CLEAN DEVELOPMENT MECHANISM PROJECT … Waste...The manufacturing facility is located at Mangalpur...
99
PROJECT DESIGN DOCUMENT FORM (CDM PDD) - Version 02 CDM – Executive Board page 1 This template shall not be altered. It shall be completed without modifying/adding headings or logo, format or font. CLEAN DEVELOPMENT MECHANISM PROJECT DESIGN DOCUMENT FORM (CDM-PDD) Version 02 - in effect as of: 1 July 2004 CONTENTS A. General description of project activity B. Application of a baseline methodology C. Duration of the project activity / Crediting period D. Application of a monitoring methodology and plan E. Estimation of GHG emissions by sources F. Environmental impacts G. Stakeholders’ comments Annexes Annex 1: Contact information on participants in the project activity Annex 2: Information regarding public funding Annex 3: Baseline information Annex 4: Monitoring plan Appendices Appendix I : Abbreviations Appendix II : References Appendix III: Baselines and CER calculation sheet
Transcript of CLEAN DEVELOPMENT MECHANISM PROJECT … Waste...The manufacturing facility is located at Mangalpur...
PROJECT DESIGN DOCUMENT FORM (CDM PDD) - Version 02 CDM – Executive Board page 1
This template shall not be altered. It shall be completed without modifying/adding headings or logo, format or font.
CLEAN DEVELOPMENT MECHANISM PROJECT DESIGN DOCUMENT FORM (CDM-PDD)
Version 02 - in effect as of: 1 July 2004
CONTENTS A. General description of project activity B. Application of a baseline methodology C. Duration of the project activity / Crediting period D. Application of a monitoring methodology and plan E. Estimation of GHG emissions by sources F. Environmental impacts G. Stakeholders’ comments
Annexes Annex 1: Contact information on participants in the project activity Annex 2: Information regarding public funding Annex 3: Baseline information
Annex 4: Monitoring plan
Appendices Appendix I : Abbreviations Appendix II : References Appendix III: Baselines and CER calculation sheet

PROJECT DESIGN DOCUMENT FORM (CDM PDD) - Version 02 CDM – Executive Board page 2
This template shall not be altered. It shall be completed without modifying/adding headings or logo, format or font.
SECTION A. General description of project activity A.1 Title of the project activity:
JBSL–Waste Heat Recovery Based Captive Power Project
Version – 01
Date of Document – 28th Aug 2005
A.2. Description of the project activity:
Brief Introduction
Jai Balaji Sponge Limited (JBSL) belongs to the Jai Balaji Group of Companies, one of the
major groups among the secondary steel producers in Eastern India. The group has long
experience of over 35 years in steel industry and has earned its name in the market for quality
production of various steel products.
JBSL has a sponge iron-manufacturing unit with a capacity of 1,05,000 Metric Tonnes (MT)
per annum that consists of seven Direct Reduction Iron (DRI) kilns of 50 MT per day (MTPD)
capacity each. The manufacturing facility is located at Mangalpur Industrial Estate, Ranigunj,
District Burdwan, West Bengal. The sponge iron unit started commercial production from
April 2000. The company proposes to set up a 1200 MTPD Ferro Alloy Plant (FAP) adjacent
to the sponge iron (SI) plant premises. JBSL proposes to install a captive power plant (CPP) of
12 MW nominal capacity running primarily on waste heat energy with minor contribution from
coal char, coal fines and coal washery rejects. The CPP will be partially meeting the electricity
demand of JBSL’s proposed FAP.
Project Activity
Of the 12 MW installed capacity of the CPP, about 9 MW of power will be generated by
utilizing the sensible heat content of the waste gas from the DRI kilns (ie. from waste heat
energy) for generating steam through Waste Heat Recovery Boilers (WHRBs). The power
generated using waste heat comes under the scope of term Project Activity mentioned
hereinafter.

PROJECT DESIGN DOCUMENT FORM (CDM PDD) - Version 02 CDM – Executive Board page 3
This template shall not be altered. It shall be completed without modifying/adding headings or logo, format or font.
Power supply planning through the CPP
The CPP will be operating in island mode, supplying power dedicatedly to proposed FAP and
its auxiliaries. The existing sponge iron plant would continue to get power from electricity
utility company Dishergarh Power Supply Company Limited (DPSCL) for its regular operation
and no power will be supplied from the up-coming CPP to the sponge iron plant.
The proposed CPP will be catering to a major share of the power demand of FAP in island
mode while the rest will be taken from the grid. The power generation in the CPP will be at 11
kV level. The internal consumption requirements for the auxiliaries and equipments for the
proposed FAP and the CPP will be met by stepping down the voltage level to 440 V.
Purpose
The purpose of the project is to achieve the following objectives:
1. Primarily to recover the sensible heat content of the waste gases generated from DRI
kiln through WHRB.
2. Utilize the recovered heat of the waste gas to generate power through a steam turbine
generator (STG).
3. Use the generated electricity for the FAP and its auxiliaries.
This project taken up by JBSL to meet the power requirement of the proposed FAP would
subsequently achieve three macro-objectives, viz.
Gross power generation (kW) 12,000
Power generation from waste gases only (kW) 9,040
Turbogenerator capacity (kW) 12,000
Grid connection The CPP would be solely supplying power to the Ferro
Alloy Plant in island mode Plant load factor 90%
Net Electricity Supply per annum from Waste Heat
Recovery Steam Generation System [Million kWh or
Million Units(MU)]
56.38

PROJECT DESIGN DOCUMENT FORM (CDM PDD) - Version 02 CDM – Executive Board page 4
This template shall not be altered. It shall be completed without modifying/adding headings or logo, format or font.
• Positive contribution towards sustainable economic growth from both energy-
economy as well as environmental point of view.
• Utilisation of a waste resource for electrical energy generation
• Conservation of natural resources by reducing the load on thermal power sources.
• Reduced GHG emission
Project’s Contribution To Sustainable Development
The project will contribute to the ‘Sustainable Development of India’. The sustainability
aspects have been discussed below:
Socio-Economic well-being: In Ranigunj – Durgapur area the project will contribute to
employment generation and abridging the gap of electricity demand and supply at local and
national level. From the macro point of view since the grid electricity will be replaced the
economy will be benefited by corresponding reductions in cost of coal mining and
transportation and savings in fossil fuel.
Environmental well-being: The project activity, by eliminating the power demand will
eliminate an equivalent amount of Carbon dioxide (CO2) emission, which would have been
generated to produce power from coal. Therefore the project activity will have excellent
environmental benefits in terms of reduction in GHG emission due to substitution of electricity
supplied by the grid to in-house generation by waste gas utilization and coal resource
conservation. The same amount of coal conserved through the project activity will become
available to be utilized for other industrial activities and manufacturing processes. Further
implementation of air cooled condensing system instead of water-cooled condensing system will
help to avoid the enormous amount of sludge generation and contribute to the minimization of
water consumption in an area which suffers from the scarcity of water resources.
Technological well-being: Waste heat recovery (WHR) based captive power plant developed
as a cleaner technology will utilize waste flue gases of sponge iron kilns which otherwise would
have been emitted to the atmosphere leading to thermal pollution. The electricity generated
from the system will partly substitute the power supplied from grid enabling project proponent
to reduce carbon dioxide emission and other associated emission from the thermal power
plants; equivalent of which would have been emitted in absence of the project. Moreover, the
in-house generation of electricity will reduce transmission & distribution loss (T&D loss),
which would have been occurred to supply the electricity to the proposed FAP of JBSL.
PROJECT DESIGN DOCUMENT FORM (CDM PDD) - Version 02 CDM – Executive Board page 5
This template shall not be altered. It shall be completed without modifying/adding headings or logo, format or font.
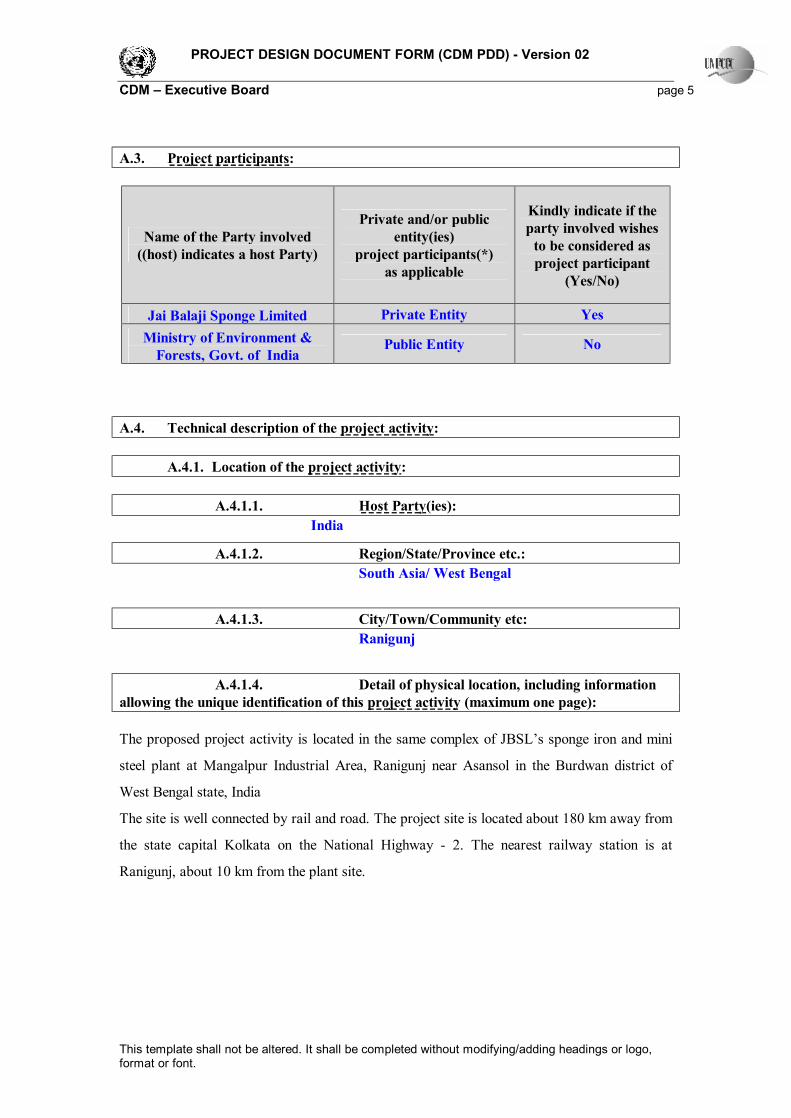
A.3. Project participants:
Name of the Party involved ((host) indicates a host Party)
Private and/or public entity(ies)
project participants(*) as applicable
Kindly indicate if the party involved wishes
to be considered as project participant
(Yes/No)
Jai Balaji Sponge Limited Private Entity Yes Ministry of Environment &
Forests, Govt. of India Public Entity No
A.4. Technical description of the project activity: A.4.1. Location of the project activity: A.4.1.1. Host Party(ies): India
A.4.1.2. Region/State/Province etc.: South Asia/ West Bengal
A.4.1.3. City/Town/Community etc:
Ranigunj
A.4.1.4. Detail of physical location, including information allowing the unique identification of this project activity (maximum one page): The proposed project activity is located in the same complex of JBSL’s sponge iron and mini
steel plant at Mangalpur Industrial Area, Ranigunj near Asansol in the Burdwan district of
West Bengal state, India
The site is well connected by rail and road. The project site is located about 180 km away from
the state capital Kolkata on the National Highway - 2. The nearest railway station is at
Ranigunj, about 10 km from the plant site.

PROJECT DESIGN DOCUMENT FORM (CDM PDD) - Version 02 CDM – Executive Board page 6
This template shall not be altered. It shall be completed without modifying/adding headings or logo, format or font.
Ranigunj
Fig1 – Location of Project Activity.
Maps not to Scale

PROJECT DESIGN DOCUMENT FORM (CDM PDD) - Version 02 CDM – Executive Board page 7
This template shall not be altered. It shall be completed without modifying/adding headings or logo, format or font.
A.4.2. Category(ies) of project activity: The project activity is an electricity generation project utilizing waste heat where aggregate
electricity generation of the project exceeds the equivalent of 15 GWh per annum. The baseline
and monitoring and methodology adopted as per ACM0004. The project activity may
principally be categorized in Category 1- Energy Industries (Renewable/Non-Renewable
sources) as per the scope of the project activities enlisted in the ‘list of sectoral scopes and
approved baseline and monitoring methodologies (version 3)’ on the UNFCCC website for
accreditation of Designated Operational Entities1.
A.4.3. Technology to be employed by the project activity: JBSL is implementing a modern WHR based captive power plant at their sponge iron cum mini
steel unit at Ranigunj. The power generated by CPP will be completely utilized for supplying
power to the FAP of JBSL.
The sponge iron unit of JBSL consists of seven DRI kilns, each of 50 MTPD capacity. The hot
gases from each kiln are discharged to the After-Burning Chamber (ABC). Average flue gas
availability from the sponge iron kilns of JBSL would be about 12,000 Nm3/hr at 9000C from
each kiln. As the gases contain a small percentage of carbon monoxide (CO), the same will be
burnt in ABC by admitting suitable quantity of combustion air. This will raise the gas
temperature to around 950 to 1000oC. Water will be sprayed to moderate the gas temperature
to 9500C after which it will be finally introduced to WHRBs through the hot gas duct.
The 7 WHRBs respectively connected to each of the DRI kilns are of 5 tph steam generation
capacity. The combusted gas will be circulated through WHRB to transfer the sensible heat
energy of the waste gas to water and generate steam. A substantial amount of heat shall be
recovered at this point. Finally, the gas will pass through Economiser bundles for optimum
recovery of heat from the hot exhaust. After final heat transfer at all heat recovery sections the
gas will leave the WHR chamber at a temperature of around 170-180oC.
The WHRBs (67 kg/cm2 and 4900C) along with the high efficiency single extraction-cum-
condensing type multistage Steam Turbine Generator (STG) set of 12MW rating shall be
operated to generate power.
1 http://cdm.unfccc.int/DOE/scopes.html

PROJECT DESIGN DOCUMENT FORM (CDM PDD) - Version 02 CDM – Executive Board page 8
This template shall not be altered. It shall be completed without modifying/adding headings or logo, format or font.
The WHRBs will be single run, natural circulation radiant furnace type with water cooled
membrane walls & bottom refractory furnace, bed tubes, two stage superheater with inter stage
de-superheater and induced draft. The boilers will be top supported and shall be of semi-
outdoor type. The WHRBs will consist of evaporator, superheater, economizer, recuperative
type air heater, integral piping, flue gas ducting with expansion joints.
The turbine will be designed for the operation with the inlet steam parameters of 66 kg/cm2 and
4850C. The turbine shall be of horizontal, single cylinder, single extraction, and condensing
type. There shall be one uncontrolled extraction from the turbine.
Combusted gas after maximum heat transfer in the boiler will lead to the exhaust stack through
Electrostatic Precipitator (ESP), which will reduce the Suspended Particulate Matter (SPM)
load to a large extent. The SPM will be collected in the hoppers of the ESP. The particulate
matter collected in the hoppers will be conveyed to existing silo by totally enclosed pneumatic
conveyors.
Other accessory systems include fuel handling system, ash handling system, vessels and heat
exchangers, tanks, piping and electrical systems. Air-cooled condenser will be used to condense
exhaust steam after passing through turbine rotor. Auxiliary cooling water enters the totally
enclosed air-cooler where water is cooled by air only. Only treated water will be supplied to
the boiler to avoid scale formation in boiler heat transfer tubes and for better performance.
Blow down water can be used for other purposes like plantation.
Implementation Schedule
The project construction start date was July 2004 and the project is to be commissioned in
September 2005. The expected year of first CER-delivery (post-certification) is 2006. The
proposed crediting period for the project is 10 years and the total lifetime of the project is 20
years.
A.4.4. Brief explanation of how the anthropogenic emissions of anthropogenic greenhouse gas (GHGs) by sources are to be reduced by the proposed CDM project activity, including why the emission reductions would not occur in the absence of the proposed project activity, taking into account national and/or sectoral policies and circumstances:
JBSL has set-up the CPP with an objective to utilize waste resources available from
manufacturing process and use it to generate electrical energy for utilization at its FAP.

PROJECT DESIGN DOCUMENT FORM (CDM PDD) - Version 02 CDM – Executive Board page 9
This template shall not be altered. It shall be completed without modifying/adding headings or logo, format or font.
The project has employed a non-GHG emitting technology - Waste Heat Recovery and Steam
Generating System. In the absence of the project, the electricity requirements of equivalent
amount would have been met by DPSCL grid supply resulting into an equivalent amount of
CO2 emission from the thermal power stations. More than 90% of DPSCL grid mix comprises
of thermal power mix (coal, gas)2. However, due to project activity, the project proponent has
been able to do away with equivalent amount of generation mix resulting in reduction of
corresponding CO2 emissions at the thermal power generation end.
The project does not contribute to any additional GHG emission. It utilizes heat content of the
waste gases available at the outlet of sponge iron kiln located within the premises and well
connected by hot gas duct. The chemical composition of the waste gas at the inlet and outlet of
the boiler remain same and no other secondary fuel is fed to the boiler.
Furthermore, taking into consideration the power deficiency in India, future power demand rise
in West Bengal (from 4236 MW in 2001-02 to 8173 MW in 2011-12)3 and recent capacity
built to meet the electricity demand in the state, the project activity contributes by reducing this
demand by 9 MW (equivalent to 56.38 MU per year). The project activity reduces
anthropogenic emissions by sources that would have occurred (due to future generation mixes)
or are occurring (due to present generation mixes) to cater to a certain proportion of the
demand. The average estimated emission reduction to be achieved by the project is 52239.5
tonnes of CO2/year and 522395 tonnes of CO2 for the entire 10 year crediting period.
The Indian Government or Government of West Bengal does not require the sponge iron
manufacturing units to utilize the heat content of the waste gases released during their
production process. Hence the project proponents do not have any legal bindings to implement
the proposed project activity. JBSL will be implementing the proposed project activity over and
above the national or sectoral requirement. The resulting GHG emission reduction will be
additional to those directed by the government policies and regulations.
The project faced a number of regulatory/institutional barriers during approval of the WHR
based CPP. The decision to implement the project activity was taken in year 2002 when the
rules related to captive power generation in India were not clear. Further, the project proponent
2 DPSCL owns 40MW capacity coal based power plants that meet around 32% of its total requirement. Remaining power is drawn from West Bengal State Electricity Board and Damodar Valley Corporation (DVC) system.

PROJECT DESIGN DOCUMENT FORM (CDM PDD) - Version 02 CDM – Executive Board page 10
This template shall not be altered. It shall be completed without modifying/adding headings or logo, format or font.
faced a number of barriers for access to bank loans (investment barrier). When JBSL
approached a number of financial institutions (FIs) for debt sourcing for the CPP, loans were
offered at higher interest rates which posed an obstacle for implementation of project. Finally, a
Government owned FI agreed to partially lend the project at competitive lending rates on the
sole premise that the project activity had the potential to accrue potential revenues through
CDM route. Based on the economic appraisal of the above FI alone, JBSL further managed to
arrange for funding from a bank at comparable rates. Thus, CDM acted as a strong motivator
for the implementation of the project activity. Moreover, although Electricity Act-2003 that has
liberalised captive power generation since June 2003 in the country; the project proponent still
faces numerous barriers on a continuous basis. The above mentioned ‘additionality’ factors are
further dealt in detail in Section B3.
Hence, in absence of the CDM project activity the associated barriers would prevail and JBSL
would eventually resort to business-as-usual scenario which is releasing the waste heat from
sponge iron kilns into atmosphere and importing power from grid for the proposed FAP plant.
The power plant is not only justified in view of its capability to affect the generation mix but
also lead as an example of eco-friendly power from a sponge iron industry. The project meets
the requirement of additionality tests as its existence and operation has the effect of reducing
GHG emissions below the level that would have occurred in its absence (refer section B.3 for
further details).
3 Refer- http://www.saneinetwork.net/pdf/SANEI_II/Reforms_and_PowerSector_in_SouthAsia.pdf

PROJECT DESIGN DOCUMENT FORM (CDM PDD) - Version 02 CDM – Executive Board page 11
This template shall not be altered. It shall be completed without modifying/adding headings or logo, format or font.
A.4.4.1. Estimated amount of emission reductions over the chosen crediting period:
Years Annual Estimation of emission reductions in tonnes of CO2 e
2005-2006 52239.49
2006-2007 52239.49
2007-2008 52239.49
2008-2009 52239.49
2009-2010 52239.49
2010-2011 52239.49
2011-2012 52239.49
2012-2013 52239.49
2013-2014 52239.49
2014-2015 52239.49
Total estimated reductions CO2 e 522395 Total number of crediting years 10 Annual average over the crediting period of estimated reductions (tonnes of CO2 e) 52239.5
A.4.5. Public funding of the project activity: There is no public funding available for the project activity.
PROJECT DESIGN DOCUMENT FORM (CDM PDD) - Version 02 CDM – Executive Board page 12
This template shall not be altered. It shall be completed without modifying/adding headings or logo, format or font.
SECTION B. Application of a baseline methodology B.1. Title and reference of the approved baseline methodology applied to the project activity: Title: Consolidated baseline methodology for waste gas and/or heat for power
generation.
Reference: Approved consolidated baseline methodology ACM0004/ Version 01, Sectoral
Scope: 01, 8 July 20054
Approach: Existing actual or historical emissions, as applicable.
B.1.1. Justification of the choice of the methodology and why it is applicable to the project activity:
Justification concerning selection of the approach
Project activity includes electricity generation by utilizing the heat energy of waste flue gas
available from JBSL’s Sponge Iron unit through waste heat recovery and steam generating
system in its CPP. The project activity will generate electricity to meet the electricity
requirement of proposed FAP of JBSL
In absence of the project (business-as-usual scenario) JBSL would have drawn equivalent
amount of electricity from the utility grid supply (DPSCL) consisting of a generation mix from
various sources mainly thermal (coal, gas), hydro and renewable resources (generation mix –
91.6% thermal and 7.9% hydro: refer Table 1). Also the waste heat energy in the flue gases
would have been lost in the ambient air adding to thermal pollution of the area. Therefore with
successful operation of captive power plant, the project is being able to displace/ substitute the
equivalent power units from grid mix which has an emission factor of 0.927 kgCO2/kWh (refer
Chapter E).
4 http://cdm.unfccc.int/EB/Meetings/020/eb20repan12.pdf

PROJECT DESIGN DOCUMENT FORM (CDM PDD) - Version 02 CDM – Executive Board page 13
This template shall not be altered. It shall be completed without modifying/adding headings or logo, format or font.
Table 1: Generation Mix of DPSCL, WBSEB and DVC based on power available (in MU)
for 2003-04
Source Power Available in MU for
2004-05 to DPSCL, DVC and WBSEB combined grid
%
Coal 24012.67 91.1 Gas 119.01 0.5 Hydro 2075.65 7.9 Other Grid 159.233 0.6 26366.563 100.0
Source: DPSCL, WBSEB, DVC and CEA reports
However, since the project has a capacity of 9 MW, which is less then 1% of the DPSCL
generation capacity (6370.51MW) we can assume a marginal effect on the operation of
existing power plants. Also in view of the predicted power deficit status of the state in future, a
delay effect in future power plants may creep in due to the occurrence of this project although
to a limited extent. Thus the project has marginal affect on the operation of the existing power
plants and future capacity additions and their associated actual emission. Hence it can be
concluded that the most appropriate approach for baseline methodology would be “Existing
actual and historical emission” of the power plants connected to the selected grid.
The selected baseline methodology is also based on “Existing actual and historical emission”
established upon chosen or identified grid that is most realistic representation of the baseline
scenario w.r.t. the project activity.
Justification concerning applicability conditions of the new methodology
The Consolidated baseline methodology ACM0004 for waste gas and/or heat for power
generation applies to project activities that generate electricity from waste heat or the
combustion of waste gases in industrial facilities. The methodology applies to electricity
generation project activities:
A. that displace electricity generation with fossil fuels in the electricity grid or displace
captive electricity generation from fossil fuels,
B. where no fuel switch is done in the process where the waste heat or waste gas is
produced after the implementation of project activity
JBSL’s project activity is a WHR based power generation project utilizing waste heat from
DRI kilns that use coal as fuel. Before project activity JBSL was connected to the grid to meet

PROJECT DESIGN DOCUMENT FORM (CDM PDD) - Version 02 CDM – Executive Board page 14
This template shall not be altered. It shall be completed without modifying/adding headings or logo, format or font.
its entire power requirement. Even after project implementation it still imports grid power to
partially meet its demand. In the state of West Bengal there are about 27 sponge iron plants5
producing similar products by using similar technology under the similar governed polices. Out
of these 27 plants JBSL project is the first of its kind. In absence of the project activity JBSL
would opt for the business-as-usual scenario, ie. releasing waste gas into atmosphere and
importing of equivalent electricity from state grid to cater to the need. Moreover, the DRI kilns
of JBSL continue to use coal as fuel and no fuel switch is planned during the crediting period.
The project activity thus meets both the applicability criteria of the methodology.
The non-project option is “import of electricity from the grid”. Since the baseline scenario (as
established in Section B2) is grid connected and the selected approach is ‘existing actual and
historical emission”, the data of actual emission of the power plants connected to the grid has
been collected from DPSCL, WBSEB and Central Government information sources and used
in calculation to determine the carbon intensity of the grid (emission factor). Data is generally
available in the form of total fuel consumption, total electricity generated, plant load factor,
CO2 emission factor and total run time, etc of the individual units.
As per the Kyoto Protocol (KP) baseline should be in accordance with the additionality criteria
of article 12, paragraph 5(c), which states that a CDM project activity must reduce
anthropogenic emissions of greenhouse gases that are additional to any that would have
occurred in the absence of the registered CDM project activity. The project additionality is
established as per latest version of “Tool for the demonstration and assessment of
additionality” which is described in Section B3.
B.2. Description of how the methodology is applied in the context of the project activity:
The project activity involves setting up of 9 MW WHR based CPP by JBSL to meet a part of
its total in-house power consumption. The methodology is applied in the context of the project
activity as follows:
5 Quarterly Bulletin, Vol. II, No. 4, dated March 2004 of Directorate of Industries, Govt of West Bengal

PROJECT DESIGN DOCUMENT FORM (CDM PDD) - Version 02 CDM – Executive Board page 15
This template shall not be altered. It shall be completed without modifying/adding headings or logo, format or font.
Identification of Alternative Baseline scenarios and selection of appropriate baseline
scenario:
As per the methodology, the project proponent should include all possible options that provide
or produce electricity (for in-house consumption and/or other consumers) as baseline scenario
alternatives. These alternatives are to be verified for legal and regulatory compliance
requirements and also for their dependence on key resources such as fuels, materials or
technology that are not available at the project site. Further, among those alternatives that do
not face any prohibitive barriers, the most economically attractive alternative is to be
considered as the baseline scenario.
As mentioned above, the project activity requires supplying a total of 9 MW of power to JBSL.
Five plausible alternative scenarios were available with the project proponent that was
contemplated during project inception stage:
Alternative 1: Import of power from grid – continuation of current scenario
JBSL would continue to purchase required power from DPSCL grid. An equivalent amount of
CO2 emissions would take place at the thermal power generation end. This alternative is in
compliance with all applicable legal and regulatory requirements and can be a part of baseline
option.
Alternative 2: Coal based CPP at JBSL
The project proponent could set up a 9 MW coal based CPP at its existing sponge iron plant.
The power generated would partially meet JBSL’s own demand. An equivalent amount of CO2
emissions would be released at the CPP end. However, for setting up a coal based CPP
statutory requirements exist due to air pollution hazards and ash handling problems.
Nevertheless, this alternative is in compliance with all applicable legal and regulatory
requirements and can be a part of baseline option.
Alternative 3: Gas based CPP at JBSL
The project proponent could generate their own power using natural gas based captive power
plant and an equivalent amount of carbon dioxide would be generated at the power plant end.
Though this alternative is in compliance with all regulatory and legal requirements, it is not a

PROJECT DESIGN DOCUMENT FORM (CDM PDD) - Version 02 CDM – Executive Board page 16
This template shall not be altered. It shall be completed without modifying/adding headings or logo, format or font.
realistic alternative due to non-availability of natural gas and its distribution network in the
state6. Therefore, alternative 3 can be excluded from the baseline scenario.
Alternative 4: Light diesel oil or furnace oil based CPP at JBSL
The project proponent could set up 9 MW light diesel oil (LDO) or furnace oil (FO) based CPP
at its existing sponge iron plant. The power generated would partially meet JBSL’s own
demand. An equivalent amount of CO2 emissions would be released at the CPP end. This
alternative is in compliance with all applicable legal and regulatory requirements and can be a
part of baseline option.
Alternative 5: Implementation of project activity without CDM benefits
JBSL may set up a 9 MW waste heat recovery based CPP at its existing sponge iron plant to
partially meet its demand. This alternative is in compliance with all applicable legal and
regulatory requirements. The energy content of the flue gases from the kilns in this case would
be fully utilized and JBSL would reduce an equivalent amount of CO2 emissions at the thermal
power plants feeding to DPSCL grid. However, for this option, the project proponent would
face a number of regulatory, investment and technological barriers (as detailed in Section B3
below) making it predictably prohibitive. Hence this option is not a part of baseline scenario.
Evaluation of the alternatives on economic attractiveness:
From the discussion above it is found that alternatives 1, 2 and 4 can be a part of baseline
scenario. Further, as per the methodology, the alternatives are to be evaluated on the basis of
economic attractiveness to find the appropriate baseline scenario. The broad parameters used
for the evaluation of sources of power are capital (installation) cost figures and the unit cost of
electricity purchased or produced. Table 2 below shows the economic evaluation of the three
options:
:
6 State wise/Sector wise Allocation of Natural Gas - http://petroleum.nic.in/ngbody.htm

PROJECT DESIGN DOCUMENT FORM (CDM PDD) - Version 02 CDM – Executive Board page 17
This template shall not be altered. It shall be completed without modifying/adding headings or logo, format or font.
Table 2: Evaluation of Alternatives based on Economic Attractiveness
7 Captive Power Plants- Case study of Gujarat India - http://iis-db.stanford.edu/pubs/20454/wp22_cpp_5mar04.pdf
Alternative
Capital Cost
Rs. Million / MW
Generation/ Purchase Cost
Rs./kWh
Source of Information Comments Conclusion
Year 2000-2001 2.68
Year 2001-2002 2.80
1) Import of Power from Grid
Nil
Year 2002-2003 3.37
JBSL sources Continuation of current situation, No additional investment, easy government approvals
An economically attractive option
2) Coal based CPP 42.5 - 45.0 1.78 - 1.92
Indicative prices available in India during project inception stage7
High Capital Cost - uneconomical for small sizes, difficulty in accessing bank loans. Government statutory approvals cumbersome because of Air pollution hazard and ash handling problems. Delay in obtaining approvals and regular permissions from the concerned authority will lead to cost overrun.
This option is economically unattractive
4) LDO/FO Based CPP 7.5 – 12.0 3.5-4.6
Indicative prices available in India during project inception stage7
Marginal Low capital cost but high variable cost mainly due to higher fuel prices. Generally used as backup for supplying power to essential equipments and not for complete grid displacement at such a scale. Moreover, JBSL anticipated further oil price increase in future.
This option is economically unattractive

PROJECT DESIGN DOCUMENT FORM (CDM PDD) - Version 02 JBSL-Waste Heat Recovery Based Captive Power Project
CDM – Executive Board page 18
This template shall not be altered. It shall be completed without modifying/adding headings or logo, format or font.
Thus in view of the above points, the Baseline Alternative 1: ‘Import of electricity from the grid’ is most likely
baseline scenario and has been considered as business as usual scenario for the baseline emission calculations.
Further, the following points corroborate that ‘import of electricity from grid’ is the baseline:
Ø This is a usual practice being followed by the other similar industries in the state (business-as-usual-
scenario). Out of 27 sponge iron plants in the state, JBSL is the first plant to implement waste heat
recovery for captive power generation.
Ø The grid’s generation mix comprises of power generated through sources such as thermal (coal and
gas), hydro and renewable energy. The project activity would therefore displace an equivalent amount
of electricity the plants would have drawn from the grid. The Baseline Emission Factor for the grid is
more conservative than that of the coal based CPP.
We may therefore conclude that in the absence of project activity, JBSL would draw power from DPSCL, and the
system boundary would include the grid’s generation mix. Thus the most appropriate baseline scenario would be
‘Import of power from grid’.
Establishing the additionality for the project activity
This step is based on Annex I - “Tool for the demonstration and assessment of additionality” of the sixteenth
meeting of Executive Board. Information/data related to preliminary screening, identifying alternatives, common
industry practice and other financial, regulatory and technology related barriers were used to establish the
additionality. Details of establishing additionality are explained in section B3.
Determining the baseline emissions
This step provides steps for analysis of the selected baseline scenario to calculate the baseline emission factor.
Details of baseline data are shown in Annex 3. From the step ‘Identification of alternative baseline scenarios’ it is
found that ‘Import of Electricity from Grid’ is the most appropriate baseline option. The project activity thus
displaces equivalent amount of electricity from grid which is predominantly generated from thermal (fossil fuel
based) power plants. Further, as per ACM0004 baseline methodology the Baseline Emission Factor (BEF) of
chosen grid is calculated as per combined margin method of ACM0002 in Annex 3. Project emissions are zero as
no auxiliary fuel is used for generation startup or supplementary fuel for WHRB. Finally, annual emission
reductions are found as the difference of baseline emissions and project emissions during the given year in tons of
CO2 equivalent. This is shown in detail in Section E.

PROJECT DESIGN DOCUMENT FORM (CDM PDD) - Version 02 JBSL-Waste Heat Recovery Based Captive Power Project
CDM – Executive Board page 19
This template shall not be altered. It shall be completed without modifying/adding headings or logo, format or font.
B.3. Description of how the anthropogenic emissions of GHG by sources are reduced below those that would have occurred in the absence of the registered CDM project activity:
As per the decision 17/cp.7, para 43, a CDM project activity is additional if anthropogenic emissions of GHGs by
sources are reduced below those that would have occurred in absence of registered CDM project activity. The
methodology requires the project proponent to determine the additionality based on ‘Tool for the demonstration
and assessment of additionality’ as per EB-16 meeting. The flowchart in Fig 2 below provides a step-wise
approach to establish additionality of the project activity.
Fig 2: Flow chart for establishing additionality

PROJECT DESIGN DOCUMENT FORM (CDM PDD) - Version 02 JBSL-Waste Heat Recovery Based Captive Power Project
CDM – Executive Board page 20
This template shall not be altered. It shall be completed without modifying/adding headings or logo, format or font.
Step 0. Preliminary screening based on the starting date of the project activity 1. If project participants wish to have the crediting period starting prior to the registration of their project activity,
they shall:
(a) Provide evidence that the starting date of the CDM project activity falls between 1 January 2000 and
the date of the registration of a first CDM project activity, bearing in mind that only CDM project
activities submitted for registration before 31 December 2005 may claim for a crediting period starting
before the date of registration:
The project proponent and sponsor Jai Balaji Sponge Limited launched the project on WHR based
Captive Power generation in July 2004, with a consolidated project report. The CPP will start
commercial operation in September 2005. Hence, the project activity lies between 1st January 2000 and
the 18 November 2004 i.e. date of registration of first CDM project activity.
JBSL would provide sufficient evidences to establish the same. JBSL proposes to get the project activity
registered with UNFCCC before December 31, 2005.
(b) Provide evidence that the incentive from the CDM was seriously considered in the decision to proceed
with the project activity. This evidence shall be based on (preferably official, legal and/or other
corporate) documentation that was available to third parties at, or prior to, the start of the project
activity.
As a responsible corporate citizen, JBSL is committed for business growth keeping in mind the
environmental protection aspects both locally as well as globally. JBSL is aware that the emergence of the
concept of sustainable development in the recent years has brought in the general realization that
environmental issues are intrinsically connected with the development objectives and polices. All activities
undertaken by JBSL take into consideration the environmental, health and social assessment.
Consequently, climate change issues are very much a part of JBSL decision making covering all its
proposed activities. JBSL was aware of the number of investment and regulatory barriers it would face
for entering into a domain of power generation which is not coming under its expertise. Despite these
barriers, the Board Members of JBSL in its meeting in March 2003 decided to take up the project activity
in view of the potential risk mitigation cover CDM would provide8. The Board also decided to bear the
costs for CDM documentation, registration and for adhering with the M&V protocol. Adequate evidences
are available which shows that CDM benefits was seriously considered to proceed with project activity.
8 Minutes of Meeting of Board of Directors of JBSL held in March 2003

PROJECT DESIGN DOCUMENT FORM (CDM PDD) - Version 02 JBSL-Waste Heat Recovery Based Captive Power Project
CDM – Executive Board page 21
This template shall not be altered. It shall be completed without modifying/adding headings or logo, format or font.
Following are the documents available that can be shown as evidence to support that incentive from CDM was
seriously considered in the decision to proceed with the project activity:
1) Appraisal for project activity by IREDA where CDM benefits was considered in the project financial
analysis.
2) Board Note submitted in the Board Meeting and Resolution of the Board Meeting showing the approval
of the Board for the same.
These evidences will be made available to the Designated Operational Entity (DOE) during validation.
Sub-step 1a. Define alternatives to the project activity: Sub-step 1b. Enforcement of applicable laws and regulations: The project activity requires supplying a total of 9 MW of power to JBSL plant. As discussed in section B2
above, there were five plausible alternatives available with the project proponent to provide this service among
which three were feasible. The feasible alternatives are:
Alternative 1: Import of power from grid by JBSL – continuation of current scenario
Alternative 2: Coal based CPP at JBSL
Alternative 4: Light diesel oil or furnace oil based CPP at JBSL
These alternatives are in compliance with all applicable legal and regulatory requirements. There is no legal
binding on JBSL to implement the project activity. In India it is not mandatory for sponge iron units to implement
waste heat recovery based power generation plants from waste gases of the kilns. Neither are there any planned
regulations for sponge iron manufacturing industries that will enforce them to implement project activity in India.
The pollution control board does require sponge iron units to operate such that the dust levels of the waste gases
to be emitted into the atmosphere should be less than 150mg/Nm3. These pollution control board norms were
being met even in absence of the project. Though this alternative would bring down the SPM levels in the flue
gas, there is no mandate by the West Bengal Pollution Control Board to implement the same. From the above we
can conclude that the project activity is a voluntary activity on part of the project proponent and is no way
mandated by the law or instigated by the promotional policies of the Government. It is a proactive endeavor to
improve on energy efficiency by utilization of waste heat energy and reduce greenhouse gas emissions.
Next the project proponent is required to conduct
Step 2. Investment analysis OR
Step 3. Barrier analysis.
JBSL proceeds to establish project additionality by conducting the Step 3: Barrier Analysis.
PROJECT DESIGN DOCUMENT FORM (CDM PDD) - Version 02 JBSL-Waste Heat Recovery Based Captive Power Project
CDM – Executive Board page 22
This template shall not be altered. It shall be completed without modifying/adding headings or logo, format or font.
The project proponent is required to determine whether the proposed project activity faces barriers that:
(a) Prevent the implementation of this type of proposed project activity; and
(b) Do not prevent the implementation of at least one of the alternatives through the following sub-steps:
Sub-step 3a. Identify barriers that would prevent the implementation of type of the proposed project activity
1. Regulatory and Institutional Barriers:
Macro Perspective: In India the power demand has always outstripped supply and the quality and reliability of
power supply have not improved9. This has resulted in widespread power shortages throughout the country, wide
fluctuations in supply voltage and frequency, frequent grid disturbances and general lack of system integrity. The
deficit power situation has been exacerbated by the very high (and worsening) transmission and distribution
(T&D) losses, which have increased from 18% in 1970 to around 32% in 200410, against an international average
of less than 10%. This situation is largely a result of under-investment in T&D systems in comparison with
investment in generation capacity addition, and is also strained by inadequate billing, improper metering and
pilferage of power.
The Indian Power sector is constrained by:
• inadequate financial resources
• cumbersome project clearance procedures
• poor financial management of financial resources
• irrational tariff structure that is politically motivated,
During the start of the project in 2004 a number of difficulties were faced by the project proponent for obtaining
approvals for the project activity. These barriers are mentioned below:
• The agricultural and domestic consumers are being heavily cross subsidized by the industrial and
commercial consumers in India11. Billing and collection is much more efficient for High Tension (HT)
industrial consumers12. The development of captive power stations would reduce the revenues of state
utilities that could in turn lead to reduction in cross subsidy to the domestic and agricultural sector. With
this trend the financial problems of the SEBs would continue to worsen. In fact, one of the major reasons
SEBs have introduced policies which discourage setting up captive power plants was the fact that their
9‘Problems and prospects of privatisation and regulation in India’s power sector’ http://www.ieiglobal.org/ESDVol3No6/india.pdf 10 http://www.cea.nic.in/ge_re/2004-05/chap-5.pdf 11 Power Trading, http://www.electricityindia.com/powertrading.html 12 Captive Power Scenario in India, Infrastructure Development Action Plan for Chattisgarh-Final Report, http://chhattisgarh.nic.in/opportunities/Annexure%203.2.pdf

PROJECT DESIGN DOCUMENT FORM (CDM PDD) - Version 02 JBSL-Waste Heat Recovery Based Captive Power Project
CDM – Executive Board page 23
This template shall not be altered. It shall be completed without modifying/adding headings or logo, format or font.
most profitable and regular paying customer had moved away from them in the past. In view of the
dismal financial state of most SEBs in India, the SEBs are unwilling to give up the industrial segment and
hence have framed policies which do not encourage captive power plants. Such an approach (dissuading
setting up of captive power plants by disallowing excess sale to the grid/ third party, making it mandatory
for industries to buy from the SEB, very high wheeling charges, etc.) was inhibiting the introduction of
new energy efficient technologies such as the waste heat recovery steam generation system in JBSL’s
case.
• Besides, another concern as mentioned by one of the state regulatory commissions of India in one of its
orders was that the industrial consumers provide continuous high load factor and act as base loads during
off peak hours for power plants feeding to the grid. Setting up of CPPs by HT consumers would affect
the off peak operations of such thermal power plants13. This factor was also one of the reasons why SEBs
in India dissuaded industrial consumers like JBSL from setting up their own CPP.
• As mentioned earlier the decision to go ahead with the project was taken in a Board meeting in 2003.
During this period the prevailing law for setting up a CPP was governed by section 44 of Electricity
Supply Act, 1948 read with Sub-section 3 of section 21 of WB electricity Act, 199514.This Act mandated
the respective State Governments to frame rules with respect to industries setting up Captive Power
plants. Under this notification any industry setting up a CPP had to obtain the clearance (No Objection
Certificate) from the State Electricity Board (in this case WBSEB). Obtaining such clearances/approvals
was cumbersome and caused considerable delay. Moreover, as per the rules of the notification industries
setting up CPP would have to pay WBSEB electricity duty charges under the Bengal Electricity Duty
Rules.
2. Investment Barriers: The total capital cost for the project was estimated at Rs. 519.69 million and Debt
Equity ratio for the project activity was fixed at 70:30. Hence, the fund to be raised externally from banks/
FIs was around Rs. 363.78 million which was a heavy liability for a medium sized company like JBSL
(turnover in 2003-04 was Rs. 1220 Million15). The project proponent approached a number of banks and
FIs like Power Finance Corporation, Rural Electrification Corporation, UCO bank, Federal Bank, West
Bengal Industrial Development Corporation and West Bengal Financial Corporation. These banks and FIs
were offering loans at high lending rate in the range of 13.5 – 16.00% as compared to the prevailing Prime
13 ‘OERC Orders’, Section 6.40.10.2 - http://www.wescoorissa.com/cinfo/a39.htm#6.37 14 See ‘Initiatives –Policy for Captive Power plants’ http://www.wbpower.nic.in/ 15 JBSL Annual Report 2003-04.

PROJECT DESIGN DOCUMENT FORM (CDM PDD) - Version 02 JBSL-Waste Heat Recovery Based Captive Power Project
CDM – Executive Board page 24
This template shall not be altered. It shall be completed without modifying/adding headings or logo, format or font.
Lending Rate of 10.25 – 11.00%16. Typically, one of the factors that influence the determination of lending
rate for such projects is based on the extent of penetration of technology. Unlike other CPPs, the waste heat
recovery based CPP had very low penetration of technology in similar industry scenario of West Bengal (as
shown in the Common Practice Analysis of section B3 of Tools for demonstration and assessment of
Additionality). The banks viewed the project as high risk project and hence fixed the higher interest rate
making the project unaffordable to the project proponent. Finally, project proponent approached Indian
Renewable Energy Development Agency (IREDA) which undertook financial appraisal of the project as an
energy efficiency project and considered potential CDM revenue that would make the project financially
attractive for lending17. In its project appraisal IREDA also mentioned about the socio-economic and
environmental benefits from gainful utilization of waste products and reduction of carbon emission by
replacing grid power. IREDA agreed to partially fund (around Rs. 190 million) the debt portion at a
comparatively attractive interest rate. UCO bank followed suit funding the remaining portion on the strength
of the IREDA appraisal did UCO bank further agree to fund the remaining portion of the debt at comparable
lending rates18. Thus from the above discussion we can conclude that CDM was the principal motivator for
reducing the interest rates making the debt sourcing for the project affordable. This confirms that CDM
played a major role in covering the investment risks for the project.
16 http://indiabudget.nic.in/es2003-04/chapt2004/chap33.pdf 17 Letter No.221/2230/EEC/2003/IREDA dated 24th December 2003 from IREDA to UCO bank. 18 Letter from UCO bank dated 3rd June 2004 to JBSL.

PROJECT DESIGN DOCUMENT FORM (CDM PDD) - Version 02 JBSL-Waste Heat Recovery Based Captive Power Project
CDM – Executive Board page 25
This template shall not be altered. It shall be completed without modifying/adding headings or logo, format or font.
3. Technological Barriers:
a. Operational risks: As mentioned earlier, JBSL’s waste heat recovery based CPP will supply power to its Ferro
Alloy Plant (FAP) in stand alone mode. The project activity faces operational risks related to the waste gas
generation and its heat content, which effect the successful implementation of the project activity.
- The non-availability of waste gases due to any technical fault in the kilns will prevent power generation in the
project activity. If the heat content of the waste gas is not sufficient, the project activity will directly be affected
since there are no inbuilt provisions to increase waste gas temperatures through auxiliary fuel firing.
- Cumulative effect of sustained variable frequency operation due to fluctuations in waste gas supply (flow rate &
temperature) may have substantial bearing in safe and sustained operation of assets like the power plant
equipments.
- Quality of ferro alloys is heavily dependent on the quality of power supply. Poor quality of power supply not
only results in reduced life of equipment but also in poor quality of products.
Non-availability of waste gas from sponge iron at the required temperature can also result in a complete closure
of the project activity and in effect will affect the FAP production. Further, resumption of production process
takes a long time. Hence the power interruption even for a short spell destabilizes the manufacturing process,
besides causing production loss and damage to the sophisticated equipment.
b. Air cooled Condenser: In the proposed captive power plant JBSL is going to install air-cooled condensing
system instead of water-cooled condensing system. Air-cooled condensing systems are least preferred in India as
they have a much higher capital cost, higher operating temperatures, and lower efficiency than wet cooling
systems19. Air-cooled condensers consist of one or more rectangular bundles of finned tubes arranged in staggered
rows and suitably supported on a steel structure. Both ends of the tubes are fixed in tube sheets in channels that
have holes opposite to the tubes, or removable covers, for tube rolling and cleaning. Apart from design
complexity air-cooled condensing system involves huge space requirement (12m width x 16m length x 22m
height) for JBSL and its weight is also quite substantial (415 MT). In spite of such technical barriers the project
proponent is willing to continue with the proposed air-cooled condensing system because it is directly contributing
to the reduction of water consumption (unlike water-cooled condensing system) in a region, which suffers from
severe water crisis especially during summer. For this proposed installation of air-cooled condensing system the
estimated amount of savings in make- up water consumption is going to be 70,000 lit/hr.
19‘Closed Cycle Dry Cooling Systems’ http://www.energymanagertraining.com/power_plants/condenser&cooling_sys.htm

PROJECT DESIGN DOCUMENT FORM (CDM PDD) - Version 02 JBSL-Waste Heat Recovery Based Captive Power Project
CDM – Executive Board page 26
This template shall not be altered. It shall be completed without modifying/adding headings or logo, format or font.
4. Other barrier(s) – due to lack of awareness about available technologies, products, financial support;
limited dissemination of information on operation knowhow; limited managerial resources; organizational
capacity
a. Lack of information on operation know-how: The sponge-iron manufacturing sector belongs to steel industry
sector with limited knowledge and exposure of complications associated with production of power. JBSL
personnel lacked the necessary technical background to develop and implement a waste heat recovery based
power plant with technological innovation. They had to strengthen their internal capacity by inviting external
expertise to implement the project activity. The JBSL personnel at various levels lacked relevant managerial
background for project activity implementation, operation and maintenance. They were provided with training to
ensure smooth operation. They had no background strength in the power sector economics and power generation
sector.
b. Declining prices of sponge iron and ferro alloys: The domestic sponge iron and ferro alloy industry in India
is witnessing a downward trend in prices of sponge iron in 2005-0620. In comparison to July 2004, the sponge iron
prices for the same month in 2005 have declined by almost 15%. The major factors leading to the falling prices
are attributed to lower demand of sponge iron due to increased supply of steel scrap at lower prices (sponge iron
substitutes scrap in steel production through Electric Arc Furnace/Induction Furnace) and oversupply of sponge
iron in the market due to additional capacities exceeding demand. As a result, the margins for sponge iron
industries in 2005-06 are expected to shrink with respect to the previous year. High input costs (due to shortage
of raw material - especially coal) add to the damper arising from declining prices.
This squeeze in operating margins will affect the working capital requirements of the sponge iron industry. This
can directly lead to a drop in allocation of working capital requirements (i.e. budget) of none core activities like
that of the CPP. JBSL is committed to the cause of green power produced by the waste heat recovery project and
although it will continue to support the successful implementation and operation of the project, it may be
constrained for funding further development/training for the CPP operations in the event of squeeze in working
capital as forecasted.
20 Monthly Industry Review for Steel Intermediaries by CRIS INFAC– July 2005 report

PROJECT DESIGN DOCUMENT FORM (CDM PDD) - Version 02 JBSL-Waste Heat Recovery Based Captive Power Project
CDM – Executive Board page 27
This template shall not be altered. It shall be completed without modifying/adding headings or logo, format or font.
Sub-step 3b: Show that the identified barriers would not prevent a wide spread implementation of at least one of the alternatives (except the proposed project activity already considered in Step 3a). This is demonstrated in Table 2 of Section B.2 above. JBSL’s project activity is a WHR based power project
utilizing waste heat from sponge iron rotary kiln that uses coal as fuel. JBSL would not have faced any regulatory
or investment barrier in case it continued to import power from grid. In this scenario it would not have faced the
investment barrier as no special investments are required to meet the demand. Further for import of power from
grid, JBSL would not have to face any technological barriers as in the case of generation of waste heat based
power. Therefore, it is most likely that in absence of the project activity JBSL would opt for the business-as-
usual scenario, i.e. releasing the waste heat into the atmosphere and importing equivalent electricity from state
grid to cater to the need.
Step 4: Common Practice analysis:
Based on the information about activities similar to the proposed project activity, the project proponent is supposed to carry out common practice analysis to complement and reinforce the barrier analysis. The project proponent is required to identify and discuss the existing common practice through the following sub-steps: Step 4a: Analyze other activities similar to the proposed project activity Step 4b: Discuss any similar options that are occurring In the sponge iron sector of West Bengal with similar socio-economic environment, geographic conditions and
technological circumstances, JBSL is one of the exceptions which is in the construction phase of the waste heat
recovery based captive power plant in order to reduce GHG emissions and avail the revenues from sale of carbon
emission reductions. As shown in Table – 3, there were 27 similar plants in West Bengal during start of project21.
Out of the 27 plants, JBSL will be the first sponge iron manufacturer to implement the waste heat recovery based
power plant. This indicates a very low penetration of technology. The project activity occurs in 4 % of the similar
industries and therefore is not a common practice.
Table 3: Common practice analysis for sponge iron plants in West Bengal
Scenario No. of Sponge iron plants in West Bengal Scenario 1: Import of electricity from the grid 26 Scenario 2: Coal based captive power plant 0
Scenario 4: Diesel based captive power plant 0
Project Activity: Waste heat recovery based power plant 1
Total number of Sponge Iron Manufacturing 27 (Source: Directorate of Industries, Government of West Bengal)
21 Quarterly Bulletin, Vol. II, No. 4, dated March 2004 of Directorate of Industries, Govt of West Bengal

PROJECT DESIGN DOCUMENT FORM (CDM PDD) - Version 02 JBSL-Waste Heat Recovery Based Captive Power Project
CDM – Executive Board page 28
This template shall not be altered. It shall be completed without modifying/adding headings or logo, format or font.
Step 5: Impact of CDM registration
The project activity was started in July 2004 and commissioned in September 2005. As mentioned in Step3, JBSL
was the first waste heat recovery project in the state of West Bengal and minimize GHG emissions due to import
of power. Though the Electricity Act 2003 provided for freeing of license to generate captive power and enable
wheeling, a number of regulatory/institutional problems are still being faced by project proponent on a continuous
basis. Project activity getting registered as CDM project would give instant visibility among the state utilities
power ministries/departments, environment ministries/departments enabling JBSL to face lesser governmental
hurdles thereafter.
Registering the project activity as CDM project would allow JBSL to make the project successful and sustainable
which would lead to banks lowering interest rates for similar activities to sponge iron industries located in the
state. This would act as a precursor for other industries to invest in waste heat recovery based power generation
with wheeling facility leading to further reduction in GHG emission reduction.
Successful implementation and running of the project activity on a sustainable basis requires continuous
investments in maintenance and technological up gradation. It also requires manpower training and skill
development on a regular basis. The project proponent could get the necessary funding from selling the project
related CERs. Apart from these, registration of the project under CDM would enhance the visibility and would
enable West Bengal Government in appreciating the GHG emission reduction efforts of the project proponent.
This could lead to smoother transactions in future between the project proponent and the utility. Further CDM
fund will provide additional coverage to the risk due to failure of project activity; shut down of plant and loss of
production in JBSL.
It is ascertained that the project activity would not have occurred in the absence of the CDM simply because no
sufficient financial, policy, or other incentives exist locally to foster its development in West Bengal /India and
without the proposed carbon financing for the project JBSL would not have taken the investment risks in order to
implement the project activity. Therefore the project activity is additional. Also, the impact of CDM registration
is significant with respect to continuity of the project activity on a sustainable basis.
PROJECT DESIGN DOCUMENT FORM (CDM PDD) - Version 02 JBSL-Waste Heat Recovery Based Captive Power Project
CDM – Executive Board page 29
This template shall not be altered. It shall be completed without modifying/adding headings or logo, format or font.
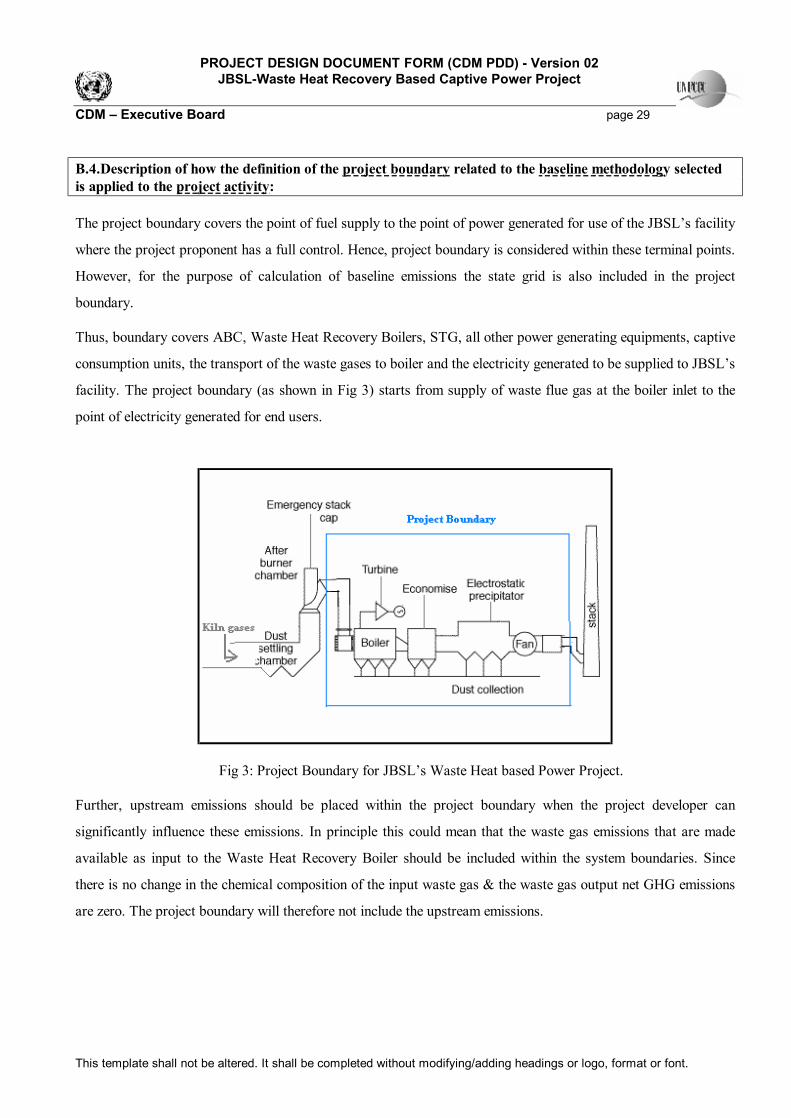
B.4.Description of how the definition of the project boundary related to the baseline methodology selected is applied to the project activity: The project boundary covers the point of fuel supply to the point of power generated for use of the JBSL’s facility
where the project proponent has a full control. Hence, project boundary is considered within these terminal points.
However, for the purpose of calculation of baseline emissions the state grid is also included in the project
boundary.
Thus, boundary covers ABC, Waste Heat Recovery Boilers, STG, all other power generating equipments, captive
consumption units, the transport of the waste gases to boiler and the electricity generated to be supplied to JBSL’s
facility. The project boundary (as shown in Fig 3) starts from supply of waste flue gas at the boiler inlet to the
point of electricity generated for end users.
Fig 3: Project Boundary for JBSL’s Waste Heat based Power Project.
Further, upstream emissions should be placed within the project boundary when the project developer can
significantly influence these emissions. In principle this could mean that the waste gas emissions that are made
available as input to the Waste Heat Recovery Boiler should be included within the system boundaries. Since
there is no change in the chemical composition of the input waste gas & the waste gas output net GHG emissions
are zero. The project boundary will therefore not include the upstream emissions.

PROJECT DESIGN DOCUMENT FORM (CDM PDD) - Version 02 JBSL-Waste Heat Recovery Based Captive Power Project
CDM – Executive Board page 30
This template shall not be altered. It shall be completed without modifying/adding headings or logo, format or font.
B.5. Details of baseline information, including the date of completion of the baseline study and the name of person (s)/entity (ies) determining the baseline:
As established in Section B2, the baseline scenario for the project activity is Import of Power from Grid. Hence,
as required by ACM0004 baseline for the project activity is calculated as per ACM0002 for chosen grid. The
approach used is exising actual or historical emissions. Net baseline emission factor for the grid was found to be
0.927 kg CO2/ kWh. Please refer to details in Annex 3 of the PDD.
Date of completing the final draft of this baseline selection (DD/MM/YYYY): 28/08/2005
Name of person/entity determining the baseline:
Jai Balaji Sponge Limited (the project participant as listed in Annex-1) and its associated consultants.
PROJECT DESIGN DOCUMENT FORM (CDM PDD) - Version 02 JBSL-Waste Heat Recovery Based Captive Power Project
CDM – Executive Board page 31
This template shall not be altered. It shall be completed without modifying/adding headings or logo, format or font.
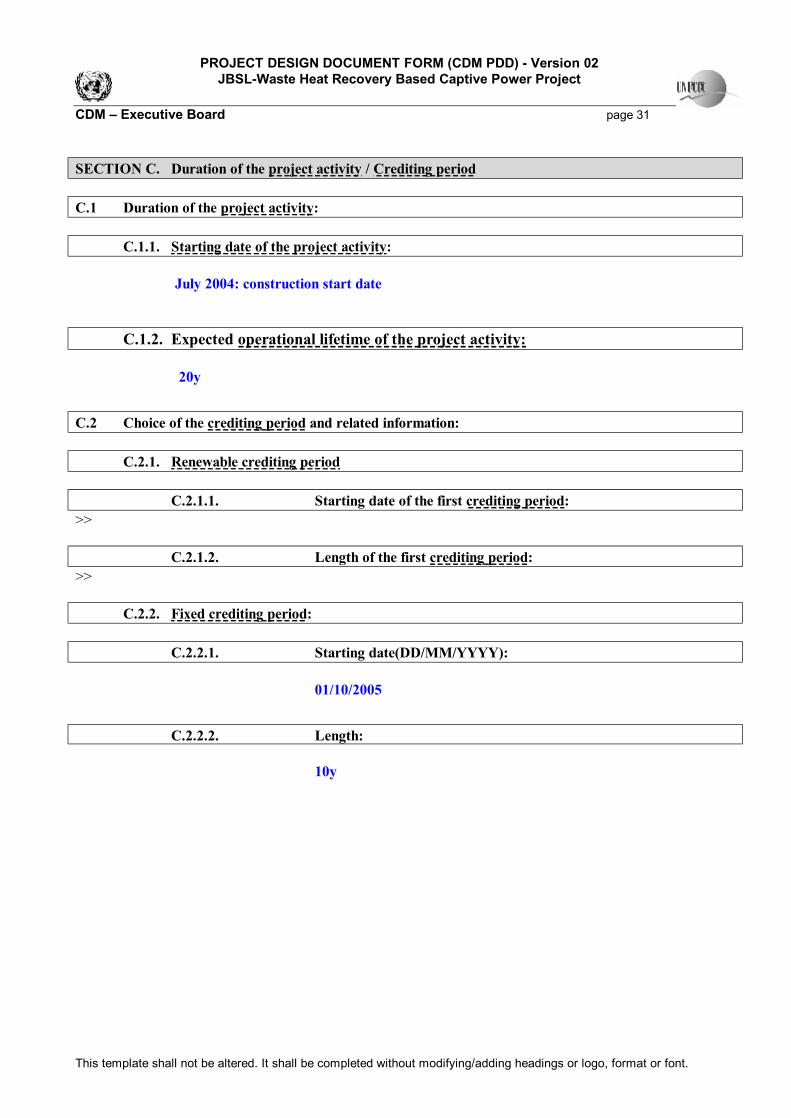
SECTION C. Duration of the project activity / Crediting period C.1 Duration of the project activity: C.1.1. Starting date of the project activity: July 2004: construction start date
C.1.2. Expected operational lifetime of the project activity: 20y
C.2 Choice of the crediting period and related information: C.2.1. Renewable crediting period C.2.1.1. Starting date of the first crediting period: >> C.2.1.2. Length of the first crediting period: >> C.2.2. Fixed crediting period: C.2.2.1. Starting date(DD/MM/YYYY): 01/10/2005
C.2.2.2. Length: 10y

PROJECT DESIGN DOCUMENT FORM (CDM PDD) - Version 02 JBSL-Waste Heat Recovery Based Captive Power Project
CDM – Executive Board page 32
This template shall not be altered. It shall be completed without modifying/adding headings or logo, format or font.
SECTION D. Application of a monitoring methodology and plan D.1. Name and reference of approved monitoring methodology applied to the project activity: Title : Consolidated monitoring methodology for waste gas and/ or heat for power generation
Reference: Approved consolidated monitoring methodology ACM0004/ Version 01, Sectoral
Scope: 01, 8 July 2005
D.2. Justification of the choice of the methodology and why it is applicable to the project activity:
The monitoring plan has been prepared in accordance with in ACM0004.
The project activity being a waste heat recovery based power generation one, there are no/negligible project
emissions generated during operation of the project activity.
The monitoring methodology will essentially aim at measuring and recording through devices, which will enable
verification of the emission reductions achieved by the project activity that qualifies as Certified Emission
Reductions (CERs). The generation of power units, auxiliary consumption, steam generation, steam
characteristics [temperature and pressure], flue gas quantity and quality, are some of the essential parameters to
be monitored. The methods of monitoring adopted should also qualify as economical, transparent, accurate and
reliable.
Applicability Criteria:
This methodology applies to project activities that generate electricity from waste heat or the combustion of waste
gases in industrial facilities.
The methodology applies to electricity generation project activities
• that displace electricity generation with fossil fuels in the electricity grid or displace captive
electricity generation from fossil fuels,
• Where no fuel switch is done in the process where the waste heat or waste gas is produced after the
implementation of project activity
JBSL’s project activity is a waste heat recovery based power project utilizing waste heat from DRI kilns. The
project activity displaces electricity of equivalent amount from DPSCL grid having a generation mix of thermal
(coal, gas) hydro and nuclear sources. Coal was used as fuel in the sponge iron kilns prior to project activity. The
kilns will continue to use coal as fuel and no fuel switch is planned during the crediting period. The applicability

PROJECT DESIGN DOCUMENT FORM (CDM PDD) - Version 02 JBSL-Waste Heat Recovery Based Captive Power Project
CDM – Executive Board page 33
This template shall not be altered. It shall be completed without modifying/adding headings or logo, format or font.
criteria of ACM0004 meet the principle of the project activity and therefore the monitoring procedure for the
project is developed as per that methodology.
Description of Monitoring Methodology
The methodology ACM004 requires monitoring of the following:
• Net Electricity Generation from Project Activity (MWh / year)– This is calculated as the difference of gross
waste heat power generated for a year minus the auxiliary power consumption during that year. The project
activity has employed state of the art monitoring and control equipments that will measure, record, report and
control various key parameters like total power generated, power used for auxiliary consumption, steam flow
rate, temperature and pressure parameters of the steam generated and steam fed to the common header of
turbo-generator sets to generate power. The monitoring and controls is part of the Distributed Control System
(DCS) of the entire plant. All instruments are calibrated and marked at regular interval to ensure accuracy.
• Data needed to calculate carbon dioxide emissions from fossil fuel consumption due to project activity –
The project activity does not use any auxiliary fossil fuel, hence there is no carbon dioxide emissions due to
fossil fuel consumption from project activity.
• Data needed to recalculate the operating margin emission factor, if needed based on the choice of the
method to determine the Operating Margin(OM), consistent with “Consolidated baseline methodology for
grid connected electricity generation from renewable sources(ACM0002)” – The Operating Margin
Emission Factor for the chosen grid is calculated as per ACM0002 Data needed to calculate the emission
factor are based on information available from authorised government agencies - Central Electricity Authority
(www.cea.nic.in), WBSEB(www.wbseb.gov.in) and DVC (www.dvcindia.org) sources and also the private
generation and distribution licensee DPSCL(www.dpscl.com) The government authorised agencies monitor
power generated and supplied to the grid. The grid mix scenario through the entire crediting period will be
based on records and reports with CEA, DPSCL, WBSEB and DVC. CEA monitors the performance of all
power generation units connected to grid under their own monitoring schedule monthly/ annually. The Grid
transmission and distribution network includes monitoring and control facilities at each generation unit level,
as well as voltage, substation and consumer level. The power records from the above sources contain all
information related to sources and origin of generation like thermal, hydro and renewable energy sources,
installed and de-rated capacity, performance of generating unit like actual and expected generation, and
planned capacity additions during the year, etc. Hence, the transparency of measurements, recording,

PROJECT DESIGN DOCUMENT FORM (CDM PDD) - Version 02 JBSL-Waste Heat Recovery Based Captive Power Project
CDM – Executive Board page 34
This template shall not be altered. It shall be completed without modifying/adding headings or logo, format or font.
monitoring and control of the generation mix of the DPSCL Grid is ensured all the time. These records can be
used for verification of generation mix and emission factor (EF) for baseline calculation for a particular year.
• Data needed to calculate the build emission factor, if needed, consistent with“Consolidated baseline
methodology for grid connected electricity generation from renewable sources(ACM0002)” – Same as
above.
• Data needed to calculate emission factor for captive power generation - Not applicable for the project
activity
Further, within the JBSL facility there is no or negligible amount of T&D losses of electricity distributed and
hence neglected.
Project Boundary and GHG Sources
To clarify the characteristics of the JBSL waste heat recovery based power project, a full flow diagram is
presented below. The project system comprising of the ABC, waste heat recovery boiler (WHRB), steam turbine
generator (STG), all other power generating equipments, captive consumption units, ESP, and the slurry removal
system. The heat captured from the waste gas is transferred to the water to generate steam, which in turn
generates power through a turbine. The waste gas after passing through ESP is released to the environment.

PROJECT DESIGN DOCUMENT FORM (CDM PDD) - Version 02 JBSL-Waste Heat Recovery Based Captive Power Project
CDM – Executive Board page 35
This template shall not be altered. It shall be completed without modifying/adding headings or logo, format or font.
Figure 4: JBSL Process
The project boundary covers the point of supply of waste gas to WHRB inlet to the point of power generated for
use of the JBSL’s DRI Unit where the project proponent has a full control. Hence, project boundary is considered
within these terminal points.
However, for the purpose of calculation of baseline emissions the state grid is also included in the project or
system boundary as shown in Fig 3.
Further, upstream emissions should be placed within the project boundary when the project developer can
significantly influence these emissions. In principle this could mean that the waste gas emissions that are made
available from the ABC as input to the Waste Heat Recovery Boiler should be included within the system
boundaries. These waste gas emissions were emitted in the atmosphere in the absence of the project activity. The
project boundary will therefore not include the upstream emissions, which will any way be generated during
production process.
The project is using the energy in the waste gas and therefore eliminating the need of grid electricity. It reduces
the production of the same energy from generating stations connected to grid. The amount of electrical energy
generated and thereby substituted in the grid, is directly controlled by the project proponents, and will be under
the preview of monitoring and verification protocol. The actual amount of CO2 reduction however depends on the
generation mix and production scenario of the grid that is taken into consideration in the baseline factor. The
project does not have a direct control on the baseline. But since the baseline parameters like actual generation mix
in million units and efficiency of thermal power plants will affect the actual emission reduction units that are
PROJECT DESIGN DOCUMENT FORM (CDM PDD) - Version 02 JBSL-Waste Heat Recovery Based Captive Power Project
CDM – Executive Board page 36
This template shall not be altered. It shall be completed without modifying/adding headings or logo, format or font.
attained during verification, they too will be included in the Monitoring and Verification procedure. The
verification methodology takes into account the methodology to estimate the CO2 reduction.
Therefore, the direct project boundary includes the ABC, WHRBs and auxiliaries and STG (and its auxiliaries),
whereas the system boundary extends to the thermal power plants.
GHG Emissions Sources of the Project
Direct on-site emissions
As power is generated from the waste gas, which was released to the environment earlier project extracts the heat
energy through indirect physical contact (through boiler tube) there is no change in the composition of the waste
gas at the boiler inlet and outlet.
The controlled combustion in ABC will ensure that there will be no on-site emission from the project activity. As
all auxiliaries will be run by the power generated through the waste heat, no other major on-site emission will
takes place within the project boundary.
Indirect on-site emissions
The indirect on site GHG source will be the consumption of energy and the emission of GHGs involved in the
construction of waste heat recovery based power plant. Considering the life cycle of the total power generated and
the emissions to be avoided in the life span of the project, emissions from the above-mentioned source will become
too small and hence neglected. In comparison with the transportation and mining of equivalent coal/oil required
for power generation at thermal power plant (of the grid) the one-time indirect on-site emissions will be negligible.
Direct off site emissions
There will be no direct off site emissions from the project activity.
In-Direct off-site emissions
This includes emissions during the manufacturing process of parts, supplies and machinery required for building
the project (i.e. electromechanical equipment, etc.). But these emissions are outside the control of the project and
excluded.

PROJECT DESIGN DOCUMENT FORM (CDM PDD) - Version 02 JBSL- Waste Heat recovery Based Captive Power Project
CDM – Executive Board page 37
This template shall not be altered. It shall be completed without modifying/adding headings or logo, format or font.
D.2. 1. Option 1: Monitoring of the emissions in the project scenario and the baseline scenario D.2.1.1. Data to be collected in order to monitor emissions from the project activity, and how this data will be archived: ID number (Please use numbers to ease cross-referencing to D.3)
Data type Data Variable
Data unit
Measured (m), calculated (c) or estimated (e)
Recording Frequency
Proportion of data to be monitored
How will the data be archived? (electronic/ paper)
For how long is archived data to be kept
Comment
1. Qi Quantitative Volume of auxiliary fuel used by project
tonnes of m3
2. NCVf Quantitative Net calorific Value of fuel
TJ per m3
3.EFi Quantitative Carbon Emissions factor of fuel
tC/ TJ
Not applicable
As per the methodology, project emission is applicable only if any treatment is given to waste gases for additional heat gain and as a result there is additional emission of CO2 due to project activity. The Additional Heat Gain can take place due to any of the two following reasons: 1. Auxiliary firing using other fuels in After Burning Chamber (ABC) There is no provision for auxiliary fuel firing in ABC. Hence, there are no project emissions due to auxiliary fuel firing. 2. Improved Technology which results in improved combustion and additional heat gain: No technological up-gradation has been implemented in ABC. Hence there are no associated project emissions.
Since project emissions in the project activity are almost negligible, no data needs to be monitored for this purpose.

PROJECT DESIGN DOCUMENT FORM (CDM PDD) - Version 02 JBSL- Waste Heat recovery Based Captive Power Project
CDM – Executive Board page 38
This template shall not be altered. It shall be completed without modifying/adding headings or logo, format or font.
For Electricity Generated by Project Activity
ID No.
Data type
Data variable Data unit
Measured (m), calculated (c) or estimated (e)
Recording frequency
Proportion of data to be monitored
How will the data be archived? (Electronic/ paper)
For how long is archived data to be kept?
Comments
4. EGgen
Quantitative
Total Electricity Generated
MWh/year
Calculated22 Continuously 100% Electronic/ paper Credit Period + 2 years
MONITORING LOCATION: The data will be measured by meters at plant and DCS. Manager In-charge would be responsible for calibration of the meters. See Annexe 4 for details.
5. EGaux
Quantitative
Auxiliary consumption of Electricity
MWh/year
Calculated23 Continuously 100% Electronic/paper Credit period + 2 years
MONITORING LOCATION: The data will be measured by meters at plant and DCS. Manager In-charge would be responsible for regular calibration. See Annexe 4 for details
6. EGy
Quantitative
Net Electricity supplied
MWh/year
Calculated (EGgen- EGaux)
Continuously 100% Electronic/paper Credit Period + 2 years
Calculated from the above measured parameters. Algorithm for project emissions given in baseline methodology
22 Power generated due to waste heat recovery project will be calculated on the basis of total enthalpy of steam (enthalpy per unit steam x steam flow) from WHRBs as a percentage of total enthalpy of steam fed to common header of the CPP 23 Auxiliary consumption of electricity due to the project activity will be calculated as percentage of total auxiliary consumption in the same manner as mentioned above.

PROJECT DESIGN DOCUMENT FORM (CDM PDD) - Version 02 JBSL- Waste Heat recovery Based Captive Power Project
CDM – Executive Board page 39
This template shall not be altered. It shall be completed without modifying/adding headings or logo, format or font.
D.2.1.2. Description of formulae used to estimate project emissions (for each gas, source, formulae/algorithm, emissions units of CO2 equ.) >> Not Applicable
D.2.1.3. Relevant data necessary for determining the baseline of anthropogenic emissions by sources of GHGs within the project boundary and how such data will be collected and archived : ID No. Data type Data variable Data
unit Measured (m), calculated (c) or estimated (e)
For which baseline method(s) must this element be included
Recording frequency
Proportion of data to be monitored
How will the data be archived? (Electronic/ paper)
For how long is archived data to be kept? Comments
7. EFy Emission factor
CO2 emission factor of the grid
tCO2/ MWh
Calculated Simple OM, BM
Yearly 100% Electronic During the crediting period and two years after
Calculated as weighted sum of OM and BM emission factors
8. EFOM,y
Emission factor
CO2 operating margin emission factor of the grid
tCO2/ MWh
Calculated Simple OM
Yearly 100% Electronic During the crediting period and two years after
Calculated as indicated in the relevant OM baseline method above
9. EFBM,y
Emission factor
CO2 Build Margin emission factor of the grid
tCO2/ MWh
Calculated BM Yearly 100% Electronic During the crediting period and two years after
Calculated as [∑I Fi,y*COEFi]/ [∑mGENm,y] over recently

PROJECT DESIGN DOCUMENT FORM (CDM PDD) - Version 02 JBSL- Waste Heat recovery Based Captive Power Project
CDM – Executive Board page 40
This template shall not be altered. It shall be completed without modifying/adding headings or logo, format or font.
D.2.1.3. Relevant data necessary for determining the baseline of anthropogenic emissions by sources of GHGs within the project boundary and how such data will be collected and archived : ID No. Data type Data variable Data
unit Measured (m), calculated (c) or estimated (e)
For which baseline method(s) must this element be included
Recording frequency
Proportion of data to be monitored
How will the data be archived? (Electronic/ paper)
For how long is archived data to be kept? Comments
built power plants defined in the baseline methodology
10. Fi,j,y Fuel Quantity
Amount of each fossil fuel consumed by each power source/ plant
t or m3/year
Measured Simple OM BM
Yearly 100% Electronic During the crediting period and two years after
Obtained from authorised latest local statistics
11. COEFi,k
Emission factor coefficient
CO2 emission coefficient of each fuel type and each power source/plant
tCO2/ t or m3
Measured Simple OM BM
Yearly 100% Electronic During the crediting period and two years after
Calculated based on the IPCC default value of the Emission Factor, Net Calorific Value and Oxidation Factor of the fuel used by the power plants feeding to DPSCL
12. GENj,y
Electricity quantity
Electricity generation of
MWh/ year
Measured Simple OM BM
Yearly 100% Electronic During the crediting period and two years after
Obtained from the authorised

PROJECT DESIGN DOCUMENT FORM (CDM PDD) - Version 02 JBSL- Waste Heat recovery Based Captive Power Project
CDM – Executive Board page 41
This template shall not be altered. It shall be completed without modifying/adding headings or logo, format or font.
D.2.1.3. Relevant data necessary for determining the baseline of anthropogenic emissions by sources of GHGs within the project boundary and how such data will be collected and archived : ID No. Data type Data variable Data
unit Measured (m), calculated (c) or estimated (e)
For which baseline method(s) must this element be included
Recording frequency
Proportion of data to be monitored
How will the data be archived? (Electronic/ paper)
For how long is archived data to be kept? Comments
each power source/plant
latest local statictics

PROJECT DESIGN DOCUMENT FORM (CDM PDD) - Version 02 JBSL- Waste Heat recovery Based Captive Power Project
CDM – Executive Board page 42
This template shall not be altered. It shall be completed without modifying/adding headings or logo, format or font.
D.2.1.4. Description of formulae used to estimate baseline emissions (for each gas, source, formulae/algorithm, emissions units of CO2 equ.) >> Emission Factor of the Grid (EFGrid)
Electricity baseline emission factor (EFy) of DPSCL Grid mix ( i.e. DPSCL, DVC and WBSEB collective grid) is calculated as a combined margin (CM),
consisting of the combination of operating margin (OM) and build margin (BM) factors according to the following three steps. Calculations for this combined
margin must be based on data from an official source (where available) and made publicly available.
STEP1: Calculate the Operating Margin emission factor
The Simple OM emission factor (EFOM,simple,y ) for DPSCL Grid mix is calculated as the weighted average emissions (in t CO2equ/MWh) of all generating
sources serving the system, excluding hydro, geothermal, wind, low-cost biomass, nuclear and solar generation.
yjj
jiyjiji
ysimpleOM GEN
COEFxFEF
,
,,,,
,, ∑
∑=
where
COEFi,j is the CO2 emission coefficient of fuel i (t CO2 / mass or volume unit of the fuel), calculated as given below and
GENj,y is the electricity (MWh) delivered to the grid by source j
Fi ,j, y is the amount of fuel i (in a mass or volume unit) consumed by relevant power sources j in year(s) y , calculated as given below
j refers to the power sources delivering electricity to the grid, not including low-operating cost and must-run power plants, and including imports from other
grid
The Fuel Consumption Fi ,j, y is obtained as

PROJECT DESIGN DOCUMENT FORM (CDM PDD) - Version 02 JBSL- Waste Heat recovery Based Captive Power Project
CDM – Executive Board page 43
This template shall not be altered. It shall be completed without modifying/adding headings or logo, format or font.
⊗
⊗=
∑∑
jii
yjj
yjii
ENCV
GENF
,
,
,,
860
where
GENj,y is the electricity (MWh) delivered to the grid by source j
NCVi is the net calorific value (energy content) per mass or volume unit of a fuel i
Ei,j is the efficiency (%) of the power plants by source j
The CO2 emission coefficient COEFi is obtained as
iiCOii OXIDEFNCVCOEF ⊗⊗= ,2 where
NCVi is the net calorific value (energy content) per mass or volume unit of a fuel i
EFCO2,i is the CO2 emission factor per unit of energy of the fuel i
OXIDi is the oxidation factor of the fuel
The Simple OM emission factor (EFOM,simple,y) is calculated separately for the most recent three years (2001-2002, 2002-2003 & 2003-2004) and an average
value has been considered as the OM emission factor for the baseline (EFOM,y).
3/,,, ysimpleOMy
yOM EFEF ∑=
where y represents the years 2001-2002, 2002-2003 and 2003-2004

PROJECT DESIGN DOCUMENT FORM (CDM PDD) - Version 02 JBSL- Waste Heat recovery Based Captive Power Project
CDM – Executive Board page 44
This template shall not be altered. It shall be completed without modifying/adding headings or logo, format or font.
STEP 2. Calculate the Build Margin emission factor
The Build Margin emission factor (EFBM,y) has been calculated as the generation-weighted average emission factor (t CO2/MWh) of a sample of power plants m
of DPSCL. The sample group m consists of either
• the five power plants that have been built most recently, or
• the power plants capacity additions in the electricity system that comprise 20% of the system generation (in MWh) and that have been built most recently.
Project proponent should use from these two options that sample group that comprises the larger annual generation. The calculation for Build Margin emission
factor is furnished below:
ymm
miymimi
yBM GEN
COEFxFEF
,
,,,,
, ∑∑
=
where
Fi,m,y, COEFi,m and GENm,y - Are analogous to the variables described for the simple OM method above for plants m.
Considered calculations for the Build Margin emission factor EFBM,y is updated annually ex post for the year in which actual project generation and associated
emissions reductions occur. The sample group m for the most recent year consists of the 6 (six) power plants that have been added to the grid most recently,
since it comprises of larger annual power generation.
STEP 3. Calculate the Emission Factor of the Grid (EFGrid)
The electricity baseline emission factor of WBSEB, EFy is calculated as the weighted average of the Operating Margin emission factor (EFOM,y) and the Build
Margin emission factor (EFBM,y):

PROJECT DESIGN DOCUMENT FORM (CDM PDD) - Version 02 JBSL- Waste Heat recovery Based Captive Power Project
CDM – Executive Board page 45
This template shall not be altered. It shall be completed without modifying/adding headings or logo, format or font.
yBMBMyOMOMy EFWEFWEF ,, ⊗⊕⊗=
where the weights wOM and wBM, by default, are 50% (i.e., wOM = wBM = 0.5), and EFOM,y and EFBM,y are calculated as described in Steps 1 and 2 above and are
expressed in t CO2/MWh.
(Please refer to “Annex 3: Baseline Information” for further details on grid analysis)
Baseline Emission Calculations
Net units of electricity substituted in the grid (EGy) = (Total electricity generated-Auxiliary Consumption)WHR
= WHRAUXGEN EGEG )( −
EGy is calculated as mentioned above in the Table D.2.1.3
Therefore the Baseline Emission is calculated as,
yyy EFEGBE ⊗=
where,
BEy = Baseline Emissions due to displacement of electricity during the year y (in tons of CO2)
EGy = Net units of electricity substituted in the grid during the year y (in MWh)
EFy = Emission Factor of the grid (in tCO2/ MWh) and
y is any year within the crediting period of the project activity

PROJECT DESIGN DOCUMENT FORM (CDM PDD) - Version 02 JBSL- Waste Heat recovery Based Captive Power Project
CDM – Executive Board page 46
This template shall not be altered. It shall be completed without modifying/adding headings or logo, format or font.
D. 2.2. Option 2: Direct monitoring of emission reductions from the project activity (values should be consistent with those in section E). Not applicable
D.2.2.1. Data to be collected in order to monitor emissions from the project activity, and how this data will be archived: ID number (Please use numbers to ease cross-referencing
to table D.3)
Data variable
Source of data
Data unit
Measured (m), calculated (c), estimated (e),
Recording Frequency
Proportion of data to
be monitored
How will the data be archived? (electronic/
paper)
Comment
D.2.2.2. Description of formulae used to calculate project emissions (for each gas, source, formulae/algorithm, emissions units of CO2 equ.): >>

PROJECT DESIGN DOCUMENT FORM (CDM PDD) - Version 02 JBSL- Waste Heat recovery Based Captive Power Project
CDM – Executive Board page 47
This template shall not be altered. It shall be completed without modifying/adding headings or logo, format or font.
D.2.3. Treatment of leakage in the monitoring plan D.2.3.1. If applicable, please describe the data and information that will be collected in order to monitor leakage effects of the project activity ID number (Please use numbers to ease cross-referencing to table D.3)
Data variable
Source of data Data
unit
Measured (m), calculated (c) or estimated (e)
Recording frequency
Proportion of data to be monitored
How will the data be archived? (electronic/ paper)
Comment
There are no potential sources of leakage which can be attributed to the project activity. Hence no data is required to be monitored for this purpose. D.2.3.2. Description of formulae used to estimate leakage (for each gas, source, formulae/algorithm, emissions units of CO2 equ.) >> Not Applicable
D.2.4. Description of formulae used to estimate emission reductions for the project activity (for each gas, source, formulae/algorithm, emissions units of CO2 equ.) >>
CO2 Emission Reduction Calculations
Step 1 : Baseline Emissions - Project Emissions Please refer to Section E.5 of this document.
D.3. Quality control (QC) and quality assurance (QA) procedures are being undertaken for data monitored

PROJECT DESIGN DOCUMENT FORM (CDM PDD) - Version 02 JBSL- Waste Heat recovery Based Captive Power Project
CDM – Executive Board page 48
This template shall not be altered. It shall be completed without modifying/adding headings or logo, format or font.
Data (Indicate table and ID number e.g. 1. , -14.)
Uncertainty level of data (High/Medium/Low)
Are QA/QC procedures planned for these data?
Outline explanation why QA/QC procedures are or are not being planned.
1., -2. Low Yes It is a critical parameter that would affect the GHG reductions claims.
4.,-6. Low Yes This data will be used for calculation of project electricity generation.
7.,-9. Low No This data is calculated, so does not need QA procedures
10., - 12. Low No This data will be required for the calculation of baseline emissions (from grid electricity) and will be obtained through published and official sources.
Note on QA/QC: The parameters related to the performance of the project will be monitored using meters and standard testing equipment, which will be regularly calibrated following standard industry practices. D.4 Please describe the operational and management structure that the project operator will implement in order to monitor emission reductions and any leakage effects, generated by the project activity The Plant Manager is responsible for monitoring and archiving of data required for estimating the emission reductions. He would be supported by the shift in-
charge who would continuously monitor the data logging and would generate daily, monthly reports
D.5 Name of person/entity determining the monitoring methodology:
Experts and consultants of JBSL.

PROJECT DESIGN DOCUMENT FORM (CDM PDD) - Version 02 CDM – Executive Board page 49
This template shall not be altered. It shall be completed without modifying/adding headings or logo, format or font.
SECTION E. Estimation of GHG emissions by sources E.1. Estimate of GHG emissions by sources: The project activity utilizes the heat content of the waste gas available from the Sponge Iron kilns as its
fuel source. Since the composition of the waste gas at the boiler inlet and the boiler outlet is identical and
there are no other fuel source within the project boundary the project activity itself leads to zero net GHG
on-site emissions.
E.2. Estimated leakage: There is no leakage activity, which contributes to the GHG emissions outside the project boundary.
E.3. The sum of E.1 and E.2 representing the project activity emissions:
A net emission by project activity (E1+E2) is zero tonnes of CO2 per kWh of power generation.
E.4. Estimated anthropogenic emissions by sources of greenhouse gases of the baseline:
Sl. No. Operating Years
Baseline Emission Factor (kg CO2 / kWh )
Baseline Emissions (tonnes of CO2)
1. Oct. 2005 – Mar.2006
0.927 26119.47
2. 2006-2007 0.927 52239.49
3. 2007-2008 0.927 52239.49
4. 2008-2009 0.927 52239.49
5. 2009-2010 0.927 52239.49
6. 2010-2011 0.927 52239.49
7. 2011-2012 0.927 52239.49
8. 2012-2013 0.927 52239.49
9. 2013-2014 0.927 52239.49
10. 2014-2015 0.927 52239.49
11. Apr 2015 – Sep2015
0.927 26119.47

PROJECT DESIGN DOCUMENT FORM (CDM PDD) - Version 02 CDM – Executive Board page 50
This template shall not be altered. It shall be completed without modifying/adding headings or logo, format or font.
E.5. Difference between E.4 and E.3 representing the emission reductions of the project activity:
Sl. No.
Operating Years
Baseline Emissions
(tonnes of CO2)
Project Emission (tonnes of
CO2)
CO2 Emission Reductions (tonnes of
CO2) 1. Oct2005-
Mar2006
26119.47 0 26119.47
2. 2006-2007 52239.49 0 52239.49
3. 2007-2008 52239.49 0 52239.49
4. 2008-2009 52239.49 0 52239.49
5. 2009-2010 52239.49 0 52239.49
6. 2010-2011 52239.49 0 52239.49
7. 2011-2012 52239.49 0 52239.49
8. 2012-2013 52239.49 0 52239.49
9. 2013-2014 52239.49 0 52239.49
10. 2014-2015 52239.49 0 52239.49
11. Apr2015-
Sep2015
26119.47 0 26119.47
Total tonnes of CO2 Estimated Emission Reductions: 522395 over 10 year crediting period E.6. Table providing values obtained when applying formulae above: Please refer to Appendix III for Details

PROJECT DESIGN DOCUMENT FORM (CDM PDD) - Version 02 CDM – Executive Board page 51
This template shall not be altered. It shall be completed without modifying/adding headings or logo, format or font.
SECTION F. Environmental impacts F.1. Documentation on the analysis of the environmental impacts, including transboundary impacts:
Article 12 of the Kyoto Protocol requires that a CDM project activity contribute to the sustainable development of the host country. Assessing the
project’s positive and negative impacts on the local environment and on society is thus a key element for each CDM project. JBSL proposes to
implement the CDM project activity because of their commitment to ensure maximum global and local benefits in relation to certain environmental
and social issues and was a major step towards sustainable development.
With regard to the local environment the project has positive effects on local air and water quality. The new waste gas treatment technology adopted
is better one.
By displacing electricity demand on the grid, the project will reduce emissions related to coal-fired power production, which include carbon dioxide,
sulphur oxides, nitrogen oxides and particulates. It will also conserve the non-renewable natural resource – coal and reduced the adverse impacts
related to transportation of coal and coal mining that would have been required to meet the additional capacity requirement of thermal power plants.
These aspects contribute to the regional and global benefits.
Environmental Impact Analysis
The heat recovery based captive power project would cause an impact on Environment in three distinct phases:
• During Construction Phase
• During Operational Phase and
• Maintenance Phase
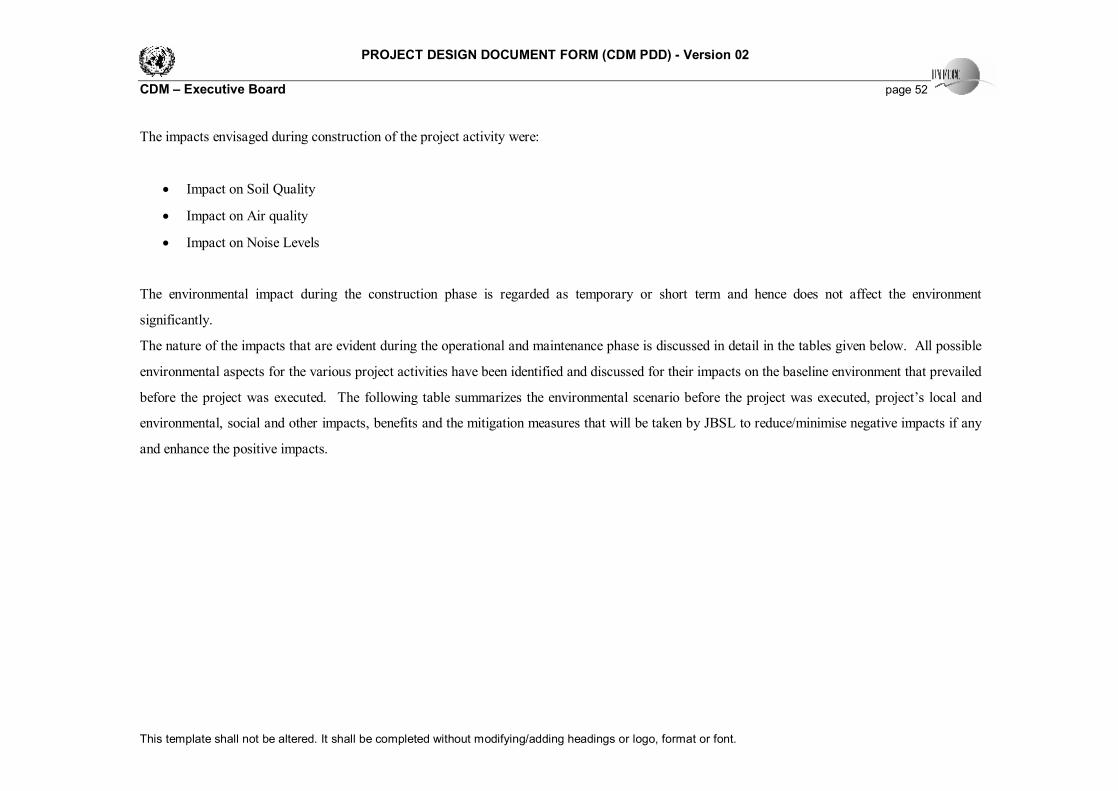
PROJECT DESIGN DOCUMENT FORM (CDM PDD) - Version 02 CDM – Executive Board page 52
This template shall not be altered. It shall be completed without modifying/adding headings or logo, format or font.
The impacts envisaged during construction of the project activity were:
• Impact on Soil Quality
• Impact on Air quality
• Impact on Noise Levels
The environmental impact during the construction phase is regarded as temporary or short term and hence does not affect the environment
significantly.
The nature of the impacts that are evident during the operational and maintenance phase is discussed in detail in the tables given below. All possible
environmental aspects for the various project activities have been identified and discussed for their impacts on the baseline environment that prevailed
before the project was executed. The following table summarizes the environmental scenario before the project was executed, project’s local and
environmental, social and other impacts, benefits and the mitigation measures that will be taken by JBSL to reduce/minimise negative impacts if any
and enhance the positive impacts.

PROJECT DESIGN DOCUMENT FORM (CDM PDD) - Version 02 CDM – Executive Board page 53
This template shall not be altered. It shall be completed without modifying/adding headings or logo, format or font.
SL. NO. ENVIRONMENTAL IMPACTS & BENEFITS MITIGATION MEASURES/
REMARKS
A CATEGORY: ENVIRONMETAL – NATURAL RESOURCE CONSERVATION 1. Conservation of coal – A non-renewable natural resource:
• By displacing JBSL Plant’s electricity demand on the grid (which would
otherwise been met from the grid), the project activity will reduce an equivalent amount of coal consumption that would have required meeting the future additional capacity requirements of thermal power plants
• In absence of the project activity the hot and dust laden gas from the ABC would have been passed through a refractory lined duct to the Gas Cooling Tower (GCT is a power intensive pollution control equipment having high electrical load) where it would get cooled by spray water to about 2000C. After the implementation of CPP the gas will be cooled in WHRB. The operation of CPP would reduce the energy consumption by decreasing the energy requirement of the gas-cooling tower. Reducing energy requirement the project is going to reduce an equivalent amount of coal consumption that would have been required to meet the future additional capacity requirement of thermal power plants.
The project activity is a step towards Coal Conservation.

PROJECT DESIGN DOCUMENT FORM (CDM PDD) - Version 02 CDM – Executive Board page 54
This template shall not be altered. It shall be completed without modifying/adding headings or logo, format or font.
SL. NO ENVIRONMENTAL IMPACTS & BENEFITS MITIGATION MEASURES/ REMARKS
B CATEGORY: ENVIRONMETAL – AMBIENT AIR QUALITY 1.
• JBSL being a Sponge Iron (DRI) making company generates hot dusty gas from rotary kiln. Company already had an elaborate gas-cleaning tower inclusive of multi field Electrostatic Precipitator (ESP), ID fan, Stack etc. The only change in the system during the project will be the replacement of Gas Conditioning Tower (GCT) to Waste heat recovery Boiler for generation of power. By the project activity exit gas temperature in atmosphere will be reduced without any change in the gas cleaning system. The project will not create any additional pollutant in the exit gas of the stack since it will be driven by an unfired Waste Heat Recovery Boiler. The ESP will be designed to limit the dust concentration below 150 mg/ Nm3 at the outlet of ESP.
• The ambient air quality in and around the JBSL factory will expected to
be found well within the statutory limits. (as per the design). There will be no variations in the AAQ data after the project execution and the SPM values too will be well within the limits. All other ambient air quality parameters i.e. SO2, NOx, CO, HC concentrations will also remain below the West Bengal Pollution Control Board standards. Therefore we can conclude the project activity will have no negative impacts on the ambient air quality of the area.
―
SL. NO ENVIRONMENTAL IMPACTS & BENEFITS MITIGATION MEASURES/ REMARKS

PROJECT DESIGN DOCUMENT FORM (CDM PDD) - Version 02 CDM – Executive Board page 55
This template shall not be altered. It shall be completed without modifying/adding headings or logo, format or font.
SL. NO ENVIRONMENTAL IMPACTS & BENEFITS MITIGATION MEASURES/ REMARKS
C. CATEGORY: ENVIRONMENTAL – AIR EMISSIONS
SUB CATEGORY: THERMAL POLLUTION
1. The project activity will utilize the heat content of the gases and thereby reduce heat energy release to atmosphere either as hot air emissions or as hot wastewater emissions from the Gas Cleaning Tower. Presently the temperature of the waste gas at the ABC out let is 950 – 10000C and then in the gas cleaning tower the spray water reduces the temperature of the waste flue gas before it enters the ESP. Presently i.e. in the absence of the project due to the absence of the implementation of WHRB the hot gases are released to atmosphere. Therefore the project activity will reduced thermal Pollution as well as the loss of heat energy to a great extent. The heat energy, which is currently get lost, will be converted to electrical energy in the after project scenario. The stack emission temperatures in the after project scenario will also found to be lower.
The WHRB will recover a part of the heat content of the waste gas to generate steam, which will further generate electricity. As the gas will come out from WHRB and finally pass through ESP the temperature of the outlet gas will fall to 1750C from earlier 2200C.
SUB CATEGORY: SPM & DUST REDUCTION 2.
As a result of the project activity, air pollution from JBSL will be reduced due to a better air pollution control mechanism. Therefore there has been a marked reduction in air pollution levels. However all the SPM emission values before and after the project execution would be well within the statutory limits of 150mg/Nm3 (as given by West Bengal Pollution Control Board regulations).
Presently the waste gases coming out of the ABC are passed through the GCT followed by a multi-field ESP to meet the pollution control norms of SPM level of 150mg/Nm3. In terms of meeting the SPM standards the proposed project activity will be more efficient in the sense that the WHRB in CPP will reduce the temperature of the waste gas around 180 degree C at which the ESP operates with maximum efficiency. A high collection efficiency (99.714%) of ESP will ensure SPM levels less than 150 mg/ Nm3 in the stack. The stack height is 50 m, which will further help, in fast dispersion of pollutants into the atmosphere, thus, reducing their impacts in the vicinity of the project area.

PROJECT DESIGN DOCUMENT FORM (CDM PDD) - Version 02 CDM – Executive Board page 56
This template shall not be altered. It shall be completed without modifying/adding headings or logo, format or font.
SL. NO ENVIRONMENTAL IMPACTS & BENEFITS MITIGATION MEASURES/ REMARKS
3.
The impact due to construction will, however, be temporary. The impact will be confined to the project boundaries.
Sprinkling of water on roads and construction site, proper upkeep of and maintenance of vehicles, providing sufficient vegetation etc. are some of the measures, which would greatly reduce the impacts during the construction phase.
SUB CATEGORY: CO2 REDUCTION & OTHERS
4. By displacing electricity demand on the grid, the project will reduce emissions related to coal fired/ Thermal power production, which include carbon dioxide, sulphur di oxides and particulates. The total estimated amount of carbon-di-oxide reduction in the 10- year crediting period is 587720 tons.
―
5. The project activity will also reduce the adverse impacts on air quality related to transportation of coal and coal mining that would have been required to meet the additional capacity requirement of thermal power plants.
―
6.
During the shutdown period of the plant an auxiliary stack on top of After Burning Chamber (ABC) will be provided for diverting the flue gas from ABC to atmosphere. The flue gas from the kilns will be directly routed to the ESP before discharging into environment.
During the maintenance phase of the waste heat recovery power plant a Gas Conditioning Tower (GCT) will cool the flue gas before passing through ESP.

PROJECT DESIGN DOCUMENT FORM (CDM PDD) - Version 02 CDM – Executive Board page 57
This template shall not be altered. It shall be completed without modifying/adding headings or logo, format or font.
SL. NO. ENVIRONMENTAL IMPACTS & BENEFITS MITIGATION MEASURES/ REMARKS
D CATEGORY: WASTE WATER GENERATION

PROJECT DESIGN DOCUMENT FORM (CDM PDD) - Version 02 CDM – Executive Board page 58
This template shall not be altered. It shall be completed without modifying/adding headings or logo, format or font.
1.
(i) Water for power plant will be mostly used for: • As coolant for condensing the bulk of steam collected. • For slurry making in dust disposal system. • Demineralized water for boiler make-up, drinking, sanitary,
fire fighting etc. (ii) There will be a Reverse Osmosis (RO) based water treatment plant to cater to make-up water requirement of steam generator turbine cycle. In the water treatment plant, acidic and alkaline effluents will be generated:
• During regeneration of the cation/ anion and the mixed bed exchangers.
• In the demineralised water treatment plant (DM plant) acidic and alkaline effluents will be generated during the regeneration of cation /anion and mixed bed exchangers. The effluent from wastewater treatment plant will be led into a properly sized impervious, neutralization pit. Normally these effluents are self-neutralizing but provision has been made in the design for dosing lime/acid into the neutralization pit to ensure proper pH value before it is being sent to the effluent treatment pond which forms a part of the power plant effluent disposal system.
(iii) Waste Water Treatment: Wastewater will be generated from the effluents of water treatment plant, steam generator blow down and sewages from various buildings in the plant.
(i) In the after project scenario the water cooled condensing system will be removed by air cooled condensing system to reduce the generation of waste water. (ii) The effluents from the RO water treatment plant will be led into a properly sized impervious, neutralization pit of 15-cu.m capacity. Normally these effluents are self neutralizing but provision will be made for dosing lime into the neutralization pit to ensure a sufficiently high PH value before these effluents get disposed. (iii) Waste water treatment for the plant will be based on discharge of various wastewaters to ponds for clarification and filtration. Oily water will be treated separately to remove oil/ grease before discharge into effluent ponds.
SL. NO. ENVIRONMENTAL IMPACTS & BENEFITS MITIGATION MEASURES/ REMARKS
D CATEGORY: WASTE WATER GENERATION
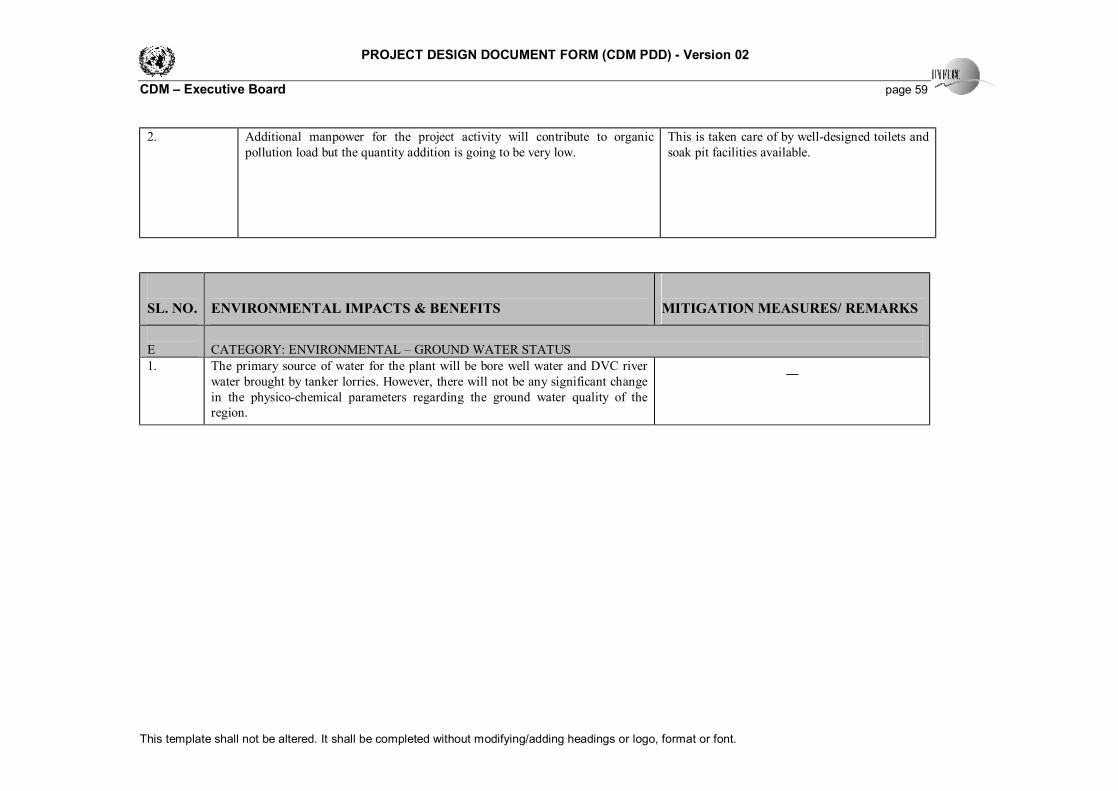
PROJECT DESIGN DOCUMENT FORM (CDM PDD) - Version 02 CDM – Executive Board page 59
This template shall not be altered. It shall be completed without modifying/adding headings or logo, format or font.
2.
Additional manpower for the project activity will contribute to organic pollution load but the quantity addition is going to be very low.
This is taken care of by well-designed toilets and soak pit facilities available.
SL. NO.
ENVIRONMENTAL IMPACTS & BENEFITS
MITIGATION MEASURES/ REMARKS
E
CATEGORY: ENVIRONMENTAL – GROUND WATER STATUS
1. The primary source of water for the plant will be bore well water and DVC river water brought by tanker lorries. However, there will not be any significant change in the physico-chemical parameters regarding the ground water quality of the region.
―
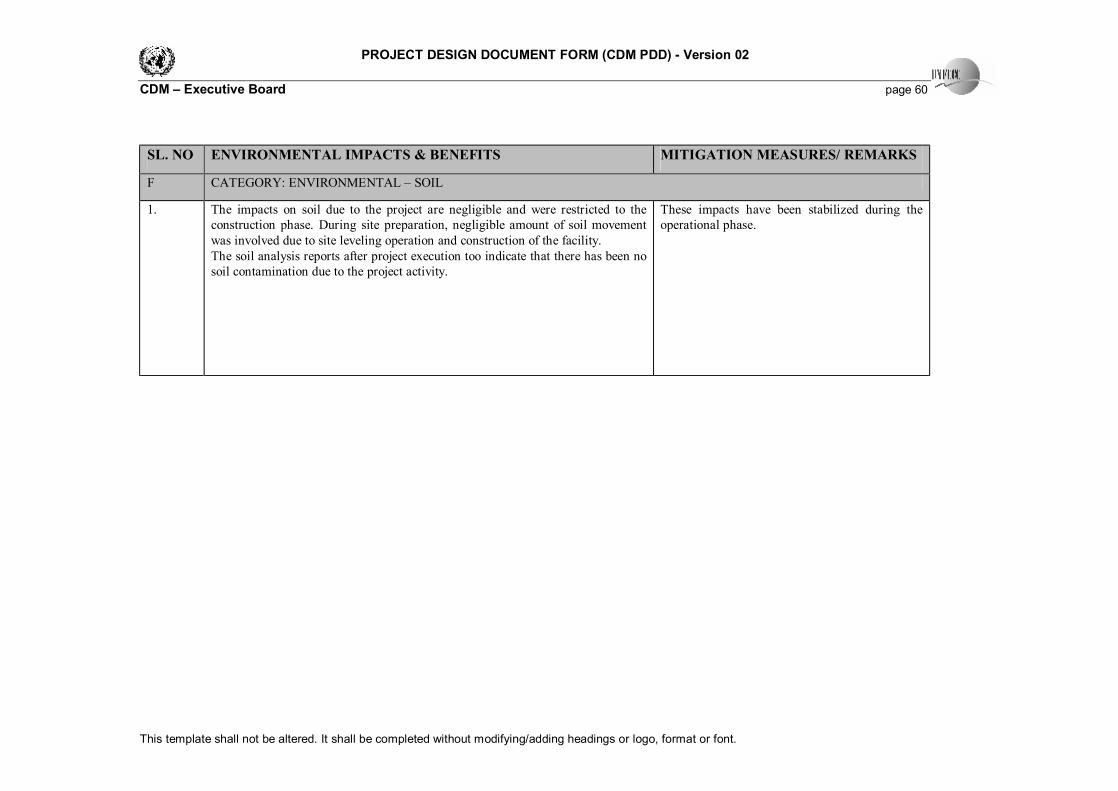
PROJECT DESIGN DOCUMENT FORM (CDM PDD) - Version 02 CDM – Executive Board page 60
This template shall not be altered. It shall be completed without modifying/adding headings or logo, format or font.
SL. NO ENVIRONMENTAL IMPACTS & BENEFITS MITIGATION MEASURES/ REMARKS
F CATEGORY: ENVIRONMENTAL – SOIL
1.
The impacts on soil due to the project are negligible and were restricted to the construction phase. During site preparation, negligible amount of soil movement was involved due to site leveling operation and construction of the facility. The soil analysis reports after project execution too indicate that there has been no soil contamination due to the project activity.
These impacts have been stabilized during the operational phase.

PROJECT DESIGN DOCUMENT FORM (CDM PDD) - Version 02 CDM – Executive Board page 61
This template shall not be altered. It shall be completed without modifying/adding headings or logo, format or font.
SL. NO ENVIRONMENTAL IMPACTS & BENEFITS MITIGATION MEASURES/ REMARKS
G. CATEGORY: ENVIRONMENTAL – SOLID WASTE GENERATION 1. 1. The bulk of the solid wastes is generated from dusts containing unreacted
iron ore and coal ash. There is no additional solid waste generation from the project activity. There is no problem associated so far with the collection, handling and transportation of solid wastes. Also there is no further pollution risk of air, water or soil at the place of disposal of solid wastes. 2. Presently i.e. in the before project scenario the gas after getting cooled at GCT is allowed to enter to the ESP for cleaning before discharging to atmosphere and the waste ESP dust is having approximately 15% fixed carbon. However, in the after project scenario the gas will pass through WHRB followed by ESP and carbon content in the ESP discharge dust drastically will be reduced to 3% (max). This reduction in the carbon content will enable to use the ESP dust to make fly ash brick. 3. The fly ash in a coal based sponge iron plant & thermal power plant is a common problem since it creates air pollution, water pollution and land contamination and this fly ash coming out of ESP does not have any market value.
There is a dump yard within the plant boundary meant for proposed disposal & treatment of plant sludge. Fly ash collected from the ESP hoppers and the air heater hoppers and the ash collected from the furnace bottom hoppers, which is also dry, can be used for land filling, cement or brick manufacturing. The estimated amount of ash quantity generated from all the boilers will be 42,000 MT/annum.

PROJECT DESIGN DOCUMENT FORM (CDM PDD) - Version 02 CDM – Executive Board page 62
This template shall not be altered. It shall be completed without modifying/adding headings or logo, format or font.
SL. NO
ENVIRONMENTAL IMPACTS & BENEFITS
MITIGATION MEASURES/ REMARKS
H. CATEGORY: ENVIRONMENTAL – NOISE GENERATION
1. The equipments used in the project will be designed and other noise abatement measures will seriously be taken in such a way so as to keep the noise level below 85 to 90 db(A) as per the requirement of Occupational Safety and Health Administration (OSHA) Standards.
• The plant and equipment used will be designed and specified with a view to minimize noise pollution.
• Employees in high noise areas will be provided with ear protection devices.

PROJECT DESIGN DOCUMENT FORM (CDM PDD) - Version 02 CDM – Executive Board page 63
This template shall not be altered. It shall be completed without modifying/adding headings or logo, format or font.
F.2. If environmental impacts are considered significant by the project participants or the host Party, please provide conclusions and all references to support documentation of an environmental impact assessment undertaken in accordance with the procedures as required by the host Party: Host party regulations do not require an Environmental Impact Assessment for the project activity. This project activity in turn has positive
environmental impacts and the environmental clearance has been received. The Heat Recovery Based Power Plant with ESP is a cleaner and more
energy efficient air pollution control measure as compared to the Gas Conditioning Tower technology. The project activity is not polluting and the
impacts associated with the project activity are insignificant. Environmental Clearance documents from relevant Government Departments are
available with the project proponent and can be shown on request.
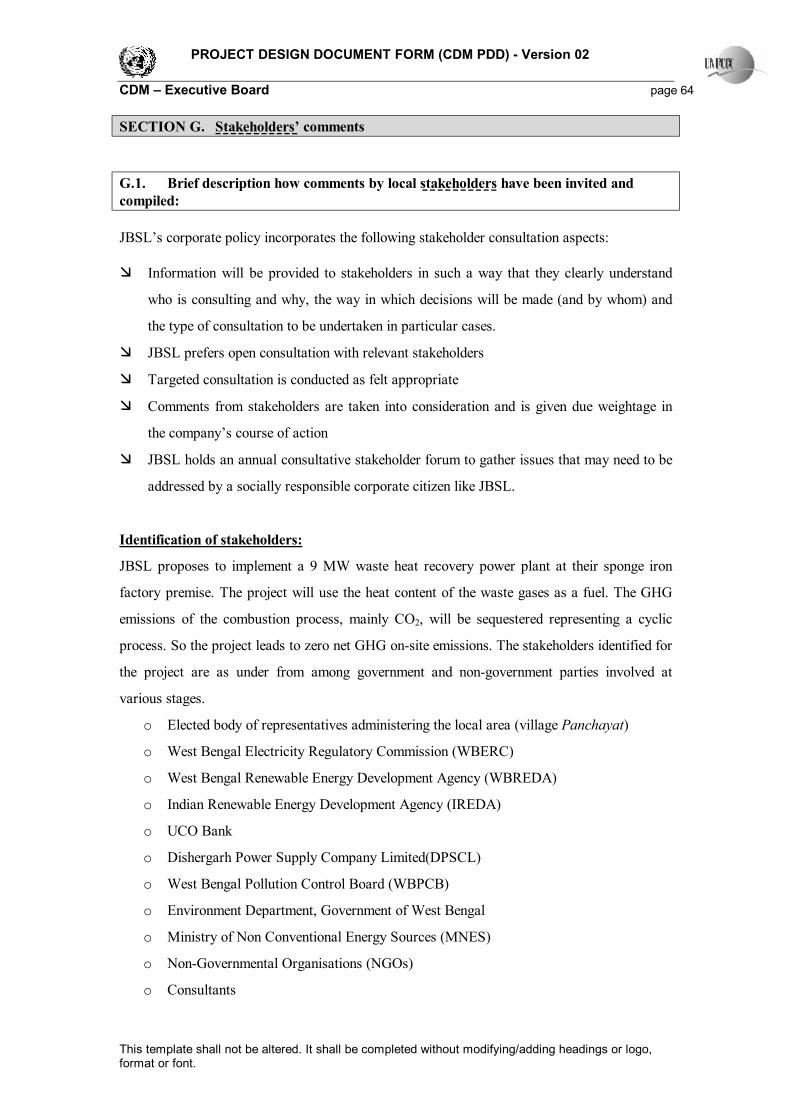
PROJECT DESIGN DOCUMENT FORM (CDM PDD) - Version 02 CDM – Executive Board page 64
This template shall not be altered. It shall be completed without modifying/adding headings or logo, format or font.
SECTION G. Stakeholders’ comments G.1. Brief description how comments by local stakeholders have been invited and compiled: JBSL’s corporate policy incorporates the following stakeholder consultation aspects: æ Information will be provided to stakeholders in such a way that they clearly understand
who is consulting and why, the way in which decisions will be made (and by whom) and
the type of consultation to be undertaken in particular cases.
æ JBSL prefers open consultation with relevant stakeholders
æ Targeted consultation is conducted as felt appropriate
æ Comments from stakeholders are taken into consideration and is given due weightage in
the company’s course of action
æ JBSL holds an annual consultative stakeholder forum to gather issues that may need to be
addressed by a socially responsible corporate citizen like JBSL.
Identification of stakeholders:
JBSL proposes to implement a 9 MW waste heat recovery power plant at their sponge iron
factory premise. The project will use the heat content of the waste gases as a fuel. The GHG
emissions of the combustion process, mainly CO2, will be sequestered representing a cyclic
process. So the project leads to zero net GHG on-site emissions. The stakeholders identified for
the project are as under from among government and non-government parties involved at
various stages.
o Elected body of representatives administering the local area (village Panchayat)
o West Bengal Electricity Regulatory Commission (WBERC)
o West Bengal Renewable Energy Development Agency (WBREDA)
o Indian Renewable Energy Development Agency (IREDA)
o UCO Bank
o Dishergarh Power Supply Company Limited(DPSCL)
o West Bengal Pollution Control Board (WBPCB)
o Environment Department, Government of West Bengal
o Ministry of Non Conventional Energy Sources (MNES)
o Non-Governmental Organisations (NGOs)
o Consultants

PROJECT DESIGN DOCUMENT FORM (CDM PDD) - Version 02 CDM – Executive Board page 65
This template shall not be altered. It shall be completed without modifying/adding headings or logo, format or font.
G.2. Summary of the comments received: Stakeholders Involvement
The village Panchayat /local elected body of representatives administering the local area is a
true representative of the local population in a democracy like India. Hence, their comments on
the project activity are necessary. JBSL has received their opinions for the project. Local
population comprises of the local people in and around the project area. The roles of the local
people are as the beneficiary of the project. In addition to this, it will also include local
manpower working at the plant site. Since, the project results in environmental benefits and will
provide good direct employment opportunities the local populace holds positive opinion about
the project.
The project will not cause any major displacement of the local population. The project will be
set up on a barren land inside the factory premises. Thus, the project will not cause any adverse
social impacts on local population rather will help in improvising their quality of life.
West Bengal Pollution Control Board (WBPCB) and Environment Department of Government
of West Bengal have prescribed standards of environmental compliance and monitor the
adherence to the standards. The project has received the Consent to Establish (or No Objection
Certificate (NOC) from WBPCB before the commissioning of the plant.
Indian Renewable Energy Development Agency (IREDA – A Government of India Enterprises)
has done the financial appraisal of the of the project activity. IREDA invited the industries,
which have waste sources, to utilise the same for power generation by availing IREDA’s
financial assistance. The Government of India, through Ministry of Non-conventional Energy
Sources (MNES), has been promoting energy conservation, demand side management and
viable renewable energy projects including wind, small hydro and bagasse cogeneration / bio-
mass power.
Project consultants were involved in the project to take care of various pre contract and post
contract project activities like preparation of Detailed Project Report (DPR), preparation of
basic and detailed engineering documents, preparation of tender documents, selection of
vendors / suppliers, supervision of project implementation, successful commissioning and trial
runs. Equipment suppliers, one of the stakeholders have supplied the equipments as per the

PROJECT DESIGN DOCUMENT FORM (CDM PDD) - Version 02 CDM – Executive Board page 66
This template shall not be altered. It shall be completed without modifying/adding headings or logo, format or font.
specifications finalized for the project and are responsible for successful erection &
commissioning of the same at the site.
Stakeholders’ Comments
JBSL has already received the major necessary approvals and consents from various
authorities, required for project implementation like West Bengal Electricity Regulatory
Commission and West Bengal Pollution Control Board. They have also received a positive
response from the Village Panchayat and other stakeholders for the project activity.
G.3. Report on how due account was taken of any comments received:
The relevant comments and important clauses mentioned in the project documents/clearances
like Detailed Project Report (DPR), environmental clearances, local clearance etc. were
considered while preparation of CDM project development document.
The JBSL representatives met with the various stakeholders for appraisal and support. They
were commended for their voluntary action toward environmental development and energy
efficient measures undertaken in this project involving generation of electricity by utilising
process waste gases with associated energy efficiency and positive environmental effects.
As per UNFCCC requirement this Project Design Document (PDD) will be published at the
validator’s web site for public comments.

PROJECT DESIGN DOCUMENT FORM (CDM PDD) - Version 02 CDM – Executive Board page 67
This template shall not be altered. It shall be completed without modifying/adding headings or logo, format or font.
Annex 1
CONTACT INFORMATION ON PARTICIPANTS IN THE PROJECT ACTIVITY Organization: Jai Balaji Sponge Limited
Street/P.O.Box: 5 Bentinck Street
Building: -
City: Kolkata
State/Region: West Bengal
Postfix/ZIP: 700001
Country: India
Telephone: 91-33-2242 6263
FAX: -
E-Mail: -
URL: -
Represented by: Mr. A. K. Gulati
Title: Director (Technical)
Salutation: Mr.
Last Name: Gulati
Middle Name: K
First Name: A
Department: Technical
Mobile: -
Direct FAX: -
Direct tel: 91-33-2242 6263
Personal E-Mail: -

PROJECT DESIGN DOCUMENT FORM (CDM PDD) - Version 02 CDM – Executive Board page 68
This template shall not be altered. It shall be completed without modifying/adding headings or logo, format or font.
Annex 2 INFORMATION REGARDING PUBLIC FUNDING
Till now funding from any Annex I country is not available.

PROJECT DESIGN DOCUMENT FORM (CDM PDD) - Version 02 CDM – Executive Board page 69
This template shall not be altered. It shall be completed without modifying/adding headings or logo, format or font.
Annex3
BASELINE INFORMATION
Determination of Carbon Intensity of Chosen Grid
A) Choice of the grid that will be affected by the project activity
The Current Delivery System in India and West Bengal were studied for selection of a realistic
grid representing the factual scenario associated with the project activity. Relevant
information/data are provided herein.
CURRENT DELIVERY SYSTEM
Indian power grid system (or the National Grid) is divided into five regional grids namely
Northern, North Eastern, Eastern, Southern and Western Region Grids. The Eastern Regional
Grid consists of Bihar, Jharkhand, Orissa, West Bengal, Damodar Valley Corporation (DVC)
and Sikkim state sector grids. These regional grids have independent Load Dispatch Centres
(LDCs) that manage the flow of power in their jurisdiction. Power generated by state owned
generation units and private owned generation units would be consumed totally by respective
states. However there is a deviation in the case of West Bengal Grid. The deviation has been
dealt with in the following section. The power generated by central sector generation plants will
be shared by all states forming part of the grid in fixed proportion. This central share amount
has been allocated for the West Bengal State.
GRID SELECTION
Dishergarh Power Supply Company Limited (DPSCL) system: The project activity draws
power from DPSCL grid which is a private Generation cum Distribution Company operating in
the area. The DPSCL generation system consists mainly of two coal based generating stations
at Chinakuri (30MW) and Dishergarh (10MW). The present peak load of the company is 122
MW. Around 32% of the load is met from own generation, while the balance is met through
imports of power from DVC and WBSEB. Imports of power take place from DVC at four
points spread over its licensed area and from WBSEB at one point. The Company is involved
in supply of power to WBSEB consumers at 18 different points in its licensed area spread over
nearby Asansol / Raniganj Coal & Industrial belts. For calculations of emission factor, the

PROJECT DESIGN DOCUMENT FORM (CDM PDD) - Version 02 CDM – Executive Board page 70
This template shall not be altered. It shall be completed without modifying/adding headings or logo, format or font.
power drawn from own generating stations of DPSCL alone is considered and not the
import of power from WBSEB or DVC to avoid double counting.
WBSEB system:
The WBSEB has the primary responsibility for the supply of electricity that may be required
within the state and for transmission and distribution of the same in most efficient manner.
The transmission and distribution system in West Bengal has access to electricity generated
from:
Ø WestBengal’s share from generating stations set up by the Central Government
[“Central Sector Plants”]
The central government (Government of India) owns power generation plants managed by
Government of India Enterprises like National Thermal Power Corporation Ltd (NTPC),
National Hydroelectric Power Corporation Ltd (NHPC), Damodar Valley Corporation (DVC)
and Power Grid Corporation of India (PGCIL) Chukka. However, power drawn from DVC
system is excluded in the generation mix of WBSEB to avoid double counting.
Power generated by the central sector is being fed to the grid, which is accessible to all states
in the region. The power generated by central sector generation plants is shared by all states
forming part of the grid in fixed proportion as mentioned above. As per the Availability Based
Tariff (ABT) Notification the central sector power generating units would operate at a plant
load factor of 80% and West Bengal state has to make payments for its total share in the
central sector. Therefore West Bengal would have to draw its allocated share from the central
sector generating stations.. In India, nuclear power generation is allowed only by Central Sector
Organisations. However West Bengal has no share in the nuclear power generating stations.
Therefore the power mix may be thermal, hydro and wind.
Ø West Bengal’s State owned generation24
The state sector in West Bengal comprises of three entities namely West Bengal State
Electricity Board (WBSEB), West Bengal Power Development Corporation Limited
(WBPDCL) and Durgapur Projects Limited (DPL). WBSEB currently has a total generating
capacity of 264.01 MW (100 MW-Gas and 164.01MW Hydro) and is primarily into
24 Refer WBSEB Annual Report 2003-04 and http://cea.nic.in/ge_re/2004-05/contents.pdf

PROJECT DESIGN DOCUMENT FORM (CDM PDD) - Version 02 CDM – Executive Board page 71
This template shall not be altered. It shall be completed without modifying/adding headings or logo, format or font.
transmission and distribution. WBPDCL is in the business of electric power generation and
supply and has a total generating capacity of 2910 MW.
DPL operates a power plant with a capacity of 395 MW and is engaged in all the three
functional areas of a power utility – the generation, transmission and distribution. The
company is generating power from its six power units and distributing power at 11KV in its
licensed area at Durgapur and the surplus power transmitted to WBSEB Grid.
Ø West Bengal’s Private owned generation
In addition to the State Sector, the other entities operating in West Bengal as Private
Companies are CESC Limited (with a generating capacity of 1155 MW) and Dishergarh
Power Supply Company Limited (with a generating capacity of 40MW). However, power
drawn from DPS system is excluded in the generation mix of WBSEB to avoid double
counting.
Also Power generated from CESC is not dispatched into the WBSEB transmission systems.
They have separate jurisdiction of operation and therefore do not contribute to the grid mix of
the WBSEB. Therefore CESC has not been considered for estimation of the baseline carbon
intensity of the grid mix of WBSEB.
Damodar Valley Corporation (DVC):
DVC, jointly owned by Government of India, Government of West Bengal and Government of
Bihar is a multipurpose river valley project set up under Act No. XIV of 1948, for the unified
development of Damodar valley area. The generation mix of DVC consists of 2535 MW-coal,
82.5MW – gas and 144 MW-hydro as on 2003-04. DVC supplies bulk power at 33 KV, 132
KV and 220 KV at 122 different locations to a number of industries and distributing
licensees25.
25 http://www.dvcindia.org/power/plants.htm

PROJECT DESIGN DOCUMENT FORM (CDM PDD) - Version 02 CDM – Executive Board page 72
This template shall not be altered. It shall be completed without modifying/adding headings or logo, format or font.
Choice of Grid
The present Generation mix statistics for DPSCL, DVC and WBSEB collective grid is given in
Table 4 below.
Table 4 – Generation Statistics for DPSCL, WBSEB and DVC for the year 2003-04.
Name of generating
Company
Installed Capacity (MW) Total Power Generated/
Available in 2003-04 (MU)
Dishergarh Power Supply Company 40 220.80
WBSEB* 3569.01 16069.04
DVC 2761.5 10076.72
Total 6370.51 26366.56
* WBSEB is the state owned Transmission and Distribution Company. Installed Capacity figures
include capacities of WBSEB and other state generating companies- WBPDCL and DPL. The power
available figure in WBSEB excludes power drawn from DVC.
The appropriate grid level for the project activity’s affect on the emissions caused at the
thermal power plants has been assessed based on the ‘Size of the project activity’. The project
activity would be saving on an average 9 MW of power and the reduced power is 0.143% of
DPSCL, WBSEB and DVC grid capacity. It is too small to have a significant impact on the
national grid(112,684MW) or regional grid (17249.58)26 in terms of marginally effecting
changes in the generation and dispatch system (operating margin) or delay future power
projects that may be commissioned during the crediting period (build margin) in the national or
eastern regional grid. Therefore, the principal effect of the project activity would be on the
lowest level of the grid i.e. the carbon intensity of the DPSCL, WBSEB and DVC grid (see
Figure 5 below).
We would therefore determine the carbon intensity of the grid mix which is governed by
DPSCL, WBSEB and DVC in Step B below to arrive at the baseline emission factor for
baseline emission calculations for the project activity’s crediting period.
26 http://www.cea.nic.in/ge_re/2004-05/chap-2.pdf
Figure 5: Flow Chart of Current Delivery system of DPSCL Grid Mix

PROJECT DESIGN DOCUMENT FORM (CDM PDD) - Version 02 CDM – Executive Board page 73
This template shall not be altered. It shall be completed without modifying/adding headings or logo, format or font.
B) Determination of the Carbon Intensity of the chosen Grid
Complete analysis of the system boundary’s electricity generation mix has been carried out for
calculating the emission factor of DPSCL, WBSEB and DVC collective grid as follows:
Combined Margin
The approved consolidated baseline methodology suggests that the project activity would have
an effect on both the operating margin (i.e. the present power generation sources of the grid,
weighted according to the actual participation in the state grid mix) and the build margin (i.e.
weighted average emissions of recent capacity additions) of the selected combined grid and the
net baseline emission factor would therefore incorporate an average of both these elements.
Step 1: Calculation of Operating Margin
As mentioned above the project activity would have some effect on the Operating Margin (OM)
of DPSCL, WBSEB and DVC combined Grid. The approved consolidated baseline
methodology-ACM0004 requires the project proponent to calculate the Operating Margin
(OM) emission factor following the guidelines in ACM0002 (Consolidated methodology for
grid-connected electricity generation from renewable sources).
DVC DPSCL
(OWN GENERATING STATIONS)
DPSCL GRID MIX
WBSEB
CONSUMER OR END USER
JAI BALAJI SPONGE LIMITED

PROJECT DESIGN DOCUMENT FORM (CDM PDD) - Version 02 CDM – Executive Board page 74
This template shall not be altered. It shall be completed without modifying/adding headings or logo, format or font.
As per Step 1 of ACM0002, the Operating Margin emission factor(s) (EFOM,y) is calculated
based on one of the four following methods:
(a) Simple OM, or
(b) Simple adjusted OM, or
(c) Dispatch Data Analysis OM, or
(d) Average OM.
As per the methodology ‘Dispatch Data Analysis’ (1c) should be the first methodological
choice. However, this method is not selected for OM emission factor calculations due to non-
availability of activity data.
‘Simple OM’ (1a) method is applicable to project activity connected to the project electricity
system (grid) where the low-cost/must run27 resources constitute less than 50% of the total grid
generation in
1) average of the five most recent years, or
2) based on long-term normal for hydroelectricity production.
The Simple adjusted OM (1b) and Average OM (1d) methods are applicable to project activity
connected to the project electricity system (grid) where the low-cost/must run resources
constitute more than 50% of the total grid generation.
To select the appropriate methodology for determining the Operating Margin emission factor
(EFOM,y) for the project activity, JBSL conducted a baseline study wherein the power generation
data for all power sources in the project electricity system (i.e. DPSCL,WBSEB and DVC
combined grid ) were collected from government/non-government organisations and authentic
sources. The power generation mix of combined comprises of coal based thermal power
generation, gas based thermal power generation and hydro power generation. The actual
generation data of combined grid was analysed for the years 1999-2000, 2000-2001, 2001-
2002, 2002-2003 and 2003-2004 to arrive at the contribution of the coal, gas and hydro based
power plants in the grid mix. (Refer to Table 5 given below). It was found that the average
share of the hydro-based power projects over the five most recent years was lower than 50% of
the total electricity generation in the grid.
27 The low operating cost and must run resources typically include hydro, geothermal, wind, low-cost biomass, nuclear and solar generation.

PROJECT DESIGN DOCUMENT FORM (CDM PDD) - Version 02 CDM – Executive Board page 75
This template shall not be altered. It shall be completed without modifying/adding headings or logo, format or font.
Table 5: Power Generation Mix of DPSCL,WBSEB and DVC combined grid for
five most recent years
Energy Source 1999-00* 2000-01 2001-02 2002-03 2003-04
Total Power Generation (MU)
21791.715 22681.031 23770.066 23496.835 26366.563
Total Hydro Power Generation (MU)
1284.155 1419.82375 1873.534 1830.722 2075.65
Total Thermal Power Generation(MU)
20507.36 21064.5293 21727.162 21527.043 24131.68
Other Grids(MU) N/A 196.678 169.37 139.07 159.233 Hydro % of Total grid generation
5.8929 6.25996124 7.88190491 7.7913557 7.8722813
Thermal % of Total grid generation
94.107 92.8728912 91.4055603 91.616777 91.523799
% Other Grids of Total generation
N/A 0.86714753 0.71253483 0.5918669 0.6039202
Hydro % of Total grid generation - Average of the five most recent years – 7.13 % Source: DPSCL, DVC, WBSEB and CEA information * Data for 1999-2000 excludes power from Jaldhaka and Teesta (WBSEB Hydro), DVC Purchase and DPSCL figures since data was not available (N/A) at the time of PDD submission. JBSL has therefore adopted the ‘Simple OM’ (1a) method, amongst the ‘Simple OM’ (1a),
‘Simple adjusted OM’ (1b) and ‘Average OM’ (1d) methods to calculate the Baseline Emission
Factor of the chosen grid.
The Simple OM emission factor (EFOM,simple,y) is calculated as the generation-weighted
average emissions per electricity unit (tCO2/MU) taking into consideration the present power
generation mix excluding low cost must run hydro-power projects of the selected grid, the
design efficiency of the thermal power plants in the grid mix and the IPCC emission factors.
The Simple OM emission factor can be calculated using either of the two following data
vintages for years(s) y:
• A 3-year average, based on the most recent statistics available at the time of PDD
submission, or
• The year in which project generation occurs, if EFOM,y is updated based on ex post
monitoring.
JBSL has calculated the OM emission factor as per the 3-year average of Simple OM
calculated based on the most recent statistics available at the time of PDD submission.

PROJECT DESIGN DOCUMENT FORM (CDM PDD) - Version 02 CDM – Executive Board page 76
This template shall not be altered. It shall be completed without modifying/adding headings or logo, format or font.
Table 6 gives the detail of power generation mix of DPSCL for 2001-02, 2002-03 and 2003-
2004.
Table 6– Power Generation Mix of DPSCL own generating stations for 2001-02, 2002-03 and 2003-04
Generation (MU) Source
2001-02 2002-03 2003-04 Coal (Chinakuri TPS and Dishergarh TPS)
224.87 216.63 220.8
Total 224.87 216.63 220.8
Source: http://www.dpscl.com/Supply_of_Powers.htm
Table 7 gives the detail of power generation mix of WBSEB grid for 2001-02, 2002-03 and
2003-04 under State jurisdiction (excluding power drawn from DPSCL). The identified plants
have been categorically differentiated on the basis of their fuel source used for generation.
Table 7 – Power Generation Mix of WBSEB grid from the Own Generating Stations, purchase from other State and Private Generating Stations (2001-02, 2002-03 and 2003-04) Sl. No.
Energy Source Own Generation/ Purchase in MU (2001-
2002)
Own Generation/P
urchase in MU (2002-
2003)
Own Generation/Purcha
se in MU (2003-2004)
I. West Bengal State Sector
1 Thermal (Coal Based)
Kola ghat
Bakereswar Bandel
WBPDCL
Santhandih
10334.67 12411.8 10264.81
2 DPL 350.08 344.38 499.11
A Subtotal – Thermal Coal Based 10684.75 12756.18 10763.92
Thermal (Gas Based)
1 Kasbha GTPS 0.629 0.163 0
Haldia GTPS 0 0.024 0
WBSEB
Siliguri GTPS 0 0 0 B. Subtotal-Thermal Gas Based 0.629 0.187 0
Hydro
1 Jaldhaka 137.273 124.09 160
Rammam 239.275 221.348 240
WBSEB
Teesta Canal Falls 169.37 163.979 93
C. Subtotal-Hydro Based 545.918 509.417 493
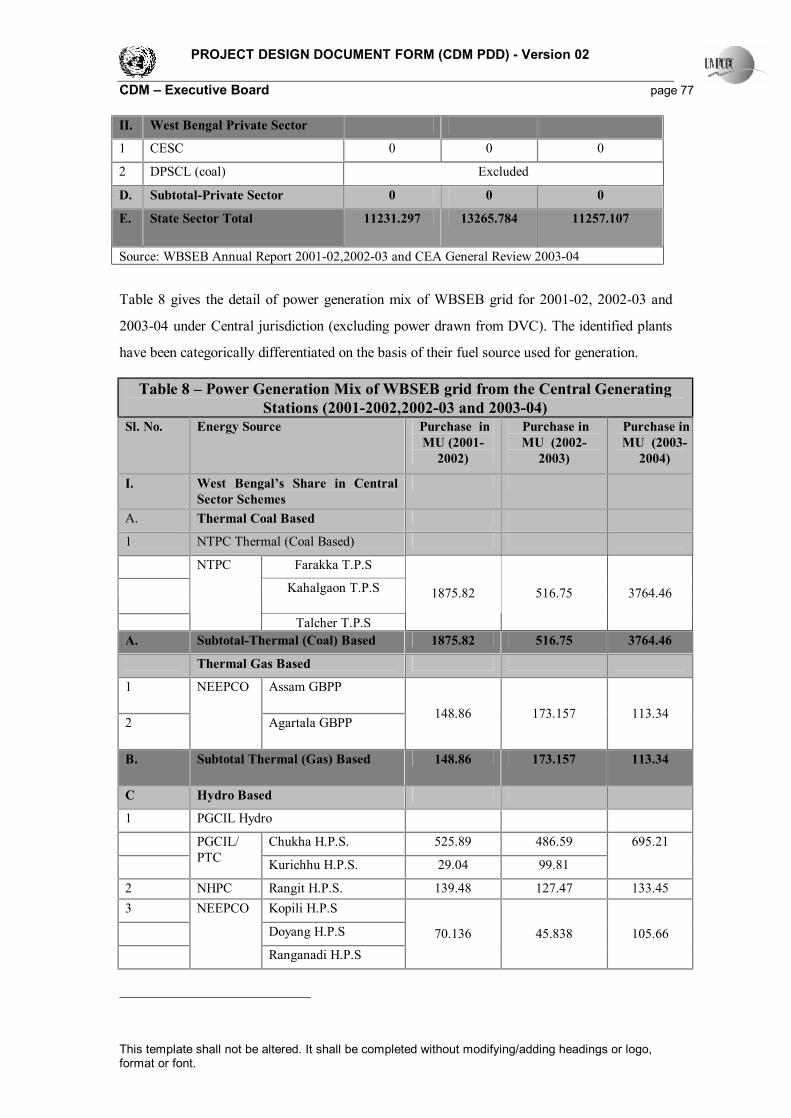
PROJECT DESIGN DOCUMENT FORM (CDM PDD) - Version 02 CDM – Executive Board page 77
This template shall not be altered. It shall be completed without modifying/adding headings or logo, format or font.
II. West Bengal Private Sector 1 CESC 0 0 0
2 DPSCL (coal) Excluded
D. Subtotal-Private Sector 0 0 0
E. State Sector Total 11231.297 13265.784 11257.107
Source: WBSEB Annual Report 2001-02,2002-03 and CEA General Review 2003-04
Table 8 gives the detail of power generation mix of WBSEB grid for 2001-02, 2002-03 and
2003-04 under Central jurisdiction (excluding power drawn from DVC). The identified plants
have been categorically differentiated on the basis of their fuel source used for generation.
Table 8 – Power Generation Mix of WBSEB grid from the Central Generating Stations (2001-2002,2002-03 and 2003-04)
Sl. No. Energy Source Purchase in MU (2001-
2002)
Purchase in MU (2002-
2003)
Purchase in MU (2003-
2004)
I. West Bengal’s Share in Central Sector Schemes
A. Thermal Coal Based
1 NTPC Thermal (Coal Based)
Farakka T.P.S
Kahalgaon T.P.S
NTPC
Talcher T.P.S
1875.82 516.75 3764.46
A. Subtotal-Thermal (Coal) Based 1875.82 516.75 3764.46
Thermal Gas Based
1 Assam GBPP
2
NEEPCO
Agartala GBPP 148.86 173.157 113.34
B. Subtotal Thermal (Gas) Based 148.86 173.157 113.34
C Hydro Based
1 PGCIL Hydro
Chukha H.P.S. 525.89 486.59
PGCIL/ PTC Kurichhu H.P.S. 29.04 99.81
695.21
2 NHPC Rangit H.P.S. 139.48 127.47 133.45 3 Kopili H.P.S
Doyang H.P.S
NEEPCO
Ranganadi H.P.S 70.136 45.838 105.66
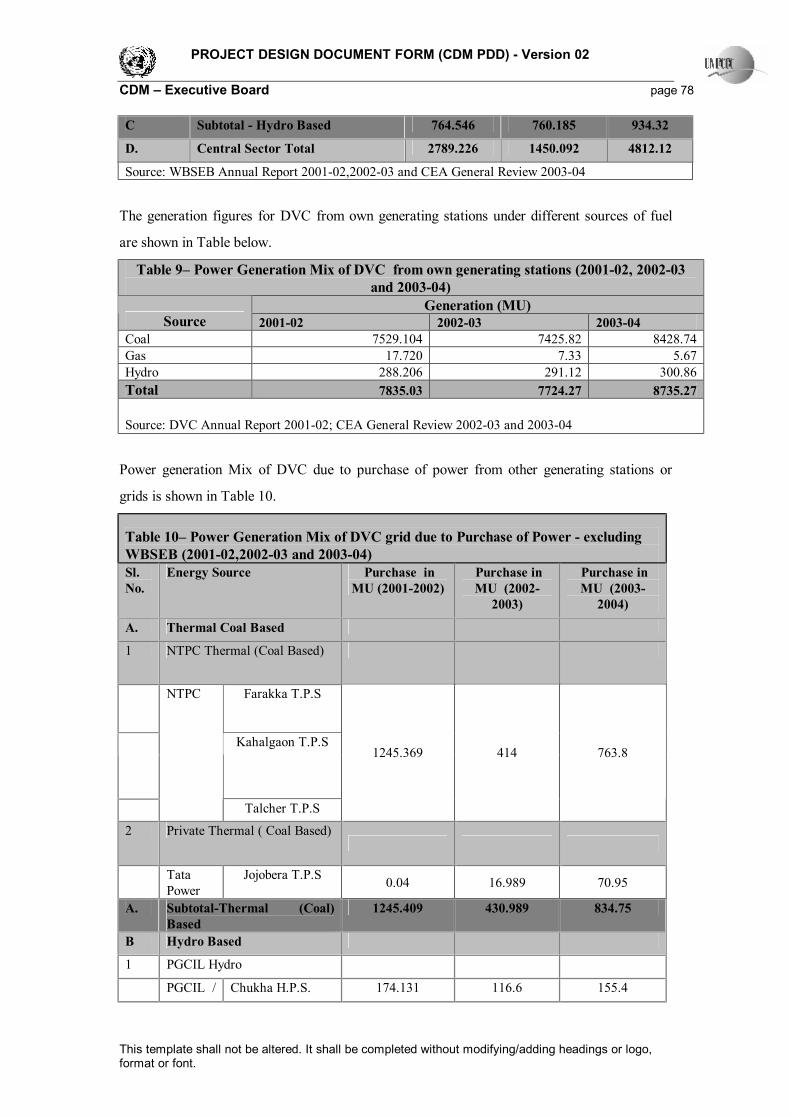
PROJECT DESIGN DOCUMENT FORM (CDM PDD) - Version 02 CDM – Executive Board page 78
This template shall not be altered. It shall be completed without modifying/adding headings or logo, format or font.
C Subtotal - Hydro Based 764.546 760.185 934.32
D. Central Sector Total 2789.226 1450.092 4812.12
Source: WBSEB Annual Report 2001-02,2002-03 and CEA General Review 2003-04
The generation figures for DVC from own generating stations under different sources of fuel
are shown in Table below.
Table 9– Power Generation Mix of DVC from own generating stations (2001-02, 2002-03 and 2003-04)
Generation (MU) Source 2001-02 2002-03 2003-04
Coal 7529.104 7425.82 8428.74 Gas 17.720 7.33 5.67 Hydro 288.206 291.12 300.86 Total 7835.03 7724.27 8735.27
Source: DVC Annual Report 2001-02; CEA General Review 2002-03 and 2003-04
Power generation Mix of DVC due to purchase of power from other generating stations or
grids is shown in Table 10.
Table 10– Power Generation Mix of DVC grid due to Purchase of Power - excluding WBSEB (2001-02,2002-03 and 2003-04) Sl. No.
Energy Source Purchase in MU (2001-2002)
Purchase in MU (2002-
2003)
Purchase in MU (2003-
2004)
A. Thermal Coal Based
1 NTPC Thermal (Coal Based)
Farakka T.P.S
Kahalgaon T.P.S
NTPC
Talcher T.P.S
1245.369 414 763.8
2 Private Thermal ( Coal Based)
Tata Power
Jojobera T.P.S 0.04 16.989 70.95
A. Subtotal-Thermal (Coal) Based
1245.409 430.989 834.75
B Hydro Based
1 PGCIL Hydro
PGCIL / Chukha H.P.S. 174.131 116.6 155.4

PROJECT DESIGN DOCUMENT FORM (CDM PDD) - Version 02 CDM – Executive Board page 79
This template shall not be altered. It shall be completed without modifying/adding headings or logo, format or font.
PTC Kurichhu H.P.S. 31.413 96.7 127 2 NHPC Rangit H.P.S. 69.32 56.7 65.07
B Subtotal-Hydro Based 274.864 270 347.47
C Other Grids
1 JSEB 113.817 136.563 146.965 2 GRIDCO 55.553 2.507 12.268 C Subtotal - Other Grids 169.37 139.07 159.233
D. DVC Purchase Total 1689.643 840.059 1341.453
Source: DVC Annual Report 2001-02, CEA General Review2002-03 and 2003-04

PROJECT DESIGN DOCUMENT FORM (CDM PDD) - Version 02 CDM – Executive Board page 80
This template shall not be altered. It shall be completed without modifying/adding headings or logo, format or font.
Calculation of Operating Margin Emission Factor
The following table gives a step by step approach for calculating the Simple Operating Margin emission factor for DPSCL, DVC and WBSEB for the most
recent 3 years at the time of PDD submission i.e.2001-2002, 2002-2003 & 2003-2004.
Table 11: Calculation of Simple Operating Margin
Parameter 2001-2002 2002-03 2003-04
Generation Mix
BASE-YEAR Sector MU % MU % MU % DPSCL DPSCL own generation (coal) 224.870 0.946 216.630 0.922 220.800 0.837 WBSEB Coal Based (Central) excluding DVC 1875.820 7.892 516.750 2.199 3764.460 14.277 Coal Based (State) 10684.750 44.950 12756.180 54.289 10763.920 40.824 Coal Based (Private) excluding DPSCL 0.000 0.000 0.000 0.000 0.000 0.000 Gas Based (Central) excluding DVC 148.860 0.626 173.157 0.737 113.340 0.430 Gas Based (State) 0.629 0.003 0.187 0.001 0.000 0.000 Hydro (Central) excluding DVC 764.546 3.216 760.185 3.235 934.320 3.544 Hydro (State) 545.918 2.297 509.417 2.168 493.000 1.870 DVC Coal based(Own Generation) 7529.104 31.675 7425.820 31.603 8428.740 31.968

PROJECT DESIGN DOCUMENT FORM (CDM PDD) - Version 02 CDM – Executive Board page 81
This template shall not be altered. It shall be completed without modifying/adding headings or logo, format or font.
Coal based(Purchase) 1245.409 5.239 430.989 1.834 834.750 3.166 Gas Based(Own Generation) 17.720 0.075 7.330 0.031 5.670 0.022 Hydro(Own Generation) 288.206 1.212 291.120 1.239 300.860 1.141 Hydro(Purchase) 274.864 1.156 270.000 1.149 347.470 1.318 Import from EREB(JSEB,GRIDCO excluding WBSEB) 169.370 0.713 139.070 0.592 159.233 0.604 Total generation 23770.066 100.000 23496.835 100.000 26366.563 100.000 Net generation excluding Hydro, Nuclear, CPP & RE plants 21727.162 91.406 21527.043 91.617 24131.680 91.524 % of generation by coal out of total gen.excl. Hydro, Nuclear,CPP & RE plants 21559.953 99.230 21346.369 99.161 24012.670 99.507 % of generation by gas out of total gen.exl. Hydro, Nuclear, CPP & RE plants 167.209 0.770 180.674 0.839 119.010 0.493 Estimation of Baseline Emission Factor ( t CO2/MU) Simple Operating Margin Fuel 1: Coal Avg. efficiency of power generation with coal as a fuel, % 36.081 36.317 36.228 Avg. calorific value of coal used, kcal/kg 3820.000 4171.000 3820.000 Estimated coal consumption, tons/yr 13452541.250 12119154.104 14922142.458 Emission factor for Coal (IPCC),tonne CO2/TJ 96.100 96.100 35.007 96.100 Oxidation factor of coal ( IPCC standard value) 0.980 0.980 0.980

PROJECT DESIGN DOCUMENT FORM (CDM PDD) - Version 02 CDM – Executive Board page 82
This template shall not be altered. It shall be completed without modifying/adding headings or logo, format or font.
COEF of coal (tonneCO2/ton of coal) 1.503 1.642 1.503 Fuel 2: Gas Avg. efficiency of power generation with gas as a fuel, % 45.000 45.000 45.000 Avg. calorific value of gas used, kcal/kg 10000.000 10000.000 10000.000 Estimated gas consumption, tons/yr 31955.498 34528.809 22744.133 Emission factor for Gas (as per standard IPCC value) 56.100 56.100 56.100 Oxidation factor of gas ( IPCC standard value) 0.995 0.995 0.995 COEF of gas(tonneCO2/ton of gas) 2.333 2.333 2.333 EF (OM Simple, excluding imports from other grids), tCO2/MU 934.295 927.908 931.869 EF (EREB) tCO2/MU 1190.000 1190.000 1190.000 EF (OM Simple), tCO2/MU 936.273 929.590 933.561 Average Simple OM, tCO2/MU 931.357 Simple OM, kg CO2 / kWh 0.9313

PROJECT DESIGN DOCUMENT FORM (CDM PDD) - Version 02 CDM – Executive Board page 83
This template shall not be altered. It shall be completed without modifying/adding headings or logo, format or font.
Step 2: Calculation of Build Margin
The project activity would have some effect on the Build Margin (BM) of the DPSCL,
WBSEB and DVC combined grid. The approved consolidated baseline methodology-
ACM0004 requires the project proponent to calculate the Build Margin (BM) emission factor
following the guidelines in ACM0002 (Consolidated methodology for grid-connected electricity
generation from renewable sources).
As per Step 2 of ACM0002, the Build Margin emission factor (EFBM,y) is calculated as the
generation-weighted average emission factor (tCO2/MU) of a sample of power plants. The
methodology suggests the project proponent to choose one of the two options available to
calculate the Build Margin emission factor EFBM,y
Option 1: Calculate the Build Margin emission factor EFBM,y ex ante based on the most recent
information available on plants already built for sample group m at the time of PDD
submission. The sample group m consists of either:
(a) The five power plants that have been built most recently, or
(b) The power plants capacity additions in the electricity system that comprise 20% of the
system generation (in MU) and that have been built most recently.
Project participants should use from these two options that sample group that comprises the
larger annual generation.
Option 2: For the first crediting period, the Build Margin emission factor EFBM,y must be updated
annually ex post for the year in which actual project generation and associated emission
reductions occur. For subsequent crediting periods, EFBM,y should be calculated ex-ante, as
described in Option 1 above. The sample group m consists of either
(a) the five power plants that have been built most recently, or
(b) the power plants capacity additions in the electricity system that comprise 20% of the
system generation (in MkWh) and that have been built most recently.
Project participants should use from these two options that sample group that comprises the
larger annual generation.
JBSL has adopted Option 1, which requires the project participant to calculate the Build
Margin emission factor EFBM,y ex ante based on the most recent information available on plants
already built for sample group m at the time of PDD submission. The sample group m should
consist of either (a) the five power plants that have been built most recently or (b) the power

PROJECT DESIGN DOCUMENT FORM (CDM PDD) - Version 02 CDM – Executive Board page 84
This template shall not be altered. It shall be completed without modifying/adding headings or logo, format or font.
plants capacity additions in the electricity system that comprise 20% of the system generation
(in MU) and that have been built most recently. Project participants are required to use from
these two options that sample group that comprises the larger annual generation. As per the
baseline information data the option (b) comprises the larger annual generation. Therefore for
JBSL project activity the sample group m consists of (b) the power plants capacity additions in
the electricity system for 2003-04 that comprise 20% of the system generation (in MU) and
that have been built most recently.
The following Table presents the selection of most recent plants used to determine the BM
emission factor for the most recent year 2003-04.
Table 12: Power Plants considered for BM calculation
Sl. No. Year Plant MW
Own Generation/Purchase for 2002-03 (MU)
1 2001 Bakreswar U-2 210 2 2001 Bakreswar U-3 210 3 2000 Bakreswar U-1 210
4311
4 2000 NEEPCO(hydro) 730 105.66 5 2000 NEEPCO(gas) 375 113.34
6 1999 PGCIL Chukha(hydro) 336 745.27
Total 5275.275152 20% of Gross Generation- MU 5273.31
Coal based 4311 Gas Based 113.34
Hydro based 850.9351515 % of generation by coal out of total 81.72085581 % of generation by gas out of total 2.148513523
% of generation by hydro out of total 16.13063067 Built Margin Emission Factor is calculated for most recent year (2003-04) as shown in Table
13.

PROJECT DESIGN DOCUMENT FORM (CDM PDD) - Version 02 CDM – Executive Board page 85
This template shall not be altered. It shall be completed without modifying/adding headings or logo, format or font.
Table 13: Built Margin Emission Factor Calculation
Built Margin Factor 2003-04 MU % Gross Generation for 2003-04 26366.563 100 Considering 20% of Gross Generation 5273.313 20 Sector Total Coal Based 4311.000 81.721 Total Gas Based 113.340 2.149 Total Hydro Based 850.935 16.131 Total generation 5275.275 100.000
Net generation excluding Hydro, Nuclear, other grid & RE plants 4424.340 83.869 Net generation by coal out of total gen.excl. Hydro, Nuclear,other grid & RE plants 4311.000 97.438 Net generation by gas out of total gen.exl. Hydro, Nuclear, other grid & RE plants 113.340 2.562 Built Margin Fuel 1 : Coal Avg. efficiency of power generation with coal as a fuel, % 36.228 Avg. calorific value of coal used in kcal/kg 3820.000 Estimated coal consumption, tons/yr 2678975.563 Emission factor for Coal (IPCC),tonne CO2/TJ 96.100 Oxidation factor of coal ( IPCC standard value) 0.980 COEF of coal (tonneCO2/ton of coal) 1.503 Fuel 2: Gas Avg. efficiency of power generation with gas as a fuel, % 45.000 Avg. calorific value of gas used, kcal/kg 10000.000 Estimated gas consumption, tons/yr 21660.533
Emission factor for Gas (IPCC value) tonne CO2/TJ 56.100 Oxidation factor of gas ( IPCC standard value) 0.995 COEF of gas(tonneCO2/ton of gas) 2.333 EF(Built Margin), tCO2/MU 921.764 EF(BM) kg CO2 / kWh 0.9217
Step 3: Combined Margin

PROJECT DESIGN DOCUMENT FORM (CDM PDD) - Version 02 CDM – Executive Board page 86
This template shall not be altered. It shall be completed without modifying/adding headings or logo, format or font.
Therefore the NET BASELINE EMISSION FACTOR as per COMBINED MARGIN =
(OM + BM)/2 = (0.9313+0.9217) / 2 = 0. 927 kg CO2 / kWh
C) Leakage
There is no considerable leakage potential identified from the project activity. There is no
requirement to procure additional fuel and therefore no transportation liabilities faced. The
project operates solely on waste heat recovery from the sponge kiln flue gases. Indirect GHG
emissions outside the project boundary only arise from transportation related to operation of
the project. The same is negligible compared to the emission reductions that accrue from the
project activity. Waste heat energy of flue gas available from Sponge Iron kiln of JBSL facility
situated beside the project unit is utilized. Other infrastructure requirements for the project are
also met from the JBSL facility.
D) Emission Reductions
Based on the Combined Margin Method detailed above, (see section E and Appendix III for
calculations) the project activity will reduce 522395 tonnes of CO2 in 10 year of credit period.
Since, the project activity is not a baseline scenario, without project activity there will be
emission as per the carbon intensity of the grid (0.927 kgCO2/kWh). Therefore the project
activity implementation reduces the energy requirement of the devices in the project boundary
and its associated emission reductions.

PROJECT DESIGN DOCUMENT FORM (CDM PDD) - Version 02 CDM – Executive Board page 87
This template shall not be altered. It shall be completed without modifying/adding headings or logo, format or font.
Annex 4 – MONITORING PLAN
Introduction: JBSL’s 12 MW Captive Power Plant consists of 7 nos. of 5 TPH Waste Heat
Recovery Boilers which utilize waste heat from the seven sponge iron kilns as energy source, a
30 TPH Fluidised Bed Combustion Boiler that uses coal rejects (coal char and coal fines) from
sponge iron process as fuel, a common steam header and 12MW turbo generator (TG) set as
shown in Fig.6 below. WHRB was installed by JBSL to improve the energy efficiency of the
manufacturing process and FBC was installed to avoid pollution problems associated with
disposal of coal rejects as required by pollution control norms. The entire CPP will be
commissioned in September 2005.
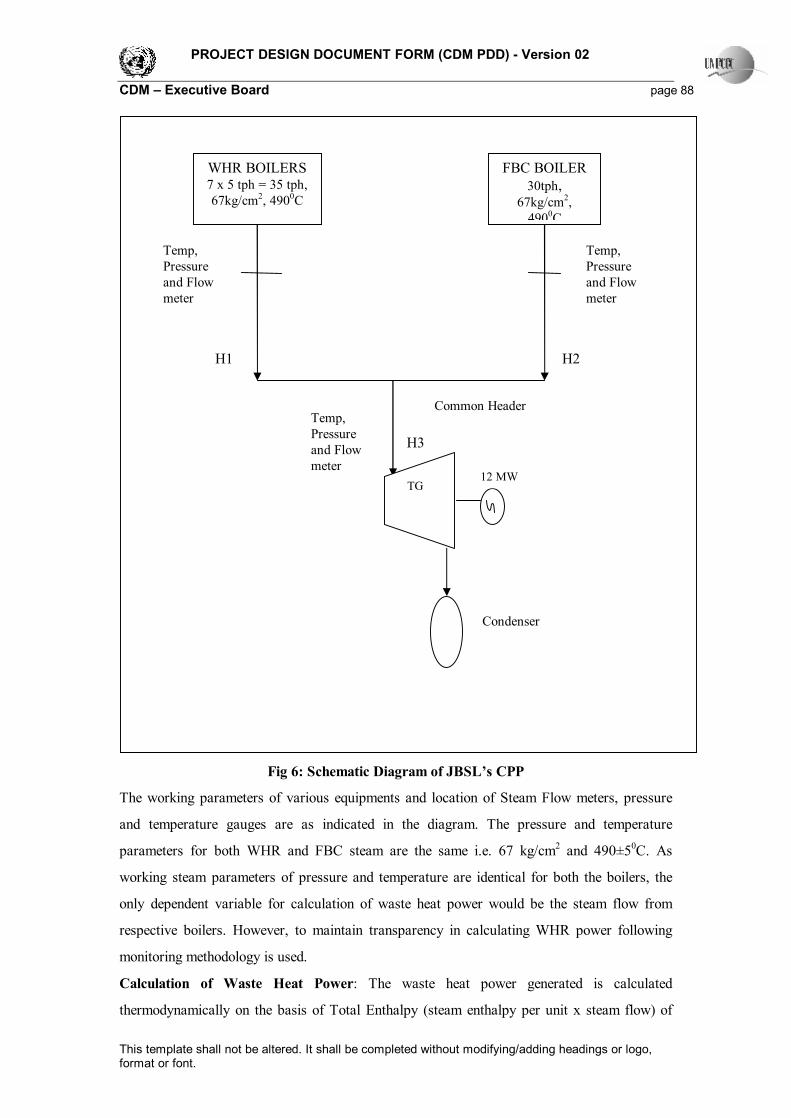
PROJECT DESIGN DOCUMENT FORM (CDM PDD) - Version 02 CDM – Executive Board page 88
This template shall not be altered. It shall be completed without modifying/adding headings or logo, format or font.
Fig 6: Schematic Diagram of JBSL’s CPP
The working parameters of various equipments and location of Steam Flow meters, pressure
and temperature gauges are as indicated in the diagram. The pressure and temperature
parameters for both WHR and FBC steam are the same i.e. 67 kg/cm2 and 490±50C. As
working steam parameters of pressure and temperature are identical for both the boilers, the
only dependent variable for calculation of waste heat power would be the steam flow from
respective boilers. However, to maintain transparency in calculating WHR power following
monitoring methodology is used.
Calculation of Waste Heat Power: The waste heat power generated is calculated
thermodynamically on the basis of Total Enthalpy (steam enthalpy per unit x steam flow) of
WHR BOILERS 7 x 5 tph = 35 tph, 67kg/cm2, 4900C
FBC BOILER 30tph,
67kg/cm2, 4900C
TG
Common Header
Temp, Pressure and Flow meter
Temp, Pressure and Flow meter
H1 H2
H3
Condenser
12 MW
Temp, Pressure and Flow meter
PROJECT DESIGN DOCUMENT FORM (CDM PDD) - Version 02 CDM – Executive Board page 89
This template shall not be altered. It shall be completed without modifying/adding headings or logo, format or font.
WHR steam as a percentage of Total Enthalpy of Steam fed to the common header from both
WHR and FBC.
The calculation is shown as follows:
A.) Total Enthalpy of Steam from WHRB in kCal (H1)
= (Enthalpy of steam at boiler outlet in kCal/kg) x (WHRB steam flow in tonnes per day)
= h1 x S1
The enthalpy of steam is calculated based on average temperature and pressure readings for the
day and WHR steam flow per day is measured by flow meter.
B) Similarly Total Enthalpy of Steam from FBC in kCal (H2)
= Enthalpy of steam at boiler outlet in kCal/kg x steam flow in tonnes per day
= h2 x S2
The enthalpy of steam is calculated based on average temperature and pressure readings for the
day and steam flow from the FBC steam flow meter.
C) If EGGEN CPP is the Total Power generated by the CPP per day (in MWh) then Power Generated by Waste heat Recovery Boiler (EGGEN ) would be calculated as EGGEN (MWh) = EG GEN CPP x (H1) -------------- …………1 (H1 + H2) Again, if Auxiliary Consumption for the CPP per day is EGAUX CPP (in MWh), then WHRB Auxiliary Consumption (EGAUX ) will calculated in the same ratio as EGAUX (MWh) = EG AUX CPP x (H1) -------------- ……….2 (H1 + H2) Therefore Net Generation from Waste heat Recovery ie. project activity (1 – 2) EGy (MWh) = (EGGEN - EGAUX) ………..3

PROJECT DESIGN DOCUMENT FORM (CDM PDD) - Version 02 CDM – Executive Board page 90
This template shall not be altered. It shall be completed without modifying/adding headings or logo, format or font.
An. D1 – Total Enthalpy from WHRB steam
ID No.
Data type
Data variable Data unit Measured (m), calculated (c) or estimated (e)
Recording frequency
Proportion of data to be monitored
How will the data be archived? (Electronic/ paper)
For how long is archived data to be kept?
Comments
1. T1 Quantitative
Avg. Temperature of WHR steam before Common header
0C Online Measurement
Continuously 100% Electronic/ paper Credit Period + 2 years
MONITORING LOCATION: The data will be monitored from meters at plant and DCS. Manager In-charge would be responsible for calibration of the meters
2. P1 Quantitative
Avg. Pressure of WHR steam before Common header
kg/ cm2 Online measurement
Continuously 100% Electronic/paper Credit period + 2 years
MONITORING LOCATION: The data will be monitored from meters at plant and DCS. Manager In-charge would be responsible for regular calibration
3. h1 Quantitative
Enthalpy kCal/kg Calculated Daily 100% Electronic/ paper Credit period + 2 years
Noted from standard Steam table/ Mollier Diagram as per the avg. temperature and pressure for the day.
4. S1 Quantitative
Flow of WHR Steam to Common header
tonnes per day
Calculated Daily 100% Electronic /paper Credit period + 2 years
MONITORING LOCATION: The data will be monitored from meters at plant and DCS. Manager In-charge would be responsible for regular calibration
5. H1 Quanti Enthalpy of kCal Calculated Daily 100% Electronic/paper Credit Calculated on a daily basis

PROJECT DESIGN DOCUMENT FORM (CDM PDD) - Version 02 CDM – Executive Board page 91
This template shall not be altered. It shall be completed without modifying/adding headings or logo, format or font.
An. D1 – Total Enthalpy from WHRB steam
ID No.
Data type
Data variable Data unit Measured (m), calculated (c) or estimated (e)
Recording frequency
Proportion of data to be monitored
How will the data be archived? (Electronic/ paper)
For how long is archived data to be kept?
Comments
tative WHR Steam (h1 x S1) Period + 2 years
An. D2 – Total Enthalpy of Steam from FBC Boiler ID No.
Data type
Data variable Data unit
Measured (m), calculated (c) or estimated (e)
Recording frequency
Proportion of data to be monitored
How will the data be archived? (Electronic/ paper)
For how long is archived data to be kept?
Comments
6. T2 Quantitative
Avg. Temperature of WHR steam before Common header
0C Online measurement
Continuously 100% Electronic/ paper
Credit Period + 2 years
MONITORING LOCATION: The data will be monitored from meters at plant and DCS. Manager In-charge would be responsible for calibration of the meters
7. P2 Quantitative
Avg. Pressure of WHR steam before Common header
kg/ cm2
Online measurement
Continuously 100% Electronic/paper Credit period + 2 years
MONITORING LOCATION: The data will be monitored from meters at plant and DCS. Manager In-charge would be responsible for regular calibration
8. h2 Quantitative
Enthalpy kCal/kg
Calculated Daily 100% Electronic/ paper
Credit period + 2 years
Noted from standard Steam table/ Mollier Diagram as per the avg. temperature and pressure for the

PROJECT DESIGN DOCUMENT FORM (CDM PDD) - Version 02 CDM – Executive Board page 92
This template shall not be altered. It shall be completed without modifying/adding headings or logo, format or font.
An. D2 – Total Enthalpy of Steam from FBC Boiler ID No.
Data type
Data variable Data unit
Measured (m), calculated (c) or estimated (e)
Recording frequency
Proportion of data to be monitored
How will the data be archived? (Electronic/ paper)
For how long is archived data to be kept?
Comments
day
9. S2 Quantitative
Flow of Steam to Common header
tonnes per day
Online measurement
Continuously 100% Electronic /paper
Credit period + 2 years
MONITORING LOCATION: The data will be monitored from meters at plant and DCS. Manager In-charge would be responsible for regular calibration
10. H2
Quantitative
Enthalpy of WHR Steam
kCal Calculated (h1 x S1)
Daily 100% Electronic/paper Credit Period + 2 years
Calculated on a daily basis
An.D3 – WHR Power generated
ID No. Data type
Data variable Data unit
Measured (m), calculated (c) or estimated (e)
Recording frequency
Proportion of data to be monitored
How will the data be archived? (Electronic/ paper)
For how long is archived data to be kept?
Comments
11. EGGEN
CPP
Quantitative
Total Electricity Generated by the CPP
MWh/ day
Online measurement
Continuously 100% Electronic/ paper Credit Period + 2 years
MONITORING LOCATION: The data will be monitored from meters at plant and DCS. Manager In-charge would be

PROJECT DESIGN DOCUMENT FORM (CDM PDD) - Version 02 CDM – Executive Board page 93
This template shall not be altered. It shall be completed without modifying/adding headings or logo, format or font.
An.D3 – WHR Power generated
ID No. Data type
Data variable Data unit
Measured (m), calculated (c) or estimated (e)
Recording frequency
Proportion of data to be monitored
How will the data be archived? (Electronic/ paper)
For how long is archived data to be kept?
Comments
responsible for calibration of the meters
12 EG AUX CPP
Quantitaive
Total Auxiliary Consumption of the CPP
MWh/day
Online measurement
Continuously 100% Electronic / paper Credit Period + 2 years
MONITORING LOCATION: The data will be monitored from meters at plant and DCS. Manager In-charge would be responsible for calibration of the meters
13. EGGEN
Quantitative
Waste Heat Recovery Based Power
MWh/day
Calculated Continuously 100% Electronic/paper Credit period + 2 years
Calculated based on the Enthalpy Ratio H1/ (H1+H2)
14. EGAUX
Quantitative
Auxiliary Electric Consumption
MWh/day
Calculated Continuously 100% Electronic/ paper Credit period + 2 years
Calculated based on the Enthalpy Ratio H1/ (H1+H2)
An. D4. Quality control (QC) and quality assurance (QA) procedures are being undertaken for data monitored
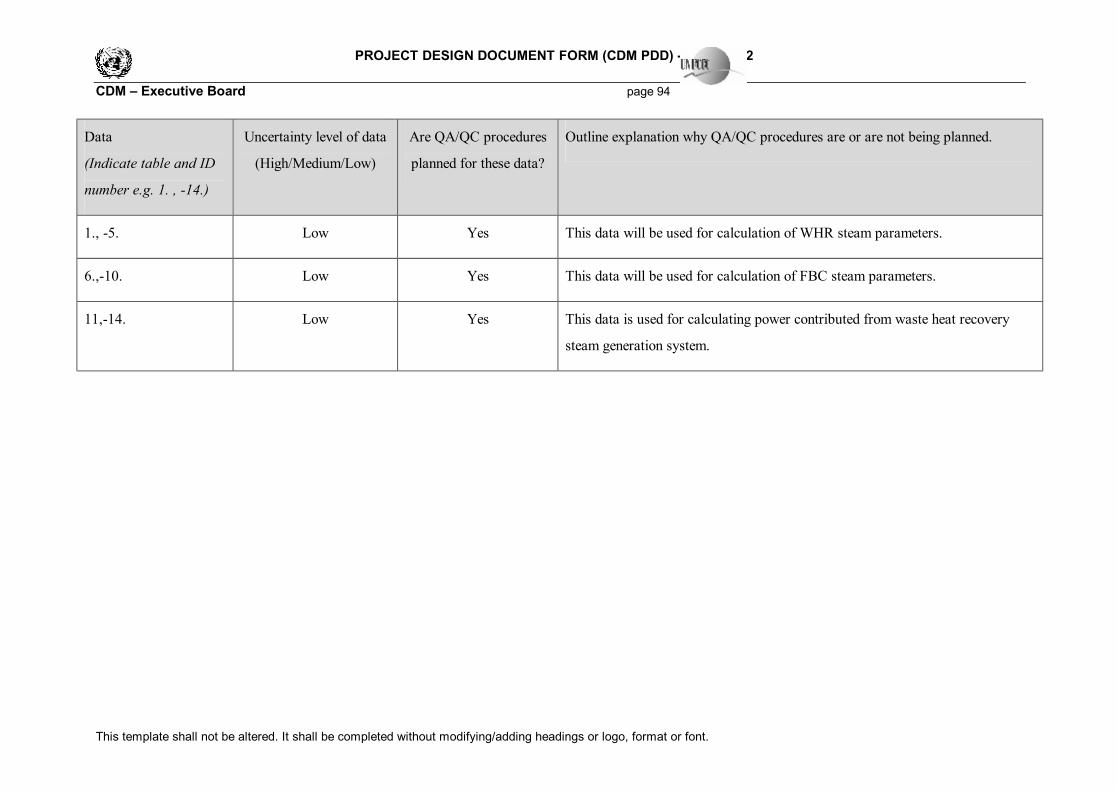
PROJECT DESIGN DOCUMENT FORM (CDM PDD) - Version 02 CDM – Executive Board page 94
This template shall not be altered. It shall be completed without modifying/adding headings or logo, format or font.
Data
(Indicate table and ID
number e.g. 1. , -14.)
Uncertainty level of data
(High/Medium/Low)
Are QA/QC procedures
planned for these data?
Outline explanation why QA/QC procedures are or are not being planned.
1., -5. Low Yes This data will be used for calculation of WHR steam parameters.
6.,-10. Low Yes This data will be used for calculation of FBC steam parameters.
11,-14. Low Yes This data is used for calculating power contributed from waste heat recovery
steam generation system.

PROJECT DESIGN DOCUMENT FORM (CDM PDD) - Version 02 CDM – Executive Board page 95
This template shall not be altered. It shall be completed without modifying/adding headings or logo, format or font.
Appendix I: Abbreviations
1 Lakh 1,00,000
ABC After Burning Chamber
BAU Business as Usual
BEF Baseline Emission Factor
BM Built Margin
CDM Clean Development Mechanism
CEA Central Electricity Authority
CER Certified Emission Reductions
CM Combined Margin
CO2 Carbon di-oxide
CPP Captive Power Plant
DCS Distributed Control System
DPL Durgapur Projects Limited
DPSCL Dishergarh Power Supply Company Limited
DRI Direct Reduction Iron
DVC Damodar Valley Corporation
EIA Environmental Impact Assessment
ESP Electro Static Precipitator
FAP Ferro Alloy Plant
FBC Fluidized Bed Combustion
GCT Gas cooling tower
GHG Greenhouse Gas
GOI Government of India
GWh Giga Watt hour
IPCC Intra-governmental Panel for Climate Change
IPP Independent Power Producers
IREDA Indian Renewable Energy Development Agency
JBSL Jai Balaji Sponge Limited
PROJECT DESIGN DOCUMENT FORM (CDM PDD) - Version 02 CDM – Executive Board page 96
This template shall not be altered. It shall be completed without modifying/adding headings or logo, format or font.
km Kilo metres
KP Kyoto Protocol
KV Kilo Voltage
KW Kilo Watt
KWh Kilo Watt hour
M&V Monitoring and Verification
MkWh Million Kilo Watt hour
MU Million Units (1 MU = 1 Million kWh)
MNES Ministry of Non-conventional Energy Sources
MoP Ministry of Power
MoU Memorandum of Understanding
MT Metric Ton
MU Million units
MW Mega Watt
NOC No Objection Certificate
OM Operating Margin
p.a per annum
PLF Plant Load Factor
PLR Prime Lending Rate
SEB State Electricity Board
SI Sponge Iron
SPM Suspended Particulate Matters
STG Steam Turbine Generator
TJ Trillion Joules
tph tonnes per hour
TPD Tonnes Per Day
UNFCCC United Nations Framework Convention on Climate Change
WBSEB West Bengal State Electricity Board
WBPCB West Bengal Pollution Control Board
WHR Waste Heat Recovery
WHRSGS Waste heat Recovery Steam Generating System
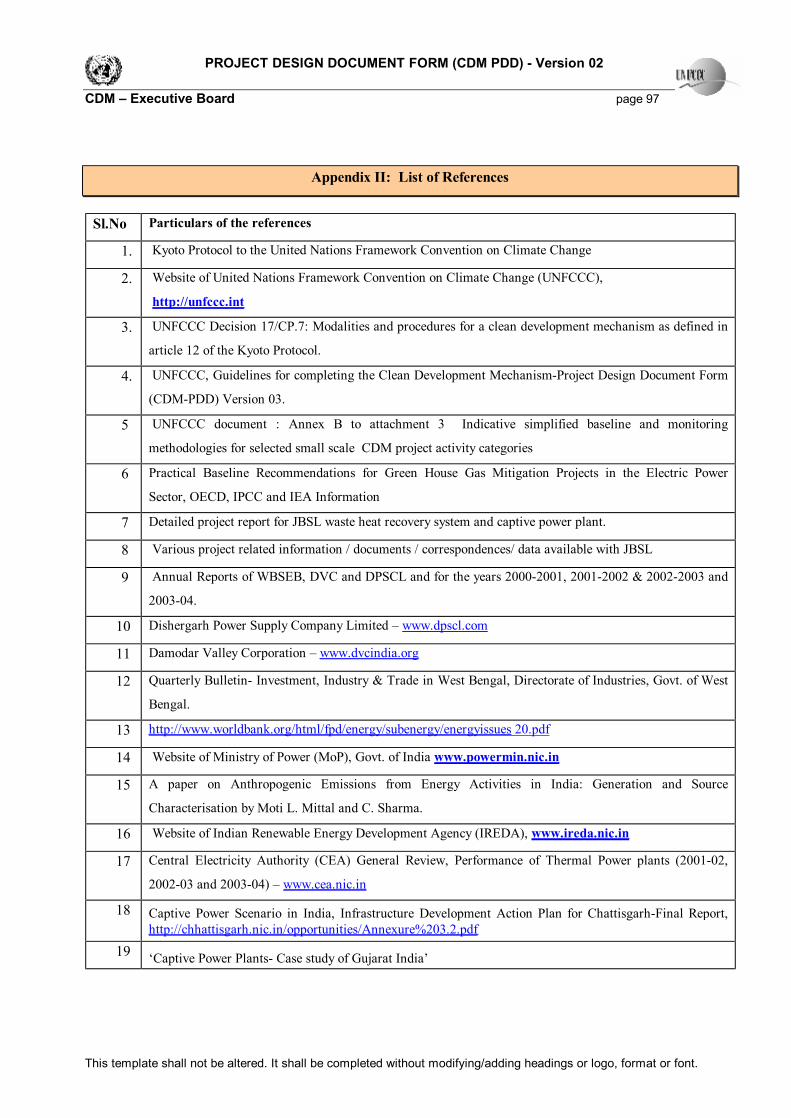
PROJECT DESIGN DOCUMENT FORM (CDM PDD) - Version 02 CDM – Executive Board page 97
This template shall not be altered. It shall be completed without modifying/adding headings or logo, format or font.
Appendix II: List of References
Sl.No Particulars of the references
1. Kyoto Protocol to the United Nations Framework Convention on Climate Change
2. Website of United Nations Framework Convention on Climate Change (UNFCCC),
http://unfccc.int
3. UNFCCC Decision 17/CP.7: Modalities and procedures for a clean development mechanism as defined in
article 12 of the Kyoto Protocol.
4. UNFCCC, Guidelines for completing the Clean Development Mechanism-Project Design Document Form
(CDM-PDD) Version 03.
5 UNFCCC document : Annex B to attachment 3 Indicative simplified baseline and monitoring
methodologies for selected small scale CDM project activity categories
6 Practical Baseline Recommendations for Green House Gas Mitigation Projects in the Electric Power
Sector, OECD, IPCC and IEA Information
7 Detailed project report for JBSL waste heat recovery system and captive power plant.
8 Various project related information / documents / correspondences/ data available with JBSL
9 Annual Reports of WBSEB, DVC and DPSCL and for the years 2000-2001, 2001-2002 & 2002-2003 and
2003-04.
10 Dishergarh Power Supply Company Limited – www.dpscl.com
11 Damodar Valley Corporation – www.dvcindia.org
12 Quarterly Bulletin- Investment, Industry & Trade in West Bengal, Directorate of Industries, Govt. of West
Bengal.
13 http://www.worldbank.org/html/fpd/energy/subenergy/energyissues 20.pdf
14 Website of Ministry of Power (MoP), Govt. of India www.powermin.nic.in
15 A paper on Anthropogenic Emissions from Energy Activities in India: Generation and Source
Characterisation by Moti L. Mittal and C. Sharma.
16 Website of Indian Renewable Energy Development Agency (IREDA), www.ireda.nic.in
17 Central Electricity Authority (CEA) General Review, Performance of Thermal Power plants (2001-02,
2002-03 and 2003-04) – www.cea.nic.in
18 Captive Power Scenario in India, Infrastructure Development Action Plan for Chattisgarh-Final Report, http://chhattisgarh.nic.in/opportunities/Annexure%203.2.pdf
19 ‘Captive Power Plants- Case study of Gujarat India’

PROJECT DESIGN DOCUMENT FORM (CDM PDD) - Version 02 CDM – Executive Board page 98
This template shall not be altered. It shall be completed without modifying/adding headings or logo, format or font.
Sl.No Particulars of the references
Source : http://iis-db.stanford.edu/pubs/20454/wp22_cpp_5mar04.pdf
20 Electricity Act 2003, Ministry of Power , Govt. of India http://www.powermin.nic.in/JSP_SERVLETS/internal.jsp
21 Monetary and Credit Policy - http://indiabudget.nic.in/es2003-04/chapt2004/chap33.pdf 22 ‘OERC Orders’, Section 6.40.10.2 – http://www.wescoorissa.com/cinfo/a39.htm#6.37 23 ‘Closed Cycle Dry Cooling Systems’
http://www.energymanagertraining.com/power_plants/condenser&cooling_sys.htm

PROJECT DESIGN DOCUMENT FORM (CDM PDD) - Version 02 CDM – Executive Board page 99
This template shall not be altered. It shall be completed without modifying/adding headings or logo, format or font.
Appendix III: Baseline and CER calculations
The calculation sheet is enclosed along with this document. - - - - -