
CLEAN DEVELOPMENT MECHANISM PROJECT · PDF file · 2015-10-09Many...
50
PROJECT DESIGN DOCUMENT FORM (CDM PDD) - Version 02 CDM – Executive Board page 1 This template shall not be altered. It shall be completed without modifying/adding headings or logo, format or font. CLEAN DEVELOPMENT MECHANISM PROJECT DESIGN DOCUMENT FORM (CDM-PDD) Version 02 - in effect as of: 1 July 2004) CONTENTS A. General description of project activity B. Application of a baseline methodology C. Duration of the project activity / Crediting period D. Application of a monitoring methodology and plan E. Estimation of GHG emissions by sources F. Environmental impacts G. Stakeholders’ comments Annexes Annex 1: Contact information on participants in the project activity Annex 2: Information regarding public funding Annex 3: Baseline information Annex 4: Monitoring plan Annex 5: Location map Annex 6: Glossary of terms used Annex 7: References
Transcript of CLEAN DEVELOPMENT MECHANISM PROJECT · PDF file · 2015-10-09Many...

PROJECT DESIGN DOCUMENT FORM (CDM PDD) - Version 02
CDM – Executive Board page 1
This template shall not be altered. It shall be completed without modifying/adding headings or logo, format or font.
CLEAN DEVELOPMENT MECHANISM
PROJECT DESIGN DOCUMENT FORM (CDM-PDD)
Version 02 - in effect as of: 1 July 2004)
CONTENTS
A. General description of project activity
B. Application of a baseline methodology
C. Duration of the project activity / Crediting period
D. Application of a monitoring methodology and plan
E. Estimation of GHG emissions by sources
F. Environmental impacts
G. Stakeholders’ comments
Annexes
Annex 1: Contact information on participants in the project activity
Annex 2: Information regarding public funding
Annex 3: Baseline information
Annex 4: Monitoring plan
Annex 5: Location map
Annex 6: Glossary of terms used
Annex 7: References

PROJECT DESIGN DOCUMENT FORM (CDM PDD) - Version 02
CDM – Executive Board page 2
This template shall not be altered. It shall be completed without modifying/adding headings or logo, format or font.
SECTION A. General description of project activity
A.1 Title of the project activity:
Title: 18 MW Kemphole Mini Hydel Scheme (KMHS), by International Power Corporation Limited,
India
Version: 1.0
Date: 20st October 2005
A.2. Description of the project activity:
Kemphole Mini Hydel Scheme (KMHS) is an 18 MW (3 X 6 MW) Run-of-the-River hydro power
project located at Kemphole stream in Hassan district of Karnataka in India. The main activity of the
project is generation of electricity using hydro potential available in Kemphole stream and exporting the
generated power to Karnataka Power Transmission Corporation Ltd. (KPTCL) as per power purchase
agreement between two of them.
KMHS project was completed in two stages; in first stage 2X6 MW units were installed (20th Oct 2003,
20th Nov 2003), in second stage 6 MW was installed (10
th Jan 2005). The project activity utilises the
water flow and fall available in the Kemphole stream. The project location is situated in dense forests of
the Kemphole reserve forest and there is no habitation in the near by area. The project does not involve
any displacement of local population and associated rehabilitations. The project uses horizontal Francis
turbines for power generation.
The project is based in Netravathi river basin. As this is the first project in the river basin (it is tough
terrain), there was no data available for gauging of the power potential. Many technological/structural
innovations have been introduced in the project activity like to utilise automatic thrash-rack-cleaning
system etc. Further the project activity is in a hilly area and is surrounded by dense forest with no power
evacuation facility, for a distance of 29 KMs, a transmission system (with 124 towers) had to be created
by the project proponent to evacuate power in the nearby substation.
The project generates electrical energy through sustainable means without causing any negative impact
on environment. Use of renewable sources for power generation contributes to mitigation of greenhouse
gases emissions. Apart from the power generation project activity shall also contribute to the following:
� Sustainable development through utilization of renewable hydro resources available in the
project region.
� Contribution to power requirements of Karnataka state grid.
� Conserving environment and its natural resources (like coal, petroleum oils etc.) through use of
renewable source of energy.
The project is in line with India’s national policy to promote clean power. Contribution of project
activity to sustainable development of the host party is as follows:-
Environmental Well Being
In India coal is the primary source of energy for power generation and production processes. The
demand for electrical energy has been steadily increasing. Expansion of the electrical supply to new areas
and rapid industrialization are the main reasons for the growth in demand for power. The project activity
PROJECT DESIGN DOCUMENT FORM (CDM PDD) - Version 02
CDM – Executive Board page 3
This template shall not be altered. It shall be completed without modifying/adding headings or logo, format or font.
contributes to the welfare of environment at large considering the carbon emissions that would have been
generated by a thermal plant of equal capacity. The project hence decreases the future needs for coal
based power generation by the grid and thereby reducing the CO2 emissions from the electricity sector.
Associated SPM, SOx, NOx emissions and emissions related to transportation and excavation of fossil
fuel are also avoided.
Since the project is a Run-of-the-River project and there are no major irrigation works across the stream
and has no pondage of water, there are no negative environmental impacts.
Social Well Being
Karnataka is witnessing major shortage of power. On an average there was a shortage of supply over
demand by 15 per cent during 1994-2000. The project activity is augmenting grid supply that is necessary
for the sustenance and development of the society.
Economic Well Being
The project activity provides a fillip to economic activity in the region. Direct & Indirect Employment
has been generated in the plant for the project implementation & management.
Technological Well Being
The project uses well established horizontal Francis turbines for power generation. The project activity is
the first hydel power project in the Netravathi river basin. The success of the project activity has
catalysed more hydel power projects to come in the basin/region.
Therefore the project is contributing to the sustainable development in following manner.
� Generating 51.08 million units of electricity on an annual basis
� Reducing electricity consumption required for auxiliary consumption to generate equivalent
amount of electricity in thermal power plants
� Conservation of natural resources like coal/gas/oil, this makes natural resources available for
other important applications
� Reducing GHG emissions
� Reducing pollution of other kind (like SOx, NOx) which happen in thermal power plants
A.3. Project participants:
Name of Party involved (*)
((host) indicates a host Party)
Private and/or public
entity(ies)
Project participants (*)
(as applicable)
Kindly indicate if the party
involved wishes to be
considered as project
participant (yes/no)
Government of India International Power Corporation
Limited (IPCL)
No
A.4. Technical description of the project activity:
A.4.1. Location of the project activity:
The KMHS is located in Heggadde village of Hassan district, Karnataka. The project site is located at
about 26 KM from Sakaleshpura along Hassan-Mangalore highway.
PROJECT DESIGN DOCUMENT FORM (CDM PDD) - Version 02
CDM – Executive Board page 4
This template shall not be altered. It shall be completed without modifying/adding headings or logo, format or font.
A.4.1.1. Host Party(ies):
India
A.4.1.2. Region/State/Province etc.:
Karnataka State
A.4.1.3. City/Town/Community etc:
Village: Heggadde
Taluk: Sakaleshpura
District: Hassan
State: Karnataka
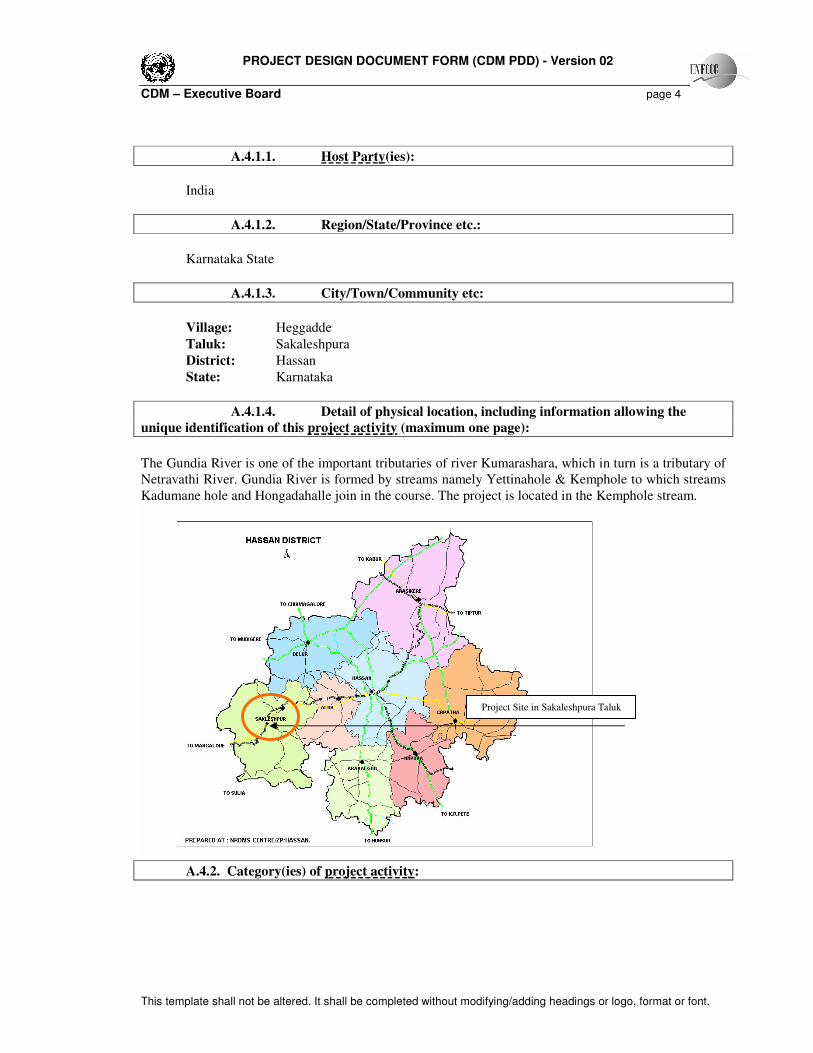
A.4.1.4. Detail of physical location, including information allowing the
unique identification of this project activity (maximum one page):
The Gundia River is one of the important tributaries of river Kumarashara, which in turn is a tributary of
Netravathi River. Gundia River is formed by streams namely Yettinahole & Kemphole to which streams
Kadumane hole and Hongadahalle join in the course. The project is located in the Kemphole stream.
A.4.2. Category(ies) of project activity:
Project Site in Sakaleshpura Taluk

PROJECT DESIGN DOCUMENT FORM (CDM PDD) - Version 02
CDM – Executive Board page 5
This template shall not be altered. It shall be completed without modifying/adding headings or logo, format or font.
The project is a run-of-the-river hydro power project and categorised in Scope Number 1; Sectoral Scope-
Energy industries (renewable/non-renewable sources) as per Sectoral scopes related approved
methodologies and DOEs (version 07 Oct 05|12:34)
A.4.3. Technology to be employed by the project activity:
The Project uses well established hydro power generation technology in electricity generation and
transmission. A gated weir across Kemphole, downstream of confluence of Kadumanehole with
Kemphole is constructed. The river bed level at the gated weir site is 319 m and the full reservoir level of
the weir is 340 m. Three horizontal Francis turbines of 6 MW capacity each coupled with horizontal 3
phase, 50 Hz, 500 rpm synchronous generators are used. The gross head available for the project is 68
meters.
A 66 KV double circuit transmission line (total 124 towers over 29 KMs) from the switchyard to the
11/66 KV sub-station at Sakaleshpura is used for power evacuation from the project activity.
A.4.4. Brief explanation of how the anthropogenic emissions of anthropogenic greenhouse
gas (GHGs) by sources are to be reduced by the proposed CDM project activity, including why the
emission reductions would not occur in the absence of the proposed project activity, taking into
account national and/or sectoral policies and circumstances:
The project activity is a run-of-river with no project emissions associated with its operations. In the
absence of the project activity same amount of power would have been generated using fossil fuels as in
the case of current grid generation mix. The project activity thus avoids power generation using fossil
fuels and reduces associated GHG emissions.
The project activity is not financially attractive and faces other barriers. Without CDM benefits it would
have not been possible to implement the project. However taking into account economic value of CERs
and the group’s policy to invest in renewable energy projects, project proponent have decided to use
hydro energy for power generation.
The estimated total reduction in tonnes of CO2 equivalent over the crediting period of 7 years = 256053
tCO2e for the first crediting period
A.4.4.1. Estimated amount of emission reductions over the chosen crediting
period:
Years Annual estimation of emission reductions in
tones of CO2 e
Oct 03- Mar 04 5535
April 04-Mar05 34123
April 05-Mar06 43279
April 06-Mar 07 43279
April 07-Mar08 43279
April 08-Mar09 43279
April 09-Mar10 43279
April 10-Mar11 43279
PROJECT DESIGN DOCUMENT FORM (CDM PDD) - Version 02
CDM – Executive Board page 6
This template shall not be altered. It shall be completed without modifying/adding headings or logo, format or font.
Total estimated reductions (tonnes of CO2 e) 256053
Total number of crediting years 7 years (first crediting period, twice renewable)
Annual average over the crediting period of
estimated reductions (tonnes of CO2e)
36579
A.4.5. Public funding of the project activity:
IPCL is promoted by Public Power International Inc, USA. Equity investment is done by USA based
promoters. However this financing is not part of an International Official Development Assistance
(ODA) effort. Details of investments are available to DOE for validation.
SECTION B. Application of a baseline methodology
B.1. Title and reference of the approved baseline methodology applied to the project activity:
Methodology: “Consolidated baseline methodology for grid-connected electricity generation from
renewable sources”
Reference: Approved consolidated baseline methodology ACM0002/Version 03, Sectoral Scope: 1, 30
September 2005
B.1.1. Justification of the choice of the methodology and why it is applicable to the project
activity:
The position of the CDM project activity vis-à-vis applicability conditions in the ACM 0002/Verson03 is
described in the following table.
Applicability Conditions in the
AM0002/Version03
Position of the project activity vis-à-vis
applicability conditions
Applies to electricity capacity additions from: Run-
of-river hydro power plants; hydro power projects
with existing reservoirs where the volume of the
reservoir is not increased.
The project activity is a grid connected run-of-the-
river hydro power project
This methodology is not applicable to project
activities that involve switching from fossil fuels to
renewable energy at the site of the project activity,
since in this case the baseline may be the
continued use of fossil fuels at the site;
It’s a renewable energy project with no fuel-switch
The geographic and system boundaries for the
relevant electricity grid can be clearly identified
and information on the characteristics of the grid is
available; and
The project activity supplies power to KPTCL –
Karnataka Power Transmission Corporation
Limited. KPTCL supplies power to various
consumers in Karnataka state.
KPTCL encompasses all power plants supplying
power to Karnataka state that can be dispatched
without significant transmission constraints.

PROJECT DESIGN DOCUMENT FORM (CDM PDD) - Version 02
CDM – Executive Board page 7
This template shall not be altered. It shall be completed without modifying/adding headings or logo, format or font.
KPTCL is therefore the geographical and system
boundary (project electricity system).
Adequate data is available to estimate grid emission
factor.
B.2. Description of how the methodology is applied in the context of the project activity:
The project activity uses the approach described in the ACM0002/Version03- “Consolidated baseline
methodology for grid-connected electricity generation from renewable sources”
Step 1: Establish additionality of the project activity
The Project Activity is demonstrated as additional using latest version of the “Tool for the demonstration
and assessment of additionality” agreed by the Executive Board. The details are provided in section B.3
of the PDD.
Step 2: Estimation of baseline emissions
Baseline scenario is that the Electricity delivered to the grid by the project would otherwise have been
generated by the operation of grid-connected power plants and by the addition of new generation sources,
as reflected in the combined margin (CM) calculations described below.
Step 2.1: Calculate the Operating Margin emission factor (EFOM,y)
ACM0002 suggested following methods to calculate the Operating Margin emission factor(s) (EFOM,y):
(a) Simple OM, or
(b) Simple adjusted OM, or
(c) Dispatch Data Analysis OM, or
(d) Average OM.
As per the approved methodology ACM0002 Dispatch data analysis should be the first methodological
choice. However due to lack of data availability ‘Dispatch Data Analysis’ is not selected for the project
activity.
The Simple adjusted OM and Average OM methods are applicable to project activities connected to the
project electricity system (grid) where the low-cost/must run resources constitute more than 50% of the
total grid generation.
‘Simple OM’ method is applicable to project activity connected to the project electricity system (grid)
where the low-cost/must run resources constitute less than 50% of the total grid generation in 1) average
of the five most recent years, or 2) based on long-term normal for hydroelectricity production.
The project activity supplies power to KPTCL; the low-cost/must run resources contribute to less than
50% of total power in the grid hence ‘Simple OM’ option has been chosen.
Table 1.1: Power generation Mix of Karnataka

PROJECT DESIGN DOCUMENT FORM (CDM PDD) - Version 02
CDM – Executive Board page 8
This template shall not be altered. It shall be completed without modifying/adding headings or logo, format or font.
Source 1999-00 2000-01 2001-02 2002-03 2003-04
Total Power Generation (MU) 26117.5 26520.5 28063.9 28754.0 30722.4
Total Thermal Power Generation (MU) 13116.2 14625.7 17131.2 19760.7 21368.8
Total Low Cost Power Generation1 (MU) 13001.2 11894.8 10932.7 8993.2 9353.5
Thermal % of Total power generation 50.22 55.15 61.04 68.72 69.55
Low Cost % of Total power generation 49.78 44.85 38.96 31.28 30.45
% of Low Cost generation out of Total generation - Average of the five most recent years –39.06%
Data Source for the years 1999-00, 2000-01, 2001-02, 2002-03 & 2003-04: KPTCL
The Simple OM emission factor (EFOM,simple,y) is calculated as the generation-weighted average emissions
per electricity unit (tCO2/MU) of all generating sources serving the project electricity system, not
including low-operating cost and must-run power plants.
The Simple OM emission factor can be calculated using either of the two following data vintages for
years(s) y:
� A 3-year average, based on the most recent statistics available at the time of PDD submission, or
� The year in which project generation occurs, if EFOM,y is updated based on ex post monitoring.
The project activity uses the OM emission factor as per the 3-year average of Simple OM calculated
based on the most recent statistics available at the time of PDD submission. The following Table 1.2
presents the key information and data used to determine the Simple OM emission factor.
Table 1.2: Data used for Simple OM emission factor2
2002-2003 2003-2004 2004-2005 Parameters
Coal Gas Diesel Coal Gas Diesel Coal Gas Diesel
Source
NCVi
(kcal/kg)
3877 10750 9760 4171 10750 9760 4171 10750 9760 Coal: General
Review 2000-2001
& 2002-2003 (CEA)
Gas: IPCC-Good
Practice Guidance
Diesel: General
Review 2002-03
(CEA)
EFCO2,i
(tonne
CO2/TJ)
96.1 73.3 74.1 96.1 73.3 74.1 96.1 73.3 74.1 IPCC 1996 Revised
Guidelines and the
IPCC Good Practice
Guidance
1 Low-cost/must run resources typically include hydro, geothermal, wind, low-cost biomass, nuclear and solar generation
2 COEFi,j y- is the CO2 emission coefficient of fuel i (tCO2 / mass or volume unit of the fuel), taking into account the Net
Calorific Value (energy content) per mass or volume unit of a fuel i (NCVi), the CO2 emission factor per unit of energy of the
fuel i(EFCO2,i), and the oxidation factor of the fuel i (OXIDi).

PROJECT DESIGN DOCUMENT FORM (CDM PDD) - Version 02
CDM – Executive Board page 9
This template shall not be altered. It shall be completed without modifying/adding headings or logo, format or font.
OXIDi 0.98 0.995 0.99 0.98 0.995 0.99 0.98 0.995 0.99 Page 1.29 in the
1996 Revised IPCC
Guidelines
COEFi,j
y(tonne of
CO2/ton of
fuel)
1.526 3.277 2.992 1.642 3.277 2.992 1.642 3.277 2.992 Calculated as per
Equation (2) of
ACM0002
2001-2002 2002-2003 2003-2004 Parameters3 Coal Gas Diesel Coal Gas Diesel Coal Gas Diesel
Source
ΣjGENj,y
(MU)
14281.8 943.57 1466.1 16962.31 1178.18 1103.73 17364.31 866.37 800.91 Refer to Tables 2-1,
2-2, 2-3, and 2-4:
Power Generation
Data of Annex 3-
Baseline Information
Station Heat
Rate
(Design
Values)
2434.38 1911 2062 2425.92 1911 2062 2425.92 1911 2062 Coal -Performance
Review of Thermal
Power Stations 2001-
02, 2002-03 & 2003-
04 -Section 13
Gas- Petition No.
22/99; IA
No.27/1999 AND
IA No.18/2000
Diesel –
http://mnes.nic.in/bas
elinepdfs/annexure2c
Ei,j (%) 35.327 45 41.707 35.45 45 41.707 35.45 45 41.707 Calculated using
Station Heat Rate
Values
NCVi
(kcal/kg)
3877 10750 9760 4171 10750 9760 4171 10750 9760 Coal – General
Review 2000-2001 &
2002-2003 (CEA)
Gas-IPCC-Good
Practice Guidance
Diesel-General
Review 2002-03
(CEA)
Fi ,j, y
(tons/yr)
896758
5
167739 309744 98655
50
209445 233185 10099359 154015 169209 Calculated
3 GENj,y is the electricity (MU) delivered to the grid by source j, j refers to the power sources delivering electricity to the grid,
not including low-operating cost and must-run power plants, and including imports from the grid. The j power sources would
also include electricity imports from the Central Generating Stations since the net imports from CGS exceed 20% of the total
generation in the project electricity system - KPTCL.
Fi ,j, y is the amount of fuel i (in a mass or volume unit, here tons/yr) consumed by relevant power sources j in
year(s) y

PROJECT DESIGN DOCUMENT FORM (CDM PDD) - Version 02
CDM – Executive Board page 10
This template shall not be altered. It shall be completed without modifying/adding headings or logo, format or font.
ΣΣΣΣjGENj,y
(MU)
16691.47 19244.22 19031.59 Refer to Tables 2-1,
2-2, 2-3, and 2-4:
Power Generation
Data of Annex 3-
Baseline Information
Parameters 2001-2002 2002-2003 2003-2004 Source
EF
(excluding
electricity
imports
from other
grids)
(ton
ofCO2/MU)
908.23
913.47
924.24
Calculated
There are some electricity transfers from the connected electricity systems (PTCIL, PGCIL, NTPC-
NVVN,WREB and SREB) to the KPTCL project electricity system.
Import %
from
National
Grid out of
total
generation
1.35 1.70 7.61 Refer to the CER
Calculation Sheet
Import %
from WREB
out of total
generation
0.20 0.06 0.00 Refer to the CER
Calculation Sheet
Import %
from SREB
out of total
generation
0.01 0.04 0.00 Refer to the CER
Calculation Sheet
As per ACM0002 the CO2 emission factor for the net electricity imports from the connected electricity
system may be determined as the average emission rate of the exporting grid, if and only if net imports
do not exceed 20% of total generation in the project electricity system.
The Emission Factor of the National Grid has been used as the emission factor for imports from
PTCIL (Power Trading Corporation of India Limited), PGCIL (Power Grid Corporation of India
Limited) and NTPC-NVVN. The Emission Factor of the Western Grid has been used as the emission
factor for imports from WREB (Western Regional Electricity Board). The Emission Factor of the
Southern Grid has been used as the emission factor for imports from SREB (Southern Regional
Electricity Board).
EF (National
Grid)
(ton ofCO2/MU)
872 865 845 http://mnes.nic.in/bas
elinepdfs/chapter2.pd
f
(EF of National Grid
has been considered)
EF (WREB)
(ton ofCO2/MU)
932 910 910 http://mnes.nic.in/bas
elinepdfs/chapter2.pd
f
(EF of Western Grid
has been considered)

PROJECT DESIGN DOCUMENT FORM (CDM PDD) - Version 02
CDM – Executive Board page 11
This template shall not be altered. It shall be completed without modifying/adding headings or logo, format or font.
EF (SREB)
(ton ofCO2/MU)
752 769 757 http://mnes.nic.in/bas
elinepdfs/chapter2.pd
f
(EF of Southern Grid
has been considered)
Net EFOM,simple,y is the calculated as the weighted average of the EF (excluding electricity imports from
other grids), EF (National Grid), EF (WREB) and EF (SREB).
Parameters 2001-2002 2002-2003 2003-2004 Source
Imports from
NTPC-NVVN,
PTCIL and
PGCIL (MU)
379.92 487.81 2337.28 Refer to Tables 2-4:
Power Generation
Data of Annex 3-
Baseline Information
Imports from
WREB (MU)
57.32 16.16 0.00 Refer to Tables 2-4:
Power Generation
Data of Annex 3-
Baseline Information
Imports from
SREB (MU)
2.52 12.56 0.00 Refer to Tables 2-4:
Power Generation
Data of Annex 3-
Baseline Information
Net
EFOM,simple,y
(ton of
CO2/MU)
907.49 912.18 915.58 Calculated
EFOM,simple
(ton of
CO2/MU)
911.75 Average of the most
recent three years'
Simple OM
Step 2.2: Calculate the Build Margin emission factor (EFBM,y)
As per the methodology the Build Margin emission factor (EFBM,y) is calculated as the generation-
weighted average emission factor (tCO2/MU) of a sample of power plants. The project activity calculates
the Build Margin emission factor EFBM,y ex ante based on the most recent information available on
plants already built for sample group m at the time of PDD submission.
The sample group m consists of either:
(a) The five power plants that have been built most recently, or
(b) The power plants’ capacity additions in the electricity system, that comprise 20% of the system
generation (in MU) and that have been built most recently.
As per the baseline information data the option (b) comprises the larger annual generation. Therefore for
the project activity the sample group m consists of power plants capacity additions in the electricity
system that comprise 20% of the system generation (in MU) and that have been built most recently.
Power plant capacity additions registered as CDM project activities are excluded from the sample group.
The following Table B-3 presents the key information and data used to determine the Simple BM
emission factor.
PROJECT DESIGN DOCUMENT FORM (CDM PDD) - Version 02
CDM – Executive Board page 12
This template shall not be altered. It shall be completed without modifying/adding headings or logo, format or font.
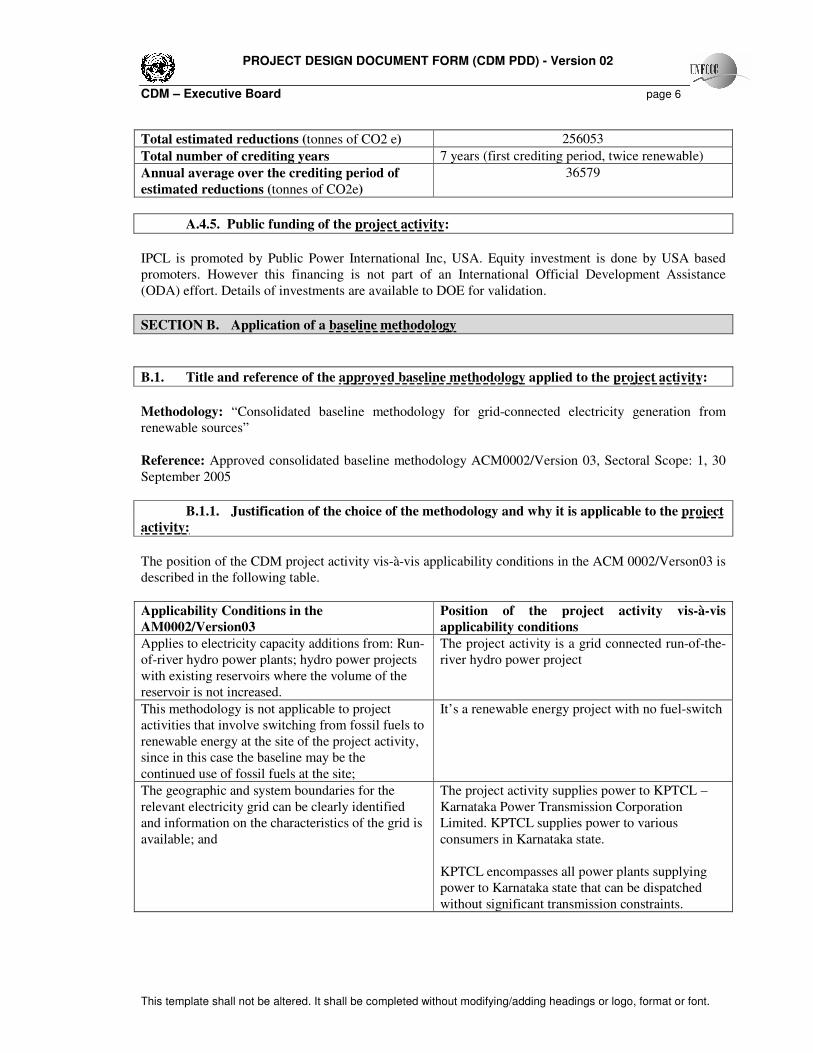
Table 1.3: Data used for Simple BM emission factor
Parameters 2003-2004
Source
Coal Gas Diesel
COEFi,m,- is the CO2 emission coefficient of fuel i (tCO2 / mass or volume unit of the fuel), taking into
account the Net Calorific Value (energy content) per mass or volume unit of a fuel i (NCVi), the CO2
emission factor per unit of energy of the fuel i (EFCO2,i), and the oxidation factor of the fuel i (OXIDi).
NCVi (kcal/kg) 4171 10750 9760 Coal & Diesel – General Review 2002-2003 (CEA)
Gas-IPCC-Good Practice Guidance
EFCO2,i (tonne
CO2/TJ)
96.1 73.3 74.1 IPCC 1996 Revised Guidelines and the IPCC Good Practice
Guidance
OXIDi 0.98 0.995 0.99 Page 1.29 in the 1996 Revised IPCC Guidelines
COEFi,m
(tonne of
CO2/ton of
fuel)
1.642 3.277 2.992 Calculated as per Equation (2) of ACM0002
Where NCVi ,EFCO2,i OXIDi, COEFi,m are analogous to the variables described for the simple OM
method above for plants in the sample group m.
Parameters 2003-2004 Source
Coal Gas Diesel
Fi ,m, y - Fuel Consumption – is the amount of fuel consumed by relevant power sources m (where m –
power sources which are a part of the sample group m delivering electricity to the grid). The Fuel
Consumption is calculated based on total generation of the relevant power sources (m) (ΣmGENm,,y) ,
efficiency of power generation with fuel source i (Ei,m)and the Net Calorific Value (energy content) per
mass or volume unit of a fuel i (NCVi).
ΣGENm,y (MU) 3363.82 866.37 0.00 Refer to Table 3-5 Power Generation Data for Calculation of Built
Margin of Annex 3-Baseline Information
Station Heat
Rate (Design
Values)
2425.92 1911 2062 Coal -Performance Review of Thermal Power Stations 2003-04
Section 13 Page no. 13.3
Gas- Petition No. 22/99; IA No.27/1999 AND IA No.18/2000
Diesel – http://mnes.nic.in/baselinepdfs/annexure2c.pdf
Avg. efficiency
of power
generation with
fuel source as
(in %)
35.45 45 41.707 Calculated using Station Heat Rate Values
NCVi (kcal/kg) 4171 10750 9760 Coal & Diesel – General Review 2002-2003 (CEA)
Gas-IPCC-Good Practice Guidance
Fi ,m, y (tons/yr) 1956451 154015 0 Calculated
Where GENm,y (MU) , NCVi ,Fi,m,y, are analogous to the variables described for the simple OM method
above for plants in the sample group m.
Parameters 2003-2004 Source

PROJECT DESIGN DOCUMENT FORM (CDM PDD) - Version 02
CDM – Executive Board page 13
This template shall not be altered. It shall be completed without modifying/adding headings or logo, format or font.
ΣΣΣΣGENm,y
(excluding imports
of electricity from
other grids) (MU)
5122.41 Refer to Table 3-5 Power Generation Data for Calculation of Built
Margin of Annex 3-Baseline Information.
Where GENm,y is analogous to the variables described for the simple OM method above for plants in
the sample group m.
EF (BM,excluding
imports of
electricity from
other grids) (ton of
CO2/MU)
725.50 Calculated
There are some electricity transfers from the connected electricity systems (PTCIL, PGCIL, NTPC-
NVVN,WREB and SREB) to the KPTCL project electricity system.
Import % from
National Grid out of
total generation of
the ‘m’ plants
considered for BM
Calculation
22.86 Refer to the CER Calculation Sheet
Import % from
WREB out of total
generation of the ‘m’
plants considered
for BM Calculation
0.00 Refer to the CER Calculation Sheet
Import % from
SREB out of total
generation of the ‘m’
plants considered
for BM Calculation
0.00 Refer to the CER Calculation Sheet
Parameters 2003-2004 Source
The imports from various grids have been dealt with in a manner similar to that of the OM calculation.
The Emission Factor of the National Grid has been used as the emission factor for imports from PTCIL
(Power Trading Corporation of India Limited), PGCIL (Power Grid Corporation of India Limited) and
NTPC-NVVN. The Emission Factor of the Western Grid has been used as the emission factor for imports
from WREB (Western Regional Electricity Board).The Emission Factor of the Southern Grid has been
used as the emission factor for imports from SREB (Southern Regional Electricity Board).
EF (National Grid)
(ton ofCO2/MU)
845 http://mnes.nic.in/baselinepdfs/chapter2.pdf
(EF of National Grid has been considered)
EF (WREB)
(ton ofCO2/MU)
910 http://mnes.nic.in/baselinepdfs/chapter2.pdf
(EF of Western Grid has been considered)
EF (SREB)
(ton ofCO2/MU)
757 http://mnes.nic.in/baselinepdfs/chapter2.pdf
(EF of Southern Grid has been considered)
EFBM,y is then calculated as the weighted average of the EF (excluding electricity imports from other
grids), EF (National Grid), EF (WREB) and EF (SREB).
Imports from 1517.62 Refer to Table 3-5 Power Generation Data for Calculation of Built

PROJECT DESIGN DOCUMENT FORM (CDM PDD) - Version 02
CDM – Executive Board page 14
This template shall not be altered. It shall be completed without modifying/adding headings or logo, format or font.
NTPC-NVVN,
PTCIL and PGCIL
(MU)
Margin of Annex 3-Baseline Information.
Imports from
WREB (MU)
0.00 Refer to Table 3-5 Power Generation Data for Calculation of Built
Margin of Annex 3-Baseline Information.
Imports from SREB
(MU)
0.00 Refer to Table 3-5 Power Generation Data for Calculation of Built
Margin of Annex 3-Baseline Information.
BM, EFBM,y (ton of
CO2/MU)
752.81 Calculated
Step 2.3: Calculate the Electricity Baseline Emission Factor (EFelectricity, y)
Electricity baseline emission factor is calculated as the weighted average of the Operating Margin
emission factor (EFOM,y) and the Build Margin emission factor (EFBM,y) where the weights wOM and
wBM, by default, are 50% (i.e., wOM = wBM = 0.5). The most recent 3-years average of the Simple OM
and the BM of the base year i.e. 2003-2004 are considered. This is presented in the table below.
Table 1.4: Baseline Emission Factor
Parameters Values
(ton of CO2/MU)
Simple OM, EFOM,simple 911.75
BM, EFBM,y (ton of CO2/MU) 752.81
Baseline Emission Factor, EFy 832.28
Step 3: Project Emissions:
As per the ACM0002 there are no project related emissions.
Step 4: Leakage:
As per ACM0002 the main emissions potentially giving rise to leakage in the context of electric sector
projects are emissions arising due to activities such as power plant construction, fuel handling (extraction,
processing, and transport), and land inundation (for hydroelectric projects – see applicability conditions
above). Project participants do not need to consider these emission sources as leakage in applying this
methodology.
Step 5: Emission Reductions:
The project activity reduces carbon dioxide through displacement of grid electricity generation with
fossil fuel based power plants by renewable-hydro electricity. The emission reduction ERy due to the
project activity during a given year y is calculated as the difference between baseline emissions (BEy),
project emissions (PEy) and emissions due to leakage (Ly), as per the formulae given below:
ERy = BEy – PEy - Ly
Where
BEy Baseline emissions Tons CO2
PEy Project emissions; PEy = 0 for the project activity.
Ly Emissions due to Leakage Ly = 0 for the project activity.

PROJECT DESIGN DOCUMENT FORM (CDM PDD) - Version 02
CDM – Executive Board page 15
This template shall not be altered. It shall be completed without modifying/adding headings or logo, format or font.
B.3. Description of how the anthropogenic emissions of GHG by sources are reduced below
those that would have occurred in the absence of the registered CDM project activity:
The KMHS is a Run-of-the-River hydel project which is exporting power to KPTCL. The power
generated by the project activity displaces the power that would have otherwise been generated by
Karnataka grid. Karnataka grid is operating with a mix of hydro, nuclear and fossil fuel power plants.
As per the decision 17/cp.7 Para 43, a project activity is considered additional if anthropogenic emissions
of green house gases by sources are reduced below those that would have occurred in the absence of the
registered project activity.
In the absence of project activity, there shall be extra burden on the state grid that shall be equal to the
amount of electricity being generated by the project. The state grid comprises of a mix of power plants
using hydro, nuclear and fossil fuels for power generation. The CO2 emission factor calculated for the
grid in accordance with the provisions of ACM0002/ Version 03 is 832.28 tonnes per MU.
In the following steps project activity is demonstrated as additional following the approach described in
“Tool for demonstration and assessment of additionality”.
Step 0: Preliminary screening based on the starting date of the project activity
The project activity was started on 20th October 2003 (Start of first stage). The Project Proponent has
decided to invest in the Project activity, after accounting for the benefits available under Clean
Development Mechanism. The project promoter plans to get the project activity get registered before 31st
December 2005.
IPCL was aware that the KMHS project is a GHG abatement project, which could avail financial benefits
under CDM if the project activity was found additional wherein the anthropogenic emissions of
greenhouse gases by sources are reduced below those that would have occurred in the absence of the
registered CDM project.
In year 2003, IPCL came to know about KPTCL’s proposition to reduce the power tariff rate below the
rate proposed in the PPA signed between IPCL and KPTCL from the sale of power from KMHS. IPCL
has done a revised project feasibility assessment based on the revised tariff which was discussed by IPCL
management in March 2003. Based on the new scenario project was found to be non attractive for
investment. A possibility of availing CDM benefits was explored and a detailed feasibility analysis
including CDM benefits was done. With the CDM revenue as one of the annual cash inflows, the KMHS
project activity was found attractive for investment. The project feasibility based on CDM revenue was
recommended to the Board of Directors for approval in the meeting held on 12th March 2003.
The same has been recorded in various official documents, where the proposed project was approved.
These documents will be made available to DOE for validating the project activity.
Step 1: Identification of alternatives to the project activity consistent with current laws and
regulations
In sub steps 1a & 1b realistic and credible alternatives available to project developers are identified
which provide output comparable to the project activity. Then it has been verified that whether these
alternatives are in compliance with all applicable legal & regulatory requirements or not.

PROJECT DESIGN DOCUMENT FORM (CDM PDD) - Version 02
CDM – Executive Board page 16
This template shall not be altered. It shall be completed without modifying/adding headings or logo, format or font.
Sub-step 1a- Define alternatives to the project activity:
Project activity is a Run-of-the-River hydel project. Two alternatives can be identified to the project
activity for this purpose. Either project developers can implement the project without considering it as a
CDM project or situation could continue as it is i.e. no implementation of KMHS.
Alternative 1: Implementation of KMHS not undertaken as a CDM project activity
KMHS is using renewable sources of energy for generation of electric power and exporting it to the
Karnataka grid. Thus project activity is displacing certain amount of electricity being generated by the
state grid using a mix of power plants and there are no CO2 emissions by the project activity.
The option is not feasible without CDM benefits as in that case Internal Rate of Return (IRR) of the
project is not attractive compared to the cost of funding (Weighted Average Cost of Capital-WACC).
Also there were many barriers for implementation of the project. This point is well proven with the help
of facts & figures in the subsequent section.
Alternative 2: Continuation of Current Situation
If current situation is continued i.e. KMHS is not implemented there would be no displacement of grid
power and an equivalent amount of Carbon-dioxide would continue to be emitted to the environment.
This alternative thus truly represents the scenario in the absence of project activity and has been
considered as baseline.
Sub Step 1b- Enforcement of applicable laws and regulations
Both of the alternatives identified here are in compliance with applicable laws and regulations.
Conclusion:
As per Step 1 of Tool for demonstration and assessment of additionality two alternatives have been
identified to the project activity, there alternatives are in compliance with all applicable laws and
regulatory requirements. Thus project activity can be termed as “Additional” up to this stage and can be
preceded towards Step 2.
Step 2: Investment Analysis At this step it has been determined whether the project activity is economically or financially viable and
attractive without the sale of Certified Emissions Reduction (CER).
Sub Step 2a- Determining appropriate analysis method
As the project activity generates financial benefits by selling electricity generated by the plant to the
KPTCL therefore Option I i.e. Simple Cost Analysis couldn’t be applied for investment analysis.
Out of the other two alternatives available i.e. Investment Comparison Analysis and Benchmark Analysis
project developer has chosen to apply Benchmark Analysis and has taken Weighted Average Cost of
Capital (WACC) as benchmark.
Sub Step 2b- Applying the selected analysis method
The project activity entails high capital cost investments. An investment analysis of the project activity
was done based on the Internal Rate of Return as the financial indicator. ‘Internal Rate of Return’ is one

PROJECT DESIGN DOCUMENT FORM (CDM PDD) - Version 02
CDM – Executive Board page 17
This template shall not be altered. It shall be completed without modifying/adding headings or logo, format or font.
of the known financial indicators used by banks, financial institutions and project developers for making
investment decisions. The project activity IRR was then compared with WACC4 for the project activity.
Sub Step 2c- Calculation and comparison of financial indicators
The financial internal rate of return of the KMHS project activity without CDM revenues is 12.4 %
which much lower than the 16% weighted average cost of capital for the project activity as required by
the investors.
The Project IRR without CDM revenues was calculated based on the following parameters:
1. Annual export to KPTCL – 51.80 mu
2. Power tariff rate of KPTCL – INR 3/- per unit with an annual escalation rate of 2%.
3. IRR is computed from the year 2005-2014.
4. Annual CER generated – 43,500
5. Exchange rate - 1EURO equivalent to INR 55/-
All financial data would be available to the DOE in the process of Validation.
Sub Step 2d- Sensitivity Analysis
A detailed sensitivity analysis of the project activity was done to test the project feasibility with varying
project parameters. The project activity feasibility is dependent on the following parameters.
� Annual export to KPTCL – 51.80 mu
� OM Expenses
� Tariff paid by KPTCL
Sensitivity Table showing impact of variations in key factors on IRR without CDM revenue:
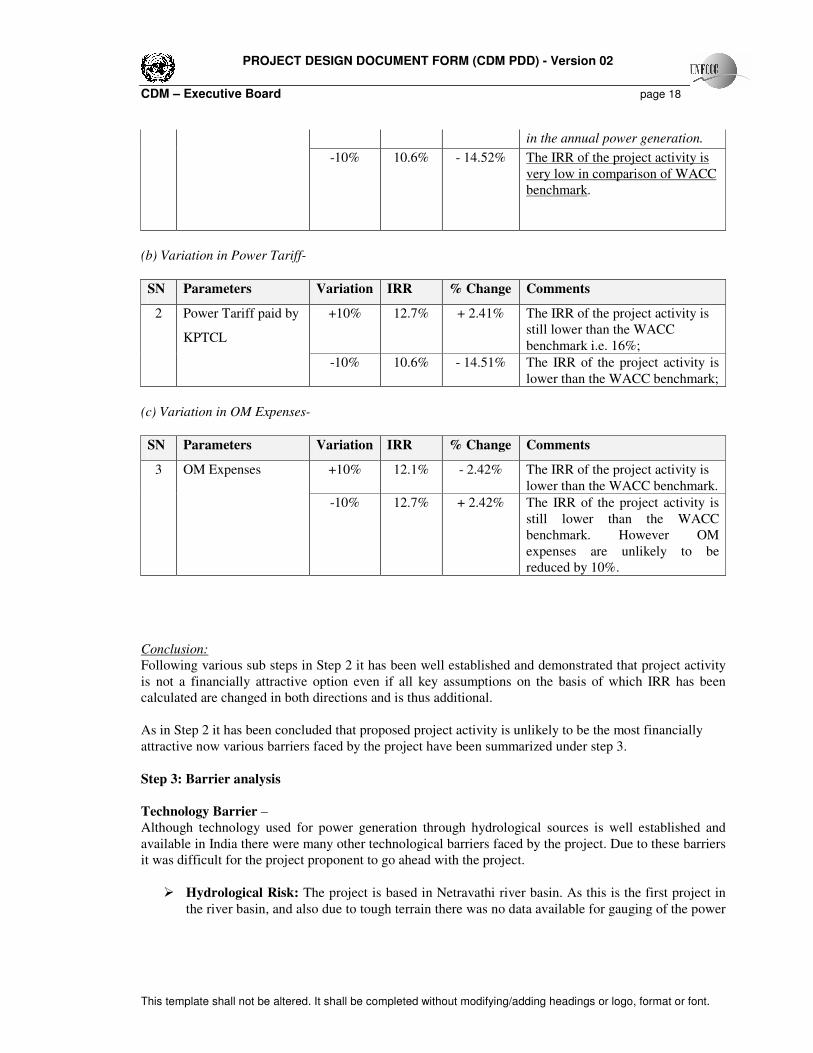
(a) Variation in Annual Export of power-
SN Parameters Variation IRR % Change Comments
1
Annual Export to
KPTCL
+10% 13.7% + 10.48% The IRR of the project activity is
still lower than the WACC
benchmark;
The probability of a 10% increase
in annual export to KPTCL is not
very high. It is unlikely that the
hydrological conditions that are
available in the project activity
are able to sustain a 10% increase
4 The WACC (16%) was calculated as a weighted average of the different cost of capital used in the
project activity.
PROJECT DESIGN DOCUMENT FORM (CDM PDD) - Version 02
CDM – Executive Board page 18
This template shall not be altered. It shall be completed without modifying/adding headings or logo, format or font.
in the annual power generation.
-10% 10.6% - 14.52% The IRR of the project activity is
very low in comparison of WACC
benchmark.
(b) Variation in Power Tariff-
SN Parameters Variation IRR % Change Comments
+10% 12.7% + 2.41% The IRR of the project activity is
still lower than the WACC
benchmark i.e. 16%;
2 Power Tariff paid by
KPTCL
-10% 10.6% - 14.51% The IRR of the project activity is
lower than the WACC benchmark;
(c) Variation in OM Expenses-
SN Parameters Variation IRR % Change Comments
+10% 12.1% - 2.42% The IRR of the project activity is
lower than the WACC benchmark.
3
OM Expenses
-10% 12.7% + 2.42% The IRR of the project activity is
still lower than the WACC
benchmark. However OM
expenses are unlikely to be
reduced by 10%.
Conclusion:
Following various sub steps in Step 2 it has been well established and demonstrated that project activity
is not a financially attractive option even if all key assumptions on the basis of which IRR has been
calculated are changed in both directions and is thus additional.
As in Step 2 it has been concluded that proposed project activity is unlikely to be the most financially
attractive now various barriers faced by the project have been summarized under step 3.
Step 3: Barrier analysis
Technology Barrier –
Although technology used for power generation through hydrological sources is well established and
available in India there were many other technological barriers faced by the project. Due to these barriers
it was difficult for the project proponent to go ahead with the project.
� Hydrological Risk: The project is based in Netravathi river basin. As this is the first project in
the river basin, and also due to tough terrain there was no data available for gauging of the power

PROJECT DESIGN DOCUMENT FORM (CDM PDD) - Version 02
CDM – Executive Board page 19
This template shall not be altered. It shall be completed without modifying/adding headings or logo, format or font.
potential. The project proponent had made substantial efforts to assess the site potential. Due to
lack of old authentic data, project faces performance risk.
� Inflow of waste with Water: Because the site is based in dense forest, thrash material (forest
waste like wood, etc) flow into water stream severely risking the power generation equipment.
The project proponents have installed an automatic thrash cleaning system to avoid damages to
equipments. Many technological/structural innovations have been introduced in the project
activity to utilise automatic cleaning system.
Infrastructural Barrier –
Plant is located in hilly forest area in Karnataka. Lack of infrastructural facilities was a major barrier for
project implementation.
� Evacuation facility: The project activity is in hilly area and is surrounded by dense forest with
no power evacuation facility in the nearby area up to 29 Km. Project proponents had to install
124 tower transmission systems to evacuate power to the nearby sub-station. Due to extremely
difficult terrain (Hilly and forest area) installation of towers was not an easy task and many
difficulties were faced in executing the project.
� Lack of support infrastructure: There is no support infrastructure like housing,
communication, approach roads etc available for the project implementation. Also there is
shortage of skilled manpower in the region. Lack of infrastructure was a major challenge for the
project promoters to implement the project activity.
To overcome technological challenges and lack of infrastructure facilities, additional investments and
efforts were required however there were no additional returns/ benefits available from these
investments/efforts.
Step 4: Common Practice Analysis
Sub Step 4a- Analyze other activities similar to the proposed project activity
The project activity is supplying power to KPTCL. An analysis of total power generated in the state of
Karnataka shows that power generated by hydel projects being implemented by Independent Private
Parties (IPP) have a very low percentage of share. In April’2003 only 0.7 per cent of total power
generation was done by plants in this category.
The project activity is also the first project in the Netravathi river basin. Lack of hydrological data for the
river stream has made it difficult for implementation of hydro power projects.
Sub Step 4b- Discuss any similar option that are occurring
No project activities are found being implemented previously those are similar to the project activity.
Thus it can be concluded that implementation of hydel projects by IPP is not at all a common practice in
the state of Karnataka in India.
Step 5: Impact of CDM Registration

PROJECT DESIGN DOCUMENT FORM (CDM PDD) - Version 02
CDM – Executive Board page 20
This template shall not be altered. It shall be completed without modifying/adding headings or logo, format or font.
As discussed in the step 2 & step 3 of the additionality analysis done above, the project is financially not
attractive to be undertaken and also faced significant barriers for implementation. IPCL could have
decided to invest in the project activity considering the impacts of CDM registration only. Primary
incentives and benefits which were considered for this purpose are following
� Possible CDM revenue which make the project financially attractive for investment.
� Reduction of GHG emissions in the overall system by use of renewable sources of energy for
power generation.
� Attracting private sector participation in power generation in the region. Successful
implementation of project activity will encourage other project developers to accept a low IRR
considering CDM benefits.
B.4. Description of how the definition of the project boundary related to the baseline
methodology selected is applied to the project activity:
The spatial extent of the project boundary includes the project site and all power plants connected
physically to the electricity system that the CDM project power plant is connected to.
The project site:
KMHS project activity boundary covers the entire power generation plant, including penstock, surge
tank, switch yard, turbines and other equipments used for power generation. The project activity supplies
power to KPTCL grid, hence transmission network used to evacuate power is also included in the project
boundary.
Electricity Grid:
KPTCL transmits power in the entire State of Karnataka. KPTCL purchases power from Karnataka
Power Corporation Limited, which generates and operates major power generating projects in the state
consisting of Hydel, Thermal and other sources.
KPTCL also purchases power from private owned power generation plants exporting power to KPTCL
and Central Government owned generating stations like National Thermal Power Corporation, Neyvelli
Lignite Corporation and the Atomic Power Stations at Kalpakkam and Kaiga. The approximate share of
power from these generating stations is around 16%.
Source Gas Included? Justification / Explanation
CO2 Yes Main emission source
CH4 No Excluded for simplification- this is
conservative
Ba
seli
ne
Grid Electricity
Generation N2O No Excluded for simplification- this is
conservative
PROJECT DESIGN DOCUMENT FORM (CDM PDD) - Version 02
CDM – Executive Board page 21
This template shall not be altered. It shall be completed without modifying/adding headings or logo, format or font.
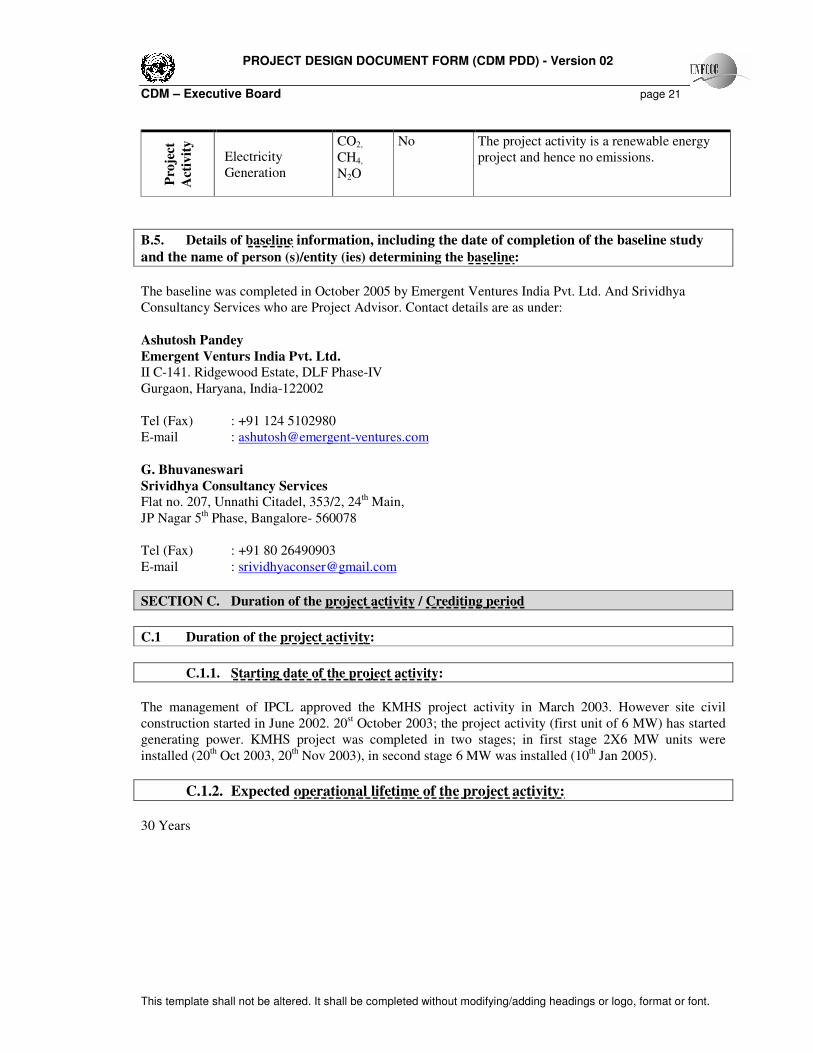
Pro
ject
Act
ivit
y
Electricity
Generation
CO2,
CH4,
N2O
No The project activity is a renewable energy
project and hence no emissions.
B.5. Details of baseline information, including the date of completion of the baseline study
and the name of person (s)/entity (ies) determining the baseline:
The baseline was completed in October 2005 by Emergent Ventures India Pvt. Ltd. And Srividhya
Consultancy Services who are Project Advisor. Contact details are as under:
Ashutosh Pandey
Emergent Venturs India Pvt. Ltd. II C-141. Ridgewood Estate, DLF Phase-IV
Gurgaon, Haryana, India-122002
Tel (Fax) : +91 124 5102980
E-mail : [email protected]
G. Bhuvaneswari
Srividhya Consultancy Services Flat no. 207, Unnathi Citadel, 353/2, 24th Main,
JP Nagar 5th Phase, Bangalore- 560078
Tel (Fax) : +91 80 26490903
E-mail : [email protected]
SECTION C. Duration of the project activity / Crediting period
C.1 Duration of the project activity:
C.1.1. Starting date of the project activity:
The management of IPCL approved the KMHS project activity in March 2003. However site civil
construction started in June 2002. 20st October 2003; the project activity (first unit of 6 MW) has started
generating power. KMHS project was completed in two stages; in first stage 2X6 MW units were
installed (20th Oct 2003, 20
th Nov 2003), in second stage 6 MW was installed (10
th Jan 2005).
C.1.2. Expected operational lifetime of the project activity:
30 Years
PROJECT DESIGN DOCUMENT FORM (CDM PDD) - Version 02
CDM – Executive Board page 22
This template shall not be altered. It shall be completed without modifying/adding headings or logo, format or font.
C.2 Choice of the crediting period and related information:
C.2.1. Renewable crediting period
C.2.1.1. Starting date of the first crediting period:
1st October 2003
C.2.1.2. Length of the first crediting period:
7 years
C.2.2. Fixed crediting period:
C.2.2.1. Starting date:
C.2.2.2. Length:
SECTION D. Application of a monitoring methodology and plan
D.1. Name and reference of approved monitoring methodology applied to the project activity:
Methodology: “Consolidated monitoring methodology for zero-emissions grid-connected electricity
generation from renewable sources”
Reference: Approved consolidated monitoring methodology ACM0002/Version 03, Sectoral Scope: 1,
14 September 2005
D.2. Justification of the choice of the methodology and why it is applicable to the project
activity:
The project activity meets the applicability criteria of the ‘Approved baseline methodology ACM0002’.
(Please refer to Section B.2. for details). The applicability criteria of the ‘Approved monitoring
methodology ACM0002’ are identical to those of the ‘Approved baseline methodology ACM0002’.
Therefore the project activity has used the ‘Approved monitoring methodology ACM0002’ in
conjugation with the ‘Approved baseline methodology ACM0002’ for the project activity.
The project activity would monitor following as per the guidance provided in the approved methodology
(ACM0002):
� Electricity generation from the proposed project activity;
� Data needed to recalculate the operating margin emission factor, consistent with “Consolidated
baseline methodology for grid-connected electricity generation from renewable sources”
(ACM0002);

PROJECT DESIGN DOCUMENT FORM (CDM PDD) - Version 02
CDM – Executive Board page 23
This template shall not be altered. It shall be completed without modifying/adding headings or logo, format or font.
� Data needed to recalculate the build margin emission factor, consistent with “Consolidated
baseline methodology for grid-connected electricity generation from renewable sources”
(ACM0002);

PROJECT DESIGN DOCUMENT FORM (CDM PDD) - Version 02
CDM – Executive Board page 24
This template shall not be altered. It shall be completed without modifying/adding headings or logo, format or font.
D.2. 1. Option 1: Monitoring of the emissions in the project scenario and the baseline scenario
Project emission associated to the project activity is zero. Therefore this section is Not Applicable
D.2.1.1. Data to be collected in order to monitor emissions from the project activity, and how this data will be archived:
ID number
(Please use
numbers to
ease cross-
referencing
to D.3)
Data
variable
Source of
data
Data
unit
Measured (m),
calculated (c)
or estimated (e)
Recording
frequency
Proportion
of data to
be
monitored
How will the
data be
archived?
(electronic/
paper)
Comment
D.2.1.2. Description of formulae used to estimate project emissions (for each gas, source, formulae/algorithm, emissions units of CO2
equ.)
>>
D.2.1.3. Relevant data necessary for determining the baseline of anthropogenic emissions by sources of GHGs within the project
boundary and how such data will be collected and archived :
ID number
(Please use
numbers to
ease cross-
referencing
to table
D.3)
Data variable Source of data Data unit Measured (m),
calculated (c),
estimated (e),
Recording
frequency
Proportion
of data to
be
monitored
How will the
data be
archived?
(electronic/
paper)
Comment

PROJECT DESIGN DOCUMENT FORM (CDM PDD) - Version 02
CDM – Executive Board page 25
This template shall not be altered. It shall be completed without modifying/adding headings or logo, format or font.
1 EGy : Electricity supplied to
the grid by the project activity
KMHS records/
KPTCL records
MWh Directly
Measured
Hourly
measurement
and monthly
recording
100% Electronic
2 EFy : CO2 emission factor of
the grid
KPTCL/CEA tCO2/
MWh
Calculated Yearly 100% Electronic Calculated as weighted
sum of OM and BM
emission factors as per
step 3 in ACM0002
3 EFOM,,y :CO2 operating
margin emission factor of the
grid
KPTCL/CEA t CO2/
MWh
Calculated Once at the
beginning
of a crediting
period
100% Electronic Calculated as Step 1 of
ACM0002
4 EFBM,y : CO2 build margin
emission factor of the grid
KPTCL/CEA t CO2/
MWh
Calculated Once at the
beginning
of a crediting
period
100% Electronic Calculated as Step 2 of
ACM0002
5 Fi,j,y :Amount of fossil fuel i,
consumed by each power
source/ plant in year y
KPTCL/CEA tons Calculated Once at the
beginning
of a crediting
period
100% Electronic Calculated based on the
Total power generation,
Average Net Calorific
Value of the Fuel used
and the Designed
Station Heat Rate data
of power plants of
KPTCL grid
6 COEFi,j,y : CO2 emission
factor of each fuel type i,
IPCC t CO2 /
ton of
fuel
Standard
/Calculated
Once at the
beginning
of a crediting
period
100% Electronic Calculated based on the
IPCC default value of
the Emission Factor,
Net Calorific Value and
Oxidation Factor of the
Fuel used by the power
plants of KPTCL grid
7 GENj,y : Electricity delivered
to the grid by power source j in
year y
KPTCL/CEA MWh/
annum
Measured Once at the
beginning
of a crediting
period
100% Electronic Obtained from authentic
and latest local
statistics.

PROJECT DESIGN DOCUMENT FORM (CDM PDD) - Version 02
CDM – Executive Board page 26
This template shall not be altered. It shall be completed without modifying/adding headings or logo, format or font.
D.2.1.4. Description of formulae used to estimate baseline emissions (for each gas, source, formulae/algorithm, emissions units of
CO2 equ.)
Calculation of baseline emission factor
The baseline emission factor (EF,y) is calculated as a combined margin (CM), consisting of the combination of operating margin (OM) and build margin (BM)
factors according to the following three steps. Calculations for this combined margin are based on data from an official source.
STEP 1: Calculate the Operating Margin emission factor
Simple OM approach is the most appropriate calculations method because in the KPTCL grid mix, the low-cost/must run resources constitutes less than 50%
of total grid generation. Simple OM factor is calculated as under.
EFOM,simple,y is calculated as the average of the most recent three years (2001-02, 2002-03 & 2003-04) .
yj
j
jiyji
ji
ysimpleOMGEN
COEFxF
EF,
,,,
,
,, ∑
∑=
Where
GENj,y : The electricity (MWh) delivered to the grid by source j
COEFi,j y : The CO2 emission coefficient of fuel i (t CO2 / mass or volume unit of the fuel), calculated as described below and
Fi ,j, y : The amount of fuel i (in a mass or volume unit) consumed by relevant power sources j in year(s) y , calculated as described below
J, Refers to the power sources delivering electricity to the grid, not including low-operating cost and must-run power plants, and including imports from the
grid
The CO2 emission coefficient COEFi is obtained as
iiCOii OXIDEFNCVCOEF ⊗⊗= ,2
Where
NCVi : The net calorific value (energy content) per mass or volume unit of a fuel i
PROJECT DESIGN DOCUMENT FORM (CDM PDD) - Version 02
CDM – Executive Board page 27
This template shall not be altered. It shall be completed without modifying/adding headings or logo, format or font.
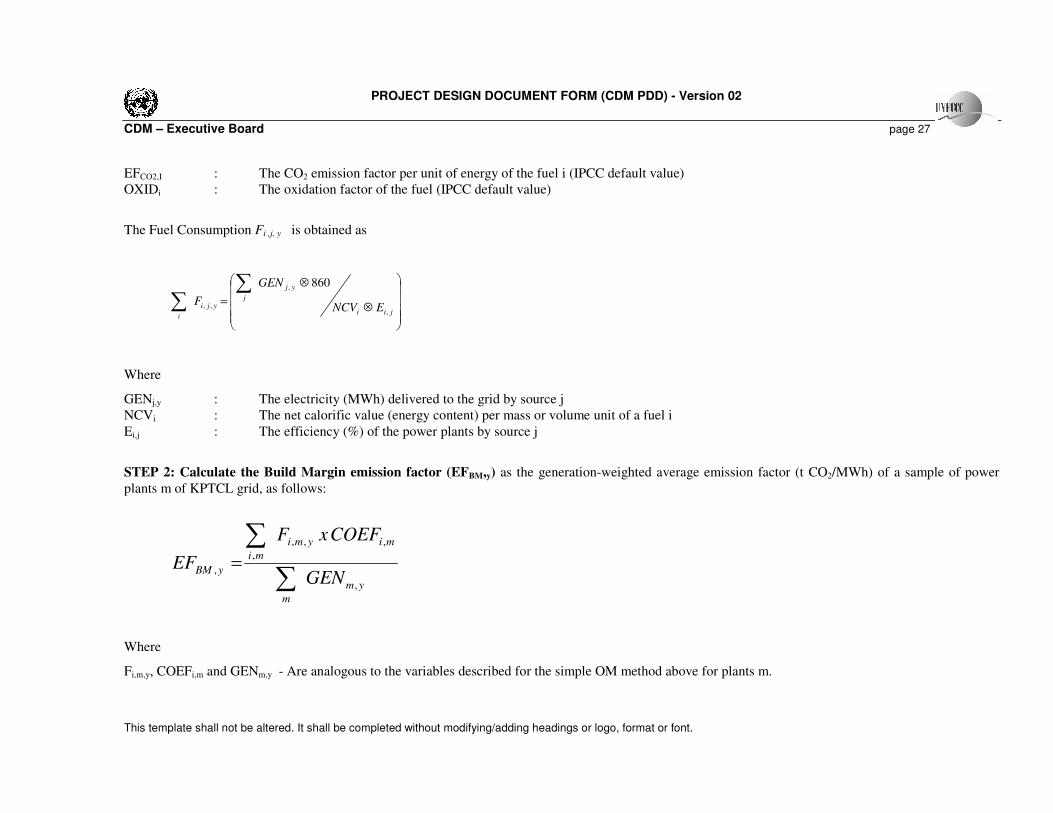
EFCO2,I : The CO2 emission factor per unit of energy of the fuel i (IPCC default value)
OXIDi : The oxidation factor of the fuel (IPCC default value)
The Fuel Consumption Fi ,j, y is obtained as
⊗
⊗
=
∑∑
jii
yj
jyji
iENCV
GEN
F,
,
,,
860
Where
GENj,y : The electricity (MWh) delivered to the grid by source j
NCVi : The net calorific value (energy content) per mass or volume unit of a fuel i
Ei,j : The efficiency (%) of the power plants by source j
STEP 2: Calculate the Build Margin emission factor (EFBM,y) as the generation-weighted average emission factor (t CO2/MWh) of a sample of power
plants m of KPTCL grid, as follows:
ym
m
miymi
mi
yBMGEN
COEFxF
EF,
,,,
,
, ∑
∑=
Where
Fi,m,y, COEFi,m and GENm,y - Are analogous to the variables described for the simple OM method above for plants m.
PROJECT DESIGN DOCUMENT FORM (CDM PDD) - Version 02
CDM – Executive Board page 28
This template shall not be altered. It shall be completed without modifying/adding headings or logo, format or font.
Considered calculations for the Build Margin emission factor EFBM,y which is updated annually ex post for the year in which actual project generation and
associated emissions reductions occur. The sample group m for the most recent year consists of the 20 (twenty) power plants that have been built most
recently, since it comprises of larger annual power generation. (Refer to Annex 3)
Further, power plant capacity additions registered as CDM project activities have been excluded from the sample group m of KPTCL grid mix.
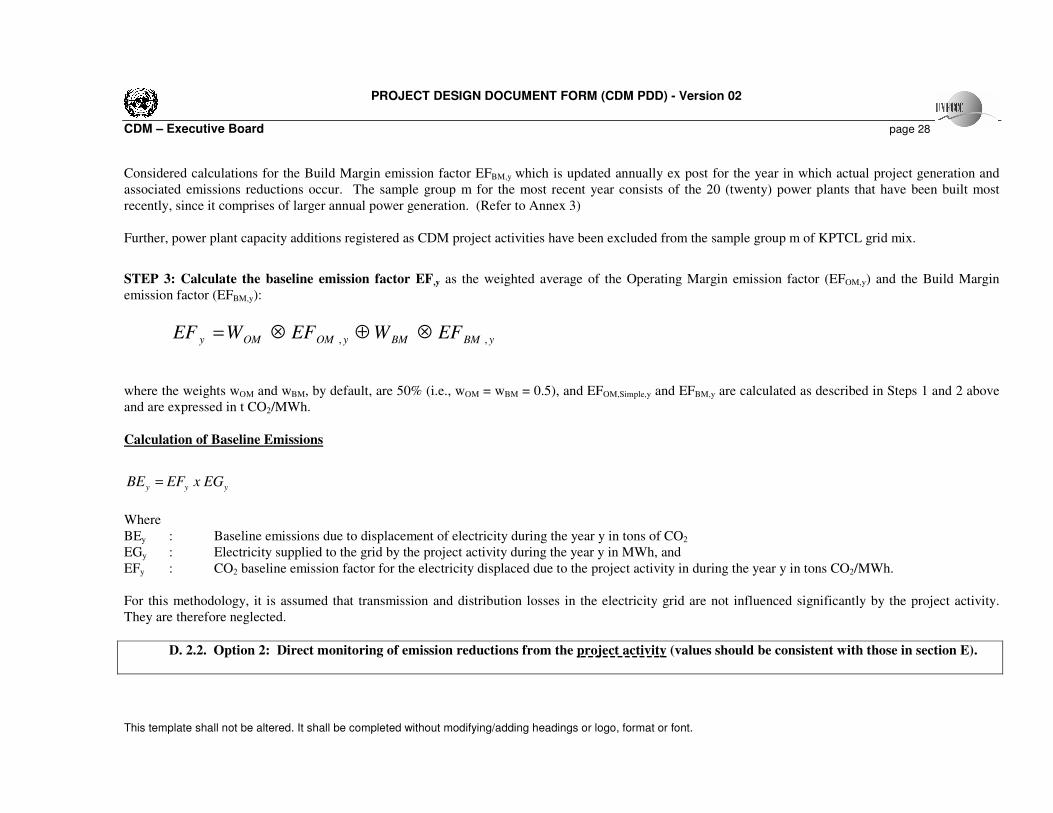
STEP 3: Calculate the baseline emission factor EF,y as the weighted average of the Operating Margin emission factor (EFOM,y) and the Build Margin
emission factor (EFBM,y):
yBMBMyOMOMy EFWEFWEF ,, ⊗⊕⊗=
where the weights wOM and wBM, by default, are 50% (i.e., wOM = wBM = 0.5), and EFOM,Simple,y and EFBM,y are calculated as described in Steps 1 and 2 above
and are expressed in t CO2/MWh.
Calculation of Baseline Emissions
yyy EGxEFBE =
Where
BEy : Baseline emissions due to displacement of electricity during the year y in tons of CO2
EGy : Electricity supplied to the grid by the project activity during the year y in MWh, and
EFy : CO2 baseline emission factor for the electricity displaced due to the project activity in during the year y in tons CO2/MWh.
For this methodology, it is assumed that transmission and distribution losses in the electricity grid are not influenced significantly by the project activity.
They are therefore neglected.
D. 2.2. Option 2: Direct monitoring of emission reductions from the project activity (values should be consistent with those in section E).

PROJECT DESIGN DOCUMENT FORM (CDM PDD) - Version 02
CDM – Executive Board page 29
This template shall not be altered. It shall be completed without modifying/adding headings or logo, format or font.
D.2.2.1. Data to be collected in order to monitor emissions from the project activity, and how this data will be archived:
ID number
(Please use
numbers to
ease cross-
referencing
to table
D.3)
Data
variable
Source of
data
Data
unit
Measured (m),
calculated (c),
estimated (e),
Recording
frequency
Proportion
of data to
be
monitored
How will the data
be archived?
(electronic/
paper)
Comment
D.2.2.2. Description of formulae used to calculate project emissions (for each gas, source, formulae/algorithm, emissions units of
CO2 equ.):
>>
D.2.3. Treatment of leakage in the monitoring plan
D.2.3.1. If applicable, please describe the data and information that will be collected in order to monitor leakage effects of the
project activity
ID number
(Please use
numbers to
ease cross-
referencing
to table
D.3)
Data
variable
Source of
data Data
unit
Measured (m),
calculated (c)
or estimated (e)
Recording
frequency
Proportion
of data to
be
monitored
How will the data
be archived?
(electronic/
paper)
Comment
D.2.3.2. Description of formulae used to estimate leakage (for each gas, source, formulae/algorithm, emissions units of CO2 equ.)
PROJECT DESIGN DOCUMENT FORM (CDM PDD) - Version 02
CDM – Executive Board page 30
This template shall not be altered. It shall be completed without modifying/adding headings or logo, format or font.
There are no emission sources as leakage in the project activity. The main emissions potentially giving rise to leakage in the context of electric sector projects
are emissions arising due to activities such as power plant construction. However according to ACM0002 Project participants do not need to consider these
emission sources as leakage in applying this methodology.
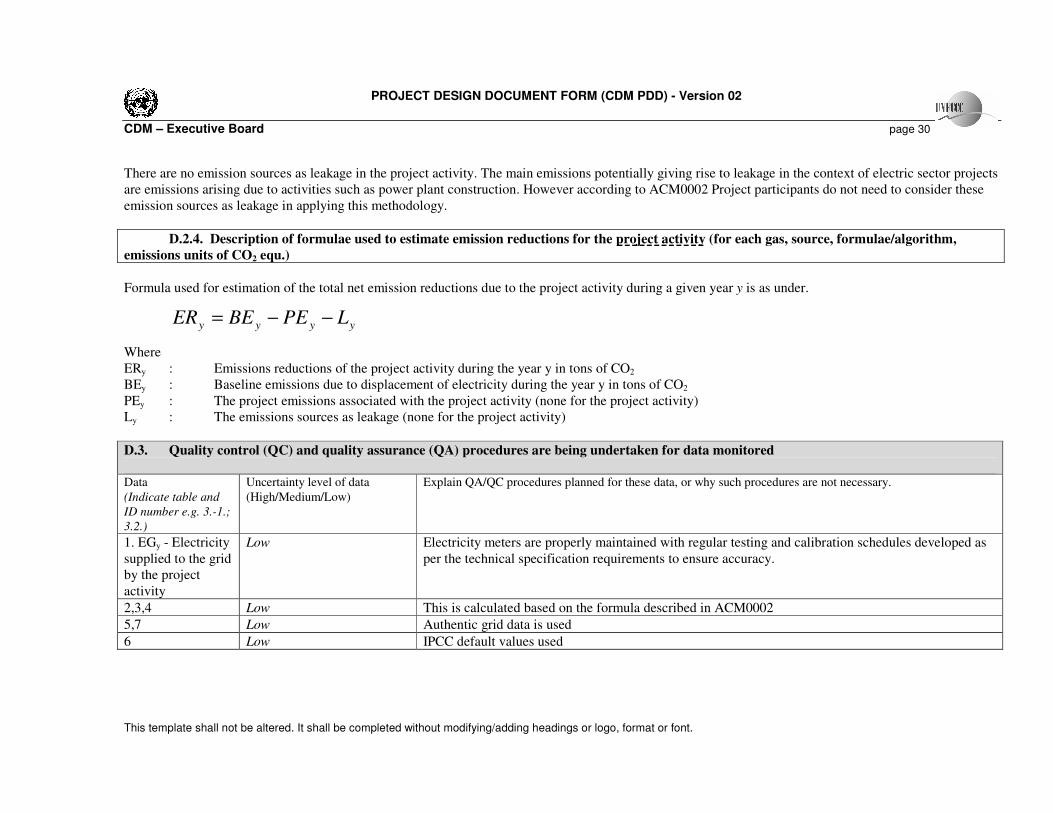
D.2.4. Description of formulae used to estimate emission reductions for the project activity (for each gas, source, formulae/algorithm,
emissions units of CO2 equ.)
Formula used for estimation of the total net emission reductions due to the project activity during a given year y is as under.
yyyy LPEBEER −−=
Where
ERy : Emissions reductions of the project activity during the year y in tons of CO2
BEy : Baseline emissions due to displacement of electricity during the year y in tons of CO2
PEy : The project emissions associated with the project activity (none for the project activity)
Ly : The emissions sources as leakage (none for the project activity)
D.3. Quality control (QC) and quality assurance (QA) procedures are being undertaken for data monitored
Data
(Indicate table and
ID number e.g. 3.-1.;
3.2.)
Uncertainty level of data
(High/Medium/Low)
Explain QA/QC procedures planned for these data, or why such procedures are not necessary.
1. EGy - Electricity
supplied to the grid
by the project
activity
Low Electricity meters are properly maintained with regular testing and calibration schedules developed as
per the technical specification requirements to ensure accuracy.
2,3,4 Low This is calculated based on the formula described in ACM0002
5,7 Low Authentic grid data is used
6 Low IPCC default values used

PROJECT DESIGN DOCUMENT FORM (CDM PDD) - Version 02
CDM – Executive Board page 31
This template shall not be altered. It shall be completed without modifying/adding headings or logo, format or font.
D.4 Please describe the operational and management structure that the project operator will implement in order to monitor emission reductions
and any leakage effects, generated by the project activity
A CDM project team is constituted with participation from relevant departments. People are trained on CDM concept and monitoring plan. This team will be
responsible for data collection and archiving. This team will meet periodically to review CDM project activity check data collected, emissions reduced etc.
On a weekly basis, the monitoring reports are checked and discussed by the seniors CDM team members/managers. In case of any irregularity observed by
any of the CDM team member, it is informed to the concerned person for necessary actions. On monthly basis, these reports are forwarded at the management
level. Detailed monitoring plan attached in annex-4.
D.5 Name of person/entity determining the monitoring methodology:
Ashutosh Pandey
Emergent Ventures India Pvt Ltd (not a project participant)
II C-141 Ridgewood Estate, DLF Phase IV
Gurgaon, Haryana – 122 002, India
Phone: 91-124 5102980
Mobile: 91-9312547154
Email: [email protected]
PROJECT DESIGN DOCUMENT FORM (CDM PDD) - Version 02
CDM – Executive Board page 32
This template shall not be altered. It shall be completed without modifying/adding headings or logo, format or font.
SECTION E. Estimation of GHG emissions by sources
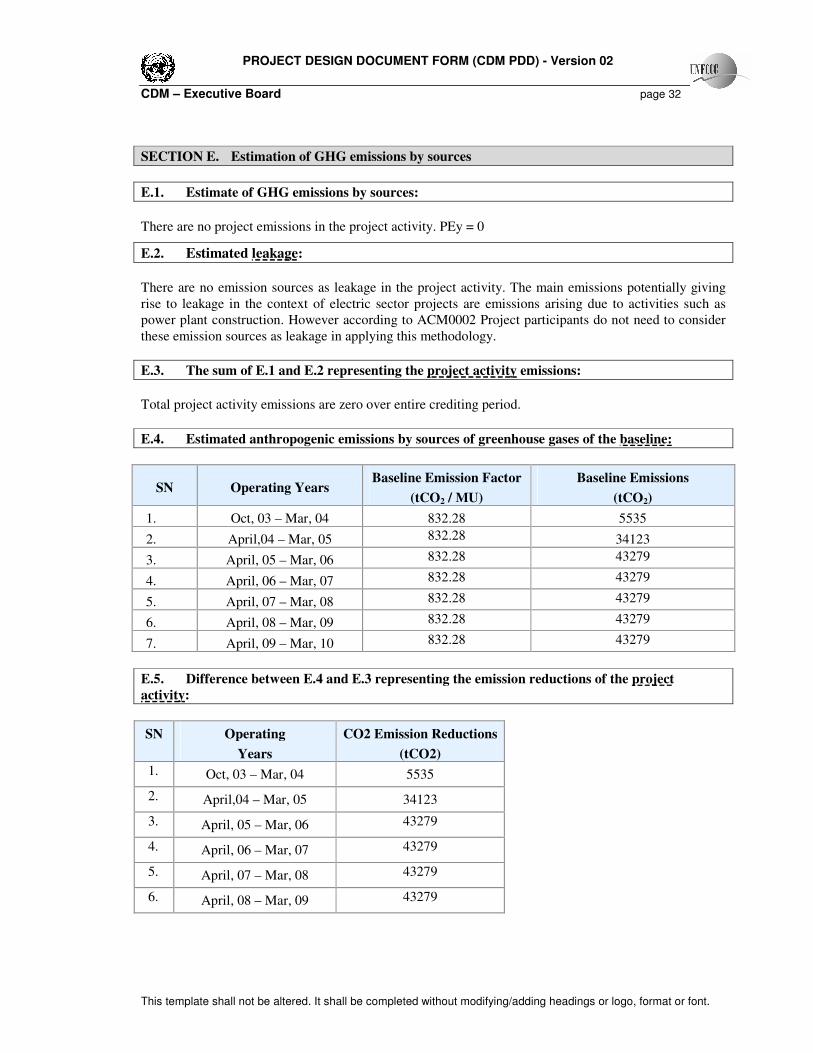
E.1. Estimate of GHG emissions by sources:
There are no project emissions in the project activity. PEy = 0
E.2. Estimated leakage:
There are no emission sources as leakage in the project activity. The main emissions potentially giving
rise to leakage in the context of electric sector projects are emissions arising due to activities such as
power plant construction. However according to ACM0002 Project participants do not need to consider
these emission sources as leakage in applying this methodology.
E.3. The sum of E.1 and E.2 representing the project activity emissions:
Total project activity emissions are zero over entire crediting period.
E.4. Estimated anthropogenic emissions by sources of greenhouse gases of the baseline:
SN Operating Years Baseline Emission Factor
(tCO2 / MU)
Baseline Emissions
(tCO2)
1. Oct, 03 – Mar, 04 832.28 5535
2. April,04 – Mar, 05 832.28 34123
3. April, 05 – Mar, 06 832.28 43279
4. April, 06 – Mar, 07 832.28 43279
5. April, 07 – Mar, 08 832.28 43279
6. April, 08 – Mar, 09 832.28 43279
7. April, 09 – Mar, 10 832.28 43279
E.5. Difference between E.4 and E.3 representing the emission reductions of the project
activity:
SN Operating
Years
CO2 Emission Reductions
(tCO2)
1. Oct, 03 – Mar, 04 5535
2. April,04 – Mar, 05 34123
3. April, 05 – Mar, 06 43279
4. April, 06 – Mar, 07 43279
5. April, 07 – Mar, 08 43279
6. April, 08 – Mar, 09 43279

PROJECT DESIGN DOCUMENT FORM (CDM PDD) - Version 02
CDM – Executive Board page 33
This template shall not be altered. It shall be completed without modifying/adding headings or logo, format or font.
SN Operating
Years
CO2 Emission Reductions
(tCO2)
7. April, 09 – Mar, 10 43279
E.6. Table providing values obtained when applying formulae above:
SN Operating
Years
Baseline
Emissions
(tCO2)
Project
Emissions
(tCO2)
Leakages
(tCO2)
CO2 Emission
Reductions
(tCO2)
1. Oct, 03 – Mar, 04 5535 0 0 5535
2. April,04 – Mar, 05 34123 0 0 34123
3. April, 05 – Mar, 06 43279 0 0 43279
4. April, 06 – Mar, 07 43279 0 0 43279
5. April, 07 – Mar, 08 43279 0 0 43279
6. April, 08 – Mar, 09 43279 0 0 43279
7. April, 09 – Mar, 10 43279 0 0 43279
SECTION F. Environmental impacts
F.1. Documentation on the analysis of the environmental impacts, including trans boundary
impacts:
The environmental assessment studies (two) have been carried out in a corridor of 10 Km. on the either
side of Kemphole. The reports fully follow the guidelines of the Ministry of Environment and Forest,
Government of India issued time to time. Accordingly the environment impact of the project area is
evaluated bringing out the beneficial and ill-effect of the project.
The following are the salient conclusions of Environment Impact Study:
a) Project is a run-of-the-river scheme and submersion is least.
b) No water was extracted from ground during construction phase.
c) No surface water is being sourced during the operational phase and no effluent is being released
into the surface water.
d) The impoundment of water behind the weir is negligible and doesn’t result in landslides or any
effect on earthquakes or any other geotechnical adverse effect.
e) Construction activity had brought normal changes to site topsoil and some components of the
land. But these impacts were kept minimized by adopting the best technology and appropriate
measures.
f) There is no agricultural activity near surrounding the project site.
PROJECT DESIGN DOCUMENT FORM (CDM PDD) - Version 02
CDM – Executive Board page 34
This template shall not be altered. It shall be completed without modifying/adding headings or logo, format or font.
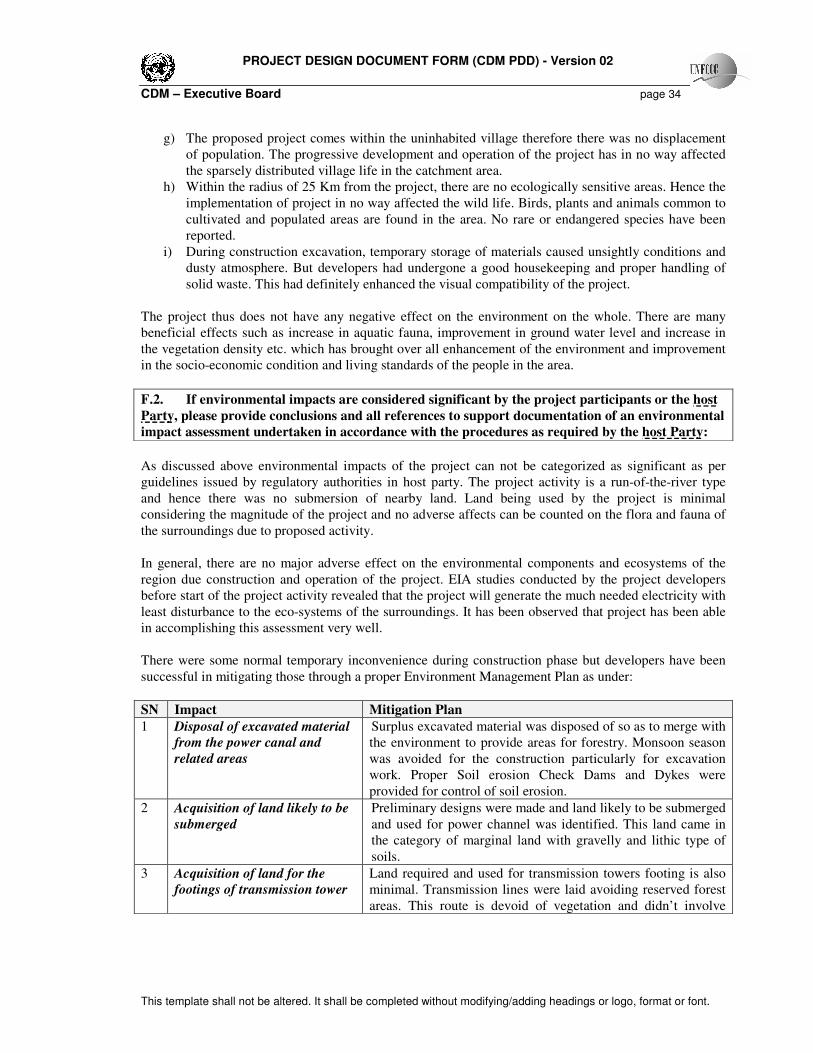
g) The proposed project comes within the uninhabited village therefore there was no displacement
of population. The progressive development and operation of the project has in no way affected
the sparsely distributed village life in the catchment area.
h) Within the radius of 25 Km from the project, there are no ecologically sensitive areas. Hence the
implementation of project in no way affected the wild life. Birds, plants and animals common to
cultivated and populated areas are found in the area. No rare or endangered species have been
reported.
i) During construction excavation, temporary storage of materials caused unsightly conditions and
dusty atmosphere. But developers had undergone a good housekeeping and proper handling of
solid waste. This had definitely enhanced the visual compatibility of the project.
The project thus does not have any negative effect on the environment on the whole. There are many
beneficial effects such as increase in aquatic fauna, improvement in ground water level and increase in
the vegetation density etc. which has brought over all enhancement of the environment and improvement
in the socio-economic condition and living standards of the people in the area.
F.2. If environmental impacts are considered significant by the project participants or the host
Party, please provide conclusions and all references to support documentation of an environmental
impact assessment undertaken in accordance with the procedures as required by the host Party:
As discussed above environmental impacts of the project can not be categorized as significant as per
guidelines issued by regulatory authorities in host party. The project activity is a run-of-the-river type
and hence there was no submersion of nearby land. Land being used by the project is minimal
considering the magnitude of the project and no adverse affects can be counted on the flora and fauna of
the surroundings due to proposed activity.
In general, there are no major adverse effect on the environmental components and ecosystems of the
region due construction and operation of the project. EIA studies conducted by the project developers
before start of the project activity revealed that the project will generate the much needed electricity with
least disturbance to the eco-systems of the surroundings. It has been observed that project has been able
in accomplishing this assessment very well.
There were some normal temporary inconvenience during construction phase but developers have been
successful in mitigating those through a proper Environment Management Plan as under:
SN Impact Mitigation Plan
1 Disposal of excavated material
from the power canal and
related areas
Surplus excavated material was disposed of so as to merge with
the environment to provide areas for forestry. Monsoon season
was avoided for the construction particularly for excavation
work. Proper Soil erosion Check Dams and Dykes were
provided for control of soil erosion.
2 Acquisition of land likely to be
submerged
Preliminary designs were made and land likely to be submerged
and used for power channel was identified. This land came in
the category of marginal land with gravelly and lithic type of
soils.
3 Acquisition of land for the
footings of transmission tower
Land required and used for transmission towers footing is also
minimal. Transmission lines were laid avoiding reserved forest
areas. This route is devoid of vegetation and didn’t involve

PROJECT DESIGN DOCUMENT FORM (CDM PDD) - Version 02
CDM – Executive Board page 35
This template shall not be altered. It shall be completed without modifying/adding headings or logo, format or font.
cutting of trees and any disturbance to any wild life. The study
of the transmission line system indicates that the route length is
on exposed rock and little soil cover.
SECTION G. Stakeholders’ comments
G.1. Brief description how comments by local stakeholders have been invited and compiled:
A meeting with all stakeholders for the project was organised by IPCL. Documentary proofs and minutes
of these meetings are maintained and can be presented at the time of validation.
Following stakeholders were consulted:
� Village Panchayat
� Local population
� Various NGOs working in the area
Sarpanch of the Village Panchayat was present in the meeting along with sufficient number of
participation from the local population.
Besides project proponents have also received all necessary approvals & clearances from Government
bodies like Karnataka Renewable Energy Development Authority (KREDA), Karnataka Pollution
Control Board (KPCB) and Environment Department, Government of Karnataka.
G.2. Summary of the comments received:
Project activity doesn’t involve any significant negative impact over social structure and environment.
Therefore all stakeholders had really shown their pleasure and support to the project activity. Comments
received from stakeholders are well documented and can be presented for verification at the time of
validation.
G.3. Report on how due account was taken of any comments received:
No negative comment was received.

PROJECT DESIGN DOCUMENT FORM (CDM PDD) - Version 02
CDM – Executive Board page 36
This template shall not be altered. It shall be completed without modifying/adding headings or logo, format or font.
Annex 1
CONTACT INFORMATION ON PARTICIPANTS IN THE PROJECT ACTIVITY Project Participant
Organization: International Power Corporation Limited, India
Street/P.O.Box: Defense Colony, HAL, 2nd Stage,
Building: "Radhakrishna", No 38, 2nd Main,
City: Bangalore
State/Region: Karnataka
Postfix/ZIP: 560038
Country: India
Telephone: 080-26531685
FAX: 080-26531685
E-Mail: [email protected]
URL:
Represented by:
Title: Director
Salutation: Mr.
Last Name: Raghavendra
Middle Name: S.
First Name: M.
Department:
Mobile: 91-9845039520
Direct FAX: 080-26531685
Direct tel: 080-26531685
Personal E-Mail: [email protected]
Host Country Details
Organization: The National CDM Authority (Designated National Authority (DNA)
Street/P.O.Box: Lodhi Road
Building: Paryavaran Bhawan, CGO Complex
City: New Delhi
State/Region: New Delhi
Postfix/ZIP: 110003
Country: India
Telephone: +91 11 24362252
FAX: +91 11 24363577
E-Mail: [email protected]
URL: www.cdmindia.nic.in
Represented by:
Title: Director
Salutation: Mr.
Last Name: Sethi
Middle Name: K.
First Name: R.

PROJECT DESIGN DOCUMENT FORM (CDM PDD) - Version 02
CDM – Executive Board page 37
This template shall not be altered. It shall be completed without modifying/adding headings or logo, format or font.
Department: The National CDM Authority
Mobile:
Direct FAX: +91 11 24363577
Direct tel: +91 11 2436 2252
Personal E-Mail: [email protected]

PROJECT DESIGN DOCUMENT FORM (CDM PDD) - Version 02
CDM – Executive Board page 38
This template shall not be altered. It shall be completed without modifying/adding headings or logo, format or font.
Annex 2
INFORMATION REGARDING PUBLIC FUNDING
IPCL is promoted by Public Power International Inc, USA. Equity investment is done by USA based
promoters. However this financing is not part of an International Official Development Assistance
(ODA) effort. Details of investments are available to DOE for validation.
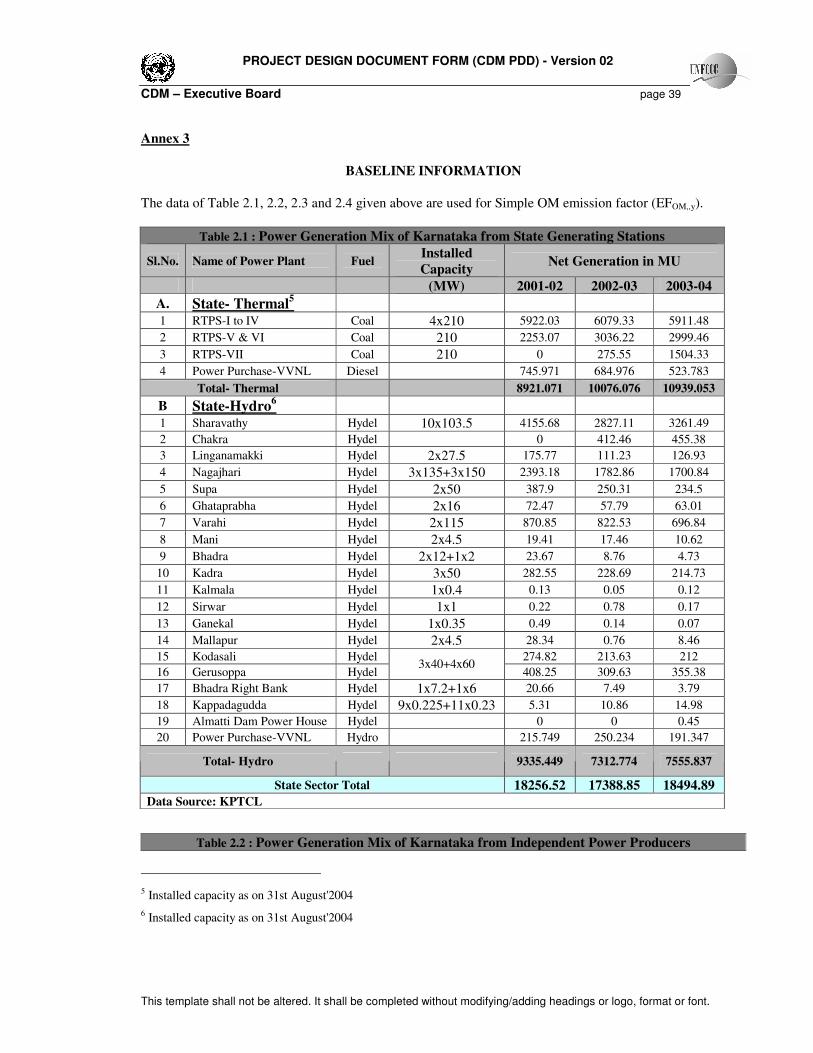
PROJECT DESIGN DOCUMENT FORM (CDM PDD) - Version 02
CDM – Executive Board page 39
This template shall not be altered. It shall be completed without modifying/adding headings or logo, format or font.
Annex 3
BASELINE INFORMATION
The data of Table 2.1, 2.2, 2.3 and 2.4 given above are used for Simple OM emission factor (EFOM,,y).
Table 2.1 : Power Generation Mix of Karnataka from State Generating Stations
Sl.No. Name of Power Plant Fuel Installed
Capacity Net Generation in MU
(MW) 2001-02 2002-03 2003-04
A. State- Thermal5
1 RTPS-I to IV Coal 4x210 5922.03 6079.33 5911.48
2 RTPS-V & VI Coal 210 2253.07 3036.22 2999.46
3 RTPS-VII Coal 210 0 275.55 1504.33
4 Power Purchase-VVNL Diesel 745.971 684.976 523.783
Total- Thermal 8921.071 10076.076 10939.053
B State-Hydro6
1 Sharavathy Hydel 10x103.5 4155.68 2827.11 3261.49
2 Chakra Hydel 0 412.46 455.38
3 Linganamakki Hydel 2x27.5 175.77 111.23 126.93
4 Nagajhari Hydel 3x135+3x150 2393.18 1782.86 1700.84
5 Supa Hydel 2x50 387.9 250.31 234.5
6 Ghataprabha Hydel 2x16 72.47 57.79 63.01
7 Varahi Hydel 2x115 870.85 822.53 696.84
8 Mani Hydel 2x4.5 19.41 17.46 10.62
9 Bhadra Hydel 2x12+1x2 23.67 8.76 4.73
10 Kadra Hydel 3x50 282.55 228.69 214.73
11 Kalmala Hydel 1x0.4 0.13 0.05 0.12
12 Sirwar Hydel 1x1 0.22 0.78 0.17
13 Ganekal Hydel 1x0.35 0.49 0.14 0.07
14 Mallapur Hydel 2x4.5 28.34 0.76 8.46
15 Kodasali Hydel 274.82 213.63 212
16 Gerusoppa Hydel 3x40+4x60
408.25 309.63 355.38
17 Bhadra Right Bank Hydel 1x7.2+1x6 20.66 7.49 3.79
18 Kappadagudda Hydel 9x0.225+11x0.23 5.31 10.86 14.98
19 Almatti Dam Power House Hydel 0 0 0.45
20 Power Purchase-VVNL Hydro 215.749 250.234 191.347
Total- Hydro 9335.449 7312.774 7555.837
State Sector Total 18256.52 17388.85 18494.89 Data Source: KPTCL
Table 2.2 : Power Generation Mix of Karnataka from Independent Power Producers
5 Installed capacity as on 31st August'2004
6 Installed capacity as on 31st August'2004

PROJECT DESIGN DOCUMENT FORM (CDM PDD) - Version 02
CDM – Executive Board page 40
This template shall not be altered. It shall be completed without modifying/adding headings or logo, format or font.
Sl.No. Name of Power Plant Fuel Installed
Capacity Net Generation in MU
(MW) 2001-02 2002-03 2003-04
A IPP7
1 Rayalseema Alkalies Diesel 27 189.08 61.8 41.63
2 TATA Electric Company Diesel 81 531.05 356.95 235.5
3 Taneer Bhavi Power Company Gas (Naptha) 220 943.57 1178.18 866.37
Total- IPP(Major) 1663.7 1596.93 1143.5
Data Source: KPTCL
Table 2.3 : Power Generation Mix of Karnataka from Private Generating Stations
Sl.No. Name of Power Plant Fuel Installed
Capacity Net Generation in MU
(MW) 2001-02 2002-03 2003-04
A IPP-Mini-Hydel
1 ITPL 2.37 1.38 0.66
2 EDCL 24.48 22.87 20.76
3 Murudeshwar Power Corporation Ltd. 48.54 37.91 37.17
4 Bhoruka Power Corporation Ltd. 27 27.3 23.59
5 Bhoruka Power (Shahapur) 0 0 2.86
6 S.M.I.O.R.E 28.46 11.98 4.45
7 Thungabhadra Steel Products 0.39 0.37 0.31
8 Amogha Power Projects 1.96 2.8 1.81
9 Atria Power Corporation Ltd. 21.34 79.29 54.46
10 Vijaylakshmi Hydro Power Ltd. 1.33 1.83
11 Moodatyagil Power Pvt. Ltd. 0.32 0.52
12 Maruthi Power (Kabini) 1.65
13 Maruthi Power (Hemabhathi) 0.5
14 Kalson Power Tech Ltd. 2.89
15 Graphite India Ltd. 1.31
16 Intrernational Power Corpn. Ltd. 3.32
Total- IPP(Mini-Hydel) 154.54 185.55 158.09
B IPP-Co-generation
1 Ugar Sugar Ltd. Bagasse 69.9 51.66 55.48
2 Shamanur Sugars Ltd. Bagasse 100.02 98.31 111.9
3 Shree Renuka Sugars Ltd. Bagasse 34.61 26.33 45.96
4 Bannari Amman Sugars Ltd. Bagasse 57.71 73.82 76.27
5 ICL Sugars Ltd. Bagasse 13.54 17.17 14.19
6 Prabhulingeshwara Sugars Bagasse 33.66 38.34 34.07
7 Dandeli Ferro Alloys Limited 4.45 3.57 0
8 Jamkhandi Sugars Limited 0.62 7.14 13.47
9 GEM Sugars 0 8.29 27.59
7 Installed capacity as on 31st March'2003

PROJECT DESIGN DOCUMENT FORM (CDM PDD) - Version 02
CDM – Executive Board page 41
This template shall not be altered. It shall be completed without modifying/adding headings or logo, format or font.
Table 2.3 : Power Generation Mix of Karnataka from Private Generating Stations
Sl.No. Name of Power Plant Fuel Installed
Capacity Net Generation in MU
(MW) 2001-02 2002-03 2003-04
10 Ryatsara Sahakari S.K.N 2.87 5.69 2.76
11 Devengare Sugar Co. Ltd. 0 0 1.67
Total- IPP(Co-Generation) 317.38 330.32 383.36
C IPP-Biomass
1 Mallavali Power Plant Rice Husk 13.11 21.78 26.47
2 South India Paper Mills
Coffee Husk,
Rice Husk &
Copra Shells 12.23 23.55 13.11
3 Bhagarampur Solvets 3.22
4 R.K.Powergen 9.75
5 Samson Distillisers 0.43
Total- IPP(Biomass) 25.34 45.33 52.98
D IPP-Wind
1 Cepco Wind Farm 7.35 20.27 23.57
2 Topaz Wind Farm 0.93 1.86 2
3 Enercon Wind Farm 2.92 23.21 26.95
4 Prabhat Agri biotech Ltd. 1.08 1.05
5 Panarna Business Centre 0 1.24
6 Panarna Credit & Capital 0.66
7 Texmo Precision and Castings 0 2.87
8 Siddaganga Oil Extractions 0 2.86
9 Fiza Developers and Inner Trade 0.01 2.83
10 Suttatti Enterprise 0 2.48
11 Raja Magnetics Ltd. 0 1.11
12 VXL Systems-II 0.77
13 VXL Systems-I 0.77
14 Kamal Trading Company 0.72
15 Jindal Alluminium-1.9MW 3.23
16 Mayura Steels 0.75
17 Shilpa Medicare 0.64
18 Patel Shanti Steels 0.71
19 Balasaheb IJ Limited 0.69
20 Friends Associate Power Projects 0.74
21 Sharp Pumps (P) Ltd. 0.73
22 Rajnikanth Foundation 0.71
23 RSM Autokast Ltd. 1.49
24 Indan Energy Ltd. 1.48
25 MSPL Ltd. Phase-1 1.99
26 Savitha Chemicals 4.82
27 Elveety Industries 0.57

PROJECT DESIGN DOCUMENT FORM (CDM PDD) - Version 02
CDM – Executive Board page 42
This template shall not be altered. It shall be completed without modifying/adding headings or logo, format or font.
Table 2.3 : Power Generation Mix of Karnataka from Private Generating Stations
Sl.No. Name of Power Plant Fuel Installed
Capacity Net Generation in MU
(MW) 2001-02 2002-03 2003-04
28 Jindal Alluminium-6.6MW 2.57 14.59
29 Ghodawat Pan Masala (Enercon) 11.83
30 Ghodawat Pan Masala-NH 9.46
31 Sanjay D. Ghodawat 1.55
32 Shriram Transport Finance 8.73
33 Shriram City Union Finance 3.89
34 Shriram Investments 8.03
35 Texmo Industries EP2 4.51
36 Enercon-Karnataka 46.08
37 Lovely Fragrances 1.83
38 J.N.Investments 0.81
39 Reliance Energy Ltd. 0.89 19.08 20.08
40 Topaz Investments-1.2MW 2.14
41 Cepco Industries-0.6MW 0 1.2
42 Shilpa Medicare-0.46MW 1.5
43 Mohite & Mohita 4.06
44 NEG Mican 6.99
45 Pallavi Green Power 0.56
46 Supreme Power Company 1.46
47 Dee Dee Enterprises 1.4
48 Royal Energy Company 1.08
49 Rangad minerals and Mining Ltd. 1.15
50 MSPL Ltd. Phase-II 3.61
51 Mansukmal Investments 0.29
52 Reliance-BSES 3.06
53 Encon Services Ltd. 4.34
54 Mahe Ltd. 12.17
55 Prime Lables Ltd. 0.36
56 Savita Chemicals (Encon Group) 2.37
57 Sanjay D. Ghodawat (I & II) 0.01
58 BS Charnabasappa & Sons 0.01
59 Associated Autotex Ancilliaries Ltd. 0
60 Good Luck Syndicate 0.01
61 Ghodawat Pan Masala (VVS) 0.02
62 Star Flexi Pack Industries 0.01
63 Shreya Laxmi Properties 0
64 Shraddha Constructions 0
65 VXL Systems 0.6MW (VVS) 0
66 Cepco Industries-1.2MW(VVS) 0
67 Dee Dee Enterprises (Enercon) 2.01
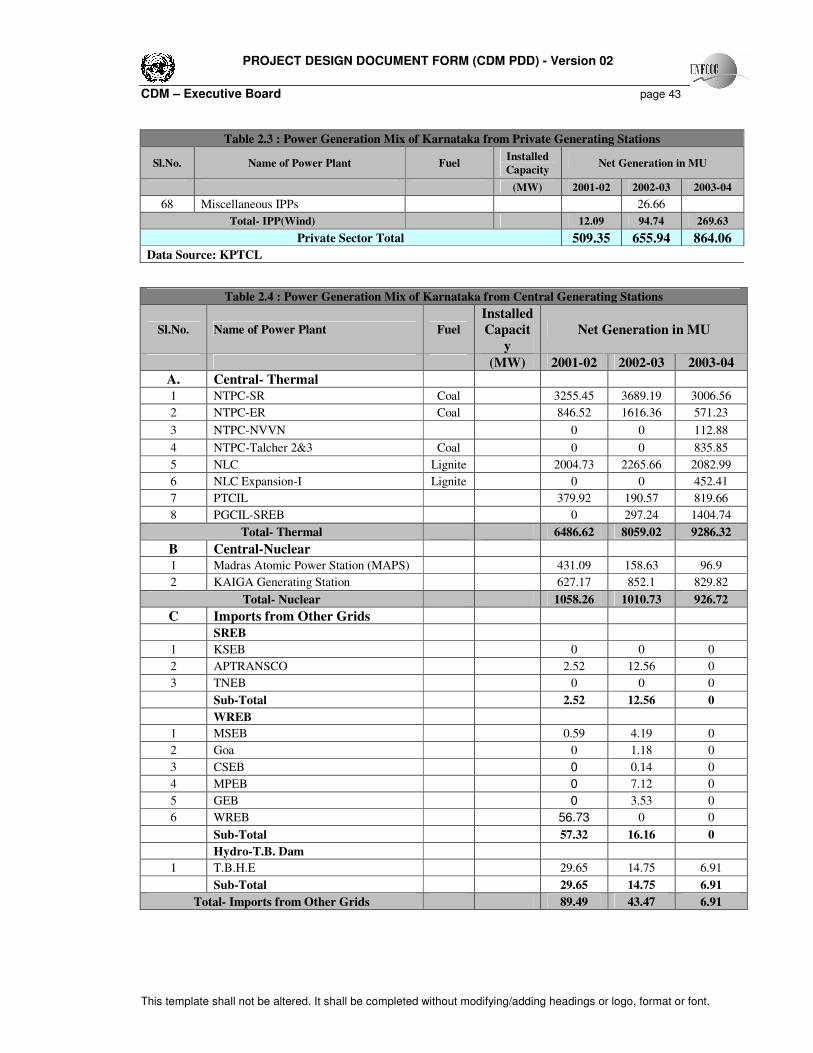
PROJECT DESIGN DOCUMENT FORM (CDM PDD) - Version 02
CDM – Executive Board page 43
This template shall not be altered. It shall be completed without modifying/adding headings or logo, format or font.
Table 2.3 : Power Generation Mix of Karnataka from Private Generating Stations
Sl.No. Name of Power Plant Fuel Installed
Capacity Net Generation in MU
(MW) 2001-02 2002-03 2003-04
68 Miscellaneous IPPs 26.66
Total- IPP(Wind) 12.09 94.74 269.63
Private Sector Total 509.35 655.94 864.06
Data Source: KPTCL
Table 2.4 : Power Generation Mix of Karnataka from Central Generating Stations
Sl.No. Name of Power Plant Fuel
Installed
Capacit
y
Net Generation in MU
(MW) 2001-02 2002-03 2003-04
A. Central- Thermal
1 NTPC-SR Coal 3255.45 3689.19 3006.56
2 NTPC-ER Coal 846.52 1616.36 571.23
3 NTPC-NVVN 0 0 112.88
4 NTPC-Talcher 2&3 Coal 0 0 835.85
5 NLC Lignite 2004.73 2265.66 2082.99
6 NLC Expansion-I Lignite 0 0 452.41
7 PTCIL 379.92 190.57 819.66
8 PGCIL-SREB 0 297.24 1404.74
Total- Thermal 6486.62 8059.02 9286.32
B Central-Nuclear
1 Madras Atomic Power Station (MAPS) 431.09 158.63 96.9
2 KAIGA Generating Station 627.17 852.1 829.82
Total- Nuclear 1058.26 1010.73 926.72
C Imports from Other Grids
SREB
1 KSEB 0 0 0
2 APTRANSCO 2.52 12.56 0
3 TNEB 0 0 0
Sub-Total 2.52 12.56 0
WREB
1 MSEB 0.59 4.19 0
2 Goa 0 1.18 0
3 CSEB 0 0.14 0
4 MPEB 0 7.12 0
5 GEB 0 3.53 0
6 WREB 56.73 0 0
Sub-Total 57.32 16.16 0
Hydro-T.B. Dam
1 T.B.H.E 29.65 14.75 6.91
Sub-Total 29.65 14.75 6.91
Total- Imports from Other Grids 89.49 43.47 6.91
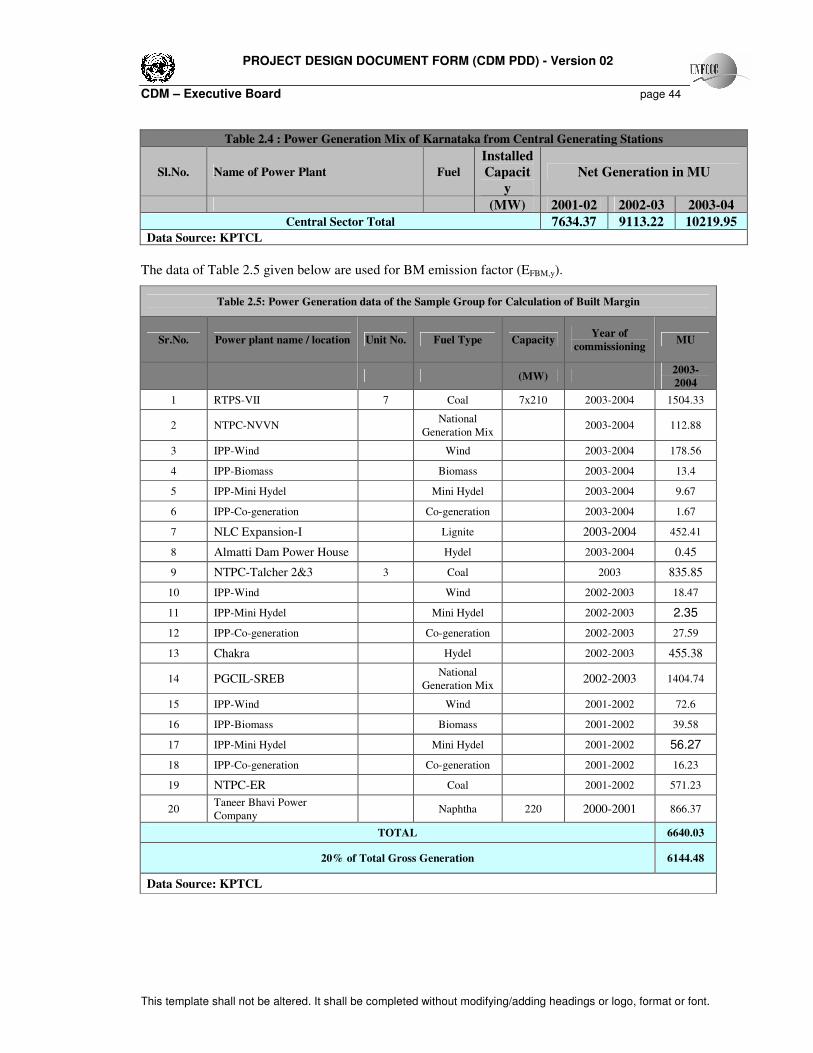
PROJECT DESIGN DOCUMENT FORM (CDM PDD) - Version 02
CDM – Executive Board page 44
This template shall not be altered. It shall be completed without modifying/adding headings or logo, format or font.
Table 2.4 : Power Generation Mix of Karnataka from Central Generating Stations
Sl.No. Name of Power Plant Fuel
Installed
Capacit
y
Net Generation in MU
(MW) 2001-02 2002-03 2003-04
Central Sector Total 7634.37 9113.22 10219.95 Data Source: KPTCL
The data of Table 2.5 given below are used for BM emission factor (EFBM,y).
Table 2.5: Power Generation data of the Sample Group for Calculation of Built Margin
Sr.No. Power plant name / location Unit No. Fuel Type Capacity Year of
commissioning MU
(MW) 2003-
2004
1 RTPS-VII 7 Coal 7x210 2003-2004 1504.33
2 NTPC-NVVN National
Generation Mix 2003-2004 112.88
3 IPP-Wind Wind 2003-2004 178.56
4 IPP-Biomass Biomass 2003-2004 13.4
5 IPP-Mini Hydel Mini Hydel 2003-2004 9.67
6 IPP-Co-generation Co-generation 2003-2004 1.67
7 NLC Expansion-I Lignite 2003-2004 452.41
8 Almatti Dam Power House Hydel 2003-2004 0.45
9 NTPC-Talcher 2&3 3 Coal 2003 835.85
10 IPP-Wind Wind 2002-2003 18.47
11 IPP-Mini Hydel Mini Hydel 2002-2003 2.35
12 IPP-Co-generation Co-generation 2002-2003 27.59
13 Chakra Hydel 2002-2003 455.38
14 PGCIL-SREB National
Generation Mix 2002-2003 1404.74
15 IPP-Wind Wind 2001-2002 72.6
16 IPP-Biomass Biomass 2001-2002 39.58
17 IPP-Mini Hydel Mini Hydel 2001-2002 56.27
18 IPP-Co-generation Co-generation 2001-2002 16.23
19 NTPC-ER Coal 2001-2002 571.23
20 Taneer Bhavi Power
Company Naphtha 220 2000-2001 866.37
TOTAL 6640.03
20% of Total Gross Generation 6144.48
Data Source: KPTCL
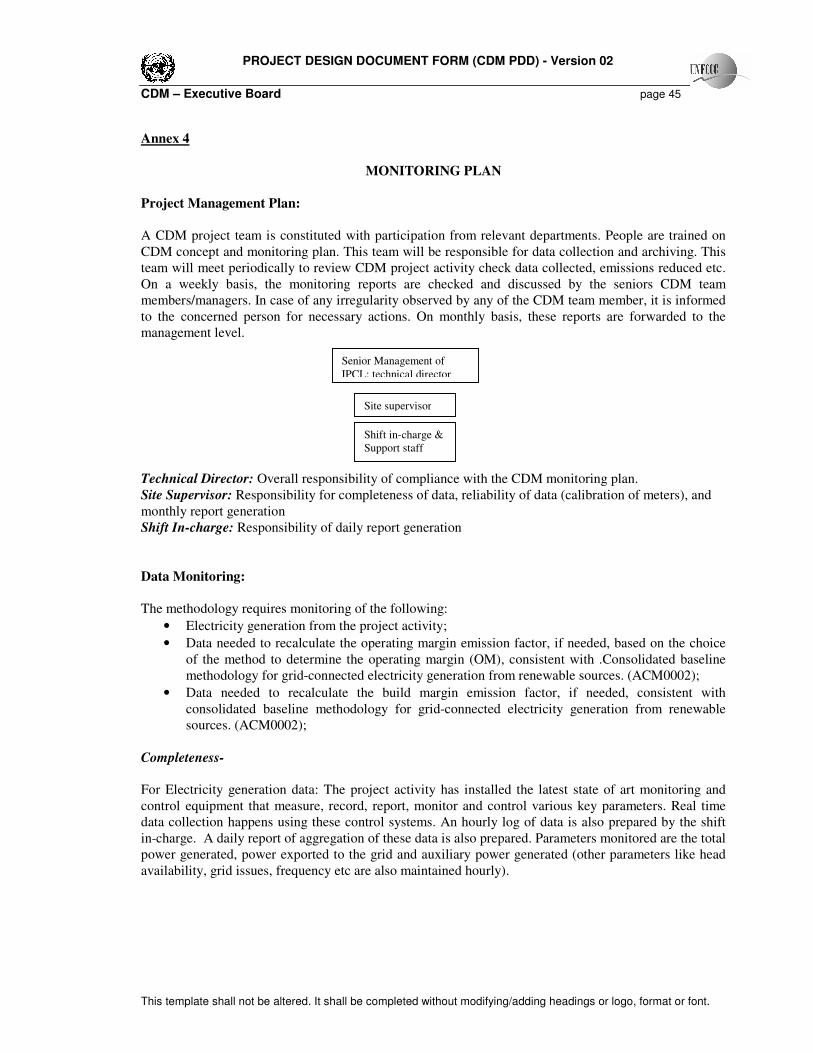
PROJECT DESIGN DOCUMENT FORM (CDM PDD) - Version 02
CDM – Executive Board page 45
This template shall not be altered. It shall be completed without modifying/adding headings or logo, format or font.
Annex 4
MONITORING PLAN
Project Management Plan:
A CDM project team is constituted with participation from relevant departments. People are trained on
CDM concept and monitoring plan. This team will be responsible for data collection and archiving. This
team will meet periodically to review CDM project activity check data collected, emissions reduced etc.
On a weekly basis, the monitoring reports are checked and discussed by the seniors CDM team
members/managers. In case of any irregularity observed by any of the CDM team member, it is informed
to the concerned person for necessary actions. On monthly basis, these reports are forwarded to the
management level.
Technical Director: Overall responsibility of compliance with the CDM monitoring plan.
Site Supervisor: Responsibility for completeness of data, reliability of data (calibration of meters), and
monthly report generation
Shift In-charge: Responsibility of daily report generation
Data Monitoring:
The methodology requires monitoring of the following:
• Electricity generation from the project activity;
• Data needed to recalculate the operating margin emission factor, if needed, based on the choice
of the method to determine the operating margin (OM), consistent with .Consolidated baseline
methodology for grid-connected electricity generation from renewable sources. (ACM0002);
• Data needed to recalculate the build margin emission factor, if needed, consistent with
consolidated baseline methodology for grid-connected electricity generation from renewable
sources. (ACM0002);
Completeness-
For Electricity generation data: The project activity has installed the latest state of art monitoring and
control equipment that measure, record, report, monitor and control various key parameters. Real time
data collection happens using these control systems. An hourly log of data is also prepared by the shift
in-charge. A daily report of aggregation of these data is also prepared. Parameters monitored are the total
power generated, power exported to the grid and auxiliary power generated (other parameters like head
availability, grid issues, frequency etc are also maintained hourly).
Senior Management of
IPCL; technical director
Site supervisor
Shift in-charge &
Support staff

PROJECT DESIGN DOCUMENT FORM (CDM PDD) - Version 02
CDM – Executive Board page 46
This template shall not be altered. It shall be completed without modifying/adding headings or logo, format or font.
For data requirement to calculate OM & BM: KPTCL publishes yearly reports regarding the performance
of the power plants attached to state grid. Apart from KPTCL, CEA and MOP and SREB also publish
yearly power plants performance data.
Reliability-
For Electricity generation data: automatic control meters regarding power generation and exports are
regularly maintained. The regular plant operating & maintenance procedures also include process of
regular meter testing, calibration & maintenance.
Daily generation reports are consolidated every month and a monthly report is submitted to KPTCL for
billing purposes. Actual power generation data is also metered using power output meter maintained by
KPTCL. Every three months KPTCL calibrates these meters. The billing invoices and meter readings by
KPTCL could be used to validate the data accuracy.
Frequency-
The measurement is recorded and monitored on a continuous basis. An hourly log is prepared every hour
by the shift in-charge. At the end of the day, hourly data is aggregated in a daily report.

PROJECT DESIGN DOCUMENT FORM (CDM PDD) - Version 02
CDM – Executive Board page 47
This template shall not be altered. It shall be completed without modifying/adding headings or logo, format or font.
Annex 5
LOCATION MAP

PROJECT DESIGN DOCUMENT FORM (CDM PDD) - Version 02
CDM – Executive Board page 48
This template shall not be altered. It shall be completed without modifying/adding headings or logo, format or font.
Annex 6
Glossary
% Percentage
BM Build Margin
BEF Baseline Emission Factor
CDM Clean Development Mechanism
CEA Central Electricity Authority
CER Carbon Emission Reduction
CM Combined Margin
CO2 Carbon Di Oxide
DNA Designated National Authority
DOE Designated Operational Entity
EIA Environmental Impact Assessment
GHG Green House Gases
GWh Giga Watt Hour
Gwh/ Year Giga Watt Hour per Year
IPCC Intergovernmental Panel on Climate Change
IPCL International Power Corporation Limited
IPPs Independent Power Producers
IRR Internal Rate of Return
Kg / kWh Kilo Gram per Kilo Watt Hour
kg CO2 equ/kwh Kilo Gram Carbon Di Oxide equivalent per Kilo Watt Hour
kg/kwh Kilo Gram per Kilo Watt Hour
KERC Karnataka Electricity Regulatory Commission
KMHS Kemphole Mini Hydel Scheme
KP Kyoto Protocol
KPCL Karnataka Power Corporation Limited
KPTCL Karnataka Power Transmission Corporation Limited
KREDA Karnataka Renewable Energy Development Authority
KV Kilo Volt
kw Kilo Watt
kWh Kilo Watt Hour
M Meter
M & P Modalities and Procedures
M & V Monitoring and Verification
M Cum. Million Cubic Meter

PROJECT DESIGN DOCUMENT FORM (CDM PDD) - Version 02
CDM – Executive Board page 49
This template shall not be altered. It shall be completed without modifying/adding headings or logo, format or font.
Mkwh Million Kilo Watt Hour
MNES Ministry of Non-Conventional Energy Sources
MoEF Ministry of Environment and Forests
MU Miilion Units
MW Mega Watt
NCV Net Calorific Value
NTPC National Thermal Power Corporation
NTPC-NVVN National Thermal Power Corporation – Vidyut Vyapar Nigam Limited
OECD Organisation for Economic Co-operation and Development
OM Operating Margin
OM Expenses Operation and Maintenance Expenses
PGCIL Power Grid Corporation of India Ltd
PTCIL Power Trading Corporation of India Limited
R.T.P.S Raichur Thermal Power Station
Rs. Indian Rupees
SREB Southern Regional Electricity Board
T & D Transmission and Distribution
UNFCCC United Nations Framework Convention on Climate Change
VVNL Vishveswaraya Vidyuth Nigama Limited
WACC Weighted average cost of capital
WREB Western Regional Electricity Board

PROJECT DESIGN DOCUMENT FORM (CDM PDD) - Version 02
CDM – Executive Board page 50
This template shall not be altered. It shall be completed without modifying/adding headings or logo, format or font.
Annex 7
LIST OF REFERENCES
Website of United Nations Framework Convention on Climate Change, http://unfccc.int
UNFCCC, Clean Development Mechanism, CDM Project Design Document (CDM-PDD)
version 02 (in effect as of: 1 July 2004)
UNFCCC, Clean Development Mechanism, Approved consolidated baseline methodology
ACM0002 - “Consolidated baseline methodology for grid-connected electricity generation from
renewable sources” ACM0002 / Version 03; Sectoral Scope: 1, 30 September 2005
UNFCCC, Clean Development Mechanism, Annex 1, Tool for the demonstration and assessment
of additionality EB 16 Report;
Detailed project report on Kemphole Hydro Scheme
KMHS project activity proposal, 2003
Board Agenda for the KMHS Board Meeting, 12th March 2003
Website of Central Electric Authority (CEA), Ministry of Power, Govt. of India- www.cea.nic.in
Communications from KPTCL
Water Resources Department, Government of Karnataka ; waterresources.kar.nic.in
Website of Ministry Non-Conventional Energy Sources (MNES), Government of India,
www.mnes.nic.in
Power Purchase Agreement between KMHS and KPTCL;
Stakeholders Comments, (2003), KMHS
IPCC-Good Practice Guidance
KPTCL Power generation, consumption data