Clean Cities Coalitions: 2017 Activity Report2017 Clean Cities Coalitions Activity Report is focused...
36
NREL is a national laboratory of the U.S. Department of Energy Office of Energy Efficiency & Renewable Energy Operated by the Alliance for Sustainable Energy, LLC This report is available at no cost from the National Renewable Energy Laboratory (NREL) at www.nrel.gov/publications. Contract No. DE-AC36-08GO28308 Technical Report NREL/TP-5400-73903 May 2019 Clean Cities Coalitions 2017 Activity Report Caley Johnson and Mark Singer National Renewable Energy Laboratory
Transcript of Clean Cities Coalitions: 2017 Activity Report2017 Clean Cities Coalitions Activity Report is focused...
NREL is a national laboratory of the U.S. Department of Energy Office of Energy Efficiency & Renewable Energy Operated by the Alliance for Sustainable Energy, LLC This report is available at no cost from the National Renewable Energy Laboratory (NREL) at www.nrel.gov/publications.
Contract No. DE-AC36-08GO28308
Technical Report NREL/TP-5400-73903 May 2019
Clean Cities Coalitions
2017 Activity Report Caley Johnson and Mark Singer
National Renewable Energy Laboratory
NREL is a national laboratory of the U.S. Department of Energy Office of Energy Efficiency & Renewable Energy Operated by the Alliance for Sustainable Energy, LLC This report is available at no cost from the National Renewable Energy Laboratory (NREL) at www.nrel.gov/publications.
Contract No. DE-AC36-08GO28308
National Renewable Energy Laboratory 15013 Denver West Parkway Golden, CO 80401 303-275-3000 • www.nrel.gov
Technical Report NREL/TP-5400-73903 May 2019
Clean Cities Coalitions
2017 Activity Report Caley Johnson and Mark Singer
National Renewable Energy Laboratory
Suggested Citation Caley, Johnson and Mark Singer. 2019. Clean Cities Coalitions: 2017 Activity Report. Golden, CO: National Renewable Energy Laboratory. NREL/TP-5400-73903. https://www.nrel.gov/docs/fy19osti/73903.pdf.

NOTICE
This work was authored by the National Renewable Energy Laboratory, operated by Alliance for Sustainable Energy, LLC, for the U.S. Department of Energy (DOE) under Contract No. DE-AC36-08GO28308. Funding provided by U.S. Department of Energy Office of Energy Efficiency and Renewable Energy Vehicle Technologies Office. The views expressed herein do not necessarily represent the views of the DOE or the U.S. Government.
This report is available at no cost from the National Renewable Energy Laboratory (NREL) at www.nrel.gov/publications.
U.S. Department of Energy (DOE) reports produced after 1991 and a growing number of pre-1991 documents are available free via www.OSTI.gov.
Cover Photos by Dennis Schroeder: (clockwise, left to right) NREL 51934, NREL 45897, NREL 42160, NREL 45891, NREL 48097, NREL 46526.
NREL prints on paper that contains recycled content.
iii This report is available at no cost from the National Renewable Energy Laboratory (NREL) at www.nrel.gov/publications.
Table of Contents Introduction ................................................................................................................................................. 2 Summary of Key Findings .......................................................................................................................... 3 Attribution and Fuel Use Factors .............................................................................................................. 5 Coalition-Reported Data ............................................................................................................................ 5
Alternative Fuels and Vehicles ............................................................................................................... 5 Fuel Economy ......................................................................................................................................... 8 Vehicle Miles Traveled Reduction ......................................................................................................... 9 Idle Reduction ........................................................................................................................................ 9 Off-Road Vehicles ................................................................................................................................ 10
National Clean Fleets Partnership Contributions .................................................................................. 11 Estimated Contributions from Outreach Activities ............................................................................... 12
Methods Used to Estimate Energy Use Impact from Outreach Activities ........................................... 12 Estimated Outreach Accomplishments ................................................................................................. 15
Cumulative Energy Use Impact ............................................................................................................... 17 Alternative Fuel Vehicle Types and Applications .................................................................................. 20
Emerging Technologies—Experimental, Prototype, and Demonstration Vehicle Projects ................. 22 Coordinators and Coalition Types .......................................................................................................... 22 Funding ...................................................................................................................................................... 24 About the Stakeholders ............................................................................................................................ 25 Data Sources and Quality ......................................................................................................................... 25 Conclusion ................................................................................................................................................. 26 Appendix A: Clean Cities Coalitions that Completed 2017 Annual Reports ...................................... 27 Appendix B: Definition of Clean Cities Coalition Types ....................................................................... 30
iv This report is available at no cost from the National Renewable Energy Laboratory (NREL) at www.nrel.gov/publications.
List of Figures Figure 1. 2017 percentage of AFVs, EUI, and emissions reductions by fuel type ....................................... 6 Figure 2. Average energy saved per vehicle for 2017 Clean Cities coalition fuel economy projects........... 8 Figure 3. Energy savings measured in MGGE from IR projects, 2017 ...................................................... 10 Figure 4. Percentage of outreach activities reaching each audience type ................................................... 16 Figure 5. Percentage of outreach activities by technology type .................................................................. 17 Figure 6. Increasing Energy Use Impact from coalitions ........................................................................... 18 Figure 7. Cumulative accomplishments of all Clean Cities coalition activities .......................................... 19 Figure 8. Cumulative emissions reductions from all Clean Cities coalition activities ............................... 20 Figure 9. AFVs by vehicle and fuel type .................................................................................................... 21 Figure 10. AFVs by application and fuel type ............................................................................................ 22 Figure 11. Data quality responses by data source ....................................................................................... 26 List of Tables Table 1. Energy Use Impact of Each Portfolio Element ............................................................................... 3 Table 2. Emissions Reduced by Clean Cities Coalitions in 2017 ................................................................. 4 Table 3. Average Annual EUI per Vehicle in 2017 ...................................................................................... 7 Table 4. VMT-Reduction Project Types, Number, and Energy Savings in 2017 ......................................... 9 Table 5. Number of Off-Road Vehicles or Equipment and EUI in 2017 .................................................... 11 Table 6. Vehicles, EUI, and Emissions Reduction from National Partners ................................................ 12 Table 7. Benchmark Customer Conversion Rates and Their Sources ........................................................ 13 Table 8. Relationships for Media Effectiveness and Their Sources ........................................................... 14 Table 9. Combination of Benchmarks and Relationships ........................................................................... 14 Table 10. Customer Conversion Rates Used in the BIM ............................................................................ 15 Table 11. Outreach, Education, and Training Activities ............................................................................. 16 Table 12. Coalition Metrics by Coalition Type .......................................................................................... 23 Table 13. Breakdown of 2017 Project Awards by Number and Value ....................................................... 24
v This report is available at no cost from the National Renewable Energy Laboratory (NREL) at www.nrel.gov/publications.
List of Acronyms AFDC Alternative Fuels Data Center AFV alternative fuel vehicle CMAQ Congestion Mitigation and Air Quality
Improvement Program CNG compressed natural gas BIM Behavioral Impact Model DMA Direct Marketing Association DOE U.S. Department of Energy E85 high-level ethanol blend EPA U.S. Environmental Protection Agency EUI energy use impact EV all-electric vehicles FFV flex fuel vehicle GGE gasoline gallon equivalent GHG greenhouse gas GREET model Greenhouse gases, Regulated Emissions, and
Energy use in Transportation model HDV heavy-duty vehicle HEV hybrid electric vehicle IR idle reduction LDV light-duty vehicle LNG liquefied natural gas MGGE million GGE NCFP National Clean Fleets Partnership NREL National Renewable Energy Laboratory ORNL Oak Ridge National Laboratory PEV plug-in electric vehicle RNG renewable natural gas USDA U.S. Department of Agriculture USPS United States Postal Service VMT vehicle miles traveled VTO Vehicle Technologies Office
1 This report is available at no cost from the National Renewable Energy Laboratory (NREL) at www.nrel.gov/publications.
Acknowledgements The authors would like to acknowledge the efforts of thousands of Clean Cities coalition stakeholders and coordinators, who provided the basis for this analysis by reporting data from their alternative fuel and energy-saving transportation projects.
This work was supported by the U.S. Department of Energy (DOE) under Contract No. DE-AC36- 08GO28308 with Alliance
for Sustainable Energy, LLC, the Manager and Operator of the National Renewable Energy Laboratory.
This publication is part of a series. Past Clean Cities Coalitions Activity Reports and multi-year data compilations can be found at www.afdc.energy.gov.
2 This report is available at no cost from the National Renewable Energy Laboratory (NREL) at www.nrel.gov/publications.
Introduction The U.S. Department of Energy’s Vehicle Technologies Office (VTO) works with local Clean Cities coalitions across the country as part of its Technology Integration Program. These efforts help businesses and consumers make smarter/more-informed transportation energy choices that can save energy, lower costs, reduce reliance on imported oil, and reduce emissions. This report summarizes the success and impact of coalition activities based on data and information provided in their annual progress reports.
A national network of nearly 100 Clean Cities coalitions, whose territory covers 80% of the U.S. population, brings together stakeholders in the public and private sectors to use alternative and renewable fuels, idle-reduction (IR) measures, fuel economy improvements, and new transportation technologies as they emerge. To ensure success, coalitions leverage a robust set of expert resources and tools provided by national laboratories and DOE. From technical assistance and handbooks to websites and targeted analysis, these resources contribute to every facet of coalition success. This strong national framework of resources, which facilitates consistent vision and informed coalitions, is a hallmark of the program.
Each year, Clean Cities coordinators submit annual reports of their activities and accomplishments for the previous calendar year. Data and information are submitted via an online reporting tool that is maintained as part of the Alternative Fuels Data Center (AFDC) at the National Renewable Energy Laboratory (NREL). Coordinators submit a range of data that characterize the membership, funding, projects, and activities of their coalitions. They also submit data about sales of alternative fuels; use of alternative fuel vehicles (AFVs), plug-in electric vehicles (PEVs), and hybrid electric vehicles (HEVs); IR initiatives; fuel economy improvement activities; and programs to reduce vehicle miles traveled (VMT).
This report compiles the accomplishments of all coalitions throughout the nation in calendar year 2017. Coalition coordinators assembled the data based on voluntary reports from their stakeholders—the private and public entities that are members of the coalitions. As such, each of these coalition reports represents a subset of Clean Cities coalition activities. Taken together, they are an important indicator of how data, information, and resources can be effectively leveraged through the national network of Clean Cities coalitions and stakeholders, to achieve significant results. Accomplishments from the National Clean Fleets Partnership (NCFP) are also reported directly by the national partners.
NREL analyzes the submitted data to determine how broadly energy use in the U.S. has shifted due to coalition activities. The two main components of energy use tracked by NREL are (1) energy savings from efficiency projects, measured in gasoline gallon equivalents (GGE), and (2) alternative fuel use. The alternative fuel use numbers in this report have been adjusted to account for any gasoline or diesel content (e.g., with biodiesel or ethanol blends) as well as for any conventional fuels used upstream to produce, distribute, or deliver alternative fuels. Efficiency
Clean Cities Coalitions use an on-line tool to report advanced vehicle technology activity, infrastructure development, and relevant energy/fuel use information for their regions.
3 This report is available at no cost from the National Renewable Energy Laboratory (NREL) at www.nrel.gov/publications.
differences between AFVs and conventional vehicles are also taken into account1. Ultimately, these two components are combined and reported as Energy Use Impact (EUI) in GGE. The EUI is a metric that measures combined progress in both energy savings from efficiency projects and increased fuel diversity, through use of domestic alternative fuels. Both these components provide consumers and businesses with more energy choices. When achieved at-scale, these strategies support DOE’s mission to pursue more secure, reliable, and affordable energy choices. This report summarizes the EUI as well as the related emission reduction impacts of coalition activities.
A compilation of data from this report, along with reports from previous years, can be accessed on the AFDC’s Maps and Data page (afdc.energy.gov/data/categories/clean-cities). Previous years’ reports can be downloaded in their entirety at www.afdc.energy.gov.
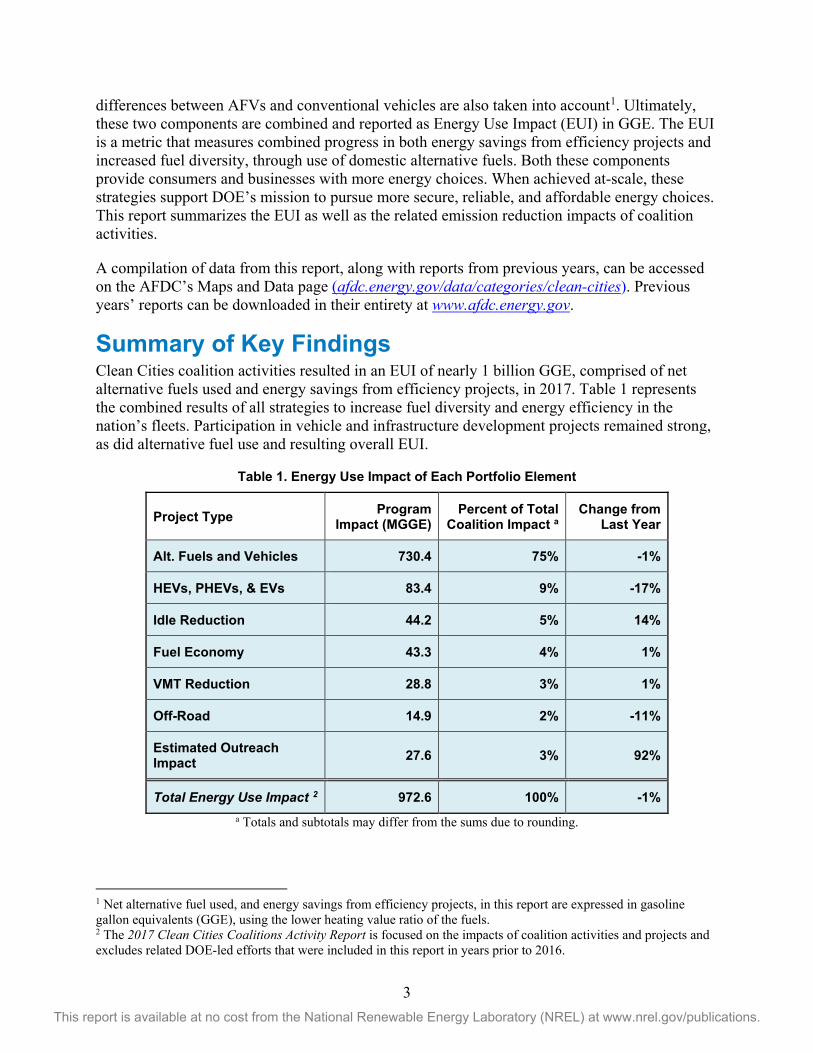
Summary of Key Findings Clean Cities coalition activities resulted in an EUI of nearly 1 billion GGE, comprised of net alternative fuels used and energy savings from efficiency projects, in 2017. Table 1 represents the combined results of all strategies to increase fuel diversity and energy efficiency in the nation’s fleets. Participation in vehicle and infrastructure development projects remained strong, as did alternative fuel use and resulting overall EUI.
Table 1. Energy Use Impact of Each Portfolio Element
Project Type Program Impact (MGGE)
Percent of Total Coalition Impact a
Change from Last Year
Alt. Fuels and Vehicles 730.4 75% -1%
HEVs, PHEVs, & EVs 83.4 9% -17%
Idle Reduction 44.2 5% 14%
Fuel Economy 43.3 4% 1%
VMT Reduction 28.8 3% 1%
Off-Road 14.9 2% -11%
Estimated Outreach Impact 27.6 3% 92%
Total Energy Use Impact 2 972.6 100% -1% a Totals and subtotals may differ from the sums due to rounding.
1 Net alternative fuel used, and energy savings from efficiency projects, in this report are expressed in gasoline gallon equivalents (GGE), using the lower heating value ratio of the fuels. 2 The 2017 Clean Cities Coalitions Activity Report is focused on the impacts of coalition activities and projects and excludes related DOE-led efforts that were included in this report in years prior to 2016.

4 This report is available at no cost from the National Renewable Energy Laboratory (NREL) at www.nrel.gov/publications.
Clean Cities coalition activities reduce emissions as they impact energy use. Table 2 shows coalition-reported activities prevented 4.5 million carbon dioxide-equivalent tons of emissions (only greenhouse gas [GHG] emissions are reported here; criteria pollutants and other emissions are not included in this report).
Table 2. Emissions Reduced by Clean Cities Coalitions in 2017
Project Type Tons of GHG
Emissions Averted
Equivalent of Conventional
Cars Removed a
Percent of Coalition
Total Alternative Fuels and Vehicles 1,909,846 427,492 43%
HEVs 702,854 157,324 16%
Idle Reduction 544,029 121,773 12%
Fuel Economy Improvements 536,346 120,054 12%
VMT Reduction 355,538 79,582 8%
EVs and PHEVs 118,819 26,596 3%
Off-Road Vehicles 108,478 24,281 2%
Outreach Events Estimate 216,835 48,535 5%
Coalition Total 4,492,746 1,005,639 100% a Calculated as total passenger car GHG emissions (Table 2–13 in the U.S. Environmental Protection Agency’s (EPA’s) Inventory of GHG Emissions and Sinks:1990-2015) divided by total short wheelbase light-duty vehicles (Table VM-1 in the Federal Highway Administration’s Highway Statistics, 2015).
Coalitions were successful in securing project grant awards from numerous (non-DOE) outside sources. For other Federal, State, and local agencies and private sector foundations, see project funding section on page 24. The 83 project grant awards in 2017 generated $53.1 million in funds from coalition members and project partners along with $3.9 million in DOE grant funds. Coalitions also collected $1.3 million in stakeholder dues and $4.9 million in operational funds from host organizations. In macro terms, this supplemental funding represents a 2:1 leveraging of the $28.9 million that DOE contributed through grants and operational support in Fiscal Year 2017.
Overall coalition Energy Use Impact of nearly 1 billion GGE is the second highest since the coalitions began reporting in 1994.
5 This report is available at no cost from the National Renewable Energy Laboratory (NREL) at www.nrel.gov/publications.
Clean Cities coordinators spent nearly 122,000 hours pursuing their coalitions’ goals in 2017. The average coordinator is quite experienced and has held his or her position for at least eight years. Coordinators logged more than 3,100 outreach, education, and training activities in 2017, which reached an estimated 10 million people.
Attribution and Fuel Use Factors To clarify the link between coalition activities and end results, this Clean Cities Coalitions Activity Report includes an attribution factor that accounts for the percentage of a project’s outcome that may be due to coalition activities, rather than to the activities of other project participants. This attribution factor was used in the estimates of impacts for fuel economy, VMT reduction, IR, alternative fuel use, and outreach projects. Coordinators estimated the percentage of each project’s outcome that the coalition was responsible for, then the project’s overall outcome was multiplied by that percentage to determine the individual coalition’s impact. Although subjective, this method attempts to address the issue of attribution where a coalition is one of several partners involved in a project. To reduce the subjectivity of this factor, NREL provides a tool to help a coalition estimate its contribution to a given project.
Coalition-Reported Data Coordinators submitted information about their stakeholders’ alternative fuel use and energy savings, broken down according to the technologies in the Technology Integration portfolio, using an on-line reporting tool. NREL analyzed the data, converted it into an equivalent net quantity of gasoline for each element of the portfolio, and reported the data in units of GGE—the amount of energy contained in a gallon of gasoline. As shown in Table 1, about 973 million GGE (MGGE) of energy were impacted through Clean Cities coalition efforts in 2017.
Clean Cities coalitions’ work with local fleets led to a substantial reduction in emissions. To estimate the GHG reductions resulting from Clean Cities coalition activities, NREL used a variation of the GREET model.3 This model accounts for the fuel life-cycle, or “well-to-wheels” factor of GHG emissions for transportation fuels, which includes fuel production, transport, and usage in the vehicle. It does not consider the emissions from indirect land use changes or vehicle manufacturing.
Alternative Fuels and Vehicles As shown in Figure 1, alternative fuels (used in AFVs and in biodiesel blends) and fuel savings from HEVs collectively accounted for approximately 814 million GGE, or 86% of the coalition-reported net alternative fuel use and energy savings from efficiency projects.
3 Argonne National Laboratory. 2015. The Greenhouse gases, Regulated Emissions, and Energy use in Transportation (GREET) Model.
Outreach, education, and training activities in 2017 reached an estimated 10 million people

6 This report is available at no cost from the National Renewable Energy Laboratory (NREL) at www.nrel.gov/publications.
In 2017, coalitions reported a total inventory of over 960,000 AFVs, split among 10 fuel and technology types.
Coordinators reported large increases in some vehicle technologies. The number of vehicles using renewable natural gas (RNG, or bio-methane) grew by 50%. Propane vehicle numbers saw a 47% increase, and HEVs were reported to grow by 37%.
The EUI from RNG use increased 75%. E85, a high-level ethanol blend, EUI increased 21%, despite a reduction in the number of flex fuel vehicles (FFVs) using high-level ethanol blends.
Figure 1 shows the percentage of EUI according to fuel type. Compressed natural gas (CNG) remains at the top of the list, accounting for 52% of the EUI, even though only 10% of the total vehicle population uses CNG. This contrasts with E85, which accounts for only 11% of the alternative fuel vehicle EUI, although 34% of reported AFVs can use E85. This is because most E85-capable vehicles are light duty and use less fuel per vehicle.
Figure 1. 2017 percentage of AFVs, EUI, and emissions reductions by fuel type
The average EUI per vehicle, shown in Table 3, reveals some interesting trends. For a given vehicle, this number is influenced by four factors:
1. Dedicated alternative fuel vehicles (those that can only operate on alternative fuel) have a higher EUI than flex-fuel, dual-fuel, or bi-fuel vehicles that can switch between fuels. Simply stated, dedicated AFVs use alternative fuel 100% of the time, while those with interchangeable fuel systems may only use alternative fuel some of the time.
Alternative fuels and vehicles account for 86% of the Energy Use Impact reported by coalitions in 2017.
7 This report is available at no cost from the National Renewable Energy Laboratory (NREL) at www.nrel.gov/publications.
2. The number of miles per year that the AFV travels (higher mileage uses more alternative fuel).
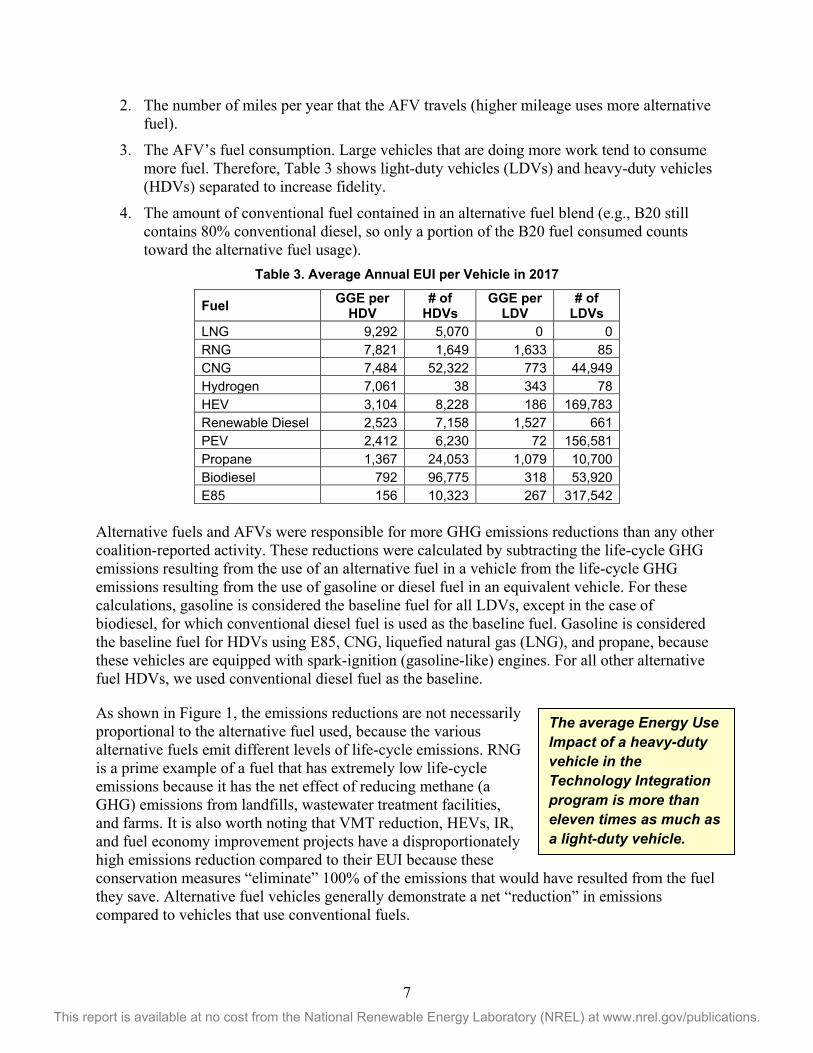
3. The AFV’s fuel consumption. Large vehicles that are doing more work tend to consume more fuel. Therefore, Table 3 shows light-duty vehicles (LDVs) and heavy-duty vehicles (HDVs) separated to increase fidelity.
4. The amount of conventional fuel contained in an alternative fuel blend (e.g., B20 still contains 80% conventional diesel, so only a portion of the B20 fuel consumed counts toward the alternative fuel usage).
Table 3. Average Annual EUI per Vehicle in 2017
Fuel GGE per HDV
# of HDVs
GGE per LDV
# of LDVs
LNG 9,292 5,070 0 0 RNG 7,821 1,649 1,633 85 CNG 7,484 52,322 773 44,949 Hydrogen 7,061 38 343 78 HEV 3,104 8,228 186 169,783 Renewable Diesel 2,523 7,158 1,527 661 PEV 2,412 6,230 72 156,581 Propane 1,367 24,053 1,079 10,700 Biodiesel 792 96,775 318 53,920 E85 156 10,323 267 317,542
Alternative fuels and AFVs were responsible for more GHG emissions reductions than any other coalition-reported activity. These reductions were calculated by subtracting the life-cycle GHG emissions resulting from the use of an alternative fuel in a vehicle from the life-cycle GHG emissions resulting from the use of gasoline or diesel fuel in an equivalent vehicle. For these calculations, gasoline is considered the baseline fuel for all LDVs, except in the case of biodiesel, for which conventional diesel fuel is used as the baseline fuel. Gasoline is considered the baseline fuel for HDVs using E85, CNG, liquefied natural gas (LNG), and propane, because these vehicles are equipped with spark-ignition (gasoline-like) engines. For all other alternative fuel HDVs, we used conventional diesel fuel as the baseline.
As shown in Figure 1, the emissions reductions are not necessarily proportional to the alternative fuel used, because the various alternative fuels emit different levels of life-cycle emissions. RNG is a prime example of a fuel that has extremely low life-cycle emissions because it has the net effect of reducing methane (a GHG) emissions from landfills, wastewater treatment facilities, and farms. It is also worth noting that VMT reduction, HEVs, IR, and fuel economy improvement projects have a disproportionately high emissions reduction compared to their EUI because these conservation measures “eliminate” 100% of the emissions that would have resulted from the fuel they save. Alternative fuel vehicles generally demonstrate a net “reduction” in emissions compared to vehicles that use conventional fuels.
The average Energy Use Impact of a heavy-duty vehicle in the Technology Integration program is more than eleven times as much as a light-duty vehicle.
8 This report is available at no cost from the National Renewable Energy Laboratory (NREL) at www.nrel.gov/publications.
High Impact Fleets and Vehicle Segments - Although heavy-duty vehicles represented only 22% of the reported AFVs, these HDVs are responsible for 76% of the alternative fuel use. The average HDV that operates on alternative fuels impacts 11.5 times as much fuel use as the average LDV. Likewise, the overwhelming majority of renewable diesel, hydrogen, CNG, RNG, and biodiesel is used by HDVs (95%, 91%, 92%, 99%, and 82%, respectively). The use of LNG is confined exclusively to HDVs, and HDVs accounted for 74% of all propane use. Contributions from PEVs were more evenly split between LDVs and HDVs (43% and 57%, respectively). The only technology whose contributions were dominated by LDVs was E85 (with only 2% from HDVs). For HEVs, 55% of the EUI impact was from LDVs.
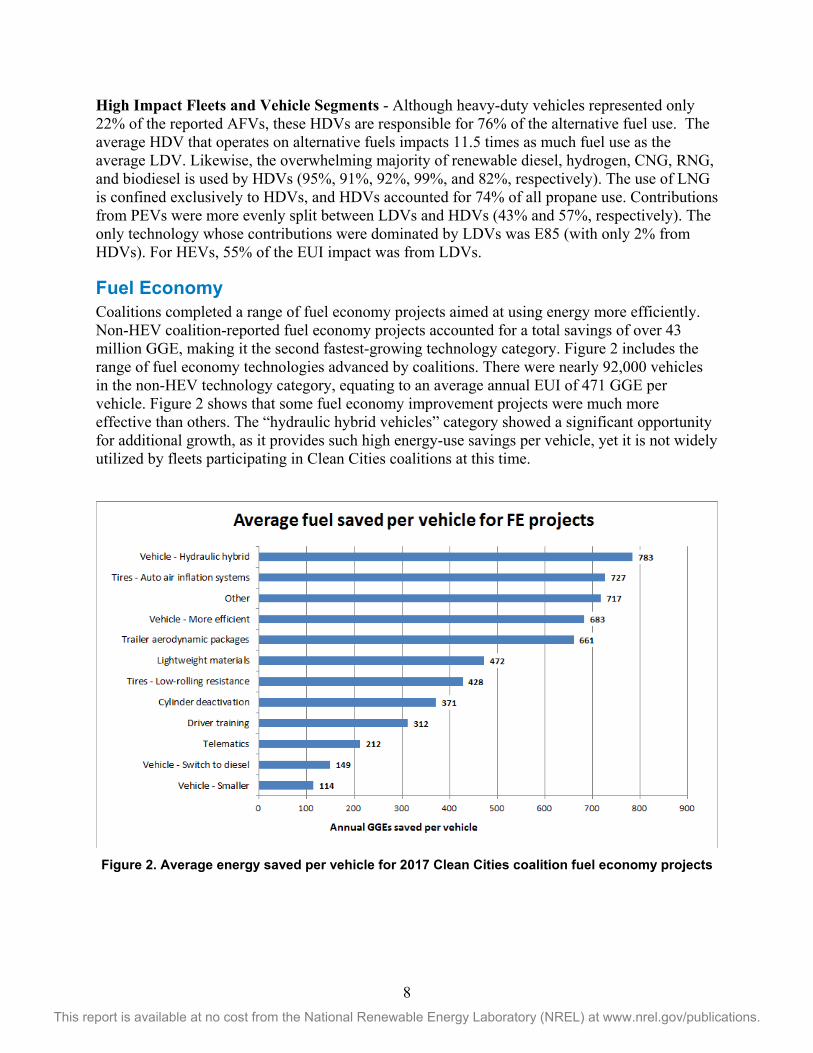
Fuel Economy Coalitions completed a range of fuel economy projects aimed at using energy more efficiently. Non-HEV coalition-reported fuel economy projects accounted for a total savings of over 43 million GGE, making it the second fastest-growing technology category. Figure 2 includes the range of fuel economy technologies advanced by coalitions. There were nearly 92,000 vehicles in the non-HEV technology category, equating to an average annual EUI of 471 GGE per vehicle. Figure 2 shows that some fuel economy improvement projects were much more effective than others. The “hydraulic hybrid vehicles” category showed a significant opportunity for additional growth, as it provides such high energy-use savings per vehicle, yet it is not widely utilized by fleets participating in Clean Cities coalitions at this time.
Figure 2. Average energy saved per vehicle for 2017 Clean Cities coalition fuel economy projects

9 This report is available at no cost from the National Renewable Energy Laboratory (NREL) at www.nrel.gov/publications.
Vehicle Miles Traveled Reduction VMT-reduction projects save fuel and therefore money, while simultaneously curbing emissions. These types of projects include strategies such as carpooling, biking, teleworking, and public transportation. Sixty-eight of the 84 reporting coalitions (81%) reported at least one VMT-reduction project in 2017, with a total of 388 projects reported. VMT projects are generally outside the scope of advanced vehicle, fuel, and systems research addressed by VTO. Since the primary purpose of this report is to analyze and document the impact of Clean Cities coalition efforts related to VTO technologies, the contribution of VMT projects is limited to 10% of any given coalition’s total energy savings. This cap affected 19 coalitions; however, even with this limit in place, coalitions saved 28.8 million GGE of fuel with VMT activities. The project types, numbers, and sizes of the VMT projects are shown in Table 4.
Table 4. VMT-Reduction Project Types, Number, and Energy Savings in 2017
Project Type Number of Projects
Increase in # of Projects
over 2016
GGE Saved per
Project a
DOE-claimed GGE Saved per
Project Carpooling 75 -1 181,925 79,347 Mass transit 73 4 239,276 132,555 Route Optimization 69 6 303,302 95,842 Non-motorized locomotion (e.g., bicycles) 53 -13 19,973 18,474 Other 37 -17 90,306 45,089 Telecommute 27 1 19,275 17,668 Car sharing (e.g., Zipcar) 22 -1 17,262 14,515 Vanpooling 17 7 306,229 182,090 Compressed work week 15 3 3,128 3,004 Total 388 -11 161,320a 74,291
a GGE per project calculated before the 10% limit of coalition overall energy savings was implemented.
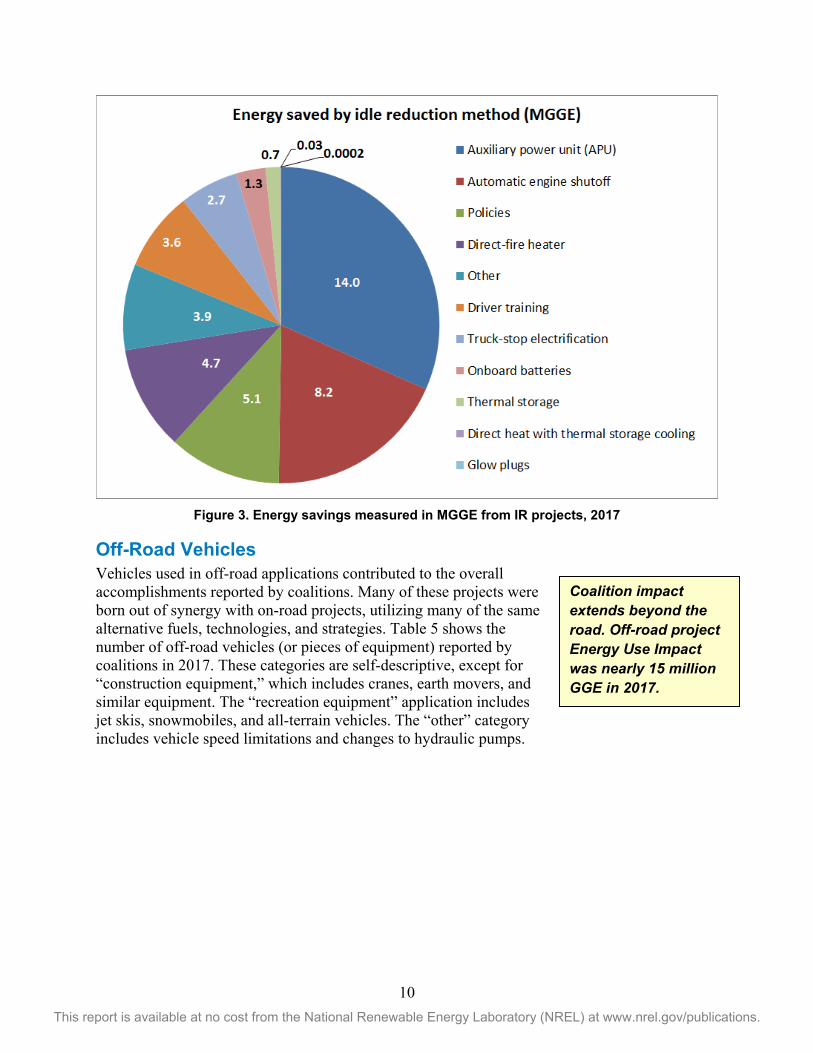
Idle Reduction The estimated energy savings in 2017 for IR technologies and policies was 44 million GGE. The number of IR projects decreased 4% in 2017, yet the quantity of energy that these projects saved increased 14%. As shown in Figure 3, at 14 million GGE, auxiliary power units were responsible for the greatest percentage (32%) of energy savings. Automatic engine shutoff, at 8.2 million GGE; IR policies, at 5.1 million GGE; and direct-fire heaters, at 4.7 million GGE, followed with significant percentages (19%, 12%, and 11%, respectively). The “other” category, at 3.9 million GGE; driver training, at 3.6 million GGE; and truck-stop electrification, at 2.7 million GGE, had similar impacts (9%, 8%, and 6% respectively). The remaining methods combined to represent 5% of the total savings.
The average Idle Reduction project saved more energy in 2017 than in 2016.
10 This report is available at no cost from the National Renewable Energy Laboratory (NREL) at www.nrel.gov/publications.
Figure 3. Energy savings measured in MGGE from IR projects, 2017
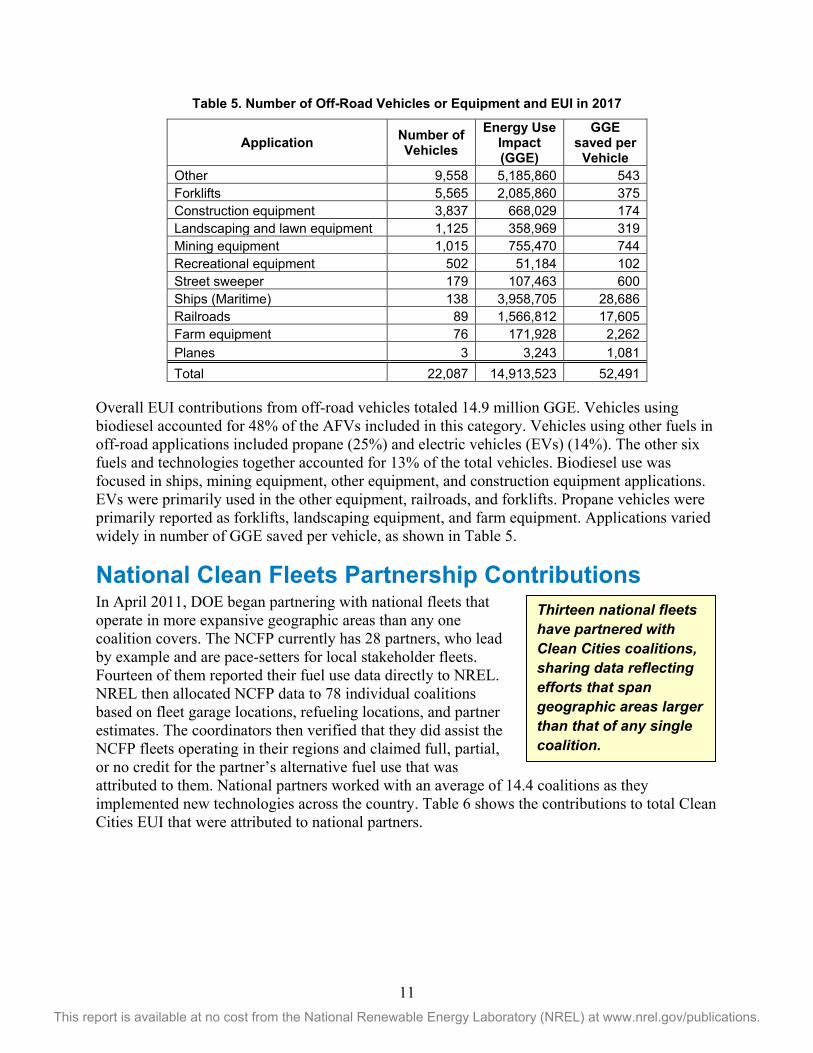
Off-Road Vehicles Vehicles used in off-road applications contributed to the overall accomplishments reported by coalitions. Many of these projects were born out of synergy with on-road projects, utilizing many of the same alternative fuels, technologies, and strategies. Table 5 shows the number of off-road vehicles (or pieces of equipment) reported by coalitions in 2017. These categories are self-descriptive, except for “construction equipment,” which includes cranes, earth movers, and similar equipment. The “recreation equipment” application includes jet skis, snowmobiles, and all-terrain vehicles. The “other” category includes vehicle speed limitations and changes to hydraulic pumps.
Coalition impact extends beyond the road. Off-road project Energy Use Impact was nearly 15 million GGE in 2017.
11 This report is available at no cost from the National Renewable Energy Laboratory (NREL) at www.nrel.gov/publications.
Table 5. Number of Off-Road Vehicles or Equipment and EUI in 2017
Application Number of Vehicles
Energy Use Impact (GGE)
GGE saved per
Vehicle Other 9,558 5,185,860 543 Forklifts 5,565 2,085,860 375 Construction equipment 3,837 668,029 174 Landscaping and lawn equipment 1,125 358,969 319 Mining equipment 1,015 755,470 744 Recreational equipment 502 51,184 102 Street sweeper 179 107,463 600 Ships (Maritime) 138 3,958,705 28,686 Railroads 89 1,566,812 17,605 Farm equipment 76 171,928 2,262 Planes 3 3,243 1,081 Total 22,087 14,913,523 52,491
Overall EUI contributions from off-road vehicles totaled 14.9 million GGE. Vehicles using biodiesel accounted for 48% of the AFVs included in this category. Vehicles using other fuels in off-road applications included propane (25%) and electric vehicles (EVs) (14%). The other six fuels and technologies together accounted for 13% of the total vehicles. Biodiesel use was focused in ships, mining equipment, other equipment, and construction equipment applications. EVs were primarily used in the other equipment, railroads, and forklifts. Propane vehicles were primarily reported as forklifts, landscaping equipment, and farm equipment. Applications varied widely in number of GGE saved per vehicle, as shown in Table 5.
National Clean Fleets Partnership Contributions In April 2011, DOE began partnering with national fleets that operate in more expansive geographic areas than any one coalition covers. The NCFP currently has 28 partners, who lead by example and are pace-setters for local stakeholder fleets. Fourteen of them reported their fuel use data directly to NREL. NREL then allocated NCFP data to 78 individual coalitions based on fleet garage locations, refueling locations, and partner estimates. The coordinators then verified that they did assist the NCFP fleets operating in their regions and claimed full, partial, or no credit for the partner’s alternative fuel use that was attributed to them. National partners worked with an average of 14.4 coalitions as they implemented new technologies across the country. Table 6 shows the contributions to total Clean Cities EUI that were attributed to national partners.
Thirteen national fleets have partnered with Clean Cities coalitions, sharing data reflecting efforts that span geographic areas larger than that of any single coalition.

12 This report is available at no cost from the National Renewable Energy Laboratory (NREL) at www.nrel.gov/publications.
Table 6. Vehicles, EUI, and Emissions Reduction from National Partners
Fuel Vehicles Energy Use
Impact (GGE)
GHG Reduced
(tons) CNG 22,945 132,665,783 113,951 LNG 1,942 35,984,342 36,092 Fuel Economy 27,154 15,742,801 195,208 Propane 3,896 10,989,259 4,308 PEV 5,585 9,322,498 37,747 Biodiesel 2,157 8,646,280 75,734 HEV 2,248 4,497,224 55,396 Renewable Diesel 485 964,682 8,450 Idle Reduction 5,218 359,834 4,462 Hydrogen 15 100,588 403 E85 2,466 33,571 123 Off-Road 357 6,359 23 TOTAL 74,468 219,313,221 531,896
Estimated Contributions from Outreach Activities This category measures impact from behavior changes such as vehicle purchases, fuel choice, driving habits, vehicle maintenance, and transportation patterns that were influenced by coalition outreach activities. Calculating these contributions involves a fair degree of uncertainty, but it is nevertheless important to quantify the impacts of educational and outreach activities as much as possible. Not doing so would imply that these activities had no impact, which is inaccurate. This section outlines our approach and provides the results.
Methods Used to Estimate Energy Use Impact from Outreach Activities To estimate net alternative fuel use and emission reductions from outreach events, NREL and Oak Ridge National Laboratory (ORNL) developed the Behavioral Impact Model (BIM) and added related functionality to the Clean Cities coalition annual reporting tool to make it compatible with the BIM.
Clean Cities coordinators reported the type of outreach event, the number of people reached by each event, the technologies presented, and the percent that should be attributed to the coalition. To determine the number of people reached by a given event, the total number of people attending the event was multiplied by the percent of the event that the coalition claimed credit for. When multiple technologies were presented at a given event, the annual report assumed the number of people reached to be divided evenly among the technologies. These data are then entered into the BIM as “persons reached by the coalition about a given technology.”
Impacts from coalition outreach events are estimated using standard analytical methods derived from advertising and marketing industries.

13 This report is available at no cost from the National Renewable Energy Laboratory (NREL) at www.nrel.gov/publications.
The BIM multiplies this persons-reached number by the probability a person will take an action as a result of the outreach (defined as purchasing an AFV or more efficient vehicle, or as changing driving or fueling behavior). This probability is derived by comparing the outreach event and technology to comparable marketing media and products. Ten of these media-product combinations have a “customer conversion rate” that is recorded by various marketing firms, as shown in Table 7. The customer conversion rate is the ratio of purchases made (desired action) divided by the total number of people contacted through the outreach activity. The code column in Table 7 is provided for trackability through the calculation process, as continued to Table 9.
Table 7. Benchmark Customer Conversion Rates and Their Sources
Code Benchmark Conversion Rate Reference
1 0.6% for electronics (expensive, complicated) websites Fireclick.com, accessed June 16, 2011
2 1.3% for environmentally related, incremental cost purchase
Bird, Lori. 2004. Utility Green Pricing Programs: Design, Implementation, and Consumer Response
3 2% for common websites and website ads
Nielsen and Facebook, 2010. Advertising Effectiveness: Understanding the Value of a Social Media Impression. And Fireclick.com, accessed June 16, 2011
4 2.5% for industry-specific mail Direct Marketing Association (DMA). 2011
5 3.2% for email Fireclick.com, accessed June 16, 2011
6 7% for affiliates and 8% for “social ads” that are endorsed by peers
Fireclick.com, accessed June 16, 2011. Nielsen and Facebook, 2010. Advertising Effectiveness: Understanding the Value of a Social Media Impression.
7 0.6% AdMeasure product: LDVs GfK Mediamark Research & Intelligence, LLC. 2011
8 5.5% AdMeasure product: Gasoline GfK Mediamark Research & Intelligence, LLC. 2011
9 17% AdMeasure smoking cessation “actions taken”
GfK Mediamark Research & Intelligence, LLC. 2011
10 2% for direct mail to current customers Eisenberg, B. “The Average Conversion Rate: Is it a Myth?” ClickZ. February 1, 2008
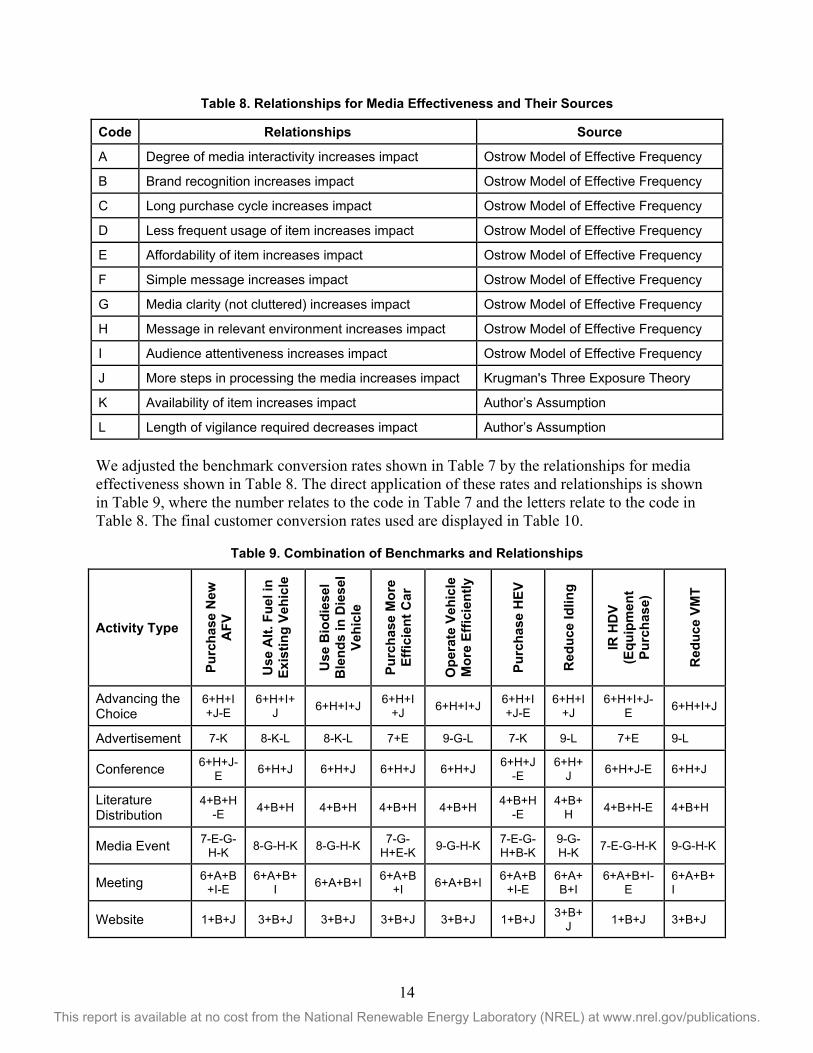
For activity-type/audience-action combinations that were not directly addressed by research, NREL adjusted the customer conversion rates based on the Ostrow Model of Effective Frequency, Krugman’s Three Exposure Theory, and the authors’ assumptions. Table 8 lists a set of relationships that increase or decrease the impact of advertisements.
14 This report is available at no cost from the National Renewable Energy Laboratory (NREL) at www.nrel.gov/publications.
Table 8. Relationships for Media Effectiveness and Their Sources
Code Relationships Source
A Degree of media interactivity increases impact Ostrow Model of Effective Frequency
B Brand recognition increases impact Ostrow Model of Effective Frequency
C Long purchase cycle increases impact Ostrow Model of Effective Frequency
D Less frequent usage of item increases impact Ostrow Model of Effective Frequency
E Affordability of item increases impact Ostrow Model of Effective Frequency
F Simple message increases impact Ostrow Model of Effective Frequency
G Media clarity (not cluttered) increases impact Ostrow Model of Effective Frequency
H Message in relevant environment increases impact Ostrow Model of Effective Frequency
I Audience attentiveness increases impact Ostrow Model of Effective Frequency
J More steps in processing the media increases impact Krugman's Three Exposure Theory
K Availability of item increases impact Author’s Assumption
L Length of vigilance required decreases impact Author’s Assumption
We adjusted the benchmark conversion rates shown in Table 7 by the relationships for media effectiveness shown in Table 8. The direct application of these rates and relationships is shown in Table 9, where the number relates to the code in Table 7 and the letters relate to the code in Table 8. The final customer conversion rates used are displayed in Table 10.
Table 9. Combination of Benchmarks and Relationships
Activity Type
Purc
hase
New
A
FV
Use
Alt.
Fue
l in
Exis
ting
Vehi
cle
Use
Bio
dies
el
Ble
nds
in D
iese
l Ve
hicl
e
Purc
hase
Mor
e Ef
ficie
nt C
ar
Ope
rate
Veh
icle
M
ore
Effic
ient
ly
Purc
hase
HEV
Red
uce
Idlin
g
IR H
DV
(Equ
ipm
ent
Purc
hase
)
Red
uce
VMT
Advancing the Choice
6+H+I+J-E
6+H+I+J 6+H+I+J 6+H+I
+J 6+H+I+J 6+H+I+J-E
6+H+I+J
6+H+I+J-E 6+H+I+J
Advertisement 7-K 8-K-L 8-K-L 7+E 9-G-L 7-K 9-L 7+E 9-L
Conference 6+H+J-E 6+H+J 6+H+J 6+H+J 6+H+J 6+H+J
-E 6+H+
J 6+H+J-E 6+H+J
Literature Distribution
4+B+H-E 4+B+H 4+B+H 4+B+H 4+B+H 4+B+H
-E 4+B+
H 4+B+H-E 4+B+H
Media Event 7-E-G-H-K 8-G-H-K 8-G-H-K 7-G-
H+E-K 9-G-H-K 7-E-G-H+B-K
9-G-H-K 7-E-G-H-K 9-G-H-K
Meeting 6+A+B+I-E
6+A+B+I 6+A+B+I 6+A+B
+I 6+A+B+I 6+A+B+I-E
6+A+B+I
6+A+B+I-E
6+A+B+I
Website 1+B+J 3+B+J 3+B+J 3+B+J 3+B+J 1+B+J 3+B+J 1+B+J 3+B+J

15 This report is available at no cost from the National Renewable Energy Laboratory (NREL) at www.nrel.gov/publications.
Table 10. Customer Conversion Rates Used in the BIM
Activity Type
Purc
hase
New
AFV
Use
Alte
rnat
ive
Fuel
in
Exis
ting
Vehi
cle
Use
Bio
dies
el B
lend
s in
D
iese
l Veh
icle
Purc
hase
Mor
e Ef
ficie
nt
Car
Ope
rate
Veh
icle
M
ore
Effic
ient
ly
Purc
hase
HEV
Red
uce
Idlin
g
HD
V IR
Equ
ipm
ent
Purc
hase
Red
uce
VMT
Advancing the Choice 2.0% 6.0% 6.0% 5.0% 7.0% 2.0% 5.0% 4.0% 8.0%
Advertisement 0.6% 5.5% 5.5% 2.0% 10.0% 2.0% 10.0% 3.0% 4.0%
Conference 2.0% 6.0% 6.0% 5.0% 7.0% 2.0% 5.0% 4.0% 8.0%
Literature Distribution 2.0% 3.0% 3.0% 2.5% 3.0% 2.5% 3.0% 2.5% 5.0%
Media Event 0.6% 2.5% 3.0% 1.2% 3.0% 1.2% 4.0% 2.0% 2.0%
Meeting—Other 2.0% 7.0% 6.0% 5.0% 7.0% 2.0% 5.0% 4.0% 8.0%
Website 2.0% 4.0% 3.0% 3.0% 4.0% 3.0% 3.0% 3.0% 3.0%
The number of people reached multiplied by the appropriate customer conversion rate (from Table 10) results in the number of people assumed to take the intended action. After the conversion factors have been applied, the BIM is like the Clean Cities coalition annual reporting tool, as it converts the estimated number of vehicles purchased or number of people changing their driving habits into an EUI. We make downward adjustments of 30%–40% to the estimates to account for probable overlaps between audiences attending outreach events and entities reporting their own petroleum savings via a Clean Cities coalition. We apply the estimated petroleum savings only to the reporting year in question, even though many of the vehicle purchases and behavioral changes will likely last beyond that year.
Estimated Outreach Accomplishments Coalitions’ outreach, education, and training activities were classified into nine categories, as shown in Table 11. A total of 3,161 activity days were reported, which were estimated to have reached more than 10 million people. The average size of events increased from last year—from 1,413 persons per event to 3,249. The estimated number of people reached through advertisements and websites increased enormously in 2017. Media events continued to be the activity that reached the most people (4.3 million).

16 This report is available at no cost from the National Renewable Energy Laboratory (NREL) at www.nrel.gov/publications.
Table 11. Outreach, Education, and Training Activities
Activity type
Number of
Activities
Share of total
activities
Activities increase
since 2016
Persons reached
Share of total
persons reached
Persons increase
since 2016
Meeting - Other 739 23.4% -28% 713,641 6.9% 425% Meeting - Stakeholder 666 21.1% 7% 18,498 0.2% 37% Conference participation 631 20.0% 22% 700,921 6.8% 22% Workshop held by coalition 321 10.2% -2% 41,617 0.4% -56% Literature Distribution 299 9.5% -44% 588,839 5.7% 34% Media Event 230 7.3% -19% 4,343,990 42.3% 43% Social Media 208 6.6% 41% 87,054 0.8% -21% Advertisement 44 1.4% -61% 1,674,565 16.3% 189% Website 23 0.7% -28% 2,101,369 20.5% 1781% TOTAL 3,161 100.0% -12% 10,270,494 100.0% 101%
Figure 4 illustrates the types of audiences reached through the 3,161 outreach activities. Each activity could be aimed at multiple audiences; in fact, each activity targeted an average of 3.8 different audiences. Government fleets were the most-cited target audience, followed by the general public and private fleets. Utility trucks, mass transit, and the other audience groups were reached by similar percentages of activities. Delivery trucks, waste management, and airports were identified as audiences in less than 30% of the outreach activities. The composition of outreach activities was consistent with 2016.
Figure 4. Percentage of outreach activities reaching each audience type
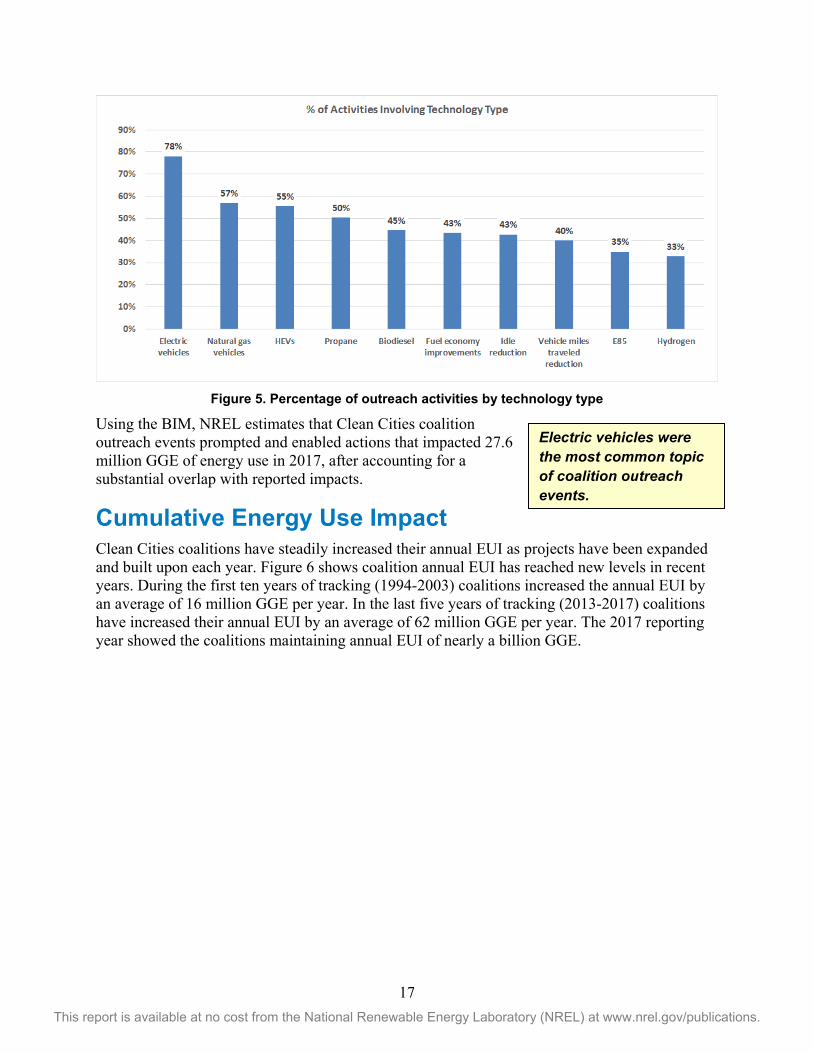
Coalitions’ outreach events featured a relatively even mix of technologies, as illustrated in Figure 5, but EVs were covered more than any of the other technology types. Just as with audience types, any one activity could address more than one technology; each activity featured an average of 4.8 different technologies.
17 This report is available at no cost from the National Renewable Energy Laboratory (NREL) at www.nrel.gov/publications.
Figure 5. Percentage of outreach activities by technology type
Using the BIM, NREL estimates that Clean Cities coalition outreach events prompted and enabled actions that impacted 27.6 million GGE of energy use in 2017, after accounting for a substantial overlap with reported impacts.
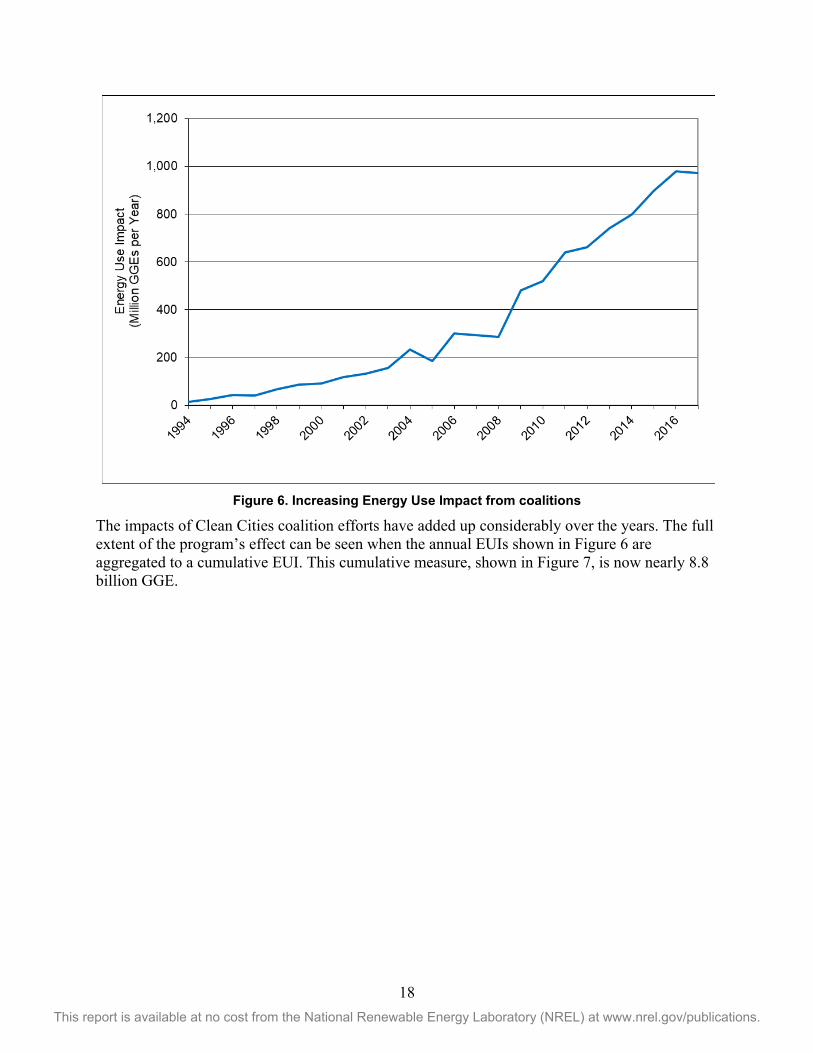
Cumulative Energy Use Impact Clean Cities coalitions have steadily increased their annual EUI as projects have been expanded and built upon each year. Figure 6 shows coalition annual EUI has reached new levels in recent years. During the first ten years of tracking (1994-2003) coalitions increased the annual EUI by an average of 16 million GGE per year. In the last five years of tracking (2013-2017) coalitions have increased their annual EUI by an average of 62 million GGE per year. The 2017 reporting year showed the coalitions maintaining annual EUI of nearly a billion GGE.
Electric vehicles were the most common topic of coalition outreach events.
18 This report is available at no cost from the National Renewable Energy Laboratory (NREL) at www.nrel.gov/publications.
Figure 6. Increasing Energy Use Impact from coalitions
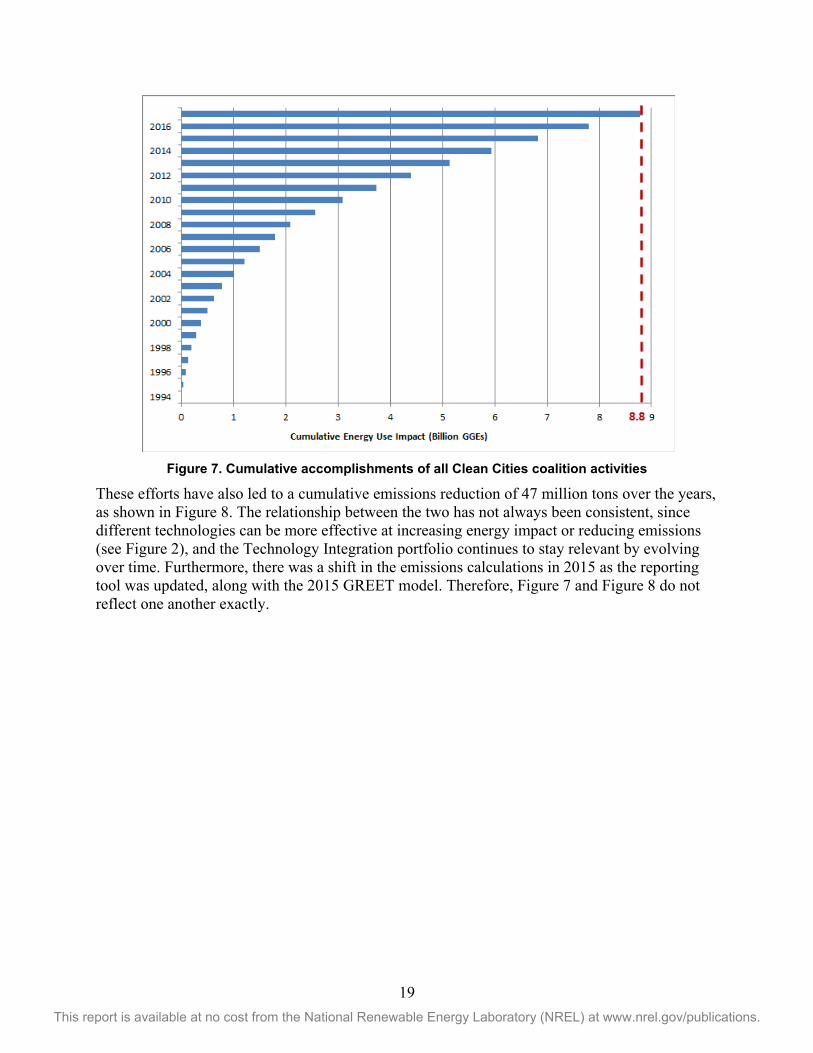
The impacts of Clean Cities coalition efforts have added up considerably over the years. The full extent of the program’s effect can be seen when the annual EUIs shown in Figure 6 are aggregated to a cumulative EUI. This cumulative measure, shown in Figure 7, is now nearly 8.8 billion GGE.
19 This report is available at no cost from the National Renewable Energy Laboratory (NREL) at www.nrel.gov/publications.
Figure 7. Cumulative accomplishments of all Clean Cities coalition activities
These efforts have also led to a cumulative emissions reduction of 47 million tons over the years, as shown in Figure 8. The relationship between the two has not always been consistent, since different technologies can be more effective at increasing energy impact or reducing emissions (see Figure 2), and the Technology Integration portfolio continues to stay relevant by evolving over time. Furthermore, there was a shift in the emissions calculations in 2015 as the reporting tool was updated, along with the 2015 GREET model. Therefore, Figure 7 and Figure 8 do not reflect one another exactly.

20 This report is available at no cost from the National Renewable Energy Laboratory (NREL) at www.nrel.gov/publications.
Figure 8. Cumulative emissions reductions from all Clean Cities coalition activities
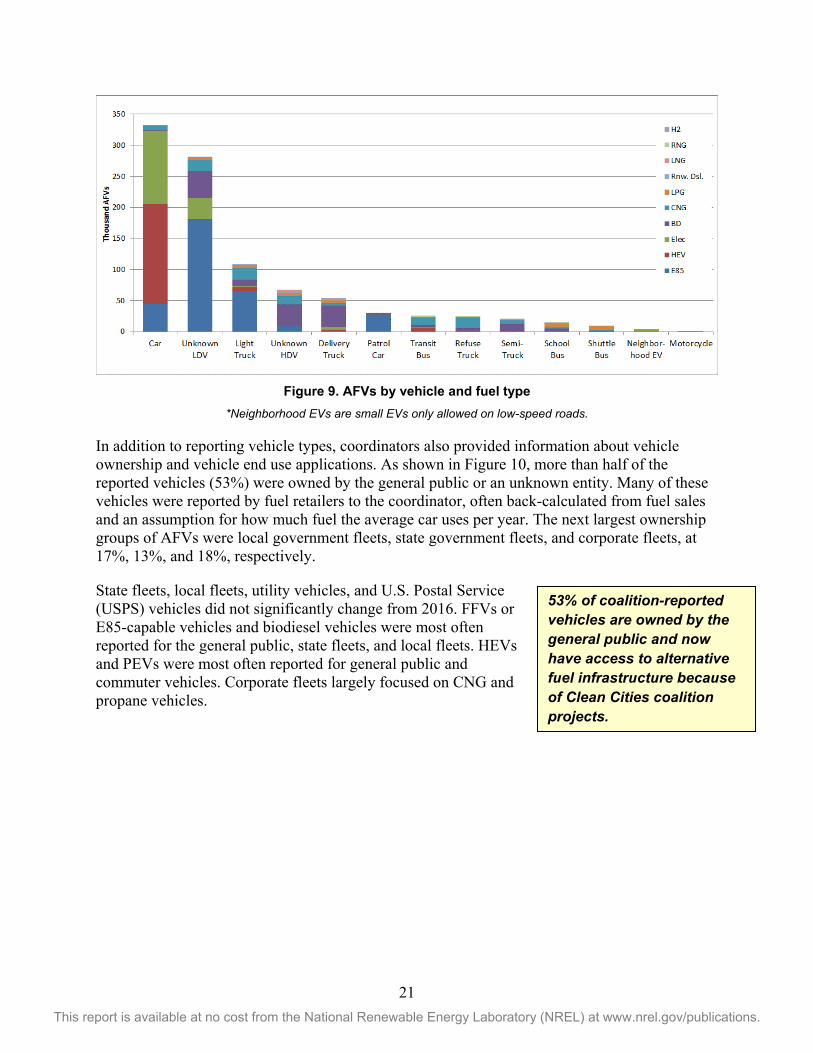
Alternative Fuel Vehicle Types and Applications The online reporting tool allows coordinators to categorize their AFVs into key vehicle types and fleet applications. Figure 9 shows that the largest portion (34%) of AFVs were cars. Unknown LDVs, which are usually vehicles reported in conjunction with a Clean Cities coalition-supported fueling station, were the second most reported vehicle type (29%). Light trucks/vans/sport utility vehicles represented 11% of vehicles. Unknown HDVs, typically reported in conjunction with public biodiesel fueling stations, accounted for 7% of vehicles, while heavy duty trucks without trailers, or delivery trucks, accounted for 6%. All remaining categories individually accounted for 3% or less of the vehicle population.
E85 LDVs were the most frequently reported fuel/vehicle combination. E85 vehicles in the unknown light-duty segment (180,000 vehicles), the car segment (45,000 vehicles), the light trucks/vans/sport utility vehicles segment (65,000 vehicles), and the patrol car segment (27,000 vehicles) together comprised 33% of all vehicles.
21 This report is available at no cost from the National Renewable Energy Laboratory (NREL) at www.nrel.gov/publications.
Figure 9. AFVs by vehicle and fuel type
*Neighborhood EVs are small EVs only allowed on low-speed roads.
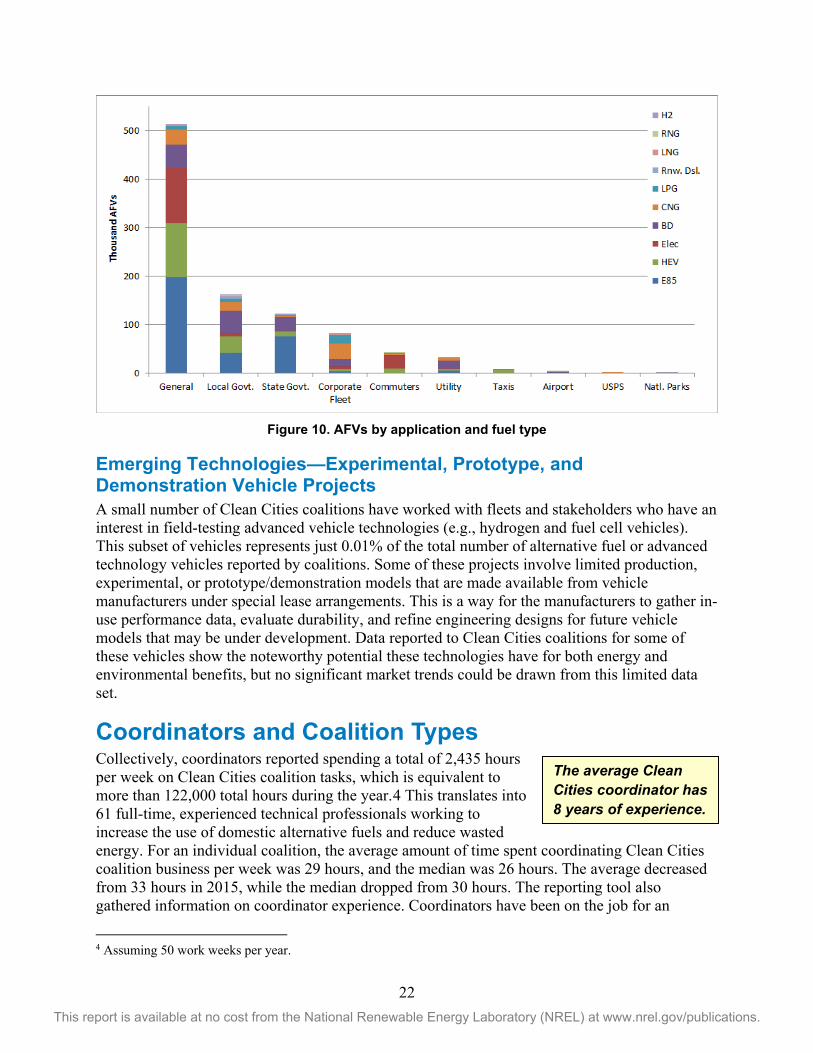
In addition to reporting vehicle types, coordinators also provided information about vehicle ownership and vehicle end use applications. As shown in Figure 10, more than half of the reported vehicles (53%) were owned by the general public or an unknown entity. Many of these vehicles were reported by fuel retailers to the coordinator, often back-calculated from fuel sales and an assumption for how much fuel the average car uses per year. The next largest ownership groups of AFVs were local government fleets, state government fleets, and corporate fleets, at 17%, 13%, and 18%, respectively.
State fleets, local fleets, utility vehicles, and U.S. Postal Service (USPS) vehicles did not significantly change from 2016. FFVs or E85-capable vehicles and biodiesel vehicles were most often reported for the general public, state fleets, and local fleets. HEVs and PEVs were most often reported for general public and commuter vehicles. Corporate fleets largely focused on CNG and propane vehicles.
53% of coalition-reported vehicles are owned by the general public and now have access to alternative fuel infrastructure because of Clean Cities coalition projects.
22 This report is available at no cost from the National Renewable Energy Laboratory (NREL) at www.nrel.gov/publications.
Figure 10. AFVs by application and fuel type
Emerging Technologies—Experimental, Prototype, and Demonstration Vehicle Projects A small number of Clean Cities coalitions have worked with fleets and stakeholders who have an interest in field-testing advanced vehicle technologies (e.g., hydrogen and fuel cell vehicles). This subset of vehicles represents just 0.01% of the total number of alternative fuel or advanced technology vehicles reported by coalitions. Some of these projects involve limited production, experimental, or prototype/demonstration models that are made available from vehicle manufacturers under special lease arrangements. This is a way for the manufacturers to gather in-use performance data, evaluate durability, and refine engineering designs for future vehicle models that may be under development. Data reported to Clean Cities coalitions for some of these vehicles show the noteworthy potential these technologies have for both energy and environmental benefits, but no significant market trends could be drawn from this limited data set.
Coordinators and Coalition Types Collectively, coordinators reported spending a total of 2,435 hours per week on Clean Cities coalition tasks, which is equivalent to more than 122,000 total hours during the year.4 This translates into 61 full-time, experienced technical professionals working to increase the use of domestic alternative fuels and reduce wasted energy. For an individual coalition, the average amount of time spent coordinating Clean Cities coalition business per week was 29 hours, and the median was 26 hours. The average decreased from 33 hours in 2015, while the median dropped from 30 hours. The reporting tool also gathered information on coordinator experience. Coordinators have been on the job for an
4 Assuming 50 work weeks per year.
The average Clean Cities coordinator has 8 years of experience.

23 This report is available at no cost from the National Renewable Energy Laboratory (NREL) at www.nrel.gov/publications.
average of 8 years. Forty-four percent of coordinators have held their position for 5 years or less. Thirty-seven percent, or 31 coordinators, have 10 years or more of experience coordinating.
Coalition types were tracked, and the relationships between coalition type and general metrics were analyzed. The coalition types correspond to their host organizations (which generally pay the coordinator’s salary) and are listed in the first column in Table 12 and defined in Appendix B. Standalone nonprofits are coalition types that are self-sustaining and do not operate as part of a larger host organization.
The number of coalitions in each grouping is listed in the second column of Table 12, followed by metrics such as the average number of stakeholders, average funds (including grants and dues) received in 2017, the average GGE of energy impacted, and the average number of persons reached through outreach events. The range of all metrics overlaps heavily between groups, and the low sample size precludes statistical significance. Furthermore, many variables affecting the metrics in this table were not controlled for, so no cause/effect relationships can be inferred between coalition type and specific metrics.
Coalitions that reported the highest number of stakeholders tended to be standalone nonprofits, while those reporting the fewest stakeholders were hosted by city and county governments. Coalitions that raised the most funds on average were hosted by city or county governments. Coalitions that brought in the least amount of funding were generally based at universities. Standalone nonprofit coalitions also tended to have the greatest EUI, on average. Coalitions that reached the most people in outreach events were generally from regional governing coalitions, such as metropolitan planning organizations. Coalitions hosted by nonprofits had the lowest total EUI, and coalitions hosted by city or county governments reached the fewest people.
Table 12. Coalition Metrics by Coalition Type
Coalition Type a Total # of Coalitions
Average # of Stakeholders
Average Funds Raised
Average Program Impact (GGE)
Average Persons Reached
Nonprofit - Standalone 32 188 $1,539,415 13,353,007 48,442 Regional Governing Coalition 17 134 $1,731,500 9,123,470 347,749 Nonprofit - Hosted 14 105 $1,886,835 5,471,144 173,727 Government - State 9 169 $2,214,849 5,575,963 27,976 Government - City or County 7 86 $11,795,118 13,151,922 3,508 University 5 135 $550,254 6,504,591 20,016 Total/Overall Weighted Average 84 149 $2,504,324 9,925,730 122,268
a Coalition types are defined in Appendix B.
Coalitions based in standalone nonprofits were the most successful in terms of Energy Use Impact and raising funds, but those based in regional governing bodies were the most successful at outreach.

24 This report is available at no cost from the National Renewable Energy Laboratory (NREL) at www.nrel.gov/publications.
Funding In 2017, 42 coalitions reported receiving 83 new project awards (project-specific grants) worth a total of $31 million. These coalitions also reported garnering $26 million in leveraged or matching funds for a combined total of $57 million in new grant and matching contributions. The value of 10 of the 83 awards met or exceeded $1 million each. Table 13 presents a breakdown of the number and value of awards reported by the coalitions.
Table 13. Breakdown of 2017 Project Awards by Number and Value
Grant Range Number of
Grants Share of
Total Number Total Value Share of Grand
Total Value <$50,000 41 49% $709,087 2% $50,000 - $99,999 13 16% $963,735 3% $100,000 - $499,999 15 18% $3,351,450 11% $500,000 - $999,999 4 5% $2,643,525 8% $1,000,000 + 10 12% $23,460,748 75% Grand Total 83 100% $31,128,545 100%
Of the $31 million in primary grant dollars received, $3.9 million (13%) was reported as from the DOE. Other large federal contributors included the Congestion Mitigation and Air Quality Improvement Program (CMAQ) with $4.3 million (14%), the U.S. Department of Agriculture (USDA) Biofuel Infrastructure Partnership with $3.2 million (10%), the EPA with $1 million (3%), and a grouping of other federal agencies with $11.3 million (36%). The largest non-federal contributors were state governments with $6.8 million (22%).
In addition to new 2017 awards, coordinators reported the portions of previous multiyear awards spent during the calendar year. If a coordinator failed to report the amount spent during 2017, the total amount of the award divided by the number of years of award duration was assumed. Coalitions reported spending 34% of the funds they were awarded in 2017, suggesting that projects start quickly after being awarded. In 2017, coalitions utilized a total of $43 million in project funds that were awarded and matched between 2013 and 2017.
In addition to project-related funds, coalitions reported collecting $1.3 million in stakeholder dues and receiving $4.9 million in operational funds, primarily from their host organizations. Combining these funds with non-DOE grant and matching funds totaled $59.4 million. This total represents a more than 2:1 leveraging of $28.9 million in DOE funds directed to the coalitions as programmatic assistance (the $25 million in the Technology Integration program budget and $3.9 million in competitive funding opportunity awards from DOE).
Coalitions leveraged $2 of project funding for every $1 in the Clean Cities program budget.
25 This report is available at no cost from the National Renewable Energy Laboratory (NREL) at www.nrel.gov/publications.
About the Stakeholders In 2017, 84 coalitions reported a total of 12,599 stakeholders, for an average of 150 stakeholders per coalition, which is similar to the average of 152 stakeholders in 2016. Coalitions drew local stakeholders from the public, private and nonprofit sectors. Stakeholders included local, state, and federal government agencies, large and small businesses, auto manufacturers, car dealers, fuel suppliers, public utilities, nonprofits, and professional associations. Coalitions reported that 50% of stakeholders were from the private sector. This composition is similar to the 54% reported in 2016 and shows a consistent balance between public and private stakeholders.
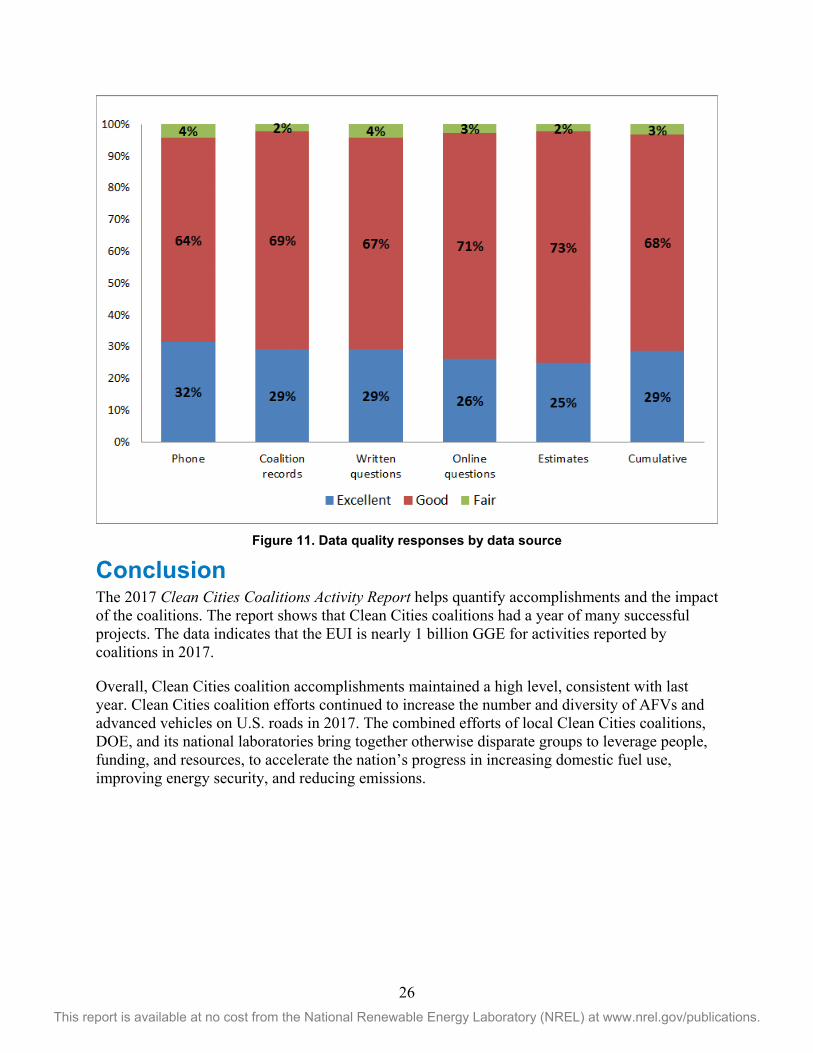
Data Sources and Quality Gathering data is often challenging for coordinators because they rely on voluntary reporting from their numerous stakeholders. Therefore, the annual report website contains some questions related to data sources and quality. In these questions, coordinators were asked to rate the quality of their data as excellent, good, fair, or poor. The “cumulative” bar in Figure 11 presents the response breakdown for the 84 coordinators who answered the question. Twenty-nine percent of the respondents classified their data as excellent, 68% as good, and 3% as fair. No respondents reported their data as poor.
The reporting tool also asked coordinators how they obtained their data. They could choose one or more of the following: online questionnaires (e.g., Survey Monkey), written (paper or electronic) questions to stakeholders, phone interviews with stakeholders, coalition records, or coalition estimates. Phone interviews were the most used method of data gathering, accounting for 27%. The second most common method was written questions (26%), then coalition records (17%), estimates (16%), and finally online questionnaires (14%). Figure 11 shows that all collection methods resulted in similar levels of reliability.
Coalitions included 12,599 stakeholders in 2017, with half of them from the private sector.
26 This report is available at no cost from the National Renewable Energy Laboratory (NREL) at www.nrel.gov/publications.
Figure 11. Data quality responses by data source
Conclusion The 2017 Clean Cities Coalitions Activity Report helps quantify accomplishments and the impact of the coalitions. The report shows that Clean Cities coalitions had a year of many successful projects. The data indicates that the EUI is nearly 1 billion GGE for activities reported by coalitions in 2017.
Overall, Clean Cities coalition accomplishments maintained a high level, consistent with last year. Clean Cities coalition efforts continued to increase the number and diversity of AFVs and advanced vehicles on U.S. roads in 2017. The combined efforts of local Clean Cities coalitions, DOE, and its national laboratories bring together otherwise disparate groups to leverage people, funding, and resources, to accelerate the nation’s progress in increasing domestic fuel use, improving energy security, and reducing emissions.

27 This report is available at no cost from the National Renewable Energy Laboratory (NREL) at www.nrel.gov/publications.
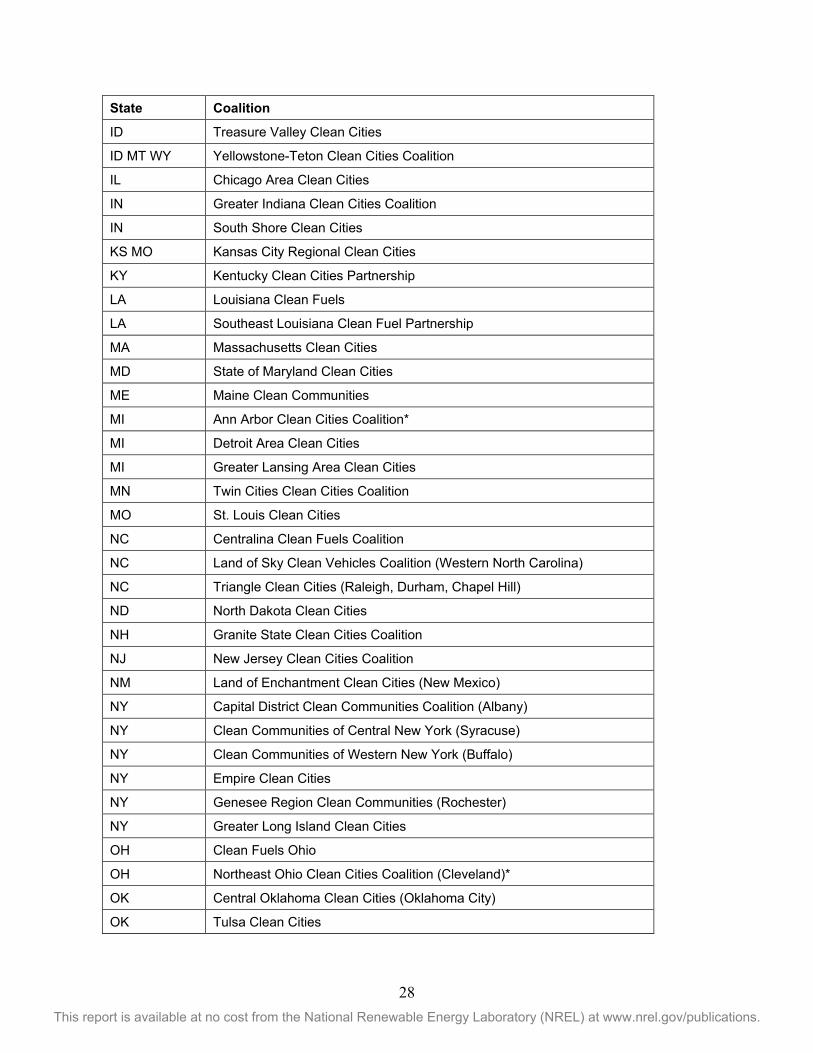
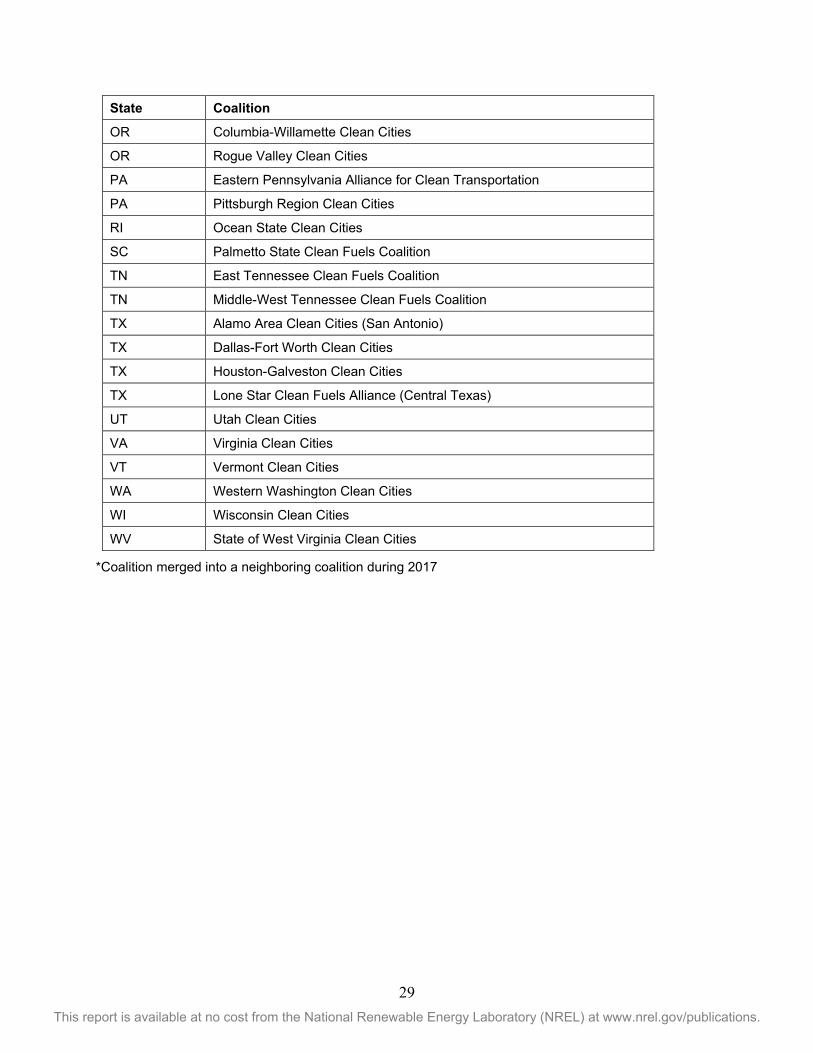
Appendix A: Clean Cities Coalitions that Completed 2017 Annual Reports
State Coalition
AL Alabama Clean Fuels Coalition
AR Arkansas Clean Cities
AZ Tucson Clean Cities
AZ Valley of the Sun Clean Cities Coalition (Phoenix)
CA Central Coast Clean Cities
CA Clean Cities Coachella Valley Region
CA East Bay Clean Cities Coalition (Oakland)
CA Long Beach Clean Cities
CA Los Angeles Clean Cities Coalition
CA Sacramento Clean Cities Coalition
CA San Diego Regional Clean Cities Coalition
CA San Francisco Clean Cities Coalition
CA San Joaquin Valley Clean Cities
CA Silicon Valley Clean Cities (San Jose)
CA Southern California Clean Cities Coalition
CA Western Riverside County Clean Cities Coalition
CO Denver Metro Clean Cities Coalition
CO Northern Colorado Clean Cities Coalition
CO Southern Colorado Clean Cities Coalition
CT Capitol Clean Cities of Connecticut
CT Connecticut Southwestern Area Clean Cities
CT Greater New Haven Clean Cities Coalition
CT Norwich Clean Cities
DC Greater Washington Region Clean Cities Coalition
DE State of Delaware Clean Cities
FL Central Florida Clean Cities Coalition
FL North Florida Clean Fuels Coalition
FL Southeast Florida Clean Cities Coalition
FL Tampa Bay Clean Cities Coalition
GA Clean Cities-Georgia
HI Sustainable Transportation Coalition of Hawaii
IA Iowa Clean Cities Coalition
28 This report is available at no cost from the National Renewable Energy Laboratory (NREL) at www.nrel.gov/publications.
State Coalition
ID Treasure Valley Clean Cities
ID MT WY Yellowstone-Teton Clean Cities Coalition
IL Chicago Area Clean Cities
IN Greater Indiana Clean Cities Coalition
IN South Shore Clean Cities
KS MO Kansas City Regional Clean Cities
KY Kentucky Clean Cities Partnership
LA Louisiana Clean Fuels
LA Southeast Louisiana Clean Fuel Partnership
MA Massachusetts Clean Cities
MD State of Maryland Clean Cities
ME Maine Clean Communities
MI Ann Arbor Clean Cities Coalition*
MI Detroit Area Clean Cities
MI Greater Lansing Area Clean Cities
MN Twin Cities Clean Cities Coalition
MO St. Louis Clean Cities
NC Centralina Clean Fuels Coalition
NC Land of Sky Clean Vehicles Coalition (Western North Carolina)
NC Triangle Clean Cities (Raleigh, Durham, Chapel Hill)
ND North Dakota Clean Cities
NH Granite State Clean Cities Coalition
NJ New Jersey Clean Cities Coalition
NM Land of Enchantment Clean Cities (New Mexico)
NY Capital District Clean Communities Coalition (Albany)
NY Clean Communities of Central New York (Syracuse)
NY Clean Communities of Western New York (Buffalo)
NY Empire Clean Cities
NY Genesee Region Clean Communities (Rochester)
NY Greater Long Island Clean Cities
OH Clean Fuels Ohio
OH Northeast Ohio Clean Cities Coalition (Cleveland)*
OK Central Oklahoma Clean Cities (Oklahoma City)
OK Tulsa Clean Cities
29 This report is available at no cost from the National Renewable Energy Laboratory (NREL) at www.nrel.gov/publications.
State Coalition
OR Columbia-Willamette Clean Cities
OR Rogue Valley Clean Cities
PA Eastern Pennsylvania Alliance for Clean Transportation
PA Pittsburgh Region Clean Cities
RI Ocean State Clean Cities
SC Palmetto State Clean Fuels Coalition
TN East Tennessee Clean Fuels Coalition
TN Middle-West Tennessee Clean Fuels Coalition
TX Alamo Area Clean Cities (San Antonio)
TX Dallas-Fort Worth Clean Cities
TX Houston-Galveston Clean Cities
TX Lone Star Clean Fuels Alliance (Central Texas)
UT Utah Clean Cities
VA Virginia Clean Cities
VT Vermont Clean Cities
WA Western Washington Clean Cities
WI Wisconsin Clean Cities
WV State of West Virginia Clean Cities
*Coalition merged into a neighboring coalition during 2017
30 This report is available at no cost from the National Renewable Energy Laboratory (NREL) at www.nrel.gov/publications.
Appendix B: Definition of Clean Cities Coalition Types Coalitions have categorized themselves into six different types, depending on their organizational structures and relationship to hosts.5 Some coalitions fit within multiple types. These types are as follows:
1. “Government—City or County” coalitions are hosted by a city or county government such as a city department of transportation or municipally owned utility.
2. “Government—State” coalitions are hosted by a state government. This is generally in the state department of energy or department of environment. Coalitions hosted by a state university are not included in this category.
3. “Hosted in a Nonprofit” coalitions are hosted within a larger nonprofit or community service organization with 501c3 status. The host organization’s activities are broader in scope than the Clean Cities coalition, such as the American Lung Association.
4. “Standalone Nonprofit” coalitions are nonprofits typically with 501c3 status and operate with no or minimal oversight and management of a host organization.
5. “Regional Governing Coalition” coalitions are hosted in a multi-governmental body such as a council of governments, municipal planning organization, or regional planning commission.
6. “Hosted in a University” coalitions are hosted by a university (public or private).
5 The relationship between a host organization and the coalition varies across the country. Typically, the coordinator of the coalition is an employee of the host organization, and the coalition benefits from the resources available at the host organization.