Claude Resources Inc. European Gold Forum Presentation April 2016
26
European Gold Forum April 20, 2016
-
Upload
marc-lepage-cpir -
Category
Investor Relations
-
view
174 -
download
2
Transcript of Claude Resources Inc. European Gold Forum Presentation April 2016

European Gold Forum April 20, 2016

www.clauderesources.com
Cautionary Statement
Cautionary Note Regarding Forward-Looking Information This document contains certain forward-looking statements relating but not limited to the Company’s expectations, intentions, plans and beliefs. Forward-looking information can often be identified by forward-looking words such as “anticipate”, “believe”, “expect”, “goal”, “plan”, “intent”, “estimate”, “may” and “will” or similar words suggesting future outcomes or other expectations, beliefs, plans, objectives, assumptions, intentions or statements about future events or performance. Forward-looking information may include reserve and resource estimates, estimates of future production, unit costs, costs of capital projects and timing of commencement of operations, and is based on current expectations that involve a number of business risks and uncertainties. Factors that could cause actual results to differ materially from any forward-looking statement include, but are not limited to, failure to establish estimated resources and reserves, the grade and recovery of mined ore varying from estimates, capital and operating costs varying significantly from estimates, delays in obtaining or failures to obtain required governmental, environmental or other project approvals, inflation, changes in exchange rates, fluctuations in commodity prices, delays in the development of projects and other factors. Forward-looking statements are subject to risks, uncertainties and other factors that could cause actual results to differ materially from expected results. Potential shareholders and prospective investors should be aware that these statements are subject to known and unknown risks, uncertainties and other factors that could cause actual results to differ materially from those suggested by the forward-looking statements. Shareholders are cautioned not to place undue reliance on forward-looking information. By its nature, forward-looking information involves numerous assumptions, inherent risks and uncertainties, both general and specific, that contribute to the possibility that the predictions, forecasts, projections and various future events will not occur. Claude Resources undertakes no obligation to update publicly or otherwise revise any forward-looking information whether as a result of new information, future events or other such factors which affect this information, except as required by law. Cautionary Note to U.S. Investors Concerning Resource Estimate The resource estimates in this document were prepared in accordance with National Instrument 43-101, adopted by the Canadian Securities Administrators. The requirements of National Instrument 43-101 differ significantly from the requirements of the United States Securities and Exchange Commission (the “SEC”). In this document, we use the terms “measured”, “indicated” and “inferred” resources. Although these terms are recognized and required in Canada, the SEC does not recognize them. The SEC permits U.S. mining companies, in their filings with the SEC, to disclose only those mineral deposits that constitute “reserves”. Under United States standards, mineralization may not be classified as a reserve unless the determination has been made that the mineralization could be economically and legally extracted at the time the determination is made. United States investors should not assume that all or any portion of a measured or indicated resource will ever be converted into “reserves”. Further, “inferred resources” have a great amount of uncertainty as to their existence and whether they can be mined economically or legally, and United States investors should not assume that “inferred resources” exist or can be legally or economically mined, or that they will ever be upgraded to a higher category.
2

www.clauderesources.com
Claude Resources Inc.
3
Amisk Gold Project
Building Value for the Gold Investor
(1) Cash and bullion relates to current cash on hand of $43.3 million and $1.9 million of bullion (gold poured in dore bars, not yet been sold and valued at market prices) at March 31, 2016. (2) See description and reconciliation of non-IFRS financial measures in the “Non-IFRS Financial Measures and Reconciliations” section of the Company’s most recent MD&A. (3) Forecast uses CDN$/U.S.$ exchange rate of $1.33, at CDN$ 1,620/oz and mid-point of production and cost guidance.
Ø Leveraged to the Canadian $ Ø 2nd best mining jurisdiction in the world*
100% Canadian
Ø >20% FCF margin in 2015 – expect similar in 2016 at C$1,620/oz
Free Cash Flow
Ø $45.2M in cash and bullion (1); $17.9M in debt (at March 31, 2016)
Strong Financial Position
Ø Production growth of 44% á in 2014 & 20% á in 2015 Ø 2016 cash cost (2)(3) guidance of $700-$775 (U.S. $530-$585) Ø 2016 AISC (2)(3) guidance $1,125-$1,245 (U.S. $850-$935)
Growing High Margin
Production
Ø Increasing drill budget from 65K m in 2015 to 85K m in 2016 Ø Underexplored greenstone belt
Exploration Upside
Canada *2014 Fraser Institute Annual Survey of Mining Companies

www.clauderesources.com
Operating Execution
Ø Record safety and environmental
performance
Ø Exceeded production and cost guidance for
second consecutive year
Ø Mine sequencing and higher grade Santoy
Gap ore replaced lower grade Santoy 8 ore
Ø Positive Alimak mining method results
4
Performance Driven by Better Ore Bodies and Mining Method
Production Results Q1 2016 Q4 2015 Q4 2014 2015 2014
Tonnes Milled 74,179 65,950 60,551 277,368 279,597
Head Grade (g/t) 8.99 8.99 6.57 8.82 7.32
Recovery 96.5 96.3% 96.1% 96.3% 95.7%
Gold Ounces Produced 20,672 18,340 12,284 75,748 62,984
Sold 21,008 18,311 16,639 72,699 62,772
$0
$200
$400
$600
$800
$1,000
$1,200
$1,400
$1,600
$1,800
$2,000
0
10,000
20,000
30,000
40,000
50,000
60,000
70,000
80,000
2013 2014 2015
AIS
C (
CD
N$/
oz)
Gol
d P
rodu
ctio
n (o
zs)
Gold produced (ozs) AISC (CDN$/oz)

www.clauderesources.com
Financial Highlights
5
A Profitable Gold Producer
Financial Results (all $ amounts in CDN$) Q4 2015 Q4 2014 2015 2014
Revenue (000’s) $27,180 $22,707 $107,651 $87,372
Cash flow from operations (2) (4) (000’s) $12,695 $4,525 $49,005 $26,540
Cash flow from operations (2) (4) per share $0.07 $0.02 $0.25 $0.14
Net earnings (000’s) $11,306 ($516) $32,335 $4,552
Earnings per share (basic and diluted) $0.06 ($0.00) $0.17 $0.02
(4) Cash flow from operations before net changes in non-cash operating working capital.
$1,103 $1,122
$381 $359
$-
$200
$400
$600
$800
$1,000
$1,200
$1,400
$1,600
Q4 2015 2015
Gol
d P
rice
($C
DN
)
Margin/oz in $CDN
Margin AISC
$826 $878
$286 $280
$-
$200
$400
$600
$800
$1,000
$1,200
$1,400
Q4 2015 2015
Gol
d P
rice
($U
.S.)
Margin/oz in $U.S.
Margin AISC
www.clauderesources.com
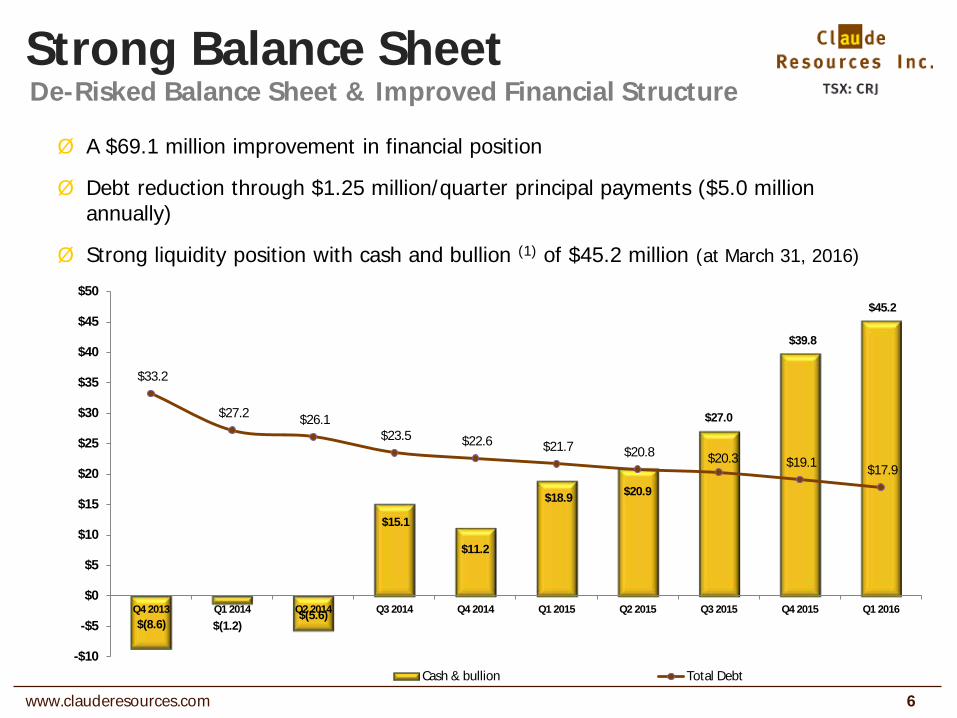
Strong Balance Sheet
Ø A $69.1 million improvement in financial position
Ø Debt reduction through $1.25 million/quarter principal payments ($5.0 million annually)
Ø Strong liquidity position with cash and bullion (1) of $45.2 million (at March 31, 2016)
6
De-Risked Balance Sheet & Improved Financial Structure
$(8.6) $(1.2) $(5.6)
$15.1
$11.2
$18.9 $20.9
$27.0
$39.8
$45.2
$33.2
$27.2 $26.1 $23.5 $22.6 $21.7 $20.8 $20.3 $19.1 $17.9
-$10
-$5
$0
$5
$10
$15
$20
$25
$30
$35
$40
$45
$50
Q4 2013 Q1 2014 Q2 2014 Q3 2014 Q4 2014 Q1 2015 Q2 2015 Q3 2015 Q4 2015 Q1 2016
Cash & bullion Total Debt

www.clauderesources.com
Operations and Projects
7
www.clauderesources.com
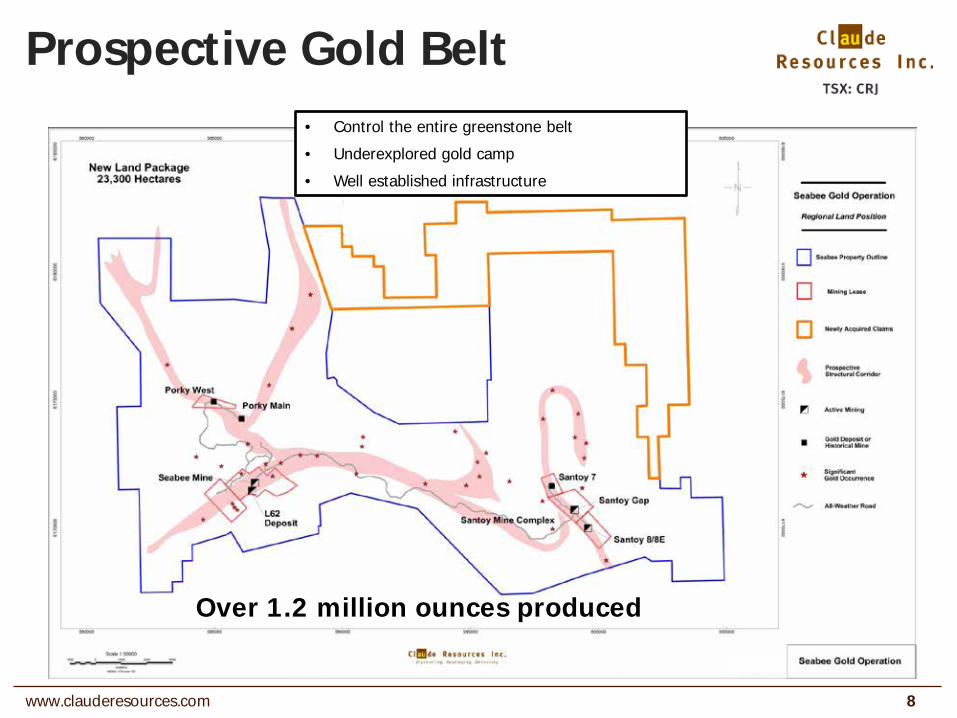
Prospective Gold Belt
8
Over 1.2 million ounces produced
• Control the entire greenstone belt
• Underexplored gold camp
• Well established infrastructure
www.clauderesources.com
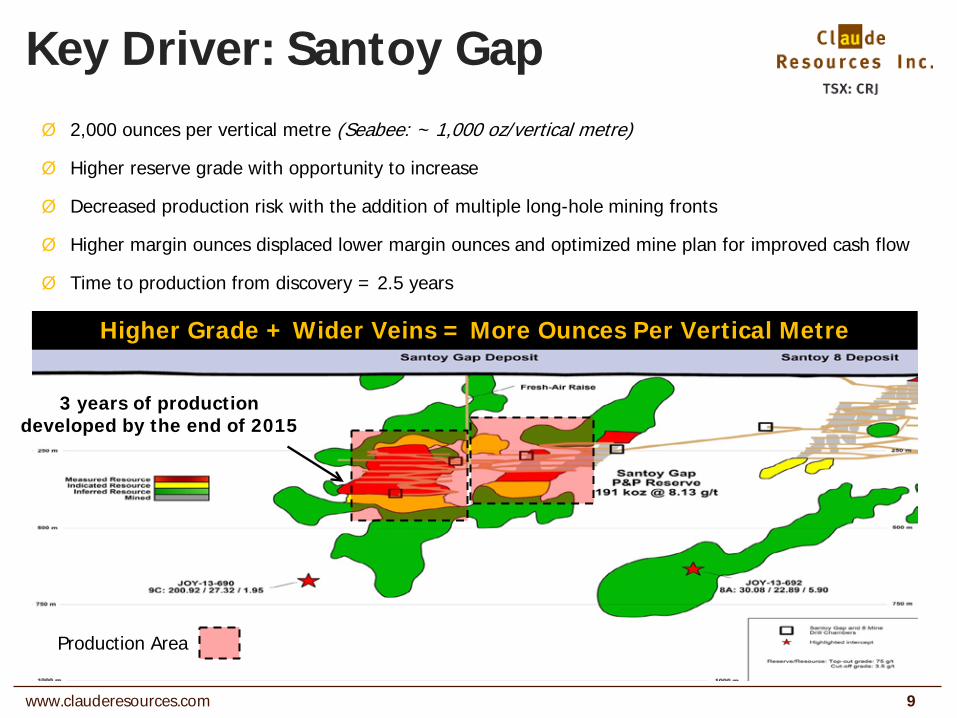
Key Driver: Santoy Gap Ø 2,000 ounces per vertical metre (Seabee: ~ 1,000 oz/vertical metre)
Ø Higher reserve grade with opportunity to increase
Ø Decreased production risk with the addition of multiple long-hole mining fronts
Ø Higher margin ounces displaced lower margin ounces and optimized mine plan for improved cash flow
Ø Time to production from discovery = 2.5 years
9
Production Area
Higher Grade + Wider Veins = More Ounces Per Vertical Metre
3 years of production developed by the end of 2015
www.clauderesources.com
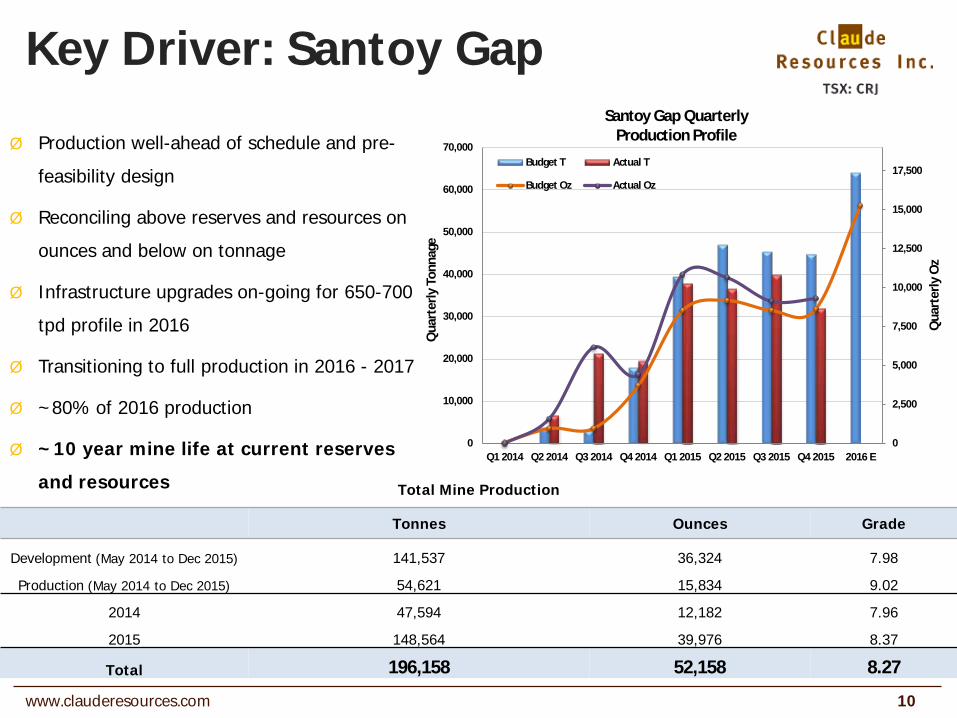
Key Driver: Santoy Gap
10
Ø Production well-ahead of schedule and pre-
feasibility design
Ø Reconciling above reserves and resources on
ounces and below on tonnage
Ø Infrastructure upgrades on-going for 650-700
tpd profile in 2016
Ø Transitioning to full production in 2016 - 2017
Ø ~80% of 2016 production
Ø ~10 year mine life at current reserves
and resources Total Mine Production
Tonnes Ounces Grade
Development (May 2014 to Dec 2015) 141,537 36,324 7.98
Production (May 2014 to Dec 2015) 54,621 15,834 9.02
2014 47,594 12,182 7.96
2015 148,564 39,976 8.37
Total 196,158 52,158 8.27
0
2,500
5,000
7,500
10,000
12,500
15,000
17,500
0
10,000
20,000
30,000
40,000
50,000
60,000
70,000
Q1 2014 Q2 2014 Q3 2014 Q4 2014 Q1 2015 Q2 2015 Q3 2015 Q4 2015 2016 E
Qua
rter
ly O
z
Qua
rter
ly T
onna
ge
Santoy Gap Quarterly Production Profile
Budget T Actual T
Budget Oz Actual Oz
www.clauderesources.com
Exploration
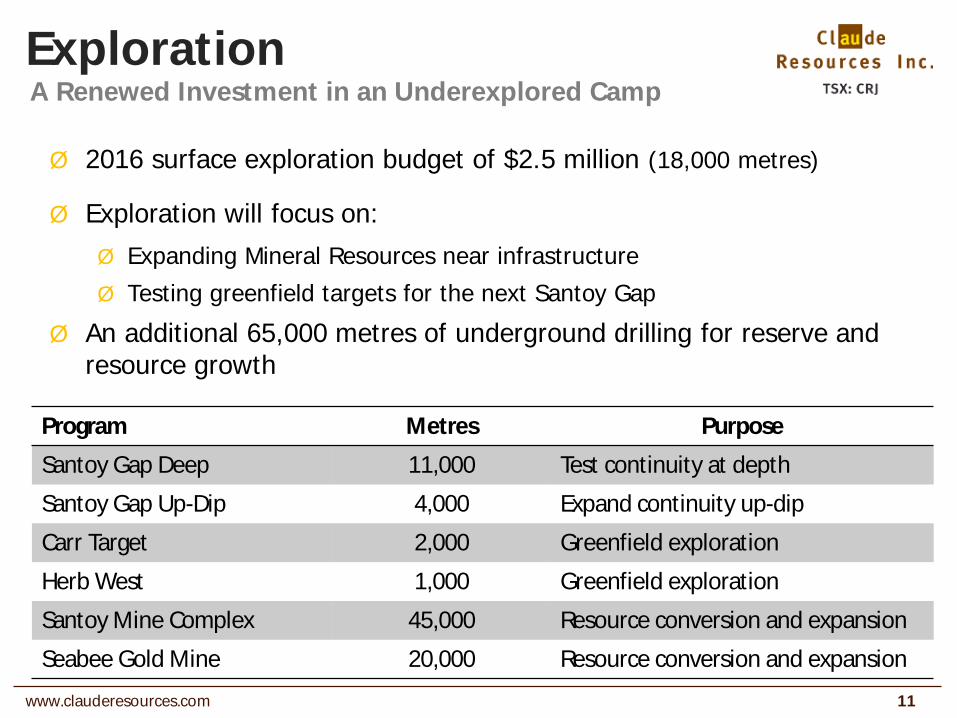
Ø 2016 surface exploration budget of $2.5 million (18,000 metres)
Ø Exploration will focus on: Ø Expanding Mineral Resources near infrastructure Ø Testing greenfield targets for the next Santoy Gap
Ø An additional 65,000 metres of underground drilling for reserve and resource growth
11
A Renewed Investment in an Underexplored Camp
Program Metres Purpose
Santoy Gap Deep 11,000 Test continuity at depth
Santoy Gap Up-Dip 4,000 Expand continuity up-dip
Carr Target 2,000 Greenfield exploration
Herb West 1,000 Greenfield exploration
Santoy Mine Complex 45,000 Resource conversion and expansion
Seabee Gold Mine 20,000 Resource conversion and expansion
www.clauderesources.com
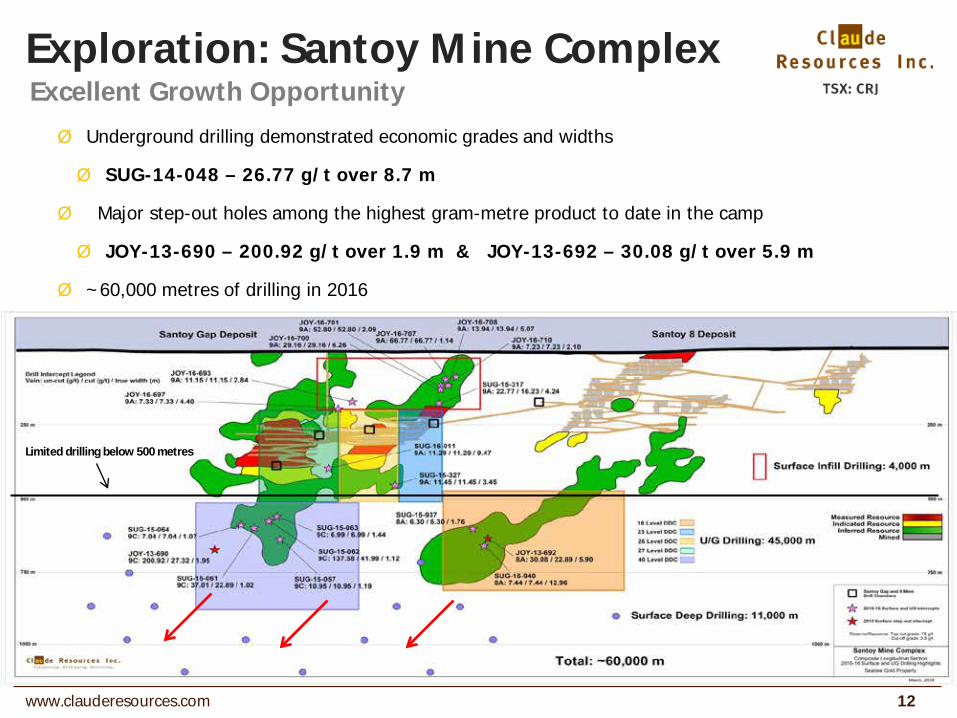
Limited drilling below 500 metres
Exploration: Santoy Mine Complex
Ø Underground drilling demonstrated economic grades and widths
Ø SUG-14-048 – 26.77 g/t over 8.7 m
Ø Major step-out holes among the highest gram-metre product to date in the camp
Ø JOY-13-690 – 200.92 g/t over 1.9 m & JOY-13-692 – 30.08 g/t over 5.9 m
Ø ~60,000 metres of drilling in 2016
12
Excellent Growth Opportunity
www.clauderesources.com
A Profitable Gold Miner
ü Record Earnings: 2015 net earnings of $32.3 million, or $0.17 per share à a $27.7
million improvement from 2014
ü Growing Production: record gold production in 2015 of 75,748 à20% increase vs
2014
ü Higher Grades: mill head grade of 8.82 g/t in 2015 à 20% increase vs 2014
ü Peer Leading Cost Performance:
ü 2015 cash cost per ounce (2)(3) of $672 (U.S. $525) à 20% decrease vs 2014
ü 2015 AISC (2)(3) of $1,122 (U.S. $878) à 14% decrease vs 2014
ü Strong Balance Sheet: increased cash and bullion (1) to $45.2 million and decreased debt to $17.9 million (at March 31, 2016)
13
Our Strategies are Delivering Results

www.clauderesources.com
Outlook
ü Sustainable gold production guidance of 65,000 to 72,000
ounces
ü Low unit cost guidance
ü Cash costs per ounce (2)(3) to $700 - $775 (U.S. $530 - $585*)
ü AISC per ounce (2)(3) to $1,125 - $1,245 (U.S. $850 - $935)
ü FCF in 2016 @ CDN ~$1,270 Au/oz (U.S. $955 Au/oz)
ü FCF margin of ~20% @ current Au prices
14
Focus Remains on Operating Execution, Free Cash Flow & Exploration

www.clauderesources.com
Claude & Silver Standard
15
Ø Silver Standard to acquire all issued and outstanding CRJ shares
Ø Total equity value of C$337 million (as of March 4, 2016 closing price)
Ø Exchange ratio of 0.185 Silver Standard share and $0.001 in cash per CRJ share
Ø Implied premium of 30% to spot and a 25% premium to 20-Day VWAP as of March 4, 2016 closing price
Ø C$1.65 per share at time of announcement (March 7, 2016)
Ø Pro forma ownership: 69% Silver Standard and 31% Claude Resources
Transaction Summary

www.clauderesources.com
Claude & Silver Standard
16
Ø Establishes a high-quality intermediate precious metals producer with margin and scale in attractive mineral belts and political regions
Ø Combined company is expected to produce ~390,000 gold equivalent ounces at cash costs of ~ U.S.$735 per Au Eq ounce sold in 2016
Ø Immediately strengthens financial position with cash and marketable securities of approximately U.S.$330 million (C$440 million) for enhanced credit quality and financial flexibility
Ø Combines complementary safe underground and open pit mining skills to realize portfolio benefits with growth and exploration opportunities
Ø Well positioned to pursue growth at our combined operations and large exploration land package, and to continue our disciplined approach of reviewing external opportunities
Transaction Highlights
Notes: Au Eq production and cash cost calculated based on mid-point of each company’s previously announced 2016 production and cash cost guidance with silver converted to gold equivalent at a 75:1 ratio. Cash and marketable securities as at December 31, 2015. USD/CAD of $0.75 exchange rate used.
www.clauderesources.com
Benefits to Claude Shareholders
17
Meaningful Ownership of the Next Mid-tier Au Producer
Ø 31% ownership in mid-tier precious metals producer
Ø Provides immediate exposure to Silver Standard’s diversified project portfolio
Ø Lowers operating risk and provides scale with multiple mining operations
Ø Significantly enhances financial strength and free cash flow generation
Ø Provides equity participation for exposure to future value creation and growth
Ø Increases trading liquidity and capital markets exposure
Ø Presents financial and tax synergies only realized through the combination

www.clauderesources.com
2016 Outlook
18
Creating Value and Growth with Silver Standard
Transaction creates an emerging mid-tier Americas focused precious metals producer
Strong financial position with cash and marketable securities of U.S.$330 million (C$440 million)
Low cost production with cash costs of ~U.S.$735 Au Eq/oz
Focus remains on operating execution, free cash flow & exploration
Notes: Au Eq production and cash cost calculated based on mid-point of each company’s previously announced 2016 production and cash cost guidance with silver converted to gold equivalent at a 75:1 ratio. Cash and marketable securities as at December 31, 2015. USD/CAD of $0.75 exchange rate used.

www.clauderesources.com 19
Trading Symbol: TSX: CRJ OTCQB: CLGRF
Investor Relations: Marc Lepage, CPIR 1.306.668.7501 [email protected]

www.clauderesources.com
Appendix A:
20
Corporate Summary Stock Exchanges: TSX CRJ OTCQB CLGRF Share Structure: Shares Outstanding (March 31, 2016): Basic 197.7 million Fully Diluted 205.8 million Market Cap CDN ~$325 million (at April 15, 2016) 52 Week High $1.76 52 Week Low $0.51 Analyst Coverage: Richard Gray Cormark Securities Rahul Paul Canaccord Genuity Ron Stewart Dundee Securities Adam Melnyk National Bank Don Blyth Paradigm Capital Philip Ker PI Financial Craig Johnston Scotiabank Andrew Mikitchook M Partners
Financials : (December 31, 2015) : EPS: $0.17
CFPS (4) : $0.25
Total cash cost/oz (2) : C$672 (U.S. $525)
AISC/oz (2) : C$1,122 (U.S. $878)
Cash & bullion (1) : $45.2 (at March 31, 2016)
Debt: $17.9 (at March 31, 2016)
Outlook:
Gold Production: 65,000 – 72,000 ozs
Cash cost/oz (2)(3) : C$700-$775 (U.S. $530-$585)
AISC/oz (2)(3) : C$1,125-$1,245 (U.S. $850-$935)

www.clauderesources.com
Appendix B: Seabee Gold Operation
21
Project Overview
Ownership: 100%
Property Size: 23,300 hectares
Property Location: Saskatchewan, Canada
History:(1991 – Present) +1,200,000 oz of gold production
Resources: See Appendices D & E
Status: Production from Seabee Mine and Santoy Mine Complex
Production: Forecast 65,000 – 72,000 ozs of gold in 2016 Infrastructure:
Mill: 900 tonnes per day (1,050 tpd peak)
Shaft: 1,000 metres
Tailings Facility: Permitted 6 year life
Key Notes: • Santoy Gap ramp up ahead of schedule (460 tpd achieved in
2015) • 2016 UG drill program 65,000 m • 2016 surface exploration program 18,000 m • Successful execution of Alimak mining method at Seabee • Santoy Gap infrastructure upgrades on-going to reach 650-
700 tpd in 2016

www.clauderesources.com
Appendix C: Amisk Gold Project
22
Project Overview
Ownership: 100%
Property Size: 40,400 hectares
Property Location: Saskatchewan, Canada
Resource:
Indicated Resources: 921,000 Au Eq ozs
Inferred Resources: 645,000 Au Eq ozs
Status: Greenfield exploration
Infrastructure: Exploration camp
Key Notes:
• Large bulk mineable potential
• Mineralization begins at surface and has been tested to approximately 600 metres below surface
• Close to provincial infrastructure and in proven mining district and “mining friendly” community

www.clauderesources.com
Appendix D:
23
Mineral Reserves & Mineral Resources (5)
At December 31, 2015 Tonnes Grade (g/t) Contained Gold (Oz) Seabee Gold Mine Proven Reserves 167,300 6.01 32,300 Probable Reserves 46,700 7.01 10,500 Measured Resources 20,600 6.47 4,300 Indicated Resources 94,600 7.79 23,700 Inferred Resources 404,800 8.09 105,300 Santoy Gap Proven Reserves 345,800 8.22 91,400 Probable Reserves 386,700 8.04 100,000 Measured Resources 84,700 5.63 15,300 Indicated Resources 116,800 5.10 19,100 Inferred Resources 1,101,900 8.52 301,700 Santoy 8 Proven Reserves 5,100 5.89 1,000 Probable Reserves 24,800 5.20 4,100 Measured Resources 27,200 11.41 10,000 Indicated Resources 37,300 5.22 6,300 Inferred Resources 1,847,100 9.29 551,700 Porky Main Indicated Resources 160,000 7.50 38,600 Inferred Resources 70,000 10.43 23,500 Porky West Indicated Resources 100,700 3.57 11,600 Inferred Resources 174,800 5.48 30,800
Total Gold Proven & Probable Reserves 976,400 7.62 239,300 Measured & Indicated Resources 642,000 6.24 128,800 Inferred Resources 3,598,500 8.76 1,012,900

www.clauderesources.com
Appendix E:
24
Footnotes
(1) Cash and bullion relates to current cash on hand of $43.3 million and $1.9 million of bullion (gold poured in dore bars, not yet been sold and valued at market prices) at March 31, 2016.
(2) See description and reconciliation of non-IFRS financial measures in the “Non-IFRS Financial Measures and Reconciliations” section of the Company’s Annual 2015 MD&A.
(3) Forecast uses CDN$/U.S.$ exchange rate of $1.33, at CDN$ 1,620/oz and mid-point of production and cost guidance. (4) Cash flow from operations before net changes in non-cash operating working capital. (5) Footnotes to the Mineral Resource Statement:
• At December 31, 2015 and November 30, 2014, Mineral Reserves and Mineral Resources were estimated by Claude personnel.
The Mineral Resource evaluation work was completed by a team of geologists and engineers under the supervision of Brian Skanderbeg, P.Geo., President and Chief Executive Officer. Mineral Reserves were conducted under the direction of Qualified Person Gordon Reed, P.Eng., Seabee Gold Operation General Manager. Mr. Skanderbeg and Mr. Reed have sufficient experience, which is relevant to the style of mineralization and type of deposit under consideration and to the activities undertaken to qualify as Qualified Persons as defined by NI 43-101.
• The Mineral Resources and reserves reported herein have been estimated in conformity with generally accepted CIM “Estimation of Mineral Resource and Mineral Reserves Best Practices” guidelines and are reported in accordance with Canadian Securities Administrators’ National Instrument 43-101.
• Mineral Reserves and Mineral Resources for the Seabee deposit are reported at a cut-off of 4.6 grams of gold per tonne. Santoy 8 and Santoy Gap Mineral Reserves and Mineral Resources are reported at a cut-off of 3.75 grams of gold per tonne. Porky Main and Porky West Mineral Resources are reported at a cut-off grade of 3.0 grams of gold per tonne. Assumptions include a price of CDN $1,400 per ounce of gold using metallurgical and process recovery of 96.2 percent and overall ore mining and processing costs derived from 2015 and 2014 realized costs.
• All figures are rounded to reflect the relative accuracy of the estimates. Summation of individual columns may not add-up due to rounding. Mineral Resources are not Mineral Reserves and do not have demonstrated economic viability. There is no certainty that all or any part of the Mineral Resource will be converted into Mineral Reserves.
• Proven and Probable Mineral Reserves are exclusive of Measured and Indicated Mineral Resources.

www.clauderesources.com
Appendix F:
25
Executive Team
Brian Skanderbeg, P.Geo.
President & CEO, Director
Mr. Skanderbeg joined the Company in April 2007. He was appointed as President & CEO in November 2014. Prior to his current position, he was the Sr. VP and COO. He previously worked for Goldcorp, Inco Ltd. and Helio Resources, holding positions in both exploration and operations. He holds a B.Sc. from the University of Manitoba, an M.Sc. from Rhodes University, South Africa. Mr. Skanderbeg brings extensive experience in gold systems, operational management, cost and asset optimization and strategic analysis.
Rick Johnson, CPA, CA
Chief Financial Officer Vice President Finance
Mr. Johnson joined Claude Resources in 1996. He was appointed to his present position in 2004, having previously served as Company Controller. Mr. Johnson holds a Bachelor of Commerce degree from the University of Saskatchewan and is a member of CPA Canada.
www.clauderesources.com
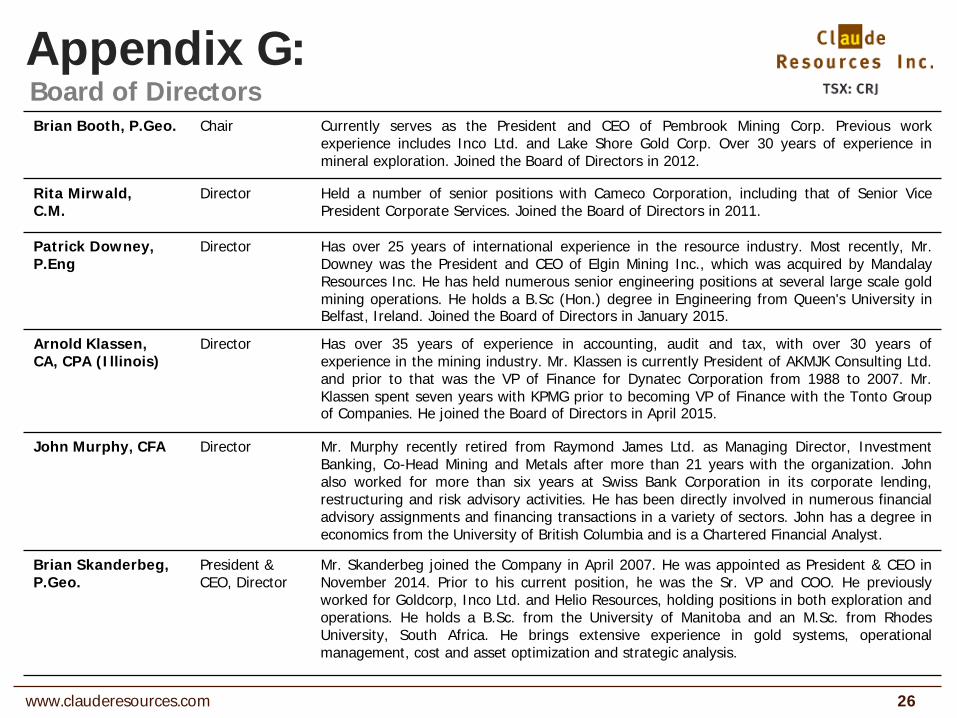
Appendix G:
26
Board of Directors Brian Booth, P.Geo. Chair Currently serves as the President and CEO of Pembrook Mining Corp. Previous work
experience includes Inco Ltd. and Lake Shore Gold Corp. Over 30 years of experience in mineral exploration. Joined the Board of Directors in 2012.
Rita Mirwald, C.M.
Director Held a number of senior positions with Cameco Corporation, including that of Senior Vice President Corporate Services. Joined the Board of Directors in 2011.
Patrick Downey, P.Eng
Director Has over 25 years of international experience in the resource industry. Most recently, Mr. Downey was the President and CEO of Elgin Mining Inc., which was acquired by Mandalay Resources Inc. He has held numerous senior engineering positions at several large scale gold mining operations. He holds a B.Sc (Hon.) degree in Engineering from Queen's University in Belfast, Ireland. Joined the Board of Directors in January 2015.
Arnold Klassen, CA, CPA (Illinois)
Director Has over 35 years of experience in accounting, audit and tax, with over 30 years of experience in the mining industry. Mr. Klassen is currently President of AKMJK Consulting Ltd. and prior to that was the VP of Finance for Dynatec Corporation from 1988 to 2007. Mr. Klassen spent seven years with KPMG prior to becoming VP of Finance with the Tonto Group of Companies. He joined the Board of Directors in April 2015.
John Murphy, CFA Director Mr. Murphy recently retired from Raymond James Ltd. as Managing Director, Investment Banking, Co-Head Mining and Metals after more than 21 years with the organization. John also worked for more than six years at Swiss Bank Corporation in its corporate lending, restructuring and risk advisory activities. He has been directly involved in numerous financial advisory assignments and financing transactions in a variety of sectors. John has a degree in economics from the University of British Columbia and is a Chartered Financial Analyst.
Brian Skanderbeg, P.Geo.
President & CEO, Director
Mr. Skanderbeg joined the Company in April 2007. He was appointed as President & CEO in November 2014. Prior to his current position, he was the Sr. VP and COO. He previously worked for Goldcorp, Inco Ltd. and Helio Resources, holding positions in both exploration and operations. He holds a B.Sc. from the University of Manitoba and an M.Sc. from Rhodes University, South Africa. He brings extensive experience in gold systems, operational management, cost and asset optimization and strategic analysis.