Claude Resources Inc. 2012 MD&A and Financial Statements
88
MANAGEMENT’ S DISCUSSION AND ANALYSIS The following Management’s Discussion and Analysis (“MD&A”) of the consolidated operating and financial performance of Claude Resources Inc. (“Claude” or the “Company”) for the years ended December 31, 2012 and 2011 is prepared as of March 27, 2013. This discussion is the responsibility of Management and has been prepared using International Financial Reporting Standards (“IFRS”), as issued by the International Accounting Standards Board. This discussion should be read in conjunction with the Company’s audited consolidated financial statements and notes thereto. The Board of Directors has approved the disclosure presented herein. All amounts referred to in this discussion are expressed in Canadian dollars, except where otherwise indicated. OVERVIEW Claude Resources Inc., incorporated pursuant to the Canada Business Corporations Act, is a gold producer with shares listed on both the Toronto Stock Exchange (TSX-CRJ) and the NYSE MKT (NYSE MKT- CGR). The Company is also engaged in the exploration and development of gold mineral reserves and mineral resources. The Company’s entire asset base is located in Canada. The Company’s revenue generating asset is the 100 percent owned Seabee Gold Operation, located in northern Saskatchewan, which includes 43,900 acres (17,750 hectares) and is comprised of five mineral leases and extensive surface infrastructure. Claude also owns 100 percent of the Amisk Gold Project in northeastern Saskatchewan. The Amisk Gold Project is located 20 kilometres southwest of Flin Flon, Manitoba and hosts the Amisk Gold Deposit and a large number of gold occurrences and prospects. At 99,800 acres (40,400 hectares), this gold and silver exploration property is one of the largest land positions in the Flin Flon mineral district. Claude also owns 100 percent of the Madsen Property located in the Red Lake gold camp of northwestern Ontario. The Madsen Project comprises over 10,000 acres (4,000 hectares) and boasts historical production in excess of 2.4 million ounces, making it the third largest gold producer in the Red Lake camp in Ontario, Canada. Infrastructure includes a fully functional 500 ton per day mill, a 4,125 foot deep shaft and permitted tailings facility. (1) The Company’s Seabee, Amisk and Madsen properties contain large, long life mineral resources in the politically safe jurisdiction of Canada. All three properties, and their related deposits, contain over one million ounces of gold in the ground inventory and have significant leverage to the price of gold and provide valuable long-term opportunities for the Company and its shareholders. Management intends to further develop shareholder value by maintaining and advancing these projects in a financially prudent manner, which will include the monitoring of the attractiveness of these projects and the evaluation of alternatives to improve their economics. GOING CONCERN The Company’s consolidated financial statements have been prepared on the assumption that the Company will continue as a going concern and realize its assets and discharge its liabilities in the normal course of business, which assumes the Company will be able to meet the mandatory debenture repayment coming due on May 23, 2013 (Note 11). As at December 31, 2012, the Company has a working capital deficiency of $4.1 million. The working capital deficiency results primarily from the Company’s debentures amounting to $9.7 million (Note 11) that are classified as a current liability as their contractual repayments terms are due in less than one year. As a part of the Company’s plan to refinance the outstanding debenture obligations, the Company, subsequent to December 31, 2012, executed a non-binding term sheet with Crown Capital Partners Inc. (“CCP”) for an additional long-term debt facility of $25.0 million (Note 22). The Company is currently in final negotiations to close this new debt facility which will provide liquidity for the repayment of the outstanding debentures as they come due on May 23, 2013. There can be no assurance that the Company will be able to finalize and close the debt facility at the terms specified in the non-binding term sheet, or at all. The uncertainty of closing the new debt facility to refinance the Company’s working capital deficiency, attributable to the debenture repayment requirement in May 2013, results in a material
-
Upload
claude-resources-inc -
Category
Investor Relations
-
view
1.544 -
download
2
Transcript of Claude Resources Inc. 2012 MD&A and Financial Statements

MANAGEMENT’S DISCUSSION AND ANALYSIS The following Management’s Discussion and Analysis (“MD&A”) of the consolidated operating and financial performance of Claude Resources Inc. (“Claude” or the “Company”) for the years ended December 31, 2012 and 2011 is prepared as of March 27, 2013. This discussion is the responsibility of Management and has been prepared using International Financial Reporting Standards (“IFRS”), as issued by the International Accounting Standards Board. This discussion should be read in conjunction with the Company’s audited consolidated financial statements and notes thereto. The Board of Directors has approved the disclosure presented herein. All amounts referred to in this discussion are expressed in Canadian dollars, except where otherwise indicated. OVERVIEW Claude Resources Inc., incorporated pursuant to the Canada Business Corporations Act, is a gold producer with shares listed on both the Toronto Stock Exchange (TSX-CRJ) and the NYSE MKT (NYSE MKT-CGR). The Company is also engaged in the exploration and development of gold mineral reserves and mineral resources. The Company’s entire asset base is located in Canada. The Company’s revenue generating asset is the 100 percent owned Seabee Gold Operation, located in northern Saskatchewan, which includes 43,900 acres (17,750 hectares) and is comprised of five mineral leases and extensive surface infrastructure. Claude also owns 100 percent of the Amisk Gold Project in northeastern Saskatchewan. The Amisk Gold Project is located 20 kilometres southwest of Flin Flon, Manitoba and hosts the Amisk Gold Deposit and a large number of gold occurrences and prospects. At 99,800 acres (40,400 hectares), this gold and silver exploration property is one of the largest land positions in the Flin Flon mineral district. Claude also owns 100 percent of the Madsen Property located in the Red Lake gold camp of northwestern Ontario. The Madsen Project comprises over 10,000 acres (4,000 hectares) and boasts historical production in excess of 2.4 million ounces, making it the third largest gold producer in the Red Lake camp in Ontario, Canada. Infrastructure includes a fully functional 500 ton per day mill, a 4,125 foot deep shaft and permitted tailings facility. (1) The Company’s Seabee, Amisk and Madsen properties contain large, long life mineral resources in the politically safe jurisdiction of Canada. All three properties, and their related deposits, contain over one million ounces of gold in the ground inventory and have significant leverage to the price of gold and provide valuable long-term opportunities for the Company and its shareholders. Management intends to further develop shareholder value by maintaining and advancing these projects in a financially prudent manner, which will include the monitoring of the attractiveness of these projects and the evaluation of alternatives to improve their economics. GOING CONCERN The Company’s consolidated financial statements have been prepared on the assumption that the Company will continue as a going concern and realize its assets and discharge its liabilities in the normal course of business, which assumes the Company will be able to meet the mandatory debenture repayment coming due on May 23, 2013 (Note 11). As at December 31, 2012, the Company has a working capital deficiency of $4.1 million. The working capital deficiency results primarily from the Company’s debentures amounting to $9.7 million (Note 11) that are classified as a current liability as their contractual repayments terms are due in less than one year. As a part of the Company’s plan to refinance the outstanding debenture obligations, the Company, subsequent to December 31, 2012, executed a non-binding term sheet with Crown Capital Partners Inc. (“CCP”) for an additional long-term debt facility of $25.0 million (Note 22). The Company is currently in final negotiations to close this new debt facility which will provide liquidity for the repayment of the outstanding debentures as they come due on May 23, 2013. There can be no assurance that the Company will be able to finalize and close the debt facility at the terms specified in the non-binding term sheet, or at all. The uncertainty of closing the new debt facility to refinance the Company’s working capital deficiency, attributable to the debenture repayment requirement in May 2013, results in a material

2012 Annual Management’s Discussion and Analysis (in thousands of CDN dollars, except as otherwise noted) Page 2
Claude Resources Inc.
uncertainty and therefore casts substantial doubt as to the Company’s ability to continue as a going concern. If the Company is unable to finalize and close the debt facility, it would be required to obtain additional sources of financing (debt or equity). The Company’s financial statements do not reflect adjustments that would be necessary if the going concern assumption were not appropriate. If the going concern basis was not appropriate for these financial statements, then adjustments would be necessary to the carrying value of assets and liabilities, the reported revenues and expenses, and the statement of financial position classifications used. PRODUCTION, EXPLORATION, AND FINANCIAL HIGHLIGHTS Seabee Gold Operation Production
• Production: 49,570 ounces produced (2011: 44,756 ounces produced) and 48,672 ounces sold (2011: 44,632 ounces sold). The increase in ounces sold and in average realized price per ounce, partially offset by increased production costs, has positively impacted net cash margin per ounce sold year over year. For fiscal 2013, the Company is forecasting production of 50,000 to 54,000 ounces. Claude expects significant reduction in total Company expenditures which is largely attributable to the completion of major upgrades to the Seabee Operations (including equipment and facilities) in 2012, major projects being completed and a reduced capital spend in 2013 ($12.4 million in 2013; $27.9 million in 2012). After achieving a record mill throughput of 275,235 tonnes in 2012, the Company is forecasting that this trend will continue in 2013 with production and milling of approximately 300,000 tonnes.
• Seabee Mine Shaft Extension Project: After a 20 day shutdown, the shaft resumed hoisting ore from the 980 metre level early in the first quarter of 2013. The reduction of trucking distance and ore handling is anticipated to result in lower diesel consumption, reduced maintenance costs and improved ventilation. Overall, Seabee Deep and L62 mining costs are expected to improve by as much as 10 percent per tonne.
• L62 Zone: has been accessed and development is active on three levels. Development tonnage was accessed during the third quarter and production tonnage commenced during the fourth quarter.
• Development: $18.6 million was spent on underground development, including access to the L62 Zone and advancement towards the Santoy Gap, to increase the number of working faces in 2013.
Exploration
Mineral Reserves and Mineral Resources:
• During 2012, the Company was able to effectively upgrade nearly half of the Santoy Gap inferred resource into the indicated category while continuing to grow the deposit (which was expanded by 29 percent and observed a four percent increase in grade). Furthermore, the infill drill program demonstrated that a high grade core exists with widths of up to 20 metres. The Santoy Gap deposit, part of the Santoy Mine Complex, represents a great opportunity for the Company due to its proximity to permitted mine infrastructure, low development cost and near-term production potential.
• Proven and Probable Mineral Reserves at December 31, 2012 were 311,100 ounces of gold. Measured and Indicated (“M&I”) Mineral Resources at December 31, 2012 were 344,200 ounces of contained gold. The Santoy Gap deposit contributed 281,200 ounces of this total. Seabee Gold Operation:
• Approximately 41,000 metres of regional drilling and 60,000 metres of underground drilling were completed during 2012. The Company’s focus was on L62 and Santoy Gap deposit.
• Exploration at Santoy Gap was ongoing with one rig performing infill and step-out drilling. Santoy Gap drill results released during the fourth quarter extended the mineralized system down-dip to 650 metres depth and along strike to the south toward the Santoy 8 deposit within the

2012 Annual Management’s Discussion and Analysis (in thousands of CDN dollars, except as otherwise noted) Page 3
Claude Resources Inc.
Santoy Mine Complex. In addition, the program discovered a sub-parallel lens to the Santoy Gap, approximately 150 metres to the east. Drill intercepts released during the fourth quarter continue to affirm the high prospectivity of the Santoy Regional Shear Zone, hosting multiple deposits over a three kilometre strike length. Results from this drilling are included in the 2012 resource update released during the first quarter of 2013.
• Future exploration will focus on evaluating the down-plunge extension of the Santoy Gap and Santoy 8 deposits, expanding recently discovered parallel zones near Santoy and on initial drill testing of several near-Seabee targets. Infill drilling at Santoy Gap, which will begin in the first half of 2013, will also be prioritized to convert additional ounces from the inferred to indicated category. Amisk Gold Project:
• The 2012 regional exploration campaign at Amisk, which included approximately 2,600 metres of drilling, investigated a number of high-priority targets, some of which warrant further testing in the future. Consultants will be used to re-interpret historical geophysical data in order to rank and prioritize regional drill targets. Regional potential remains high and exploration maturity low. Field work and extensive compilation in 2012 have resulted in the emergence of an extensive list of exploration targets that are currently being prioritized for assessment in 2013.
• Advancement of the Preliminary Economic Assessment of the Amisk Gold Project (“Amisk PEA”) will be ongoing in the future. Madsen:
• Exploration during 2012 included two underground rigs and one surface rig; 19,000 metres were completed. Testing focused on the 8 Zone Trend as well as the McVeigh and Austin Tuff depth continuity. Encouraging results were returned from the 2012 program, extending the 8 Zone system at depth and confirming conceptual potential beneath the Austin Tuff.
• Phase I and II drill programs at Madsen were successful in confirming and extending the 8 Zone and Austin and McVeigh systems. The Company has demonstrated that Madsen is a high grade gold project that has strong vertical continuity, remaining open at depth and along strike to the northeast. Based on these results, the significant existing resource base and advanced infrastructure, the Company believes that the Madsen Project warrants scoping level analysis. The analysis will provide key input into a decision to advance Madsen towards a pre-feasibility study (which may include further field and underground work) and Preliminary Economic Assessment (“Madsen PEA”), conceptually evaluating the value and development potential of the project.
Financial
• Revenue: Sales of 48,672 ounces (2011 – 44,632 ounces) at an average price of $1,660 (U.S. $1,661) generated revenue of $80.8 million, a 16 percent increase revenue over full year 2011.
• Canadian dollar cash cost per ounce of gold (2): CDN $997 (U.S. $998) per ounce, 10 percent higher than the cash cost per ounce of CDN $908 (U.S. $918) reported during the year ended December 31, 2011. The increases are primarily a result of the higher direct mining costs, including labour, energy, maintenance and consumable costs, year over year. The Company is continuing to pursue best practices with the intention of lowering these costs. In addition to external consultants being engaged to provide feedback and recommendations on improving operational efficiencies to reduce unit operating costs, the Company anticipates that the continued contribution of the Santoy Mine Complex (including the Santoy 8 and Santoy Gap deposits), ore feedstock from the L62 Zone and completion of the shaft extension will be positive catalysts in improving production and lowering overall unit operating costs at the Seabee Gold Operation.
• Net cash margin: Improved to $663 per ounce from $653 per ounce in 2011. • Net profit: $5.6 million, or $0.03 per share (2011 – $9.5 million, or $0.06 per share) after a non-
cash deferred income tax expense of $3.0 million. • Cash flow from operations before net changes in non-cash operating working capital (3):
$25.8 million, or $0.15 per share (2011 - $22.2 million, or $0.14 per share).

2012 Annual Management’s Discussion and Analysis (in thousands of CDN dollars, except as otherwise noted) Page 4
Claude Resources Inc.
OUTLOOK Looking forward, the Company expects to see a return from its investment in capital projects and equipment over the past two years. In the future, Claude will continue to:
i) Pursue best practices in the areas of safety, health and the environment in all of our operations;
ii) Improve unit operating costs at the Seabee Gold Operation by implementing a cash flow optimization plan designed to maximize cash flow while further developing satellite deposits including the Company’s Santoy Gap deposit;
iii) Sustain or increase reserves and resources at the Seabee Gold Operation through targeted exploration and development;
iv) Advance a scoping level analysis on the Company's 100 percent owned Madsen Exploration Project; and
v) Complete the Amisk PEA on the Amisk Gold Project. Operating and Financial The Company completed its shaft extension project at the Seabee Mine in January 2013. During the remainder of 2013, the Company will see the completion of many milestones including:
• full production from the L62 deposit; • record mill and mine throughput; and • access to underground drill chambers to explore and infill drill the Santoy Gap deposit.
For 2013, forecast gold production at the Seabee Gold Operation is estimated to range from 50,000 ounces to 54,000 ounces. Unit costs for 2013 are expected to improve slightly from 2012’s unit cash costs of $997 CDN per ounce. Quarterly operating results are expected to fluctuate throughout 2013; as such, they will not necessarily be reflective of the full year average. Access to the Seabee Gold Operation is by fixed wing aircraft to an airstrip located on the property. Large consumables (including diesel and propane) and items related to the upgrading of the mining fleet and mine infrastructure are trucked to the site via a 60 kilometre annual winter ice road from Brabant Lake on Highway 102. The winter ice road is typically in use from January through March. This seasonal trend of purchasing and delivering inventories to the Seabee Gold Operation results in significant cash outflows during the first quarter of the year.
During 2013, the Company expects 350 to 400 semi-trailer loads (2012 winter road – over 500 semi-trailer loads), a result of improved operating effectiveness and fewer capital projects in 2013. The Company has also benefited from lower prices on several of its consumable inventory items, year over year.
At current gold prices and forecast production, Management believes that operating cash flows, in addition to the increased credit facilities negotiated during the first quarter of 2013, will be sufficient to fund the 2013 Winter Ice Road resupply requirements and further development opportunities at the Seabee Gold Operation. With respect to the Company’s outstanding debentures that mature in May of 2013, the Company believes that the closing of the debt financing announced in January 2013 will provide sufficient funding for the redemption. Capital During 2013, capital expenditures are expected to include continued investment and expected upgrades at the Seabee Gold Operation. Capital expenditures at the Seabee Gold Operation in 2013 are estimated to total approximately $31.9 million, funded from a combination of cash on hand, operating cash flow and demand loans. This reduction from 2012 is due to the completion of several major projects, including the shaft extension.
2012 Annual Management’s Discussion and Analysis (in thousands of CDN dollars, except as otherwise noted) Page 5
Claude Resources Inc.
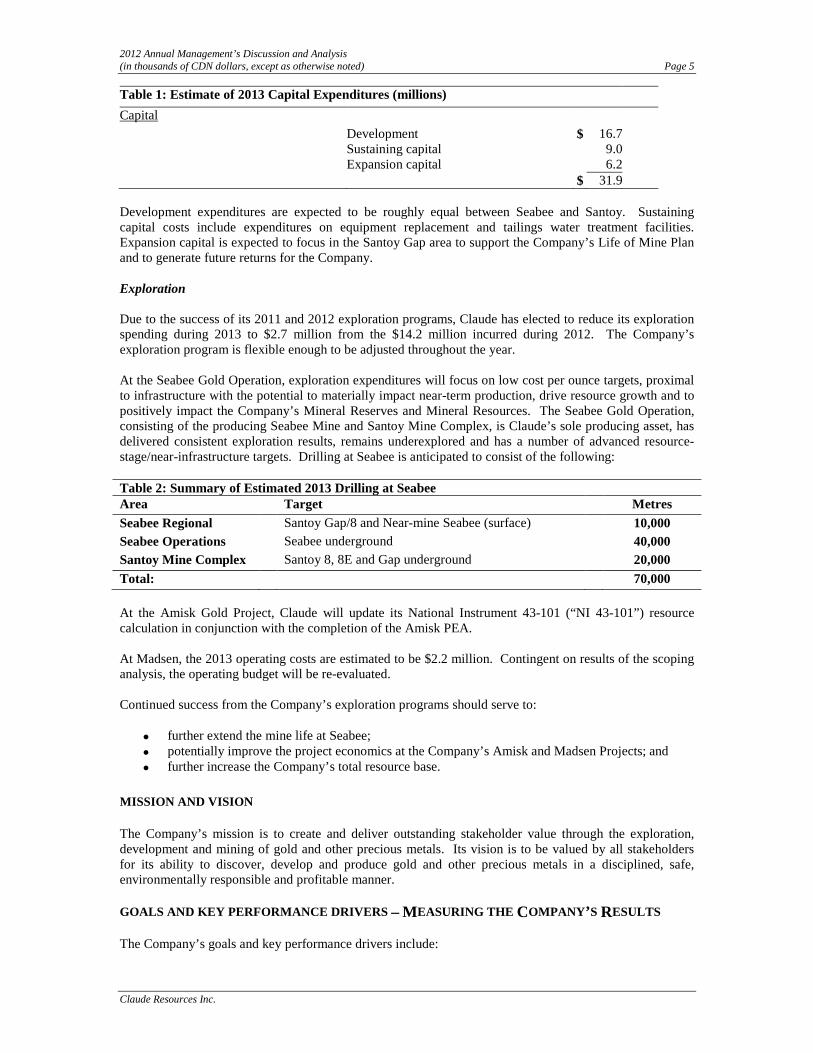
Table 1: Estimate of 2013 Capital Expenditures (millions) Capital Development $ 16.7 Sustaining capital 9.0 Expansion capital 6.2 $ 31.9 Development expenditures are expected to be roughly equal between Seabee and Santoy. Sustaining capital costs include expenditures on equipment replacement and tailings water treatment facilities. Expansion capital is expected to focus in the Santoy Gap area to support the Company’s Life of Mine Plan and to generate future returns for the Company. Exploration Due to the success of its 2011 and 2012 exploration programs, Claude has elected to reduce its exploration spending during 2013 to $2.7 million from the $14.2 million incurred during 2012. The Company’s exploration program is flexible enough to be adjusted throughout the year. At the Seabee Gold Operation, exploration expenditures will focus on low cost per ounce targets, proximal to infrastructure with the potential to materially impact near-term production, drive resource growth and to positively impact the Company’s Mineral Reserves and Mineral Resources. The Seabee Gold Operation, consisting of the producing Seabee Mine and Santoy Mine Complex, is Claude’s sole producing asset, has delivered consistent exploration results, remains underexplored and has a number of advanced resource-stage/near-infrastructure targets. Drilling at Seabee is anticipated to consist of the following: Table 2: Summary of Estimated 2013 Drilling at Seabee Area Target Metres Seabee Regional Santoy Gap/8 and Near-mine Seabee (surface) 10,000 Seabee Operations Seabee underground 40,000 Santoy Mine Complex Santoy 8, 8E and Gap underground 20,000 Total: 70,000 At the Amisk Gold Project, Claude will update its National Instrument 43-101 (“NI 43-101”) resource calculation in conjunction with the completion of the Amisk PEA. At Madsen, the 2013 operating costs are estimated to be $2.2 million. Contingent on results of the scoping analysis, the operating budget will be re-evaluated. Continued success from the Company’s exploration programs should serve to:
• further extend the mine life at Seabee; • potentially improve the project economics at the Company’s Amisk and Madsen Projects; and • further increase the Company’s total resource base.
MISSION AND VISION The Company’s mission is to create and deliver outstanding stakeholder value through the exploration, development and mining of gold and other precious metals. Its vision is to be valued by all stakeholders for its ability to discover, develop and produce gold and other precious metals in a disciplined, safe, environmentally responsible and profitable manner. GOALS AND KEY PERFORMANCE DRIVERS – MEASURING THE COMPANY’S RESULTS The Company’s goals and key performance drivers include:

2012 Annual Management’s Discussion and Analysis (in thousands of CDN dollars, except as otherwise noted) Page 6
Claude Resources Inc.
• Improving operating margins at the Seabee Gold Operation; • Sustaining reserves and resources at the Seabee Gold Operation through targeted exploration and
development; • Pursuing best practices in the areas of safety, health and the environment in all of our operations; • Maintaining financial capacity and liquidity in order to reduce financial risk; • Considering strategically attractive opportunities and accretive transactions; and • Ensuring that the Company’s share price reflects underlying value.
Production and Unit Operating Costs at the Seabee Gold Operation The combination of strong average realized gold prices per ounce during 2012 has offset the increased mine operating costs, year over year, resulting in improved operating margins for the Company. During 2012, the Company observed a six percent improvement in Canadian dollar gold prices realized (2012 - $1,660 (U.S. $1,661); 2011 - $1,561 (U.S. $1,578) and increased gold sales volume (2012 – 48,672 ounces; 2011 – 44,632 ounces). Total Canadian dollar cash cost per ounce of gold (2) for 2012 increased 10 percent to CDN $997 (U.S. $998) per ounce from CDN $908 (U.S. $918) in 2011, primarily as a result of the higher direct mining costs, including labour, energy, maintenance and consumable costs, year over year. During 2012, net cash margin (2) improved to $663 per ounce from $653 per ounce in 2011. During 2013, the Company will continue to focus on the profitability of the Seabee Gold Operation through a combination of improved grade control, cost controls (including engaging external consultants to provide feedback and recommendations on improving operational efficiencies) and developing the production profile at lower cost satellite ore bodies, including the Santoy 8 and Santoy Gap deposits. Safety, Health and the Environment The Company strives to protect the safety and health of its employees and the environment it operates in. Claude is continuing to look for ways to improve processes to increase Safety, Health and Environmental performance. During 2012, the Company continued to pursue best practices in the areas of Safety, Health and the Environment and its stated goal of “Mission Zero” in matters related to Safety, Health and the Environment. Claude has expanded its Safety, Training and Environment Departments as well as retained external professionals to conduct periodic reviews of its work practices, workplaces and management systems. As part of Claude’s commitment towards “Zero Injury” and “Zero Environmental Exceedence”, the Company established operational objectives of reducing these incidents year over year. To measure its objectives relating to Safety, Health and the Environment, the Company utilizes a Safety, Health and Environment Managements System (“SHEMS”). For Safety and Health, the Company utilizes the Total Recordable Incident Rate (“TRIR”) metric, a common industry rating that is used to determine the number of serious injuries (medical incidents and higher) that a company has for every 200,000 hours worked. Management utilizes the TRIR metric because it considers all incidents that have caused serious harm to the Company’s workforce, thereby enabling the Company to be more proactive with its policies and procedures designed to improve and maintain safety. Management believes having success in these critical areas will place Claude in a position to be recognized as a leader in matters related to Safety, Health and the Environment.
2012 Annual Management’s Discussion and Analysis (in thousands of CDN dollars, except as otherwise noted) Page 7
Claude Resources Inc.
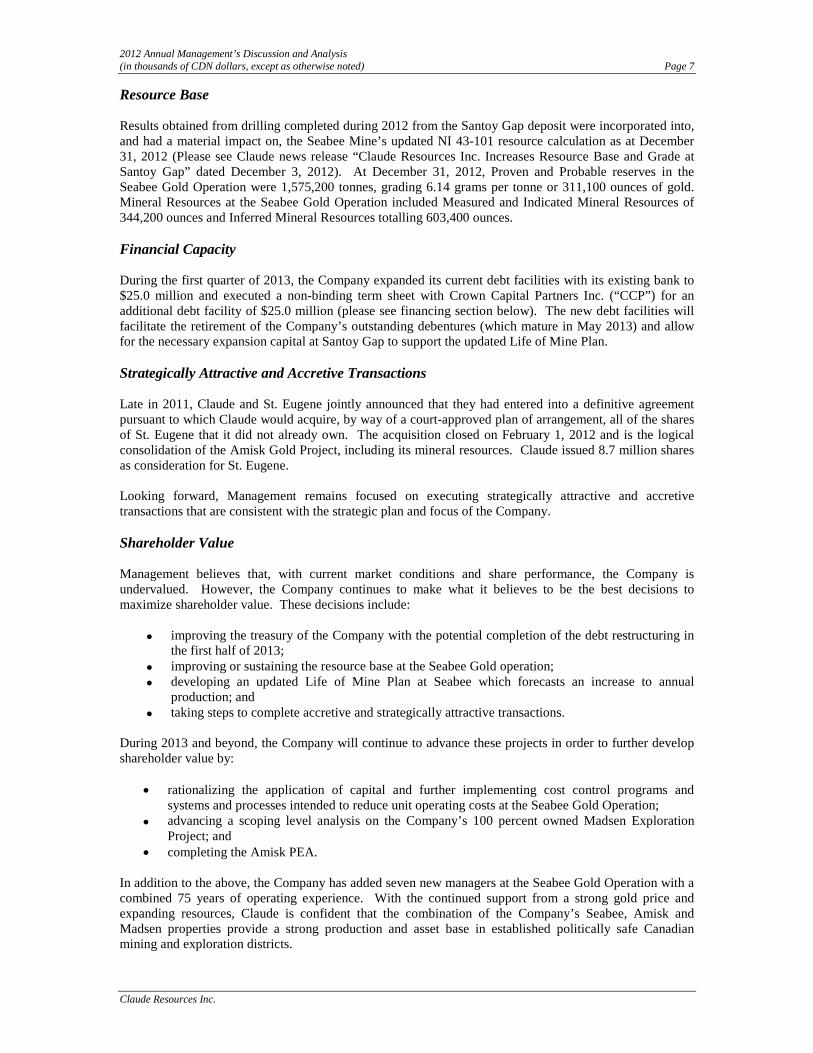
Resource Base Results obtained from drilling completed during 2012 from the Santoy Gap deposit were incorporated into, and had a material impact on, the Seabee Mine’s updated NI 43-101 resource calculation as at December 31, 2012 (Please see Claude news release “Claude Resources Inc. Increases Resource Base and Grade at Santoy Gap” dated December 3, 2012). At December 31, 2012, Proven and Probable reserves in the Seabee Gold Operation were 1,575,200 tonnes, grading 6.14 grams per tonne or 311,100 ounces of gold. Mineral Resources at the Seabee Gold Operation included Measured and Indicated Mineral Resources of 344,200 ounces and Inferred Mineral Resources totalling 603,400 ounces. Financial Capacity During the first quarter of 2013, the Company expanded its current debt facilities with its existing bank to $25.0 million and executed a non-binding term sheet with Crown Capital Partners Inc. (“CCP”) for an additional debt facility of $25.0 million (please see financing section below). The new debt facilities will facilitate the retirement of the Company’s outstanding debentures (which mature in May 2013) and allow for the necessary expansion capital at Santoy Gap to support the updated Life of Mine Plan. Strategically Attractive and Accretive Transactions Late in 2011, Claude and St. Eugene jointly announced that they had entered into a definitive agreement pursuant to which Claude would acquire, by way of a court-approved plan of arrangement, all of the shares of St. Eugene that it did not already own. The acquisition closed on February 1, 2012 and is the logical consolidation of the Amisk Gold Project, including its mineral resources. Claude issued 8.7 million shares as consideration for St. Eugene. Looking forward, Management remains focused on executing strategically attractive and accretive transactions that are consistent with the strategic plan and focus of the Company. Shareholder Value Management believes that, with current market conditions and share performance, the Company is undervalued. However, the Company continues to make what it believes to be the best decisions to maximize shareholder value. These decisions include:
• improving the treasury of the Company with the potential completion of the debt restructuring in the first half of 2013;
• improving or sustaining the resource base at the Seabee Gold operation; • developing an updated Life of Mine Plan at Seabee which forecasts an increase to annual
production; and • taking steps to complete accretive and strategically attractive transactions.
During 2013 and beyond, the Company will continue to advance these projects in order to further develop shareholder value by:
• rationalizing the application of capital and further implementing cost control programs and systems and processes intended to reduce unit operating costs at the Seabee Gold Operation;
• advancing a scoping level analysis on the Company’s 100 percent owned Madsen Exploration Project; and
• completing the Amisk PEA. In addition to the above, the Company has added seven new managers at the Seabee Gold Operation with a combined 75 years of operating experience. With the continued support from a strong gold price and expanding resources, Claude is confident that the combination of the Company’s Seabee, Amisk and Madsen properties provide a strong production and asset base in established politically safe Canadian mining and exploration districts.

2012 Annual Management’s Discussion and Analysis (in thousands of CDN dollars, except as otherwise noted) Page 8
Claude Resources Inc.
MINING OPERATIONS RESULTS Seabee Gold Operation At the Seabee Gold Operation, Claude is focused on executing the expansion of its production profile and lowering unit costs over the next several years by maximizing gold output from the near surface Santoy 8 and Santoy Gap deposits as well as increasing margins at the Seabee Mine via the shaft extension project which will provide more efficient transportation of ore and waste from the Seabee Deep and L62 deposits. The Company is also continuing with its review of operating processes and procedures to identify and implement efficiencies designed to increase production and lower operating costs. During 2012, the Company milled 275,235 tonnes at a grade of 5.86 grams of gold per tonne (2011 – 257,181 tonnes at a grade of 5.68 grams of gold per tonne). With mill recoveries relatively unchanged year over year, the increase in ounces produced is attributable to increased tonnes milled and slightly grade. The increase in tonnes milled and lower grade year over year was due to increased mining activity at the lower grade Santoy 8 deposit offset by fewer tonnes from Seabee, a function of mine sequencing and development schedules. Table 3: Seabee Gold Operation Annual Production and Cost Statistics Dec 31 Dec 31 2012 2011
Operating Data Tonnes Milled 275,235 257,181 Head Grade (grams per tonne) 5.86 5.68 Recovery (%) 95.6% 95.3% Gold Produced (ounces) 49,570 44,756 Gold Sold (ounces) 48,672 44,632 Financial Data Revenues (CDN$ million) $80.8 $69.7 Production Costs (CDN$ million) $48.5 $40.5 Cash Operating Costs (CDN$/oz) (2) $997 $908 Cash Operating Costs (U.S.$/oz) (2) $998 $918 Seabee Mine During 2012, the Seabee Mine produced 32,626 ounces (2011 – 31,448 ounces). This increase was attributable to a 13 percent increase in grade offset by a decrease in tonnes milled which were impacted by prioritization of the Shaft Extension Project. Table 4: Seabee Mine Annual Production Statistics Dec 31 Dec 31 2012 2011
Tonnes Milled 147,051 160,811 Tonnes per Day 402 441 Head Grade (grams per tonne) 7.21 6.39 Gold Produced (ounces) 32,626 31,448 At the L62 Zone, the series of intercepts with above average true widths and economic gold grades represent a near term opportunity to improve operating margins at the Seabee Operation. These intercepts are near existing underground infrastructure. Development at the L62 Zone was initiated during the third quarter with long-hole production initiated during the fourth quarter.

2012 Annual Management’s Discussion and Analysis (in thousands of CDN dollars, except as otherwise noted) Page 9
Claude Resources Inc.
Santoy Mine Complex During 2012, the Santoy Mine Complex produced 16,944 ounces of gold (2011 – 13,308). These results were attributable to increased tonnes partially offset by a decrease in grade. Tonnage throughput per day was in line with Management’s expectation for 2012 and is expected to increase during 2013. Table 5: Santoy 8 Mine Annual Production Statistics Dec 31 Dec 31 2012 2011
Tonnes Milled 128,184 96,370 Tonnes per Day 350 264 Head Grade (grams per tonne) 4.31 4.50 Gold Produced (ounces) 16,944 13,308 Capital Projects
Mill
The Seabee Gold Operation’s Mill consists of a single stage crushing circuit and a two stage grinding circuit, followed by leaching. The Mill has been expanded to a peak capacity of 1,050 tonnes, with the operation capable of sustaining approximately 850 tonnes per day on average under the Seabee Gold Operation’s current Life of Mine Plan. During the first half of 2012, major upgrade work on the #1 regrind ball mill and an upgrade to the CIP tanks was completed. An eight day planned shutdown, originally scheduled for the third quarter, was completed early in the fourth quarter. Stockpiling of ore occurred during the shutdown and full year production numbers were not impacted.
Further expansions to the Mill are being evaluated to accommodate future sustained capacity and production increases expected from the L62 Zone and the Santoy Gap deposit.
Shaft Extension The Company’s shaft extension project at the Seabee Mine deepened the shaft from 600 metres to 980 metres. After a 20 day shutdown, this project was completed early in the first quarter of 2013. During the 20 day shutdown the Company was able to maintain production that averaged over 700 tonnes per day throughput to the Seabee Mill which originated from the Santoy Mine Complex and from the upper portions of the Seabee Mine. During the shutdown the Company continued underground development and mining at Seabee Deep and L62 between the 900 and 1100 metre levels. The shaft extension project was undertaken to provide more efficient transportation of ore and waste from underground to surface. The reduction of trucking distance and ore handling are anticipated to result in lower diesel consumption, reduced maintenance costs and improved ventilation. Overall Seabee Deep and L62 mining costs are expected to improve by as much as 10 percent per tonne. Camp In order to accommodate the increased workforce at the Seabee Gold Operation, the Company’s Board of Directors approved upgrades to Seabee’s camp facilities. Modular accommodation facilities were purchased and transported to the Seabee Gold Operation over the annual winter ice road with installation completed early in the second quarter. In addition to the modular facilities, on site construction of other new accommodations began during the first quarter with occupancy beginning late in the third quarter. EXPLORATION RESULTS Claude continued to advance its exploration and development strategy during 2012. Exploration at the Seabee Gold Operation focused on expanding and delineating the L62 Zone and Santoy Gap deposit and advancing several regional targets. At the Amisk Gold Project, exploration during the year continued to

2012 Annual Management’s Discussion and Analysis (in thousands of CDN dollars, except as otherwise noted) Page 10
Claude Resources Inc.
expand and confirm the NI 43-101 open-pit resource estimate. At Madsen, the Company completed its three-rig, surface and underground drill program during 2012. The program focused on evaluating the 8 Zone Trend, the Austin and McVeigh Tuff and the Main Madsen Trend below the 4,000 foot level. All exploration activities were carried out under the direction of Qualified Person, Brian Skanderbeg, P. Geo., Senior Vice President and Chief Operating Officer. Seabee Gold Operation The Seabee Gold Operation is located northeast of La Ronge, Saskatchewan and is host to the producing Seabee Mine and Santoy Mine Complex as well as the L62 Zone, Santoy Gap and Regional exploration targets.
Figure 1: Seabee Property regional map showing significant gold deposits and occurrences. At the Seabee Property, exploration in 2012 was successful in expanding the Gap while converting nearly half of the inferred ounces to an indicated resource. Drilling tested over one kilometre of prospective strike-length north of Santoy Gap deposit toward the Santoy 7 deposit as well as completed the proposed program at the Neptune target. The L62 deposit at Seabee was also expanded up-plunge during the fourth quarter and has been incorporated into the Company’s December 31, 2012 Mineral Reserve and Mineral Resource estimate. Santoy Region The Santoy Region includes the Santoy 8 and Santoy Gap deposits, which are part of the Santoy Mine Complex. During 2013, exploration will focus on evaluating the down-plunge extension of the Santoy Gap and Santoy 8A deposits, expanding recently discovered parallel zones near the Santoy Region and on initial drill testing of several near-Seabee targets. Infill drilling at the Santoy Gap deposit will also be prioritized to convert additional ounces from the inferred to indicated category. Gold mineralization at the Santoy Region is hosted in siliceous, shear structures with sulfide-chlorite-quartz veins and in silicified granitoid sills. The mineralized lenses dip moderately to steeply eastward and are

2012 Annual Management’s Discussion and Analysis (in thousands of CDN dollars, except as otherwise noted) Page 11
Claude Resources Inc.
amenable to bulk mining techniques. Gold mineralization of the Santoy 8 ore lens occurs over a strike length of 600 metres, a depth of 500 metres and remains open along strike and down plunge to the north. The Santoy 8E ore lens has been intercepted over a strike length of 200 metres, depth of 250 metres and remains open along strike and down plunge to the north. The true thickness of the Santoy 8 deposits varies from 1.5 metres to 15 metres. The Santoy Gap deposit is located 400 to 900 metres north of underground infrastructure, immediately on strike and adjacent to the Santoy 8 deposit within the Santoy Mine Complex. The Company’s 2012 exploration program focused on aggressively exploring the Santoy Gap deposit and its relationship to the Santoy 8 ore body to depths up to 750 metres. Infill and exploration drilling continued to confirm and expand the Santoy Gap system. A total of 71 holes and 35,000 metres were completed in and around the Santoy Gap and along the Santoy Regional Shear Zone during 2012. The Santoy Gap system remains open down plunge to the north, along strike to the south and at depth. These recent intercepts at depth may link with the existing Santoy 8 resource 300 metres to the south. Highlights from 2012 Santoy Gap drilling include: Table 6: Highlights from 2012 Santoy Gap drilling
Hole ID Easting Northing From (m) To (m) Grade (g/t) Width
(m) Zone
JOY-12-630 598791 6170890 272.27 272.77 13.60 0.50 GAP JOY-12-636 599035 6170957 415.77 432.50 6.91 16.73 GAP JOY-12-638 599035 6170957 398.00 400.30 13.94 2.30 GAP JOY-12-643 598950 6170670 181.75 183.57 41.88 1.82 GAP JOY-12-648 599073 6170506 61.92 62.42 17.25 0.50 Other
And 158.00 159.00 11.45 1.00 GAP JOY-12-665 599094 6170889 378.25 380.00 13.84 1.75 GAP JOY-12-667 599000 6170595 124.57 126.24 10.75 1.67 GAP JOY-12-670 599010 6170745 253.59 255.97 11.50 2.38 GAP JOY-12-674 599207 6170942 520.15 526.45 4.67 6.30 GAP
And 566.25 567.25 49.50 1.00 FW JOY-12-677 599154 6170781 321.04 350.78 14.58 29.74 GAP JOY-12-678 598827 6170985 230.50 231.50 50.30 1.00 GAP JOY-12-679 599155 6170775 343.99 364.28 13.81 20.29 GAP JOY-12-682 599155 6170775 374.60 375.60 27.20 1.00 GAP
And 400.80 405.50 11.07 4.70 GAP JOY-12-686 599287 6170925 642.40 648.33 8.16 5.93 GAP JOY-12-688 599481 6170719 416.20 422.20 5.07 6.00 HW JOY-12-689 599537 6170658 382.84 387.37 3.51 4.53 HW
And 603.00 604.32 4.68 1.41 GAP And 607.50 609.08 5.03 1.58 GAP
Note: Composites were calculated using a 3.0 g/t Au cut-off grade and may include internal dilution. True widths are interpreted to be 75 to 95 percent of drilled width. Assay results are uncut.

2012 Annual Management’s Discussion and Analysis (in thousands of CDN dollars, except as otherwise noted) Page 12
Claude Resources Inc.
Figure 2: Santoy Region Composite Longitudinal Section. In addition to extending the mineralized system, the program discovered a sub-parallel lens to the Santoy Gap, approximately 150 metres to the east. These latest drill intercepts continue to affirm the high prospectivity of the Santoy Regional Shear Zone, hosting multiple deposits over a three kilometre strike length. Based on the Santoy Gap inferred resource, positive exploration results and proximity to the existing Santoy 8 infrastructure, the Company has initiated an 850 metre long exploration drift to allow for infill drilling and upgrading of the inferred resource.
Figure 3: Map of the Santoy Region

2012 Annual Management’s Discussion and Analysis (in thousands of CDN dollars, except as otherwise noted) Page 13
Claude Resources Inc.
L62 Zone
The L62 Zone is located approximately 200 metres from existing Seabee Underground infrastructure on multiple levels. Exploration of this zone defined a resource base between 500 and 1,000 metres below surface. Drilling continued during the fourth quarter of 2012 and will continue through the first half of 2013. The deposit remains open up dip and results have been incorporated into the Company’s 2012 year-end Mineral Reserve and Mineral Resource update.
Figure 4: Seabee Mine Composite Longitudinal Section (L62 Zone Discovery) Seabee Regional Exploration of the Seabee Regional area has included work in the Pine, Pigeon and Laonil Lake areas. Grass roots work has focused on examining these prospective regional structures. Amisk Gold Project The potential of the Amisk Gold Project continues to be critically evaluated by the Company. The Amisk Gold Project is located in the Flin Flon-Snow Lake Greenstone Belt. The project is host to the Amisk Gold Deposit as well as a large number of gold occurrences and prospects. While the Amisk PEA is advanced, future exploration at Amisk during 2013 has been reduced and is dependent to some degree on the results of the Amisk PEA. The 2012 regional exploration campaign at Amisk investigated a number of high-priority targets, some of which warrant further testing in 2013. Consultants will be used to re-interpret historical geophysical data in order to rank and prioritize regional drill targets. Regional potential remains high and exploration maturity low. Field work and extensive compilation in 2012 have resulted in the emergence of an extensive list of exploration targets that are currently being prioritized for assessment in 2013. Completion of the Amisk PEA is expected during Q2 2013.

2012 Annual Management’s Discussion and Analysis (in thousands of CDN dollars, except as otherwise noted) Page 14
Claude Resources Inc.
During 2012, the Company also staked an additional 16,033 hectares on the western portion of the Amisk Gold Project during 2012. During the second half of 2012, on the Company’s newly acquired claims and western block of the Amisk Gold Project, reconnaissance work occurred with the goal of identifying similarities to Amisk’s historical geology and for potential drill targets. The newly acquired claims host potential for Amisk-style gold-silver (“Au-Ag”) mineralization as well as conventional base-metal deposits typical of the Flin Flon belt. No drilling is planned for 2013 on the newly acquired claims; however, the Company expects to continue with target development, ranking and ground-base reconnaissance in the area.
Figure 5: Amisk Gold Project Results from a summer historic core sampling program and 2011 and 2012 drilling expanded the mineralized system and confirmed grade continuity of the resource model. Gold and silver mineralization is associated with a sequence of quartz porphyritic, rhyolitic lapilli tuffs and flows hosting disseminations and stringers of pyrite, sphalerite, galena, tetrahedrite and chalcopyrite. Drilling has intercepted the mineralized system over a strike length of 1,200 metres, width of 400 metres and depths of in excess of 600 metres. The system remains open to the southwest, southeast, northwest and at depth.

2012 Annual Management’s Discussion and Analysis (in thousands of CDN dollars, except as otherwise noted) Page 15
Claude Resources Inc.
Figure 6: Cross Section A-A’ of the Amisk Gold Property The Company’s 2011 and 2012 drill programs at Amisk focused specifically on testing the limits of the mineralized footprint north of the current pit outline, targeting depth extension below the pit bottom and infill drilling to evaluate potential upgrade of categories in the resource estimate completed by SRK. Drilling successfully confirmed continuity of gold mineralization within the northern and eastern portion of the deposit as well as demonstrated the potential for expansion to the east and southeast.
Mineralization intercepted in the drilling is consistent with the current resource model and is associated with a sequence of quartz porphyritic, rhyolitic lapilli tuffs and basaltic tuffs and argillite hosting disseminations, stringers and semi-massive intervals of pyrite, sphalerite, galena, tetrahedrite, pyrrhotite and chalcopyrite. Drill hole AL-11-319 confirmed continuity of gold mineralization within the southeastern portion of the deposit as well as demonstrated the potential for expansion to the east and southeast. The program tested from surface to in excess of 700 metres depth and was designed to expand the limits of the Amisk Gold deposit as well as infill within the northern and eastern portion of the deposit. During 2011, the Company reported positive metallurgical testwork results at the Amisk Gold Project. Initial metallurgical testing indicates that gold and silver mineralization is amenable to conventional cyanide leaching. Results from testing on three composite samples from the Amisk Gold deposit have returned an average of 89.4 percent recovery for gold, ranging from 85.2 percent to 91.7 percent and an average of 80.8 percent recovery for silver, ranging from 66.4 percent to 92.8 percent. Detailed results are presented in the table below.

2012 Annual Management’s Discussion and Analysis (in thousands of CDN dollars, except as otherwise noted) Page 16
Claude Resources Inc.
Table 7: Metallurgical Testwork Results, Amisk Gold Project
Grade Recovery (Cyanidation)
Size Fraction
Composite ID Au
(g/T) Ag
(g/T) Au (%) Ag (%) P 80 (um)*
Low Grade 0.50 7.4 89.8 70.9 72 Medium Grade 0.85 9.2 85.2 88.9 146 Medium Grade 0.85 9.2 89.1 84.8 117 Medium Grade 0.85 9.2 91.0 92.8 72 High Grade 1.68 8.4 91.7 66.4 92 * Denotes size fraction of grind that 80 percent of material passed. During 2012, in addition to focusing on growth of the gold and silver resource base, the presence of significant grades of zinc and lead in the hanging wall were evaluated and further evaluation of pit-proximal base-metal targets has resulted in advancement of these targets to a drill-ready stage. Work on the external Amisk PEA continued during 2012 and an initial draft is expected to be received during the second quarter of 2013. Looking forward at Amisk, exploration will focus on completion of preliminary economic studies and further evaluation of the underground potential. Madsen Project Following the four year advanced exploration program and moving into 2013, Claude plans to advance the Madsen project into a scoping level study as well as evaluate further surface exploration targets. The evaluation will provide key input into a decision to advance a Madsen PEA, conceptually evaluating the value and development potential of all significant resource domains. The Madsen Mine property currently hosts a NI 43-101 compliant Indicated Resource of 928,000 ounces at 8.93 grams per tonne and an Inferred Resource of 297,000 ounces at 11.74 grams per tonne. The property also hosts significant surface and underground infrastructure including a permitted tailings facility, 500 tonne per day mill and a 1,250 metre deep shaft.
Figure 7: Madsen Longitudinal Section

2012 Annual Management’s Discussion and Analysis (in thousands of CDN dollars, except as otherwise noted) Page 17
Claude Resources Inc.
Figure 8: Madsen Property Overview
Exploration efforts at the Madsen Project continued to focus on the 8 Zone Trend which hosts the past-producing 8 Zone and is highly prospective for future high grade discoveries. During 2012, Phase II underground and surface drilling completed 16 holes totaling over 19,000 metres. Targeting the 8 Zone plunge and strike continuity as well as the Austin and McVeigh Tuff plunge continuity, the Company utilized two underground drill rigs, active on the 16th level, and one surface drill rig. Drilling continued to expand the 8 Zone plunge at depth and demonstrated significant depth extension to the Austin and McVeigh Tuff. Encouraging results were returned from the 2012 program, extending the 8 Zone system at depth and confirming conceptual potential beneath the Austin Tuff. 8 Zone
During 2012, Phase II underground drilling continued from the 16th level which provides the ideal drill platform to explore both at depth as well as the strike potential of the 8 Zone Trend. A total of nine drill holes, targeting the down plunge continuity of the 8 Zone, were completed in 2012. Drill holes MUG-12-20, -26, -28 and -30 confirmed plunge continuity, returning visible-gold bearing intercepts of up to 26.50 grams per tonne over 2.00 metres. Drill hole MUG-12-25b intercepted a strong footwall zone returning 14.55 grams per tonne over 2.00 metres. These intercepts confirmed the 8 Zone system 250 metres down plunge from historic mining as well as indicate potential for high grade, sub-parallel lenses. The system continues to remain open down plunge and along strike to the east.
Drill holes targeting the western strike continuity of the 8 Zone include MUG-11-19, MUG-12-21, -22, -23 and -24 (Figure 9). Drill hole 21 intercepted silicified, biotite-altered basalt and returned gold assays of 9.53 grams per tonne over 2.00 metres, approximately 850 metres below surface. This intercept is in the hanging-wall of the 8 Zone system and interpreted to correlate with and be an extension of the Austin Tuff. Importantly, 2011 drilling in this area intercepted several high grade intervals within the McVeigh Tuff. The combination of well-mineralized Austin and McVeigh intercepts, 500 metres along strike and west from historic stopes, indicates the potential for a new shoot development.

2012 Annual Management’s Discussion and Analysis (in thousands of CDN dollars, except as otherwise noted) Page 18
Claude Resources Inc.
Figure 9: 8 Zone Longitudinal Section
Drill holes targeting the strike continuity of the 8 Zone included MUG-11-10, 11, 13, 15, 17 and 19. Drill hole 13 and drill hole 17 intercepted silicified, biotite-altered basalt and returned 15.70 grams per tonne over 2.00 metres and 53.70 grams per tonne over 0.70 metres, approximately 950 metres below surface. These intercepts are in the hanging-wall of the 8 Zone system and interpreted to correlate with and be an extension of the McVeigh Tuff, located approximately 650 metres up-dip. The McVeigh Tuff hosts a current Indicated Resource of 115,000 ounces at 9.59 grams per tonne and has seen very limited drill testing below 350 metres. In addition to the McVeigh mineralization, the 8 Zone structure is developed in all holes completed along strike and is characterized by anomalous gold associated with biotite-altered, variably silicified basaltic and ultramafic lithologies.
Table 8: Summary of 2012 Phase II drill results from Madsen drilling
Hole-ID From To Width (m) Grade (g/t) Zone
AD-11-01 2,376.0 2,378.0 2.0 14.30 Austin Tuff AD-12-01b 1,887.0 1,889.0 2.0 3.43 Austin Tuff AD-12-02a Anomalous MUG-11-18d Anomalous MUG-12-18d 821.0 823.0 2.0 6.52 8 Zone – Main MUG-11-19 Anomalous
MUG-12-20 795.0 797.0 2.0 26.50 8 Zone - Main and 882.9 884.2 1.3 8.12 8 Zone - FW
MUG-11-21 102.0 104.0 2.0 9.53 Austin Tuff MUG-12-22 Anomalous MUG-12-23 Anomalous MUG-12-24 547.0 549.0 2.0 4.55 8 Zone - Main MUG-12-25b 1,045.0 1,047.0 2.0 14.55 8 Zone - FW MUG-12-26 833.0 834.5 1.5 12.00 8 Zone - Main

2012 Annual Management’s Discussion and Analysis (in thousands of CDN dollars, except as otherwise noted) Page 19
Claude Resources Inc.
Table 8: Summary of 2012 Phase II drill results from Madsen drilling
Hole-ID From To Width (m) Grade (g/t) Zone
MUG-12-27 NSI
MUG-12-28 787.5 789.0 1.5 4.75 8 Zone – HW and 834.0 835.5 1.5 29.60 8 Zone - Main
MUG-12-29 361.0 363.0 2.0 17.70 McVeigh Tuff MUG-12-30 951.0 952.0 1.0 7.77 8 Zone - FW
∗ Composites calculated using a 3 grams per tonne Au cut-off grade. Reported width is drilled length and interpreted to
represent 65 - 85 percent of true width. NSI - No Significant Intercept. Anomalous - Assayed between 1 and 3 grams per tonne of gold.
Results obtained from 2011 and 2012 drilling have been encouraging and continue to demonstrate that the 8 Zone is a high grade gold system that has strong vertical continuity and remains open at depth and along strike to the northeast. Furthermore, the discovery of economic grades and widths hosted within the depth continuity of the McVeigh Tuff opens up significant exploration potential. During 2013, Claude plans to advance the Madsen project into a scoping level study as well as evaluate further surface exploration targets. Austin and McVeigh Tuffs In addition to Phase II underground drilling, the Company completed three deep surface drill holes to evaluate the Austin Tuff at elevations of 1,200 to 2,000 metres below surface. Drill holes AD-11-01, AD-12-01b and -02a intercepted widespread alteration and mineralization, returning gold assays of up to 14.30 grams per tonne over 2.00 metres. These holes are the deepest completed to date on the property and confirm the development of the Austin Tuff 700 metres below historic mine stopes. The Austin Tuff continues to remain open down plunge and along strike to the east. Quality Assurance and Quality Control Procedures Rigorous quality assurance and quality control procedures have been implemented including the use of blanks, standards and duplicates. Geochemical analyses were submitted to ALS Chemex in Vancouver, British Columbia and or the Seabee minesite lab. The former laboratory is ISO approved. Core samples were analyzed by a 30 gram gold fire assay with an atomic absorption and gravimetric and or screen fire finish. MINERAL RESERVES AND MINERAL RESOURCES The Mineral Reserves and Mineral Resources estimates are conducted under the direction of Qualified Persons Brian Skanderbeg, P.Geo., Senior Vice President and Chief Operating Officer and Peter Longo, P.Eng., Vice President, Operations. Seabee Gold Operation At December 31, 2012, Proven and Probable Reserves in the Seabee Gold Operation were 1,575,200 tonnes, grading 6.14 grams per tonne or 311,100 ounces of gold. The Company’s Mineral Resources at its Seabee Gold Operation included Measured and Indicated Mineral Resources of 344,200 ounces and Inferred Mineral Resources totalling 603,400 ounces. Results obtained from drilling completed during 2012 from the Santoy Gap deposit were incorporated into and had a material impact on the Seabee Operation’s updated NI 43-101 resource calculation as at December 31, 2012 (Please see Claude news release “Claude Resources Inc. Increases Resource Base and Grade at Santoy Gap” dated December 3, 2012).

2012 Annual Management’s Discussion and Analysis (in thousands of CDN dollars, except as otherwise noted) Page 20
Claude Resources Inc.
Table 9: Seabee Gold Operation Mineral Reserves and Mineral Resources
Proven and Probable Reserves
Projects December 31, 2012 December 31, 2011
Tonnes Grade (g/t) Ozs Tonnes Grade (g/t) Ozs Seabee 947,100 7.26 221,100 1,062,900 6.58 224,900 Santoy 8 628,100 4.45 89,900 997,100 4.08 130,600 Totals 1,575,200 6.14 311,100 2,059,900 5.37 355,600
Measured and Indicated Mineral Resources Projects Tonnes Grade (g/t) Ozs Tonnes Grade (g/t) Ozs Seabee 45,400 4.86 7,100 127,400 4.65 19,000 Santoy 8 59,300 3.28 6,200 12,600 5.04 2,000 Santoy Gap 994,000 8.80 281,200 - - - Porky Main 160,000 7.50 38,600 160,000 7.50 38,600 Porky West 111,000 3.10 11,000 111,000 3.10 11,000 Totals 1,369,600 7.82 344,200 410,900 5.35 70,700
Inferred Mineral Resources Projects Tonnes Grade (g/t) Ozs Tonnes Grade (g/t) Ozs Seabee 355,600 8.55 97,700 813,900 6.83 178,800 Santoy 8 518,700 5.91 98,600 850,000 5.46 149,300 Santoy Gap 1,875,000 5.92 356,900 2,321,000 6.63 495,000 Porky Main 70,000 10.43 23,500 70,000 10.43 23,500 Porky West 138,300 6.03 26,800 138,300 6.03 26,800 Totals 2,957,600 6.35 603,400 4,193,200 6.48 873,400
For the above table of reserves, the following mining and economic factors have been applied:
• In 2012, Mineral Reserves and Mineral Resources estimates were conducted under the direction of Qualified Persons Brian Skanderbeg, P.Geo., Senior Vice President and Chief Operating Officer and Peter Longo, P.Eng., Vice President, Operations.
• In 2011, mineral reserves and mineral resources were estimated by Claude personnel and audited by SRK. • Mineral Reserves and Mineral Resources estimates have been completed in accordance with CIM Standards and are
reported in accordance with Canadian Securities Administrators’ NI 43-101. Mineral Resources are exclusive of Mineral Reserves.
• Mineral Reserves and Mineral Resources are reported at a cut-off grade of 4.5 grams per tonne for the Seabee Mine and 3.0 grams per tonne for Santoy 8, Santoy Gap, Porky Main and Porky West. This is based on a gold price of CDN $1,500 per ounce.
• A dilution factor averaging approximately 15 percent is applied. • Historic stope recovery averages 85 percent. • A specific gravity of 2.8 to 2.9 is utilized in tonnage estimates. • All figures are rounded to reflect the relative accuracy of the estimates. Totals may not represent the sum of the parts due to
rounding. • Mineral resources are not mineral reserves and do not have demonstrated economic viability.
Amisk Gold Project At the Amisk Gold Project, Claude’s independent NI 43-101 compliant resource calculation outlines an Indicated Resource of 921,000 ounces of 0.95 grams of Au Eq per tonne and an Inferred Resource of 645,000 ounces at 0.70 grams of Au Eq per tonne. Table 10: Amisk Gold Project Consolidated Mineral Resource Statement*
Resource Class Quantity Grade (g/tonne) Contained Ounces (000’s) (000’s tonnes) Au Ag Au Eq Au Ag Au Eq
Indicated 30,150 0.85 6.17 0.95 827 5,978 921 Inferred 28,653 0.64 4.01 0.70 589 3,692 645 * Reported at a cut-off of 0.40 grams of gold equivalent (Au Eq) per tonne using a price of U.S. $1,100 per ounce of gold and U.S. $16 per ounce of silver inside a conceptual pit shell optimized using metallurgical and process recovery of 87 percent, overall ore mining

2012 Annual Management’s Discussion and Analysis (in thousands of CDN dollars, except as otherwise noted) Page 21
Claude Resources Inc.
and processing costs of U.S. $15 per tonne and overall pit slope of 50 degrees. All figures are rounded to reflect the relative accuracy of the estimates. Mineral Resources are not Mineral Reserves and do not have demonstrated economic viability. The mineral resources for the Amisk Gold Project are sensitive to the selection of cut-off grade. The table below presents the quantity and grade estimates at a range of cut-off grades inside the conceptual pit shell considered for reporting the Mineral Resource Statement. A cut-off value of 0.4 grams of gold equivalent per tonne was selected based on optimization results and benchmarking against similar deposits. Table 11: Global Block Model Quantity and Grade Estimates, Amisk Lake Gold Project at Various Cut-off Grades.
Grade Indicated Inferred Au Eq (gpt)
Quantity (tonnes)
Au Eq (gpt)
Ounces Au Eq
Quantity (tonnes)
Au Eq (gpt)
Ounces Au Eq
0.10 47,496,802 0.70 1,068,940 102,734,810 0.36 1,189,080 0.20 44,036,914 0.75 1,061,865 72,604,675 0.45 1,050,433 0.30 37,422,417 0.83 998,622 45,000,464 0.57 824,675 0.40 30,150,090 0.95 920,881 28,653,135 0.70 644,854 0.50 23,533,117 1.09 824,702 19,446,358 0.82 512,676 0.60 18,322,858 1.25 736,367 13,665,490 0.94 412,994 0.70 14,359,129 1.41 650,936 9,491,034 1.07 326,504 0.80 11,418,785 1.58 580,054 6,659,786 1.20 256,941 0.90 9,206,976 1.76 520,980 4,825,758 1.34 207,903 1.00 7,606,617 1.93 471,998 3,589,543 1.48 170,802 1.50 3,472,946 2.80 312,642 1,078,945 2.16 74,928
Note: The reader is cautioned that the figures in this table should not be misconstrued with a Mineral Resource Statement. The figures are only presented to show the sensitivity of the block model estimates to the selection of cut-off grade. For the Amisk Gold Project, an updated NI 43-101 resource statement, inclusive of all 2012 drilling, is will be completed in conjunction with the external Amisk PEA for the Amisk Gold Project. Madsen Exploration Project At the Madsen Exploration Project, Claude’s independent NI 43-101 compliant resource calculation outlines an Indicated Resource of 928,000 ounces of 8.93 grams per tonne and an Inferred Resource of 297,000 ounces at 11.74 grams per tonne.
Table 12: Consolidated Mineral Resource Statement (1) for the Madsen Mine, Ontario Resource
Class Zone Tonnes Grade (g/tonne)
Grade (oz/ton)
Contained Gold (oz)
Indicated Austin 1,677,000 7.92 0.23 427,000
South Austin 850,000 9.32 0.27 254,000 McVeigh 374,000 9.59 0.28 115,000 8 Zone 335,000 12.21 0.36 132,000 Total 3,236,000 8.93 0.26 928,000
Inferred Austin 108,000 6.30 0.18 22,000 South Austin 259,000 8.45 0.25 70,000 McVeigh 104,000 6.11 0.18 20,000 8 Zone 317,000 18.14 0.53 185,000 Total 788,000 11.74 0.34 297,000
Note: mineral resources are not mineral reserves and do not have demonstrated economic viability. All figures have been rounded to reflect the relative accuracy of the estimates. Reported at a cut-off grade of 5.0 g/t gold based on U.S. $1,000 per troy ounce of gold and gold metallurgical recoveries of 94 percent.

2012 Annual Management’s Discussion and Analysis (in thousands of CDN dollars, except as otherwise noted) Page 22
Claude Resources Inc.
The Company’s independent NI 43-101 Mineral Resource evaluation for the Madsen Mine was completed by SRK in December 2010. This Mineral Resource evaluation was based on historical exploration and mining data, Phase I underground drilling results up to September 27, 2009 and geological and resource modeling. The Mineral Resource evaluation was undertaken on the four separate zones, Austin, South Austin, McVeigh and 8 Zone that comprise the Madsen Gold Mine. The NI 43-101 Technical Report was filed on January 20, 2010. The mineral resources of the Madsen Exploration Project are sensitive to the selection of cut-off grade. The global quantities and grade estimates at three gold cut-off grades are presented in Table 13. The reader is cautioned that the figures presented in this table should not be misconstrued with the mineral resource statement. The figures are only presented to show the sensitivity of the mineral resources to the selection of cut-off grade.
Table 13: Global Block Model Quantities and Grade Estimates* at Various Cut-off Grades. Class Zone Quantity
Tonnage (000’t) Grade
Gold (gpt) Contained Metal
Gold (000’oz) Cut-off (gpt Au) 3 4 5 3 4 5 3 4 5 Indicated Austin‡ 4,299 2,565 1,677 5.40 6.72 7.92 746 554 427
South Austin# 1,553 1,140 850 6.85 8.08 9.32 342 296 254 McVeigh‡ 637 465 374 7.20 8.57 9.59 148 128 115 Zone 8^ 422 370 335 10.49 11.49 12.21 142 136 132
Inferred Austin‡ 782 288 108 4.04 5.12 6.30 101 47 22 South Austin# 630 390 259 5.70 7.09 8.45 116 89 70 McVeigh‡ 155 105 104 5.33 6.09 6.11 27 21 20 Zone 8^ 321 320 317 17.93 17.98 18.14 185 185 185
* The reader is cautioned that the quantities and grade estimates in this table are not included in the resource statement for
the MGP. The figures are presented to show the sensitivity of the block model estimates to the selection of cut-off grade. ‡ Reported considering a geotechnical buffer of 15 feet (4.6 metres). # Reported considering a geotechnical buffer of 10 feet (3.0 metres). ^ Reported with no geotechnical buffer.
FINANCIAL RESULTS OF OPERATIONS Highlights Table 14: Highlights of Financial Results of Operations Dec 31 Dec 31 2012 2011 Revenue $ 80,808 $ 69,659 Divided by ounces sold 48,672 44,632 Average Realized Price per Ounce (CDN$) $ 1,660 $ 1,561 Production costs $ 48,535 $ 40,542 Divided by ounces sold 48,672 44,632 Total cash costs per ounce (CDN$) $ 997 $ 908 Net Cash Margin per Ounce Sold (CDN$) $ 663 $ 653 Depreciation and depletion $ 15,681 $ 11,407 Gross profit $ 16,592 $ 17,710 Net profit $ 5,569 $ 9,454 Earnings per share (basic and diluted) $ 0.03 $ 0.06

2012 Annual Management’s Discussion and Analysis (in thousands of CDN dollars, except as otherwise noted) Page 23
Claude Resources Inc.
Cash Cost, $709
Cash Cost, $908
Cash Cost, $997
Margin, $564
Margin, $653
Margin, $663
$-
$1,000
$2,000
2010 2011 2012
The increase in ounces sold and in average realized price per ounce, partially offset by increased production costs, has positively impacted net cash margin per ounce sold year over year. The Company intends to improve profitability of the Seabee Gold Operation through a combination of improved grade control, cost controls and developing the production profile at lower cost satellite ore bodies, including Santoy 8 and eventually the Santoy Gap deposit. Also, in addition to external consultants being engaged to provide feedback and recommendations on improving operational efficiencies reducing unit operating costs, the Company anticipates that the continued contribution of the Santoy Mine Complex (including the Santoy 8 and Santoy Gap deposits), contribution of ore from the L62 Zone and completion of the shaft extension will be positive catalysts in improving production and lowering overall unit operating costs at the Seabee Gold Operation.
Figure 10: Average Gold Price Realized (CDN$) Figure 11: Cash Cost and Margin Realized (CDN$) Per Ounce Sold Per Ounce Sold Net Profit For the year ended December 31, 2012, the Company recorded net profit of $5.6 million, or $0.03 per share, after a $3.0 million non-cash deferred income tax expense. This compares to a net profit of $9.5 million, or $0.06 per share, after a $0.4 million non-cash deferred income tax expense, for the year ended December 31, 2011 (2010 – $10.3 million, or $0.08 per share). Profit from continuing operations before income tax in 2012 was $8.5 million, or $0.05 per share (2011 - $9.8 million, or $0.06 per share; 2010 - $8.3 million, or $0.05 per share), reflecting a change in the Company’s deferred tax base year over year. Three-year trend The Company’s profit trends with changes in revenue, which has been significantly impacted by the price of gold, and is offset by increasing production costs attributable to increasing labour and input costs. Management is focused on continuing to pursue best practices intended to stabilize unit production costs and has engaged external consultants to provide additional feedback and recommendations on improving operational efficiencies. Revenue In the discussion below, gold revenues for the comparable figures in 2010, net of expenditures, from projects not yet in commercial production have not been included in earnings; rather, these amounts have been offset against the carrying value of the assets. Gold revenue from the Company’s Seabee Gold Operation for the year ended December 31, 2012 increased 16 percent to $80.8 million from $69.7 million reported for the year ended December 31, 2011 (December 31, 2010 - $56.0 million).
$1,273 $1,561 $1,660
$-
$1,000
$2,000
2010 2011 2012
2012 Annual Management’s Discussion and Analysis (in thousands of CDN dollars, except as otherwise noted) Page 24
Claude Resources Inc.
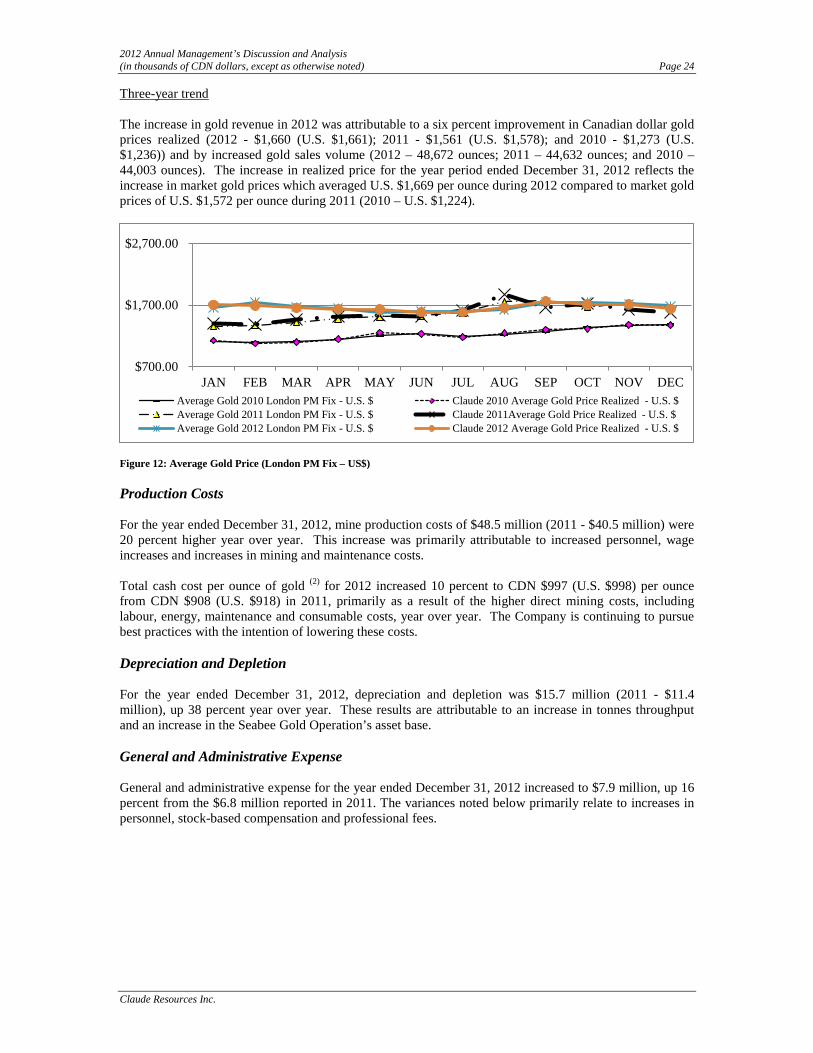
Three-year trend The increase in gold revenue in 2012 was attributable to a six percent improvement in Canadian dollar gold prices realized (2012 - $1,660 (U.S. $1,661); 2011 - $1,561 (U.S. $1,578); and 2010 - $1,273 (U.S. $1,236)) and by increased gold sales volume (2012 – 48,672 ounces; 2011 – 44,632 ounces; and 2010 – 44,003 ounces). The increase in realized price for the year period ended December 31, 2012 reflects the increase in market gold prices which averaged U.S. $1,669 per ounce during 2012 compared to market gold prices of U.S. $1,572 per ounce during 2011 (2010 – U.S. $1,224).
Figure 12: Average Gold Price (London PM Fix – US$) Production Costs For the year ended December 31, 2012, mine production costs of $48.5 million (2011 - $40.5 million) were 20 percent higher year over year. This increase was primarily attributable to increased personnel, wage increases and increases in mining and maintenance costs. Total cash cost per ounce of gold (2) for 2012 increased 10 percent to CDN $997 (U.S. $998) per ounce from CDN $908 (U.S. $918) in 2011, primarily as a result of the higher direct mining costs, including labour, energy, maintenance and consumable costs, year over year. The Company is continuing to pursue best practices with the intention of lowering these costs. Depreciation and Depletion For the year ended December 31, 2012, depreciation and depletion was $15.7 million (2011 - $11.4 million), up 38 percent year over year. These results are attributable to an increase in tonnes throughput and an increase in the Seabee Gold Operation’s asset base. General and Administrative Expense General and administrative expense for the year ended December 31, 2012 increased to $7.9 million, up 16 percent from the $6.8 million reported in 2011. The variances noted below primarily relate to increases in personnel, stock-based compensation and professional fees.
$700.00
$1,700.00
$2,700.00
JAN FEB MAR APR MAY JUN JUL AUG SEP OCT NOV DECAverage Gold 2010 London PM Fix - U.S. $ Claude 2010 Average Gold Price Realized - U.S. $Average Gold 2011 London PM Fix - U.S. $ Claude 2011Average Gold Price Realized - U.S. $Average Gold 2012 London PM Fix - U.S. $ Claude 2012 Average Gold Price Realized - U.S. $

2012 Annual Management’s Discussion and Analysis (in thousands of CDN dollars, except as otherwise noted) Page 25
Claude Resources Inc.
Table 15: Corporate General and Administrative Expense Dec 31 Dec 31 2012 2011 Direct administration $ 5,464 $ 4,788 Stock-based compensation 2,280 1,991 Deferred share units 153 - Total General and Administrative $ 7,897 $ 6,779 Finance Expense Finance expense includes interest expense, accretion expense and derivative gains or losses (if any). For the year ended December 31, 2012, finance expense was $1.5 million, down 52 percent from the $3.1 million reported during 2011. The decreases were attributable to the Company settling certain out-of-the-money derivative instruments during the third quarter of 2011. Finance and Other Income Finance and other income consists of interest income, production royalties pursuant to the Red Mile transactions and other income. For the year ended December 31, 2012, finance and other income of $1.5 million was relatively unchanged year over year. Deferred Income Tax Expense Deferred income tax expense for the year ended December 31, 2012 was $3.0 million (2011 - $0.4 million). This increase in this expense is primarily attributable to the recognition of previously unrecognized deferred tax assets in 2011 of approximately $3.8 million. Liquidity, Financial Resources and Capital Structure The Company monitors its spending plans, repayment obligations and cash resources on a continuous basis with the objective of ensuring that there is sufficient capital within the Company to meet business requirements, after taking into account cash flows from operations and the Company’s holdings of cash and cash equivalents and short-term investments. The Company’s typical cash requirement over the first and second quarters of each year is significant because of the Seabee Gold Operation’s winter ice road resupply, which includes restocking diesel, propane and other large consumables as well as the continued investment in maintenance and growth capital relating to the mining fleet and mine infrastructure. The Company had bank indebtedness of $3.5 million at December 31, 2012 (December 31, 2011 - $2.5 million of cash and cash equivalents and short-term investments of $33.2 million). At December 31, 2012, the Company had a working capital deficiency of $4.1 million (December 31, 2011 - surplus of $42.4 million). Included in the working capital calculation at December 31, 2012 are demand loans and outstanding debentures totaling $5.3 million and $9.7 million, respectively. Demand loans have been classified as current liabilities due to their demand feature. As the debenture is due in less than one year, its balance has been classified as a current liability. Table 16: Working Capital and Current Ratio Dec 31 Dec 31 Percent 2012 2011 Change Current assets $ 24,300 $ 52,004 (53) Current liabilities $ 28,397 $ 9,606 196 Working capital $ (4,097) $ 42,398 (110) Current ratio 0.86 5.4 (84)

2012 Annual Management’s Discussion and Analysis (in thousands of CDN dollars, except as otherwise noted) Page 26
Claude Resources Inc.
The Company’s objective when managing capital is to safeguard its ability to continue as a going concern so that it can continue to provide adequate returns to shareholders and benefits to other stakeholders. The Company manages the capital structure and makes adjustments to it in light of changes in economic conditions and the risk characteristics of the underlying assets. In order to maintain or adjust the capital structure, the Company may issue new shares, sell assets or incur debt. The Company is not subject to externally imposed capital requirements. The Company’s capital structure is comprised of a combination of short-term and long-term debt and shareholders’ equity. The Capital structure of the Company is as follows: Table 17: Schedule of Capital Structure of the Company Capital Structure December 31 December 31 Interest Maturity 2012 2011 Demand loan Repaid during 2012 $ - $ 896 Demand loans Prime + 1.50% Jan-Apr/2015 5,337 - Debenture 12.00% May/2013 9,665 9,452 Total debt $ 15,002 $ 10,348 Shareholders’ equity 192,364 172,895 Debt to equity 7.80% 5.99 % In January 2013, the Company expanded its current debt facilities with its existing bank to $25.0 million and executed a non-binding term sheet with CCP for an additional long-term debt facility of $25.0 million (please see financing section below). The new debt facilities are intended for the retirement of the Company’s outstanding debentures (which mature in May 2013), for expansion capital at the Seabee Gold Operation and for general working capital purposes. Investing Mineral property expenditures during 2012 were $62.5 million, an $11.3 million increase from 2011. Expenditures were comprised of Seabee Mine and shaft development of $22.3 million, exploration costs (focusing on the Santoy Gap deposit, Seabee North, Amisk and Madsen exploration projects) of $20.0 million and property, plant and equipment additions of $20.2 million. Property, plant and equipment additions include mining equipment, camp infrastructure and tailings management facility expansion. The Company utilized its cash on hand and short-term investments to fund these additions. Financing Financing activities during 2012 included the issuance of 338,676 common shares (2011 – 235,614) pursuant to the Company’s Employee Share Purchase Plan and 75,402 common shares (2011 – 648,667) pursuant to the Company’s Stock Option Plan. During 2012, the Company repaid $4.9 million of its demand loans and capital leases outstanding. The proceeds and repayments of demand loans relate to production equipment at the Seabee Gold Operation.
During the first quarter of 2013, the Company has expanded its current debt facilities with its existing financial institution, Canadian Western Bank (“CWB”), to $25.0 million and executed a non-binding term sheet with CCP for an additional long-term debt facility of $25.0 million.

2012 Annual Management’s Discussion and Analysis (in thousands of CDN dollars, except as otherwise noted) Page 27
Claude Resources Inc.
CWB Financing Summary
The CWB facilities consist of leases, demand loans and of a line of credit. The debt expansion is structured as follows:
Facility Previous Amount Current Amount Line of Credit $5,000,000 $10,000,000 Leases/Demand Loans $7,000,000 $10,000,000 Revolving Loan NIL $5,000,000
Interest rates are both fixed and floating and carry a weighted average rate of approximately 4.5 percent.
CCP Financing Summary Upon closing, the CCP offering is anticipated to consist of a five (5) year $25 million debt facility which carries an interest rate of 10 percent of the outstanding principal, compounded and payable monthly. Principal payments, due to begin in 2014, are payable monthly. The facility will include 5.75 million warrants at a strike price of $0.70 which can be exercisable at any time from the closing of the transaction to 5 years following the closing of the transaction. Sources / Uses
Sources of Funds Use of Funds * CCP Term Loan $25,000,000 Refinancing $10,000,000 Working Capital $15,000,000 Total Sources $25,000,000 Total Use $25,000,000
* Approximate balances
Principal Repayment Terms
Period Monthly Amount Annual Amount Months 1 - 12 NIL NIL Months 13 – 59 $300,000 $3,600,000 Due at Maturity $10,900,000
Prepayment Terms
Months Following Closing Prepayment Fee Months 13 – 24 2% Months 25 – 36 1% Months 37 – 60 0%
Financial and Other Instruments In the normal course of its operations, the Company is exposed to gold price, foreign exchange, interest rate, liquidity, equity price and counterparty risks. The overall financial risk management program focuses on preservation of capital and protecting current and future Company assets and cash flows by reducing exposure to risks posed by the uncertainties and volatilities of financial markets. The Company may use derivative financial instruments to hedge some of its exposure to fluctuations in gold prices and foreign exchange rates. The Company does not acquire, hold or issue derivatives for trading purposes. The Company’s management of financial risks is aimed at ensuring that net cash flows are

2012 Annual Management’s Discussion and Analysis (in thousands of CDN dollars, except as otherwise noted) Page 28
Claude Resources Inc.
sufficient to meet all its financial commitments as and when they fall due and to maintain the capacity to fund its forecast project development and exploration strategies. The value of the Company’s mineral resources is related to the price of gold and the outlook for this mineral. Gold and precious metal prices historically have fluctuated widely and are affected by numerous factors outside of the Company’s control, including, but not limited to, industrial and retail demand, central bank lending, forward sales by producers and speculators, levels of worldwide production, short-term changes in supply and demand because of speculative hedging activities and certain other factors related specifically to gold. The profitability of the Company’s operations is highly correlated to the market price of gold. If the gold price declines below the cost of production at the Company’s operations, for a prolonged period of time, it may not be economically feasible to continue production. The Company’s revenues from the production and sale of gold are denominated in U.S. dollars. However, the Company’s operating expenses are primarily incurred in Canadian dollars and its liabilities are primarily denominated in Canadian dollars. The results of the Company’s operations are subject to currency risks. The operating results and financial position of the Company are reported in Canadian dollars in the Company’s consolidated financial statements. The Company did not have any derivative instruments outstanding at December 31, 2012 or December 31, 2011. The Company’s main interest rate risk arises from interest earning cash deposits that expose the Company to interest rate risk. The Company’s liquidity position is managed to ensure sufficient liquid funds are available to meet its financial obligations in a timely manner. The Company manages liquidity risk by continuously monitoring forecast and actual cash flows and ensuring that the Company has the ability to access required funding. The Company is exposed to equity securities price risk arising from investments classified on the balance sheet as available-for-sale. Investments in equity securities are approved by the Board on a case-by-case basis. All of the Company’s available-for-sale equity investments are in junior resource companies listed on the TSX Venture Exchange. The Company is exposed to counterparty risk which is the risk that a counterparty will not complete its obligations under a financial instrument resulting in a financial loss for the Company. The Company does not generally obtain collateral or other security to support financial instruments subject to credit risk; however, the Company only deals with credit worthy counterparties. Accounts receivable comprise institutions purchasing gold under normal settlement terms of two working days. Counterparty risk under derivative financial instruments is to reputable institutions. All significant cash balances are on deposit with high-rated banking institutions. The carrying amount of financial assets recorded in the financial statements represents the Company’s maximum exposure to credit risk without taking account of the value of any collateral or other security obtained.

2012 Annual Management’s Discussion and Analysis (in thousands of CDN dollars, except as otherwise noted) Page 29
Claude Resources Inc.
Contractual Obligations The Company’s contractual and other obligations as at December 31, 2012 are summarized as follows: Table 18: Schedule of Payments / Commitments due by Period
Total Less than
1 year 2-3
Years 4-5
Years More than
5 years Contractual Obligation Demand loans 5,337 2,387 2,950 - - Interest on demand loans 276 191 85 - - Debenture 9,751 9,751 - - - Debenture interest 458 458 - - - Capital lease obligations 1,786 1,495 291 - - Interest on capital leases 58 56 2 - - Office lease 197 123 74 - - 17,863 14,461 3,402 - - During 2012 (and subsequent to December 31, 2012), the Company has been updating its decommissioning and reclamation plans for the Madsen and Seabee properties. It is expected that additional security (approximately $6.5 million) will need to be provided to the applicable regulatory authorities. However, the timing of this security has not yet been determined. As noted above, near-term funding requirements pursuant to the redemption of its outstanding debentures (due on May 23, 2013), have placed the Company in a working capital deficiency. In order to address this working capital deficiency, the Company, subsequent to December 31, 2012, increased its current debt facilities with CWB to the following:
• $10.0 million operating line of credit (previous amount: $5.0 million); • $10.0 million finance lease line (previous amount: $7.0 million); and • $5.0 million revolving loan (new).
In addition to the above, the Company has executed a non-binding term sheet with CCP for an additional long-term debt facility of $25.0 million (Note 22). As of the date of this MD&A, the Company is in negotiations to close the CCP debt facility. Management believes that repayment of the outstanding debentures will occur as required on May 23, 2013. If for any reason the Company is unable to close the CCP debt facility, it could have an impact on the Company’s ability to continue as a going concern and realize assets at their recognized values and to extinguish liabilities in the normal course of business at the amounts stated in the consolidated financial statements. STATEMENTS OF FINANCIAL POSITION Table 19: Select Statements of Financial Position Data Percent Dec 31 Dec 31 Dec 31 Change 2012 2011 2010 2012 to 2011 Total assets $ 234,517 $ 207,887 $ 136,369 13 Non-current liabilities $ 13,756 $ 25,386 $ 11,266 (46) The Company’s total assets were $234.5 million at December 31, 2012, compared to $207.9 million at December 31, 2011; Claude’s asset base primarily consists of non-current assets comprising mineral properties, reflecting the capital intensive nature of the exploration and mining business and the impact of the significant capital expenditures relating to its operations and exploration projects. The $26.6 million net increase resulted from increases of: $5.8 million in Inventories; $2.1 million in Accounts receivable, attributable to the timing of

2012 Annual Management’s Discussion and Analysis (in thousands of CDN dollars, except as otherwise noted) Page 30
Claude Resources Inc.
gold sales and receipt of funds; and $57.8 million in Mineral properties attributable to Seabee Mine development and shaft extension, exploration costs (focusing on the Santoy Gap deposit, Seabee North, Amisk and Madsen exploration projects) and additions to property, plant and equipment. These increases were offset by decreases of: $35.7 million in Cash and cash equivalents and Short-term investments, attributable to the Company’s annual winter road resupply and investment in exploration and Seabee capital projects; $1.0 million in Deferred income tax asset attributable to a change in the Company’s deferred tax base; and $2.5 million in Investments due to the disposition of certain of the Company’s available for sale securities and a decrease in the market value of the remainder these securities. Total liabilities were $42.2 million at December 31, 2012, up $7.2 million from December 31, 2011. This result was attributable to a $3.5 million increase in bank indebtedness and a $1.8 million increase in Accounts payable and accrued liabilities, attributable to the timing and payment of expenditures relating to consumables at the Seabee Gold Operation; a net increase of $2.3 million in the Company’s current and non-current Loans and borrowings attributable to demand loans obtained to fund a portion of the capital equipment resupply at the Seabee Gold Operation; an increase of $9.7 million to the Company’s current debenture payable (offset by a decrease to the long-term portion of the debenture payable) due to the debenture being payable in less than one year; and an increase of $1.1 million in Deferred income tax liability attributable to a change in the Company’s deferred tax base. Shareholders’ equity increased by $19.5 million to $192.4 million at December 31, 2012, from $172.9 million at December 31, 2011. This variance is attributable to an increase in Share capital of $12.7 million due to the issuance of Company stock pursuant to the acquisition of St. Eugene; an increase of $1.9 million to Contributed surplus, a $5.6 million decrease to Accumulated deficit, a result of the net profit for the year; and, a $0.6 million decrease to Accumulated other comprehensive income (loss). Comprehensive income consists of net profit, together with certain other economic gains and losses that are collectively referred to as “other comprehensive income (loss)” or “OCI” and are excluded from the Income Statement. During the year ended December 31, 2012, other comprehensive income decreased to a loss of $0.03 million (December 31, 2011 – comprehensive income of $0.6 million) due to the Company’s disposition of certain available-for-sale securities. KEY SENSITIVITIES Earnings from Claude’s gold operation are sensitive to fluctuations in both commodity and currency prices. The key factors and their approximate effect on earnings, earnings per share and cash flow, based on assumptions comparable to 2012 actuals, are as follows: Gold For a U.S. $10 movement in gold price per ounce, earnings and cash flow will have a corresponding movement of CDN $0.5 million, or $0.00 per share. For a $0.01 movement in the US$/CDN$ exchange rate, earnings and cash flow will have a corresponding movement of $0.8 million, or $0.00 per share. Grade For a 0.25 gram per tonne movement in grade, earnings and cash flow will have a corresponding movement of CDN $3.6 million, or $0.02 per share. SELECTED QUARTERLY FINANCIAL DATA For the quarter ended December 31, 2012, the Company recorded a net profit of $2.4 million, or $0.01 per share, compared to a net loss of $0.2 million, or $0.00 per share, for the comparable period in 2011. Gold revenue generated during the fourth quarter was $21.2 million, a seven percent increase over the $19.9 million reported for the same period in 2011. This was a result of increased gold sales volume compared to the fourth quarter of 2011 (Q4 2012 – 12,732 ounces; Q4 2011 – 11,855 ounces) offset by

2012 Annual Management’s Discussion and Analysis (in thousands of CDN dollars, except as otherwise noted) Page 31
Claude Resources Inc.
slightly lower Canadian dollar gold prices realized Q4 2012 - $1,668 (U.S. $1,683); Q4 2011 - $1,678 (U.S. $1,641). For the three months ended December 31, 2012, total mine operating costs were $10.5 million, down $2.9 million period over period. Operating efficiencies being implemented at the Seabee Gold Operation resulted in mining and maintenance costs being down period over period and resulted in a 27 percent decrease in Canadian dollar cash operating cost per ounce: Q4 2012 – CDN $822 (U.S. $829); Q4 2011 – CDN $1,130 (U.S. $1,105) During the fourth quarter of 2012, depreciation, depletion and accretion of the Company’s gold assets of $4.4 million represented a 13 percent increase compared to the $3.9 million reported during the comparable period in 2011. These results are attributable to a larger asset base being depreciated period over period.
Dec 31 Sept 30 June 30 Mar 31 Dec 31 Sept 30 Jun 30 Mar 31 2012 2012 2012 2012 2011 2011 2011 2011 Tonnes milled 69,698 66,173 72,808 66,556 74,456 66,722 65,502 50,501 Grade processed (grams per tonne) 5.94 7.34 5.45 4.74 4.97 5.51 6.26 6.20 Ounces produced 12,700 15,100 12,200 9,600 11,300 11,300 12,600 9,500 Ounces sold 12,700 14,100 12,300 9,500 11,900 10,900 12,400 9,500 Gold sales ($ millions) 21.2 23.4 20.1 16.1 19.9 18.2 18.2 13.3 Net profit (loss) ($ millions) 2.4 3.0 0.7 (0.5) (0.2) 2.6 5.2 1.8 Net profit (loss) per share (a) 0.01 0.02 0.00 (0.00) 0.00 0.02 0.03 0.01 Average realized gold price (CDN$ per ounce) 1,668 1,663 1,633 1,681 1,678 1,670 1,469 1,408 Average realized gold price (US$ per ounce) 1,683 1,671 1,616 1,679 1,641 1,704 1,518 1,428 Cash cost per ounce (b) (CDN$ per ounce) 822 920 1,082 1,236 1,130 871 717 924 Cash cost per ounce (b) (US$ per ounce) 829 924 1,071 1,234 1,105 888 741 938 Cash flow from operations before net changes in non-cash operating working capital ($ millions) (c)
9.4 8.6 5.3 2.6 7.2 5.7 8.3 3.6
Cash flow from operations per share 0.05 0.05 0.03 0.02 0.04 0.03 0.05 0.03 Weighted average shares outstanding (basic)
173,746 173,746 173,741 170,481 164,351 163,911 155,275 140,361
CDN$/US$ Exchange 0.9914 0.9949 1.0101 1.0012 1.0230 0.9804 0.9676 0.9861
(a) Basic and diluted, calculated based on the number of shares issued and outstanding during the quarter. (b) Denotes a non-IFRS performance measure. For an explanation of non-IFRS performance measures, refer to the “Non-IFRS Performance Measures” section of this MD&A. (c) For an explanation of this performance measure, refer to the “Other Performance Measures” section of this MD&A. The financial results for the last eight quarters reflect the following general trends: improved average realized gold price (which has improved gold revenue and net profit (loss)); lower grade attributable to more feedstock from the Santoy 8 deposit; and increasing cash cost per ounce. ACCOUNTING ESTIMATES Certain of the Company’s accounting policies require that Management make decisions with respect to the formulation of estimates and assumptions that affect the reported amounts of assets, liabilities, revenues and expenses. Claude’s significant accounting policies are contained in Note 3 to the consolidated financial statements. The following is a discussion of the accounting estimates that are critical in determining the Company’s financial results.

2012 Annual Management’s Discussion and Analysis (in thousands of CDN dollars, except as otherwise noted) Page 32
Claude Resources Inc.
Reserves Estimation of reserves involves the exercise of judgment. Forecasts are based on geological, geophysical, engineering and economic data, all of which are subject to many uncertainties and interpretations. The Company expects that, over time, reserve estimates may be revised upward or downward based on updated information. Such information may include revisions to geological data or assumptions, a change in economic data, and the results of drilling and exploration activities. Reserve estimates can have a significant impact on net earnings, as they are a key component in the calculation of depreciation and depletion. In addition, changes in reserve estimates, commodity prices and future operating and capital costs can have a significant impact on the impairment assessments of the applicable assets. Valuation of Properties Claude assesses the carrying values of its properties at the end of each reporting period, or more frequently if warranted by a change in circumstances, to determine whether any indication of impairment exists. If it is determined that carrying values of assets cannot be recovered, the unrecoverable amounts are written off against current earnings. Recoverability is dependent upon assumptions and judgments regarding future prices, costs of production, sustaining capital requirements and economically recoverable ore reserves. A change in assumptions may materially impact the potential impairment of these assets. Decommissioning and Reclamation Claude’s mining, exploration and development activities are subject to various levels of Federal and Provincial Law as well as environmental regulations, including requirements for closure and reclamation. Management’s judgment and estimates are used when estimating reclamation and closure costs. In some cases, these costs will be incurred many years from the date of estimate. Estimates may be revised as a result of changes in government regulations or assumptions. FUTURE ACCOUNTING PRONOUNCEMENTS Certain new accounting standards and interpretations have been published that are not mandatory for the December 31, 2012 reporting period:
• IFRS 9, Financial Instruments: effective for accounting periods commencing on or after January 1, 2015. The Company is currently evaluating the impact of IFRS 9 on its financial statements.
• IFRS 10, Consolidated Financial Statements, was issued by the IASB in May 2011 and is effective for annual periods beginning on or after January 1, 2013 with early adoption permitted. The Company does not expect the adoption of this standard to have a material impact on its financial statements.
• IFRS 11, Joint Arrangements, was issued by the IASB in May 2011 and is effective for annual periods beginning on or after January 1, 2013 with early adoption permitted. The Company does not expect the adoption of this standard to have a material impact on its financial statements..
• IFRS 12, Disclosure of Interests in Other Entities, was issued by the IASB in May 2011 and is effective for the Company beginning on January 1, 2013. It is expected that IFRS 12 will increase the current level of disclosure related to the Company’s interests in other entities upon adoption.
• In May 2011, the IASB published IFRS 13, Fair Value Measurement, which is effective prospectively for annual periods beginning on or after January 1, 2013. The Company does not expect the adoption of this standard to have a material impact on its financial statements.
• In June 2011, the IASB issued IAS 1, Presentation of Items of OCI: Amendments to IAS 1 Presentation of Financial Statements. The amendments stipulate the presentation of net profit and OCI and also require the Company to group items within OCI based on whether the items may be subsequently reclassified to profit or loss. Amendments to IAS 1 are effective for annual periods beginning on or after July 1, 2012. The Company does not expect the adoption of the amendments to this standard to have a material impact on its financial statements.
• In May 2011, the IASB issued amendments to IAS 28, Investments in Associates and Joint Ventures, which are effective for annual periods beginning on or after January 1, 2013 with early

2012 Annual Management’s Discussion and Analysis (in thousands of CDN dollars, except as otherwise noted) Page 33
Claude Resources Inc.
adoption permitted. The Company does not expect the amendments to IAS 28 to have a material impact on the financial statements.
• In December 2011, the IASB published Offsetting Financial Assets and Financial Liabilities and issued new disclosure requirements in IFRS 7, Financial Instruments: Disclosures. The amendments to IAS 32 clarify that if an entity currently has a legally enforceable right to set-off if that right is not contingent on a future event, and enforceable both in the normal course of business and in the event of default, insolvency or bankruptcy of the entity and all counterparties. The amendments to IAS 32 also clarify when a settlement mechanism provides for net settlement or gross settlement that is equivalent to net settlement. The amendments to IFRS 7 contain new disclosure requirements for financial assets and liabilities that are offset in the statement of financial position, or subject to master netting arrangements or similar arrangements. The effective date for the amendments to IAS 32 is annual periods beginning on or after January 1, 2014. The effective date for the amendments to IFRS 7 is annual periods beginning on or after January 1, 2013. These amendments are to be applied retrospectively. The Company does not expect the amendments to have a material impact on the financial statements.
BUSINESS RISKS The profitability and operating cash flow of the Company is dependent on several factors: the quantity of gold produced, related gold prices, foreign exchange, operating costs, capital expenditures, exploration levels and environmental, health and safety regulations. These and other risk factors listed below relate to the mining industry in general while others are specific to Claude. A complete list of risk factors is contained within the Company’s Annual Information Form. Whenever possible, the Company seeks to mitigate these risk factors. Inherent Exploration and Mining Risks The exploration for and development of mineral deposits involves significant risks, which even the combination of careful evaluation, experience and knowledge may not eliminate. It is impossible to guarantee that current or future exploration programs on existing mineral properties will establish reserves. The level of profitability of the Company in future years will depend mainly on gold prices, the cost of production at the Seabee Operation and whether any of the Company’s exploration stage properties can be brought into production. Whether an ore body will continue to be commercially viable depends on a number of factors, some of which are the particular attributes of the deposit such as: size, grade and proximity to infrastructure; precious metal prices, which cannot be predicted and which have been highly volatile in the past; mining costs; and government regulations, including regulations relating to prices, taxes, royalties, land tenure, land use, importing and exporting of minerals, environmental protection and reclamation and closure obligations. The effect of these factors cannot be accurately predicted, but the combination of these factors may cause a mineral deposit that has been mined profitably in the past, such as the Seabee Operation, to become unprofitable. The Company is subject to the risks normally encountered in the mining industry, such as unusual or unexpected geological formations, cave-ins or flooding. The Company may become subject to liability for pollution, cave-ins or other hazards against which it cannot insure or against which it may elect not to insure. The development of gold and other mineral properties is affected by many factors, including the cost of operations, variations in the grade of ore, fluctuations in commodity markets, costs of processing equipment and other factors such as government regulations, including regulations relating to royalties, fluctuations in the U.S. dollar versus Canadian dollar exchange rate, allowable production, importing and exporting of minerals and environmental protection. Gold Price Volatility The economics of developing gold and other metal properties are affected by many factors, including the cost of operations, variations in the grade of ore mined and the price of gold or other metals. Depending on the price of gold, the Company may determine that it is impractical to commence or continue commercial production. The

2012 Annual Management’s Discussion and Analysis (in thousands of CDN dollars, except as otherwise noted) Page 34
Claude Resources Inc.
price of gold has fluctuated in recent years. During the year ended December 31, 2012, the market price per ounce for gold ranged from a low of U.S. $1,540 to a high of U.S. $1,792, with an average price of U.S. $1,669. Any significant drop in the price of gold adversely impacts the Company’s revenues, profitability and cash flows. Also, sustained low gold prices can:
1. Reduce production revenues as a result of cutbacks caused by the cessation of mining operations involving deposits or portions of deposits that have become uneconomic at the prevailing price of gold;
2. Cause the cessation or deferral of new mining projects; 3. Decrease the amount of capital available for exploration activities; 4. Reduce existing reserves by removing ore from reserves that cannot be economically mined
at prevailing prices; or, 5. Cause the write-off of an asset whose value is impaired by the low price of gold.
Gold prices may fluctuate widely and are affected by numerous industry factors, such as demand for precious metals, forward selling by producers and central bank sales and purchases of gold. Moreover, gold prices are also affected by macro-economic factors such as expectations for inflation, interest rates, currency exchange rates and global or regional political and economic situations. The current demand for and supply of gold affects gold prices, but not necessarily in the same manner as current demand and supply affects the price of other commodities. The potential supply of gold consists of new mine production plus existing stocks of bullion and fabricated gold held by governments, financial institutions, industrial organizations and individuals. If gold prices remain at low market levels for a sustained period, the Company could determine that it is not economically feasible to continue mining operations or exploration activities. There can be no assurance that the price of gold will remain stable or that such price will be at a level that will prove feasible to continue the Company’s exploration activities, or if applicable, begin development of its properties, commence or, if commenced, continue commercial production. Foreign Exchange Risk The price of gold is denominated in U.S. dollars and, accordingly, the Company’s proceeds from gold sales will be denominated and received in U.S. dollars. As a result, fluctuations in the U.S. dollar against the Canadian dollar could result in unanticipated fluctuations in the Company’s financial results, which are reported in Canadian dollars. During the year ended December 31, 2012, the CDN$/US$ exchange rate ranged from a low of $0.9784 to a high of $1.0275, with an average of $0.9994. Access to Funding The Company’s ability to continue its production, exploration and development activities depends in part on its ability to generate revenues from its operations or to obtain financing through joint ventures, debt financing, equity financing and production sharing arrangements or other means. The failure of the Company to meet its ongoing obligations on a timely basis could result in the loss or substantial dilution of its interest (as existing or as proposed to be acquired) in its properties. In addition, Management estimates that approximately $2.7 million is the minimum annual expenditure required to fulfill the Company’s intended exploration and dewatering programs in 2013. At current gold prices and forecast production, Management believes operating cash flows will not be sufficient to fund the debenture maturing in May 2013. The Company expects that operating cash flows combined with the closing of the debt financing announced in January 2013 will provide sufficient funding for 2013 and the Q1 2014 winter road resupply at the Seabee Gold Operation.

2012 Annual Management’s Discussion and Analysis (in thousands of CDN dollars, except as otherwise noted) Page 35
Claude Resources Inc.
Unfavourable Government Regulatory Changes The Company’s exploration activities and mining operations are affected to varying degrees by government regulations relating to mining operations, the acquisition of land, pollution control and environmental protection, safety, production and expropriation of property. Changes in these regulations or in their application are beyond the control of the Company and may adversely affect its operations, business and results of operations. Failure to comply with the conditions set out in any permit or failure to comply with applicable statutes and regulations may result in orders to cease or curtail operations or to install additional equipment. The Company may be required to compensate those suffering loss or damage by reason of its operating or exploration activities. Currently, all of the Company’s properties are subject to the federal laws of Canada and, depending upon the location of the Company’s properties, may be subject to the provincial laws of Saskatchewan and Ontario as well as local municipal laws. Mineral exploration and mining may be affected in varying degrees by government regulations relating to the mining industry. Any changes in regulations or shifts in political conditions are beyond the control of the Company and may adversely affect its business. Operations may be affected in varying degrees by government regulations with respect to price controls, export controls, foreign exchange controls, income taxes, expropriation of property, environmental and mine safety legislation. Aboriginal Rights, Title Claims and the Duty to Consult May Delay Projects Exploration, development and mining activities at the Company’s Saskatchewan and Ontario properties may affect established or potential treaty or Aboriginal rights, title or other claims held by Aboriginal groups, in these circumstances, First Nation and Métis, with related duty to consult issues. The Company is committed to effectively managing any impacts to such rights, title and claims and any resulting consultation requirements that may arise. However, there is no assurance that the Company will not face material adverse consequences because of the legal and factual uncertainties associated with these issues. Failure to Effectively Manage the Company’s Tailings Facilities could Negatively Impact Gold Production The Company’s Seabee Mill produces tailings. Managing these tailings is integral to gold production. The Seabee Operation’s East Lake and Triangle Lake tailings management facilities have the capacity to store tailings from milling ore from the Seabee Mill until approximately 2016. The Company is currently in the process of planning tailings capacity expansion beyond 2016. This will support the extension of Seabee’s mine life and provide additional tailings capacity to process ore from the Santoy 8 deposit and other potential sources such as Santoy Gap deposit within the Santoy Mine Complex. If the Company does not receive regulatory approval for new or expanded tailings facilities, gold production could be constrained. Changes to Safety, Health and Environmental Regulations Could Have a Material Adverse Effect on Future Operations Safety, health and environmental legislation affects nearly all aspects of the Company’s operations including exploration, mine development, working conditions, waste disposal, emission controls and protection of endangered and protected species. Compliance with safety, health and environmental legislation can require significant expenditures and failure to comply with such safety, health and environmental legislation may result in the imposition of fines and penalties, the temporary or permanent suspension of operations, clean-up costs resulting from contaminated properties, damages and the loss of important permits. Exposure to these liabilities arises not only from the Company’s existing operations, but from operations that have been closed or sold to third parties. Generally, the Company is required to reclaim properties after mining is completed and specific requirements vary among jurisdictions. The Company is required to provide financial assurances as security for reclamation costs, which may exceed the Company’s estimates for such costs. The Company could also be held liable for worker exposure to hazardous substances and for accidents causing injury or death. There can be no assurances that the

2012 Annual Management’s Discussion and Analysis (in thousands of CDN dollars, except as otherwise noted) Page 36
Claude Resources Inc.
Company will at all times be in compliance with all safety, health and environmental regulations or that steps to achieve compliance would not materially adversely affect the Company’s business. Safety, health and environmental laws and regulations are evolving in all jurisdictions where the Company has activities. The Company is not able to determine the specific impact that future changes in safety, health and environmental laws and regulations may have on its operations and activities, and its resulting financial position; however, the Company anticipates that capital expenditures and operating expenses will increase in the future as a result of the implementation of new and increasingly stringent safety, health and environmental regulation. For example, emissions standards are poised to become increasingly stringent. Further changes in safety, health and environmental laws, new information on existing safety, health and environmental conditions or other events, including legal proceedings based upon such conditions or an inability to obtain necessary permits, may require increased financial reserves or compliance expenditures or otherwise have a material adverse effect on the Company. Environmental and regulatory review is a long and complex process that can delay the opening, modification or expansion of a mine, extend decommissioning at a closed mine, or restrict areas where exploration activities may take place. Decommissioning and Reclamation Obligations May Constrain Production Environmental regulators are demanding more and more financial assurances so that the parties involved, and not the government, bear the costs of decommissioning and reclaiming sites. Decommissioning plans have been filed for the Seabee and Madsen properties. These plans are reviewed, as necessary, or at the time of an amendment or renewal of an operating license. Regulators may conduct a further review of the detailed decommissioning plans, and this can lead to additional requirements, costs and financial assurances. It is not possible to predict what level of decommissioning and reclamation and financial assurances regulators may require in the future. Imprecise Ore Reserves and Ore Grade Estimates May Negatively Impact Gold Production and Operating Profitability Although the Company has assessed the Mineral Reserve and Mineral Resource estimates contained in this document and believes that the methods used to estimate such Mineral Reserves and Mineral Resources are appropriate, such figures are estimates. Estimates of Mineral Reserves and Mineral Resources are inherently imprecise and depend to some extent on statistical inferences drawn from limited drilling, which may prove unreliable. Furthermore, the indicated level of recovery of gold may not be realized. Market price fluctuations of gold may render reserves and deposits containing relatively lower grades of mineralization uneconomic. Moreover, short-term operating factors relating to Mineral Reserves, such as the need for orderly development of the deposits or the processing of new or different grades, may cause mining operations to be unprofitable in any particular period. Potential Shareholder Dilution Could Impact Share Price and New Equity Issues As of December 31, 2012, there were stock options outstanding to purchase 6,948,527 common shares and share purchase warrants outstanding to purchase 1,693,200 common shares. Subsequent to December 31, 2012, and subject to due diligence, the Company may issue an additional 5,750,000 common share purchase warrants pursuant to a debt financing. These options and warrants, if fully exercised, would constitute approximately 7.6 percent of the Company’s resulting share capital. The exercise of such options or warrants and the subsequent resale of such shares in the public market could adversely affect the prevailing share market price and the Company’s ability to raise equity capital in the future at a time and price which it deems appropriate. The Company may also enter into commitments in the future which would require the issuance of additional common shares and the Company may grant additional share purchase warrants and stock options. Any share issuances from the Company’s treasury could result in immediate dilution to existing shareholders.

2012 Annual Management’s Discussion and Analysis (in thousands of CDN dollars, except as otherwise noted) Page 37
Claude Resources Inc.
Industry Competition May Hinder Corporate Growth The Company’s business is intensely competitive and the Company competes with other mining companies, some of which have greater resources and experience. Competition in the precious metals mining industry is primarily for mineral rich properties which can be developed and produced economically, the technical expertise to find, develop and produce such properties, the labour to operate the properties and the capital for the purpose of financing development of such properties. Many competitors not only explore for and mine precious metals, but also conduct refining and marketing operations on a worldwide basis and some of these companies have much greater financial and technical resources than the Company. Such competition may result in the Company being unable to acquire desired properties, to recruit or retain qualified employees or to acquire the capital necessary to fund its operations and develop its properties. The Company’s inability to compete with other mining companies could have a material adverse effect on the Company’s results of operations and its business. Extreme and Persistent Weather Conditions Could Cause Operating and Exploration Difficulties The Company’s mining and exploration properties are all located in the northern portions of Saskatchewan and Ontario. Access to these properties and the ability to conduct work on them can be affected by adverse weather conditions. Adverse weather conditions can also increase the costs of both access and work on the Company’s properties. Title to Company Properties Could be Challenged with Potential Loss of Ownership Acquisition of title to mineral properties is a very detailed and time-consuming process. The Company believes it has investigated title to all of its mineral properties and has obtained title opinions with respect to its most significant properties. To the best of the Company’s knowledge, titles to all such properties are in good standing. For the Madsen property, Claude has searched title records for any and all encumbrances. For the Seabee and Amisk properties, the Company has examined property search abstracts from the Saskatchewan Ministry of the Economy as well as made inquiries and reviewed lease files from the Ministry. It has also received confirmation of title from Saskatchewan Environment. The title to the Company’s properties could be challenged or impugned. The properties may have been acquired in error from parties who did not possess transferable title, may be subject to prior unregistered agreements or transfers and title may be affected by undetected defects. We May Not be Able to Hire Enough Skilled Employees to Support Operations Many of the projects undertaken by the Company rely on the availability of skilled labour and the capital outlays required to employ such labour. The Company employs full and part time employees, contractors and consultants to assist in executing operations and providing technical guidance. In the event of a skilled labour shortage, various projects of the Company may not become operational due to increased capital outlays associated with labour. Further, a skilled labour shortage could result in operational issues such as production shortfalls and higher mining costs. Uninsured Risks could Negatively Impact Profitability In the course of exploration, development and production of mineral properties, certain risks and in particular, unexpected or unusual geological operating conditions including rock bursts, cave-ins, fire and flooding and earthquakes may occur. It is not always possible to fully insure against such risks and the Company may decide not to take out insurance against such risks as a result of high premiums or other reasons. Should such liabilities arise, they could reduce or eliminate any future profitability and result in increased costs and a decline in the value of the securities of the Company.

2012 Annual Management’s Discussion and Analysis (in thousands of CDN dollars, except as otherwise noted) Page 38
Claude Resources Inc.
The Company is Subject to Evolving Corporate Governance and Public Disclosure Regulations that have Increased the Cost of Compliance and the Risk of Non-compliance The Company is subject to changing rules and regulations promulgated by a number of Canadian and United States governmental and self-regulating organizations, including the Canadian Securities Administrators, the Toronto Stock Exchange, the U.S. Securities and Exchange Commission, the NYSE MKT and the International Accounting Standards Board. These rules and regulations continue to evolve in scope and complexity making compliance more difficult and uncertain. Efforts to comply with new regulations have resulted, and are likely to continue to result in, increased general and administrative expenses and a diversion of Management time and attention from revenue-generating activities to compliance activities. Due to the Company’s Canadian Jurisdiction, Investors may be Deterred from Trading Company Stock as it may be Difficult for United States (“U.S.”) Investors to Effect Service of Process Against the Company The Company is incorporated under the laws of Canada. All of the Company’s directors and officers are residents of Canada and all of the Company’s assets and its subsidiaries are located in Canada. Consequently, it may be difficult for U.S. investors to affect service of process in the U.S. upon the Company’s directors or officers or to realize in the U.S. upon judgments of U.S. courts predicated upon civil liabilities under the United States Securities Exchange Act of 1934, as amended. A judgment of a U.S. court predicated solely upon such civil liabilities may be enforceable in Canada by a Canadian court if the U.S. court in which the judgment was obtained had jurisdiction, as determined by the Canadian court, in the matter. There is substantial doubt whether an original action could be brought successfully in Canada against any of such persons or the Company predicated solely upon such civil liabilities. Internal Controls Provide No Absolute Assurances as to Reliability of Financial Reporting The Company has invested resources to document and assess its system of internal controls over financial reporting and it is continuing its evaluation of such internal controls. Internal controls over financial reporting are procedures designed to provide reasonable assurance that transactions are properly authorized, assets are safeguarded against unauthorized or improper use, and transactions are properly recorded and reported. A control system, no matter how well designed and operated, can provide only reasonable, not absolute, assurance with respect to the reliability of financial reporting and financial statement preparation. The Company is required to satisfy the requirement of Section 404 of the U.S. Sarbanes-Oxley Act of 2002 (the “Sarbanes-Oxley Act”), which requires an annual assessment by management of the effectiveness of the Company’s internal control over financial reporting. If the Company fails to maintain the adequacy of its internal control over financial reporting, as such standards are modified, supplemented, or amended from time to time, the Company may not be able to ensure that it can conclude on an ongoing basis that it has effective internal controls over financial reporting in accordance with Section 404 of the Sarbanes-Oxley Act. The Company’s failure to satisfy the requirement of Section 404 of the Sarbanes-Oxley Act on an ongoing, timely basis could result in the loss of investor confidence in the reality of its financial statements, which in turn could harm the Company’s business and negatively impact the trading price of its common shares. In addition, any failure to implement required new or improved controls, or difficulties encountered in their implementation, could harm the Company’s operating results or cause it to fail to meet its reporting obligations. Although the Company intends to devote substantial time and incur substantial costs, as necessary, to ensure ongoing compliance, the Company cannot be certain that it will be successful in complying with Section 404 of the Sarbanes-Oxley Act.

2012 Annual Management’s Discussion and Analysis (in thousands of CDN dollars, except as otherwise noted) Page 39
Claude Resources Inc.
The Company is Subject to Certain Legal Proceedings and may be Subject to Additional Litigation in the Future All industries, including the mining industry, are subject to legal claims, with and without merit. The Company is currently involved in litigation of a non-material nature and may become involved in legal disputes in the future. Defence and settlement costs can be substantial, even with respect to claims that have no merit. Due to the inherent uncertainty of the litigation process, there can be no assurance that the resolution of any particular legal proceedings will not have a material adverse effect on the Company’s financial position or results of operations. Conflicts of Interest Certain of the directors of the Company are also directors and officers of other companies engaged in mineral exploration and development and mineral property acquisitions. As such, situations may arise where such directors are in a conflict of interest with the Company. The Company will resolve any actual conflicts of interest if and when the same arise in accordance with the Company’s Code of Ethics Policy. OUTSTANDING SHARE DATA The authorized share capital of the Company consists of an unlimited number of common shares and two classes of unlimited preferred shares issuable in series. At December 31, 2012, there were 173,745,564 common shares outstanding. This compares to 164,630,231 common shares outstanding at December 31, 2011. During 2012, the Company issued 414,078 common shares pursuant to the Company’s Employee Share Purchase Plan and the Company’s Stock Option plan. An additional 8,701,255 shares were issued as consideration for Claude’s acquisition of St. Eugene (please see Claude news release “Claude Resources Inc. Completes Acquisition of St. Eugene Mining Corporation Limited” dated February 2, 2012). Subsequent to December 31, 2012, Claude issued 2,065,812 common shares pursuant to the Company’s Employee Share Purchase Program. At March 27, 2013, there were 175,811,376 common shares of the Company issued and outstanding. OUTSTANDING STOCK OPTIONS AND WARRANTS At December 31, 2012, there were 6.9 million director, officer and key employee stock options outstanding with exercise prices ranging from $0.50 to $2.38 per share. This compares to 5.5 million director, officer and key employee stock options outstanding at December 31, 2011 with similar prices. Table 20: Schedule of Outstanding Stock Options and Weighted Average Exercise Price December 31, 2012 December 31, 2011
Number
Weighted Average
Exercise Price Number
Weighted Average
Exercise Price Beginning of period 5,484,250 $1.57 3,916,737 $ 1.15 Options granted 1,896,290 1.04 2,478,768 2.06 Options exercised (75,402) 0.78 (648,667) 0.75 Options forfeited (316,611) 1.82 (241,876) 1.86 Options expired (40,000) 1.51 (20,712) 1.04 End of period 6,948,527 $1.43 5,484,250 $1.57 For options outstanding at December 31, 2012, the range of exercise prices, the number vested, the weighted average exercise price and the weighted average remaining contractual life are as follows:

2012 Annual Management’s Discussion and Analysis (in thousands of CDN dollars, except as otherwise noted) Page 40
Claude Resources Inc.
Table 21: Schedule of Outstanding Stock Options by Price Range
Options Outstanding Options Exercisable
Option Price Per Share Quantity
Weighted Average
Remaining Life
Weighted Average Exercise
Price Quantity
Weighted Average
Remaining Life
Weighted Average Exercise
Price $0.50 - $1.00 1,329,845 6.24 $0.72 846,512 6.03 $0.76 $1.01 - $1.50 2,633,731 5.86 1.20 2,199,898 5.79 1.19 $1.51 - $2.00 2,432,000 7.06 1.86 1,512,000 6.20 1.80 $2.01 - $2.38 552,951 7.80 2.30 338,903 7.53 2.26
6,948,527 6.51 $1.43 4,897,313 6.08 $1.38 At December 31, 2012, there were 1.7 million common share purchase warrants outstanding. Each common share purchase warrant entitles the holder to acquire one common share of the Company at prices determined at the time of issue. The range of exercise prices and dates of expiration of the warrants outstanding are as follows:
Table 22: Schedule of Warrants Outstanding Number Number Exercise Outstanding at Outstanding at Price Expiry Date December 31, 2011 Granted Expired December 31, 2012
$ 1.60 May 22, 2013 1,693,200 - - 1,693,200 $ 0.90 November 16, 2012 1,023,000 - 1,023,000 - $ 1.77 April 7, 2012 - 319,545 319,545 - $ 1.77 April 12, 2012 - 10,257 10,257 - $ 3.17 March 31, 2012 - 79,980 79,980 - $ 4.44 March 31, 2012 - 443,812 443,812 -
2,716,200 853,594 1,876,594 1,693,200 The warrants granted during 2012 relate to outstanding warrants assumed as part of the St. Eugene acquisition completed in the first quarter. FOOTNOTES
(1) Historically, Madsen results have been reported in ounces per ton and feet (Imperial). (2) See description and reconciliation of non-IFRS measures in the “Non-IFRS Performance
Measures and Reconciliations” section of this MD&A. (3) See description and reconciliation of this performance measure in the “Other Performance
Measures and Reconciliations” section of this MD&A. NON-IFRS PERFORMANCE MEASURES AND RECONCILIATIONS The Company utilizes non-IFRS financial measures as supplemental indicators of operating performance and financial position. These non-IFRS financial measures are used internally by the Company for comparing actual results from one period to another. The Company believes that, in addition to conventional measures prepared in accordance with IFRS, certain investors use this information to evaluate the Company’s performance and ability to generate cash flow. Accordingly, such information is intended to provide additional information and should not be considered in isolation or as a substitute for measures of performance prepared in accordance with IFRS.

2012 Annual Management’s Discussion and Analysis (in thousands of CDN dollars, except as otherwise noted) Page 41
Claude Resources Inc.
Cash Cost Per Ounce The Company reports its cash costs on a per-ounce basis, based on uniform standards developed by the Gold Institute, an independent researcher and evaluator of the gold market and gold industry. Management uses this measure to analyze the profitability, compared to average realized gold prices, of the Seabee Gold Operation. Investors are cautioned that the above measures may not be comparable to similarly titled measures of other companies, should these companies not follow Gold Institute standards.
Table 23: Total Cash Cost per Gold Ounce Sold December 31 December 31 2012 2011 Production cost (CDN$) $ 48,535 $ 40,542 Divided by ounces sold 48,672 44,632 Total cash cost per ounce (CDN$) $ 997 $ 908 CDN$ Exchange Rate $ 0.9994 $ 0.9893 Total cash cost per ounce (US$) $ 998 $ 918 Net Cash Margin The Company uses net cash margin, which represents realized price per ounce less net cash costs per ounce. This measure is used by Management to analyze profitability trends and to assess the cash-generating capability from the sale of gold on a consolidated basis in each reporting period, expressed on a unit basis. Management believes that this measurement illustrates the performance of the Company’s business on a consolidated basis and enables investors to better understand Claude’s performance in comparison to other gold producers who present results on a similar basis and is an important indicator of expected performance in future periods. The Company’s net cash margin is intended to provide additional information, does not have any standardized meaning prescribed by IFRS and should not be considered in isolation or as a substitute for measures of performance prepared in accordance with IFRS. This measure is not necessarily indicative of operating profit or cash flow from operations as determined under IFRS. Other companies may calculate net cash margin differently. This non-IFRS measure is calculated from realized gold price per ounce and total cash costs per ounce, as determined in the net cash cost reconciliation. Net cash margin could also be derived from realized price per ounce and net cash costs per ounce. Table 24: Net Cash Margin Dec 31 Dec 31 2012 2011 Revenue $ 80,808 $ 69,659 Divided by ounces sold 48,672 44,632 Average Realized Price per Ounce (CDN$) $ 1,660 $ 1,561 Production costs $ 48,535 $ 40,542 Divided by ounces sold 48,672 44,632 Total cash costs per ounce (CDN$) $ 997 $ 908 Net Cash Margin per Ounce Sold (CDN$) $ 663 $ 653

2012 Annual Management’s Discussion and Analysis (in thousands of CDN dollars, except as otherwise noted) Page 42
Claude Resources Inc.
OTHER PERFORMANCE MEASURES AND RECONCILIATIONS Cash Flow from Operations before Net Changes in Non-Cash Operating Working Capital The Company uses Cash Flow from Operations before Net Changes in Non-Cash Operating Working Capital as a supplemental measure of its financial performance. The Company uses this measure to analyze the cash generated by its operations. These measures are not necessarily indicative of operating profit or cash flow from operations as determined under IFRS. Investors are cautioned that the above measures may not be comparable to similarly titled measures of other companies. Table 25: Calculation of Cash Flow from Operations before Net Changes in Non-Cash Operating Working Capital Dec 31 Dec 31 2012 2011 Net Profit $ 5,569 $ 9,454 Adjustments for non-cash items: Depreciation and depletion 15,681 11,407 Finance expense 388 361 Finance and other income (1,248) (1,109) Loss (Gain) on investments 199 (35) Stock-based compensation 2,280 1,991 Write-down of mineral property - 851 Gain on sale of exploration property - (1,131) Deferred income tax expense 2,972 364 $ 25,841 $ 22,153 Weighted Average shares outstanding (basic) 172,993 156,062 Weighted Average shares outstanding (diluted) 173,232 158,410 Per share cash flows from operating activities (basic and diluted) $ 0.15 $ 0.14 DISCLOSURE CONTROLS AND INTERNAL CONTROLS OVER FINANCIAL REPORTING Disclosure Controls and Procedures As at December 31, 2012, we evaluated our disclosure controls and procedures as defined in the rules of the U.S. Securities and Exchange Commission (“SEC”) and the Canadian Securities Administrators. This evaluation was carried out under the supervision and participation of Management, including the President and Chief Executive Officer and the Chief Financial Officer. Based on that evaluation, the President and Chief Executive Officer and Chief Financial Officer concluded that the design and operation of these disclosure controls and procedures were effective. Internal Control Over Financial Reporting Management is responsible for establishing and maintaining adequate internal control over financial reporting. Internal control over financial reporting, no matter how well designed, has inherent limitations and can only provide reasonable assurance with respect to the preparation and fair presentation of published financial statements. Under the supervision and with the participation of the President and Chief Executive Officer and the Chief Financial Officer, management conducted an evaluation of the effectiveness of its internal control over financial reporting based on the framework in Internal Control – Integrated Framework issued by the Committee of Sponsoring Organizations of the Treadway Commission. Based on this evaluation, the President and Chief Executive Officer and the Chief Financial Officer concluded that internal control over financial reporting is effective as at December 31, 2012. No significant changes were made in our internal controls over financial reporting during the period ended December 31, 2012 that have materially affected, or are reasonably likely to materially affect, our internal control over financial reporting.

2012 Annual Management’s Discussion and Analysis (in thousands of CDN dollars, except as otherwise noted) Page 43
Claude Resources Inc.
Limitations of Controls and Procedures The Company’s management, including the President and Chief Executive Officer and Vice President and Chief Financial Officer, believes that any disclosure controls and procedures or internal control over financial reporting, no matter how well conceived and operated, can provide only reasonable, not absolute, assurance that the objectives of the control system are met. Further, the design of a control system must reflect the fact that there are resource constraints, and the benefits of controls must be considered relative to their costs. Because of the inherent limitations in all control systems, they cannot provide absolute assurance that all control issues and instances of fraud, if any, within the Company have been prevented or detected. These inherent limitations include the realities that judgments in decision-making can be faulty, and that breakdowns can occur because of simple error or mistake. Additionally, controls can be circumvented by the individual acts of some persons, by collusion of two or more people, or by unauthorized override of the control. The design of any control system also is based in part upon certain assumptions about the likelihood of future events, and there can be no assurance that any design will succeed in achieving its stated goals under all potential future conditions. Accordingly, because of the inherent limitations in a cost effective control system, misstatements due to error or fraud may occur and not be detected. CAUTIONARY NOTE TO U.S. INVESTORS CONCERNING RESOURCE ESTIMATES Resource Estimates The resource estimates in this Management’s Discussion and Analysis were prepared in accordance with National Instrument 43-101, adopted by the Canadian Securities Administrators. The requirements of National Instrument 43-101 differ significantly from the requirements of the SEC. In this Management’s Discussion and Analysis, the Company uses certain terms such as “measured”, “indicated” and “inferred” resources. Although these terms are recognized and required in Canada, the SEC does not recognize them. The SEC permits U.S. mining companies, in their filings with the SEC, to disclose only those mineral deposits that constitute “reserves”. Under U.S. standards, mineralization may not be classified as a reserve unless the determination has been made that the mineralization could be economically and legally extracted at the time the determination is made. U.S. investors should not assume that all or any portion of a measured or indicated resource will ever be converted into “reserves”. Further, “inferred resources” have a great amount of uncertainty as to their existence and whether they can be mined economically or legally, and U.S. investors should not assume that “inferred resources” exist or can be legally or economically mined, or that they will ever be upgraded to a more certain category. Compliance with Canadian Securities Regulations This annual report is intended to comply with the requirements of the Toronto Stock Exchange and applicable Canadian securities legislation, which differ in certain respects from the rules and regulations promulgated under the United States Securities Exchange Act of 1934, as amended (“Exchange Act”), as promulgated by the SEC. U.S. investors are urged to consider the disclosure in our Annual Report on Form 40-F, File No. 001-31956, as filed with the SEC under the Exchange Act, which may be obtained from the Company (without cost) or from the SEC’s Web site: http://sec.gov/edgar.shtml. CAUTION REGARDING FORWARD-LOOKING INFORMATION All statements, other than statements of historical fact, contained or incorporated by reference in this MD&A constitute “forward-looking information” within the meaning of applicable Canadian securities laws and “forward-looking statements” within the meaning of the United States Private Securities Litigation Reform Act of 1995 (referred to herein as “forward-looking statements”). Forward-looking statements include, but are not limited to, statements with respect to the future price of gold, the estimation of mineral reserves and resources, the realization of mineral reserve estimates, the timing and amount of estimated future production, costs of production, capital expenditures, costs and timing of the development

2012 Annual Management’s Discussion and Analysis (in thousands of CDN dollars, except as otherwise noted) Page 44
Claude Resources Inc.
of new deposits, success of exploration activities, permitting time lines, currency exchange rate fluctuations, requirements for additional capital, government regulation of mining operations, environmental risks, unanticipated reclamation expenses, title disputes or claims and limitations on insurance coverage. Generally, these forward-looking statements can be identified by the use of forward-looking terminology such as “plans”, “expects” or “does not expect”, “is expected”, “budget”, “scheduled”, “estimates”, “forecasts”, “intends”, “anticipates” or “does not anticipate” or “believes”, or the negative connotation thereof or variations of such words and phrases or state that certain actions, events or results, “may”, “could”, “would”, “might” or “will be taken”, “occur” or “be achieved” or the negative connotation thereof. All forward-looking statements are based on various assumptions, including, without limitation, the expectations and beliefs of management, the assumed long-term price of gold, that the Company will receive required permits and access to surface rights, that the Company can access financing, appropriate equipment and sufficient labour, and that the political environment within Canada will continue to support the development of mining projects in Canada. Forward-looking statements are subject to known and unknown risks, uncertainties and other factors that may cause the actual results, level of activity, performance or achievements of Claude to be materially different from those expressed or implied by such forward-looking statements, including but not limited to: actual results of current exploration activities; environmental risks; future prices of gold; possible variations in ore reserves, grade or recovery rates; mine development and operating risks; accidents, labour issues and other risks of the mining industry; delays in obtaining government approvals or financing or in the completion of development or construction activities; and other risks and uncertainties, including but not limited to those discussed in the section entitled “Business Risk” in this MD&A. These risks and uncertainties are not, and should not be construed as being, exhaustive. Although Claude has attempted to identify important factors that could cause actual results to differ materially from those contained in forward-looking statements, there may be other factors that cause results not to be as anticipated, estimated or intended. There can be no assurance that such statements will prove to be accurate, as actual results and future events could differ materially from those anticipated in such statements. Accordingly, readers should not place undue reliance on forward-looking statements. Forward-looking statements in this MD&A are made as of the date of this MD&A, being March 27, 2012 and, accordingly, are subject to change after such date. Except as otherwise indicated by Claude, these statements do not reflect the potential impact of any non-recurring or other special items that may occur after the date hereof. Forward-looking statements are provided for the purpose of providing information about management’s current expectations and plans and allowing investors and others to get a better understanding of our operating environment. Claude does not undertake to update any forward-looking statements that are incorporated by reference herein, except in accordance with applicable securities laws.
The forward-looking statements contained in this Management’s Discussion and Analysis are expressly qualified by these cautionary statements. ADDITIONAL INFORMATION Additional information related to the Company, including its Annual Information Form (Form 40-F in the U.S.), is available on Canadian (www.sedar.com) and U.S. (www.sec.gov) securities regulatory authorities’ websites. Certain documents are also available on the Company’s website at www.clauderesources.com.

2012 Annual Management’s Discussion and Analysis (in thousands of CDN dollars, except as otherwise noted) Page 45
Claude Resources Inc.
CONVERSION MULTIPLES For ease of reference, the following factors for converting metric measurements into imperial equivalents are provided: To Convert from Metric To Imperial Multiply Metric Units by Metres Feet (ft.) 3.281 Kilometres (km) Miles 0.621
Tonnes Tons (2,000 pounds) 1.102 Grams Troy Ounces 0.032 Hectares Acres 2.471 GLOSSARY OF FINANCIAL TERMS Current ratio = (current asset / current liabilities) Debt to capital = (total debt – cash and cash equivalents) / (total debt – cash and cash equivalents + total shareholders’ equity) Working capital = (current asset – current liabilities) GLOSSARY OF TECHNICAL TERMS Alteration – any change in the mineral composition of a rock brought about by physical or chemical means. Assaying - laboratory examination that determines the content or proportion of a specific metal (i.e.: silver) contained within a sample. Technique usually involves firing/smelting. Au Eq (“gold equivalent”) – a measure of contained metal expressed in equivalent gold grade. Biotite – a widely distributed and important rock-forming mineral of the mica group. Brecciated – broken into sharp-angled fragments surrounded by finer-grained material. Bulk Sample – a collection of representative mineralized material whose location, geologic character and metal assay content can be determined and then used for metallurgical or geotechnical testing purposes. Chalcopyrite - a sulphide mineral of copper and iron. Chlorite – a group of platy, monoclinic, usually greenish minerals. Chloritic alteration – the replacement by, conversion into, or introduction of chlorite into a rock. Core Samples - the cylindrical form of rock called “core” that is extracted from a diamond drill hole. Mineralized sections are separated and these samples are sent to a laboratory for analysis. Cross-cut - a horizontal opening driven from a shaft or haulage drift at an oblique or right angle to the strike of a vein or other orebody. Cut-off Grade - the lowest grade of mineralized material that qualifies as a reserve in a deposit (i.e.: contributing material of the lowest assay that is included in a reserve estimate).

2012 Annual Management’s Discussion and Analysis (in thousands of CDN dollars, except as otherwise noted) Page 46
Claude Resources Inc.
Diamond Drilling – a type of rotary drilling in which diamond bits are used as the rock-cutting tool to produce a recoverable drill core sample of rock for observation and analysis. Dip – the angle that a structural surface, a bedding or fault plane makes with the horizontal, measured perpendicular to the strike of the structure. Drift - a horizontal underground opening that follows along the length of a vein or rock formation. Duty to Consult - governments in Canada may have a duty to consult with and potentially accommodate Aboriginal groups prior to making decisions which may impact lands and resources subject to established or potential treaty or Aboriginal rights, title or other claims. These governments, in turn, may delegate procedural aspects of this duty to industry. Exploration – work involved in searching for ore, from prospecting to diamond drilling or driving a drift. Fault – a fracture or break in rock along which there has been movement. Feasibility Study – a comprehensive technical and economic study of the selected development option for a mineral project that includes appropriately detailed assessments of realistically assumed mining, processing, metallurgical, economic, marketing, legal, environmental, social and governmental considerations together with any other relevant operational factors and detailed financial analysis, that are necessary to demonstrate at the time of reporting that extraction is reasonably justified (economically mineable). The results of the study may reasonably serve as the basis for a final decision by a proponent or financial institution to proceed with, or finance, the development of the project. The confidence level of the study will be higher than that of a Prefeasibility Study. Fire Assay - the assaying of metallic minerals by use of a miniature smelting procedure with various agents. Footwall - the rock on the underside of a vein or ore structure. Fracture – a break or crack in rock. Geophysical Survey - a scientific method of prospecting that measures the physical properties of rock formations. Common properties investigated include magnetism, specific gravity, electrical conductivity and radioactivity. Grade – the metal content of rock with precious metals, grade can be expressed as troy ounces or grams per tonne of rock. Granitoid – a light-coloured, plutonic rock with quartz between 20 and 60 percent. Head Grade – the average grade of ore fed into a mill. Hydrothermal – the products or the actions of heated waters in a rock mass such as a mineral deposit precipitating from a hot solution. Igneous – a primary type of rock formed by the cooling of molten material. Indicated Mineral Resource – is that part of a Mineral Resource for which quantity, grade or quality, densities, shape and physical characteristics, can be estimated with a level of confidence sufficient to allow the appropriate application of technical and economic parameters, to support mine planning and evaluation of the economic viability of the deposit. The estimate is based on detailed and reliable exploration and testing information gathered through appropriate techniques from locations such as outcrops, trenches, pits, workings and drill holes that are spaced closely enough for geological and grade continuity to be reasonably assumed.

2012 Annual Management’s Discussion and Analysis (in thousands of CDN dollars, except as otherwise noted) Page 47
Claude Resources Inc.
Inferred Mineral Resource – is that part of a Mineral Resource for which quantity and grade or quality can be estimated on the basis of geological evidence and limited sampling and reasonably assumed, but not verified, geological and grade continuity. The estimate is based on limited information and sampling gathered through appropriate techniques from locations such as outcrops, trenches, pits, workings and drill holes. Lens - a body of ore that is thick in the middle and tapers towards the ends. Lithostructural – an assemblage of rocks that is unified on the basis of structural and lithological features. Mafic - igneous rocks composed mostly of dark, iron and magnesium-rich minerals. Measured Mineral Resource - is that part of a Mineral Resource for which quantity, grade or quality, densities, shape, and physical characteristics are so well established that they can be estimated with confidence sufficient to allow the appropriate application of technical and economic parameters, to support production planning and evaluation of the economic viability of the deposit. The estimate is based on detailed and reliable exploration, sampling and testing information gathered through appropriate techniques from locations such as outcrops, trenches, pits, workings and drill holes that are spaced closely enough to confirm both geological and grade continuity. Metallurgy – the study of the extractive processes which produce minerals from their host rocks. Mill - a processing facility where ore is finely ground and thereafter undergoes physical or chemical treatment to extract the valuable metals. Mineral – a naturally formed chemical element or compound having a definitive chemical composition and usually a characteristic crystal form. Mineralization – a natural concentration in rocks or soil of one or more minerals. Mineral Reserve – the economically mineable part of a Measured or Indicated Mineral Resource demonstrated by at least a Prefeasibility Study. This study must include adequate information on mining, processing, metallurgical, economic and other relevant factors that demonstrate, at the time of reporting, that economic extraction can be justified. A Mineral Reserve includes diluting materials and allowances for losses that may occur when material is mined. Mineral Resource – a concentration or occurrence of natural, solid, inorganic, or fossilized organic material in or on the Earth’s crust in such form and quantity and of such a grade or quality that it has reasonable prospects for economic extraction. The location, quantity, grade, geological characteristics, and continuity of a Mineral Resource are known, estimated or interpreted from specific geological evidence and knowledge. National Instrument 43-101 or NI 43-101 – National Instrument 43-101 Standards of Disclosure for Mineral Projects of the Canadian Securities Administrators. Ounces - troy ounces of a fineness of 999.9 parts per 1,000 parts. Ore - rock, generally containing metallic or non-metallic minerals, which can be mined and processed at a profit. Ore Body - a sufficiently large amount of ore that can be mined economically. Plunge - the vertical angle a linear geological feature makes with the horizontal plane. Porphyry - any igneous rock in which relatively large crystals are set in a fine-grained groundmass.

2012 Annual Management’s Discussion and Analysis (in thousands of CDN dollars, except as otherwise noted) Page 48
Claude Resources Inc.
Prefeasibility Study – a comprehensive study of the viability of a mineral project that has advanced to a stage where the mining method, in the case of underground mining, or the pit configuration, in the case of an open pit, has been established, and where an effective method of mineral processing has been determined. This study must include a financial analysis based on reasonable assumptions of technical engineering, operating, and economic factors, which are sufficient for a Qualified Person acting reasonably, to determine if all or part of the Mineral Resource may be classified as a Mineral Reserve. Probable Mineral Reserve – the economically mineable part of an Indicated, and in some circumstances, a Measured Mineral Resource, demonstrated by at least a Prefeasibility Study. This study must include adequate information on mining, processing, metallurgical, economic and other relevant factors that demonstrate, at the time of reporting, that economic extraction can be justified. Proven Mineral Reserve – the economically mineable part of a Measured Mineral Resource demonstrated by at least a Prefeasibility Study. This study must include adequate information on mining, processing, metallurgical, economic and other relevant factors that demonstrate, at the time of reporting, that economic extraction is justified. Pulp - a mixture of ground ore and water. Pyrite - an iron sulphide mineral (FeS2), the most common naturally occurring sulphide mineral. Pyrrhotite - a bronze-colored, often magnetic iron sulphide mineral. Qualified Person – an individual who is an engineer or geoscientist with at least five (5) years of experience in mineral exploration, mine development, mine operation, project assessment or any combination of these; has experience relevant to the subject matter of the mineral project and technical report; and is a member in good standing of a professional association. Quartz – crystalline silica; often forming veins in fractures and faults within older rocks. Raise - a vertical or inclined underground working that has been excavated from the bottom upward. Ramp - an inclined underground opening. Sericite – a fine-grained potassium mica found in various metamorphic rocks. Shear Zone - a zone in which shearing has occurred on a large scale so that the rock is crushed and brecciated. Showing - surface occurrence of mineral. Shrinkage Stoping – any mining method in which broken ore is temporarily retained in the stope to provide a working platform and/or to offer temporary support to the stope walls during active mining. Sill - an intrusive sheet of igneous rock of roughly uniform thickness that has been forced between the bedding planes of existing rock; the initial horizontal drift along the strike of the ore vein. Specific Gravity - the ratio between the weight of a unit volume of a substance and that of a unit volume of water. Stope - an underground excavation from which ore has been extracted, either above or below a level. Access to stopes is usually by way of adjacent raises. Stratigraphy – the sequence of bedded rocks in a particular area.

2012 Annual Management’s Discussion and Analysis (in thousands of CDN dollars, except as otherwise noted) Page 49
Claude Resources Inc.
Tailings - Tailings consist of ground rock and process effluents that are generated in a mine processing plant or mill. Mechanical and chemical processes are used to extract gold from mine ore and produce a waste stream known as tailings. This process of product extraction is never 100 percent efficient, nor is it possible to reclaim all reusable and expended processing reagents and chemicals. The unrecoverable and uneconomic metals, minerals, chemicals, organics and process water are discharged, normally as slurry, to a final storage area commonly known as a Tailings Management Facility (TMF) or Tailings Storage Facility (TSF). Till - is unsorted glacial sediment. Its content may vary from clays to mixtures of clay, sand, gravel and boulders. This material is typically derived from the subglacial erosion and incorporated by the moving ice of the glaciers of previously available unconsolidated sediments. Tonne – a metric ton or 2,204 pounds. Trenching - the process of exploration by which till is removed from a trench cut from the earth’s surface. Vein – a thin, sheet-like, cross-cutting body of hydrothermal mineralization, principally quartz. Waste – barren rock in a mine, or mineralized material that is too low in grade to be mined and milled at a profit. Working interest or WI - means the interest held by Claude in property. This interest normally bears its proportionate share of capital and operating costs as well as royalties or other production burdens. The working interest percentage is expressed before royalty interests.

MANAGEMENT'S RESPONSIBILITY FOR THE CONSOLIDATED FINANCIAL STATEMENTS
Neil McMillan Rick Johnson, C.A.Chief Executive Officer Chief Financial Officer
Date: March 27, 2013
The accompanying consolidated financial statements of Claude Resources Inc. are the responsibility of Management and have been approved by the Board of Directors.
The consolidated financial statements have been prepared by Management in conformity with International Financial Reporting Standards ("IFRS") as issued by the International Accounting Standards Board ("IASB"). The consolidated financial statements include amounts that are based on estimates and judgments. Financial information used elsewhere in the annual report is consistent with that in the financial statements.
The Management of the Company, in furtherance of the integrity and objectivity of data in the financial statements, has developed and maintains a system of internal accounting controls. These internal accounting controls provide reasonable assurance that financial records are reliable, form a proper basis for preparation of financial statements and that assets are properly accounted for and safeguarded. The internal accounting control process includes Management's communication to employees of policies which govern ethical business conduct.
The Board of Directors carries out its responsibility for the consolidated financial statements in this annual report principally through its audit committee, consisting of independent directors. The audit committee reviews the Company's annual consolidated financial statements and recommends their approval to the Board of Directors. The shareholders' auditors have full access to the audit committee, with and without Management being present.
These consolidated financial statements have been audited by the shareholders' auditors, KPMG LLP, Chartered Accountants, in accordance with Canadian generally accepted auditing standards.
Page 50

KPMG LLP Telephone (306) 934-6200 Chartered Accountants Fax (306) 934-6233 500 – 475 Second Avenue South Internet www.kpmg.ca Saskatoon Saskatchewan S7K 1P4 Canada
KPMG LLP, is a Canadian limited liability partnership and a member firm of the KPMG network of independent member firms affiliated with KPMG International Cooperative (“KPMG International”), a Swiss entity. KPMG Canada provides services to KPMG LLP.
INDEPENDENT AUDITORS’ REPORT
To the Shareholders of Claude Resources Inc. We have audited the accompanying consolidated financial statements of Claude Resources Inc., which comprise the consolidated statements of financial position as at December 31, 2012 and December 31, 2011, the consolidated statements of income, comprehensive income, changes in equity and cash flows for the years then ended, and notes, comprising a summary of significant accounting policies and other explanatory information. Management’s Responsibility for the Consolidated Financial Statements Management is responsible for the preparation and fair presentation of these consolidated financial statements in accordance with International Financial Reporting Standards as issued by the International Accounting Standards Board, and for such internal control as management determines is necessary to enable the preparation of consolidated financial statements that are free from material misstatement, whether due to fraud or error. Auditors’ Responsibility Our responsibility is to express an opinion on these consolidated financial statements based on our audits. We conducted our audits in accordance with Canadian generally accepted auditing standards. Those standards require that we comply with ethical requirements and plan and perform the audit to obtain reasonable assurance about whether the consolidated financial statements are free from material misstatement. An audit involves performing procedures to obtain audit evidence about the amounts and disclosures in the consolidated financial statements. The procedures selected depend on our judgment, including the assessment of the risks of material misstatement of the consolidated financial statements, whether due to fraud or error. In making those risk assessments, we consider internal control relevant to the entity’s preparation and fair presentation of the consolidated financial statements in order to design audit procedures that are appropriate in the circumstances, but not for the purpose of expressing an opinion on the effectiveness of the entity’s internal control. An audit also includes evaluating the appropriateness of accounting policies used and the reasonableness of accounting estimates made by management, as well as evaluating the overall presentation of the consolidated financial statements. We believe that the audit evidence we have obtained in our audits is sufficient and appropriate to provide a basis for our audit opinion. Opinion In our opinion, the consolidated financial statements present fairly, in all material respects, the consolidated financial position of Claude Resources Inc. as at December 31, 2012 and December 31, 2011, and its consolidated financial performance and its consolidated cash flows for the years then ended in accordance with International Financial Reporting Standards as issued by the International Accounting Standards Board.
Page 51

KPMG LLP, is a Canadian limited liability partnership and a member firm of the KPMG network of independent member firms affiliated with KPMG International Cooperative (“KPMG International”), a Swiss entity. KPMG Canada provides services to KPMG LLP.
Emphasis of Matter Without qualifying our opinion, we draw attention to Note 2 in the consolidated financial statements, which indicates that Claude Resources Inc. has a working capital deficiency of $4,100,000 which includes debentures amounting to $9,665,000 that are due to be repaid on May 23, 2013. This condition, along with matters as set forth in Note 2 in the consolidated financial statements, indicate the existence of a material uncertainty that casts substantial doubt about Claude Resources Inc.’s ability to continue as a going concern.
Chartered Accountants March 27, 2013 Saskatoon, Canada
Page 52
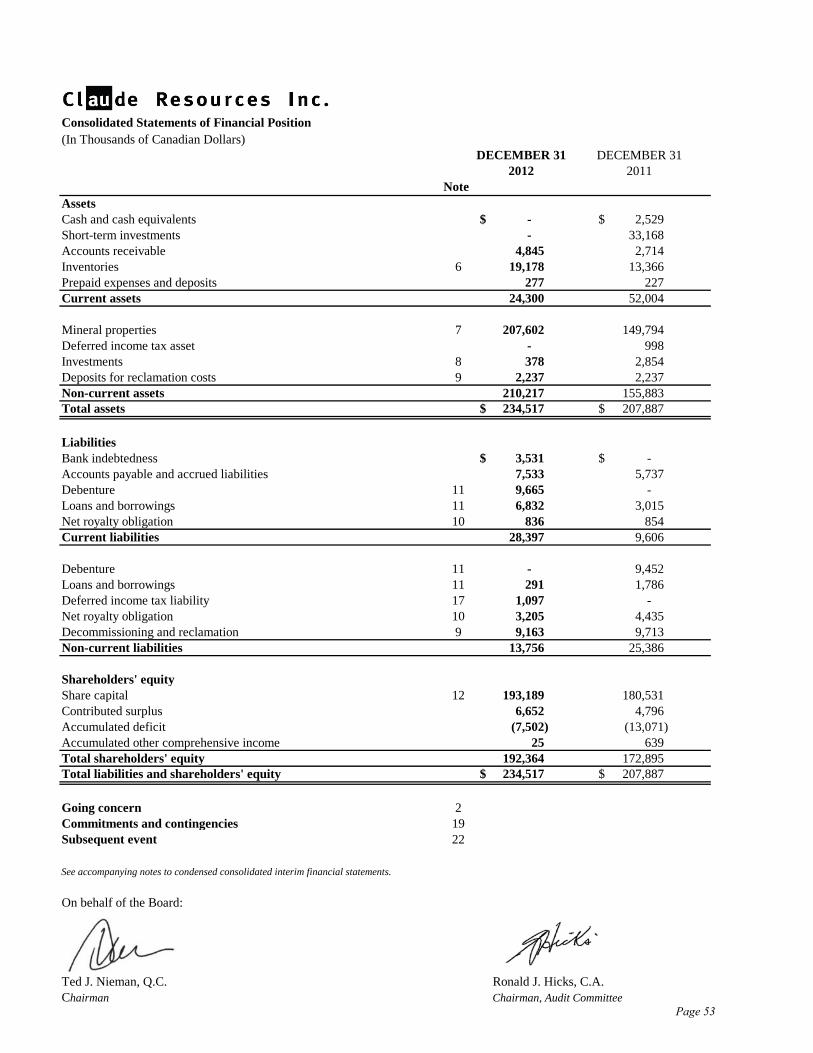
Consolidated Statements of Financial Position(In Thousands of Canadian Dollars)
DECEMBER 31 DECEMBER 312012 2011
NoteAssetsCash and cash equivalents $ - $ 2,529 Short-term investments - 33,168 Accounts receivable 4,845 2,714 Inventories 6 19,178 13,366 Prepaid expenses and deposits 277 227 Current assets 24,300 52,004
Mineral properties 7 207,602 149,794 Deferred income tax asset - 998 Investments 8 378 2,854 Deposits for reclamation costs 9 2,237 2,237 Non-current assets 210,217 155,883 Total assets $ 234,517 $ 207,887
LiabilitiesBank indebtedness $ 3,531 $ - Accounts payable and accrued liabilities 7,533 5,737 Debenture 11 9,665 - Loans and borrowings 11 6,832 3,015 Net royalty obligation 10 836 854 Current liabilities 28,397 9,606
Debenture 11 - 9,452 Loans and borrowings 11 291 1,786 Deferred income tax liability 17 1,097 - Net royalty obligation 10 3,205 4,435 Decommissioning and reclamation 9 9,163 9,713 Non-current liabilities 13,756 25,386
Shareholders' equityShare capital 12 193,189 180,531 Contributed surplus 6,652 4,796 Accumulated deficit (7,502) (13,071) Accumulated other comprehensive income 25 639 Total shareholders' equity 192,364 172,895 Total liabilities and shareholders' equity $ 234,517 $ 207,887
Going concern 2Commitments and contingencies 19Subsequent event 22
See accompanying notes to condensed consolidated interim financial statements.
On behalf of the Board:
Ted J. Nieman, Q.C. Ronald J. Hicks, C.A.Chairman Chairman, Audit Committee
Page 53

Consolidated Statements of Income(In Thousands of Canadian Dollars, except per share amounts)
DECEMBER 312012 2011
Note
Revenue $ 80,808 $ 69,659
Mine Operating:Production costs 48,535 40,542 Depreciation and depletion 15,681 11,407
64,216 51,949 Gross profit 16,592 17,710
General and administrative 7,897 6,779 Finance expense 13 1,450 3,051 Finance and other income 14 (1,495) (1,623) Write-down of exploration property 7 - 851 Gain on sale of exploration property 8 - (1,131) Loss (gain) on investments 199 (35)
8,051 7,892
Profit before income tax 8,541 9,818
Deferred income tax expense 17 2,972 364
Net profit $ 5,569 $ 9,454
Net earnings per shareBasic and diluted 18
Net earnings $ 0.03 $ 0.06
Weighted average common shares outstanding for the year:
Basic 172,933 156,062 Diluted 173,232 158,410
See accompanying notes to condensed consolidated interim financial statements.
Consolidated Statements of Comprehensive Income(In Thousands of Canadian Dollars)
2012 2011Note
Net profit $ 5,569 $ 9,454
Other comprehensive income (loss)17 172 (30) 17 (786) (2,084)
Other comprehensive income (loss) (614) (2,114) Total comprehensive income $ 4,955 $ 7,340
See accompanying notes to condensed consolidated interim financial statements.
DECEMBER 31
Loss (gain) on available-for-sale securities transferred to profit, net of taxUnrealized gain (loss) on available-for-sale securities, net of tax
Page 54

Consolidated Statements of Shareholders' Equity(In Thousands of Canadian Dollars)
DECEMBER 312012 2011
Share CapitalBalance, beginning of year $ 180,531 $ 122,751 Common shares issued 12,392 54,840 Warrants exercised - 2,656 Transfers from contributed surplus 266 284 Balance, end of year $ 193,189 $ 180,531
Contributed SurplusBalance, beginning of year $ 4,796 $ 3,089 Stock-based compensation 2,280 1,991 Transfers to share capital (266) (284) Tax impact of expired warrants (158) - Balance, end of year $ 6,652 $ 4,796
Accumulated DeficitBalance, beginning of year $ (13,071) $ (22,525) Net profit 5,569 9,454 Balance, end of year $ (7,502) $ (13,071)
Accumulated Other Comprehensive Income (Loss)Balance, beginning of year $ 639 $ 2,753
(614) (2,114) Balance, end of year $ 25 $ 639
Shareholders' equity, end of year $ 192,364 $ 172,895
See accompanying notes to condensed consolidated interim financial statements.
Other comprehensive income (loss)
Page 55

Consolidated Statements of Cash Flows(In Thousands of Canadian Dollars)
DECEMBER 312012 2011
Note
Cash flows from (used in) operating activities
Net profit $ 5,569 $ 9,454 Adjustments for non-cash items:
Depreciation and depletion 15,681 11,407 Finance expense 388 361 Finance and other income (1,248) (1,109) Loss (gain) on investments 199 (35) Stock-based compensation 2,280 1,991 Write-down of exploration property 7 - 851 Gain on sale of exploration property 8 - (1,131) Deferred income tax expense 17 2,972 364
25,841 22,153
Net changes in non-cash operating working capital:Accounts receivable (2,131) 2 Inventories (4,988) (3,748) Prepaid expenses and deposits (50) 269 Accounts payable and accrued liabilities 1,796 958
Cash provided by operating activities 20,468 19,634
Cash flows from investing activities:Additions to mineral properties (62,527) (51,172) Restricted cash - 4,389 Reclamation deposits - 40 Decrease (increase) in investments 33,306 (32,972)
Cash used in investing activities (29,221) (79,715)
Cash flows from financing activities:371 56,464
Debenture redemption - (87) Demand loans:
Proceeds 7,224 - Repayments (2,783) (1,603)
Obligations under finance lease:Proceeds - 4,077 Repayments (2,119) (2,642)
Cash from financing activities 2,693 56,209
Decrease in cash and cash equivalents (6,060) (3,872) Cash and cash equivalents, beginning of year 2,529 6,401 Cash and cash equivalents (bank indebtedness), end of year $ (3,531) $ 2,529
Supplemental cash flow disclosure:Interest paid $ 1,514 $ 1,321
See accompanying notes to condensed consolidated interim financial statements.
Proceeds from issue of common shares and warrants, net of issue costs
Page 56

Claude Resources Inc. Notes to the Consolidated Financial Statements For the Years ended December 31, 2012 and 2011 Expressed in Thousands of Canadian Dollars, except share data or as otherwise noted
Page 57
1. Corporate Information: Claude Resources Inc. (“Claude” or the “Company”) is a company domiciled in Canada. The address of the Company’s registered office is at 1500, 410 – 22nd Street East, Saskatoon, Saskatchewan, S7K 5T6. Its principal office is located at 200, 224 – 4th Avenue South, Saskatoon, Saskatchewan, S7K 5M5. Claude Resources Inc. is a gold producer whose shares are listed on both the Toronto Stock Exchange (TSX-CRJ) and the NYSE MKT (NYSE MKT-CGR). The Company is also engaged in the exploration and development of gold mineral reserves and mineral resources. The Company’s entire asset base is located in Canada. Its revenue generating asset is the 100 percent owned Seabee Gold Operation, located in northern Saskatchewan. Claude also owns 100 percent of the Amisk Gold Project in northeastern Saskatchewan and 100 percent of the Madsen Property in the Red Lake gold camp of northwestern Ontario. 2. Basis of Preparation: STATEMENT OF COMPLIANCE These consolidated financial statements have been prepared in accordance with International Financial Reporting Standards (“IFRS”), as issued by the International Accounting Standards Board (“IASB”). These consolidated financial statements were authorized for issue by the Company’s Board of Directors on March 27, 2013. BASIS OF MEASUREMENT These consolidated financial statements have been prepared on the historical cost basis except for derivative financial instruments, available-for-sale financial assets and liabilities for cash-settled share-based payment arrangements, which are measured at fair value. FUNCTIONAL CURRENCY These consolidated financial statements are presented in Canadian dollars, which is the Company’s functional currency. All financial information presented in Canadian dollars has been rounded to the nearest thousand, except share data or as otherwise noted. GOING CONCERN These consolidated financial statements have been prepared on the assumption that the Company will continue as a going concern and realize its assets and discharge its liabilities in the normal course of business, which assumes the Company will be able to meet the mandatory debenture repayment coming due on May 23, 2013 (Note 11). As at December 31, 2012, the Company has a working capital deficiency of $4.1 million. The working capital deficiency results primarily from the Company’s debentures amounting to $9.7 million (Note 11) that are classified as a current liability as their contractual repayments terms are due in less than one year. As a part of the Company’s plan to refinance the outstanding debenture obligations, the Company, subsequent to December 31, 2012, executed a non-binding term sheet with Crown Capital Partners Inc. (“CCP”) for an additional long-term debt facility of $25.0 million (Note 22). The Company is currently in final negotiations to close this new debt facility which will provide liquidity for the repayment of the outstanding debentures as they come due on May 23, 2013. There can be no assurance that the Company will be able to finalize and close the debt facility at the terms specified in the non-binding term sheet, or at all. The uncertainty of closing the new debt facility to refinance the Company’s working capital deficiency, attributable to the debenture repayment requirement in May 2013, results in a material uncertainty and therefore casts substantial doubt as to the Company’s ability to continue as a going concern. If the Company is unable to finalize and close the debt facility, it would be required to obtain additional sources of financing (debt or equity). The financial statements do not reflect adjustments that would be necessary if the going concern assumption were not appropriate. If the going concern basis was not appropriate for these financial statements, then adjustments would be necessary to the carrying value of assets and liabilities, the reported revenues and expenses, and the statement of

Claude Resources Inc. Notes to the Consolidated Financial Statements For the Years ended December 31, 2012 and 2011 Expressed in Thousands of Canadian Dollars, except share data or as otherwise noted
Page 58
financial position classifications used. USE OF JUDGMENTS AND ESTIMATES The preparation of the Company’s consolidated financial statements in conformity with IFRS requires Management to make judgments, estimates and assumptions that affect the application of accounting policies and the reported amounts of assets, liabilities, revenue and expenses and disclosure of contingent assets and liabilities at the date of the consolidated financial statements. Significant judgments, estimates and assumptions are related to the useful lives and recoverability of mineral properties and deferred income tax assets or liabilities, valuation of inventory, provisions for decommissioning and reclamation and financial instruments. Although these estimates are based on Management’s best knowledge of the amount, events or actions, actual results ultimately may differ from those estimates. Estimates and underlying assumptions are reviewed on an ongoing basis. Revisions to accounting estimates are recognized in the period in which the estimates are revised and in any future periods affected. Critical Judgments in Applying Accounting Policies Critical judgments that the Company’s management has made in the process of applying the Company’s accounting policies, apart from those involving estimates, that have the most significant effect on the amounts recognized in the Company’s consolidated financial statements are as follows: Production Start Date The Company assesses the stage of each mine under construction to determine when a mine moves into commercial production. The criteria used to assess the start date of commercial production are based on the unique nature of each mine construction project, such as the complexity of the geology and its location. The Company considers various relevant criteria to assess when the mine construction phase is substantially complete and the mine is ready for its intended use. At this point, deferred costs are reclassified from “Mines under construction” to “Producing mines” and “Property, plant and equipment”. Some of the criteria will include, but are not limited, to the following:
• Completion of a reasonable period of testing of the mine plant and equipment; • Ability to produce precious metal in saleable form; • Ability to sustain certain levels of ongoing production of precious metals; and • Production attaining a reasonable percentage of Mine Plan for a specified period of time.
When a mine enters the production stage, the capitalization of certain construction costs ceases and costs are either regarded as inventory or operating expense, except for new capital costs which are capitalized. Depreciation and depletion commences at this time. Exploration and Evaluation Expenditures The application of the Company’s accounting policy for exploration and evaluation expenditures requires judgment in determining whether future economic benefits are likely either from future extraction or sale or where activities have not reached a stage which permits a reasonable assessment of the existence of mineral reserves. The determination of a mineral resource is itself an estimation process that involves varying degrees of uncertainty depending on sub-classification and these estimates directly impact the decision to continue the deferral of exploration and evaluation expenditures. The accounting policy requires management to make certain estimates and assumptions about future events or circumstances, in particular whether an economically viable extraction operation can be established. Estimates and assumptions made may change if new information becomes available. If, after an expenditure is capitalized, information becomes available suggesting that the recovery of this expenditure is unlikely, the amount capitalized is written off in the statement of comprehensive income in the period when the new information becomes available. Business Combinations Determination of whether a set of assets acquired and liabilities assumed constitute a business may require the Company to make certain judgments, taking into account all facts and circumstances. Upon acquisition of a set of assets

Claude Resources Inc. Notes to the Consolidated Financial Statements For the Years ended December 31, 2012 and 2011 Expressed in Thousands of Canadian Dollars, except share data or as otherwise noted
Page 59
and liabilities, the Company examines the criteria set forth in IFRS 3, Business Combinations (“IFRS 3”). If a transaction does not meet the definition of a business, as defined in IFRS 3, it is accounted for as an asset acquisition. Critical Estimates and Assumptions in Applying Accounting Policies Significant assumptions about the future and other major sources of estimation uncertainty as at the end of the reporting period that have a significant risk of resulting in a material adjustment to the carrying amounts of the Company’s assets and liabilities are as follows: Impairment At the end of each reporting period, the Company assesses whether any indication of impairment exist. Where an indicator of impairment exists, an estimate of the recoverable amount is made. Determining the recoverable amount requires the use of estimates and assumptions such as long-term commodity prices, discount rates, future capital requirements, exploration potential and operating performance. Changes in circumstances may affect these estimates and the recoverable amount. Fair value for mineral properties is generally determined as the present value of estimated future cash flows arising from the continued use of the assets, which includes estimates such as the cost of future expansion plans and eventual disposal, using assumptions that an independent market participant would take into account. Cash flows are discounted to their present value using a post-tax discount rate that reflects current market assessments of the time value of money and the risks specific to the asset. Mine Operating Costs When determining mine operating costs recognized in the Consolidated Statements of Income, the Company makes estimates of quantities of ore within stockpiles and of quantities in-circuit and the recoverable gold in this material to determine the average costs of finished goods sold during the period. Changes in these estimates can result in a change in mine operating costs of future periods and carrying amounts of inventories. Ore Reserve and Resource Estimates Ore reserves are estimates of the amount of ore that can be economically extracted from the Company’s mining properties. Estimating the quantities and grades of the reserves and resources requires the size, shape and depth of the ore bodies to be determined by analyzing geological data such as the logging and assaying of drill samples. This process may require complex and difficult geological judgments and calculations to interpret the data. The estimation of recoverable reserves is based upon factors such as estimates of foreign exchange rates, commodity prices, future capital requirements and production costs along with geological assumptions and judgments made in estimating the size and grade of the ore body. Because the economic assumptions used to estimate the gold mineral reserves and resources change from year to year, and because additional geological data is generated during the course of operations, estimates of the mineral reserves and resources may change from year to year. Changes in the reserve or resource estimates may impact upon the carrying value of exploration and evaluation assets, mine properties, property, plant and equipment, decommissioning and reclamation, recognition of deferred tax balances and depreciation and amortization charges. At the end of each financial year, the Company updates its estimate of proven and probable gold mineral reserves and resources. Depreciation of the Company’s mining assets, included within the Mineral properties line item on the Statement of Financial Position, is prospectively adjusted, based on these changes. The Company also monitors the accuracy of the estimate during the periods between annual updates for significant changes to economic assumptions and geological data that could require an interim update to the estimate. Taxation Estimation of deferred taxes includes judgments based on expected performance of the Company. Various factors are considered to assess taxes, including past operating results, operational plans, expiration of tax losses and tax pools carried forward and tax planning strategies.

Claude Resources Inc. Notes to the Consolidated Financial Statements For the Years ended December 31, 2012 and 2011 Expressed in Thousands of Canadian Dollars, except share data or as otherwise noted
Page 60
Decommissioning and Reclamation The Company’s mining and exploration activities are subject to various environmental laws and regulations. The Company estimates environmental obligations based on the current legal and constructive requirements. The Company provides for the closure, reclamation and decommissioning of its operating and development sites based on the estimated future costs using information available at the reporting date. Provision is made, based on net present values, for decommissioning and land restoration costs as soon as the obligation arises. Additional Accounting Judgments, Estimates and Assumptions In addition to the above disclosure on estimates and judgments, the Company has disclosed additional information relating to significant estimates and judgments recognized in the consolidated financial statements throughout the following notes:
Note 7 Mineral Properties Note 8 Investments Note 9 Decommissioning and Reclamation Note 10 Net Royalty Obligation Note 12 Share-based Compensation Note 17 Income Taxes Note 19 Financial Instruments
3. Significant Accounting Policies: The accounting policies utilized by Management for the Company and its wholly owned subsidiaries have been applied consistently to all periods presented in these consolidated financial statements, unless otherwise indicated. CONSOLIDATION PRINCIPLES The consolidated financial statements include the accounts of the Company and its wholly owned subsidiaries. These consolidated financial statements include the Company’s proportionate share of joint ventures. Intercompany transactions have been eliminated on consolidation. The financial statements of the subsidiaries are prepared using the same reporting dates as the Company. FOREIGN CURRENCY TRANSLATION The Company’s functional and presentation currency is the Canadian dollar. Transactions denominated in foreign currencies are translated into Canadian dollars at the rate of exchange prevailing at the date of the transaction. Monetary assets and liabilities denominated in foreign currencies are translated into Canadian dollars at the rate of exchange in effect at the date of the Statement of Financial Position. Non-monetary items are translated at the rate in effect at the date of the transaction. Exchange gains and losses on these transactions are included in profit (loss). FINANCIAL INSTRUMENTS Non-derivative Financial Assets The Company initially recognizes loans and receivables and deposits on the date they originate. All other financial assets (including assets designated at fair value through profit or loss) are recognized initially on the trade date at which the Company becomes a party to the contractual provisions of the instrument. The Company derecognizes a financial asset when the contractual rights to the cash flows from the asset expire, or it transfers the rights to receive the contractual cash flows on the financial asset in a transaction in which substantially all the risks and rewards of ownership of the financial asset are transferred. Financial assets and liabilities are offset and a net asset amount is presented in the Statement of Financial Position when, and only when, the Company has a legal right to offset the amounts and intends either to settle on a net basis or to realize the asset and settle the liability simultaneously. The Company’s non-derivative financial assets include: held-to-maturity financial assets; loans and receivables; and

Claude Resources Inc. Notes to the Consolidated Financial Statements For the Years ended December 31, 2012 and 2011 Expressed in Thousands of Canadian Dollars, except share data or as otherwise noted
Page 61
available-for-sale financial assets. Held-to-maturity financial assets If the Company has the positive intent and ability to hold debt securities to maturity, then such financial assets are classified as held-to-maturity. Held-to-maturity financial assets are recognized initially at fair value plus any directly attributable transaction costs. Subsequent to initial recognition, held-to-maturity financial assets are measured at amortized cost using the effective interest method, less any impairment losses. Any sale or reclassification of a more than insignificant amount of held-to-maturity investments not close to their maturity would result in the reclassification of all held-to-maturity investments as available-for-sale, and prevent the Company from classifying investment securities as held-to-maturity for the current and the following two fiscal years. The Company’s held-to-maturity financial assets are deposits for reclamation costs. Loans and receivables Loans and receivables are financial assets with fixed or determinable payments that are not quoted in an active market. Such assets are recognized initially at fair value plus any directly attributable transaction costs. Subsequent to initial recognition, loans and receivables are measured at amortized cost using the effective interest method, less any impairment losses. The Company’s loans and receivables are comprised of: cash and cash equivalents; accounts receivable; and short-term investments. Cash and cash equivalents comprise cash balances and deposits with original maturities of three months or less. Bank overdrafts, if utilized, are repayable on demand, form an integral part of the Company’s cash management and are included as a component of cash and cash equivalents for the purpose of the Statement of Cash Flows. The Company only deposits cash surpluses with major banks of high quality credit standing. Cash on hand earns interest at floating rates based on daily bank deposit rates. Short-term deposits are made for varying periods of between one day and three months, depending on the immediate cash requirements of the Company, and earn interest at the respective short-term deposit rates. Available-for-sale financial assets Available-for-sale financial assets are non-derivative financial assets that are designated as available-for-sale and are not classified in any of the previous categories of financial assets. Available-for-sale financial assets are recognized initially at fair value plus any directly attributable transaction costs. Subsequent to initial recognition, these assets are measured at fair value and changes therein, other than impairment losses, are recognized in other comprehensive income and presented within equity. When an investment is derecognized through sale or has an impairment that is other than temporary, the cumulative gain or loss in other comprehensive income is transferred to profit or loss. The Company’s investments in equity securities are classified as available-for-sale financial assets. Non-derivative Financial Liabilities The Company initially recognizes debt securities issued and subordinated liabilities on the date that they originate. All other financial liabilities (including liabilities designated at fair value through profit or loss) are recognized initially on the trade date at which the Company becomes a party to the contractual provisions of the instrument. The Company derecognizes a financial liability when its contractual obligations are discharged, cancelled or expire. The Company has the following non-derivative financial liabilities: demand loans; bank overdrafts in the form of a line of credit; accounts payable and accrued liabilities; and the Company’s debenture. Such financial liabilities are recognized initially at fair value plus any directly attributable transaction costs. Subsequent to initial recognition these financial liabilities are measured at amortized cost using the effective interest method.

Claude Resources Inc. Notes to the Consolidated Financial Statements For the Years ended December 31, 2012 and 2011 Expressed in Thousands of Canadian Dollars, except share data or as otherwise noted
Page 62
Share Capital Common shares Common shares are classified as equity. Incremental costs directly attributable to the issue of common shares are recognized as a deduction from equity, net of any tax effects. Flow-through shares From time to time, the Company may finance a portion of its exploration activities through the issue of flow-through shares. The premium paid for flow through shares in excess of the market value of the shares without the flow-through features at the time of issue is credited to other liabilities and included in income at the time the qualifying expenditures are made. Debenture The Company’s debenture was issued with common share purchase warrants. The debenture and common share purchase warrants are presented separately on the Company’s Statement of Financial Position. Transaction costs incurred with the completion of this debenture have been netted against the proceeds received. The liability portion of the debenture has been designated as an other financial liability and was initially recognized at fair value. Subsequent to initial recognition, the debenture is measured at amortized cost using the effective interest method. The common share purchase warrants were initially recognized at fair value and are not remeasured subsequent to initial recognition. Derivative and Other Financial Instruments Derivative financial instruments, which include foreign exchange and gold derivative contracts, are not designated as hedges. These instruments are recorded using the mark-to-market method of accounting whereby the instruments are recorded in the consolidated Statement of Financial Position at their fair value as either an asset or liability with changes in fair value recognized in profit or loss. Transaction costs are expensed as incurred. Effective Interest Rate Method The Company utilizes the effective interest rate method when accounting for certain of its financial instruments. The effective interest rate method is a method of calculating the amortized cost of a financial asset or a financial liability (or group of financial assets or financial liabilities) and of allocating the interest income or interest expense over the relevant period. The effective interest rate is the rate that discounts estimated future cash payments or receipts through the expected life of the financial instrument or, when appropriate, a shorter period to the net carrying amount of the financial asset or financial liability. When calculating the effective interest rate, the Company estimates cash flows considering all contractual terms of the financial instrument. INVENTORIES Inventories are comprised of broken ore, gold in-circuit and consumable materials and supplies. Broken ore represents material that, at the time of extraction, the Company expects to process into a saleable form and sell at a profit. Ore is recorded as an asset that is classified within inventory as material is extracted from underground mines. Ore contained in stockpiles is initially measured by estimating the number of tonnes added and removed from the stockpile, and then converted to estimated ounces of gold contained therein based on assay data and applying estimated metallurgical recovery rates (based on the expected processing method). As ore is processed, costs are removed based on recoverable quantities of gold and each stockpile’s average cost per unit. Ore is accumulated in stockpiles which are subsequently processed into gold dore in a saleable form under a mine plan that takes into consideration optimal scheduling of production of the Company’s reserves, present plant capacity and the market price of gold. Gold contained in the milling circuit represents gold that the Company counts as production but is not yet in a saleable form. Gold contained in the milling circuit and in stockpiled ore on surface is valued at the lower of cost and net realizable value. Costs include labour, equipment costs and operating overhead. Material and supplies inventory is valued at the lower of cost and net realizable value. Any provision for obsolescence is determined by reference to specific stock items identified as obsolete.

Claude Resources Inc. Notes to the Consolidated Financial Statements For the Years ended December 31, 2012 and 2011 Expressed in Thousands of Canadian Dollars, except share data or as otherwise noted
Page 63
MINERAL PROPERTIES The Company holds various positions in mining interests, including exploration rights, mineral claims, mining leases, unpatented mining leases and options to acquire mining claims or leases. All of these positions are classified as mineral properties for financial statement purposes. Recognition and Measurement All costs related to the acquisition, exploration and development of mineral properties and the development of milling assets are capitalized on a property by property basis. These costs include expenditure that is directly attributable to the acquisition of the asset, as well as development costs on producing properties incurred to develop future producing assets. Development costs on producing properties include only expenditures incurred to develop reserves or for delineation of existing reserves. Interest on debt directly related to the acquisition and development of mineral properties is capitalized until commencement of commercial production. Expenditures for maintenance and repairs are charged to operations expenses as incurred. The cost of self-constructed assets includes the cost of materials and direct labour, any other costs directly attributable to bringing the assets to a working condition for their intended use, the costs of dismantling and removing the items and restoring the site on which they are located, and borrowing costs on qualifying assets. Items of property, plant and equipment are measured at cost less accumulated depreciation and accumulated impairment losses. The decision to develop a mine property within a project area is based on an assessment of the commercial viability of the property and the availability of financing. Once the decision to proceed to development is made, development and other expenditures relating to the project area are reclassified and disclosed as part of mineral properties with the intention that these will be depreciated by charges against earnings from future mining operations. No depreciation is charged against the property until commercial production commences. After a mine property has been brought into commercial production, costs of additional work on that property are expensed as incurred, except for new development costs which are capitalized. When material components of property, plant and equipment have different useful lives, they are accounted for as separate items (major components) of property, plant and equipment and depreciated separately. Gains and losses on disposal of an item of property, plant and equipment are determined by comparing the proceeds from disposal with the carrying amount of property, plant and equipment, and are recognized within other income in profit or loss. Subsequent Costs The cost of replacing a part of an item of property, plant and equipment is added to the carrying amount of the item if it is probable that the future economic benefits embodied within the part will flow to the Company, and its cost can be measured reliably. The carrying amount of the replaced part is removed. The costs of the day-to-day servicing of property, plant and equipment are recognized in profit or loss as incurred. Depreciation and Depletion Depreciation (on those assets subject to depreciation) is calculated over the depreciable amount (which is the cost of an asset, less its residual value, if any) using either the straight-line method or the units of production method. Depletion is calculated over the net book value using the units of production method. Land is shown at cost and not depreciated or depleted. Upon commencement of commercial production, the cost of mine development, mine buildings, plant and equipment directly used in production are amortized using the shorter of the unit of production method over estimated recoverable ore reserves or the useful life of the asset. Estimated recoverable ore reserves include proven and probable mineral reserves. Depreciation methods, useful lives and residual values are reviewed at each financial year end and adjusted if appropriate.
Claude Resources Inc. Notes to the Consolidated Financial Statements For the Years ended December 31, 2012 and 2011 Expressed in Thousands of Canadian Dollars, except share data or as otherwise noted
Page 64
EXPLORATION AND EVALUATION EXPENDITURES Exploration and evaluation expenditures are those expenditures incurred by the Company in connection with the exploration for and evaluation of mineral resources before the technical feasibility and commercial viability of extracting a mineral resource are demonstrable. Pre-exploration expenditures are expensed as incurred. All direct costs related to the acquisition and exploration of resource property interests are capitalized by property. Exploration and evaluation assets include expenditures on acquisition of rights to explore, studies, exploratory drilling, trenching, sampling, and other direct costs related to exploration or evaluation of a project. General and administrative costs are only included in the measurement of exploration and evaluation costs where they are related directly to operational activities in a particular area of interest. Exploration and evaluation assets are initially measured at cost and classified as tangible assets. An impairment review of exploration and evaluation assets is performed, either individually or at the cash-generating unit (“CGU”) level, when there are indicators that the carrying amount of the assets may exceed their recoverable amounts. To the extent that this occurs, the excess is fully provided for, in the financial period in which this is determined. Exploration and evaluation assets are reassessed on a regular basis and these costs are carried forward provided that at least one of the conditions below is met:
• such costs are expected to be recouped in full through successful development and exploration of the area of interest or alternatively, by its sale; or
• exploration and evaluation activities in the area of interest have not yet reached a stage that permits a reasonable assessment of the existence or otherwise of economically recoverable reserves, and active and significant operations in relation to the area are continuing, or planned for the future.
Where a project is determined to be technically or commercially feasible and a decision has been made to proceed with development with respect to a particular area of interest, the relevant exploration and evaluation asset is tested for impairment and the balance is reclassified as a development asset in mineral properties. LEASES Leases in terms of which the Company assumes substantially all the risks and rewards of ownership are classified as finance leases. Upon initial recognition the leased asset is measured at an amount equal to the lower of its cost or the present value of the minimum lease payments. Subsequent to initial recognition, the asset is accounted for in accordance with the accounting policy applicable to that asset. Other leases are operating leases and the leased assets are not recognized in the Company’s statement of financial position. DECOMMISSIONING AND RECLAMATION The mining, extraction and processing activities of the Company normally give rise to legal and / or a constructive obligation for site closure or environmental restoration. Closure and restoration can include property decommissioning and dismantling, removal or treatment of waste materials, as well as site and land restoration. The Company provides for the closure, reclamation and decommissioning of its operating and development sites based on the estimated future costs using information available at the reporting date. Costs included in the provision comprise all closure and restoration activity expected to occur gradually over the life of the operation and at the time of closure. Routine operating costs that may impact the ultimate closure and restoration activities, such as waste material handling conducted as a normal part of a mining or production process, are not included in the provision. The amount of the provision recognized is estimated based on the risk adjusted costs required to settle the present obligation, discounted using a pre-tax risk-free discount rate consistent with the probability weighted expected cash flows. When the provision is initially recorded, a corresponding asset is recognized. At each reporting date the restoration and rehabilitation provisions are remeasured in line with changes in discount rates and timing or amounts of the costs to be incurred.

Claude Resources Inc. Notes to the Consolidated Financial Statements For the Years ended December 31, 2012 and 2011 Expressed in Thousands of Canadian Dollars, except share data or as otherwise noted
Page 65
Changes in the provision relating to mine rehabilitation and restoration obligations, which are not the result of the current production of inventory, are added to or deducted from the related asset, other than the unwinding of the discount which is recognized as a finance cost in the Statements of Income. Changes to the provision for reclamation and remediation obligations related to operating mines, which are not the result of current production of inventory, are recorded with an offsetting change to the related asset. For properties where mining activities have ceased or are in reclamation, changes are charged directly to earnings. IMPAIRMENT Financial Assets A financial asset not carried at fair value through profit or loss is assessed at each reporting date to determine whether there is objective evidence that it is impaired. A financial asset is impaired if objective evidence indicates that a loss event has occurred after the initial recognition of the asset and that the loss event will have a negative effect on the estimated future cash flows of that asset. Objective evidence that financial assets (including equity securities) are impaired can include default or delinquency by a debtor, restructuring of an amount due to the Company on terms that the Company would not consider otherwise, indications that a debtor or issuer will enter bankruptcy, or the disappearance of an active market for a security. In addition, for an investment in an equity security, a significant or prolonged decline in its fair value below its cost is objective evidence of impairment. At the end of each reporting period, the Company assesses whether there is objective evidence that a financial asset or group of financial assets is impaired. With respect to available-for-sale securities, for which unrealized gains and losses are generally recognized in Other Comprehensive income (“OCI”), a significant or prolonged decline in the fair value of the investment below its cost may be evidence that the assets are impaired. If objective evidence of impairment were to exist, the impaired amount (i.e. the unrealized loss) would be recognized in profit (loss); any subsequent reversals would be recognized in OCI and would not flow back into profit (loss). Impairment losses on available-for-sale investment securities are recognized by transferring the cumulative loss that has been recognized in other comprehensive income, and presented in unrealized gains/losses on available-for-sale financial assets in equity, to profit or loss. The cumulative loss that is removed from other comprehensive income and recognized in profit or loss is the difference between the acquisition cost, net of any principal repayment and amortization, and the current fair value, less any impairment loss previously recognized in profit or loss. If, in a subsequent period, the fair value of an impaired available-for-sale investment security increases and the increase can be related objectively to an event occurring after the impairment loss was recognized in profit or loss, then the impairment loss is reversed, with the amount of the reversal recognized in profit or loss. However, any subsequent recovery in the fair value of an impaired available-for-sale equity security is recognized in other comprehensive income. Non-Financial Assets The carrying amounts of the Company’s non-financial assets, other than inventories, deferred tax assets, and exploration and evaluation assets, are reviewed at each reporting date to determine whether there is any indication of impairment. If any such indication exists, then the asset’s recoverable amount is estimated. The recoverable amount of an asset or CGU is the greater of its value in use and its fair value less costs to sell. Fair value less cost to sell is determined as the amount that would be obtained from the sale of the asset in an arm’s length transaction between knowledgeable and willing parties. Fair value for mineral assets is generally determined as the present value of the estimated future cash flows expected to arise from the continued use of the asset, including any expansion prospects, and its eventual disposal, using assumptions that an independent market participant would take into account. These cash flows are discounted by an appropriate discount rate to arrive at a net present value of the asset. Value in use is determined as the present value of the estimated future cash flows expected to arise from the continued use of the asset in its present form and its eventual disposal. Value in use is determined by applying assumptions specific to the Company’s continued use and cannot take into account future development. These assumptions are

Claude Resources Inc. Notes to the Consolidated Financial Statements For the Years ended December 31, 2012 and 2011 Expressed in Thousands of Canadian Dollars, except share data or as otherwise noted
Page 66
different than those used in calculating fair value and consequently the value in use calculation is likely to give a different result (usually lower) than a fair value calculation. The estimated future cash flows are discounted to their present value using a post-tax discount rate that reflects current market assessments of the time value of money and the risks specific to the asset. For the purpose of impairment testing, assets that cannot be tested individually are grouped together into the smallest group of assets that generates cash inflows from continuing use that are largely independent of the cash inflows of other assets or groups of assets. An impairment loss is recognized if the carrying amount of an asset or CGU exceeds its recoverable amount. Impairment losses are recognized in profit (loss). Impairment losses recognized in respect of CGUs are allocated first to reduce the carrying amount of goodwill, if any, allocated to the units, and then to reduce the carrying amounts of the other assets in the unit (group of units) on a pro rata basis. Impairment losses recognized in prior periods are assessed at each reporting date whenever events or changes in circumstances indicate that the impairment may have reversed. An impairment loss is reversed only to the extent that the asset’s carrying amount does not exceed the carrying amount that would have been determined, net of depreciation or amortization, if no impairment loss had been recognized. A reversal of an impairment loss is recognized immediately in profit (loss). PROVISIONS A provision is recognized if, as a result of a past event, the Company has a present legal or constructive obligation that can be estimated reliably, and it is probable that an outflow of economic benefits will be required to settle the obligation. Provisions are determined by discounting the expected future cash flows at a pre-tax rate that reflects current market assessments of the time value of money and the risks specific to the liability. The unwinding of the discount is recognized as finance cost. EMPLOYEE FUTURE BENEFITS Short-term Employee Benefits Short-term employee benefit obligations are measured on an undiscounted basis and are expensed as the related service is provided. A liability is recognized for the amount expected to be paid under short-term cash bonus plans if the Company has a present legal or constructive obligation to pay this amount as a result of past service provided by the employee and the obligation can be estimated reliably. Share-based Payments The Company has two stock-based compensation plans which are described further in Note 12(a) and 12(b). Stock Option Plan The Company accounts for all stock option awards using the fair-value method of accounting. Under this method, the Company recognizes compensation expense for the stock options granted based on their grant date fair value, which is determined using the Black-Scholes option pricing model. The fair value of the option is expensed over the vesting period with a corresponding amount recorded as contributed surplus. Consideration received on the exercise of stock options is recorded as share capital and the related contributed surplus is transferred to share capital. Employee Share Purchase Plan Under the Employee Share Purchase Plan (“ESPP”), compensation expense is recognized as the fair value of the shares granted under the plan and is recognized over the one year vesting period pursuant to the ESPP. Consideration received from the ESPP is recorded as share capital and amounts recorded in contributed surplus related to the fair value of the shares granted under the plan are transferred to share capital upon the issuance of shares. Shares issued pursuant to the ESPP are valued using the Black-Scholes option pricing model using variables in effect at the grant date.

Claude Resources Inc. Notes to the Consolidated Financial Statements For the Years ended December 31, 2012 and 2011 Expressed in Thousands of Canadian Dollars, except share data or as otherwise noted
Page 67
Deferred Share Unit Plan The Company’s Deferred Share Unit (“DSU”) Plan is a cash-settled plan. For cash-settled plans, the fair value of the amount payable to eligible individuals is recognized as an expense, with a corresponding increase in liabilities, over the period that the individuals unconditionally become entitled to payment. The liability is re-measured at each reporting date and at the settlement date. Any changes in the fair value of the liability are recognized as employee benefit expense in earnings. REVENUE RECOGNITION Revenue from the sale of precious metals is recognized when the significant risks and rewards of ownership have passed to the customer. This is when persuasive evidence of an arrangement exists, title and insurance risk passes to the customer, collection is reasonably assured and the price is reasonably determinable. LEASE PAYMENTS Payments made under operating leases are recognized in profit or loss on a straight-line basis over the term of the lease. Lease incentives received are recognized as an integral part of the total lease expense, over the term of the lease. Minimum lease payments made under finance leases are apportioned between the finance expense and the reduction of the outstanding liability. The finance expense is allocated to each period during the lease term so as to produce a constant periodic rate of interest on the remaining balance of the liability. INCOME TAXES Income tax expense is comprised of current and deferred taxes. Current tax and deferred tax are recognized in profit or loss except to the extent that it relates to a business combination, or items recognized directly in equity or in other comprehensive income. Current Current tax is the expected tax payable or receivable on the taxable income or loss for the year, using tax rates enacted or substantially enacted at the reporting date, and any adjustments to tax payable in respect of previous years. Deferred Deferred tax is recognized in respect of temporary differences between the carrying amounts of assets and liabilities for financial reporting purposes and the amounts used for taxation purposes. Deferred tax is measured at the tax rates that are expected to be applied to temporary differences when they reverse, based on the laws that have been enacted or substantively enacted by the reporting date. A deferred tax asset is recognized for unused tax losses, tax credits and deductible temporary differences, to the extent that it is probable that future taxable profits will be available against which they can be utilized. Deferred tax assets are reviewed at each reporting date and are reduced to the extent that it is no longer probable that the related tax benefit will be realized. Tax Exposures In determining the amount of current and deferred tax, the Company takes into account the impact of uncertain tax positions and whether additional taxes and interest may be due. This assessment relies on estimates and assumptions and may involve a series of judgments about future events. New information may become available that causes the Company to change its judgment regarding the adequacy of existing tax liabilities; such changes to tax liabilities will impact tax expense in the period that such a determination is made. EARNINGS PER SHARE The Company presents basic and diluted earnings per share (“EPS”) data for its common shares. Basic per share amounts are calculated using the weighted average number of shares outstanding during the period. Diluted per share amounts are calculated based on the treasury-stock method, which assumes that any proceeds obtained on exercise of options and warrants, along with any unrecognized stock-based compensation, would be used by the Company to

Claude Resources Inc. Notes to the Consolidated Financial Statements For the Years ended December 31, 2012 and 2011 Expressed in Thousands of Canadian Dollars, except share data or as otherwise noted
Page 68
repurchase common shares at the average market price during the period. The weighted average number of shares outstanding is then adjusted by the net change. 4. Accounting Standards: Future Changes in Accounting Policies Financial Instruments IFRS 9, Financial Instruments (“IFRS 9”), was issued by the IASB on November 12, 2009 and will replace IAS 39, Financial Instruments: Recognition and Measurement (“IAS 39”). IFRS 9 uses a single approach to determine whether a financial asset is measured at amortized cost or fair value, replacing the multiple rules in IAS 39. The approach in IFRS 9 is based on how an entity manages its financial instruments in the context of its business model and the contractual cash flow characteristics of the financial assets. The new standard also requires a single impairment method to be used, replacing the multiple impairment methods in IAS 39. IFRS 9 is effective for annual periods beginning on or after January 1, 2015. The Company is currently evaluating the impact of IFRS 9 on its financial statements. Consolidated Financial Statements In May 2011, the IASB issued IFRS 10, Consolidated Financial Statements. This new standard defines the principle of control and establishes control as the basis for determining which entities are included in consolidated financial statements. The principle of control is based on three criteria: power over the investee; exposure to variable returns from involvement in the investee; and the ability of the investor to use its power to affect the amount of its returns. The standard requires control of an investee to be reassessed when the facts and circumstances indicate that there have been changes to one or more of the criteria for determining control. This new standard supersedes the requirements relating to consolidated financial statements in IAS 27, Consolidated and Separate Financial Statements (as amended in 2009) and SIC-12, Consolidation – Special Purpose Entities. IFRS 10 is effective for the Company beginning on January 1, 2013, with early adoption permitted. The Company does not expect the adoption of this standard to have a material impact on its financial statements. Joint Arrangements IFRS 11, Joint Arrangements, was issued by the IASB in May 2011 and is effective for annual periods beginning on or after January 1, 2013 with early adoption permitted. Under IFRS 11, joint arrangements are classified as either joint operations or joint ventures. Parties to a joint operation retain the rights and obligations to individual assets and liabilities of the operation, while parties to a joint venture have rights to the net assets of the venture. Any arrangement which is not structured through a separate entity or is structured through a separate entity but such separation is ineffective such that the parties to the arrangement have rights to the assets and obligations for the liabilities will be classified as a joint operation. Joint operations shall be accounted for in a manner consistent with jointly controlled assets and operations whereby the Company’s contractual share of the arrangement’s assets, liabilities, revenues and expenses are included in the consolidated financial statements. Any arrangement structured through a separate vehicle that does effectively result in separation between the Company and the arrangement shall be classified as a joint venture and accounted for using the equity method of accounting. Under the existing IFRS standard, the Company has the option to account for any interests it has in joint ventures using proportionate consolidation or equity accounting. The Company does not expect the adoption of this standard to have a material impact on its financial statements. Disclosure of Interests in Other Entities In May 2011, the IASB issued IFRS 12, Disclosure of Interests in Other Entities. This new standard requires enhanced disclosures about an entity’s interest in subsidiaries, joint arrangements, associates and unconsolidated structured entities. IFRS 12 contains new disclosure requirements for interests the Company has in subsidiaries, joint arrangements, associates and unconsolidated structured entities. Required disclosures aim to provide readers of the financial statements with information to evaluate the nature of and risks associated with the Company’s interests in other entities and the effects of those interests on the Company’s financial statements. IFRS 12 is effective for the Company beginning on January 1, 2013. It is expected that IFRS 12 will increase the current level of disclosure related to the Company’s interests in other entities upon adoption.

Claude Resources Inc. Notes to the Consolidated Financial Statements For the Years ended December 31, 2012 and 2011 Expressed in Thousands of Canadian Dollars, except share data or as otherwise noted
Page 69
Fair Value Measurement In May 2011, the IASB published IFRS 13, Fair Value Measurement, which is effective prospectively for annual periods beginning on or after January 1, 2013. IFRS 13 replaces fair value measurement guidance contained in individual IFRSs, providing a single source of fair value measurement guidance. The standard provides a framework for measuring fair value and establishes new disclosure requirements to enable readers to assess the methods and inputs used to develop fair value measurements and for recurring valuations that are subject to measurement uncertainty, the effect of those measurements on the financial statements. The Company intends to adopt IFRS 13 prospectively in its financial statements for the annual period beginning on January 1, 2013. The Company does not expect the adoption of this standard to have a material impact on its financial statements. Presentation of Financial Statements In June 2011, the IASB issued an amendment to IAS 1, Presentation of Items of OCI: Amendments to IAS 1 Presentation of Financial Statements. The amendments stipulate the presentation of net profit and OCI and also require the Company to group items within OCI based on whether the items may be subsequently reclassified to profit or loss. Amendments to IAS 1 are effective for annual periods beginning on or after July 1, 2012. The Company does not expect the adoption of the amendments to this standard to have a material impact on its financial statements. Investments in Associates and Joint Ventures In May 2011, the IASB issued amendments to IAS 28, Investments in Associates and Joint Ventures, which are effective for annual periods beginning on or after January 1, 2013 with early adoption permitted. Amendments to IAS 28 provide additional guidance applicable to accounting for interests in joint ventures or associates when a portion of an interest is classified as held for sale or when the Company ceases to have joint control or significant influence over an associate or joint venture. When joint control or significant influence over an associate or joint venture ceases, the Company will no longer be required to re-measure the investment at that date. When a portion of an interest in a joint venture or associate is classified as held for sale, the portion not classified as held for sale shall be accounted for using the equity method of accounting until the sale is completed at which time the interest is reassessed for prospective accounting treatment. The Company does not expect the amendments to IAS 28 to have a material impact on the financial statements. Offsetting Financial Assets and Liabilities In December 2011, the IASB published Offsetting Financial Assets and Financial Liabilities and issued new disclosure requirements in IFRS 7 Financial Instruments: Disclosures. The amendments to IAS 32 clarify that an entity currently has a legally enforceable right to set-off if that right is not contingent on a future event, and enforceable both in the normal course of business and in the event of default, insolvency or bankruptcy of the entity and all counterparties. The amendments to IAS 32 also clarify when a settlement mechanism provides for net settlement or gross settlement that is equivalent to net settlement. The amendments to IFRS 7 contain new disclosure requirements for financial assets and liabilities that are offset in the statement of financial position, or subject to master netting arrangements or similar arrangements. The effective date for the amendments to IAS 32 is annual periods beginning on or after January 1, 2014. The effective date for the amendments to IFRS 7 is annual periods beginning on or after January 1, 2013. These amendments are to be applied retrospectively. The Company does not expect the amendments to IAS 32 to have a material impact on the financial statements. 5. Determination of Fair Values: A number of the Company’s accounting policies and disclosures require the determination of fair value, for both financial and non-financial assets and liabilities. Fair values have been determined for measurement and or disclosure purposes based on the methods described below. When applicable, further information about the assumptions made in determining fair values is disclosed in the notes specific to that asset or liability. Investments in Equity Securities and Debt Securities The fair value of the Company’s available-for-sale financial assets is determined by reference to their quoted closing bid price at the reporting date.

Claude Resources Inc. Notes to the Consolidated Financial Statements For the Years ended December 31, 2012 and 2011 Expressed in Thousands of Canadian Dollars, except share data or as otherwise noted
Page 70
Derivatives The fair value of the Company’s forward exchange contracts are estimated based on appropriate price modeling commonly used by market participants. Such modeling uses discounted cash flow analysis with observable market inputs including future interest rates, implied volatilities and the credit risk of the Company or the counterparties as appropriate, with resulting valuations periodically validated through third-party or counterparty quotes. Share-based payment transactions The fair value of issuances under the Company’s employee share purchase plan, and stock option plan are measured using the Black-Scholes option pricing model. Measurement inputs include share price on measurement date, exercise price of the instrument, expected volatility (based on weighted average historic volatility adjusted for changes expected due to publicly available information), weighted average expected life of the instruments (based on historical experience and general option holder behavior) and the risk-free interest rate (based on government bonds). 6. Inventories: Details of the Company’s inventories are as follows:
DEC 31 DEC 31 2012 2011 Gold in-circuit (1) (2) $ 3,616 $ 3,128 Stockpiled ore (1) (2) 1,191 265 Materials and supplies (3) 14,371 9,973 Inventories $ 19,178 $ 13,366
(1) For the year ended December 31, 2012, depreciation and depletion of $1.6 million is included in the above
noted balances (December 31, 2011 - $0.7 million). (2) There was no write-down or reversal of write-down of gold inventory for the year ended December 31, 2012.
For the year ended December 31, 2011, the Company wrote-down $0.5 million of gold inventory. (3) There was no write-down or reversal of write-down of materials and supplies inventory for the year ended
December 31, 2012. For the year ended December 31, 2011, the Company wrote-down $0.2 million of materials and supplies inventory.
7. Mineral Properties: Details of the Company’s property, plant and equipment included in mineral properties are as follows: Cost Property Exploration acquisition Buildings, And and mine plant and evaluations development equipment assets Total Balance at January 1, 2011 $ 120,847 $ 104,302 $ 67,456 $ 292,605 Additions 25,548 16,767 13,593 55,908 Transfers between groups 15,757 - (15,757) - Balance at December 31, 2011 $ 162,152 $ 121,069 $ 65,292 $ 348,513 Balance at January 1, 2012 $ 162,152 $ 121,069 $ 65,292 $ 348,513 Additions 21,607 20,192 32,514 74,313 Balance at December 31, 2012 $ 183,759 $ 141,261 $ 97,806 $ 422,826

Claude Resources Inc. Notes to the Consolidated Financial Statements For the Years ended December 31, 2012 and 2011 Expressed in Thousands of Canadian Dollars, except share data or as otherwise noted
Page 71
Depreciation and impairment losses Balance at January 1, 2011 $ 98,034 $ 81,597 $ 6,495 $ 186,126 Depreciation 5,482 6,260 - 11,742 Impairment - - 851 851 Balance at December 31, 2011 $ 103,516 $ 87,857 $ 7,346 $ 198,719 Balance at January 1, 2012 $ 103,516 $ 87,857 $ 7,346 $ 198,719 Depreciation 7,554 8,951 - 16,505 Balance at December 31, 2012 $ 111,070 $ 96,808 $ 7,346 $ 215,224 Carrying amounts At December 31, 2011 $ 58,636 $ 33,212 $ 57,946 $ 149,794 At December 31, 2012 $ 72,689 $ 44,453 $ 90,460 $ 207,602 Exploration properties Amounts reflected for exploration properties not in commercial production represent costs incurred to date, net of impairments, and are not intended to reflect present or future values. The recoverability of these costs is dependent upon the discovery of economically recoverable ore reserves and the ability to obtain necessary financing for the development of future profitable production from the properties or realization of sufficient proceeds from the disposition of the properties. At December 31, 2012, the Company reviewed its exploration and evaluation assets individually for indicators of impairment. Management believes that the Company’s exploration and evaluation assets have not yet reached a stage that permits a reasonable assessment of the economically recoverable reserves. In addition, exploration activities in relation to these assets are continuing or planned for the future. As such, no indicators that the carrying amount of these assets may exceed their recoverable amount were noted. During 2011, the Company transferred exploration and evaluations assets related to the Santoy 8 to mine development costs upon the property achieving technical feasibility and economic viability. In accordance with IFRS, the Company tested these costs for impairment upon transfer to mine development and determined that no impairment charge was required. Fair value less costs to sell was used to assess impairment and was determined using a discounted cash flow approach that incorporated marketplace participant assumptions. The cash flows were discounted over an 8 year period at a post-tax rate of 11.3 percent. Impairment loss During the year ended December 31, 2012, the Company tested its CGUs for indicators of impairment and determined that the fair value less cost to sell of the Company’s CGUs (the Seabee Gold Mine and the Santoy Mine Complex) were greater than the carrying value; as such, an impairment charge was not required. Fair value less cost to sell was determined using a discounted cash flow approach that incorporated marketplace participant assumptions. The cash flows for the Seabee Mine were discounted over a nine year period at a post-tax rate of 9.25 percent. The cash flows for the Santoy Mine Complex were discounted over a 13 year period at a post-tax rate of 9.25 percent. While testing the Seabee Gold Mine for impairment, the Company reviewed and concluded that a reversal of the January 1, 2010 impairment charge of $13.1 million was not warranted because indicators of reversal were not present. Leased machinery The Company leases production equipment under a number of finance lease agreements. Some leases provide the Company with the option to purchase the equipment at a beneficial price. Some leases are for specialized equipment and in these leases the Company can cancel the leases at its option, but is responsible for reimbursing the lessor for any losses incurred. The leased equipment secures lease obligations (see Note 11). At December 31, 2012 the carrying amount of assets under finance leases included in buildings, plant and equipment was $5.1 million (December 31, 2011: $7.9 million).

Claude Resources Inc. Notes to the Consolidated Financial Statements For the Years ended December 31, 2012 and 2011 Expressed in Thousands of Canadian Dollars, except share data or as otherwise noted
Page 72
Security The Company’s demand loans (Note 11) were utilized for the purchases of specialized equipment. The equipment purchased secures the obligations under these demand loans. At December 31, 2012 the carrying amount of assets utilized as security under demand loans included in buildings, plant and equipment was $8.9 million (December 31, 2011: $nil). The Company’s debenture (Note 11) is secured by a general security agreement covering all of the Company's assets, except those subordinated to bank debt. Capitalized interest Debenture interest costs of $0.5 million for the year ended December 31, 2012 (December 31, 2011: $0.5 million) relating to the Madsen project have been capitalized in accordance with the Company’s accounting policy. Mine Operating Costs by Function
DEC 31 DEC 31 2012 2011 Production costs $ 48,535 $ 40,542 Depreciation and depletion 15,681 11,407 Write-down of exploration property - 851 (Gain) on sale of exploration property - (1,131) $ 64,216 $ 51,669
8. Investments:
DEC 31 DEC 31 2012 2011 Available-for-sale securities, beginning of year $ 2,854 $ 4,328 Disposition of available-for-sale securities (1,565) (197) Acquisition of available-for-sale securities (1) - 1,131 Write-down of available-for-sale securities (993) (74) Unrealized gain (loss) on available-for-sale securities 82 (2,334) Available-for-sale securities, end of year $ 378 $ 2,854
(1) The acquisition in 2011 related to shares in a public company received as settlement for Claude’s disposition
of a mineral property interest. At December 31, 2012, the Company reviewed its portfolio of available-for-sale securities in order to assess whether there was objective evidence of impairment. Factors considered in the Company’s assessment included the length of time and extent which to fair value was below cost and current conditions specific to the investment. Utilizing these factors, the Company determined that certain of its available-for-sale securities had objective evidence of impairment and were written down. By holding these available-for-sale securities, the Company is exposed to various risk factors including market price risk and liquidity risk (Note 19). 9. Decommissioning and Reclamation: The Company’s decommissioning and reclamation costs consists of reclamation and closure costs. Mineral property obligations were determined using discount rates ranging from 1.73 to 2.11 percent. Expected undiscounted payments of future obligations are $10.3 million over the next 6 to 15 years. An accretion expense component of $0.2 million has been charged during the year ended December 31, 2012, augmented by revisions made to the decommissioning and reclamation costs, resulting in an increase in the overall carrying amount of the provision. Changes to the provision during the year ended December 31, 2012 are as follows:
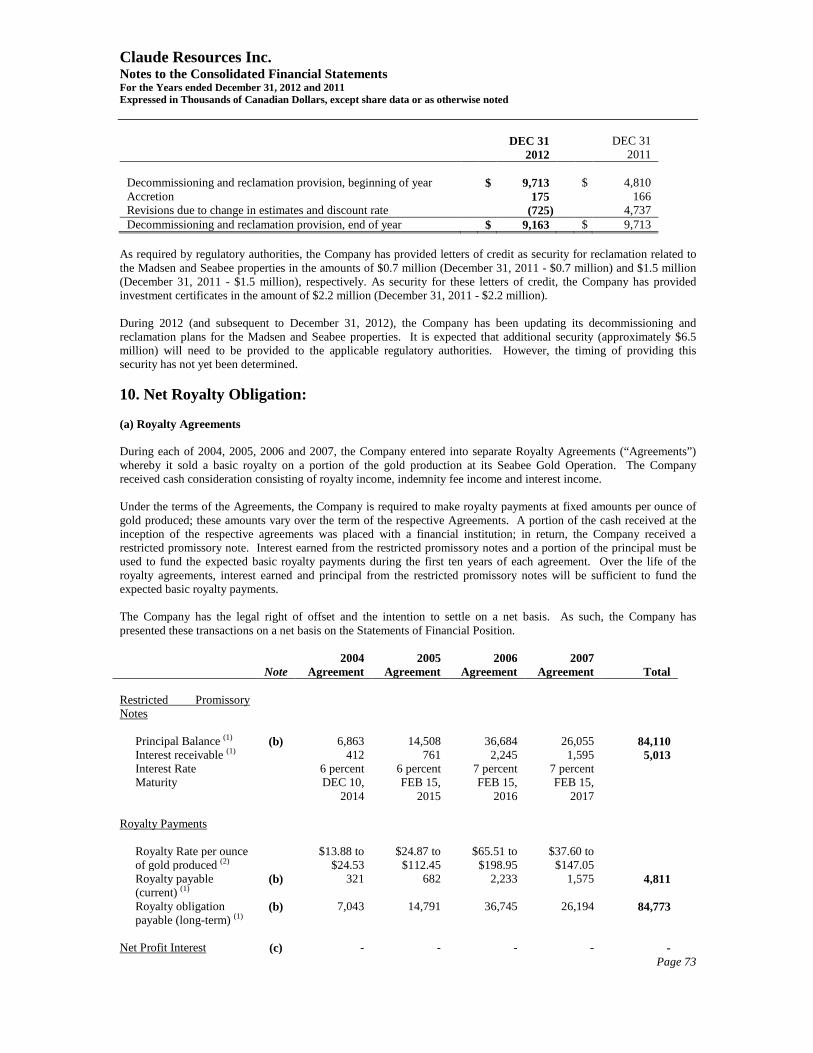
Claude Resources Inc. Notes to the Consolidated Financial Statements For the Years ended December 31, 2012 and 2011 Expressed in Thousands of Canadian Dollars, except share data or as otherwise noted
Page 73
DEC 31 DEC 31 2012 2011 Decommissioning and reclamation provision, beginning of year $ 9,713 $ 4,810 Accretion 175 166 Revisions due to change in estimates and discount rate (725) 4,737 Decommissioning and reclamation provision, end of year $ 9,163 $ 9,713
As required by regulatory authorities, the Company has provided letters of credit as security for reclamation related to the Madsen and Seabee properties in the amounts of $0.7 million (December 31, 2011 - $0.7 million) and $1.5 million (December 31, 2011 - $1.5 million), respectively. As security for these letters of credit, the Company has provided investment certificates in the amount of $2.2 million (December 31, 2011 - $2.2 million). During 2012 (and subsequent to December 31, 2012), the Company has been updating its decommissioning and reclamation plans for the Madsen and Seabee properties. It is expected that additional security (approximately $6.5 million) will need to be provided to the applicable regulatory authorities. However, the timing of providing this security has not yet been determined. 10. Net Royalty Obligation: (a) Royalty Agreements During each of 2004, 2005, 2006 and 2007, the Company entered into separate Royalty Agreements (“Agreements”) whereby it sold a basic royalty on a portion of the gold production at its Seabee Gold Operation. The Company received cash consideration consisting of royalty income, indemnity fee income and interest income. Under the terms of the Agreements, the Company is required to make royalty payments at fixed amounts per ounce of gold produced; these amounts vary over the term of the respective Agreements. A portion of the cash received at the inception of the respective agreements was placed with a financial institution; in return, the Company received a restricted promissory note. Interest earned from the restricted promissory notes and a portion of the principal must be used to fund the expected basic royalty payments during the first ten years of each agreement. Over the life of the royalty agreements, interest earned and principal from the restricted promissory notes will be sufficient to fund the expected basic royalty payments. The Company has the legal right of offset and the intention to settle on a net basis. As such, the Company has presented these transactions on a net basis on the Statements of Financial Position.
Note 2004
Agreement 2005
Agreement 2006
Agreement 2007
Agreement Total Restricted Promissory Notes
Principal Balance (1) (b) 6,863 14,508 36,684 26,055 84,110 Interest receivable (1) 412 761 2,245 1,595 5,013 Interest Rate 6 percent 6 percent 7 percent 7 percent Maturity DEC 10,
2014 FEB 15,
2015 FEB 15,
2016 FEB 15,
2017
Royalty Payments Royalty Rate per ounce
of gold produced (2) $13.88 to
$24.53 $24.87 to
$112.45 $65.51 to
$198.95 $37.60 to
$147.05
Royalty payable (current) (1)
(b) 321 682 2,233 1,575 4,811
Royalty obligation payable (long-term) (1)
(b) 7,043 14,791 36,745 26,194 84,773
Net Profit Interest (c) - - - - -

Claude Resources Inc. Notes to the Consolidated Financial Statements For the Years ended December 31, 2012 and 2011 Expressed in Thousands of Canadian Dollars, except share data or as otherwise noted
Page 74
Note
2004 Agreement
2005 Agreement
2006 Agreement
2007 Agreement Total
Applicable years 2010-2014 2011-2015 2012-2016 2013-2017 Percent 2.50, 3.00 or
4.00 1.00, 2.00 or
3.00 3.75, 4.00 or
4.25 3.50, 3.70 or
3.90
Price of gold thresholds $800, $900 or $1,200
$875, $1,075 or
$1,275
$975, $1,175 or
$1,375
$1,250, $1,500 or
$1,675
(1) At December 31, 2012. (2) Over the remaining life of the respective agreements.
(b) Net Royalty Obligation The following schedule outlines the different components of the transaction that are presented net on the Company’s consolidated Statements of Financial Position:
DEC 31 DEC 31 2012 2011 Current portion Assets Interest receivable on Restricted promissory notes $ 5,013 $ 4,953 Liabilities Current portion of deferred revenue 1,038 996 Interest payable on royalty obligations 4,811 4,811 $ 5,849 $ 5,807 Net royalty obligation (current) (836) (854) Long-term portion Assets Restricted promissory notes $ 84,110 $ 84,037 Liabilities Deferred revenue 2,542 3,586 Royalty obligation 84,773 84,886 $ 87,315 $ 88,472 Net royalty obligation (long-term) (3,205) (4,435) Net royalty obligation $ (4,041) $ (5,289)
The interest income and the indemnity fees received by the Company are being amortized into income over the prepayment period and the life of the respective agreements. The interest income and the indemnity fees are netted against interest expense and are reflected in “Financing expense” on the consolidated statement of income. (c) NPI Payment In addition to the royalty, the Company granted a net profit interest (“NPI”) of varying percentages, payable only if gold prices exceed a pre-determined threshold. Prior to any NPI payment, the Company is entitled to first recover the NPI expenditures (including capital expenditures), working capital, operating losses, interest charges and asset retirement obligations relating to the production of ore at the Seabee Operation. These expenditures are calculated on a cumulative basis from the commencement of the individual agreements. At December 31, 2012, the cumulative carry

Claude Resources Inc. Notes to the Consolidated Financial Statements For the Years ended December 31, 2012 and 2011 Expressed in Thousands of Canadian Dollars, except share data or as otherwise noted
Page 75
forward amounts remained in a deficiency position under each of the agreements and no payments are expected during 2013 or 2014. (d) Call and Put Under certain circumstances, a 100 percent owned subsidiary of Claude will have the right to purchase (“Call”) the equity of the holder of the royalties or right to receive the royalties at an amount no greater than the fair market value thereof at the time of the Call. The Call price will be paid from the balance owing to the Company under the promissory notes. Under certain circumstances, the purchaser of the royalties will have the right to sell (“Put”) their interest in the royalty to the Company at an amount no greater than the fair market value thereof at the time of the Put. However, such right is subject to the subsidiary of Claude’s pre-emptive right to exercise the Call in advance of any Put being exercised and completed. 11. Loans and Borrowings: This note provides information about the contractual terms of the Company’s interest-bearing loans and borrowings, which are measured at amortized cost. For more information about the Company’s exposure to interest rate and liquidity risk, see Note 19.
DEC 31 DEC 31 2012 2011 Current liabilities Demand loans (a) $ 5,337 $ 896 Current portion of finance lease liabilities (b) 1,495 2,119 Debenture (c) 9,665 - $ 16,497 $ 3,015 Non-current liabilities Finance lease liabilities (b) $ 291 $ 1,786 Debenture (c) - 9,452 $ 291 $ 11,238
(a) Demand Loans Terms and conditions of the Company’s outstanding demand loans are as follows:
DEC 31 DEC 31 2012 2011 Demand loan, repaid during 2012 $ - $ 896 Demand loans, repayable in consecutive monthly blended payments of $214,893 including interest at prime plus 1.50 percent, due between January and April 2015
5,337 -
$ 5,337 $ 896 The demand loans are secured by a general security agreement covering all assets of the Company. At December 31, 2012 the carrying amount of assets under demand loans included in buildings, plant and equipment was $8.9 million. (b) Finance Lease Liabilities Obligations under finance leases bear interest between 5.4 percent and 8.0 percent per annum, are due from 2013 to 2014 and are secured by the leased equipment. The estimated principal repayments on the leases are as follows: 2012 - $1,495; and 2013 - $291.
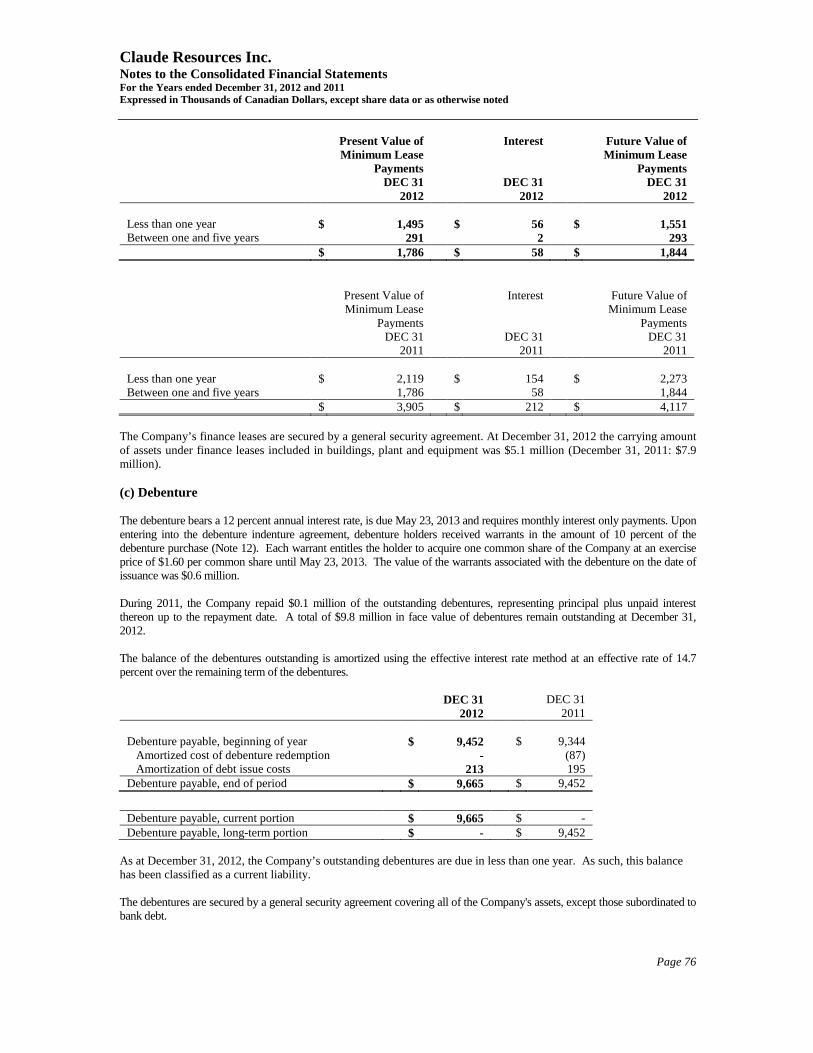
Claude Resources Inc. Notes to the Consolidated Financial Statements For the Years ended December 31, 2012 and 2011 Expressed in Thousands of Canadian Dollars, except share data or as otherwise noted
Page 76
Present Value of Interest Future Value of Minimum Lease Minimum Lease Payments Payments DEC 31 DEC 31 DEC 31 2012 2012 2012 Less than one year $ 1,495 $ 56 $ 1,551 Between one and five years 291 2 293 $ 1,786 $ 58 $ 1,844
Present Value of Interest Future Value of Minimum Lease Minimum Lease Payments Payments DEC 31 DEC 31 DEC 31 2011 2011 2011 Less than one year $ 2,119 $ 154 $ 2,273 Between one and five years 1,786 58 1,844 $ 3,905 $ 212 $ 4,117
The Company’s finance leases are secured by a general security agreement. At December 31, 2012 the carrying amount of assets under finance leases included in buildings, plant and equipment was $5.1 million (December 31, 2011: $7.9 million). (c) Debenture The debenture bears a 12 percent annual interest rate, is due May 23, 2013 and requires monthly interest only payments. Upon entering into the debenture indenture agreement, debenture holders received warrants in the amount of 10 percent of the debenture purchase (Note 12). Each warrant entitles the holder to acquire one common share of the Company at an exercise price of $1.60 per common share until May 23, 2013. The value of the warrants associated with the debenture on the date of issuance was $0.6 million. During 2011, the Company repaid $0.1 million of the outstanding debentures, representing principal plus unpaid interest thereon up to the repayment date. A total of $9.8 million in face value of debentures remain outstanding at December 31, 2012. The balance of the debentures outstanding is amortized using the effective interest rate method at an effective rate of 14.7 percent over the remaining term of the debentures.
DEC 31 DEC 31 2012 2011 Debenture payable, beginning of year $ 9,452 $ 9,344 Amortized cost of debenture redemption - (87) Amortization of debt issue costs 213 195 Debenture payable, end of period $ 9,665 $ 9,452
Debenture payable, current portion $ 9,665 $ - Debenture payable, long-term portion $ - $ 9,452
As at December 31, 2012, the Company’s outstanding debentures are due in less than one year. As such, this balance has been classified as a current liability. The debentures are secured by a general security agreement covering all of the Company's assets, except those subordinated to bank debt.

Claude Resources Inc. Notes to the Consolidated Financial Statements For the Years ended December 31, 2012 and 2011 Expressed in Thousands of Canadian Dollars, except share data or as otherwise noted
Page 77
(d) Line of Credit The Company has a $5.0 million operating line of credit which bears interest at prime plus 1.125 percent; the prime rate at December 31, 2012 was 3 percent. These funds are available for general corporate purposes. (e) Other Subsequent to December 31, 2012, the Company expanded its current debt facilities with CWB to the following (Note 22):
• $10.0 million operating line of credit (previous amount: $5.0 million); • $10.0 million finance lease line (previous amount: $7.0 million); and • $5.0 million revolving loan (new).
In addition to the above, the Company also executed a non-binding term sheet with Crown Capital Partner’s Inc. for an additional debt facility of $25.0 million (Note 22). 12. Share Capital: AUTHORIZED The authorized share capital of the Company consists of an unlimited number of common shares and two classes of unlimited preferred shares issuable in series. The first preferred shares are issuable in series and rank ahead of the second preferred shares and the common shares in respect of dividend payment, dissolution or any other distribution of assets. The other rights, privileges, restrictions and conditions attached to each series of the first preferred shares are fixed by the Board of Directors at the time of creation of such series. The second preferred shares are issuable in series and rank ahead of the common shares in respect of dividend payment, dissolution or any other distribution of assets. The other rights, privileges, restrictions and conditions attached to each series of the second preferred shares are fixed by the Board of Directors at the time of creation of such series. The common shares of the Company are entitled to vote at all meetings of the shareholders and, upon dissolution or any other distribution of assets, to receive such assets of the Company as are distributable to the holders of the common shares. DEC 31 DEC 31 Shares 2012 Shares 2011 Common shares: Outstanding, beginning of year 164,630,231 $ 176,994 138,913,329 $ 118,279 ESPP (a) 338,676 546 235,614 324 Exercise of stock options (b) 75,402 92 648,667 642 Equity issue (d) 8,701,255 12,008 - - Equity issue (e) - - 23,000,000 57,500 Broker warrant exercise (f) - - 139,321 162 Warrant exercise (f) - - 1,577,000 2,271 Warrant exercise (f) - - 116,300 223 Issue costs, net of income taxes - - - (2,407) Outstanding, end of year 173,745,564 189,640 164,630,231 176,994

Claude Resources Inc. Notes to the Consolidated Financial Statements For the Years ended December 31, 2012 and 2011 Expressed in Thousands of Canadian Dollars, except share data or as otherwise noted
Page 78
Warrants and other equity: Warrants (d) 12 - Common share purchase warrants (f) 2,700 2,700 Tax adjusted cumulative issue costs (228) (228) Common share purchase warrants (f) 552 552 Debenture purchase warrants (f) 513 513 173,745,564 $ 193,189 164,630,231 $ 180,531 The Company has the following equity-settled plans: (a) Employee Share Purchase Plan The ESPP was established to encourage employees to purchase Company common shares. Under the plan, eligible employees may contribute up to five percent of their basic annual salary and the Company shall contribute common shares in an amount equal to 50 percent of the employee’s contribution. Shares of the Company are issued to employees based on a weighted average market price over a specific period. During 2012, the Company issued 338,676 common shares (2011 – 235,614) pursuant to this plan. The maximum number of common shares of the Company available for issue under this ESPP is five percent of the Company’s common shares outstanding. The weighted average fair value of ESPP options granted during 2012 was $0.62 (2011 - $0.90) and was estimated using the Black-Scholes option pricing model with assumptions of a 1.00 year weighted average expected option life, a 16 percent expected forfeiture rate (2011 – 15 percent), 72 percent volatility (2011 – 53 percent) and an interest rate of 0.98 percent (2011 – 1.3 percent). The expected volatility used in the Black-Scholes option pricing model is based on the historical volatility of the Company’s shares over the weighted average expected option life. During 2012, compensation expense recognized in respect of the ESPP was $0.6 million (2011 - $0.3 million). This compensation expense has been included in General and administrative expense in the Consolidated Statements of Income. (b) Stock Option Plan The Company has established a stock option plan under which options may be granted to directors, officers and key employees. The maximum number of common shares available for option under the stock option plan is nine percent of the Company’s common shares outstanding. Options granted have an exercise price of the Company’s prior day’s closing price quoted on the TSX for the common shares Claude. All options are settled by physical delivery of shares. Vesting periods of options granted under the Company’s stock option plan vary on a grant by grant basis, at the discretion of the Company’s Board of Directors. Grants to Employees have a term to expiry of 7 to 10 years and typically have a vesting term of 3 to 5 years. Grants to Directors have a term to expiry of 7 to 10 years and vest immediately. Options outstanding under this plan at December 31, 2012 and December 31, 2011 and their weighted average exercise prices are as follows:
Weighted Weighted DEC 31 Average DEC 31 Average 2012 Exercise 2011 Exercise Options Price Options Price Beginning of period 5,484,250 $ 1.57 3,916,737 $ 1.15 Options granted 1,896,290 1.04 2,478,768 2.06 Options exercised (75,402) 0.78 (648,667) 0.75 Options forfeited (316,611) 1.82 (241,876) 1.86 Options expired (40,000) 1.51 (20,712) 1.04 End of period 6,948,527 $ 1.43 5,484,250 $ 1.57
The weighted average share price at the date of exercise for share options exercised during 2012 was $1.02 (December 31, 2011: $1.84). For director and employee options outstanding at December 31, 2012, the range of exercise prices, the weighted average exercise price and the weighted average remaining contractual life are as follows:

Claude Resources Inc. Notes to the Consolidated Financial Statements For the Years ended December 31, 2012 and 2011 Expressed in Thousands of Canadian Dollars, except share data or as otherwise noted
Page 79
Options Outstanding Options Exercisable
Option Price Per Share Quantity
Weighted Average
Remaining Life
Weighted Average Exercise
Price Quantity
Weighted Average
Remaining Life
Weighted Average Exercise
Price
$0.50 - $1.00 1,329,845 6.24 $0.72 846,512 6.03 $0.76 $1.01 - $1.50 2,633,731 5.86 1.20 2,199,898 5.79 1.19 $1.51 - $2.00 2,432,000 7.06 1.86 1,512,000 6.20 1.80 $2.01 - $2.38 552,951 7.80 2.30 338,903 7.53 2.26
6,948,527 6.51 $1.43 4,897,313 6.08 $1.38 The foregoing options have expiry dates ranging from June 30, 2013 to December 8, 2021. The weighted average fair value of stock options granted during 2012 was $0.65 (2011 - $1.37) and was estimated using the Black-Scholes option pricing model with assumptions of a 5.57 year (2011 – 7.11 year) weighted average expected option life, a two to four percent expected forfeiture rate (2011 – two percent), 65 percent to 76 percent volatility (2011 – 68 percent to 75 percent) and interest rates ranging from 1.1 percent to 1.8 percent (2011 – 1.3 percent to 3.1 percent). For the year ended December 31, 2012, the compensation expense recognized in respect of stock options was $1.6 million (2011 - $1.7 million). This compensation expense has been included in General and administrative expenses in the Consolidated Statements of Income. The expected volatility used in the Black-Scholes option pricing model is based on the historical volatility of the Company’s shares over the weighted average expected option life. The Company has the following cash-settled plan: (c) Deferred Share Unit Plan The Company offers a DSU plan to non-employee Directors. A DSU is a notional unit that reflects the market value of a single common share of Claude. For the year ended December 31, 2012, 50 percent of each Director’s annual retainer was paid in DSUs. Each DSU fully vests upon award and are redeemable for cash upon a director leaving the Company’s Board of Directors. The redemption amount will be based upon the weighted average of the closing prices of the common shares of Claude on the TSX for the last 20 trading days prior to the redemption date multiplied by the number of DSUs held by the Director. At December 31, 2012, total DSUs held by participating Directors was 283,791 (December 31, 2011 – nil). Compensation expense recognized in respect of DSUs during 2012 was $0.2 million (2011 - $nil). This compensation expense has been included in General and administrative expenses in the Consolidated Statements of Income. Equity Issues: (d) Acquisition During 2012, the Company issued 8,701,255 common shares pursuant to a Plan of Arrangement whereby Claude acquired all of the outstanding common shares of St. Eugene Mining Corporation Limited that it did not already own (Note 22). Pursuant to this transaction, the Company also granted a total of 853,594 common share purchase warrants to replace St. Eugene common share purchase warrants outstanding at the time of the transaction. (e) Short form Prospectus During 2011, the Company completed a short form prospectus offering. The Offering consisted of the issuance of 20,000,000 common shares of the Company, on a bought deal basis, at a price of $2.50 per share, as well as the issuance of 3,000,000 shares of the Company, at a price of $2.50 per share, to the Underwriters pursuant to the over-allotment option, for aggregate

Claude Resources Inc. Notes to the Consolidated Financial Statements For the Years ended December 31, 2012 and 2011 Expressed in Thousands of Canadian Dollars, except share data or as otherwise noted
Page 80
gross proceeds of $57,500,000. Other: (f) Schedule of Warrants Outstanding Each common share purchase warrant entitles the holder to acquire one common share of the Company at prices determined at the time of issue. The range of exercise prices and dates of expiration of the common share purchase warrants outstanding are as follows: Number Number Exercise Outstanding at Outstanding at Price Expiry Date DEC 31, 2011 Granted Expired DEC 31, 2012 $ 1.60 May 22, 2013 1,693,200 - - 1,693,200 $ 0.90 November 16, 2012 1,023,000 - 1,023,000 - $ 1.77 April 7, 2012 - 319,545 319,545 - $ 1.77 April 12, 2012 - 10,257 10,257 - $ 3.17 March 31, 2012 - 79,980 79,980 - $ 4.44 March 31, 2012 - 443,812 443,812 - 2,716,200 853,594 1,876,594 1,693,200 The warrants granted during 2012 relate to outstanding warrants assumed as part of the St. Eugene acquisition completed in the first quarter. Note 22 The weighted average fair value of warrants granted during 2012 was $0.02 and was estimated using the Black-Scholes option pricing model with assumptions of a 0.2 year weighted average expected option life, and an interest rates of 0.9 percent. The range of exercise prices and dates of expiration of the common share purchase warrants outstanding at December 31, 2011 were as follows: Number Number Exercise Outstanding at Outstanding at Price Expiry Date DEC 31, 2010 Exercised Expired DEC 31, 2011 $ 1.60 May 22, 2013 1,809,500 116,300 - 1,693,200 $ 0.83 April 9, 2011 139,321 139,321 - - $ 0.90 November 16, 2012 2,600,000 1,577,000 - 1,023,000 $ 1.75 December 30, 2011 6,000,000 - 6,000,000 - 10,548,821 1,832,621 6,000,000 2,716,200 13. Finance Expense:
DEC 31 DEC 31 2012 2011 Interest expense on loans and borrowings $ 1,514 $ 1,321 Interest capitalized to mineral properties (536) (542) Derivative loss 85 1,911 Debenture amortization 212 195 Accretion expense 175 166 $ 1,450 $ 3,051
Finance expense paid for the year ended December 31, 2012 was $1.6 million (December 31, 2011 - $3.2 million).

Claude Resources Inc. Notes to the Consolidated Financial Statements For the Years ended December 31, 2012 and 2011 Expressed in Thousands of Canadian Dollars, except share data or as otherwise noted
Page 81
14. Finance and Other Income:
DEC 31 DEC 31 2012 2011 Net royalty income $ (1,248) $ (1,109) Other income (138) (200) Interest income (109) (314) $ (1,495) $ (1,623)
Finance and other income received during the year ended December 31, 2012 was $0.2 million (December 31, 2011 - $0.5 million). 15. Personnel Expenses:
DEC 31 DEC 31 2012 2011 Wages and salaries $ 38,951 $ 32,201 Canadian Pension Plan (CPP) and EI remittances 1,473 1,249 $ 40,424 $ 33,450
16. Related Party Transactions: Key Management Personnel Compensation of key management personnel of the Company:
DEC 31 DEC 31 2012 2011 Cash compensation – Salaries, short-term incentives and other Benefits
$ 1,810 $ 1,819
Long term incentives, including share-based payments 1,324 517 Total compensation paid to key management personnel $ 3,134 $ 2,336
The Company’s Executive Leadership Team (consisting of the Chief Executive Officer, Chief Operating Officer, Chief Financial Officer and Vice President Operations) are considered to be Key Management Personnel. In addition, members of the Company’s Board of Directors are included in this definition, as defined by IAS 24, Related Party Disclosures. 17. Income Taxes: (a) Income tax expense
DEC 31 DEC 31 Income tax expense 2012 2011 Deferred income tax expense:
Origination and reversal of temporary differences $ 2,725 $ 4,378 Write-down of mineral properties - (230) Change in unrecognized deferred tax assets 247 (3,784)
Deferred income tax expense $ 2,972 $ 364 (b) Income tax recognized directly in Other comprehensive income (loss) Other comprehensive income included on the consolidated statements of comprehensive income is presented net of

Claude Resources Inc. Notes to the Consolidated Financial Statements For the Years ended December 31, 2012 and 2011 Expressed in Thousands of Canadian Dollars, except share data or as otherwise noted
Page 82
income taxes. The following income tax amounts are included in each component of other comprehensive income (loss): For the year ended December 31, 2011:
Income tax Before tax expense Net of tax Other comprehensive income (loss)
Gain on available for sale securities transferred to profit (35) 5 (30) Unrealized loss on available for sale securities (2,409) 325 (2,084)
(2,444) 330 (2,114) For the year ended December 31, 2012:
Income tax
Before tax (recovery)
expense Net of tax Other comprehensive income (loss)
Loss on available for sale securities transferred to profit 199 (27) 172 Unrealized gain on available for sale securities (909) 123 (786) (710) 96 (614)
(c) Effective tax rate reconciliation The provision for income tax, both current and deferred, differs from the amount calculated by applying the combined expected federal and provincial income tax rate to profit before income tax. The reasons for these differences are as follows:
DEC 31 DEC 31 2012 2011
Profit before income taxes $ 8,541 $ 9,818 Federal and Provincial statutory income tax rate 27.0% 28.5% Expected tax expense 2,306 2,798 Permanent differences 358 571 Effect of change in effective tax rates - (168) Other (27) - Decrease in tax assets related to royalty payable 88 947 Decrease (increase) in recognized deferred tax assets 247 (3,784) Income tax expense $ 2,972 $ 364
The expected statutory tax rate has changed due to the federal income tax rate decreasing from 16.5 percent to 15.0 percent from 2011 to 2012.

Claude Resources Inc. Notes to the Consolidated Financial Statements For the Years ended December 31, 2012 and 2011 Expressed in Thousands of Canadian Dollars, except share data or as otherwise noted
Page 83
(d) Significant components of recognized and unrecognized Deferred tax assets and liabilities The significant components of deferred income tax assets/liabilities are as follows:
Recognized in Recognized Recognized other JAN 1 in directly comprehensive DEC 31 2011 Net profit to equity Income 2011
Deferred income tax assets (liabilities) Share issue costs 564 (461) 929 - 1,032 Decommissioning and reclamation 1,299 1,324 - - 2,623 Net royalty obligation 3,918 (1,024) - - 2,894 Investments (323) 10 - 330 17 Mineral properties (1,615) (3,960) - - (5,575) Other 44 (37) - - 7 Total Deferred income tax assets (liabilities) 3,887 (4,148) 929 330 998 Recognized (unrecognized) deferred tax assets
(3,887) 3,784 103 - -
- (364) 1,032 330 998
Recognized in Acquisition of Recognized Recognized other JAN 1 St. Eugene in directly comprehensive DEC 31 2012 Mining Net profit to equity Income 2012
Deferred income tax assets (liabilities) Share issue costs 1,032 - (344) - - 688 Decommissioning and reclamation 2,623 - (148) - - 2,475 Net royalty obligation 2,894 - (389) - - 2,505 Investments 17 - 134 - 96 247 Mineral properties (5,575) - (2,240) - - (7,815) Loss carry forwards - 939 63 - - 1,002 Other 7 199 (158) - 48 Total Deferred income tax assets (liabilities) 998 939 (2,725) (158) 96 (850) Recognized (unrecognized) deferred tax assets
- - (247) - - (247)
998 939 (2,972) (158) 96 (1,097) (e) Unrecognized Income Tax Credits The Company has $4.0 million (2011 - $2.2 million) of unused income tax credits that can be applied against future taxes payable. No deferred tax asset or income tax credit receivable has been recognized as it is not probable that future taxable profits will be available to utilize the credits. The income tax credit will expire, if unused, as follows:
2012
2026 $ 61 2027 539 2028 314 2029 230 2030 273 2031 700 2032 1,843
$ 3,960

Claude Resources Inc. Notes to the Consolidated Financial Statements For the Years ended December 31, 2012 and 2011 Expressed in Thousands of Canadian Dollars, except share data or as otherwise noted
Page 84
18. Earnings Per Share: Basic earnings per share:
DEC 31 DEC 31 2012 2011 Basic earnings per share: Net profit attributable to common Shareholders $ 5,569 $ 9,454 Weighted average number of common Shares outstanding 172,933 156,062 Basic net earnings per share $ 0.03 $ 0.06
Diluted earnings per share:
DEC 31 DEC 31 2012 2011 Diluted earnings per share: Net earnings attributable to common Shareholders $ 5,569 $ 9,454 Weighted average number of common Shares outstanding 172,933 156,062 Dilutive effect of stock options 299 1,385 Dilutive effect of warrants - 963 Weighted average number of common Shares outstanding, assuming dilution 173,232 158,410 Diluted net earnings per share $ 0.03 $ 0.06
Excluded from the computation of diluted earnings per share at December 31, 2012 were:
i. options outstanding on 5,653,682 common shares with an average exercise price greater than the average market price of the Company’s common shares; and
ii. 1,693,200 warrants with an exercise price greater than the average market price of the Company’s common shares.
Excluded from the computation of diluted earnings per share at December 31, 2011 were options outstanding on 648,561 common shares with an average exercise price greater than the average market price of the Company’s common shares. 19. Financial Instruments: The Company is exposed in varying degrees to a variety of financial instrument related risks by virtue of its activities. The overall financial risk management program focuses on preservation of capital and protecting current and future Company assets and cash flows by reducing exposure to risks posed by the uncertainties and volatilities of financial markets. The Company’s Board of Directors has responsibility to ensure that an adequate financial risk management policy is established and to approve the policy. The Company’s Audit Committee oversees Management’s compliance with the Company’s financial risk management policy, approves financial risk management programs, and receives and reviews reports on management compliance with the policy. The types of risk exposures and the way in which such exposures are managed are as follows: Credit Risk – The Company’s credit risk is primarily attributable to its liquid financial assets including cash and cash equivalents, receivables, and commodity and currency instruments. The Company limits exposure to credit risk on liquid financial assets through maintaining its cash and cash equivalents and reclamation deposits with high-credit quality financial institutions. Sales of precious metals are to entities considered to be credit worthy, as evaluated through the Company’s risk management program, which includes an evaluation of new and existing customers and quarterly monitoring.

Claude Resources Inc. Notes to the Consolidated Financial Statements For the Years ended December 31, 2012 and 2011 Expressed in Thousands of Canadian Dollars, except share data or as otherwise noted
Page 85
Liquidity Risk – The Company ensures that there is sufficient capital in order to meet short term business requirements, after taking into account cash flows from operations and the Company’s holdings of cash and cash equivalents. The Company believes operating cash flows will be sufficient to fund the continued exploration at Madsen and Amisk and ongoing capital improvements at the Seabee properties for the next twelve months. The Company’s cash is invested in business accounts with quality financial institutions and is available on demand.
Payments/Commitments due by period
Total
Less than 1 year
2-3 Years
4-5 Years
More than 5 years
Contractual Obligation Demand loans 5,337 2,387 2,950 - - Interest on demand loans 276 191 85 - - Debenture 9,751 9,751 - - - Debenture interest 458 458 - - - Capital lease obligations 1,786 1,495 291 - - Interest on capital leases 58 56 2 - - Office lease 197 123 74 - - 17,863 14,461 3,402 - - During 2012 (and subsequent to December 31, 2012), the Company has been updating its decommissioning and reclamation plans for the Madsen and Seabee properties. It is expected that additional security (approximately $6.5 million) will need to be provided to the applicable regulatory authorities. However, the timing of this security has not yet been determined. As noted above, near-term funding requirements pursuant to the redemption of its outstanding debentures (due on May 23, 2013), have placed the Company in a working capital deficiency. In order to address this working capital deficiency, the Company, subsequent to December 31, 2012, increased its current debt facilities with CWB to the following (Note 22):
• $10.0 million operating line of credit (previous amount: $5.0 million); • $10.0 million finance lease line (previous amount: $7.0 million); and • $5.0 million revolving loan (new).
In addition to the above, the Company has executed a non-binding term sheet with CCP for an additional long-term debt facility of $25.0 million (Note 22). As of the date of these Financial Statements, the Company is in negotiations to close the CCP debt facility. Management believes that repayment of the outstanding debentures will occur as required on May 23, 2013. If for any reason the Company is unable to close the CCP debt facility, it could have an impact on the Company`s ability to continue as a going concern and realize assets at their recognized values and to extinguish liabilities in the normal course of business at the amounts stated in the consolidated financial statements. Market Risk – Market risk is the potential for loss from adverse changes in the market value of financial instruments. The level of market risk that the Company is exposed to varies depending on the composition of its derivative instrument portfolio, as well as current and expected market conditions. The significant market risk exposures to which the Company is exposed are Foreign exchange risk, Commodity price and Interest rate risk. These are discussed further below: Foreign exchange risk – The results of the Company’s operations are subject to currency risks. The Company’s revenues from the production and sale of gold are denominated in U.S. dollars. However, the Company’s operating expenses are primarily incurred in Canadian dollars and its liabilities are primarily denominated in Canadian dollars. The Company is not exposed to material foreign exchange risk on its financial instruments. Interest rate risk – In respect to the Company’s financial assets, the interest rate risk mainly arises from the interest rate impact on our cash and cash equivalents, reclamation deposits and debt. In respect to financial liabilities, one of the Company’s demand loans carries a floating interest rate with the balance of Company debt at fixed interest rates. When possible, the Company will fix its interest costs to avoid variations in cash flows. Due to the greater proportion of fixed

Claude Resources Inc. Notes to the Consolidated Financial Statements For the Years ended December 31, 2012 and 2011 Expressed in Thousands of Canadian Dollars, except share data or as otherwise noted
Page 86
rate debt, a one percent change in interest rates would not materially impact earnings or cash flows. Commodity price risk – The value of the Company’s mineral resources is related to the price of gold and the outlook for this mineral. Gold and precious metal prices historically have fluctuated widely and are affected by numerous factors outside of the Company’s control, including, but not limited to, industrial and retail demand, central bank lending, forward sales by producers and speculators, levels of worldwide production, short-term changes in supply and demand because of speculative hedging activities and certain other factors related specifically to gold. The profitability of the Company’s operations is highly correlated to the market price of gold. If the gold price declines below the cost of production at the Company’s operations, for a prolonged period of time, it may not be economically feasible to continue production. The Company is not exposed to material commodity price risk on its financial instruments. For a $10 US$ movement in gold price per ounce, earnings and cash flow will have a corresponding movement of CDN $0.5 million, or $0.00 per share. Fair Value - The Company has various financial instruments comprised of cash and cash equivalents, receivables, short and long-term investments, restricted promissory notes, reclamation deposits, demand loans, accounts payable and accrued liabilities, long-term debt, and royalty obligations. For disclosure purposes, all financial instruments measured at fair value are categorized into one of three hierarchy levels, described below. Each level is based on the transparency of the inputs used to measure the fair values of assets and liabilities:
Level 1 – Values based on unadjusted quoted prices in active markets that are accessible at the measurement date for identical assets or liabilities.
Level 2 – Values based on quoted prices in markets that are not active or model inputs that are observable either directly or indirectly for substantially the full term of the asset or liability.
Level 3 – Values based on prices or valuation techniques that require inputs that are both unobservable and significant to the overall fair value measurement.
The fair values of financial assets and liabilities, together with the carrying amounts shown in the Statement of Financial Position, are as follows: DEC 31 DEC 31 2012 2011 Carrying
Value Estimated Fair Value
Carrying Value
Estimated Fair Value
Loans and receivables Cash and cash equivalents - - $2,529 $2,529 Short-term investments (1) - - 33,168 33,168 Accounts receivable (3) $4,845 $4,845 2,714 2,714 Available-for-sale financial assets Investments (1) 378 378 2,854 2,854 Held-to-maturity Deposits for reclamation costs 2,237 2,237 2,237 2,237 Other financial liabilities Bank indebtedness 3,531 3,531 - - Demand loans 5,337 5,337 896 896 Accounts payable 7,533 7,533 5,737 5,737 Net royalty obligations 4,041 4,041 5,289 5,289 Debenture (1) 9,665 9,751 9,452 9,751
(1) Based on quoted market prices – Level 1 (2) Based on models with observable inputs – Level 2 (3) At December 31, 2012, there were no receivables that were past due or considered impaired.

Claude Resources Inc. Notes to the Consolidated Financial Statements For the Years ended December 31, 2012 and 2011 Expressed in Thousands of Canadian Dollars, except share data or as otherwise noted
Page 87
20. Capital Management: The Company’s objective when managing its capital is to safeguard its ability to continue as a going concern so that it can provide adequate returns to shareholders and benefits to other stakeholders. The Company defines capital that it manages as the aggregate of its equity attributable to owners of the Company, which is comprised of issued capital, contributed surplus, accumulated deficit and accumulated other comprehensive income (loss). The Company manages the capital structure and makes adjustments to it in light of changes in economic conditions and the risk characteristics of the underlying assets and the Company’s working capital requirements. In order to maintain or adjust the capital structure, the Company (upon approval from its Board of Directors, as required) may issue new shares through private placements, sell assets or incur debt. The Board of Directors reviews and approves any material transaction out of the ordinary course of business, including proposals on acquisitions, major investments, as well as annual capital and operating budgets. The Company believes that this approach, given the relative size of the Company, is reasonable. There were no changes in the Company’s approach to capital management during the year ended December 31, 2012. The Company is not subject to externally imposed capital requirements. The Company utilizes a combination of short-term and long-term debt and equity to finance its operations and exploration. DEC 31 DEC 31 Interest Maturity 2012 2011 Demand loan Repaid during 2012 $ - $ 896 Demand loans Prime + 1.50% Jan –
Apr/2015 5,337 -
Debenture 12.00% May/2013 9,665 9,452 Total debt $ 15,002 $ 10,348 Shareholders’ equity 192,364 172,895 Debt to equity 7.80% 5.99 % The Company is bound by and has met all covenants, if any, on these credit facilities. Subsequent to December 31, 2012, the Company expanded its current debt facilities with its existing bank to $25.0 million and has executed a non-binding term sheet with Crown Capital Partners Inc. (“CCP”) for an additional long-term debt facility of $25.0 million (Note 22). The new debt facilities will facilitate the retirement of the Company’s outstanding debentures (which mature in May 2013) and allow for the necessary expansion capital at the Seabee Gold Operation to support the updated Life of Mine Plan. 21. Acquisition: On February 1, 2012, the Company closed the transaction whereby Claude acquired all of the outstanding shares of St. Eugene Mining Corporation Limited (TSXV: SEM) ("St. Eugene") that it did not already own. The transaction was accomplished pursuant to the terms of a court approved plan of arrangement completed under the Business Corporations Act (British Columbia) (the “Arrangement”). Under the Arrangement, Claude acquired all of the outstanding common shares of St. Eugene in exchange for the issuance of 8,701,255 common shares of Claude. As part of the Arrangement, Claude also exchanged all outstanding warrants of St. Eugene for warrants of Claude and reduced its existing net smelter return royalty on the Tartan Lake Project from a sliding scale to two percent. On closing, Claude owns 100 percent of the Amisk Gold Project. The transaction has been accounted for as an asset acquisition as St. Eugene did not meet the definition of a business, as defined in IFRS 3, Business Combinations. The purchase price of the transaction, which was $14.9 million, has been recorded as an increase to mineral properties and share capital. The preliminary purchase price allocation was calculated as follows:

Claude Resources Inc. Notes to the Consolidated Financial Statements For the Years ended December 31, 2012 and 2011 Expressed in Thousands of Canadian Dollars, except share data or as otherwise noted
Page 88
Cash and cash equivalents $ 486 Mineral property interest 15,198 Accounts payable and accrued liabilities (828) $ 14,856
22. Subsequent Events: (a) Term Loan Subsequent to December 31, 2012, the Company has executed a non-binding term sheet for a five-year $25.0 million term loan (the “Loan”) with CCP. Interest on the Loan is fixed at 10 percent, compounds monthly and is payable monthly. Principal payments will begin 12 months from closing and will be payable monthly. A portion of the Loan will be utilized to retire the Company’s outstanding debentures due to mature in May 2013 with the remainder being available for working capital purposes. The maturity date of the Loan will be 60 months from closing. The Loan will be subordinate to all of the Company’s other short-term and long-term loans and borrowings. The table below represents currently scheduled repayment and maturity of the Loan over the next five years. Period Monthly Amount Annual Amount Months 1 – 12 NIL NIL Months 13 – 59 $300,000 $3,600,000 Due at Maturity $10,900,000 After 12 months following the closing of this arrangement, the Company has the right to prepay the term loan subject to a prepayment fee (calculated on the amount being prepaid) of:
Months Following Closing Prepayment Fee Months 13 – 24 2% Months 25 – 36 1% Months 37 – 60 0%
In conjunction with the closing of this arrangement, the Company will grant 5,750,000 common share purchase warrants priced at $0.70 per common share purchase warrant. These common share purchase warrants can be exercisable by the holder, in whole or in part, at any time from closing until five years following closing. (b) Revolving Credit Facility Subsequent to December 31, 2012, the Company completed an arrangement for a new $5.0 million revolving credit facility due on December 31, 2013. Upon mutual agreement, the facility can be extended for an additional year. This revolving credit facility bears interest at prime plus 1.75 percent; the prime rate at March 27, 2013 was 3 percent. These funds are available for general corporate purposes. (c) Line of Credit Subsequent to December 31, 2012, the Company completed an arrangement for a new $10.0 million line of credit, replacing its old $5.0 million line of credit. The line of credit bears interest at prime plus 1.125 percent; the prime rate at March 27, 2013 was 3 percent. These funds are available for general corporate purposes. (d) Finance Lease Line Subsequent to December 31, 2012, the Company completed an arrangement for a new $10.0 million facility, replacing its old $7.0 million facility. The line of credit bears interest at prime plus 1.50 percent; the prime rate at March 27, 2013 was 3 percent. These funds are available for general corporate purposes.