Classifying Interdependencies in the Food and Agriculture ...
109
University of Arkansas, Fayetteville University of Arkansas, Fayetteville ScholarWorks@UARK ScholarWorks@UARK Graduate Theses and Dissertations 12-2018 Classifying Interdependencies in the Food and Agriculture Critical Classifying Interdependencies in the Food and Agriculture Critical Infrastructure Sector Infrastructure Sector John Doerpinghaus University of Arkansas, Fayetteville Follow this and additional works at: https://scholarworks.uark.edu/etd Part of the Agribusiness Commons, Agricultural Education Commons, Operational Research Commons, and the Operations and Supply Chain Management Commons Citation Citation Doerpinghaus, J. (2018). Classifying Interdependencies in the Food and Agriculture Critical Infrastructure Sector. Graduate Theses and Dissertations Retrieved from https://scholarworks.uark.edu/etd/3112 This Thesis is brought to you for free and open access by ScholarWorks@UARK. It has been accepted for inclusion in Graduate Theses and Dissertations by an authorized administrator of ScholarWorks@UARK. For more information, please contact [email protected].
Transcript of Classifying Interdependencies in the Food and Agriculture ...

University of Arkansas, Fayetteville University of Arkansas, Fayetteville
ScholarWorks@UARK ScholarWorks@UARK
Graduate Theses and Dissertations
12-2018
Classifying Interdependencies in the Food and Agriculture Critical Classifying Interdependencies in the Food and Agriculture Critical
Infrastructure Sector Infrastructure Sector
John Doerpinghaus University of Arkansas, Fayetteville
Follow this and additional works at: https://scholarworks.uark.edu/etd
Part of the Agribusiness Commons, Agricultural Education Commons, Operational Research
Commons, and the Operations and Supply Chain Management Commons
Citation Citation Doerpinghaus, J. (2018). Classifying Interdependencies in the Food and Agriculture Critical Infrastructure Sector. Graduate Theses and Dissertations Retrieved from https://scholarworks.uark.edu/etd/3112
This Thesis is brought to you for free and open access by ScholarWorks@UARK. It has been accepted for inclusion in Graduate Theses and Dissertations by an authorized administrator of ScholarWorks@UARK. For more information, please contact [email protected].

Classifying Interdependencies in the Food and Agriculture Critical Infrastructure Sector
A thesis submitted in partial fulfillmentof the requirements for the degree of
Master of Science in Industrial Engineering
by
John DoerpinghausUniversity of Arkansas
Bachelor of Science in Business Administration, 2011
December 2018University of Arkansas
This thesis is approved for recommendation to the Graduate Council.
Sarah Nurre Pinkley, PhDThesis Director
Kelly M. Sullivan, PhDCommittee Member
Benjamin R. K. Runkle, PhDCommittee Member

Abstract
This work classifies examples of infrastructure interdependencies found in the food and
agriculture critical infrastructure sector. Interdependencies are identified through an exam-
ination of rice and poultry agriculture throughout the state of Arkansas. The subtleties
of interdependence examples in the food and agriculture sector are inadequately captured
by the well-studied interdependence classification taxonomies. Through 39 interviews, we
develop an understanding of the subtle temporal, geographic, and productivity scales of
interdependence in over 100 examples and present five new, distinct classifications of in-
terdependence: (1) dynamic physical, (2) dynamic geographic, (3) deadline, (4) delay, and
(5) human, economic, and natural resource interdependencies. An analysis of these inter-
dependencies and their intricacies provides the opportunity to generalize these ideas across
other critical infrastructure sectors and model infrastructure restoration and resilience with
greater concern for seasonality, resource scarcity, and punctuality.

Acknowledgements
For their insight and involvement under University of Arkansas IRB 1708017910, we
genuinely thank each of the participants in this study. Furthermore, we would like to thank
Zachary Johnson during the portion of this research funded by the University of Arkansas
College of Engineering seed grant. A portion of this research was research was funded under
MarTREC project number 6005.

Preface
This thesis represents the the culmination of my original work in the context of funded
research projects coordinated by Sarah Nurre Pinkley, Kelly M. Sullivan, and Benjamin R.
K. Runkle (“Research team”). This section serves to delineate original contributions from
the contributions of the research team. Throughout these projects, I was responsible for
scheduling interviews, performing each interview with at least one member of the research
team, summarizing interview discussions, identifying examples of interdependence, classify-
ing observed examples, and the original writing of this document in conjunction with the
creation of visualizations contained within.

Contents
1 Introduction 1
2 Review of Critical Infrastructure Systems and Interdependence Literature 7
3 Methods for Classifying Interdependencies 11
4 Classification of Interdependencies in the Food and Agriculture Infras-
tructure Sector 15
5 Interdependence Classifications in the Existing Taxonomy 18
5.1 Physical Interdependencies . . . . . . . . . . . . . . . . . . . . . . . . . . . . 18
5.2 Cyber Interdependencies . . . . . . . . . . . . . . . . . . . . . . . . . . . . . 19
5.3 Geographic Interdependencies . . . . . . . . . . . . . . . . . . . . . . . . . . 21
5.4 Logical Interdependencies . . . . . . . . . . . . . . . . . . . . . . . . . . . . 23
6 Interdependence Classifications in the Expanded Taxonomy 26
6.1 Dynamic Physical Interdependencies . . . . . . . . . . . . . . . . . . . . . . 26
6.2 Dynamic Geographic Interdependencies . . . . . . . . . . . . . . . . . . . . . 28
6.3 Deadline Interdependencies . . . . . . . . . . . . . . . . . . . . . . . . . . . . 31
6.4 Delay Interdependencies . . . . . . . . . . . . . . . . . . . . . . . . . . . . . 34
6.5 Human, Economic, and Natural Resource Interdependencies . . . . . . . . . 37
7 Analysis of Interdependencies Observed in the Food and Agriculture
Critical Infrastructure Sector 40
7.1 Food and Agriculture Sector Fragmentation . . . . . . . . . . . . . . . . . . 41
7.2 Generalizing Dynamic Interdependencies Beyond Food and Agriculture . . . 44
7.3 Temporal Analysis . . . . . . . . . . . . . . . . . . . . . . . . . . . . . . . . 45
7.4 Geographic Analysis . . . . . . . . . . . . . . . . . . . . . . . . . . . . . . . 46
7.5 Nonbinary Response to Disruption . . . . . . . . . . . . . . . . . . . . . . . 48

8 Conclusions and Further Work 50
Bibliography . . . . . . . . . . . . . . . . . . . . . . . . . . . . . . . . . . . . . . 51
A Well-Studied Interdependencies 56
B Observed Physical Interdependencies 63
C Observed Cyber Interdependencies 68
D Observed Geographic Interdependencies 71
E Observed Logical Interdependencies 74
F Observed Dynamic Physical Interdependencies 76
G Observed Dynamic Geographic Interdependencies 82
H Observed Deadline Interdependencies 88
I Observed Delay Interdependencies 92
J Observed Human, Economic, and Natural Resource Interdependencies 95
K Institutional Review Board Protocol 97

Chapter 1
Introduction
Simulation and modeling of critical infrastructure systems (CIS) build upon an under-
standing of infrastructure interdependence. The study of critical infrastructure systems
systematically characterizes an infrastructure’s operational requirements, capabilities, and
environmental factors as interdependencies. From this characterization, critical infrastruc-
ture systems are modeled and disruption scenarios are simulated to further study infrastruc-
ture restoration, resilience, and reliability. The transportation, energy, telecommunications,
and water and wastewater (water) lifeline infrastructure systems described in Lee et al. [1]
are studied throughout CIS literature (see Amin [2], Bao-Hua et al. [3], Reed et al. [4], Islam
and Moselhi [5], Portante et al. [6]). However, this work aims to develop understanding
of the food and agriculture sector via study of rice and poultry production in the state of
Arkansas. This study is a means to classify operational interdependencies in the food and
agriculture sector and introduce five new, distinct classifications of interdependence.
Societal reliance on critical infrastructure systems may be most evident in the after-
math of an extreme event (e.g., terrorist attack, weather phenomena). The extreme event
responsible for exposing critical infrastructure system vulnerabilities and establishing CIS
protection programs was the 1995 terrorist bombing of the Alfred P. Murrah Federal Building
in Oklahoma City, Oklahoma. In the months following the bombing, President Bill Clinton
established the President’s Commission on Critical Infrastructure Protection (the Commis-
sion) to identify infrastructure systems vital to national security, determine infrastructure
vulnerabilities, and propose infrastructure protection strategies. The Commission’s Report
was published in 1997, formally defining critical infrastructure as a “network of independent,
mostly privately-owned, man-made systems and processes that function collaboratively and
synergistically to produce and distribute a continuous flow of essential goods and services
. . . so vital that their incapacity or destruction would have a debilitating impact on our
1

defense and national security” [7].
Similar to the Commission’s Report, opportunities to study CIS and infrastructure in-
terdependencies materialize in the aftermath of extreme events. Observable infrastructure
interdependencies and CIS disruption propagation patterns have been studied following ex-
treme event occurrences. Earthquake engineers mapped and analyzed damage propagation
patterns throughout lifeline infrastructures following the 1995 Kobe earthquake [8]. In turn,
the Kobe earthquake study facilitated the formalization of infrastructure failure interdepen-
dencies (IFIs) in the work [9]. Additionally, the study of New Jersey, New York City, and
Long Island’s recovery after Hurricane Sandy made landfall in 2012 prompted the formal-
ization of infrastructure restoration interdependencies [10]. Moreover, mathematical infras-
tructure restoration models were developed in an extreme event response framework [1, 11].
Alternatively, some CIS studies examine infrastructure interdependencies in the absence of
disruptions and extreme events (see Haimes [12], Laugé et al. [13]). The focus of this study
is an examination of Arkansas’s food and agriculture sector at large.
Contextualizing Arkansas’s rice and poultry productions as a critical infrastructure sys-
tem and classifying operational interdependencies is the basis for modeling and simulation
in the food and agriculture sector. The food and agriculture sector was not recognized to be
vital for domestic well-being or national security until 2013 when President Barack Obama
directed the United States Department of Homeland Security (DHS) to oversee the protec-
tion and strengthening of 16 infrastructure sectors critical to national security [14]. Food
and agriculture was designated as critical and defined to be “composed of complex produc-
tion, processing, and delivery systems and has the capacity to feed people and animals both
within and beyond the boundaries of the United States” [15].
Indeed, the food and agriculture critical infrastructure is a complex system whose pro-
tection is paramount to national security. The food and agriculture critical infrastructure
sector is a diverse composition of animal production, crop production, food and beverage
manufacturing, food product warehousing, grocery stores, and restaurants. The operational
2

diversity among components of the food and agriculture sector is responsible for producing
nutrients for biological subsistence. Operational diversity underpinned by ubiquitous depen-
dence on the sector promotes multidisciplinary interest in the food and agriculture sector -
e.g, food science, agronomy, animal science, plant science, operations research, biological and
agricultural engineering, agricultural economics, and agricultural science. Interdependencies
existing among the food and agriculture, water, and energy infrastructure sectors have been
examined through studies of the food-energy-water nexus and critical infrastructure systems
[16, 17].
This study of the food and agriculture sector in Arkansas primarily focuses on classifying
operational interdependencies that exist among the 16 DHS critical infrastructure sectors
and Arkansas’s food and agriculture infrastructures. Arkansas is well-suited for this study;
approximately one-third of the state’s land, 13,600,000 acres, is used for agricultural pro-
duction. In 2012, Arkansas produced more rice than other state and produced the third
most cotton, broiler chickens, and turkeys [18]. Moreover, 2012 sales of commodity grain
in Arkansas reached $4.2 billion, while poultry and cotton sales exceeded $4 billion and
$445 million, respectively [18]. Maintaining high crop and animal production levels requires
a robust supply chain of power plants, chemical manufacturing plants, water supplies and
distribution, transportation networks, and agricultural production facilities.
The prevalence of food and agriculture operations throughout the state form a rich envi-
ronment to study operational interdependencies. Furthermore, diversity of the state’s agri-
cultural operations present interdependency characteristics ranging from generic resource
requirements between distinct infrastructure sectors to time-sensitive resource requirements
between components of the same infrastructure. The rice production lifecycle analysis pre-
sented in Pagani et al. [19] investigates energy and input requirements necessary to grow
rice Missouri’s Mississippi river delta region which is visualized in Figure 1.1. Similarly, the
poultry lifecycle analysis in Pelletier [20] examined direct inputs and emissions associated
with producing one live-weight ton of broiler poultry which is visualized in Figure 1.2.
3

Figure 1.1: Flowchart of energy inputs from the rice lifecycle assessment of Pagani et al.[19] which illustrates primary resource requirements of the rice production infrastructure.Primary energy inputs denoted with (*) indicate the authors’ directly determined the mix offossil fuels and renewable resources used in power generation whereas primary energy inputsdenoted with (**) indicate the authors determined the source of power generation based onregional operations.
4

Figure 1.2: The lifecycle analysis visualized in Pelletier [20] represents direct energy inputsnecessary to feed and grow one ton of live-weight broiler chickens as single arrows fromresource to production process, and emissions are represented using three arrows originatingfrom a production process.
5

This study classified approximately 115 observed infrastructure interdependencies; 65
interdependencies were adequately characterized by the existing taxonomy and 50 interde-
pendencies were classified using a new, expanded taxonomy we propose. The expanded
taxonomy consists of five new, distinct interdependence classifications to account for varia-
tions in resource requirements, temporal scales, geographic scales, and productivity scales.
Classified interdependencies span 13 critical infrastructure sectors. The food and agriculture
sector appears most frequently in 107 classified interdependencies. The transportation and
water sectors appear second and third most frequently, in 26 and 18 classified examples,
respectively.
This work’s contributions are as follows. First, we contribute a qualitative examination
of empirical evidence to classify interdependencies observed in Arkansas’s food and agri-
culture infrastructures in accordance with the existing taxonomy. Next, we expand the
existing taxonomy with five new, distinct interdependence classes adequately characteriz-
ing the remaining interdependence examples. Finally, we discuss and analyze the defining
characteristics for each class of the expanded taxonomy.
This work proceeds as follows. Chapter 2 presents a review of literature relevant to critical
infrastructure systems and the food and agriculture sector. Chapter 3 describes the methods
used to examine the food and agriculture sector and classify interdependence examples.
Chapter 4 introduces our classification scheme, Chapter 5 classifies interdependence examples
using the existing taxonomy, and the formalization and classification of examples using the
expanded taxonomy follows in Chapter 6. An analysis of the characteristics of the examples
is presented in Chapter 7, and Chapter 8 explores future directions of this work and its
implications.
6

Chapter 2
Review of Critical Infrastructure Systems and Interdependence Literature
It is necessary to formalize the terminology used throughout this work before surveying
relevant literature. This work generalizes the formal definition of infrastructure given in
Chapter 1. Infrastructure broadly refers to a collection of systems responsible for the pro-
duction of an output or completion of a task. An infrastructure sector (sector) references
the population of infrastructures engaged in the production and distribution of goods and
services to society. This distinction between infrastructure and infrastructure sector allows
us to compare classified interdependencies in Chapters 5 and 6 at the infrastructure and
infrastructure sector levels. An interdependence is the relationship among infrastructures
with correlated operational states.
Works motivating the study of critical infrastructure systems and specifically infras-
tructure interdependencies underscore the complexity of infrastructure interactions and the
integral roles of infrastructures in society. The analysis of Amin [2] on the operational ca-
pabilities of the energy, telecommunications, and transportation infrastructures quantifies
societal dependence on these infrastructure sectors. The work of Little [21] highlights the
interconnected nature of infrastructure systems necessitating infrastructures be studied as
complex adaptive systems (CAS). The infrastructure interdependency assessment process
presented in Brown et al. [22] aims to mitigate risks of disruption arising the complex, inter-
connected nature of infrastructure systems. These works highlight the necessity of identifying
infrastructure interdependencies to protect critical infrastructures.
Multiple operational interdependence taxonomies have been defined and proposed to ad-
dress specific characteristics not adequately captured in the previous formalizations. The
works of Zimmerman [23] and Rinaldi et al. [24] developed general classifications of op-
erational interdependencies. An interdependence classification taxonomy was proposed in
Wallace et al. [25] to formalize shared and exclusive-or interdependencies not adequately
7

characterized by previous classes. Mathematical formalization was developed for defining
operational interdependencies in Dudenhoeffer et al. [26] with consideration of interdepen-
dence induced by policy and regulation. The framework of Zhang and Peeta [27] formalized
budgetary and economic interdependencies applied to economic input/output models. The
concept of operational interdependence is well-studied, and this work refers to the collection
of classes proposed in Zimmerman [23], Rinaldi et al. [24], Wallace et al. [25], Dudenhoeffer
et al. [26], Zhang and Peeta [27] as the “well-studied interdependencies.” Additionally, the
taxonomies presented to characterize infrastructure failure interdependencies and restoration
interdependencies in Chang et al. [9] and Sharkey et al. [10] respectively, are also considered
integral to the well-studied interdependencies. For reference, a tabular presentation of each
taxonomy of the well-studied interdependencies with formal descriptions for each associated
interdependence class may be found in Appendix A. The formalization of interdependen-
cies and infrastructure interactions in these two studies have facilitated the further study
and comprehension of infrastructure interdependence. We consider our formalizations to be
most similar to operational interdependencies with specific application to food and agricul-
ture infrastructures. Our work focuses on developing interdependence classes that capture
prevalent complicating factors or confounding attributes whose true nature is inadequately
captured by existing interdependence classes. We also throughly investigate instances of re-
source consumption varying over time, productivity varying over time, along with the spatial
and temporal characteristics affecting an infrastructure’s operability. The work of Sharkey
et al. [10] formalizes the concept of time-sensitive options, a restoration interdependence
characterizing the difficulty of completing a restoration task increasing at a certain unknown
time during the restoration process because restoration of an independent infrastructure
has not been completed. The Pederson et al. [28], Xiao et al. [29], Ouyang [30] and Saidi
et al. [31] literature reviews further discuss the well-studied interdependencies. The widely-
cited analysis of Ouyang [30] compared the operational interdependence taxonomies of the
well-studied interdependencies to determine which taxonomy most effectively and efficiently
8

classified ten arbitrary examples of interdependence. The widely understood Rinaldi et al.
[24] taxonomy was the only taxonomy that appropriately classified all ten examples of inter-
dependence, and is well suited for classifying general examples of interdependence compared
to other taxonomies. Therefore, this work refers to the interdependence classifications and
classification framework of Rinaldi et al. [24] as the “existing taxonomy” used in Chapter 5.
Operational interdependence refers to relationships among infrastructures such that the
operational state of an infrastructure depends on an independent infrastructure’s produc-
tivity. These interdependencies are subject to cascading failures propagating from a single
disruption throughout a complex network of interdependent infrastructures [9, 24, 32]. In
general, interdependencies are identified through empirical examinations of infrastructures
and examining disruption propagation patterns following extreme events. Interdependen-
cies are identified and discussed in CIS studies aiming to build conceptual understanding of
interdependencies and parameterize infrastructure models and simulations.
Each of the works composing the well-studied interdependencies created further con-
ceptual understanding of operational interdependencies. The operational interdependencies
identified in New York City presented in Wallace et al. [25] identified mechanisms inducing
operational interdependence not yet formalized. The study of infrastructure interdependence
has evolved beyond operational interdependencies. The concept of IFIs presented in Chang
et al. [9] was formulated through the study of infrastructure disruption patterns observed
after the 1995 Kobe earthquake. Pragmatic examples of IFIs were studied in the aftermath
of power blackouts, hurricanes, and ice storms were documented in McDaniels et al. [32],
Chang et al. [33], McDaniels et al. [34], and McDaniels et al. [35] and then aggregated into
an IFI database presented in Chang et al. [36] to inform risk mitigation strategies. Simi-
larly, Sharkey et al. [10] presented the concept of infrastructure restoration interdependencies
formulated from observation of restoration activities in the wake of Hurricane Sandy.
Applications of empirical interdependence classification are the development of quan-
titative measures of interdependence, empirical risk analyses, and parameterization of in-
9

frastructure interdependence and restoration models. The works of Zimmerman [23, 37],
and Zimmerman et al. [38] analyze cross-sector interdependencies, the effects of cascad-
ing failures on infrastructure sectors, and infrastructure sector resilience, respectively using
quantitative interdependence and resilience metrics. Further quantification of infrastructure
resilience metrics (e.g., robustness, rapidity, performance loss) are presented in Nan and
Sansavini [39]. The work of Chang and Shinozuka [40] quantifies water distribution infras-
tructure resilience to disruptions caused by earthquakes. Quantitative metrics of operational
interdependencies in Kajitani and Sagai [41] are derived from structural engineering data,
system operations plans, and economic data. Statistical significance tests are performed in
Mendonça and Wallace [42] and Dueñas-Osorio and Kwasinski [43] to determine significant
cross-sector interactions following the 2001 World Trade Center terrorist attacks and 2010
Chilean earthquake. Operational interdependencies were quantified to perform a CIS risk
assessment in Kjølle et al. [44] by computing failure probabilities used to predict disruption
frequency and severity in a Norwegian energy infrastructure. Operational interdependencies
presented in Espada et al. [45] are inform network flow parameters in a GIS network model
established to assess flood vulnerabilities.
Infrastructure interdependencies are identified to develop infrastructure modeling and
simulation techniques throughout critical infrastructure sectors. The modeling literature
extensively focuses on the lifeline infrastructure sectors. The work of Zimmerman et al. [17]
explores interdependencies among the food and agriculture, water, and energy infrastruc-
ture sectors with special attention paid to organic farming. Similarly, Scott et al. [46] and
D’Odorico et al. [16] expound on the interdisciplinary food-water-energy nexus field of study.
This work aims to comprehensively characterize the interdependencies found in the food and
agriculture infrastructure sector and present interdependence classes applicable to sectors
beyond food and agriculture.
10

Chapter 3
Methods for Classifying Interdependencies
The aim of this study is to document observed examples of interdependencies found
in Arkansas’s food and agriculture critical infrastructure sector. The documented inter-
dependency examples are presented in a classification framework expanding the prevalent
classifications of Rinaldi et al. [24]. The newly defined, distinct classifications are used to
capture frequently appearing subtleties among the observed examples. Interdependencies in
the food and agriculture sector are subject to complicating factors discussed in Rinaldi [47]
like varying time scales, geographic scales, and productivity. Clear exposition and general
application of these complications further motivates our study of the food and agriculture
sector interdependencies.
Studying Arkansas’s food and agriculture sector is facilitated by the sector’s produc-
tivity and geographic footprint. In 2014, the food and agriculture sector’s total economic
contribution to state GDP exceeded 20 billion USD, more than 17% of Arkansas GDP, from
producers spanning the poultry operations in northwestern Arkansas to row crop farming
on the state’s eastern side [48]. The food and agriculture sector’s combined economic and
geographic presence encourages public and commercial enterprises to thoroughly understand
the sector’s operations. This work relies on the knowledge and experience of food and agri-
cultural operators and stakeholders in interdependent infrastructure sectors.
Examples of infrastructure interdependencies were collected, most significantly, through a
series of interviews with stakeholders in the food and agriculture sector throughout Arkansas.
Interviews were conducted with 39 individuals representing food and agriculture operations,
public utilities, emergency services, financial institutions, and higher education. Of the 39
individuals, 12 are academic experts in food science, poultry science, agriculture, engineer-
ing, or agricultural economics. The remaining 27 interviewees operated or managed food and
agriculture production, food milling and processing plants, public enterprises, financial insti-
11

tutions, government organizations, and agriculturally focused policy initiatives. We recognize
there is a discrepancy in responses from poultry professionals in comparison to experts in rice
production interviewed throughout the study. The amount of time we spent interviewing re-
spondents that are knowledgeable about rice production is substantially longer than those in
the poultry field, which introduces bias into our study. Throughout the planning and inter-
viewing stages, we attempted to interview professionals in both fields earnestly. Recognizing
bias resulting from studying interdependencies existing in the rice production infrastructures
more deeply than poultry allowed us to understand that bias may also arise from our study
of infrastructure interdependencies considering food and agriculture stakeholders to be the
dependent infrastructure in many scenarios. Our respondents were exceptionally knowledge-
able in their chosen fields, but a thorough understanding of how other critical infrastructure
systems respond if food and agriculture is interrupted was elusive.
Generally, each interview was attended by at least two members of the research team
and lasted appropriately one hour. The research team’s preference was to conduct physical
interviews when possible, if not, teleconferencing was used. The research team traveled
to conduct interviews in Jonesboro at the Arkansas Soil & Water Education Conference
& Expo on January 31, 2018, and then further traveled to Little Rock and the Arkansas
delta region to interview commercial grain mill operators, commercial rice farmers, public
servants, and policy advocates. Interviews were also conducted in northwest Arkansas with
academics and utility providers. Each interview followed similar formats and guidelines to
effectively identify infrastructure sector interdependencies and discuss specific examples of
infrastructure interdependencies.
Three broad topics were addressed by each interviewee: the nature of their relationship
with the food and agriculture sector, perceptions of how the food and agriculture sector
depends on other DHS critical infrastructure sectors, and the risks or vulnerabilities affect-
ing food and agriculture. All interviews began with an interviewee’s personal introduction
and explanation of their professional responsibilities and expertise. The research team then
12

introduced this research and the study of critical infrastructure systems in the context of
our interviewee’s profession. Discussions identifying infrastructure sector dependencies were
aided with a reference document enumerating and briefly discussing each of the critical infras-
tructure sectors. Sectors thought to be interdependent were further discussed to understand
specific examples of interdependency that the interviewees had observed. The research team
continued the discussion through questions designed to expose the nature of how specific
infrastructure components interact along in as much detail as possible. Clarifications of
specific examples developed an understanding of how these interactions and dependencies
changed over time, varied with operational tasks within the food and agriculture sector, and
exposed ancillary factors affecting the interdependence.
Furthermore, examples of interdependencies have been identified in news publications
and Arkansas agricultural publications. Interview participants widely acknowledged food
and agriculture production to be vulnerable to weather events. Specifically, the effects of
Hurricane Harvey making landfall in late August of 2017, during the peak of the rice harvest,
were well documented by news outlets and agricultural publications in Arkansas, Louisiana,
and Texas. Our study includes a further investigation of Hurricane Harvey’s effects on the
food and agriculture sector in the tri-state region. Specific, fully characterized examples
of interdependencies existing in the food and agriculture sector from the interviews and
periodicals were then aggregated for further analysis and classification.
Initially, interdependencies were classified to be physical, cyber, geographic, or logical in
accordance with the existing taxonomy. Analysis of the interdependency classification pre-
sented several distinct factors complicating multiple examples, each affecting the examples
in a distinct, generic fashion. The complicating factors frequently observed in this study
of the food and agriculture sector were identified in order to formally define new, distinct
interdependence classifications. Formalizing these frequently occurring factors necessitates
the proposal of five new classes of infrastructure interdependence which adequately capture
subtle characteristics the existing taxonomy is unable to do. Subsequently, the examples
13

were reclassified using a combination of the existing taxonomy and the newly-defined classi-
fications referred to as the expanded taxonomy. To validate the classifications, the research
team unanimously agrees the exposition of the example accurately characterizes the true
nature of the interdependence and then the example is also appropriately classified. We
then further standardized our observations using an industry classification taxonomy, North
American Industry Classification System (NAICS) developed by United States Department
of the Census. Through this standardization and aggregation, we are able to interpret our
findings and provide accurate, concrete accounts of the interactions we observed across spe-
cific infrastructure components.
14

Chapter 4
Classification of Interdependencies in the Food and Agriculture Infrastructure
Sector
The focus of this study is to classify infrastructure interdependencies observed through-
out the food and agriculture sector. Interdependence classes of the existing taxonomy and
expanded taxonomy are defined and explicated in Chapter 5 and Chapter 6, respectively.
The expanded taxonomy interdependence classes are dynamic physical, dynamic geographic,
deadline, delay, and human, economic, and natural resource. Expanded taxonomy interde-
pendence classes are motivated by characteristics of infrastructure interdependencies ob-
served in the food and agriculture sector exhibiting subtleties not adequately captured by
the existing taxonomy. Further development of these concepts are found throughout Chap-
ter 5 and Chapter 6. This work aims to observe and formalize operational interdependencies
existing in the food and agriculture sector; more specifically, what factors characterize and
confound the nature in which two infrastructures rely on one another to remain operational
and productive day-to-day. We consider four of the five new, distinct interdependence classes
presented in this work to satisfy the definition of operational interdependence. However, dur-
ing the course of this work , we regularly observed a change in behavior among infrastructures
in the aftermath of some type of disruption. More specifically, we observed instances in which
a dependent infrastructure experienced a time lag before being impacted by an independent
infrastructure’s disruption, and we observed events requiring collaboration among neighbors
in order to mitigate the impact of a disruption. These interactions characterized by the geo-
graphic, dynamic geographic, and delay interdependence classes more accurately characterize
infrastructure tasks and operations that are undertaken in order to restore productivity after
a disruption, hence we consider them to be restoration interdependencies.
This study of the food and agriculture sector identified and classified approximately 115
examples of infrastructure interdependence. Of the 115 classified examples, five examples
15

outside of the food and agriculture sector were identified. The existing taxonomy appropri-
ately classified 65 interdependencies, and the remaining 50 interdependencies were classified
by the expanded taxonomy. This study found the food and agriculture sector to be interde-
pendent with 13 of the 16 critical infrastructure sectors designated by DHS. Discussion and
analysis of interdependence classifications in this study is provided in Chapter 7. Table 4.1
presents the notation used to formalize interdependence classes in this paper.
16

Table 4.1: The following symbols are used in this paper:
Notation Definition and description
A,B,Ai Infrastructure sectors are represented as A and B in a two-way in-
teraction, where a collection of n geographically interdependent in-
frastructure sectors is represented Ai for i = 1, . . . , n for n ≥ 2;
(A,B) An interdependence between two infrastructure sectors such that
infrastructure sectors A, in some way, depends on B;
infrastructureA,B,Ai The description of each observed infrastructure interdependence de-
notes an infrastructure in infrastructure sectors A,B,Ai as indepen-
dent infrastructureA, dependent infrastructureB, and geographically
interdependent infrastructureAi ;
S The set S is composed of distinct infrastructure sectors, Ai, when
there exists an interdependence with another infrastructure sector,
Aj, for i, j ∈ N, i.e., S = {Ai : ∃(Ai, Aj) for i = 1, . . . , n, j =
1, . . . , n, and i 6= j};
t The time at which an arbitrary deadline occurs is denoted t; and
δt An arbitrary interval of time is denoted δt.
17

Chapter 5
Interdependence Classifications in the Existing Taxonomy
Interdependence classifications begin with the physical, cyber, geographic, and logical
classes of the existing taxonomy. Generally, the interdependence classes of the existing
are simply defined and adequately capture broad dependence relationships among critical
infrastructure sectors. This study considers physical, cyber, and logical interdependence
classifications to appropriately characterize distinct, static dependence relationships among
infrastructure sectors over time. Similarly, geographic interdependencies exhibit infrastruc-
ture consistency characteristics that are affected by some localized event.
5.1 Physical Interdependencies
Definition: The operational state of infrastructure A depends on a material output of
infrastructure B [24].
Observed frequency: 37.
Examples (A, B):
• (Food and agriculture, Food and agriculture). Animal food manufacturingA feed for-
mulations depend on cereal grains produced by the crop productionB infrastructure.
• (Food and agriculture, Chemical). Crop productionA depends on fertilizer, herbicides,
pesticides, and other agricultural chemicals produced by the agricultural chemical man-
ufacturingB infrastructure.
• (Food and agriculture, Critical manufacturing). Animal productionA and crop produc-
tionA depend on industrial equipment and farm machinery produced by the agricultural
implement manufacturingB infrastructure.
Discussion: The physical infrastructure interdependence classification characterizes an in-
frastructure’s dependence on the productivity of another infrastructure sector. Examples
18

of physical interdependencies may be generalized across similar entities within an infras-
tructure. For instance, feed formulations may vary across dairy cattle, beef cattle, swine,
and poultry production operations based on nutritional requirements for a specific infras-
tructure’s livestock or if the infrastructure’s material outputs are organic or conventional,
but invariably commercial animal production infrastructures require large volumes of cereal
grains (e.g. soybeans, corn, wheat) to feed their livestock. Similarly, plant production op-
erations vary in size, output volume, and crop output, but the operational activities among
plant producers are similar, so there exists a uniform, collective dependence on agricultural
chemicals (e.g., fertilizers and herbicides) produced in the chemical infrastructure sector and
tractors, combines, and other farm equipment produced within the critical manufacturing
infrastructure sector. The general, collective nature of physical interdependencies captures
vital input requirements of the food and agriculture sector at an aggregate level. Thus, the
dependent infrastructures exhibit a consistent demand over time. In summary, the defining
characteristics of the physical interdependence classification are generic operational depen-
dence on widely accessible outputs from independent infrastructures and, in the aggregate,
variability in the nature and timing of operational activities across an infrastructure sector
creates consistent dependence on material outputs from independent infrastructures over
time.
A comprehensive list of all physical interdependencies classified in this study is presented
in Appendix B.
5.2 Cyber Interdependencies
Definition: The operational state of infrastructure A is dependent on a material output of
infrastructure B that is transmitted directly or indirectly through the information technology
or communications critical infrastructure sectors [24].
Observed frequency: 20.
Examples (A, B):
• (Dams, Information technology). Water supply and irrigation systemsA floodwater
19

impoundment and diversion activities are planned using real-time environmental data
in the Damwatch web-application that depends on the data processing, hosting, and
related servicesB infrastructure.
• (Food and agriculture, Communications). Farm management servicesA that remotely
monitor and operate farm equipment such as grain bins depend on the wireless telecom-
munications carriersB infrastructure to transmit digital communications in rural areas.
• (Food and agriculture, Information technology). Agricultural research and develop-
mentA depends on physical and cybersecurity measures in the security systems ser-
vicesB and data processing, hosting, and related servicesB infrastructures to protect
proprietary technology and intellectual property from unauthorized access as a matter
of corporate security and national security.
Discussion: The cyber interdependence classification is a special case of physical inter-
dependencies. Indeed, the operational state of dependent infrastructures in the observed
examples of cyber interdependence are dependent on material output and productivity of
infrastructures operating within the information technology or communications critical in-
frastructure sectors. Modernization of entities within the food and agriculture sector has
created operational dependencies on communications and information technology infrastruc-
tures in order to monitor automated business processes such as billing, production, and
material management. Furthermore, reliance on automation and information technology in
the food and agriculture sector increases the complexity of operational activities by allow-
ing for farm management services to remotely monitor and control grain drying facilities
or necessitating managed services providers implement additional cybersecurity measures in
order to prevent corporate espionage and deter attempted of agri-terrorism. As in the case of
physical interdependencies, we consistently observed food and agriculture infrastructures ex-
hibiting dependence on generic outputs of the independent cyber infrastructures. Similarly,
the defining characteristics of the cyber interdependence classification are generic operational
20

dependence on widely accessible outputs from independent infrastructures and, in the aggre-
gate, variability in the nature and timing of operational activities across an infrastructure
sector creates consistent dependence on material outputs from independent infrastructures
over time.
A comprehensive list of all cyber interdependencies classified in this study is presented
in Appendix C.
5.3 Geographic Interdependencies
Definition: A “local environmental event can create state changes in all [infrastructures in
a collection]” (A1, . . . , An) [24].
Observed frequency: 8.
Examples (A1, . . . , An):
• (Food and agricultureA1 , WaterA2). Food manufacturingA1 facilities consume large
amounts of potable water and require high volumes of wastewater collection and hence
tend to be geographically clustered in regions where distribution networks and wastew-
ater treatment facilities in the municipal water and sewage systemsA2 infrastructures
are well established.
• (Food and agricultureA1,A2, A3 , TransportationA4). Grain farmingA1 , grain millingA2 ,
and grain elevators and storageA3 , and the road transportationA4 infrastructures used
in crop production are typically within a 25 mile radius.
Discussion: Observed examples of geographic interdependencies exhibit characteristics for-
malized in the well-studied interdependencies. The first example of geographically interde-
pendent infrastructures presented in our study are food processing facilities and municipal
water and wastewater utilities. We have identified examples of geographic interdependence
between food processing facilities and municipal water and sewer systems induced by ca-
pacities of the existing water distribution and wastewater collection networks. In smaller,
rural communities food processing facilities were strategically located to avoid insufficient
21

wastewater processing capacity which, in turn, may limit production capacity and prevent
expanding operations in the region. Similarly, poultry processing facilities clustered in more
populated areas are located in close spatial proximity because of high accessibility to the mu-
nicipal water and sewer infrastructures. The second example of geographic interdependence
in our study is based on the nature of operations for rice production in the Arkansas delta
region. Rice production processes are typically localized such that rice growing, harvesting,
milling, and processing all occur within a local area. This clustering of infrastructures re-
sponsible for productivity in multiple steps of the broader row crop production infrastructure
creates opportunity for both production efficiencies and cascading disruptions that require
neighboring facilities to increase production levels and transportation infrastructures to haul
grain farther.
The rice production infrastructure’s shifting preference for local grain drying and storage
showcases the importance of differentiating between resource requirements as physical inter-
dependencies and geographic interdependencies induced by co-location and spatial proximity.
As the rice production infrastructures become more reliant on on-farm grain drying and stor-
age systems, the sector’s dependence on tractor trailers in order to haul wet, freshly-harvested
grain to commercial rice mills that, generally, are located farther from rice harvesting ac-
tivities than an on-farm drying and storage bin. This reduction in delivery distance implies
an increase in operational efficiency during the transition from rice harvesting operations to
grain processing activities, but there is simultaneously a geographic interdependence induced
between the infrastructures when the physical facilities and operational activities occupy the
same space. The rice production and grain processing infrastructures have both become
susceptible to localized events, which may disrupt and damage the land, equipment, growing
rice, and harvest rice simultaneously.
These examples of geographic interdependence are specific to our study but, as with the
other classes of the existing taxonomy, geographic interdependencies characterize generic
mechanisms that correlate operational states within a collection of infrastructures that is
22

consistent across specific entities or infrastructures that perform similar operational activ-
ities within the larger critical infrastructure sector. A comprehensive list of all geographic
interdependencies classified in this study is presented in Appendix D.
5.4 Logical Interdependencies
Definition: The operational state of A is dependent on B by some “mechanism that is not
a physical, cyber, or geographic connection” [24].
Observed frequency: 5.
Examples (A, B):
• (Water, Food and agriculture). Water supply and irrigation systemA infrastructures
in Arkansas depend on crop productionB to self-report groundwater usage to conser-
vation districts monitoring groundwater use and forecasting groundwater availability
for future growing seasons.
• (Food and agriculture, Financial services). Animal productionA and crop productionA
depend on agriculturally-focused credit servicesB, the Farm Credit System, created,
operated, and regulated by the federal government.
Discussion: The final interdependence class of the existing taxonomy is defined to compre-
hensively classify infrastructure interdependencies that exist beyond the interdependencies
induced by operational input requirements or geospatial proximity. In this study, we classify
observations as logical interdependencies in the cases such that neither input requirements
nor spatial proximity is the primary mechanisms driving correlated state changes between
infrastructures. Moreover, we classify observations as logical interdependencies if we are
able to infer an interdependence is systematically observable in a more general context. In
our first example of logical interdependence, a majority of crop production infrastructures
throughout the state of Arkansas draw vast amounts of groundwater for irrigation, and the
Arkansas Natural Resources Commission (ANRC) requires users to self-report usage data
annually. Groundwater usage data is recorded and analyzed by ANRC in order to estimate
23

groundwater levels, identify regions of critically low groundwater levels, and formulate the
Arkansas Water Plan. In this example, our knowledge of the groundwater supply is in-
formed by producers operating within the crop production infrastructure, and the producers
operating within the crop production infrastructure influence groundwater availability and
usage policy through continued irrigation. Moreover, instances of asymmetric information
have influenced the actions of ANRC when users intentionally under-report or over-report
usage in fear of municipal usage fees or groundwater rationing, respectively, as groundwater
levels continue to fall. Despite the complexity, we have observed consistent activity from the
mutually interdependent infrastructures over time and across the greater crop production
infrastructures operating in the state of Arkansas. Summarily, the logical interdependence
classification captures intricate correlations between the operability of infrastructures which
are consistently observed over time and systematically occurring throughout the general
critical infrastructure sector.
We must also distinguish the decision to classify these examples as logical interdepen-
dencies rather than human, economic, and natural resources interdependencies defined in
Chapter 6. The first example of logical interdependence identifies the mechanism in which
water supply and irrigation infrastructures depends on crop production infrastructures. This
example is only classified under the logical interdependence because there is a regulatory
mechanism coupling and confounding the relationship between independent and dependent
infrastructures. Public entities mandate row crop farmers estimate and self-report groundwa-
ter usage around the aquifer, and then calculate groundwater metrics like water consumption
projections, approximate water levels, and net change in the groundwater supply. Row crop
farmers tend to be skeptical of the motivations for reporting groundwater consumption, hence
clouding the validity of reported consumption. Clearly this example of interdependence is
more complex, and we are unable to capture the true nature of the interaction between these
infrastructures simply, hence the catch-all classification.
Similarly, agricultural infrastructures rely on financial services infrastructures coupled
24

through a public enterprise under federal oversight and administration. Congress created
the Farm Credit System in 1916 in order to finance agricultural production throughout
the country, and operations of the Farm Credit System are influenced through public pol-
icy. Moreover, the establishment of a system that funds private enterprises by the federal
government confounds the mechanisms in which animal production and crop production in-
frastructures receive the credit necessary to operate. The true nature of interdependence
in the examples of logical interdependence is influenced by factors not solely determined
to result from changing human, economic, and natural resource factors. Hence, the second
complex example that involves human resources, economic resources, or natural resources
that does not fit the definition of the new interdependence.
A comprehensive list of logical interdependencies classified in this study is presented in
Appendix E.
25

Chapter 6
Interdependence Classifications in the Expanded Taxonomy
We examined the true nature of interactions captured by the physical, cyber, geographic,
and logical interdependence classes of the existing taxonomy. Generally, existing taxonomy
classifications characterize a given infrastructure’s operational behavior in relation to an inde-
pendent infrastructure’s ability to produce and distribute resources necessary for production
in the dependent infrastructure. We now aim to examine infrastructure interdependencies,
input requirements, disruption effects, and the temporal and geographic scales of operational
activities in a granular fashion through the classifications of our expanded taxonomy. In this
section, we present and discuss the dynamic physical, dynamic geographic, deadline, and de-
lay interdependencies along with our classification of human, economic, and natural resource
interdependencies.
6.1 Dynamic Physical Interdependencies
The dynamic physical infrastructure interdependence classification enhances the resolu-
tion of physical interdependencies by accommodating resource requirements for time-varying
operational activities in the dependent infrastructure. Enhancing the resolution of a physical
interdependence necessitates we examine an infrastructure’s production cycle more closely in
order to identify sources of variation in between the independent and dependent infrastruc-
tures. We observed production and operational tasks that vary over time, due to seasonal
demand fluctuations or environmentally constrained productivity among other reasons, ex-
hibited analogous varying resource requirements. This examination of production cycles and
time varying resource requirements provided key insights for our high-resolution analysis to
more adequately capture the true nature of this behavior. Examining the operational in-
frastructure components, associated physical resource requirements, and schedule in which
these processes occur underpins accurately assessing of timely component-level susceptibility
to cascading failures and measuring disruption-driven performance degradation.
26

Definition: The time-varying operational activities of infrastructure sector A depend on
different amounts of material outputs of infrastructure sector B over time.
Observed frequency: 14.
Examples (A, B):
• (Food and agriculture, Transportation). Broiler chicken productionA flock production
cycles last approximately 10 weeks where the cycle begins with the placement of live
chicks to begin a seven week grow-out period that ends when the mature birds are
processed. Cleaning and sanitation tasks are completed in the final three weeks of
the cycle while the house is empty, hence broiler chicken production depends on truck
transportationB to deliver poultry feed from the feedmill to poultry farms only during
the seven week grow-out period when the house is occupied.
• (Food and agriculture, Water). Rice farmingA depends on water supply and irrigation
systemsB to deliver groundwater for irrigating crops from May through September.
• (Transportation, Food and agriculture). Truck transportationA depends on grain
millingB efficiency in September - November to efficiently unload grain deliveries pre-
venting long queues that disrupt truck flow from grain mills to farms.
Discussion: In the first observed example of dynamic physical interdependence, we recog-
nize that, generally, a tractor-trailer filled with age appropriate feed is filled at the feedmill
and then dispatched to deliver the feed to a poultry flock that is being grown in multi-
ple houses across many farms operated by contract-growers. Moreover, the standardized
grow-out cycle includes several weeks where no livestock production activity occurs, when
dependence on truck transportation of feed vanishes, in order to prepare for the arrival of
the next flock. Disruptions in feed delivery typically do not fully disrupt production out-
put, rather there is a reduction in the yield of the flock caused by a lack of feed during the
disruption period.
27

The second example characterizes a rice farm’s dependence on water and irrigation re-
sources used specifically for the production period occurring annually from May to Septem-
ber. During periods when no crops are grown there is essentially no dependence on water
infrastructures as no activities occurring in the rice growing infrastructures require irrigation.
A disruption of water supply and irrigation systems during the growing period is unlikely to
fully disrupt production, but reduces harvest yield as the crops were unable to grow during
the disruption period. The disruption of water during harvest illustrates the effects of con-
tinuously occurring disruptions observed frequently in our study of the food and agriculture
sector. Similarly, grain milling productivity spikes as rice is harvested and milled annually
from September through November. Rice farms using the same rice mill typically have ho-
mogeneous production cycles caused by localized weather patterns; homogeneous production
cycles, in turn, require grain milling facilities to accept high volumes of freshly harvested
rice in a brief period. The influx of rice deliveries creates long queues of trucks waiting to
be processed at production facilities which increases the lead time between deliveries. This
increase in lead times at the production facility then stops harvesting operations if on-farm
temporary storage reaches capacity. Harvesting operations may resume only if trucking in-
frastructures increase productivity by supplying more trucks to unload temporary storage
containers that must wait in long queues or if rice milling facilities increase the rate deliveries
are processed, unloaded, and released from the queue. More importantly, this disruption in
the trucking infrastructure at harvest time is detrimental to total rice production.
A comprehensive list of dynamic physical interdependencies classified in this study is
presented in Appendix F.
6.2 Dynamic Geographic Interdependencies
The dynamic geographic infrastructure interdependence classification extends and en-
hances a geographic interdependence by characterizing operational changes in a collection of
infrastructures spontaneously and unexpected caused by a local event over a period of time.
It is important to distinguish our dynamic geographic classification from the geographic
28

class of the existing taxonomy. We consider the existing taxonomy to account for a static
collection of infrastructures that are simultaneously disrupted, but our dynamic geographic
classification is distinct through a recognition of interdependent infrastructures productivity
levels shifting such that production and output exist in the affected infrastructures when
other infrastructures, not necessarily subject to disruption by traditional geographic interde-
pendence, become necessary to sustain output. This shift in productivity is recognized when
there is a change in geographic footprint of operational activities is triggered by another dis-
rupted infrastructure. The shifts in productivity result from a flow of output from one region
unaffected by the triggering event to support production in the affected region. The change
of infrastructure operations and output in the unaffected region that result from a disruption
are the infrastructures which are classified by the dynamic geographic interdependence. This
dynamic geographic interdependence further presents correlated activities during restoration
activities in the event an infrastructure is disrupted by an extreme event. Thus, the dynamic
geographic may also be classified as a new type of restoration interdependence.
Definition: The geographic or spatial scales in which a local event can create state changes
in all infrastructures in a collection (A1, . . . , An) are altered by some process, event, or
circumstance.
Observed frequency: 9.
Examples (A1, . . . , An):
• (Food and agricultureA1, A2, A3 , TransportationA4 ). The geographic scale of crop pro-
ductionA1 , grain millingA2 , grain elevators and storageA3 , and truck transportationA4
infrastructures interdependence shrinks as on-farm grain drying storage systems be-
come more prevalent.
• (Food and agricultureA1, A2 , TransportationA3 ). The geographic scale of animal pro-
ductionA1 , animal food manufacturingA2 , and truck transportationA3 infrastructure
interdependence increases when a feedmill is unable to manufacture feed creating
dependence on neighboring feedmills for the production and transportation of feed
29

Discussion: The first example of dynamic geographic interdependence classifies infrastruc-
tures whose operations are determined by the usual grain production cycle but are shifting
over time to accommodate changes in operational tasks during harvest which result from lo-
cal farmers adopting on-farm grain drying systems as a substitute for immediately shipping
freshly harvested grain to commercial mills during the harvest. The adoption of on-farm
grain drying systems has added a number of operational activities in the crop production
infrastructures and reduced the volume of operational activities in the grain milling and
truck transportation infrastructures specifically when crops are harvested. The distances in
which crop delivery trucks travel from the field to the dryer and elevator is reduced to the
distance from the field to the on-farm systems. Similarly, commercial grain elevators observe
reductions in the amount of wet rice that must be unloaded, processed, and dried as more
farmers utilize local drying and storage solutions. These reductions of production volume
correspond to the crop production infrastructures assuming the burden of drying grain lo-
cally. This reduction in operational activities is specific to grain drying infrastructures, but
the total amount of work done by the truck transportation becomes more evenly distributed
throughout the year since most farmers sell dried, unprocessed rice to commercial grain el-
evators that mill, package, and resell the inventory. However, there is a tradeoff between
increased production efficiency resulting from co-locating the equipment and processes per-
formed in the grain drying and storage stages of supply chain to the same space where row
crops are grown and harvested. This co-location increases the susceptibility of both row
crop production and grain milling operations to be affected by the same localized event that
would have previously only disrupted the row crop production operations during the growing
season.
The second example presented in our study occurs in the event a livestock feedmill,
or more generally another production facility, becomes inoperable for some period of time.
When production facilities in the food and agricultural sector are unable to operate as
30

planned when biological processes occurring in livestock production, crop production, and
food processing operations require productivity in interdependent infrastructure components
then an increase in the volume of operational activities in those interdependent infrastruc-
tures is observed. In this case, neighboring feedmills are contracted to produce feed for
livestock impacted by the disrupted feedmill. Delivery from this alternate location during
the period of disruption increases the amount of production required from the truck trans-
portation infrastructure. Moreover, the neighboring feedmill may have to increase total
productivity in order to produce the volume of feed required for planned operations in ad-
dition to the feed production burden they are contracted to satisfy until operability of the
affected infrastructures is restored.
A comprehensive list of dynamic geographic interdependencies classified in this study is
presented in Appendix G.
6.3 Deadline Interdependencies
The deadline infrastructure interdependence classification also enhances the resolution
of physical interdependencies by characterizing infrastructure components or tasks that re-
quire the operations of an independent infrastructure be completed by a specific deadline.
Like the dynamic physical classification, deadline interdependence extends and enhances the
physical interdependence class to accommodate a temporal factor observed frequently in
our study of the food and agriculture sector. The deadline interdependence resembles the
time-sensitive options restoration interdependence presented in Sharkey et al. [10] that char-
acterizes the existence of a restoration task in the dependent infrastructure when restoration
of an independent infrastructure is not completed by an unknown deadline. Comparatively,
the deadline interdependence formalizes a resource requirement (in the form of a good or
service) that must be satisfied by a known deadline. Furthermore, our study aimed to iden-
tify examples of deadline interdependence are observed during day-to-day operating tasks in
the food and agriculture sector rather than during restoration tasks following a disruption.
Productivity in the food and agriculture sector requires punctual operations and task com-
31

pletion in order to satisfy biological processes inherent in the production of plants, animals,
and processed food products. For the purposes of this work, we consider a deadline t to
be the point in time when some task or output required by the dependent infrastructure
must be received such that the operational activities and production outputs are in-line with
plans and expectations. The dependent infrastructure relies on punctual productivity in the
independent infrastructure to prevent disruptions affecting output volumes and scheduled
operations.
Definition: The operational state of infrastructure A depends on resources provided by
infrastructure B by a deadline t.
Observed frequency: 12.
Examples (A, B, t):
• (Food and agriculture, Transportation, 10 hours). Poultry productionA and animal
slaughtering and processingA depends on truck transportationB of live birds from poul-
try farms to processing plants as the birds lose mass during transit and perish if not
processed within 10 hours.
• (Food and agriculture, Energy, 24 hours). Rice farmingA depends on electric power
generationB and natural gas distributionB to power irrigation pumps so that no rice
fields are not flooded or irrigated for longer than 24 hours.
• (Food and agriculture, Food and agriculture, June 30). Rice farmingA depends on crop
productionB infrastructure to cultivate and distribute rice seeds to be planted by June
30.
Discussion: Output yield (in pounds produced) of the animal slaughtering and processing
infrastructure is subject to fluctuations in the yield (in live weight) of each poultry flock
grown in the poultry production infrastructure. The truck transportation infrastructure is
responsible for bridging the gap between separate food and agriculture infrastructures by
delivering poultry flocks from farms to slaughtering and processing facilities when the live
32

birds reach market weight. The transition time for poultry beginning at pick-up and ending
with delivery to processing facilities must not exceed 10 hours. Live birds actively lose mass
during transport from the grow-out farms to the processing facility causing the livelihood
of the poultry flock to rapidly deteriorate approximately 10 hours after the birds leave the
grow-out facilities. Rapid deterioration of the flock disrupts total yield in the outputs of
both the animal slaughtering and processing and poultry production while birds expire in
transit and surviving birds lose substantial amounts of mass due to dehydration. Moreover, if
this deadline is unmet by the truck transportation infrastructure then yield loss may disrupt
planned operations and procedures in the food and agriculture sector so they may be altered
to increase welfare standards in order to mitigate yield losses and societal backlash spurred
by instances of animal cruelty causing excessive losses of live animals.
The second and third examples of deadline interdependencies characterize requirement
deadlines observed in the rice farming infrastructure. Typically, irrigation pumps rely on
the power and natural gas infrastructures in the energy sector to operate normally. A
disruption in the infrastructure responsible for powering the pumps, in turn, triggers a 24
hour restoration deadline; rice crop vitality is correlated with soil moisture. The time until
the deadline t is a function of the production tasks, extent of the disruption, and available
contingencies. In this instance, backup generators powered by diesel fuel or natural gas would
appreciably mitigate the impact of a disruption, but such contingencies are not frequently
used by row crop farmers. Typically, irrigated rice fields are able to retain moisture and
sustain plant growth for 24 hours before crops begin to wither, lose mass, and ultimately
die in the summer heat. Rice harvest yield losses in the event this deadline is not met
vary in relation to the the amount of crop land that is unable to be irrigated and with the
length of the disruption. It is unlikely that disruptions in either the natural gas or power
infrastructures occur on temporal and geographic scales large enough to bring a rice farm’s
output to zero, much less disrupt rice output of the entire rice farming infrastructure in a
binary sense. The third example, however, has potential to reduce total output of domestic
33

hybrid rice farming yields to zero. At the time of this writing, approximately half of rice
farmers in Arkansas grow hybrid rice as opposed to conventional rice while there is only a
single producer of hybrid rice seeds. Optimal planting dates vary throughout geographic
regions, but the results of our study indicate rice farming infrastructures consider June 30
to be the latest possible planting date so that the growth and harvest processes occur in
the usual fashion. Consequently, a disruption that prevents rice producers from meeting
this planting deadline could escalate so severely that restoration becomes significantly more
difficult or even impossible as the local environment is less suitable to facilitate the initial
stages of rice production that should have occurred prior to the planting deadline. Restoring
productivity in the wake of an escalating failure may not be possible until environmental
conditions are appropriate for growing rice, hence there would be a full, binary production
loss in the affected infrastructure components. The June 30 planting deadline generally
applied to any rice farming operation, but we noted documented instances of a disruption
in the production of hybrid rice seeds creating shortage concerns and complicating rice
farming infrastructure operations as farmers considered altering crop rotations and other
contingencies. During this event, the independent infrastructure was able to produce enough
seed so that hybrid rice yield losses were marginal.
A comprehensive list of deadline interdependencies classified in this study is presented in
Appendix H.
6.4 Delay Interdependencies
The delay infrastructure interdependence classification also enhances the resolution of
physical interdependencies by characterizing the ability of some infrastructure processes to
continue functioning for some period of time δt in the event an that infrastructure that
produces a material input is disrupted. Similar to the dynamic physical classification, delay
interdependence extends and enhances the physical interdependence class to accommodate
a temporal factor observed frequently in our study of the food and agriculture sector. Some
production processes in food and agriculture infrastructures are able to withstand tempo-
34

rary disruptions in independent infrastructures through raw material stockpiles that create
a buffer between the time of a disruption onset in the independent infrastructure and the
dependent infrastructure [49]. In addition to this buffering characteristic, we also observed
instances such that a δt exists when circumstances prevent instantaneous detection of dis-
ruptions in the independent infrastructure’s operating procedures.
Definition: The operational state of infrastructure A is dependent on a material output of
infrastructure B and, from the onset of a disruption in B, A is unaffected for a period of
time δt.
Observed frequency: 7.
Examples (A, B, δt):
• (Food and agriculture, Transportation, 24 hours). Poultry productionA growth pro-
cesses experience a delayed onset disruption when the buffering stock of animal feed is
depleted approximately 24 hours after a disruption in the truck transportationB infras-
tructures responsible for delivering feed to poultry houses which causes the grow-out
period to be extended while the birds reach market weight.
• (Food and agriculture, Energy, 24 hours). Poultry productionA growth processes ex-
periences a delayed onset disruption when the buffering stock of diesel fuel powering
a backup generator is depleted approximately 24 hours after a disruption in the elec-
tric power generationB infrastructure which causes the grow-out period to be extended
while the birds reach market weight.
• (Water, Food and agriculture, years). Water supply and irrigation systemsA experi-
ences a delayed onset disruption of distribution when pollution is detected in the water
supply, up to several years after polluting begins, after disruption in the animal pro-
ductionB, crop productionB, and food manufacturingB infrastructures allows pollutants
to reach a water supply causing the water infrastructures to perform sanitation and
restoration processes before distribution may be resumed.
35

Discussion: The first and second examples of delay interdependencies exhibit the depen-
dent infrastructure’s ability to continue operating following a disruption in an independent
infrastructure that produces a material production input through an inventory buffer. Occa-
sionally, contingencies that mitigate temporary disruptions in lifeline infrastructure systems
are found in commercial production processes. A standard procedure for commercial poul-
try producers is to require contract growers to construct and use on-site storage tanks for
water, poultry feed, and diesel fuel so livestock are able to withstand short periods of dis-
ruption without substantial yield losses on the affected grow-out farms. The feed and diesel
fuel stored on-site compose buffers that mitigate reductions in production when the truck
transportation and energy infrastructures are unable to deliver their respective inputs to
the poultry farms. Generally, the contingency plans are implemented to create buffering
stocks so that each farm may withstand disruptions lasting up to 24 hours. Furthermore,
these contingencies are enacted with an assumption that disruptions are so widespread or
severe that restoration processes will require more than 24 hours. When buffering stocks are
depleted then, in these instances, the poultry production infrastructure is disrupted in the
same manner as dynamic physical interdependencies. Instances of delay interdependencies
with a buffering stock attribute are also observed in the food processing infrastructure. In
contrast to the poultry production and crop production infrastructures, the food processing
infrastructure operates more similarly to traditional manufacturing where production will
cease if essential raw materials are unavailable and the buffering stock has been depleted. For
instance, food processing facilities must meet sanitation and hygiene standards that require
the use of cleaning chemicals, but if cleaning chemicals or substitutes are unavailable, then
productivity and output cease at the facility affected by the disruption at time δt.
The third example of delay interdependence is an instance where the water infrastructure
is unable to detect an ongoing disruption of environmental and waste management produc-
tion processes that suppress environmental contamination. In the event industrial waste
created by production processes in food and agriculture infrastructures continually contami-
36

nate a municipal water supply or groundwater sources, then the water supply infrastructure
would operate normally until there exist detectable levels of contamination built up over a
considerable δt. Once the contamination is detected, then water supply infrastructure must
take appropriate countermeasures outside the scope of day-to-day operations in order to
ensure their output meets health and safety standards. The delayed onset disruption in the
example manifests exactly when pollutant concentration levels exceed the tolerances set by
the water distribution infrastructure.
A comprehensive list of delay interdependencies classified in this study is presented in
Appendix I.
6.5 Human, Economic, and Natural Resource Interdependencies
The human, economic, and natural resource interdependence classification is an exten-
sion and enhancement of the existing taxonomy’s logical interdependence class. Because
infrastructures operate as complex adaptive systems, operability is affected and influenced
by societal factors in the operating environment. Human resources in an infrastructure’s
operating environment are composed of changes in production or operations influenced by
the shifts in cultural and geographic factors affecting human operators and stake-holders of
the infrastructure’s production; human resources are examined through census-like demo-
graphics. Economic resources depict changes in the infrastructure’s operational behavior in
response to variations in credit availability, consumer preference, and the overall macroeco-
nomic climate. Consumption of scarce natural resources used for production in the lifeline
infrastructure sectors is altering the infrastructure operating environment which, in turn,
necessitates interdependent infrastructures adapt production processes to become more ef-
ficient and robust to limited resource availability or allocation. This classification aims to
evaluate modifications in an infrastructure’s operational tasks that are correlated to chang-
ing human resources, economic resources, or natural resources within the infrastructure’s
operating environment.
Definition: The operational state of infrastructure A is affected by changes in human,
37

economic, or natural resources provided by infrastructure B.
Observed frequency: 7.
Examples (A, B):
• (Food and agriculture, Energy). Grain crop productionA planting decisions are affected
by petroleum merchantsB in OPEC due to a positive correlation of grain prices and
commodity oil prices.
• (Food and agriculture, Chemical). Crop productionA depends on fertilizer, herbicides,
pesticides, and other agricultural chemicals produced by the agricultural chemical man-
ufacturingB infrastructure which affects the natural environment and resources avail-
able in water and soil.
• (Food and agriculture, Water). A majority of irrigation for row crop productionA draws
large amounts of water from groundwater aquifers and surface water reservoirsB.
Discussion: Typically, a single producer in the crop production infrastructure segments
production among several crop varieties in order to maximize returns when the crops are
harvested and improve soil quality based on the characteristics of biological processes for
each crop in the rotation. A producer’s desire to maximize crop returns may lead to strate-
gic modifications of crop rotation and planting strategies based on speculation of oil prices,
actions taken by OPEC, and considering the strategies used by other crop producers to es-
timate total crop yields across the infrastructure sector. Operations in the crop production
infrastructure are reliant on production and operations in the petroleum merchant infrastruc-
ture when crop producers develop and implement production processes based on petroleum
production and distribution decisions made by the petroleum merchants. While the effects
of a disruption in the petroleum merchant infrastructure are variable and difficult to assess,
identifying that producers alter operations and production decisions in response to produc-
tivity in the petroleum merchants infrastructure enhances a comprehensive understanding
38

the infrastructure environment and solidifies the need for inter-disciplinary studies of critical
infrastructure systems and the food and agriculture critical infrastructure sector.
In the second and third examples, production in the food and agriculture sector is af-
fected by shifts in economic resources in the context of resource availability as a function
of operations in the agricultural chemical manufacturing infrastructure sector and the water
infrastructure, respectively. Productivity in the crop production infrastructure, along with
its output, depend on availability of resource requirements coming from infrastructures that
are also influenced by human, economic, and natural resource components of the indepen-
dent infrastructure’s operating environment. Furthermore, both examples depict production
factors in an independent infrastructure influencing production decisions in the food and
agriculture sector where each infrastructures’ operational behaviors are correlated and al-
tered productivity in the dependent infrastructure, composed of the operational activities,
production processes, and output, is attributable to the availability of a production resource
requirement. However, the interdependence classes defined in this study do not adequately
capture the true nature of the relationship between the infrastructures.
It is important to note that the low frequency of interdependencies found in this classifi-
cation indicates these examples rarely occur and the mechanisms in which human, socioeco-
nomic, and environmental factors affect access to scarce resources is not widely considered.
This classification provides the foundation to categorize the effects of changes in labor, pop-
ulation, demographics, socioeconomics, and natural environments which, in the near-term,
seemingly have little consequence but influences change in infrastructure productivity and
viability over the long run. This interdependence is contextualized through macro-scale shifts
rather than the more granular classifications in our study that concretely describe infrastruc-
ture interdependence for specific infrastructure components, specific resource requirements,
and specific types of disruptions.
A comprehensive list of human, economic, and natural resource interdependencies clas-
sified in this study is presented in Appendix J.
39

Chapter 7
Analysis of Interdependencies Observed in the Food and Agriculture Critical
Infrastructure Sector
In total, we classified 116 examples of operational interdependencies during the course
of this study. The existing taxonomy adequately classified 68 examples of operational in-
terdependencies, and the remaining 48 examples, approximately 41 percent of all identified
examples, were aggregated to formalize each of the interdependence classifications in the ex-
panded taxonomy. As the study progressed, we continued to observe variations in operational
tasks and resource requirements due to biological processes in plants and animals and the
inconsistent nature of output when row crop producers routinely sell one year’s productivity
as the crops are harvested. Similarly, livestock have unpredictable, time varying changes
in operational tasks. Infrastructures beyond food and agriculture also experience produc-
tion dynamics and are subject to similar concerns presented in this work. The heatmap
in Figure 7.1 is a visual representation of the frequency in which we identified examples of
interdependency between the food and agriculture sector and and other critical infrastruc-
ture sectors where interactions occurring most frequently are shaded dark blue. Naively, we
may inspect the figure and conclude that physical resource requirements between the food
and agriculture sector and water, transportation, information technology, and energy infras-
tructures are most vital for stakeholders in the food and agriculture sector because those
interactions were documented more frequently than others. However, the subtleties inves-
tigated in this study provided insight into necessities and considerations beyond resource
requirements. Upon further inspection, we may observe elevated levels of interdependence
within the food and agriculture sector, nontrivial restoration interdependencies induced by
spatial proximity, and significant interactions between food and agriculture infrastructures
and infrastructures providing resources more abstractly than traditional material input re-
quirements for production. The analysis presented in this chapter further explicates these
40

interdependence observations with concrete examples from our empirical study of the rice and
poultry industries in Arkansas. This chapter presents a cross section of our analysis in order
to compare and contrast the rice and poultry production infrastructures, and then generalize
our findings to the highly fragmented and diverse food and agriculture infrastructure sector
as we work towards recognizing dynamic interdependence among all critical infrastructure
sectors. We then present the factors complicating our understanding of these interdepen-
dencies: dynamic temporal scales, spatial clustering of production that induces cooperation
among producers, and prevalent nonbinary responses in production and operability in the
wake of a disruption.
7.1 Food and Agriculture Sector Fragmentation
The food and agriculture critical infrastructure sector is unique among the critical infras-
tructures. The mix of goods grown, produced, and distributed by the food and agriculture
sector is exceptionally diverse; the sector is responsible for growing and processing cereal
grains, beverage manufacturing, producing further processed food items, restaurant dining,
and even growing timber used by homebuilders and paper mills. Despite the breadth of oper-
ational tasks occurring within the sector, our work focused mainly on the large, commercial
rice and poultry production infrastructures in Arkansas. The nature of food and agriculture
production is unique due to variations in operational tasks depending on seasonality or the
current stage of production. Furthermore, we observed agricultural producers create large
production footprints through contract livestock growing, networks of production facilities
built to accommodate a simultaneous annual influx of freshly harvested crops, and true
mutual dependence between food and agriculture infrastructures.
We were able to interview 39 professional and academic experts during the course of our
study, and each of the participants provided expert insight into the nature of food and agri-
culture productivity throughout the state. Out of the 39 participants, approximately five
possessed exceptional knowledge of the poultry production infrastructure and approximately
14 possessed exceptional knowledge of the rice production and processing infrastructures. We
41

Chem
ical
Com
mer
cial
faci
lities
Com
munic
atio
ns
Critica
lm
anufa
cturing
Dam
sE
mer
gency
serv
ices
Ener
gyFin
anci
alse
rvic
esFood
and
agricu
lture
Hea
lthca
reIn
form
atio
nte
chnol
ogy
Tra
nsp
orta
tion
Wat
er
Infr
astr
uct
ure
sect
or
Physi
cal
Cyber
Geo
grap
hic
Log
ical
Dynam
icphysi
cal
Dynam
icge
ogra
phic
Dea
dline
Del
ay
Hum
an,
econ
omic
,nat
ura
lre
sourc
e
Interdependenceclassification
0123456
Figure7.1:
Thisheatmap
show
sthefrequencyin
which
each
interdep
endencewas
observed
throug
hout
ourstud
yof
thefood
andag
ricultureindu
stry
where
depthof
blue
shad
ingindicateshigh
erob
servationfrequencies.
42

recognize this disparity among our two study subjects; throughout the course of our study
we were continuously able to connect with stakeholders in the rice production infrastructure
but, through no lack of effort or attempts, meeting with poultry producers occurred less fre-
quently than rice. We recognize this imbalance may introduce rice production infrastructure
bias in the analysis. Despite the interview subject imbalance, we classified 47 and 37 distinct
instances of infrastructure interdependence in the rice production and poultry production
infrastructures, respectively. Furthermore, we were able to classify examples of interdepen-
dence extending beyond conventional rice production and poultry production in the food
and agriculture sector. Our analysis of the empirical data showed that approximately 40%
of our classified examples of interdependence in this study identified interdependencies be-
tween a component of the food and agriculture sector outside of the poultry production and
rice production infrastructures. We observed examples of interdependence that, using the
Department of the Census NAICS taxonomy, we identified to be significant components of
capital planning, food processing and production, agricultural research and development,
food storage, soil cultivation, agricultural transportation, and commercial farm management
services for absentee land owners.
In total, the food and agriculture sector contextualizes the study of critical infrastructure
systems and infrastructure interdependence so that both broad implications and intricate de-
tails are examined. For instance, by observed frequency, the three infrastructure components
outside of the food and agriculture sector observed to be dependent of other infrastructures
most frequently were water supply and irrigation components within the dams and water
infrastructure sectors in addition to the truck transportation component of the transporta-
tion sector. More interestingly, the infrastructure components found to be an independent
infrastructure most frequently were electric power generation and crop production infras-
tructures. Row crops are required ubiquitously throughout critical infrastructure sectors,
but subtle infrastructure correlations exist between chemical manufacturers, utility compa-
nies, other food and agriculture infrastructures, and financial service infrastructures. These
43

subtle correlations are more difficult to detect and appropriately classify, hence these inter-
actions were identified less frequently than obvious resource requirements. We can refine this
concept and develop further support for studying less obvious, more abstract examples of
interdependence in the row crop infrastructure. The geographic area supporting most row
crop farmland in Arkansas is experiencing a groundwater crisis as the aquifer is reaching
critically low levels while farmers continue drawing unsustainably to grow crops. Impending
scarcity and depletion of a natural resource like groundwater has spurred investment in sur-
face water impoundments, sustainable farming practices and education, and more abstractly,
conservation. Moreover, row crop farmers throughout Arkansas rely on the finite, concen-
trated groundwater supply in the aquifer to irrigate their fields; this concentrated, aggregate
resource reliance affects the scale of geographic interdependencies as more infrastructures
become reliant on alternative irrigation technologies or municipal utilities to provide that
water.
7.2 Generalizing Dynamic Interdependencies Beyond Food and Agriculture
Certainly there are unique attributes to production in the food and agriculture infrastruc-
ture sector. However, using the interdependence concepts informed by this study, we were
able to classify 30 examples of temporal phenomena, effects of geographic clustering, season-
ality, and exogenous factors influencing infrastructure interactions in nine critical infrastruc-
ture sectors including financial services, information technology, healthcare, transportation,
and energy. Despite the differences in operating characteristics and resource requirements
of each infrastructure sector, the factors studied in the food and agriculture infrastructure
sector also affect operations and restoration in dissimilar infrastructure sectors.
The empirical evidence we collected and analyzed to formalize the interdependence clas-
sifications that account for nontrivial complications observed specifically in the food and
agriculture sector provided a firm foundation for this investigation. Similarly, the empirical
evidence gathered and used to formalize the various taxonomies of the well-studied interde-
pendencies. Each taxonomy of the well-studied interdependencies depicts and characterizes
44

some unique factor not yet considered in the critical infrastructure systems literature. Just as
the taxonomies of the well-studied interdependencies have been successfully applied and ex-
panded beyond their initial scope; we have classified examples of dynamic interdependencies
that are not associated with food and agriculture production. This study of interdepen-
dencies in the food and agriculture sector reinforces the importance utilizing empirical data
as a stepping stone to develop more sophisticated methods in order to solve more general
problems of time-varying interdependencies and variable resource consumption which we
observed specifically in the food and agriculture infrastructure sector.
7.3 Temporal Analysis
Operations in the food and agriculture infrastructure sector are complex due to the field’s
fragmented nature; many different entities with dissimilar operations operate simply because
we have biological requirements that necessitate a productive food and agriculture infrastruc-
ture. Time varying operations in the food and agriculture sector tend to be either seasonal
or triggered by a precursing operational activity within a production process. Furthermore,
variation in operational activities and resource requirements affect production levels at the
infrastructure component level such that disruptions do not affect productivity or yield in a
binary manner.
Seasonality in operational activities is observed more easily throughout the rice pro-
duction infrastructures and, more generally, crop production infrastructures that consist of
biological processes. The biological processes occurring during crop production cycles are de-
pendent on natural resources and the surrounding environment. Generally, crop production
has similar timetables for capital acquisition, field preparation, planting, growing, harvest-
ing, and processing. The seasonal nature of these processes and resource requirements allows
for the development of timetables that characterize and quantify resource requirements dur-
ing the production cycle along with their effects on total yield (production) occurring at
harvest. The changes in infrastructure operations throughout the year also influences the
infrastructure’s susceptibility to disruption, and the severity of disruptions based on produc-
45

tion seasonality.
Conversely, there are operating activities occurring in the food and agriculture sector that
are triggered by preceding events in the production cycle. Triggered operational activities are
more prevalent in the livestock production infrastructures. Livestock production cycles are
time sensitive in the sense that timeliness and punctuality is necessary to sustain biological
processes for each animal in production, hence there must be stocks of food and water in
place at the production facilities, transportation must occur within a short time window, and
the conclusion of process necessitates the process in the production cycle begin immediately,
else yield falls and overall productivity declines.
7.4 Geographic Analysis
There are interesting geographic characteristics in food and agriculture infrastructure
operations. Food and agriculture operations tend to be clustered in close proximity due
to environmental suitability, transportation timescales, and resource availability. Clustered
operations may exhibit an enhanced susceptibility to disruptive events, especially when we
consider the time-varying characteristics also observed in food and agriculture operations.
Examining spatial relationships among interdependent infrastructures and interdependent
components of the food and agriculture infrastructure supplements the temporal analysis
performed above.
Environmental factors significantly affect the productivity and operability of food and
agriculture infrastructures, and hence, productive components tend to cluster where the lo-
cal environment supports production. For instance, the Mississippi river delta spanning the
eastern side of Arkansas is mostly agricultural land used to grow rice, cotton, and soybeans.
On the western side of the state, poultry production is the predominant form of agriculture.
The delta region’s environmental conditions are favorable for growing rice and other cereal
grains, and cereal grain production then generally relies on the grain processing infrastruc-
tures to dry, mill, store, and sell harvested grain. The livestock production infrastructure
requires significant amounts of grain to be used as the primary ingredient in feed. From this
46

simple chain of resource requirements and infrastructure interdependencies found in the rice
and poultry infrastructure sectors, the region most suitable for agricultural production must
also accommodate the production facilties and infrastructures completing the agricultural
supply chain. The clustering of agricultural infrastructures which rely on one another to
complete production processes in the agricultural supply chain illustrates an agricultural
intradependence such that distinct infrastructures operating in the same infrastructure layer
have correlated states of operation. Our study identified readily apparent examples of in-
tradependence in the food and agriculture infrastructure sector. Localizing grain drying and
storage systems in the rice production infrastructure demonstrates tightly coupled infras-
tructure components exist in the agricultural supply chain, especially where environmental
factors are ideal for crop production. As discussed in Chapter 6, spatial clustering of these
infrastructures likely increases infrastructure production efficiency, but at the expense of
increasing the entire supply chain’s susceptibility to local extreme events.
Similarly, the clustering of agricultural infrastructures makes interdependent infrastruc-
tures more vulnerable to failures and disruptions that are locally devastating. Consider the
interdependent relationship between the row crop production infrastructure and the finan-
cial institution financing crop production. Typically, the banks providing financing for crop
production are members of the Farm Credit System that lend strictly for agricultural pro-
duction financing, agricultural equipment purchase/lease, or to purchase a home in a rural
area. The member banks of the Farm Credit System also typically operate small branches
in rural communities to serve customers locally. Based on the operational interdependencies
and temporal analysis given throughout this study, we can assume the financial institu-
tions operating in close proximity to the crop production infrastructures are geographically
interdependent. If an extreme event were to disrupt the local area and devastate crop pro-
duction operations, then banking operability is disrupted because the locally concentrated
row crop producers each suffered significant losses and are unable to repay the operating
line of credit. Furthermore, the financial institution is not going to recoup any of the losses
47

from this year’s disaster until next year when row crop production reaches a point of pro-
ductivity when the environmental conditions allow it. So, the aspects of spatial clustering
in the food and agricultural sector are on a continuum. There are positive aspects of spatial
clustering that allow for dynamic restoration from neighboring areas to sharing vulnerabili-
ties to disruption and extreme events through operational relationships. Correlated states of
operation of infrastructures in geographically interdependent infrastructures may compound
disruption susceptibility at the component (or individual infrastructure level) and reduce
overall resilience of an infrastructure sector depending on how other factors are affecting the
infrastructure system.
7.5 Nonbinary Response to Disruption
The unique characteristics of food and agriculture production we have presented culmi-
nate in an infrastructure system that, in general, does not respond to a disruption in resource
requirements in a binary manner. Production in the food and agriculture sector is unique.
For instance, the growing season for rice shifts marginally across the state of Arkansas where
the optimal dates to plant rice seed vary by 10 days across the southern, central, and north-
ern regions of the state [50]. Furthermore rice fields account for a significant portion of
Arkansas’s 14 million acres dedicated to agricultural production. We infer that the oper-
ational process of growing rice across the region does not vary significantly from producer
to producer, and the abundance of producers spread across large amounts of land reinforces
the ability of the rice crop, and more generally row crops, to survive disruptions in some
input to a growing process and simply yield less at harvest than if the disruption had not
occurred rather than suffer catastrophic loss in the case of a binary disruption. Similarly for
the poultry production infrastructure sector, we gathered examples of poultry production
disruptions in northwest Arkansas after an ice storm impeded traffic flow so badly that the
poultry farms ran of feed on-hand, and the birds were unable to eat until the transportation
network was operable. Despite the poultry feed delivery disruptions, the response in pro-
ductivity levels was nonbinary. In this case, the birds did not reach market weight on time
48

and the producers had to make the choice whether to process low-yielding birds or to keep
the flock on feed for a brief time until they had reached market weight.
This interesting harvest-time production dynamic prevalent in the row crop and livestock
production infrastructures provides a reasonable context to more accurately model and study
the true nonbinary responses to disruption due to the infrastructure’s operational nature.
This discussion of an infrastructure’s nonbinary response to a disruption is necessary due to
the time-varying production schedules and operational activities found throughout the sector
as opposed to a poultry processing facility’s generic, consistent requirements for energy
and water. If a generic food production facility does not receive water or energy from
the utility providers, then production stops at the immediate onset of the disruption and,
generally, the food being processed throughout the facility must be thrown away resulting
in a true binary response to disruption. The variability and diversity of production in the
food and agriculture infrastructure sector has developed structural complexity throughout
the operating environment and, in turn, exhibits interesting characteristics with possible
applications throughout each of the critical infrastructure sectors.
49

Chapter 8
Conclusions and Further Work
Our study of the food and agriculture infrastructure sector identified more than 100
examples of interdependence across 13 critical infrastructure sectors. We identified interde-
pendencies through interviews with 39 industry stakeholders across the state of Arkansas.
Interdependencies were first classified utilizing the existing taxonomy, and then further char-
acterized using five new, distinct interdependence classes that account for variations in tem-
poral and geographic scales affecting resource requirements and productivity.
In future work, we can expect these interdependencies to be generalized and applied
throughout the critical infrastructure sectors to more accurately portray complex infras-
tructure interactions. Furthermore modeling restoration tasks in the food and agriculture
infrastructures is necessary to ensure productivity and reduce food scarcity that attributes
to civil unrest and societal tumult. Considering complexity and creating general charac-
terizations for each of these complicating factors is necessary to provide deeper, poignant
insights into infrastructure interdependence.
50

Bibliography
[1] Earl E. Lee, John E. Mitchell, and William A. Wallace. Restoration of services ininterdependent infrastructure systems: A network flows approach. IEEE Transactionson Systems, Man and Cybernetics, Part C (Applications and Reviews), 37(6):1303–1317,2007. doi: 10.1109/TSMCC.2007.905859.
[2] Massoud Amin. Toward secure and resilient interdependent infrastructures. Journal ofInfrastructure Systems, 8(3):67–75, 2002. doi: 10.1061/(ASCE)1076-0342(2002)8:3(67).
[3] Yao Bao-Hua, Xie Li-Li, and Huo En-Jie. A comprehensive study method for lifelinesystem interaction under seismic conditions. Acta Seismologica Sinica, 17(2):211–221,2004.
[4] Dorothy A. Reed, Jane Preuss, and Jaewook Park. Context and resiliency: Influences onelectric utility lifeline performance. In Infrastructure Risk Management Processes: Natu-ral, Accidental, and Deliberate Hazards, pages 118–142. ASCE, 2006. ISBN 0784408157.
[5] Tushith Islam and Osama Moselhi. Modeling geospatial interdependence for integratedmunicipal infrastructure. Journal of Infrastructure Systems, 18(2):68–74, 2012. doi:10.1061/(ASCE)IS.1943-555X.0000065.
[6] Edgar C. Portante, James A. Kavicky, Brian A. Craig, Leah E. Talaber, and Stephen M.Folga. Modeling electric power and natural gas system interdependencies. Jour-nal of Infrastructure Systems, 23(4):04017035, 2017. doi: 10.1061/(ASCE)IS.1943-555X.0000395.
[7] President’s Commission on Critical Infrastructure Protection. Critical foundations pro-tecting America’s infrastructures - The report of the President’s Commission on CriticalInfrastructure Protection, 1997. URL https://fas.org/sgp/library/pccip.pdf.
[8] Nouoto Nojima and Hiroyuki Kameda. Lifeline interactions in the Hanshin-Awaji earth-quake disaster. In Committee of Earthquake Engineering, The 1995 Hyogoken-NanbuEarthquake: investigation into damage to civil engineering structures, pages 253–264.Society of Civil Engineers, 1996.
[9] Stephanie E. Chang, Timothy L. McDaniels, and Dorothy A. Reed. Mitigation ofextreme events: Electric power outage and infrastructure failure interactions. In Theeconomic impact of terrorist attacks, pages 70–90. 2005.
[10] Thomas C. Sharkey, Sarah G. Nurre, William A. Wallace, Joe H. Chow, and John E.Mitchell. Identification and classification of restoration interdependencies in the wakeof Hurricane Sandy. Journal of Infrastructure Systems, 22(1):04015007–1–12, 2016.
[11] Sarah G. Nurre, Burak Cavdaroglu, John E. Mitchell, Thomas C. Sharkey, andWilliam A. Wallace. Restoring infrastructure systems: An integrated network design
51

and scheduling (INDS) problem. European Journal of Operational Research, 223(3):794–806, 2012. doi: 10.1016/j.ejor.2012.07.010.
[12] Yacov Y. Haimes. Roadmap for modeling risks of terrorism to the homeland. Journal ofInfrastructure Systems, 8(2):35–41, 2002. doi: 10.1061/(ASCE)1076-0342(2002)8:2(35).
[13] Ana Laugé, Josune Hernantes, and Jose M. Sarriegi. Critical infrastructure dependen-cies: A holistic, dynamic and quantitative approach. International Journal of Crit-ical Infrastructure Protection, 8:16–23, 2015. doi: 10.1016/j.ijcip.2014.12.004. URLhttp://dx.doi.org/10.1016/j.ijcip.2014.12.004.
[14] Office of the President The White House. Presidential Policy Directive - Critical Infras-tructure Security and Resilience, 2013.
[15] United States Food and Drug Administration, United States Department of Agriculture,and United States Department of Homeland Security. Food and Agriculture SectorSpecific Plan. Technical report, 2015.
[16] Paolo D’Odorico, Kyle Frankel Davis, Lorenzo Rosa, Joel A. Carr, Davide Chiarelli,Jampel Dell’Angelo, Jessica Gephart, Graham K. MacDonald, David A. Seekell, SamirSuweis, and Maria Cristina Rulli. The global food-energy-water nexus. Reviews ofGeophysics, pages 1–76, 2018. doi: 10.1029/2017RG000591.
[17] Rae Zimmerman, Quanyan Zhu, and Carolyn Dimitri. Promoting resilience for food,energy, and water interdependencies. Journal of Environmental Studies and Sciences,6(1):50–61, 2016. doi: 10.1007/s13412-016-0362-0.
[18] United States Department of Agriculture. 2012 Census of Agriculture. Technical report,Washington, D.C., 2014.
[19] Marco Pagani, Thomas G. Johnson, and Matteo Vittuari. Energy input in con-ventional and organic paddy rice production in Missouri and Italy: A compara-tive case study. Journal of Environmental Management, 188:173–182, 2017. doi:10.1016/j.jenvman.2016.12.010.
[20] N. Pelletier. Environmental performance in the US broiler poultry sector: Life cycleenergy use and greenhouse gas, ozone depleting, acidifying and eutrophying emissions.Agricultural Systems, 98(2):67–73, 2008. doi: 10.1016/j.agsy.2008.03.007.
[21] Richard G. Little. Controlling cascading failure: Understanding the vulnerabilities ofinterconnected infrastructures. Journal of Urban Technology, 9(1):109–123, 2002. doi:10.1080/106307302317379855.
[22] Theresa Brown, Walt Beyeler, and Dianne Barton. Assessing infrastructure interdepen-dencies: The challenge of risk analysis for complex adaptive systems. 1(1):108, 2004.doi: 10.1504/IJCIS.2004.003800.
52

[23] Rae Zimmerman. Social implications of infrastructure network interactions. Journal ofUrban Technology, 8(3):97–119, 2001. doi: 10.1080/106307301753430764.
[24] Steven M. Rinaldi, J.P. Peerenboom, and T.K. Kelly. Identifying, understanding, andanalyzing critical infrastructure interdependencies. IEEE Control Systems Magazine,21(6):11–25, 2001. doi: 10.1109/37.969131.
[25] William A. Wallace, David Mendonça, Earl E. Lee, John E. Mitchell, and Joe H. Chow.Managing disruptions to critical interdependent infrastructures in the context of the2001 World Trade Center Attack. Impacts of and Human Response to the September11, 2001 Disasters: What Research Tells Us, pages 166–198, 2003. doi: 10.1109/ic-smc.2004.1401165.
[26] Donald D. Dudenhoeffer, May R. Permann, and Milos Manic. CIMS: A frameworkfor infrastructure interdependency modeling and analysis. In L. F. Perrone, F. P.Wieland, J. Liu, B. G. Lawson, D. M. Nicol, and R. M. Fujimoto, editors, Proceed-ings - Winter Simulation Conference, pages 478–485, Monterey, CA, 2006. IEEE. doi:10.1109/WSC.2006.323119.
[27] Pengcheng Zhang and Srinivas Peeta. A generalized modeling framework to ana-lyze interdependencies among infrastructure systems. Transportation Research PartB: Methodological, 45(3):553–579, 2011. doi: 10.1016/j.trb.2010.10.001.
[28] P. Pederson, Donald D. Dudenhoeffer, S Hartley, and May R. Permann. Critical in-frastructure interdependency modeling: A survey of U.S. and international research.Technical report, Idaho National Laboratory, 2006.
[29] Nan Xiao, Raj Sharman, H. Raghav Rao, and Shambhu J. Upadhyaya. Association forInformation Systems AIS Electronic Library (AISeL) Infrastructure interdependenciesmodeling and analysis - A review and synthesis. In AMCIS 2008 Proceedings. AIS, 2008.URL http://aisel.aisnet.org/amcis2008/224.
[30] Min Ouyang. Review on modeling and simulation of interdependent critical infras-tructure systems. Reliability Engineering & System Safety, 121:43–60, 2014. doi:10.1016/j.ress.2013.06.040.
[31] Saeid Saidi, Lina Kattan, Poornima Jayasinghe, Patrick Hettiaratchi, and Joshua Taron.Integrated infrastructure systems - A review. Sustainable Cities and Society, 36:1–11,2018. doi: 10.1016/j.scs.2017.09.022.
[32] Timothy L. McDaniels, Stephanie E. Chang, Krista Peterson, Joseph Mikawoz,and Dorothy A. Reed. Empirical framework for characterizing infrastructure fail-ure interdependencies. Journal of Infrastructure Systems, 13(3):175–184, 2007. doi:10.1061/(ASCE)1076-0342(2007)13:3(175).
[33] Stephanie E. Chang, Timothy L. McDaniels, Joseph Mikawoz, and Krista Peterson.
53

Infrastructure failure interdependencies in extreme events: Power outage consequencesin the 1998 Ice Storm. Natural Hazards, 41(2):337–358, 2007. doi: 10.1007/s11069-006-9039-4.
[34] Timothy L. McDaniels, Stephanie E. Chang, and Dorothy A. Reed. Characterizinginfrastructure failure interdependencies to inform systemic risk. In Wiley Handbook ofScience and Technology for Homeland Security, pages 1–16. John Wiley & Sons, Inc.,2008. doi: 10.1002/9780470087923.hhs238.
[35] Timothy L. McDaniels, Stephanie E. Chang, Darren Cole, Joseph Mikawoz, and HollyLongstaff. Fostering resilience to extreme events within infrastructure systems: Charac-terizing decision contexts for mitigation and adaptation. Global Environmental Change,18(2):310–318, 2008. doi: 10.1016/j.gloenvcha.2008.03.001.
[36] Stephanie E. Chang, Timothy L. McDaniels, and C Beaubien. Societal impacts ofinfrastructure failure interdependencies: Building an empirical knowledge base. InTCLEE 2009, pages 1–10, Reston, VA, 2009. American Society of Civil Engineers.doi: 10.1061/41050(357)66.
[37] Rae Zimmerman. Decision-making and the vulnerability of interdependent critical in-frastructure. In 2004 IEEE International Conference on Systems, Man and Cybernetics(IEEE Cat. No.04CH37583), volume 5, pages 4059–4063. IEEE, 2004. doi: 10.1109/IC-SMC.2004.1401166.
[38] Rae Zimmerman, Quanyan Zhu, Francisco de Leon, and Zhan Guo. Conceptualmodeling framework to integrate resilient and interdependent infrastructure in ex-treme weather. Journal of Infrastructure Systems, 23(4):04017034, 2017. doi:10.1061/(ASCE)IS.1943-555X.0000394.
[39] Cen Nan and Giovanni Sansavini. A quantitative method for assessing resilience ofinterdependent infrastructures. Reliability Engineering and System Safety, 157:35–53,2017. doi: 10.1016/j.ress.2016.08.013.
[40] Stephanie E. Chang and Masanobu Shinozuka. Measuring improvements in thedisaster resilience of communities. Earthquake Spectra, 20(3):739–755, 2004. doi:10.1193/1.1775796.
[41] Yoshio Kajitani and Shigeo Sagai. Modelling the interdependencies of critical infras-tructures during natural disasters: A case of supply, communication and transportationinfrastructures. International Journal of Critical Infrastructures, 5:38–50, 2009. doi:10.1504/IJCIS.2009.022848.
[42] David J. Mendonça and William A. Wallace. Impacts of the 2001 World Trade CenterAttack on New York City critical infrastructures. Journal of Infrastructure Systems, 12(4):260–270, 2006. doi: 10.1061/(ASCE)1076-0342(2006)12:4(260).
54

[43] Leonardo Dueñas-Osorio and Alexis Kwasinski. Quantification of lifeline system inter-dependencies after the 27 February 2010 M w 8.8 Offshore Maule, Chile, Earthquake.Earthquake Spectra, 28(S1):S581–S603, 2012. doi: 10.1193/1.4000054.
[44] G. H. Kjølle, I. B. Utne, and O. Gjerde. Risk analysis of critical infrastructures em-phasizing electricity supply and interdependencies. Reliability Engineering and SystemSafety, 105:80–89, 2012. doi: 10.1016/j.ress.2012.02.006.
[45] Rodolfo Jr Espada, Armando Apan, and Kevin McDougall. Vulnerability assessmentand interdependency analysis of critical infrastructures for climate adaptation and floodmitigation. International Journal of Disaster Resilience in the Built Environment, 6(3):313–346, 2015. doi: 10.1108/IJDRBE-02-2014-0019.
[46] Christopher A. Scott, Mathew Kurian, and James L. Wescoat. The water-energy-foodnexus: Enhancing adaptive capacity to complex global challenges. In Governing theNexus, pages 15–38. Springer International Publishing, 2015. doi: 10.1007/978-3-319-05747-7-2.
[47] Steven M. Rinaldi. Modeling and simulating critical infrastructures and their in-terdependencies. In 37th Annual Hawaii International Conference on System Sci-ences, 2004. Proceedings of the. IEEE, 2004. doi: 10.1109/HICSS.2004.1265180. URLhttp://ieeexplore.ieee.org/document/1265180/.
[48] University of Arkansas Division of Agriculture. Economic contributionof Arkansas agriculture. Technical report, Little Rock, 2014. URLhttps://division.uaex.edu/Economic_Contribution_2014.pdf.
[49] Nils Kalstad Svendsen and Stephen D Wolthusen. Connectivity models of interdepen-dency in mixed-type critical infrastructure networks. Information Security TechnicalReport, 12(1):44–55, 2007. doi: 10.1016/j.istr.2007.02.005.
[50] Jarrod Hardke, Ralph Mazzanti, and Ron Baker. 2018 Arkansas Rice Quick Facts.University of Arkansas Division of Agriculture, 2018.
55

Appendix A
Well-Studied Interdependencies
Table A.1: Aggregation of well-studied infrastructure interdependencies. Prominent inter-dependency taxonomies are aggregated in chronological order by publication.
Publication Classification Description
Rinaldi et al. [24]
Physical The state of an infrastructure
is dependent on the material
output(s) of the other.
Cyber The state of an infrastructure
depends on information trans-
mitted through the digital in-
formation infrastructure.
Geographic A local environmental event
can create state changes in a
collection of infrastructures.
Logical The state of an infrastructure
depends on the state of an-
other via a connection that is
not physical, cyber, or geo-
graphic.
Zimmerman [23]Functional Infrastructures can be depen-
dent on one another opera-
tionally.
56

Table A.1: (continued)
Publication Classification Description
Spatial Infrastructures become more
dense and compact as dis-
tributed networks occupy the
same conduits in cities.
Wallace et al. [25]
Input An infrastructure requires one
or more services, as an input,
from another infrastructure to
provide another service.
Shared Physical components or ac-
tivities of infrastructures are
shared to provide some service.
Exclusive-or Only one of the two or more
services can be provided by an
infrastructure.
Mutually dependent Infrastructures mutually de-
pend on an output of one an-
other.
Co-located Any physical components or
activities are situated within
an established geographical
area.
Dudenhoeffer et al. [26]
Physical (a, b)e defines a requirement of
b on a.
57

Table A.1: (continued)
Publication Classification Description
Informational (a, b)i defines an informational
or control requirement be-
tween a and b. Information
from asset a, not necessary for
the existence of node b, is es-
sential for certain functionality
in node b, ∼a →∼f(b) where
f(b) is a function of operation
for asset b.
Geospatial (a, b)g defines a relationship
that exists entirely due to the
proximity of nodes a to b, (e.g.
(a, b)g → d(a, b) < ε for some
predefined distance ε). Thus
a physical event occurring at
node a represented as E(a),
E(a)→ E(b).1
Policy/Procedural (a, b)p defines an interdepen-
dency that exists due to policy
or procedures relating an event
or state of change for node a to
a subsequent effect on node b
or Ej(a)→ Ek(b).1
58

Table A.1: (continued)
Publication Classification Description
Societal (a, b)s defines interdependen-
cies or influences that an
event, physical or otherwise,
on an infrastructure compo-
nent may impart on societal
factors which may be time
sensitive in nature, decaying
as the time from the original
event grows. So for (a, b)s,
Ej(a) → Ek(b, t), a decaying
effect over time t.
Chang et al. [33]
Cascading The disruption of the power
system directly causes the dis-
ruption in the impacted sys-
tem.
Escalating The disruption of the power
system exacerbates an already-
existing disruption in the im-
pacted system, increasing the
severity or outage time.
Restoration The power outage hampers the
restoration of the impacted
system.
59

Table A.1: (continued)
Publication Classification Description
Compound damage propaga-
tion
The power system disrup-
tion leads to a disruption
that then causes serious dam-
age/accidents/problems in the
impacted system.
Substitutive A system is disrupted due to
demands placed on it to sub-
stitute for the power system.
Zhang and Peeta [27]
Functional Functionality of an infrastruc-
ture system requires inputs
from another system, or can
be substituted, to a certain ex-
tent, by the other system.
Physical Infrastructure systems are cou-
pled through shared physical
attributes and share flow right
of way.
Budgetary Infrastructure systems rely on
some level of public financing
leading to resource allocation
budget interdependencies.
Market and Economic Infrastructures share market
resources in the same economic
system.
60

Table A.1: (continued)
Publication Classification Description
Sharkey et al. [10]
Traditional precedence (A, B) : A restoration task
in infrastructure B cannot be
started until a restoration task
in infrastructure A is complete.
Effectiveness precedence (A, B) : A restoration task in
infrastructure B is not as effec-
tive until a restoration task in
infrastructure A is complete.
Options precedence A restoration task in infras-
tructure B can be completed
by accomplishing a restoration
task in one of a set of possible
infrastructures A1, A2, . . . , An.
Time-sensitive options A restoration task in infras-
tructure B must be com-
pleted only if a restoration
task in infrastructure A is not
completed by a certain (un-
known) deadline. Therefore,
the restoration task in A must
be completed by its deadline
or the task in B must be com-
pleted.
61

Table A.1: (continued)
Publication Classification Description
Competition for resources Restoration tasks in infrastruc-
tures A1, A2, . . . , An compete
for the same set of scarce re-
sources.
62

Appendix B
Observed Physical Interdependencies
Recall a physical infrastructure interdependency, (A,B), exists when the operational state of
infrastructure A depends on a material output of infrastructure B [24].
Table B.1: Enumeration of physical interdependencies observed in the food and agriculturesector denoting infrastructure AA and infrastructure BB in the description of each example.
A B Description
Chemical Food and agriculture Ethyl alcohol manufacturingA depends
on grains produced by the crop produc-
tionB infrastructure.
Food and agriculture Chemical Crop productionA depends on fertilizer,
herbicides, pesticides, and other agricul-
tural chemicals produced by the agri-
cultural chemical manufacturingB infras-
tructure.
Food and agriculture Chemical Food manufacturingA adheres to sanita-
tion standards that depend on chlorine
dioxide and other cleaning chemicals pro-
duced by the chemical manufacturingB
infrastructure.
63

Table B.1: Physical interdependencies (continued)
A B Description
Food and agriculture Critical manufacturing Animal productionA and crop produc-
tionA depend on industrial equipment
and farm machinery manufactured in the
agricultural implement manufacturingB
infrastructure.
Food and agriculture Critical manufacturing Food manufacturingA processes depend
on industrial equipment manufactured in
the food product machinery manufactur-
ingB infrastructure.
Food and agriculture Dams Crop productionA, grain millingA, and
food manufacturingA infrastructures are
vulnerable to flooding and depend on
floodwater impoundment and diversion
operations of the water supply and irri-
gation systemsB infrastructure.
Food and agriculture Energy Crop productionA equipment and vehi-
cles depend on gasoline and diesel fuel
from the petroleum manufacturingB in-
frastructure.
Food and agriculture Energy Refrigerated storageA refrigeration sys-
tems prolonging the shelf-life of perish-
able food products depend on the electric
power generationB infrastructure.
64

Table B.1: Physical interdependencies (continued)
A B Description
Food and agriculture Energy Grain elevators and storageA facilities are
monitored and ventilated by equipment
that depends on the electric power gen-
erationB infrastructure.
Food and agriculture Energy Grain millingA boilers depend on dedi-
cated transmission lines from the natural
gas distributionB infrastructure.
Food and agriculture Energy Grain millingA industrial equipment re-
lies on dedicated transmission lines from
the electric power generationB infrastruc-
ture.
Food and agriculture Financial services Animal productionA financing depends
on credit extended by commercial banks
or the Farm Credit System in the credit
intermediationB infrastructure.
Food and agriculture Food and agriculture Animal food manufacturingA feed formu-
lations depend on cereal grains produced
by the grain farmingB infrastructure.
Food and agriculture Food and agriculture Food manufacturingA perishable goods
spoilage prevention depends on refrigera-
tion provided by the refrigerated storageB
infrastructure.
65

Table B.1: Physical interdependencies (continued)
A B Description
Food and agriculture Healthcare Animal productionA healthcare and an-
imal welfare standards depend on phar-
maceuticals and vaccinations from the
pharmaceutical and medicine manufac-
turingB infrastructure.
Food and agriculture Healthcare Animal productionA healthcare and bio-
logical security standards depend on an-
imal diagnostic testing services from the
veterinary servicesB infrastructure.
Food and agriculture Transportation Food manufacturingA shipments and de-
liveries depend on transportation from
the air transportationB, rail transporta-
tionB, water transportationB, and truck
transportationB infrastructures.
Food and agriculture Transportation Soil preparation and cultivationA opera-
tions performed aerially depend on com-
mercial pilots, aircraft, and airports in
the air transportationB infrastructure.
66

Table B.1: Physical interdependencies (continued)
A B Description
Food and agriculture Water Food manufacturingA, animal produc-
tionA, and crop productionA depend on
municipal water supplies, irrigation reser-
voirs, and distribution of potable water
from the water supply and irrigation sys-
temsB infrastructure.
Food and agriculture Water Food manufacturingA, animal produc-
tionA, and crop productionA operations
typically are unable to appropriately
treat wastewater byproduct and then de-
pends on collection and treatment pro-
vided by the wastewater treatmentB in-
frastructure.
Transportation Food and agriculture Rail transportationA, water transporta-
tionA, and truck transportationA long-
haul grain shipments rely on fumiga-
tion for vermin control provided by the
postharvest crop activitiesB infrastruc-
ture.
67

Appendix C
Observed Cyber Interdependencies
Recall a cyber infrastructure interdependence exists when A is dependent on a material out-
put of B that is transmitted directly or indirectly through the information technology or
communications infrastructure sectors [24].
Table C.1: Enumeration of cyber interdependencies observed in the food and agriculturesector denoting infrastructure AA and infrastructure BB in the description of each example.
A B Description
Dams Information technology Water supply and irrigation sys-
temsA floodwater impoundment and
diversion activities are planned using
real-time environmental data in the
Damwatch web-application that de-
pends on the data processing, hosting,
and related servicesB infrastructure.
Dams Communications Water supply and irrigation systemsA
floodwater impoundment and diver-
sion activities are planned using real-
time environmental data disseminated
by the Damwatch web-application
that depends on the wired telecommu-
nications carriersB, wireless telecom-
munications carriersB, and satellite
telecommunicationsB infrastructures.
68

Table C.1: Cyber interdependencies (continued)
A B Description
Information technology Communications Data processing, hosting, and related
servicesA aggregation, analysis, and
dissemination of environmental data
from across the country in real-time
depends on data transmission through
the wired telecommunications carri-
ersB, wireless telecommunications car-
riersB, and satellite telecommunica-
tionsB infrastructures.
Food and agriculture Information technology Grain farmingA remotely operated,
on-farm grain drying and storage sys-
tems depends on the ability to dig-
itally manage operations and equip-
ment through the computer facilities
management serviceB infrastructure.
Food and agriculture Communications Farm management servicesA that re-
motely monitor and operate farm
equipment such as grain bins de-
pend on the wireless telecommunica-
tions carriersB infrastructure to trans-
mit digital communications in rural ar-
eas.
69

Table C.1: Cyber interdependencies (continued)
A B Description
Food and agriculture Information technology Food manufacturingA, animal produc-
tionA, and crop productionA enter-
prise resource planning software inte-
gral to productivity depends on soft-
ware consultants developing and main-
taining functionality through the com-
puter systems design servicesB infras-
tructure.
Food and agriculture Information technology Food manufacturingA, animal produc-
tionA, and crop productionA enterprise
resource planning software depends on
managed technology services provided
by the data processing, hosting, and
related servicesB infrastructure.
Food and agriculture Information technology Agricultural research and develop-
mentA depends on physical and cy-
bersecurity measures in the security
systems servicesB and data processing,
hosting, and related servicesB infras-
tructures to protect proprietary tech-
nology and intellectual property from
unauthorized access as a matter of cor-
porate security and national security.
70

Appendix D
Observed Geographic Interdependencies
Recall a geographic infrastructure interdependence exists among a collection of infrastructures
“if a local environmental event can create state changes in all of them” [24].
Table D.1: Enumeration of geographic interdependencies observed in the food and agriculturesector denoting infrastructures A1 . . . An
A1 . . . An in each example’s description.
S = {A1, . . . , An} Description
Food and agricultureA1 , Commercial
faciltiesA2 . . . A4
Restaurants and other eating placesA1 are
collocated with commercial facilities hous-
ing performing arts and spectator sportsA2 ,
museums and historical sitesA3 , amusement
parks, gambling, and recreationA4 .
DamsA1 , Food and agricultureA2 . . . A4 ,
TransportationA5 , WaterA6 , EnergyA7 ,
Emergency servicesA8 . . . A10
Floods in the Arkansas delta affect water
supply and irrigation systemsA1 , grain farm-
ingA2 , grain millingA3 , animal productionA4 ,
water transportationA5 , water supply and
irrigation systemsA6 , electric power gener-
ationA7 , emergency road servicesA8 , emer-
gency medical transportation servicesA9 ,
and emergency relief servicesA10 infrastruc-
tures.
71

Table D.1: Geographic interdependencies (continued)
S = {A1, . . . , An} Description
Food and agricultureA1, A2 , WaterA3 ,
HealthcareA4, A5 , Emergency servicesA6
Food manuacturingA1 and animal produc-
tionA2 pollution affects water treatment and
distributionA3 , health care servicesA4 , hospi-
talsA5 , and emergency relief servicesA6 op-
erations to treat the polluted water, health-
care and testing for ill residents, and emer-
gency relief for those without potable water.
Food and agricultureA1 . . . A3 ,
TransportationA4
Grain farmingA1 , grain millingA2 , and grain
elevators and storageA3 , and the road trans-
portationA4 infrastructures used in crop pro-
duction are typically within a 25 mile ra-
dius.
WaterA1, A4 , Food and agricultureA2 , Emer-
gency servicesA3, A6 , TransportationA5
Drought and wildfires disrupting the wa-
ter supplyA1 for animal productionA2 re-
quire emergency relief servicesA3 deliver wa-
ter from neighboring water suppliesA4 us-
ing truck transportationA5 and fire depart-
mentsA6 .
72

Table D.1: Geographic interdependencies (continued)
S = {A1, . . . , An} Description
Food and agricultureA1 . . . A4 ,
TransportationA5 , EnergyA6
Ice storms in Arkansas simultaneously dis-
rupt animal productionA1 , animal produc-
tion support activitiesA2 , animal food man-
ufacturingA3 , food manufacturingA4 , truck
transportationA5 , and electric power distri-
butionA6 .
Food manufacturingA1 , WaterA2 Food manufacturingA1 facilities consume
large amounts of potable water and require
high volumes of wastewater collection and
hence tend to be geographically clustered
in regions where distribution networks and
wastewater treatment facilities in the mu-
nicipal water and sewage systemsA2 infras-
tructures are well established.
73

Appendix E
Observed Logical Interdependencies
Recall a logical infrastructure interdependence exists when the state of A is dependent on B
by some mechanism that is not physical, cyber, or geographic in nature [24].
Table E.1: Enumeration of logical interdependencies observed in the food and agriculturesector denoting infrastructure AA and infrastructure BB in the description of each example.
A B Description
Chemical Food and agriculture Agricultural chemical manufacturingA de-
pends on grain farmingB infrastructures
challenging the regulatory bans on the use
of the dicamba herbicide.
Food and agriculture Financial services Animal productionA and crop productionA
depend on agriculturally-focused credit
servicesB, the Farm Credit System, cre-
ated, operated, and regulated by the fed-
eral government.
Transportation Emergency services Road transportationA depends on govern-
ment emergency planningB to lift work-
ing time limitations during states of emer-
gency.
74

Table E.1: Logical interdependencies (continued)
A B Description
Water Food and agriculture Water supply and irrigation systemA in-
frastructures depend on crop productionB
to self-report groundwater usage to con-
servation districts monitoring groundwater
use and forecasting groundwater availabil-
ity for future growing seasons.
75

Appendix F
Observed Dynamic Physical Interdependencies
Recall a dynamic physical infrastructure interdependence exists when the time-varying oper-
ational activities of infrastructure sector A depend on different amounts of material outputs
of infrastructure sector B over time.
Table F.1: Enumeration of dynamic physical interdependencies observed in the food andagriculture sector denoting infrastructure AA and infrastructure BB in the description ofeach example.
A B Description
Food and agriculture Food and agriculture Broiler chicken productionA depends on
poultry hatcheriesB for chick placement
at the beginning of every seven week
flock grow-out period.
76

Table F.1: Dynamic physical interdependencies (continued)
A B Description
Food and agriculture Transportation Broiler chicken productionA production
cycles last approximately 10 weeks where
the cycle begins with the placement of
live chicks to begin a seven week grow-
out period that ends when the mature
birds are processed. Cleaning and san-
itation tasks are completed in the final
three weeks of the cycle while the house
is empty, hence broiler chicken produc-
tion depends on truck transportationB to
deliver poultry feed from the feedmill to
poultry farms only during the seven week
grow-out period when the house is occu-
pied.
77

Table F.1: Dynamic physical interdependencies (continued)
A B Description
Food and agriculture Water Broiler chicken productionAproduction
cycles last approximately 10 weeks where
the cycle begins with the placement of
live chicks to begin a seven week grow-
out period that ends when the mature
birds are processed depends on water
supply and irrigation systemsB to deliver
water for drinking and cooling systems
on poultry farms housing a flock dur-
ing the seven week grow-out period when
they occupy the chicken houses..
Food and agriculture Energy Broiler chicken productionA depends on
electric power generationB to deliver un-
interrupted power for feeding, drinking,
monitoring, and cooling systems on poul-
try farms housing a flock during the
seven week grow-out period when they
occupy the chicken houses..
Food and agriculture Healthcare Broiler chicken productionA depends on
veterinary servicesB to test and monitor
flock health during the seven week grow-
out period when they occupy the chicken
houses..
78

Table F.1: Dynamic physical interdependencies (continued)
A B Description
Food and agriculture Healthcare Animal food manufacturingA depends
on pharmaceutical and medicine man-
ufacturingB for specific antibiotics and
vitamins necessary for individual flock
health and feed-mass conversion during
the seven week grow-out period when
they occupy the chicken houses..
Food and agriculture Food and agriculture Truck transportationA of market weight
broiler chickens must be caught and
loaded into trucks through processes
that depend on poultry catchingB infras-
tructures on the final day of the seven
week grow-out period when they occupy
the chicken houses..
Food and agriculture Food and agriculture Animal slaughtering and processingA of
market weight broiler chickens depends
on poultry catchingB infrastructures to
catch and load broiler flocks on the final
day of the seven week grow-out period
when they occupy the chicken houses..
79

Table F.1: Dynamic physical interdependencies (continued)
A B Description
Food and agriculture Water Rice farmingA depends on water sup-
ply and irrigation systemsB to deliver
ground water for irrigating crops from
May through September.
Food and agriculture Energy Rice farmingA depends on electric power
generationB and natural gas distribu-
tionB to power water pumps that irrigate
rice fields in the hottest months of June,
July, and August.
Food and agriculture Energy Grain millingA depends on electric power
generationB and natural gas distribu-
tionB to power fans and heaters dry-
ing wet rice harvested in October and
November to a moisture content of 14%.
Food and agriculture Information technology Grain millingA depends on data process-
ing, hosting, and related activitiesB to
monitor grain drying operations and re-
motely control equipment responsible for
the grain drying process.
80

Table F.1: Dynamic physical interdependencies (continued)
A B Description
Food and agriculture Transportation Grain millingA depends on truck trans-
portationB in September - November
to deliver large amounts of freshly har-
vested grain from the fields to grain
milling facilities or on-farm grain drying
and storage systems.
Transportation Food and agriculture Truck transportationA depends on grain
millingB efficiency in September -
November to efficiently unload grain de-
liveries preventing long queues that dis-
rupt truck flow from grain mills to farms.
Energy Food and agriculture Electric power generationA depends on
radio transmitters installed on crop pro-
ductionB irrigation pumps to stop irriga-
tion and divert power to other customers
during peak usage hours in the hot sum-
mer months.
81

Appendix G
Observed Dynamic Geographic Interdependencies
Recall a dynamic geographic infrastructure interdependence exists when the geographic or
spatial scales of interdependent infrastructure operations are altered by some process, event,
or circumstance.
Table G.1: Enumeration of dynamic geographic interdependencies observed in the food andagriculture sector denoting infrastructures A1 . . . An
A1 . . . An in each example’s description.
S = {A1, . . . , An} Description
Food and agricultureA1 . . . A3 ,
TransportationA4
The geographic scale of crop productionA1 ,
grain millingA2 , grain elevators and stor-
ageA2 , and truck transportationA4 infras-
tructures interdependence shrinks as on-
farm grain drying storage systems become
more prevalent.
Food and agricultureA1, A2 , ChemicalA3 ,
TransportationA4
The geographic scale of crop productionA1 ,
soil preparation and cultivationA2 , agricul-
tural chemical manufacturingA3 , and air
transportationA4 infrastructure interdepen-
dence increases as the herbicide dicamba
volatilizes during aerial application drifting
several miles to other fields and affecting
non-resistant crops.
82

Table G.1: Dynamic geographic interdependencies (continued)
S = {A1, . . . , An} Description
Food and agricultureA1 . . . A4 , HealthcareA5 ,
Emergency servicesA6 , Financial servicesA7
The geographic scale of crop productionA1 ,
animal productionA2 and food manufactur-
ingA3 laborers dependence on food and bev-
erage storesA4 , health care servicesA5 , emer-
gency medical transportation servicesA6 ,
and financial servicesA7 increases as rural
populations become smaller and local busi-
nesses close throughout the Arkansas delta.
Food and agricultureA1, A2 ,
TransportationA3
The geographic scale of animal produc-
tionA1 , animal food manufacturingA2 , and
truck transportationA3 infrastructure inter-
dependence increases when a feedmill is dis-
rupted and unable to manufacture feed cre-
ating dependence on neighboring feedmills
for the production and transportation of
feed.
83

Table G.1: Dynamic geographic interdependencies (continued)
S = {A1, . . . , An} Description
Food and agricultureA1, A2 ,
TransportationA3
The geographic scale of animal produc-
tionA1 , animal slaughtering and process-
ingA2 , and truck transportationA3 infras-
tructure interdependence increases when a
animal slaughtering and processing facility
is disrupted and unable to operate creating
dependence on neighboring facilities for an-
imal slaughtering and processing.
Food and agricultureA1 . . . A3 ,
TransportationA4, A5
The geographic scale of crop productionA1 ,
grain millingA2 , grain elevators and stor-
ageA3 , truck transportationA4 , and rail
transportationA5 infrastructure interdepen-
dence increases when a grain mill is dis-
rupted and unable to operate creating de-
pendence on neighboring grain mills to mill,
store, and distribute harvested grain.
84

Table G.1: Dynamic geographic interdependencies (continued)
S = {A1, . . . , An} Description
Food and agricultureA1, A2 ,
TransportationA3
The geographic scale of food manufac-
turingA1 , refrigerated storageA2 and truck
transportationA3 infrastructure interdepen-
dence increases when a food manufacturing
plant is disrupted and unable to operate cre-
ating dependence on neighboring manufac-
turing plants and storage facilities to man-
ufacture, store, and distribute products.
Food and agricultureA1 . . . A4 , WaterA5 ,
TransportationA6
The geographic scale of animal pro-
ductionA1 , food manufacturingA2 , animal
slaughtering and processingA3 , animal food
manufacturingA4 , water treatment and dis-
tributionA5 , and truck transportationA6 in-
frastructure interdependence increases as
manufacturing facilities are unable to ex-
pand operations or increase productivity
when municipal water utilities are unable to
process higher volumes of wastewater.
85

Table G.1: Dynamic geographic interdependencies (continued)
S = {A1, . . . , An} Description
Food and agricultureA1 , HealthcareA2 . . . A4 ,
Emergency servicesA5
The geographic scale of animal produc-
tionA1 , veterinary servicesA2 , pharmaceuti-
cal and medicine manufacturingA3 , health
care servicesA4 , and government emergency
planningA5 infrastructure interdependence
increases as pathogen-carrying migratory
birds infect animal flocks requiring veteri-
nary testing and epidemic prevention, and
emergency services planning and health care
services if the pathogens infect human pop-
ulation.
86

Table G.1: Dynamic geographic interdependencies (continued)
S = {A1, . . . , An} Description
Food and agricultureA1, A2 , Criti-
cal manufacturingA3, A4 , ChemicalA5 ,
CommunicationsA6 , Information
technologyA7
The geographic scale of agricultural pro-
ductionA1 , agricultural research and devel-
opmentA2 , agricultural implement manufac-
turingA3 , food product machinery manu-
facturingA4 , agricultural chemical manufac-
turingA5 , wireless telecommunications car-
riersA6 , and data processing, hosting, and
related servicesA7 infrastructure interdepen-
dence increases as advances in information
technology and communication create cy-
bersecurity vulnerabilities in food and agri-
culture systems exploitable from remote lo-
cations.
87

Appendix H
Observed Deadline Interdependencies
Recall a deadline infrastructure interdependence exists when infrastructure A depends on
resources provided by infrastructure B by a deadline t.
Table H.1: Enumeration of deadline interdependencies observed in the food and agriculturesector denoting infrastructure AA and infrastructure BB in the description of each example.
A B t Description
Food and agriculture Transportation 10 hours Poultry productionA and
animal slaughtering and
processingA depends on
truck transportationB of
live birds from poul-
try farms to processing
plants as the birds lose
mass during transit and
perish if not processed
within 10 hours.
Food and agriculture Energy 24 hours Rice farmingA depends
on electric power gener-
ationB and natural gas
distributionB to power ir-
rigation pumps so that
no rice fields are not
flooded or irrigated for
longer than 24 hours.
88

Table H.1: Deadline interdependencies (continued)
A B t Description
Food and agriculture Healthcare 36 hours Animal productionA de-
pends on veterinary ser-
vicesB and pharmaceuti-
cal medicine manufactur-
ingB infrastructures for
testing and vaccinations
to stop disease spread
within 36 hours of detec-
tion.
Food and agriculture Energy 14 days Grain millingA depends
on electric power gener-
ationB and natural gas
distributionB infrastruc-
tures to dry grain to 14%
moisture content within
14 days of harvest.
Food and agriculture Dams 7 days Crop productionA de-
pends on water supply
and irrigation systemsB
infrastructure to allevi-
ate floodwaters in low-
lying fields before crops
drown in seven days.
89

Table H.1: Deadline interdependencies (continued)
A B t Description
Food and agriculture Chemical March 31 Soil preparation and
cultivationA depends on
agricultural chemical
manufacturingB so that
fertilizer and nutrients
may be sowed into the
fields by the end of
March before planting
begins.
Food and agriculture Food and agriculture June 30 Rice farmingA depends
on crop productionB in-
frastructure to cultivate
and distribute rice seeds
to be planted by June 30.
90

Table H.1: Deadline interdependencies (continued)
A B t Description
Food and agriculture Financial services January 31 Soil preparation and
cultivationA and crop
productionA depend on
credit servicesA and fund
disbursement by January
31 to purchase seed,
fertilizer, chemicals, and
other inputs necessary
for the upcoming crop
year.
91

Appendix I
Observed Delay Interdependencies
Recall a delay infrastructure interdependence exists when the operational state of infrastruc-
ture A experiences a delayed onset disruption δt time after a disruption in infrastructure
B.
Table I.1: Enumeration of delay interdependencies observed in the food and agriculturesector denoting infrastructure AA and infrastructure BB in the description of each example.
A B δt Description
Food and agriculture Transportation 24 hours Poultry productionA experi-
ences a delayed onset disrup-
tion when the buffering stock
of animal feed is depleted, ap-
proximately 24 hours, after a
disruption in the truck trans-
portationB infrastructure re-
sponsible for delivering feed to
poultry houses.
Food and agriculture Energy 24 hours Poultry productionA experi-
ences a delayed onset disrup-
tion when the buffering stock
of diesel fuel powering a backup
generator is depleted, approxi-
mately 24 hours, after a disrup-
tion in the electric power gen-
erationB infrastructure.
92

Table I.1: Delay interdependencies (continued)
A B δt Description
Food and agriculture Water 24 hours Poultry productionA experi-
ences a delayed onset disrup-
tion when the buffering stock
of reserve-tank water, approx-
imately 24 hours, after a dis-
ruption in the water supply and
irrigationB infrastructure.
Water Food and agriculture years Water supply and irrigation
systemsA experiences a delayed
onset disruption when pollu-
tion is detectable in the wa-
ter supply, up to several years
after polluting begins, after a
disruption in the animal pro-
ductionB, crop productionB,
and food manufacturingB in-
frastructures allows the pollu-
tants to reach a water supply.
93
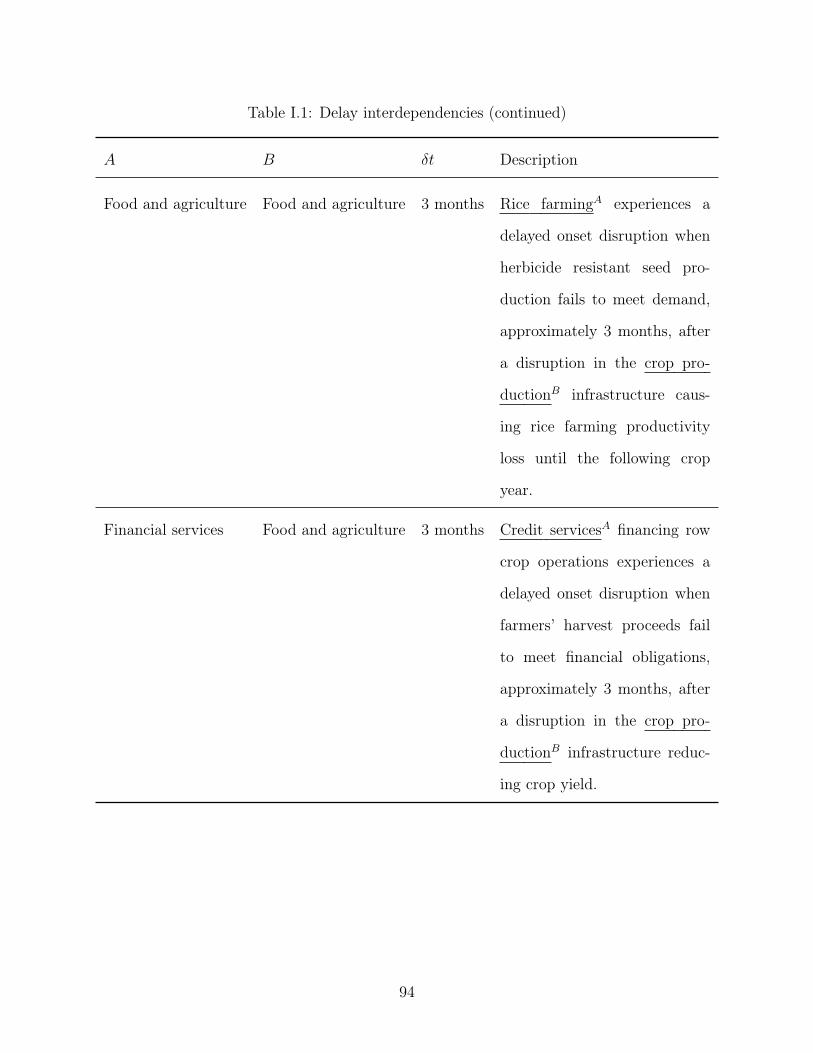
Table I.1: Delay interdependencies (continued)
A B δt Description
Food and agriculture Food and agriculture 3 months Rice farmingA experiences a
delayed onset disruption when
herbicide resistant seed pro-
duction fails to meet demand,
approximately 3 months, after
a disruption in the crop pro-
ductionB infrastructure caus-
ing rice farming productivity
loss until the following crop
year.
Financial services Food and agriculture 3 months Credit servicesA financing row
crop operations experiences a
delayed onset disruption when
farmers’ harvest proceeds fail
to meet financial obligations,
approximately 3 months, after
a disruption in the crop pro-
ductionB infrastructure reduc-
ing crop yield.
94

Appendix J
Observed Human, Economic, and Natural Resource Interdependencies
Recall a human, economic, and natural resource infrastructure interdependence exists when
the operational state of infrastructure A is affected by changes in human, economic, or
natural resources provided by infrastructure B.
Table J.1: Enumeration of human, economic, and natural resource interdependencies ob-served in the food and agriculture sector denoting infrastructure AA and infrastructure BB
in the description of each example.
A B Description
Financial services Food and agriculture Availability and accessibility of agricul-
tural credit servicesA to finance row crop
operations, equipment purchases, and
farmers’ living expenses on an annual ba-
sis is affected by crop production harvest
volumes.
Food and agriculture Energy Grain crop production planting decisions
are affected by petroleum merchants in
OPEC due to a positive correlation of
grain prices and commodity oil prices.
Food and agriculture Information technology Crop production labor force within the
food and agriculture sector is becom-
ing smaller due to increased productivity
from information technology innovations
allowing farmers to work at older ages.
95

Table J.1: Human, economic, and natural resource interdependencies interdependencies (con-tinued)
A B Description
Food and agriculture Transportation Grain milling infrastructures require in-
creased volumes of barge and truck
transportation affected by the increased
maintenance costs of rail transportation.
Food and agriculture Water A majority of irrigation for row crop pro-
ductionA draws large amounts of water
from groundwater aquifers and surface
water reservoirsB.
Food and agriculture Commercial facilties The average age of row crop producersA
continues to increase as populations in
rural areas continue to decline as resi-
dents leave in response to fewer commer-
cial faciltiesB operating in typically poor,
rural areas that ultimately leads to gen-
erational information loss as fewer fami-
lies are able to maintain farm production
with sufficient financial support through
the generations.
96

Appendix K
Institutional Review Board Protocol
97

98

99

100

101

109 MLKG • 1 University of Arkansas • Fayetteville, AR 72701-1201 • (479) 575-2208 • Fax (479) 575-6527 • Email [email protected] The University of Arkansas is an equal opportunity/affirmative action institution.
Office of Research Compliance Institutional Review Board
August 31, 2017
MEMORANDUM
TO: Sarah Nurre Kelly Sullivan Benjamin Runkle
FROM: Ro Windwalker IRB Coordinator
RE: New Protocol Approval
IRB Protocol #: 1708017910 (previously 17-07-012)
Protocol Title: Classification of the Interdependencies in the Food and Agriculture Critical Infrastructure Sector in Arkansas
Review Type: EXEMPT EXPEDITED FULL IRB
Approved Project Period: Start Date: 08/31/2017 Expiration Date: 08/24/2018
Your protocol has been approved by the IRB. Protocols are approved for a maximum period of one year. If you wish to continue the project past the approved project period (see above), you must submit a request, using the form Continuing Review for IRB Approved Projects, prior to the expiration date. This form is available from the IRB Coordinator or on the Research Compliance website (https://vpred.uark.edu/units/rscp/index.php). As a courtesy, you will be sent a reminder two months in advance of that date. However, failure to receive a reminder does not negate your obligation to make the request in sufficient time for review and approval. Federal regulations prohibit retroactive approval of continuation. Failure to receive approval to continue the project prior to the expiration date will result in Termination of the protocol approval. The IRB Coordinator can give you guidance on submission times. This protocol has been approved for 50 participants. If you wish to make any modifications in the approved protocol, including enrolling more than this number, you must seek approval prior to implementing those changes. All modifications should be requested in writing (email is acceptable) and must provide sufficient detail to assess the impact of the change. If you have questions or need any assistance from the IRB, please contact me at 109 MLKG Building, 5-2208, or [email protected].
102