Classified Service Compensation Report 20092009 COMPENSATION REPORT 5 Our research indicates that...
12
COMPENSATION REPORT 2009 CLASSIFIED SERVICE
Transcript of Classified Service Compensation Report 20092009 COMPENSATION REPORT 5 Our research indicates that...
COMPENSATION REPORT2009
CLASSIFIED SERVICE


Table of Contents 1
Personnel Act & Compensation Philosophy 2
Status of the State of NM’s Compensation System & Pay Administration 3
National Trends 5
Salary Survey 7
STATELEADERSHIP
STATE PERSONNELOFFICE
STATE PERSONNELBOARD MEMBERS
Bill Richardson, Governor
Diane Denish, Lieutenant Governor
Sandra K. Perez, Director
Reese Fullerton, Deputy Director
Dominic Garcia, Chief of Staff
Justin Najaka, State Director of Compensation
Mary Lou Cameron, Chair
Ray Camp, Vice Chair
Robert Guillen
Gene Valdes
Michelle Welby

2 NEW MEXICO STATE PERSONNEL OFFICE
The purpose of the Personnel Act is to establish for New Mexico a system of personnel administration based solely on qualification and ability, which will provide greater economy and efficiency in the management of state affairs (10-9-2 NMSA 1978). The Act
created a Personnel Board of five private citizens appointed by the Governor and confirmed by the Senate, who serve
staggered terms of five years each. One of its major responsibilities is to promulgate rules to establish a compensation plan.
The State Personnel Board Rule Subsection E of 1.7.4.8 NMAC requires the Board to adopt and submit a compensation report
that includes a summary of the status of the classified pay system and the results of the annual compensation survey that
includes total compensation to the governor and the Legislative Finance Committee by the end of each calendar year. This
shall serve as the official report.
Compensation PhilosophyThe State of New Mexico’s compensation philosophy, as stated in the existing Classified Service Pay Plan, reads as follows:
“The Compensation System (salary and benefits) for classified state government employees will be structured to
support the mission of State Government and be consistent with State statutes to provide a high level of responsive
service in meeting the needs of its citizens. The foundation of this structure is to reward employees for their specific
contributions to the achievement of organizational goals and objectives. Fiscal responsibility requires that this
approach be administered in a consistent manner throughout the State’s classified service based on its financial
capabilities.”
32009 COMPENSATION REPORT
Studies conducted by WorldatWork, the Employee Benefit Research Institute, the Society for Human Resource Manage-ment, International Personnel Management Association, Na-tional Association of State Personnel Executives, HayGroup, Towers Perrin, Watson Wyatt Worldwide, and numerous other organizations reveal that employer-provided employ-ee benefits remain an important part of the total rewards package in attracting and retaining workers.
Total compensation can be defined as “the complete reward/recognition package for employees, including all forms of money, benefits, perquisites, services and in-kind payments.” The State of New Mexico provides a competitive employee benefit package that includes: employer-paid medical insurance contributions, pension (retirement) contributions, paid leave allowances for vacation days, sick days and paid holidays. Additionally, state employees can take advantage of a Section 457, Deferred Compensation Plan that allows for contributions to a tax-deferred savings program that can be used to supplement their retirement plan.
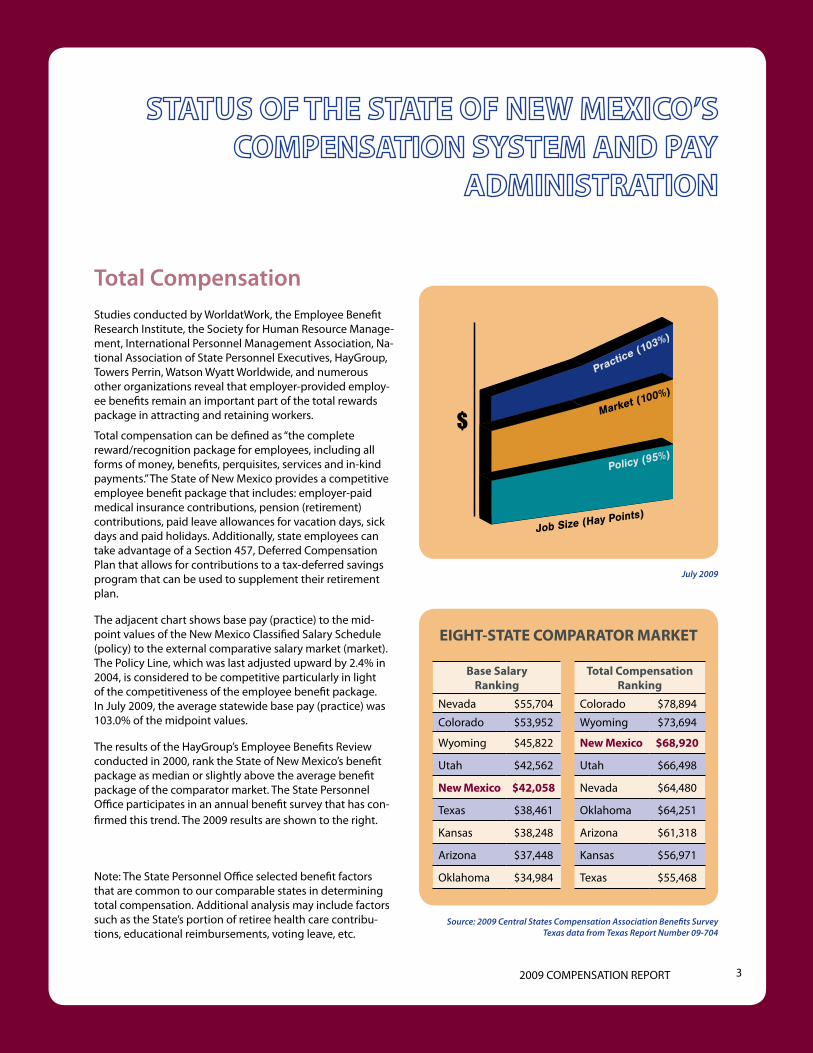
The adjacent chart shows base pay (practice) to the mid-point values of the New Mexico Classified Salary Schedule (policy) to the external comparative salary market (market). The Policy Line, which was last adjusted upward by 2.4% in 2004, is considered to be competitive particularly in light of the competitiveness of the employee benefit package. In July 2009, the average statewide base pay (practice) was 103.0% of the midpoint values.
The results of the HayGroup’s Employee Benefits Review conducted in 2000, rank the State of New Mexico’s benefit package as median or slightly above the average benefit package of the comparator market. The State Personnel Office participates in an annual benefit survey that has con-firmed this trend. The 2009 results are shown to the right.
Note: The State Personnel Office selected benefit factors that are common to our comparable states in determining total compensation. Additional analysis may include factors such as the State’s portion of retiree health care contribu-tions, educational reimbursements, voting leave, etc.
Total Compensation
$
July 2009
EIGHT-STATE COMPARATOR MARKET
Base Salary Ranking
Nevada $55,704
Colorado $53,952
Wyoming $45,822
Utah $42,562
New Mexico $42,058
Texas $38,461
Kansas $38,248
Arizona $37,448
Oklahoma $34,984
Total Compensation Ranking
Colorado $78,894
Wyoming $73,694
New Mexico $68,920
Utah $66,498
Nevada $64,480
Oklahoma $64,251
Arizona $61,318
Kansas $56,971
Texas $55,468
Source: 2009 Central States Compensation Association Benefits SurveyTexas data from Texas Report Number 09-704

4 NEW MEXICO STATE PERSONNEL OFFICE
Sample based on Presbyterian family coverage in conjunction with family dental, vision, life and disability coverage.
Sample Total Classified Compensation Calculation
Average Base Salary: $42,057.60
Employer Sponsored Benefits:
FICA/Medicare (6.2% / 1.45% of gross salary) $ 3,217.41
PERA (15.09% of gross salary) 6,346.49
Vacation (96 hours per year) 1,941.12
Sick (96 hours per year) 1,941.12
Holiday (80 hours per year) 1,617.60
Insurance (less than $50,000) 11,636.56
Personal Day (8 hours per year) 161.76
Total Benefits $26,862.06
Total Compensation (Salary + Benefits): $68,919.66
NOTE: The State Personnel Office selected benefit factors that are common to our comparable states in determining total compensation. Additional analysis may include factors such as the State’s portion of retiree health care contributions, educational reimbursements, voting leave, etc.
Source: Average Base Salary obtained from PeopleSoft Report NMS047HR–Profile of Personnel by Class—Statewide Classified 7/1/2009
Personal Day: $161.76 (0.23%)
Insurance: $11,636.56 (16.88%)
Holiday: $1,617.60 (2.35%)
Sick: $1,941.12 (2.82%)
Vacation: $1,941.12 (2.82%)
PERA: $6,346.49 (9.21%)
FICA/Medicare: $3,217.41 (4.67%)
Average Base Salary
$42,058(61.02%)
AVERAGE TOTAL COMPENSATION

52009 COMPENSATION REPORT
Our research indicates that most organizations plan to adjust their salary structures in 2010 by an average of 1.9% (ranging from 0.5% to 2.9%) and to provide merit increases of approximately 2.5%. Survey sources indicate that orga-nizations as a whole across all industries plan on providing increases that range from 0.8% to 3.0%. WorldatWork indi-cates that U.S. employers plan on providing an average 2.8% general salary increase (based on survey responses from all U.S. regions and industries). In the Major Industry Grouping subset of WorldatWork data, Public Administration Sector employers predict an average general increase of 1.8% in 2010, which is a drop from the actual 2009 salary increase of 2.4%. This estimate stands in stark contrast to the 2009 Con-sumer Price Index for All Urban Consumers (CPI-U) of -1.3%. For the first time since implementation of the Cost of Living Adjustment (COLA) in 1975, the Social Security Administra-tion announced that it will not provide any increase adjust-ment to Social Security and Supplemental Security Income benefits for more than 57 million Americans because of low consumer prices. In October 2009, the Bureau of Labor Statistics reported the seasonally adjusted unemployment rate at 10.2%, a 26 year high.
In light of the optimistically high national salary increase trends for 2010, those figures reflect a different strategy that many companies are shifting to, according to Incentive Magazine. Even as organizations shed employees to make it through the recession, many are emphasizing retention of top talent as a major concern. Keeping salaries competi-tive is still a primary tool to retain employees. In addition to increasing salaries, employers are also reviewing and en-hancing their benefits package by taking a more holistic ap-proach in developing employee recognition programs fea-turing rewards and bonuses for a job well done. In a down economy, organizations can take advantage of growth and development strategies, both internal and external, to prepare those employees for future success. And finally, management’s proactive approach to healthy work and life balance can help employees set a realistic expectation of workloads, thereby reducing stress and the likelihood of becoming unhappy and looking for greener pastures.
Benefits premiums have continued to rise faster than wages and overall inflation, as noted by a Kaiser Family Founda-tion survey. Family premiums for 2009 rose 5%, during the 12-month period ending in April. Nationally, employers will see an estimated increase in their medical benefit expen-ditures of nearly 7% in 2010. The effect of ongoing cost increases with the current economic climate are creating significant affordability challenges for both employers and employees, according to data from Towers Perrin. The study
indicates that many employers are preparing to accept new approaches to benefit management that may potentially alter the current model of health care delivery.
The State of New Mexico continued to fund the majority of healthcare premiums; however, employees have realized the impact of out-of-pocket costs in the form of higher co-payments and deductibles and not from premium increases.
In a cost cutting measure, 2009 New Mexico State Legis-lature approved House Bill 854 temporarily shifting the cost of 1.5% Public Employee Retirement contribution to member employees. This increased each employee’s contri-bution from 7.42% to 8.92% of salary while decreasing the employer contribution from 16.59% to 15.09%.
INDUSTRY TRENDS AND RELATED DATA SOURCES
Data Source StructureSalary
Increase
WorldatWork 1.8% 2.8%
CSCA* 0.5% .81%
CompData — 2.7%
Hay Group 2.5% 3.0%
Mercer — 2.9%
Watson Wyatt 2.0% 2.8%
Hewitt Associates — 2.7%
BLR — 1.8%
IOMA 2.9% 2.5%
ORC Worldwide — 3.0%
Social Security Administration — 0%
*2009 Central States Compensation Association survey of 23 reporting states indicates that only four states project structure
adjustments (averaging 2.9%) and only five project salary budget increases (averaging 3.7% [North Dakota at 6.9%]).

6 NEW MEXICO STATE PERSONNEL OFFICE
Weathering the Financial Storm
Layoffs Buyouts
Elimination of Vacant Positions
Hiring Freeze Furloughs
Early Retirement Incentives
Retraction of Planned Pay Raises Pay Cuts
AL
AZ
CA
CO
DE
FL
IN
IA
KS
KY
LA
ME
MA
MI
MO
MT
NM
NC
OK
OR
PA
SC
TN
UT
WA
WV
WI
WY
Source: As reported by NASPE: Weathering the Financial Storm Survey Results November 2, 2009
72009 COMPENSATION REPORT
The purpose of conducting an annual salary survey is to determine the competitiveness of the salary structure (Pay Bands and Pay Opportunities) and the State’s current pay practice (actual pay) with the average pay of the State’s comparative markets and to determine the competitiveness of benefits (insurance, leave, etc.) to the markets. The State Personnel Office uses numerous key surveys to collect salary data.
Annual Salary Survey Purpose
The effectiveness of an organization’s pay system can be measured by the extent to which pay is competitive with others in the market (for the same benchmark jobs). The State Personnel Office’s compensation philosophy has advo-cated an objective of maintaining external competitiveness.
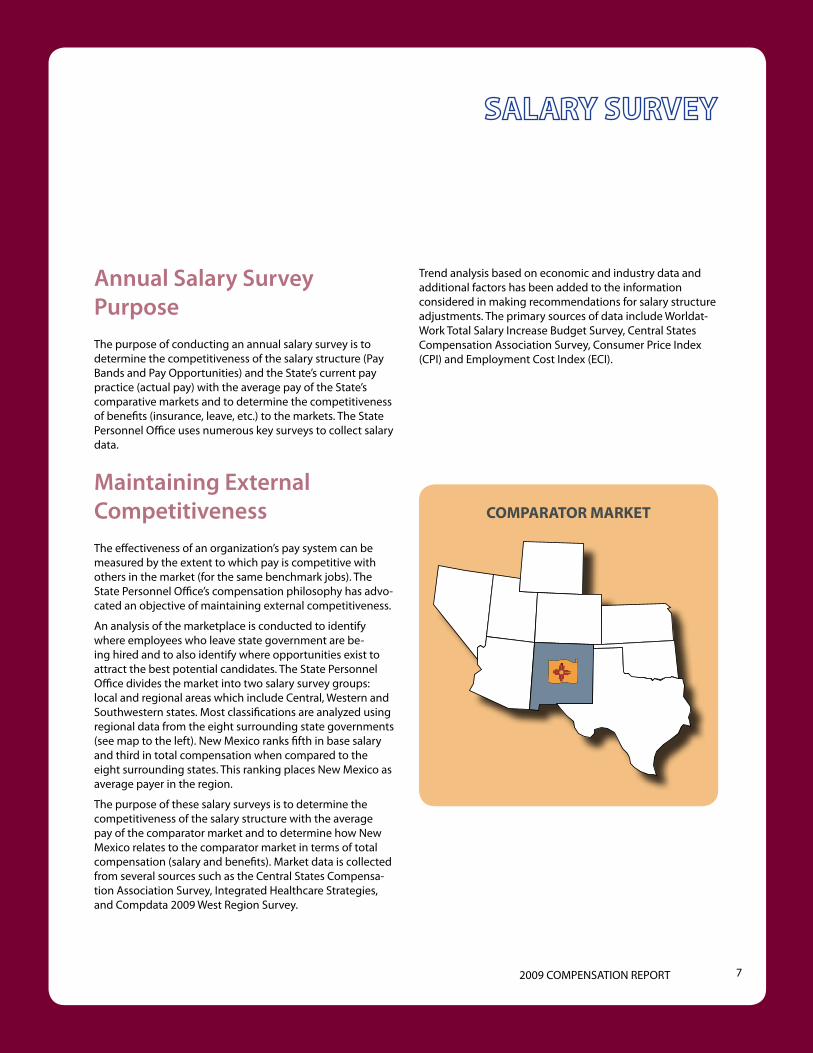
An analysis of the marketplace is conducted to identify where employees who leave state government are be-ing hired and to also identify where opportunities exist to attract the best potential candidates. The State Personnel Office divides the market into two salary survey groups: local and regional areas which include Central, Western and Southwestern states. Most classifications are analyzed using regional data from the eight surrounding state governments (see map to the left). New Mexico ranks fifth in base salary and third in total compensation when compared to the eight surrounding states. This ranking places New Mexico as average payer in the region.
The purpose of these salary surveys is to determine the competitiveness of the salary structure with the average pay of the comparator market and to determine how New Mexico relates to the comparator market in terms of total compensation (salary and benefits). Market data is collected from several sources such as the Central States Compensa-tion Association Survey, Integrated Healthcare Strategies, and Compdata 2009 West Region Survey.
Maintaining External Competitiveness
Trend analysis based on economic and industry data and additional factors has been added to the information considered in making recommendations for salary structure adjustments. The primary sources of data include Worldat-Work Total Salary Increase Budget Survey, Central States Compensation Association Survey, Consumer Price Index (CPI) and Employment Cost Index (ECI).
COMPARATOR MARKET
8 NEW MEXICO STATE PERSONNEL OFFICE
Salary SurveysThe benchmark classifications identified for analysis as part of the salary survey were selected based on the following criteria:
● they represent a large sample of state employees;
● they represent a variety of job occupations (clerical, administrative, trade, counseling, law enforcement, etc.); and
● they represent a range of levels in job complexity (mea-sured in job content points).
Central States Compensation Association Sal-ary Survey: The State Personnel Office participates in a comprehensive annual salary survey of benchmark job clas-sifications sponsored by the Central States Compensation Association. The Association was established in 1984 for the purpose of improving the validity of job matches and accu-racy of data in salary surveys among the states and reducing the number of individual surveys exchanged among the states on an annual basis. This year 23 state governments participated in this annual survey. New Mexico identified job matches for 238 of the 245 benchmark classifications in the survey. Over 535,289 state workers are represented in this survey.
CompData Survey (West Region): The 2009 survey contains 328 jobs in the states of Arizona, California, Colo-rado, Idaho, Montana, Nevada, New Mexico, Oregon, Utah, Washington and Wyoming. A total of 652 organizations submitted data covering 733,439 employees. CompData Surveys beginning in 2009 redesigned their compensation data to report compensation as an industry-specific and re-gional resource and has increased the number of organiza-tions to create a larger more comprehensive data of current pay and benefit information.
Comparative Market Move-ment/Structure AdjustmentsThe State Personnel Office analyzes industry and economic data from several key sources:
● WorldatWork Total Salary Increase Budget Survey: WorldatWork is a global, not-for-profit professional association with more than 23,000 compensation, benefits, and human resource professionals. Founded in 1955, WorldatWork is dedicated to knowledge leadership in compensation, benefits and total rewards disciplines associated with attracting, retaining, and motivating employees. For over three decades, the Total Salary Increase Budget Survey has been relied upon as the foundation from which corporations and government agencies project their annual salary budget increases. This report is acknowledged as one of the longest running (36 years) and most comprehensive salary surveys and being the largest salary increase budget survey of its kind (2,743 participating organizations representing approximately 13.6 million employees). In July 2009, projections for 2010 indicated participating organizations plan to adjust salary structures upward by an average 1.8% and provide average merit increases of approximately 2.8%. Survey results indicate that 80% of organizations provided a base salary increase in 2009—which is down by 10% from last year. Increased focus on variable pay appears to be offsetting base salary increases, with approximately 80% of organizations offering some sort of variable pay this year (down from 81% last year). Supporting data may be found at www.worldatwork.org.
● Central States Compensation Association: Data from this association shows that median salaries in the survey benchmarks increased approximately 0.5% and average salaries increased 0.8%. Median salaries are a reliable indicator of how much salary structures have changed from the previous survey period. Average salary increases indicate the average (actual) increase in pay employees received. Typically, average salary increases outpace median increases.
● Compdata Survey (West Region): The 2009 survey suggests that participating organizations plan to provide salary increases averaging 2.7%. Supporting data may be found at www.compdatasurveys.com.
● The HayGroup: Hay consultants are reporting clients plan to adjust their salary structures 2.5% and provide average salary increases of 3.0%. These figures encompass over 1,700 organizations representing over 3 million employees. Supporting data may be found at www.haygroup.com.
● Mercer: The 2009/2010 U.S. Compensation Planning Survey, which gathered responses from more than 950 employers and reflected pay practices for nearly 12
Data referenced in this document were compiled through September/October 2009. Due to the recent economic downturn many sources are working with their clients to revise their projections. Revised data
has been included where available.
DISCLAIMER

92009 COMPENSATION REPORT
million workers, indicated organizations plan to provide salary increases of 2.9% next year. Supporting data may be found at www.mercerhr.com.
● Watson Wyatt: The Watson Wyatt Compensation practice indicates that organizations plan to adjust their salary structures by 2.0% and provide 2.8% average salary increases next year. Supporting data may be found at www.watsonwyatt.com.
● Hewitt Associates: Hewitt Associates Compensation practice indicates that organizations plan on providing 2.7% average salary increases next year. Supporting data may be found at www.hewittassociates.com.
● Compensation.BLR.com: Survey results show that the planned increases for both merit and general raises have increased 1.8% for 2010. Supporting data may be found at www.compensation.blr.com.
● IOMA: The Report on Salary Surveys published by IOMA’s survey group indicates that employers plan to adjust their salary structures by 2.9% and provide 2.5% average salary increases next year. Supporting data may be found at www.ioma.com.
● ORC Worldwide: The 2009 US Salary Budgets and Structure Adjustment Survey forecasts that organizations plan to provide 3.0% average salary increases. This survey contains responses from more than 496 organizations. Supporting data may be found at www.orcworldwide.com.
Economic DataEmployment Cost Index (ECI)The ECI measures the changes in compensation costs, which include wages, salaries and employer costs for employee benefits. Annual compensation costs for civilian workers increased 1.5% for the year that ended September 2009. This was much lower than the 2.9% increase for the year that ended September 2008. Annual compensation costs for state and local government workers increased 3.2% for the year that ended September 2009. This is down from 3.4% for the year that ended September 2008. Effective April 2007, the methodology for collecting and reporting Employment Cost Index (ECI) changed, which has a slight impact on trending ECI historical data. This is not the result of a change in what an establishment or the employees have been do-ing, but instead stems from a reclassification based on the new hierarchy. Supporting data may be found at www.bls.gov.
Consumer Price Index—All Urban Consumers(CPI—U)The CPI is the most widely cited index number for a price level that may be used as an indicator of the cost of living compiled by the Bureau of Labor Statistics of the US Depart-ment of Labor. It is an indicator of the changing purchasing power of the dollar. Specifically, it measures the price chang-
ECI & CPIECONOMIC DATA
(% for 12 months ended September)
Data referenced in this document were compiled through September/October 2009. Due to the recent economic downturn many sources are revising data,
which has been included where available.
YearECI
(Civilian)
ECI (State & Local
Govt.) CPI-U
1994 3.2 3.0 2.6
1995 2.7 3.0 2.8
1996 2.8 2.5 3.0
1997 3.0 2.4 2.3
1998 3.7 3.0 1.6
1999 3.1 2.9 2.2
2000 4.3 3.3 3.4
2001 4.1 4.4 2.8
2002 3.7 3.8 1.6
2003 3.9 3.6 2.4
2004 3.8 3.4 2.5
2005 3.0 3.9 4.7
2006 3.3 4.1 2.1
2007 3.3 4.3 2.8
2008 2.9 3.4 4.9
2009 1.5 3.2 -1.3
es of items in a fixed “market basket” of goods and services purchased by a hypothetical average family. The CPI-U (which covers 80% of the population of the United States) decreased 1.3% for the 12 prior months that ended Septem-ber 2009. The September index of 215.97 (not seasonally adjusted) (1982-84 = 100) was down from 218.78 (not sea-sonally adjusted) in the 12 months that ended September 2008. Supporting data may be found at www.bls.gov.

2600 Cerrillos Road, PO Box 26127, Santa Fe, NM 87505 p (505) 476-7759 f (505) 476-7764 www.spo.state.nm.us