Classification and Clustering of Parkinson’s and Healthy...
12
INT.J.BIOAUTOMATION, 2017, 21(1), 19-30 19 Classification and Clustering of Parkinson’s and Healthy Control Gait Dynamics Using LDA and K-means Akash Kumar Bhoi Department of Electrical & Electronics Engineering Sikkim Manipal Institute of Technology Sikkim Manipal University, India E-mail: [email protected] Received: August 05, 2016 Accepted: February 16, 2017 Published: March 31, 2017 Abstract: Problem arises when distinct morphologic changes are not seen in the electromyographic waveform of normal (control) and Parkinson’s subjects during data interpretation. This study aimed to ascertain whether neuro-degenerative disease, e.g., Parkinson’s disease (PD) affects gait and mobility with comparison to the healthy control. Fifteen subjects (left and right foot) from both the groups are selected where the signal is obtained using force-sensitive resistors (Gait Dynamics in Neuro-Degenerative Disease Data Base). The proposed methodology is divided into five parts: (i) 1 hr recording of gait dynamics data are segmented into three intervals (0-20 min, 20-40 min and 40-60 min); (ii) Normalization of each segmented data (20 min), i.e., preprocessing (noise and baseline drift removal); (iii) Then the frequency domain powers for each segments are calculated which further introduced features in the successive stages for classification and clustering; (iv) The classification of Parkinson’s disease and healthy control group is accomplished using Linear Discriminant Analysis (LDA); (v) Clustering of these two classes is performed using K-means clustering algorithm taking same sets of features. Certainly the classification and clustering results signify the classification probability using frequency domain power of gait dynamics/electromyogram signal. The re-substitution error of LDA during classification is found to be 21.11%. Moreover, significant and precise classification and clustering results are achieved between PD and control taking left-right foot frequency domain power as classification features. Keywords: Parkinson’s disease, Healthy control, Gait dynamics, Power in frequency domain, Linear discriminant analysis, K-means clustering. Introduction Gait analysis is used for assessing locomotors disabilities and evaluating corrective and therapeutic procedures [34]. As each muscle provides a specific function, the basic information to be gained by dynamic electromyography is phasing within the gait cycle [29]. Kugler [20] had described a technique which automatically classified between Parkinson’s disease (PD) patients and healthy controls using surface electromyographic (EMG) signals from standardized gait tests. Gait analysis reveals a characteristic pattern of leg muscle activation in PD, increased tibialis anterior activity during the swing phase and reduced amplitude of the EMG response and poor modulation in the leg extensor muscles during the stance phase [8, 9]. Gait disorders in PD may be either prominent or, even in the advanced stages of the disease, mild. Certain clinical features are more likely to be associated with disturbed gait: rapid course of motor symptoms [3]. Adaptability-of-Gait test has potential to identify a new gait performance between severe PD, moderate PD and age-matched controls [33]. Roland et al. [32] proposed a study to use EMG to dissociate frailty phenotypes in females with PD during routine daily activities and provide insight into how PD associated motor declines contributes to frailty and functional decline. Hausdorff et al. [15] have studied the detailed insight on
Transcript of Classification and Clustering of Parkinson’s and Healthy...

INT.J.BIOAUTOMATION, 2017, 21(1), 19-30
19
Classification and Clustering of Parkinson’s
and Healthy Control Gait Dynamics
Using LDA and K-means
Akash Kumar Bhoi
Department of Electrical & Electronics Engineering
Sikkim Manipal Institute of Technology
Sikkim Manipal University, India
E-mail: [email protected]
Received: August 05, 2016 Accepted: February 16, 2017
Published: March 31, 2017
Abstract: Problem arises when distinct morphologic changes are not seen in the
electromyographic waveform of normal (control) and Parkinson’s subjects during data
interpretation. This study aimed to ascertain whether neuro-degenerative disease, e.g.,
Parkinson’s disease (PD) affects gait and mobility with comparison to the healthy control.
Fifteen subjects (left and right foot) from both the groups are selected where the signal is
obtained using force-sensitive resistors (Gait Dynamics in Neuro-Degenerative Disease Data
Base). The proposed methodology is divided into five parts: (i) 1 hr recording of gait dynamics
data are segmented into three intervals (0-20 min, 20-40 min and 40-60 min);
(ii) Normalization of each segmented data (20 min), i.e., preprocessing (noise and baseline
drift removal); (iii) Then the frequency domain powers for each segments are calculated which
further introduced features in the successive stages for classification and clustering;
(iv) The classification of Parkinson’s disease and healthy control group is accomplished using
Linear Discriminant Analysis (LDA); (v) Clustering of these two classes is performed using
K-means clustering algorithm taking same sets of features. Certainly the classification and
clustering results signify the classification probability using frequency domain power of gait
dynamics/electromyogram signal. The re-substitution error of LDA during classification is
found to be 21.11%. Moreover, significant and precise classification and clustering results are
achieved between PD and control taking left-right foot frequency domain power as
classification features.
Keywords: Parkinson’s disease, Healthy control, Gait dynamics, Power in frequency domain,
Linear discriminant analysis, K-means clustering.
Introduction Gait analysis is used for assessing locomotors disabilities and evaluating corrective and
therapeutic procedures [34]. As each muscle provides a specific function, the basic information
to be gained by dynamic electromyography is phasing within the gait cycle [29]. Kugler [20]
had described a technique which automatically classified between Parkinson’s disease (PD)
patients and healthy controls using surface electromyographic (EMG) signals from
standardized gait tests. Gait analysis reveals a characteristic pattern of leg muscle activation in
PD, increased tibialis anterior activity during the swing phase and reduced amplitude of the
EMG response and poor modulation in the leg extensor muscles during the stance phase [8, 9].
Gait disorders in PD may be either prominent or, even in the advanced stages of the disease,
mild. Certain clinical features are more likely to be associated with disturbed gait: rapid course
of motor symptoms [3]. Adaptability-of-Gait test has potential to identify a new gait
performance between severe PD, moderate PD and age-matched controls [33]. Roland et al.
[32] proposed a study to use EMG to dissociate frailty phenotypes in females with PD during
routine daily activities and provide insight into how PD associated motor declines contributes
to frailty and functional decline. Hausdorff et al. [15] have studied the detailed insight on

INT.J.BIOAUTOMATION, 2017, 21(1), 19-30
20
variation and resemblance among the proteins sequences of patients having Alzheimer’s,
Parkinson’s and Huntington’s diseases. Paul et al. [28] have analyzed the impacts of nsSNPs
on structure and function of Paraxonase 1 using different bioinformatics tools which helps in
identifying deleterious non-synonymous single nucleotide polymorphisms (nsSNPs) in a
disease related gene. Cook et al. [6], DeLuca et al. [7] and Lofterod et al. [23] stated about the
fundamental research on gait control and the associated mechanisms. They also discussed how
gait analysis evolved as a clinical tool for surgical planning on cerebral palsy cases.
Pollo [31] assessed the efficacy of surgical interventions, and evaluated the rate of deterioration
in progressive disorders to evaluate the impact of medication and orthopedic aids. Carvalho [5]
and Sousa [36] identified gait patterns, speed of walking, mechanical work made by the main
muscular groups during the diverse phases, etc..
Bazner et al. [4], Frenkel-Toledo et al. [11] and Yogev et al. [38] described the computerized
force-sensitive system which was used to quantify gait cycle timing, specifically the swing time
and the stride-to-stride variability of swing time. The system measures the forces underneath
the foot as a function of time.
The gait patterns can be influenced by almost any variable such as age, weight, diseases,
strength, walking surface, etc. [37]. Usually the gait patterns are obtained from force platforms
that measure the ground reaction forces (GRF), equal and opposite to the ones made by the foot
on the ground. Fig. 1 is a representation of a typical healthy subject GRF pattern during half a
walking cycle (between the pink bars). It is divided in a (antero-posterior) breaking phase and
an accelerating phase. For each leg, the point where no antero-posterior force is done
(the location of the pink bars) is the point where the foot is under the hip [5].
Fig. 1 Typical GRF gait pattern (adapted from Carvalho [5])
One of the typical features of gait in patients with PD is that the overall movement pattern
remains more or less normal, except for the markedly reduced angular displacements in hip,
knee and ankle joints [18, 25, 26]. Two of the difficulties encountered in performing an analysis
of gait involved data manipulation and interpretation. The interpretative difficulty arises from
the fact that these channels show dissimilar patterns among patients with the same syndrome
[12, 13, 19, 30]. Even among normal individuals there exist dissimilar EMG patterns [1, 27,
35]. Kunju et al. [21] proposed a technique which processed and analyzed EMG signal using
filtering techniques. The results showed a marked variation in the root mean square amplitude
levels and median frequency of EMG as the subject’s walking pace changed [21].
Here, frequency domain power of both right and left foot were taken as features for
classification between control and Parkinson’s gait dynamics.
Methodologies Fig. 2 illustrates the different methods adopted for this gait dynamics study. The following
sections demonstrate the workflow starting from the gait dynamics database generation to the
classification of the control and Parkinson’s subjects.

INT.J.BIOAUTOMATION, 2017, 21(1), 19-30
21
Fig. 2 Block diagram of proposed methodologies
Gait Dynamics in Neuro-Degenerative Disease Data Base
To understand better the pathophysiology of these diseases and to improve our ability to
measure responses to therapeutic interventions, it may be helpful to quantify gait dynamics
accurately. The records used in the proposed methodology in Gait Dynamics in Neuro-
Degenerative Disease Data Base [15] are from patients with PD (n = 15) and records from
15 healthy control subjects (Table 1). The raw data were obtained using force-sensitive
resistors, with the output roughly proportional to the force under the foot. Here the selected
recordings are having 1 hour length and 2 rows (signals) with 90000 columns (samples/signal)
for left-right foots; sampling frequency: 300 Hz and sampling interval: 0.003(3) sec.
Segmentation and pre-processing The 1 hour gait data having 90000 columns (samples/signal) for left-right foots are segmented
into three parts each having 30000 columns (samples/signal), i.e., 20 min, respectively.
The EMG signals are passed through pre-processing stages where the baseline drifts and noise
(i.e., low frequency and high frequency components) are eliminated. The baseline drift of EMG
signal (Fig. 3) is removed by applying moving average filtering [17] and the process is
equivalent to low pass filtering with the response of the smoothing given by the difference
equation:
1
12 1
sY i Y i N Y i N Y i NN
, (1)
where sY i is the smoothed value for the ith data point, N is the number of neighboring data
points on either side of i, and 2N + 1 is the span. The moving average smoothing method used
by Curve Fitting Toolbox follows these rules [17]:
The span must be odd.
The data point to be smoothed must be at the center of the span.
The span is adjusted for data points that cannot accommodate the specified number of
neighbours on either side.
The end points are not smoothed because a span cannot be defined.

INT.J.BIOAUTOMATION, 2017, 21(1), 19-30
22
Table 1. Subjects information of Gait Dynamics in Neuro-Degenerative Disease Data Base
Group Age
(years)
Height
(meters)
Weight
(kg) Gender
Gait
speed
(m/sec)
Duration/
Severity
control1 57 1.94 95 f 1.33 0
control2 22 1.94 70 m 1.47 0
control3 23 1.83 66 f 1.44 0
control4 52 1.78 73 f 1.54 0
control5 47 1.94 82 f 1.54 0
control6 30 1.81 59 f 1.26 0
control7 22 1.86 64 f 1.54 0
control8 22 1.78 64 f 1.33 0
control9 32 1.83 68 f 1.47 0
control10 38 1.67 57 f 1.4 0
control11 69 1.72 68 f 0.91 0
control12 74 1.89 77 m 1.26 0
control13 61 1.86 60 f 1.33 0
control14 20 1.9 57 f 1.33 0
control15 20 1.83 50 f 1.19 0
park1 77 2 86 m 0.98 4
park2 44 1.67 54 f 1.26 1.5
park3 80 1.81 77 m 0.98 2
park4 74 1.72 43 f 0.91 3.5
park5 75 1.92 91 m 1.05 2
park6 53 2 86 m 1.33 2
park7 64 1.67 54 f 0.91 4
park8 64 1.83 73 m 0.84 4
park9 68 1.92 84 m 1.05 1.5
park10 60 1.94 74 m 1.19 3
park11 74 2.04 100 m 0.5 3
park12 57 1.72 65 f 0.98 3
park13 79 1.68 59 f 0.84 3
park14 57 2.13 84 m 0.98 3
park15 76 2 96 m 1.19 2.5
Fig. 3 Segmented and pre-processed EMG signal

INT.J.BIOAUTOMATION, 2017, 21(1), 19-30
23
The noise cancellation (Fig. 3) is performed with Discrete Wavelet Transform (DWT) [2] for
the gait dynamic/EMG signal. The DWT of a signal x is calculated by passing it through a series
of filters. First the samples are passed through a low pass filter with impulse response g resulting
in a convolution of the two:
*k
y n x g n x k g n k
. (2)
The signal is also decomposed simultaneously using a high-pass filter h. The outputs are giving
(Fig. 4) the detail coefficients (from the high-pass filter) and approximation coefficients
(from the low-pass). It is important that the two filters are related to each other and they are
known as a quadrature mirror filter.
Fig. 4 Block diagram of filter analysis
However, since half the frequencies of the signal have now been removed, half the samples can
be discarded according to Nyquist’s rule. The filter outputs are then sub sampled by 2. In the
next two formulas, the notation is the opposite: g denotes high pass and h – low pass as is
Mallat’s and the common notation:
2 low
k
y n x k h n k
, (3)
2high
k
y n x k g n k
. (4)
Results analysis
Frequency domain power Power spectral density describes how the power of a signal or time series is distributed over the
different frequencies. The average power P of a signal x(t) is the following time average:
21lim ( )
2
T
TT
P x t dtT
. (5)
So the total average power is computed as the sum of the power of all the frequency components
of the 20 min gait dynamic signal. Left-right foot gait dynamic frequency domain powers are
tabulated in Table 2.
Linear discriminant analysis In this case, multi-class Linear Discriminant Analysis (LDA) (Fig. 5) is used to classify two
unknown group of EMG signals (i.e., PD and control) based on the frequency domain features
(e.g., left-right foot frequency domain power) by calculating of mean, global mean, mean
subtraction, transpose, covariance, probability, frequencies and at the end defining thresholds
for each class on the distributed space area [14].

INT.J.BIOAUTOMATION, 2017, 21(1), 19-30
24
Table 2. Frequency domain powers of gait dynamics data
Subject
No
Time
(min) CL_PFa CR_PFb PL_PFc PR_PFd
1
0-20 3.1271e+05 3.4865e+05 1.7192e+05 2.2076e+05
20-40 2.7568e+05 3.3898e+05 2.0067e+05 2.4239e+05
40-60 2.7687e+05 3.5937e+05 2.0211e+05 2.3759e+05
2
0-20 2.2092e+05 3.4539e+05 1.9976e+05 2.3055e+05
20-40 1.7661e+05 2.7386e+05 2.1665e+05 2.0676e+05
40-60 1.8913e+05 2.1937e+05 2.4219e+05 2.1641e+05
3
0-20 3.7444e+05 2.1823e+05 2.0253e+05 1.5603e+05
20-40 3.9933e+05 2.2950e+05 2.1071e+05 1.6909e+05
40-60 3.8379e+05 2.2437e+05 1.9435e+05 1.6102e+05
4
0-20 2.5809e+05 2.4491e+05 2.2362e+05 2.0417e+05
20-40 2.4929e+05 2.4455e+05 2.4165e+05 2.1304e+05
40-60 2.4544e+05 2.4608e+05 2.4894e+05 2.1941e+05
5
0-20 2.5729e+05 2.0405e+05 3.6301e+05 2.8953e+05
20-40 1.4262e+05 2.5528e+05 1.4938e+05 2.9659e+05
40-60 1.5329e+05 2.7650e+05 1.0833e+05 2.9480e+05
6
0-20 3.5596e+05 2.4761e+05 2.2817e+05 2.3037e+05
20-40 3.5255e+05 2.5104e+05 2.1643e+05 2.4923e+05
40-60 3.6962e+05 2.6476e+05 2.0758e+05 2.6181e+05
7
0-20 2.5492e+05 2.8901e+05 1.9902e+05 1.9167e+05
20-40 2.6495e+05 2.9207e+05 2.1643e+05 1.9878e+05
40-60 2.6920e+05 3.0526e+05 1.2948e+05 1.2976e+05
8
0-20 2.1024e+05 2.1176e+05 1.9652e+05 9.5291e+04
20-40 1.7993e+05 2.0495e+05 1.8061e+05 7.4609e+04
40-60 1.6784e+05 1.9124e+05 1.8062e+05 7.8080e+04
9
0-20 3.2321e+05 3.3188e+05 1.7693e+05 3.2925e+05
20-40 3.1115e+05 3.3721e+05 1.7793e+05 3.2114e+05
40-60 3.0096e+05 3.2844e+05 1.8255e+05 3.1965e+05
10
0-20 3.0582e+05 3.7786e+05 1.8827e+05 4.3117e+05
20-40 3.1379e+05 3.8864e+05 1.7032e+05 3.7005e+05
40-60 3.0189e+05 3.6905e+05 2.1930e+05 3.9099e+05
11
0-20 3.7527e+05 2.2605e+05 1.4265e+05 1.9703e+05
20-40 3.5871e+05 2.3161e+05 1.1440e+05 1.4822e+05
40-60 3.8496e+05 2.2133e+05 1.8558e+05 1.7516e+05
12
0-20 3.6059e+05 2.3104e+05 2.6311e+05 1.5553e+05
20-40 3.4068e+05 2.1518e+05 2.5417e+05 1.6636e+05
40-60 3.3783e+05 2.2133e+05 2.4508e+05 1.6544e+05
13
0-20 2.3918e+05 3.3716e+05 3.0053e+05 1.8468e+05
20-40 2.5516e+05 2.1745e+05 3.0485e+05 1.8270e+05
40-60 2.3702e+05 3.2087e+05 2.9633e+05 1.7793e+05
14
0-20 2.4474e+05 2.7825e+05 1.6497e+05 2.7418e+05
20-40 2.4177e+05 2.7805e+05 2.3931e+05 1.7114e+05
40-60 2.4173e+05 2.8423e+05 2.5805e+05 1.0363e+05
15
0-20 1.7909e+05 2.2138e+05 2.4601e+05 2.3766e+05
20-40 1.9765e+05 2.0728e+05 2.0257e+05 2.2520e+05
40-60 2.0883e+05 1.8233e+05 1.9581e+05 2.3346e+05 aCL_PF = Control(Left-foot)_Power in Frequency Domain, bCR_PF = Control(Right-foot)_Power in Frequency Domain, cPL_PF = Parkinson’s(Left-foot)_Power in Frequency Domain, dPR_PF = Parkinson’s(Right-foot)_Power in Frequency Domain.
INT.J.BIOAUTOMATION, 2017, 21(1), 19-30
25
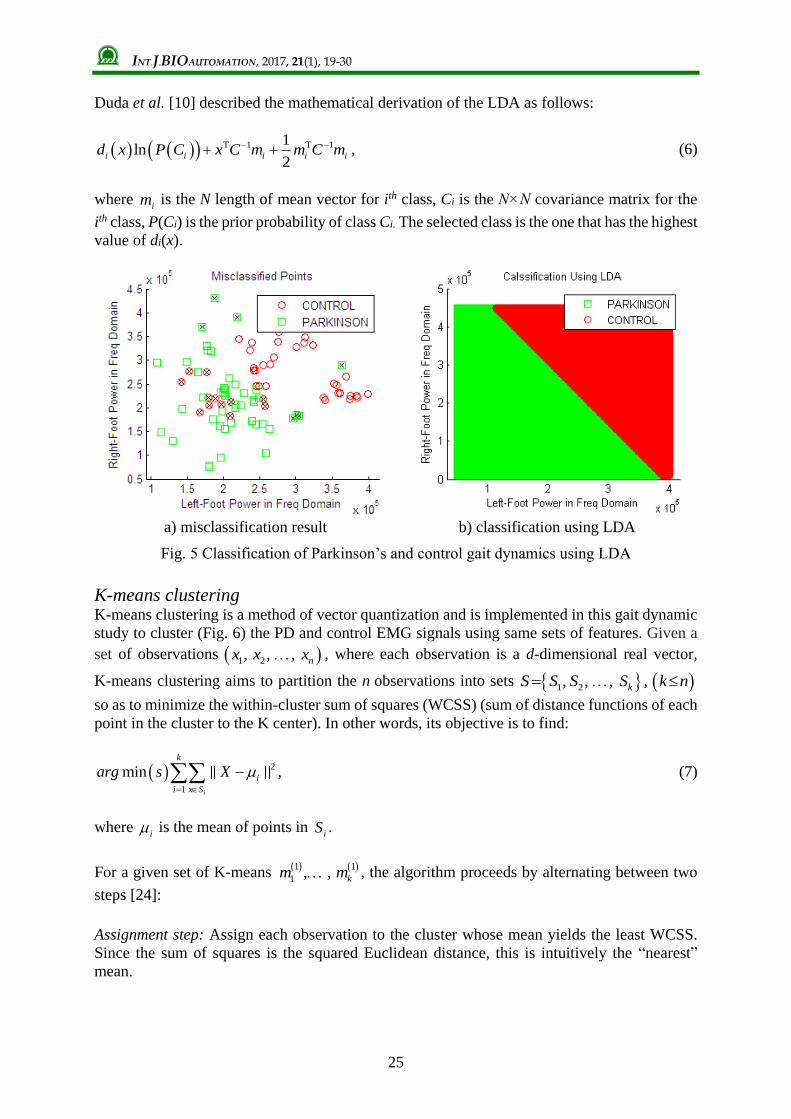
Duda et al. [10] described the mathematical derivation of the LDA as follows:
T 1 T 11ln
2i i i i id x P C x C m m C m , (6)
where im is the N length of mean vector for ith class, Ci is the N×N covariance matrix for the
ith class, P(Ci) is the prior probability of class Ci. The selected class is the one that has the highest
value of di(x).
a) misclassification result b) classification using LDA
Fig. 5 Classification of Parkinson’s and control gait dynamics using LDA
K-means clustering K-means clustering is a method of vector quantization and is implemented in this gait dynamic
study to cluster (Fig. 6) the PD and control EMG signals using same sets of features. Given a
set of observations 1 2, , , nx x x , where each observation is a d-dimensional real vector,
K-means clustering aims to partition the n observations into sets 1 2 , , , kS S S S , k n
so as to minimize the within-cluster sum of squares (WCSS) (sum of distance functions of each
point in the cluster to the K center). In other words, its objective is to find:
2
1
min
i
k
i
i x S
arg s X
, (7)
where i is the mean of points in
iS .
For a given set of K-means 1 1
1 , , km m , the algorithm proceeds by alternating between two
steps [24]:
Assignment step: Assign each observation to the cluster whose mean yields the least WCSS.
Since the sum of squares is the squared Euclidean distance, this is intuitively the “nearest”
mean.

INT.J.BIOAUTOMATION, 2017, 21(1), 19-30
26
a) partition into two clusters b) cluster assignments and centroids
Fig. 6 Clustering of two regions using K-means
2 2: , 1t t t
i p p i p jS x x m x m j j k , (8)
where each px is assigned to exactly one tS , even if it could be assigned to two or more of
them.
Update step: Calculate the new means to be the centroids of the observations in the new clusters
1 1
tj Si
t
i jtxi
m xS
. (9)
Since the arithmetic mean is a least-squares estimator, this also minimizes the WCSS objective.
Discussions Li [22] discussed the application of a neural network in medical diagnosis using back
propagation and results calculated as “Among the training samples, the detection accuracy rate
for Parkinson’s patients is 100%, the detection accuracy rate for non-Parkinson’s patients is
95% and misdiagnosis rate is 5%. Among the testing samples, the detection accuracy rate for
Parkinson’s patients is 96.3%, the detection accuracy rate for non-Parkinson’s patients is
93.3% and misdiagnosis rate is 6.7%”. Tabulated frequency domain powers (Table 1) of left-
right foot were introduced as the classifier parameters for the LDA and K-means clustering
techniques. Fig. 5(a) shows the misclassification result (cross marks) during classification by
LDA.
The re-substitution error of LDA is found to be 21.11% and the misclassification error for
quadratic discriminant analysis is 18.89%. Moreover, LDA is precisely classifying these two
classes (Fig. 5(b)) taking left-right foot frequency domain power as classifier features.
Using the same sets of features in K-means clustering, significant results achieved (Fig. 6) in
partitioning and cluster assignments of control and Parkinson’s regions. The best total sum of
distances = 7.66504e+06 where replicate is 4 and total iterations are 7. The EMG signals from
Gait Dynamics in Neuro-Degenerative Disease Database were recorded using force-sensitive

INT.J.BIOAUTOMATION, 2017, 21(1), 19-30
27
resistors, which show no significant morphological changes in the signals patterns of PD and
control. The amplitude changes and strides length are also calculated before selecting frequency
domain power of signal as a feature. But both the amplitude and average stride length could not
contribute sufficiently to be marked as classifier features for this study. The energy-power
domain changes for healthy and neuro-degenerative disease may be considered as a noticeable
parameter in gait dynamic study.
Conclusion Dynamic electromyography offers a means of directly tracking muscle activity.
The myo-electric signal sufficiently parallels the intensity of muscle action to serve as a useful
indicator of its mechanical effect. Previous methods were based on observations and prone to
errors related to person’s walking alteration pattern. Here signal processing techniques were
implemented in sequential order which leads to classification of PD and control subjects.
Initially the raw data were subjected to normalization (i.e., noise and baseline drift cancellation)
for further processing (i.e., feature extraction, classification and clustering). LDA and K-means
significantly performed the classification and clustering operations respectively. The visual
interpretations of these results are clearly showing the two different classes, e.g., Parkinson’s
disease and control subjects. Further research can be accomplished in the field of pattern
recognition and classification between amyotrophic lateral sclerosis, Parkinson’s disease and
control.
References 1. Adler N., B. Kent (1979). Electromyography of the Vastus medialis in Normal Subjects
during Gait, 4th Congress of International Society of Electrophysiological Kinesiology,
Boston.
2. Akansu A. N., R .A. Haddad (1992). Multiresolution Signal Decomposition: Transforms,
Subbands, and Wavelets, Boston, MA: Academic Press.
3. Barbeau A., M. Roy (1976). Six-year Results of Treatment with Levodopa and Benzerazide
in Parkinson’s Disease, Neurology, 26, 399-404.
4. Bazner H., M. Oster, M. Daffertshofer, M. Hennerici (2000). Assessment of Gait in
Subcortical Vascular Encephalopathy by Computerized Analysis: A Cross-sectional and
Longitudinal Study, J Neurol, 247, 841-849.
5. Carvalho A. M. M. D. (2013). Computational Tools for Data Fusion and Signal Processing
of Human Gait, Master Thesis in Bioengineering, The Faculty of Engineering of the
University of Porto.
6. Cook R. E, I. Schneider, M. E. Hazlewood, S. J. Hillman, J. E. Robb (2003). Gait Analysis
Alters Decision-making in Cerebral Palsy, J Pediatr Orthop, 23(3), 292-295.
7. DeLuca P. A., R. B. 3rd Davis, S. Ounpuu, S. Rose, R. Sirkin (1997). Alterations in Surgical
Decision Making in Patients with Cerebral Palsy Based on Three-dimensional Gait
Analysis, J Pediatr Orthop, 17(5), 608-614.
8. Dietz V., W. Berger, G. A. Horstmann (1988). Posture in Parkinson’s Disease, Impairment
of Reflexes and Programming, Ann Neurol, 24, 660-669.
9. Dietz V., W. Zijlstra, T. Prokop, W. Berger (1995). Leg Muscle Activation during Gait in
Parkinson’s Disease: Adaptation and Interlimb Coordination, Electroencephalogr Clin
Neurophysiol, 97, 408-415.
10. Duda R., P. Hartand, D. Stork (2000). Pattern Classification, 2nd Ed., New York:
Wiley-Interscience.
11. Frenkel T. S., N. Giladi, C. Peretz, T. Herman, L. Gruendlinger, J. M. Hausdorff (2005).
Treadmill Walking as an External Pacemaker to Improve Gait Rhythm and Stability in
Parkinson’s Disease, Mov Disord, 20, 1109-1114.

INT.J.BIOAUTOMATION, 2017, 21(1), 19-30
28
12. Griffin P., W. Wheelhouse, R. Shiavi (1977). Adductor Transfer for Adductor Spasticity:
Clinical and Electromyographic Gait Analysis, Develop Med Child Neurol, 19, 783-789.
13. Griffin P., W. Wheelhouse, R. Shiavi, W. Bass (1977). Habitual Toe-walkers: A Clinical
and Electromyographic Gait Analysis, J Bone Joint Surg, 59(A), 98-101.
14. Hargrove L. J., E. J. Scheme, K. B. Englehart, B. S. Hudgins (2010). Multiple Binary
Classifications via Linear Discriminant Analysis for Improved Controllability of a Powered
Prosthesis, IEEE Trans Neural Syst Rehabil Eng, 18(1), 49-57.
15. Hausdorff J. M., A. Lertratanakul, M. E. Cudkowicz, A. L. Peterson, D. Kaliton,
A. L. Goldberger (2000). Dynamic Markers of Altered Gait Rhythm in Amyotrophic
Lateral Sclerosis, J Applied Physiology, 88, 2045-2053.
16. Hussain B., H. Khalid, S. Nadeem, T. Sultana, S. Aslam (2012). Phylogenetic and
Chronological Analysis of Proteins Causing Alzheimer’s, Parkinson’s and Huntington’s
Diseases, Int J Bioautomation, 16(3), 165-178.
17. Kaur M., B. Singh, Seema (2011). Comparison of Different Approaches for Removal of
Baseline Wander from ECG Signal, Proceedings of the International Conference &
Workshop on Emerging Trends in Technology, 1290-1294.
18. Knutsson E., A. Martensson (1986). Posture and Gait in Parkinsonian Patients,
In: Disorders of Posture and Gait, Bles W., T. Brandt (Eds.), 217-229.
19. Knutsson E., C. Richards (1979). Different Types of Disturbed Motor Control in Gait of
Hemiplegic Patients, Brain, 102, 405-430.
20. Kugler P. (2013). Automatic Recognition of Parkinson’s Disease Using Surface
Electromyography during Standardized Gait Tests, In: Proc. of the 35th Annual
International Conference of the IEEE Engineering in Medicine and Biology Society,
5781-5784.
21. Kunju N., N. Kumar, D. Pankaj, A. Dhawan, A. Kumar (2009). EMG Signal Analysis for
Identifying Walking Patterns of Normal Healthy Individuals, Indian Journal of
Biomechanics: Special Issue, NCBM 7-8 March 2009, 118-122.
22. Li J. (2016). Application of BP Neural Network Algorithm in Biomedical Diagnostic
Analysis, Int J Bioautomation, 20(3), 417-426.
23. Lofterod B., T. Terjesen, I. Skaaret, A. B. Huse, R. Jahnsen (2007). Preoperative Gait
Analysis has a Substantial Effect on Orthopedic Decision Making in Children with Cerebral
Palsy: Comparison between Clinical Evaluation and Gait Analysis in 60 Patients, Acta
Orthop, 78(1), 74-80.
24. MacKay D. (2003). Chapter 20. An Example Inference Task: Clustering (PDF),
In: Information Theory, Inference and Learning Algorithms, MacKay D. J. C. (Ed.),
Cambridge University Press, 284-292.
25. Murray M. P., S. B. Sepic, G. M. Gardner, W. J. Downs (1978). Walking Patterns of Men
with Parkinsonism, Am J Phys Med, 57(6), 278-294.
26. Nieuwboer A., W. de Weerdt, R. Dom, L. Peeraer, E. Lesaffre, F. Hilde, B. Baunach (1999).
Plantar Force Distribution in Parkinsonian Gait: A Comparison between Patients and
Age-matched Control Subjects, Scand J Rehab Med, 31, 185-192.
27. Paul J. (1971). Comparison of EMG Signals from Leg Muscles with the Corresponding
Force Actions Calculated from Walk Path Measurements, Human Locomotor Engineering,
48A, 6-26.
28. Paul S., Md. Solayman, M. Saha, Md. S. Hossain (2015). In silico Analysis of the
Functional and Structural Impacts of Non-synonymous Single Nucleotide Polymorphisms
in the Human Paraxonase 1 Gene, Int J Bioautomation, 19(3), 275-286.
29. Perry J. (1998). The Contribution of Dynamic Electromyography to Gait Analysis,
In: RRDS Gait Analysis in the Science of Rehabilitation, DeLisa J. A. (Ed.), 33-48.

INT.J.BIOAUTOMATION, 2017, 21(1), 19-30
29
30. Perry J., M. Hoffer, D. Antonelli, J. Plut, G. Lewis, R. Greenburg (1976).
Electromyography before and after Surgery for Hip Deformity in Children with Cerebral
Palsy, J Bone Joint Surq, 58(A), 201-208.
31. Pollo F. E. (2007). Gait Analysis: Techniques & Recognition of Abnormal Gait,
The FASEB Journal, 21(5), A83.
32. Roland K. P., G. R. Jones, J. M. Jakobi (2014). Daily Electromyography in Females with
Parkinson’s Disease: A Potential Indicator of Frailty, Archives of Gerontology and
Geriatrics, 58, 80-87.
33. Schwed M. A., T. Getrost, D. Schmidtbleicher, C. T. Haas (2013). Biomechanical Analysis
of Gait Adaptability in Parkinson’s Disease, The Open Rehabilitation Journal, 6, 49-58.
34. Shiavi R., P. Griffin (1981). Representing and Clustering Electromyographic Gait Patterns
with Multivariate Techniques, Med & Biol Eng & Comput, 19(5), 605-611.
35. Shiavi R., S. Champion, F. Freemon (1979). Population Variability of Gait Patterns at
Normal Walking Speed, 4th Congress of International Society of Electrophysiological
Kinesiology, Boston.
36. Sousa A. S. P. D. (2009). Analysis of gait based on multifactorial correlation, M.Sc. Thesis,
Porto University (in Portuguese).
37. Whittle M. (2007). Gait Analysis: An Introduction, Edinburgh, New York, Butterworth-
Heinemann.
38. Yogev G., N. Giladi, C. Peretz, S. Springer, E. S. Simon, J. M. Hausdorff (2005).
Dual Tasking, Gait Rhythmicity, and Parkinson’s Disease: Which Aspects of Gait are
Attention Demanding?, Eur J Neurosci, 22, 1248-1256.

INT.J.BIOAUTOMATION, 2017, 21(1), 19-30
30
Assist. Prof. Akash Kumar Bhoi, Ph.D. Student
E-mail: [email protected]
Akash Kumar Bhoi has completed his B.Tech. (Biomedical
Engineering) from the TAT, Bhubaneswar and M.Tech.
(Biomedical Instrumentation) from Karunya University,
Coimbatore in the years 2009 and 2011, respectively. He is pursuing
Ph.D. from Sikkim Manipal University, India. He is working as
R&D Faculty Associate & Assistant Professor in the Department of
Electrical & Electronics Engineering at Sikkim Manipal Institute of
Technology, India since 2012. He is a Member of ISEIS & IAENG,
an Associate member of UACEE, and an Editorial Board member of
IJAEEE, IJAEEE, ITSI-TEEE, IJECCE & IJCTT and Reviewer of
IJET, IJCT, IJBSE, IJMI, AJBLS. His areas of research are
biomedical signal processing, medical image processing, sensor and
transducer and medical instrumentation. He has published several
papers in national and international journals and conferences. He has
also published book chapters. He has participated in workshops,
seminars and conferences. He was the conference secretary of
Springer Sponsored International Conference (ETAEERE in 2016).
© 2017 by the authors. Licensee Institute of Biophysics and Biomedical Engineering,
Bulgarian Academy of Sciences. This article is an open access article distributed under the
terms and conditions of the Creative Commons Attribution (CC BY) license
(http://creativecommons.org/licenses/by/4.0/).