Classification and Regression Trees - Statistics Departmentstine/mich/DM_07.pdf · •...
29
Wharton Department of Statistics Classification and Regression Trees Bob Stine Dept of Statistics, Wharton School University of Pennsylvania
Transcript of Classification and Regression Trees - Statistics Departmentstine/mich/DM_07.pdf · •...
Wharton Department of Statistics
Classification and Regression Trees
Bob StineDept of Statistics, Wharton School
University of Pennsylvania
Wharton Department of Statistics
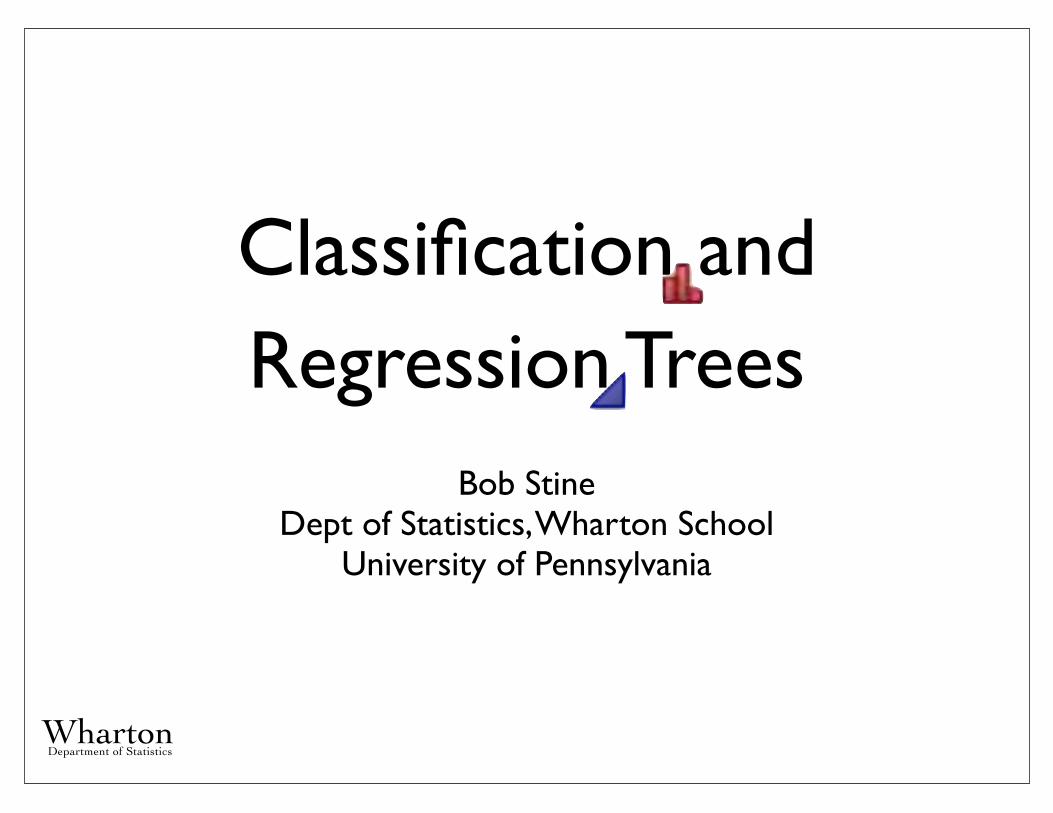
Trees• Familiar metaphor
• Biology• Decision tree• Medical diagnosis• Org chart
• Properties• Recursive, partitioning items into unique leaf• Increasing specialization
• Convey structure at-a-glance
• How to grow a tree from data?• What rules identify the relevant variables, split rules?
2
Wharton Department of Statistics
Trees as Models for Data• Different type of explanatory variable
• Decision rules replace typical predictors• Implicit equation uses indicator functions X ⇒ Ix≤c & Ix>c
• Software builds these from training data
• Process• Find rule to partition data• Fits are averages of subsets• Use validation data to decide when to stop
• Models as averages• All models average, just question of which cases
3
Wharton Department of Statistics
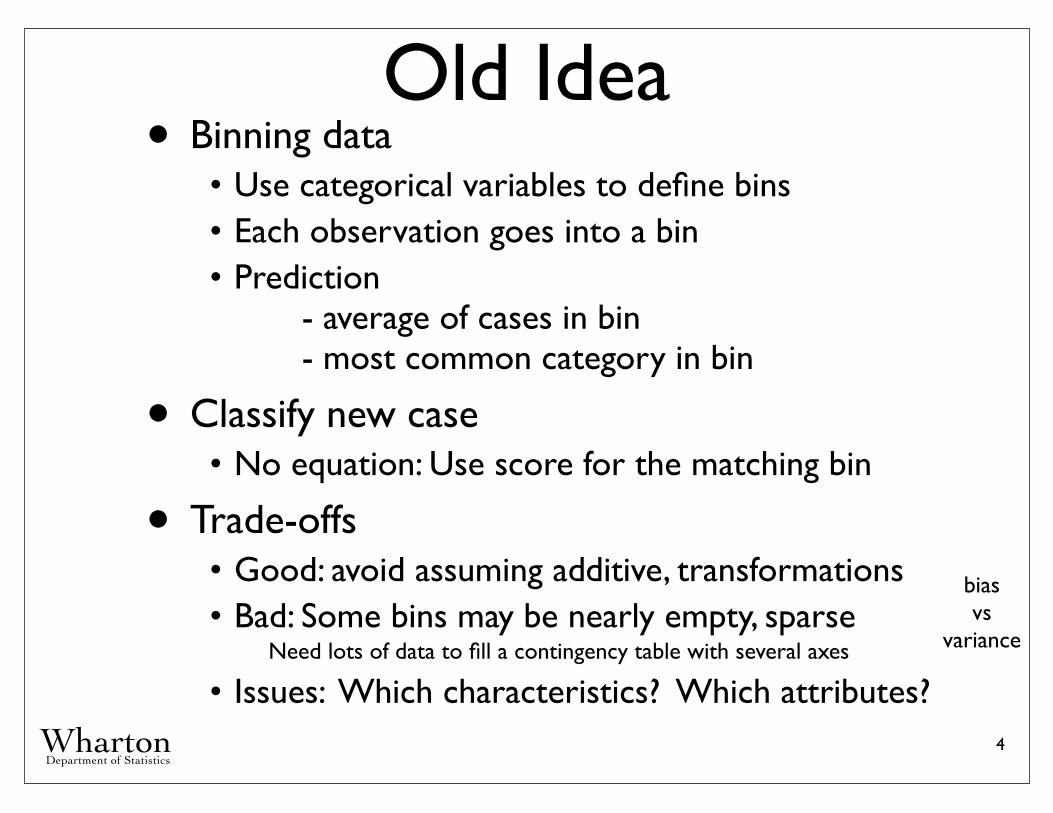
Old Idea• Binning data
• Use categorical variables to define bins• Each observation goes into a bin• Prediction - average of cases in bin - most common category in bin
• Classify new case• No equation: Use score for the matching bin
• Trade-offs• Good: avoid assuming additive, transformations• Bad: Some bins may be nearly empty, sparse
Need lots of data to fill a contingency table with several axes
• Issues: Which characteristics? Which attributes?4
biasvs
variance
Wharton Department of Statistics
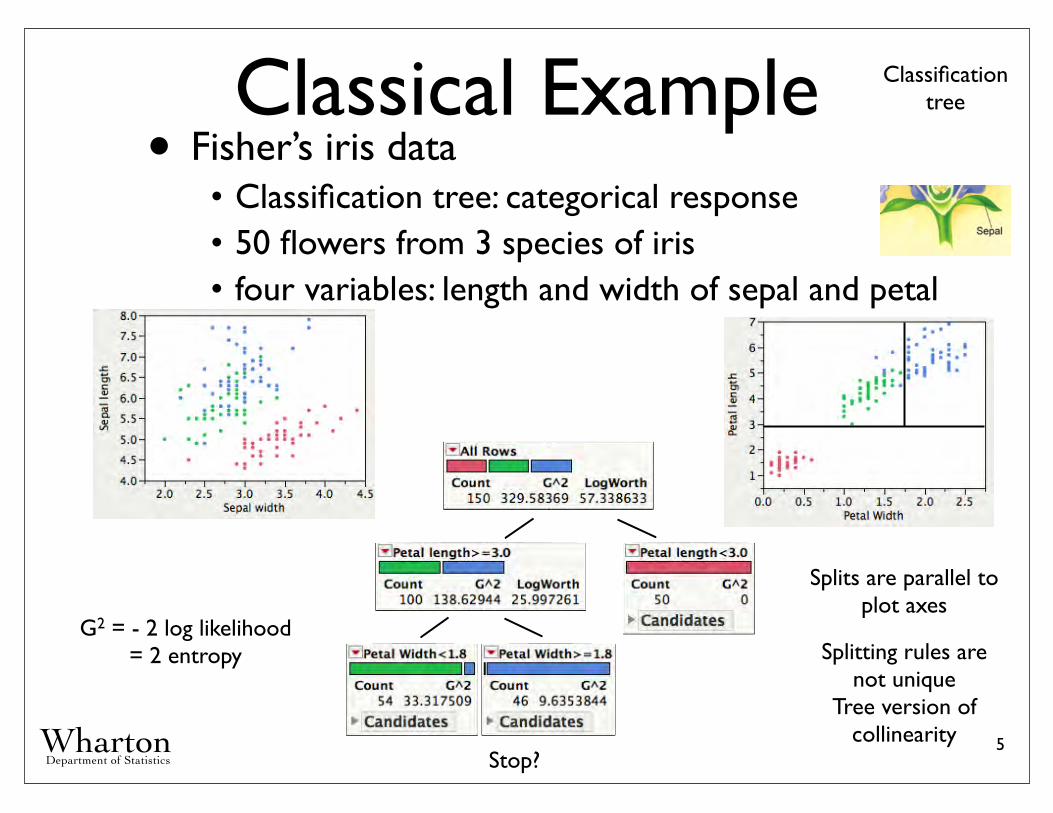
Classical Example• Fisher’s iris data
• Classification tree: categorical response• 50 flowers from 3 species of iris• four variables: length and width of sepal and petal
5
Splitting rules are not unique
Tree version of collinearity
Splits are parallel to plot axes
Stop?
Classification tree
G2 = - 2 log likelihood= 2 entropy

Wharton Department of Statistics
Example• ANES 2008
• Regression tree: numerical response• Favor or oppose gay marriage• X’s: Obama-McCain, PresDiapproval, Econ Problem
6
Regression tree with dummy
response
Stop?
Use “Select Rows” command in the tree nodes
Node shows average of response (here
percentage) for its cases
Wharton Department of Statistics
Recursive Partitioning• Recursive, binary splits CART™
• Start with all cases in one group, the root nodeTree grows upside down
• Split a current group to make homogeneousMay split same group several times
• Continue until objective is reached
• Comments• Recursive: once cases are split, never rejoin• Greedy: immediate step rather than look ahead
Very fast, even with many features
• Invariant of order-preserving transformations• Rules are not unique (as in collinearity in regr)• Interactions
7
Wharton Department of Statistics
Growing Tree• Search for best splitting variable
• Numerical variablePartition cases X ≤ c and X > c, all possible cConsider only numbers c that match a data point (ie, sort cases)
• Categorical variablePartition cases into two mutually exclusive groupsLots of groups if the number of labels k is large (2k-1-1 splits)
• Greedy search• One-step look ahead (as in forward stepwise)• Find next variable that maximizes search
criterion, such as level of significance or R2.• Criterion depends on response: numerical or
categorical
8

Wharton Department of Statistics
Splitting Criteria• Numerous choices
• Log-likelihood for classification tree• Recall -2 log likelihood ≈ residual SS in OLS• G2 is node’s contribution to -2 log likelihood
Related to the entropy of the current partition (entropy measures randomness)
• G2 = 0 for node that is homogenousperfect fit, no value in trying to split further (entropy = 0)
• Log worth• JMP version of the p-value of a split
• Cross-validation• Use a tuning sample to decide how many splits
9
Wharton Department of Statistics
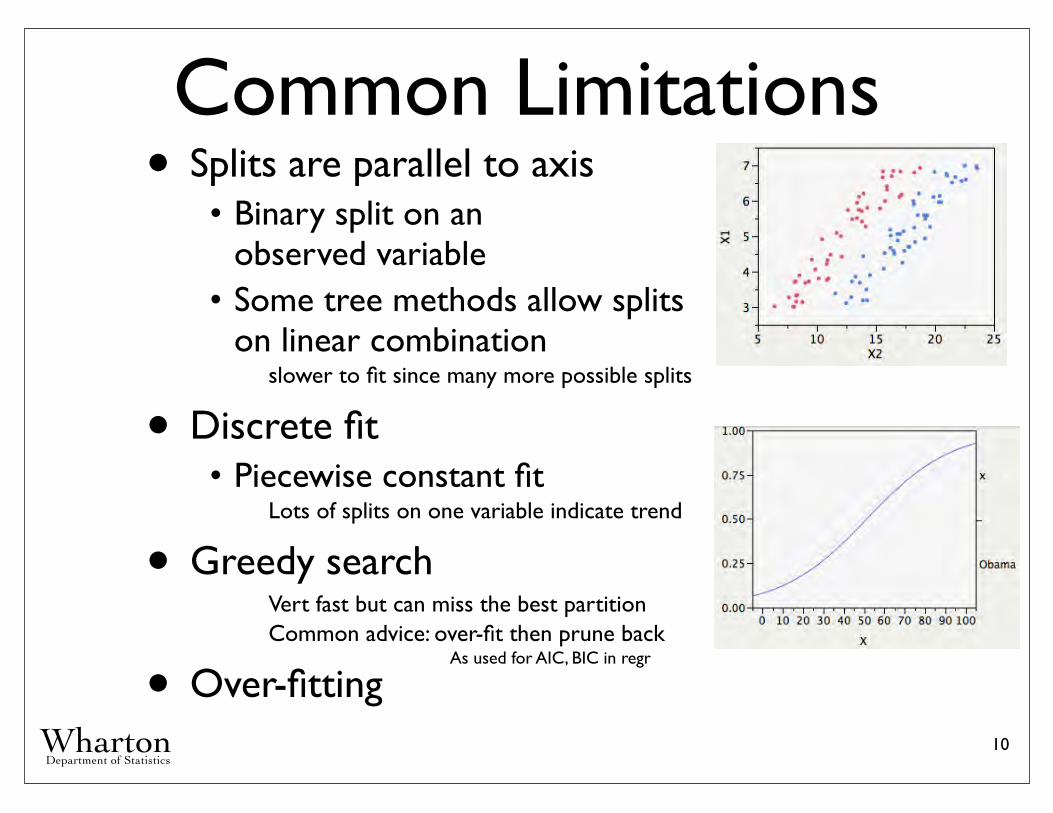
Common Limitations• Splits are parallel to axis
• Binary split on an observed variable
• Some tree methods allow splitson linear combination
slower to fit since many more possible splits
• Discrete fit• Piecewise constant fit
Lots of splits on one variable indicate trend
• Greedy searchVert fast but can miss the best partitionCommon advice: over-fit then prune back
• Over-fitting10
As used for AIC, BIC in regr
Wharton Department of Statistics
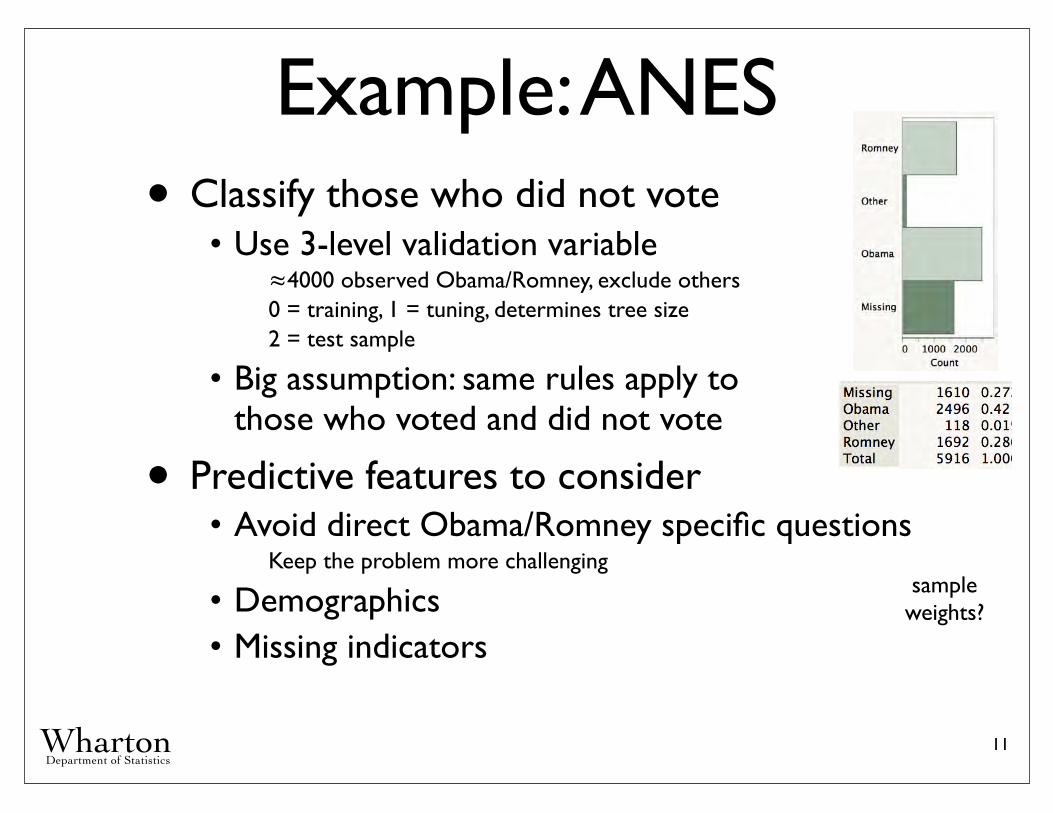
Example: ANES• Classify those who did not vote
• Use 3-level validation variable≈4000 observed Obama/Romney, exclude others0 = training, 1 = tuning, determines tree size2 = test sample
• Big assumption: same rules apply tothose who voted and did not vote
• Predictive features to consider• Avoid direct Obama/Romney specific questions
Keep the problem more challenging
• Demographics• Missing indicators
11
sample weights?
Wharton Department of Statistics
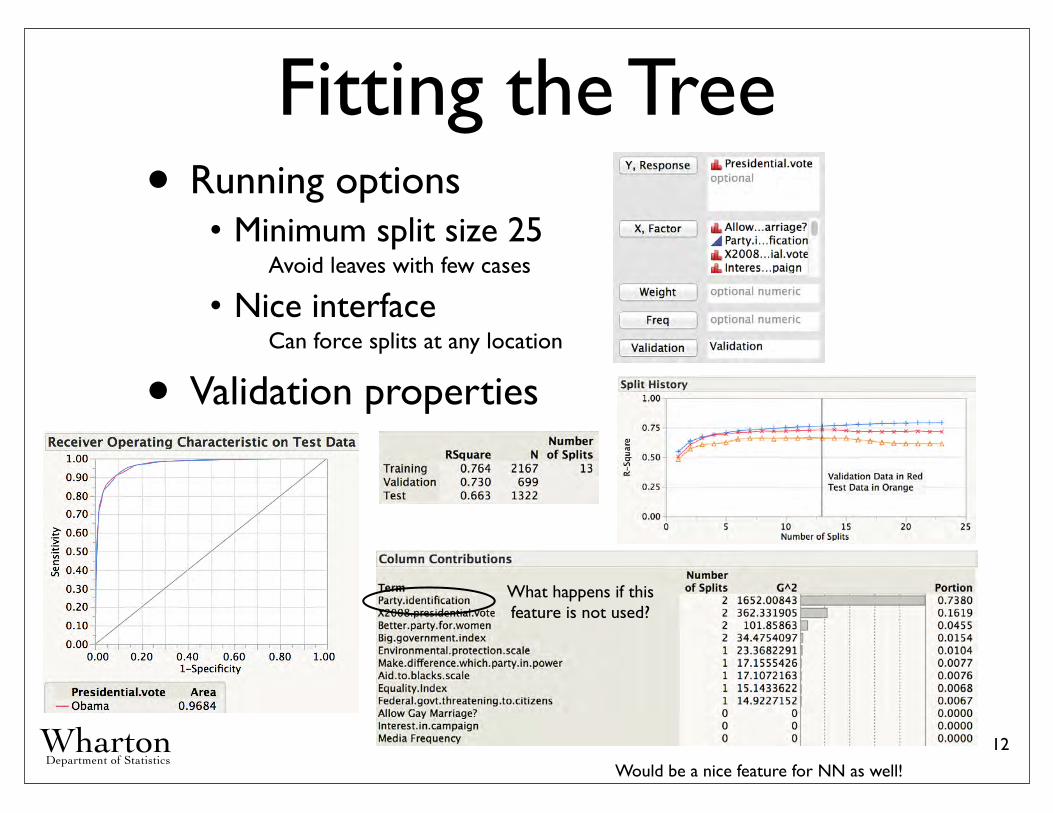
Fitting the Tree• Running options
• Minimum split size 25Avoid leaves with few cases
• Nice interfaceCan force splits at any location
• Validation properties
12
Would be a nice feature for NN as well!
What happens if this feature is not used?

Wharton Department of Statistics
Mosaic Plot • Summary of tree
• Thin bins have few cases• Less flat means better splits
13Romney Obama
Wharton Department of Statistics
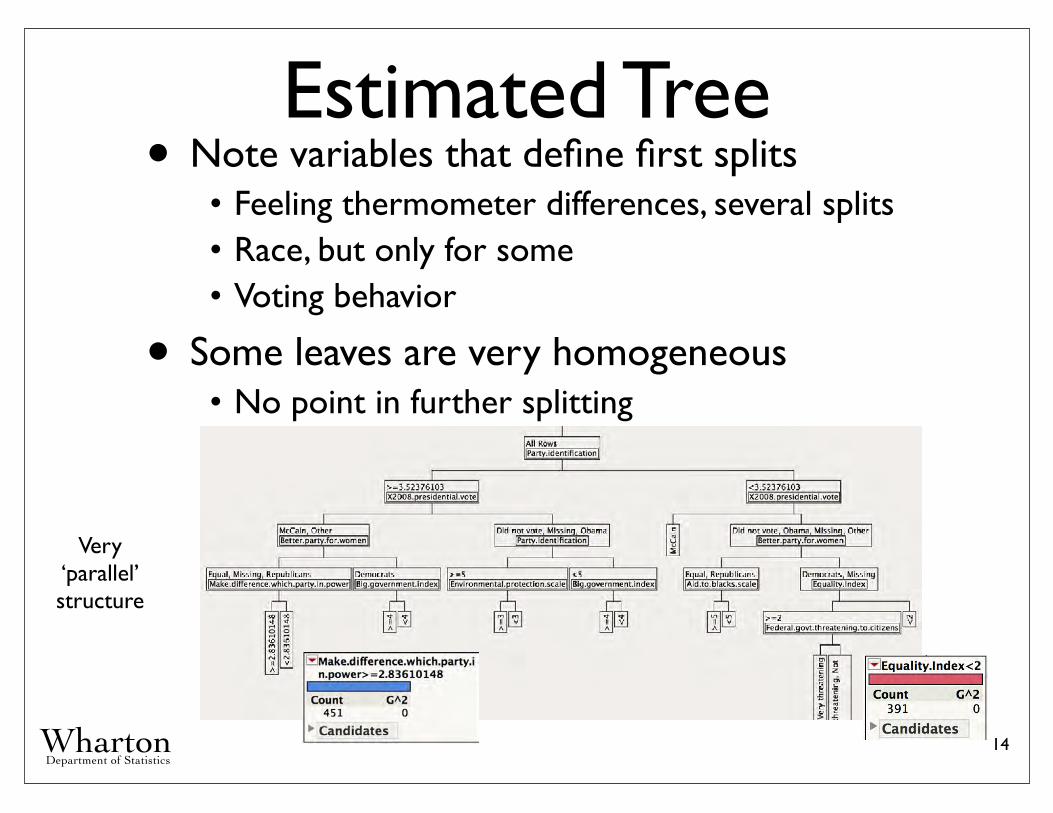
Estimated Tree• Note variables that define first splits
• Feeling thermometer differences, several splits• Race, but only for some• Voting behavior
• Some leaves are very homogeneous• No point in further splitting
14
Very ‘parallel’ structure
Wharton Department of Statistics
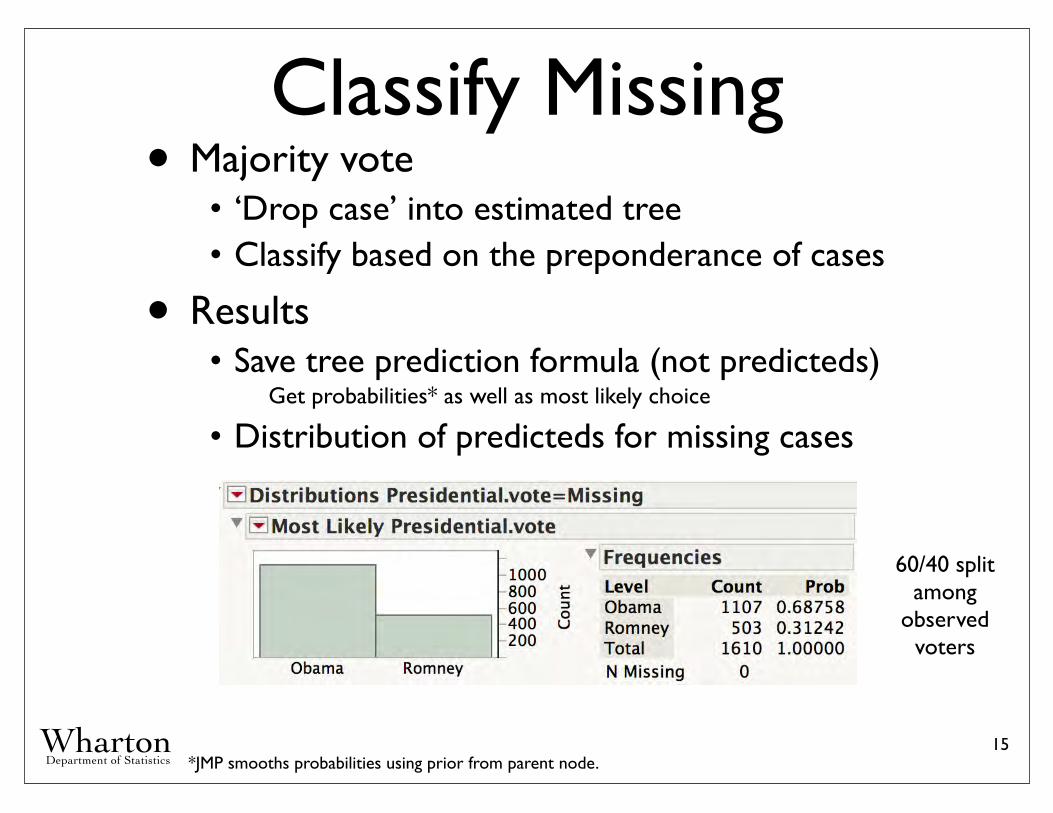
Classify Missing• Majority vote
• ‘Drop case’ into estimated tree• Classify based on the preponderance of cases
• Results• Save tree prediction formula (not predicteds)
Get probabilities* as well as most likely choice
• Distribution of predicteds for missing cases
15*JMP smooths probabilities using prior from parent node.
60/40 split among
observed voters
Wharton Department of Statistics
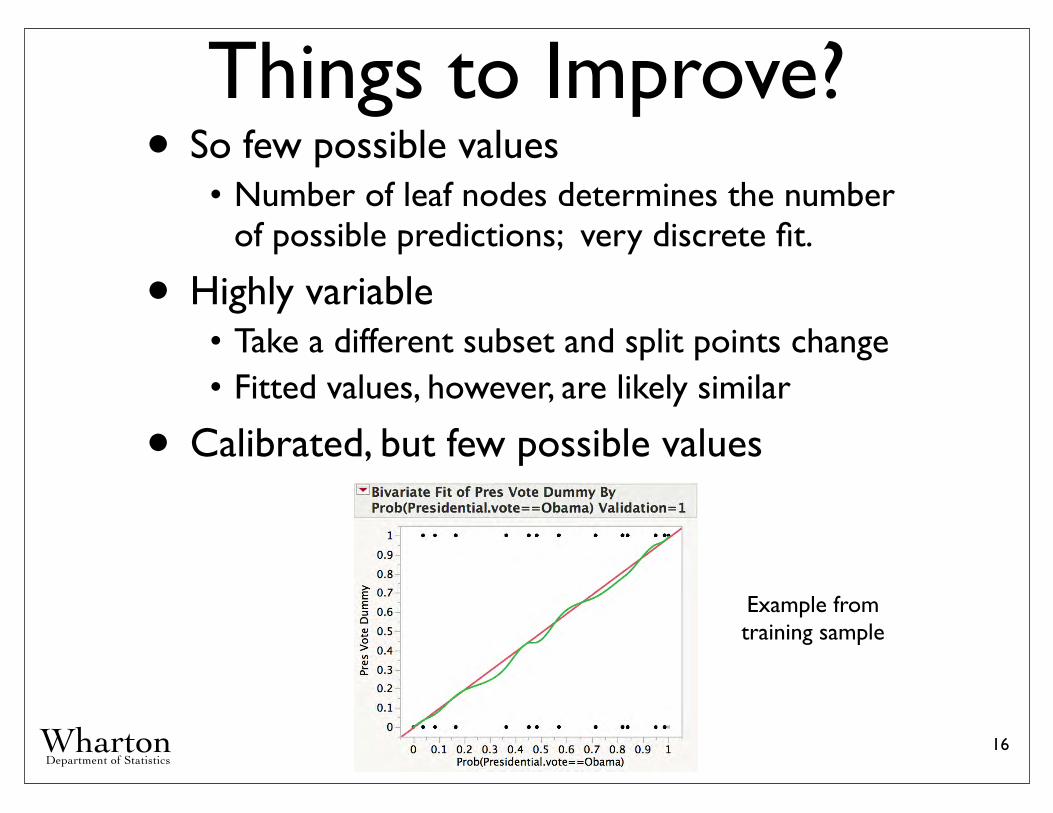
Things to Improve?• So few possible values
• Number of leaf nodes determines the number of possible predictions; very discrete fit.
• Highly variable• Take a different subset and split points change• Fitted values, however, are likely similar
• Calibrated, but few possible values
16
Example from training sample
Wharton Department of Statistics
Averaging Trees• Rather than average within a model, we can
average over models
• Model averaging borrows strength• Fit collection of models• Predict by ‘majority vote’ or averaging• Question: How to get a collection of models?
• Boosting• Re-weight cases not fit well by current model
(If numerical Y, fit next model to residuals of current model)
• Simple models
• Bagging• Build trees (forest) using bootstrap samples• Complicated models, different sets of variables
17
Wharton Department of Statistics
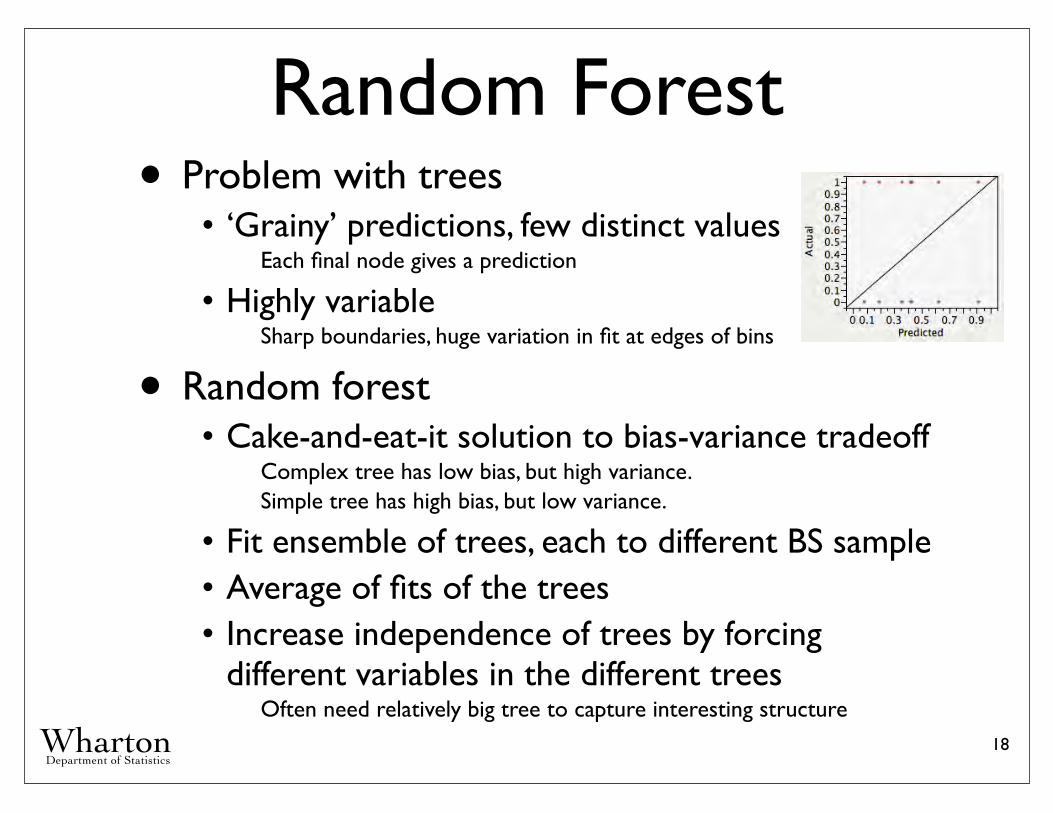
Random Forest• Problem with trees
• ‘Grainy’ predictions, few distinct valuesEach final node gives a prediction
• Highly variableSharp boundaries, huge variation in fit at edges of bins
• Random forest• Cake-and-eat-it solution to bias-variance tradeoff
Complex tree has low bias, but high variance.Simple tree has high bias, but low variance.
• Fit ensemble of trees, each to different BS sample• Average of fits of the trees• Increase independence of trees by forcing
different variables in the different treesOften need relatively big tree to capture interesting structure
18
Wharton Department of Statistics
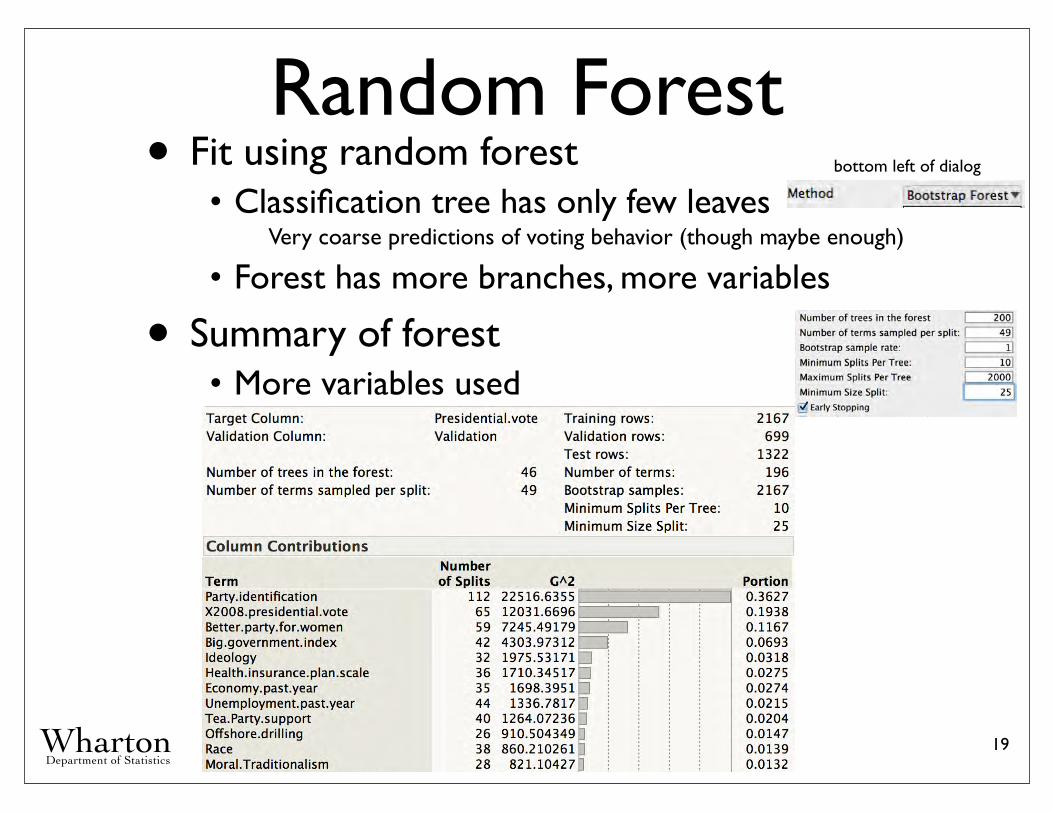
Random Forest• Fit using random forest
• Classification tree has only few leavesVery coarse predictions of voting behavior (though maybe enough)
• Forest has more branches, more variables
• Summary of forest• More variables used
19
bottom left of dialog
Wharton Department of Statistics
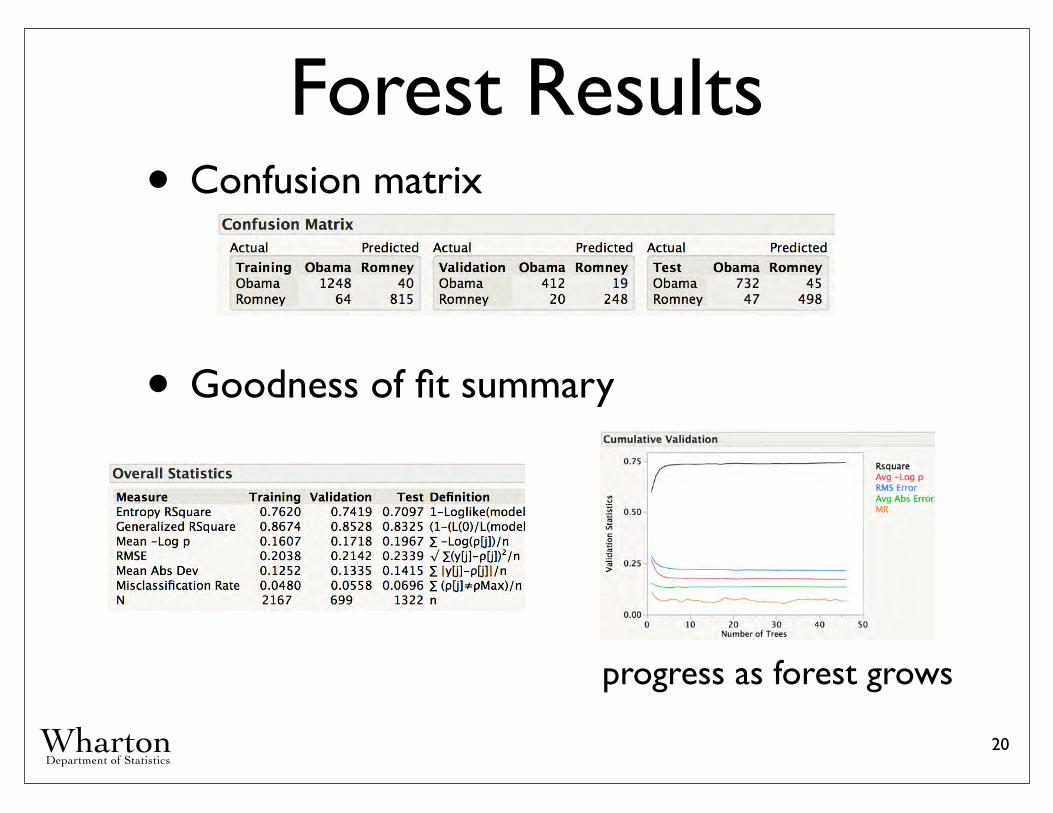
Forest Results• Confusion matrix
• Goodness of fit summary
20
progress as forest grows
Wharton Department of Statistics
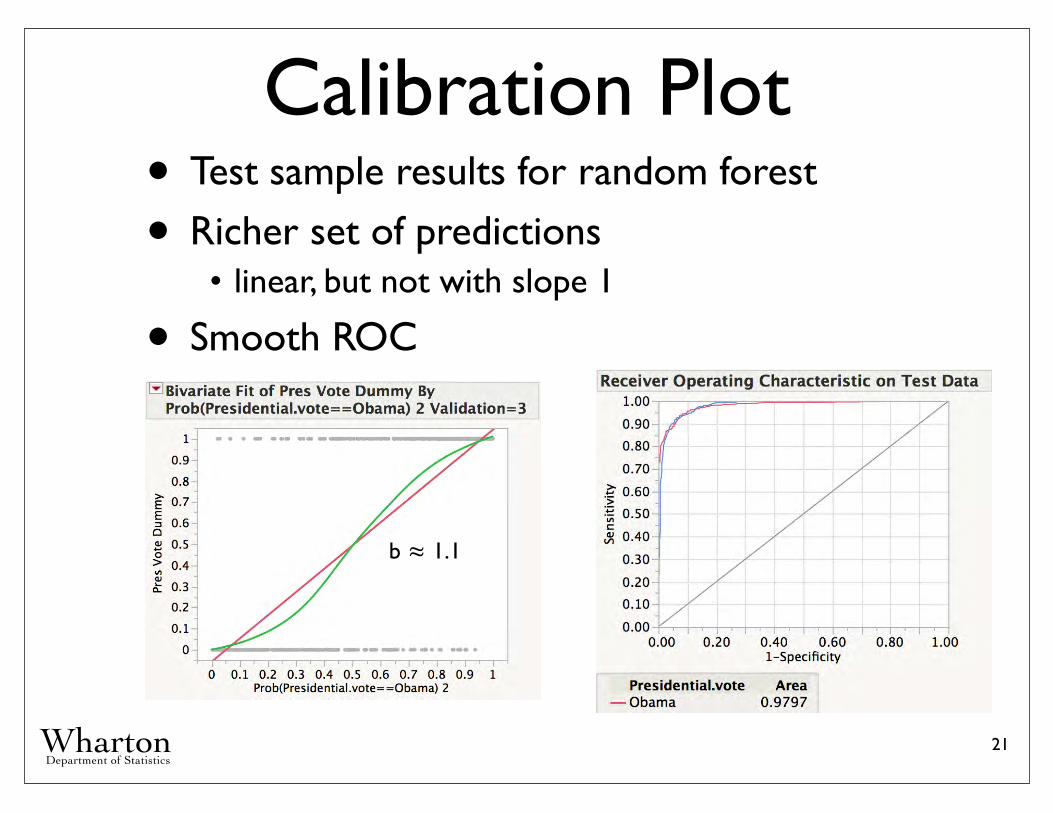
Calibration Plot• Test sample results for random forest
• Richer set of predictions• linear, but not with slope 1
• Smooth ROC
21
b ≈ 1.1
Wharton Department of Statistics
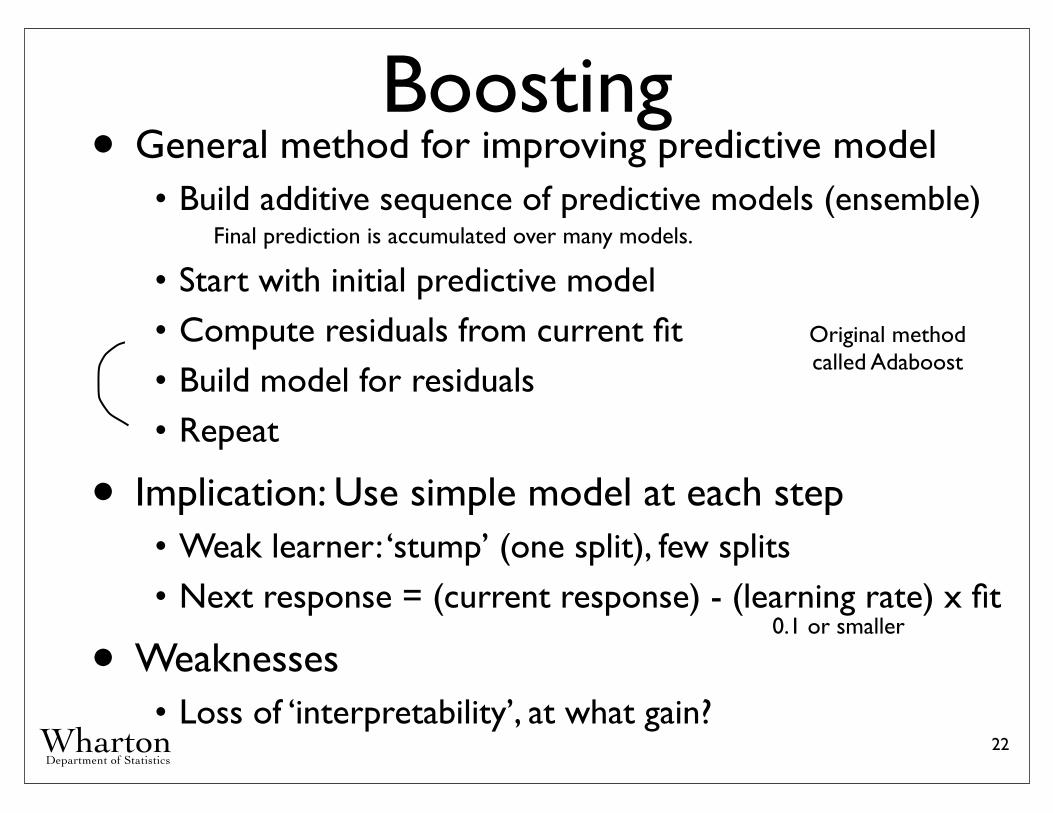
Boosting• General method for improving predictive model
• Build additive sequence of predictive models (ensemble)Final prediction is accumulated over many models.
• Start with initial predictive model• Compute residuals from current fit• Build model for residuals • Repeat
• Implication: Use simple model at each step• Weak learner: ‘stump’ (one split), few splits• Next response = (current response) - (learning rate) x fit
• Weaknesses• Loss of ‘interpretability’, at what gain?
22
0.1 or smaller
Original method called Adaboost
Wharton Department of Statistics
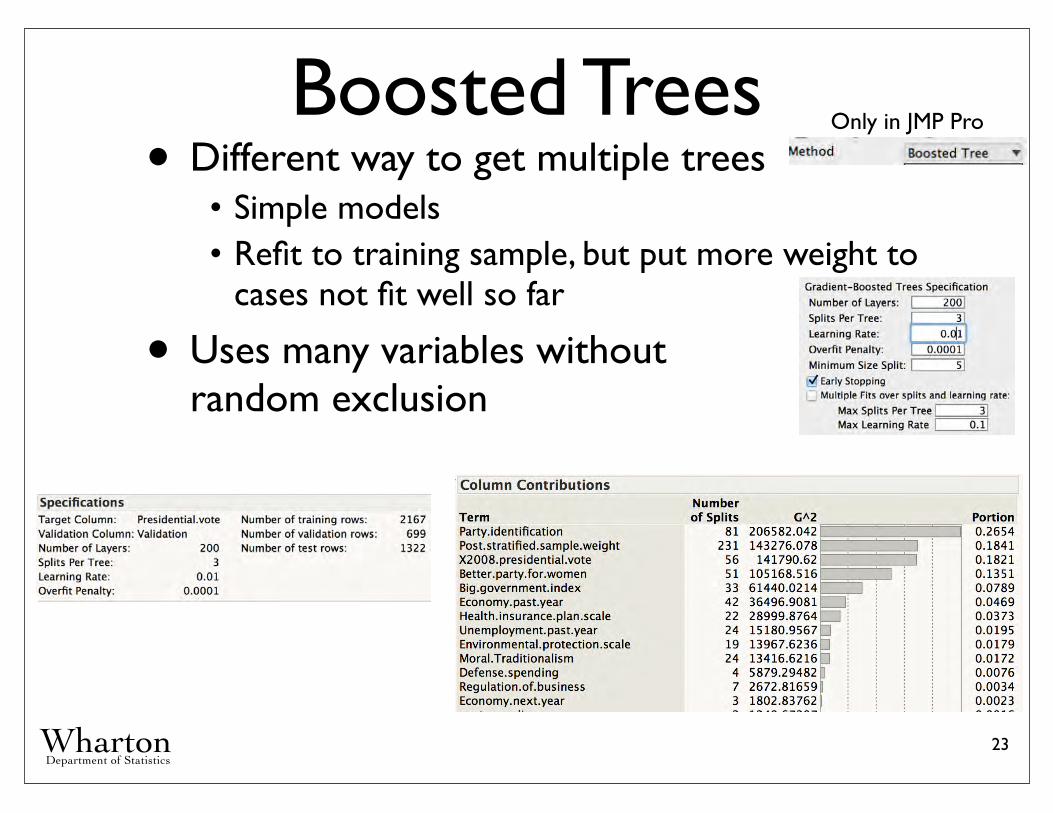
Boosted Trees• Different way to get multiple trees
• Simple models• Refit to training sample, but put more weight to
cases not fit well so far
• Uses many variables without random exclusion
23
Only in JMP Pro
Wharton Department of Statistics
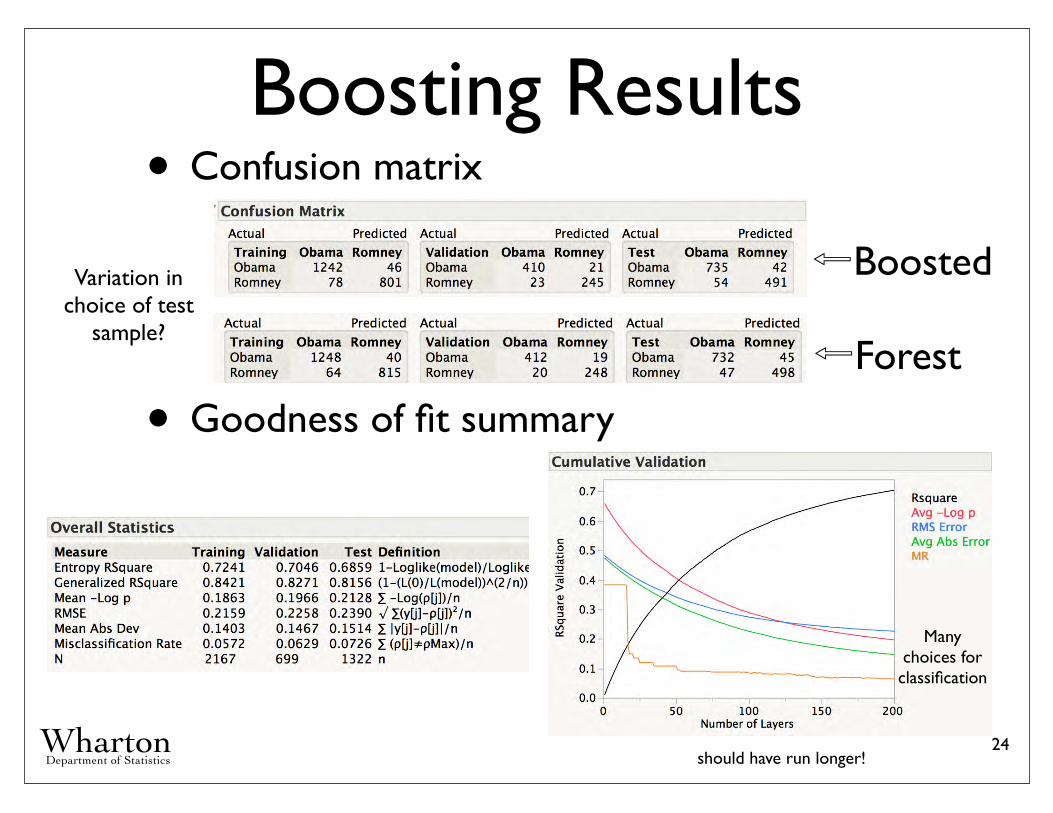
Boosting Results• Confusion matrix
• Goodness of fit summary
24
⇦Boosted
⇦Forest
Variation in choice of test
sample?
Many choices for
classification
should have run longer!
Wharton Department of Statistics
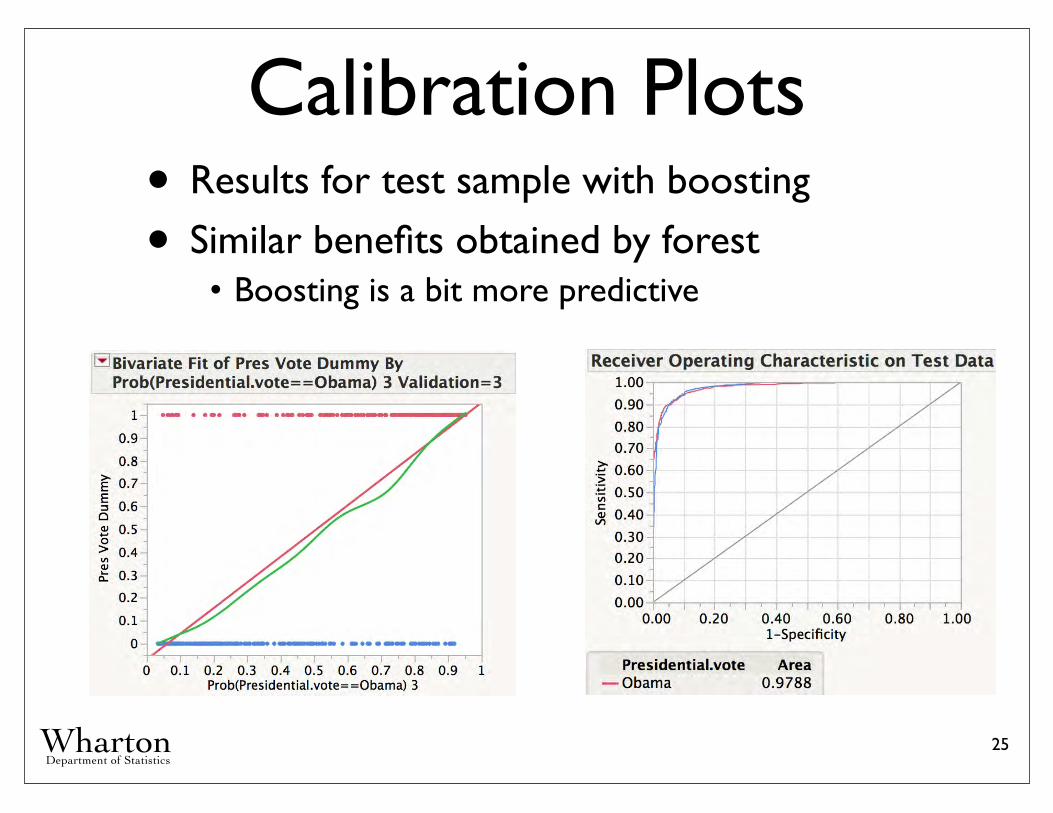
Calibration Plots• Results for test sample with boosting
• Similar benefits obtained by forest• Boosting is a bit more predictive
25
b ≈ 1.1
Wharton Department of Statistics
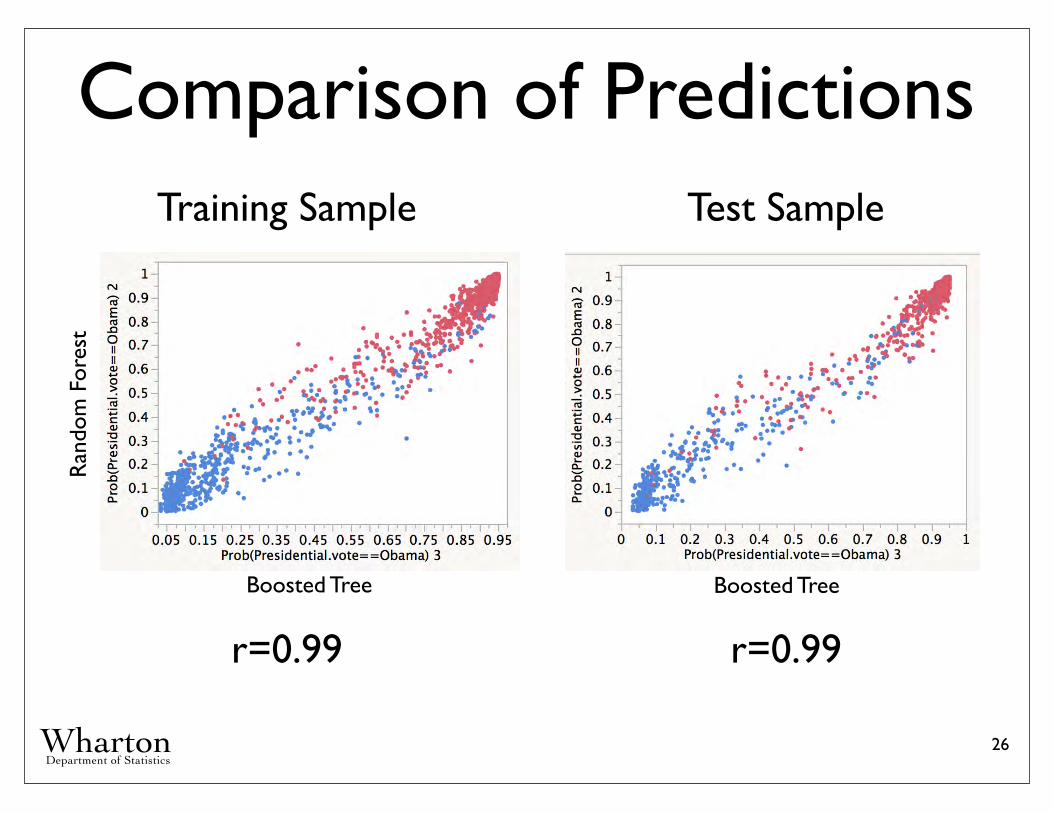
Comparison of Predictions
26
Training Sample Test Sample
r=0.99 r=0.99
Ran
dom
For
est
Boosted Tree Boosted Tree
Wharton Department of Statistics
Take-Aways• Classification and regression trees
• Partition cases into homogeneous subsetsRegression tree: small variation around leaf meanClassification tree: concentrate cases into one category
• Greedy, recursive algorithmVery fast
• Flexible, iterative implementation in JMPAlso found in several R packages (such as ‘tree’)
• Model averaging• Boosting, bagging smooth predictions• Borrow strength
• Over-fitting• Control with cross-validation• Analogous to use of CV in tuning Neural Net
27
Wharton Department of Statistics
Some questions to ponder...• How does a tree indicate the presence of
an interaction between factors?
• What does it mean when a tree splits many times on the same variable?
How might you remedy this problem?
• Why is it important (at least 2 reasons) to avoid categorical variables with many categories in trees?
• What does it mean to describe a tree as defined by recursive and binary cuts?
Why do it this way?
28
Wharton Department of Statistics
Next Time• Thursday
• Newberry Lab day for nets and trees
• Friday• Kernel methods and random projection• Text mining• Comparisons and summary
29