Class III and C & D Solid Waste Integrated Resource Plan library/water - garbage... · Class III...
28
Class III and C & D Solid Waste Integrated Resource Plan Stakeholder Meeting: Vision, Goals, Guiding Principles May 31, 2011
Transcript of Class III and C & D Solid Waste Integrated Resource Plan library/water - garbage... · Class III...
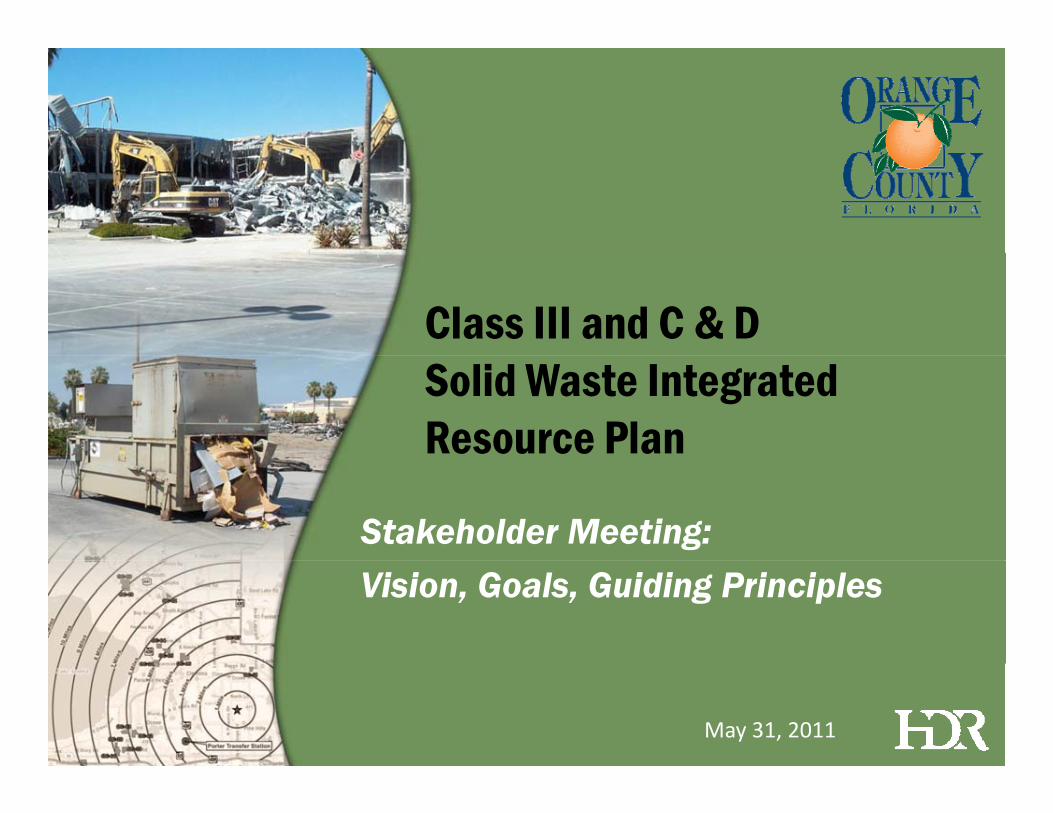
Class III and C & DSolid Waste Integrated Resource Plan
Stakeholder Meeting: Vision, Goals, Guiding Principles
May 31, 2011

Agenda
• Project Overview• Overview of Current Situation• Group Discussion – VisionGroup Discussion Vision• Group Discussion – Guiding PrinciplesG Di i G l• Group Discussion – Goals
• Group Discussion ‐ Strategies

Project Drivers
• Florida Statute Chapter 403 Amendments • Orange County Comprehensive Policy Plan• Orange County Green GovernmentOrange County Green Government Initiatives
• Development of a Sustainable Economy• Development of a Sustainable Economy• EECBG Funding• http://netapps.ocfl.net/arrapublic/ActiveProjects.aspx

Target Waste Type
• Class III and Construction and Demolition (C&D) Debris solid waste that is generated within or transported into the County
• Examples of Class III Waste:p– Yard trash, construction and demolition debris, processed tires, asbestos, carpet, cardboard, paper, glass, plastic, furniture other than appliances
Project Overview
• Assess the current situation• Establish vision, guiding principles and goals for the SWIRP
• Develop a ‘short‐list’ of strategies– Consider Vision, Guiding Principles, Goals
• Analyze short‐listed strategies– Triple bottom line approach
• Recommended strategies• Finalize the SWIRP

Overview of Current Situation
GenerationGeneration
Collection Marketing/ End Use
Processing Disposal

FDEP Reports for 2007
• 6.1 million tons of C&D was disposed in Florida’s 75 C&D disposal sites
• C&D constitutes 25% of Florida’s MSW waste stream or 8.2 million tons
• Currently only 27% or 2.1 million tons ofCurrently only 27% or 2.1 million tons of Florida’s C&D is recycled
Source: FDEP report:“75% Recycling Goal Report to the Legislature”, January of 2010

Class III Waste Disposed at Orange County Landfill Orange County Landfill
600,000
700,000
Yard Waste
Class III
400,000
500,000
200 000
300,000
Waste
100,000
200,000
0
Fi l YFiscal Year
Source: Orange County Landfill tonnage data

County Class III Generation Projections
County-Wide Class III and C&D Generation (Tons/Year)
Mid Point BetweenProjected in 2003 Adjusted Projection
Mid-Point Between 2003 and Adjusted
2010 1,413,698 633,605 ---
2020 1,693,229 749,900 1,221,600
2030 1,955,102 870,300 1,412,7002030 1,955,102 870,300 1,412,700
2040 2,246,112 999,800 1,623,000
2050 2 524 302 1 123 600 1 824 0002050 2,524,302 1,123,600 1,824,000Source 2003 Projection Data: Final Report Solid Waste Master Plan, Orange County Solid Waste Division (SCS Engineers, January 30, 2009)

UCF Project Overview Project Goals
• To improve the accuracy of C&D debrisTo improve the accuracy of C&D debris inventories
• To perform a C&D recovered material market analysis
• To promote C&D recycling by providing i f ti d l f b t tinformation and examples of best management practices
Overall Objective Overall Objective• To Increase C&D debris recycling efficiency in the State of Florida

Inventory Methodology Building permit data is linked to C&D activity to estimate the
mass of debris generated. • Area data for this study were given by Orange County’s Information Systems and Services (ISS) division.
• Where area data are unavailable, valuations for six C&D ,sectors are determined and divided by the average cost per area for each sector.
$
h l d ( / )
Area
Area$$
• Then, generation rates are applied (mass/area).
MassAreaMass Area

Benefits of Approach The resulting model can be:
• Used to determine historical trends for C&DUsed to determine historical trends for C&D debris generation
• Used to estimate future C&D debris generationoEconomic Drivers
Benefits• The building permit database is constantly updated allowing the model to be easily updated i ti lin a timely manner
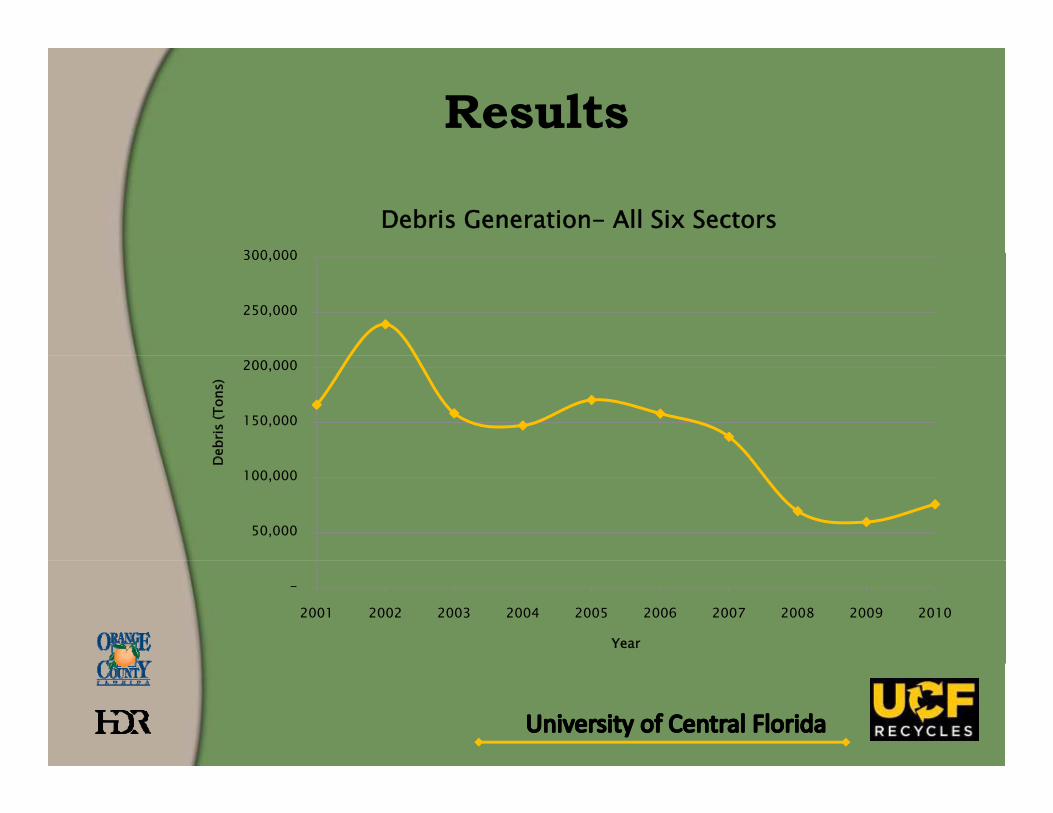
Results
300 000
Debris Generation- All Six Sectors
250,000
300,000
150,000
200,000
Deb
ris (T
ons)
50,000
100,000
D
-
2001 2002 2003 2004 2005 2006 2007 2008 2009 2010
Year

ComparisonLocation Year
C&D Debris Generation Rate
(pcd)
hi d
5.00
6.00
7.00
‐Day
This study (9‐Year Average) 2001‐2009 1.17
OC Data from FDEP Reports (9‐Year Average) 2001‐2009 3.91
1 00
2.00
3.00
4.00
Poun
ds/Cap
‐
UCF
FDEP
U.S. National Average Range 1977 .12‐3.52
U.S. National Avg. 1996 2.75
FL State Average 1995 2.01
South Carolina 1997 1.43
0.00
1.00
2000 2002 2004 2006 2008 2010
Year
South Carolina 1997 1.43
Australia 1997 .88‐2.19
Ireland 1997 0.96
FL State Average 2000 1.5
WA/DE/NH/VT/WI 2008 1 7WA/DE/NH/VT/WI 2008 1.7
California 2008 0.82
California 2009 1.2

Current Collection
• Provided by commercial haulers, demolition companies and other private entities.
• Anecdotally, 60 to 70% of the Class III waste delivered to County Landfill is yfrom licensed commercial haulers, remainder from homeowners and other private construction or hauling companies.

Current Collection
• Based on phone interviews:– Many hauling companies provide recycling by hauling source‐separated material directly to
d lprocessors or directly to a MRF • Mainly when customer requested LEED certification
D li i i id hi h l l f– Demolition companies provide a higher level of recycling (approximately 30 to 50%) to maximize project profitmaximize project profit

Current Processing and Disposal
• The extent of processing, and consequently disposal, varies throughout the County.
• There are a number of permitted C&D, Class III and mixed waste recycling (MRF) y gfacilities in Orange County. – Some of these facilities also handle waste from neighboring counties, and as far away as Hillsborough County and Pinellas County

Current Processing and Disposal
• Based on phone interviews, for those facilities where tipping fee data was available:– C&D processing fees vary from approximately $25 per ton to $41 per ton
– C&D disposal fees vary from approximately $18 per ton to $25 per ton

Current End Markets
• Data on historical trends in recycling markets for Target Waste Type is not readily available
• Traditional recyclables market data is available, and has been highly variableg y
• It is not clear whether the Target Waste Type recyclables markets have also beenType recyclables markets have also been as variable

End Use
U d C&D M i l N P d UUsed C&D Material New Product Use
Cardboard Raw materialRaw material for boxes andcontainers
Concrete Aggregate Base for road buildinggg g gDrainage applications/bankstabilization
Metal Raw materialRaw material for metalsfabricators
Plastic pipe Raw materialRaw material for plastic andpipe
Wood MulchLandscaping / Erosioncontrol
Industrial fuel sourceCompost additive/Soilamendment

Regulatory, Policies, General Climate State Level State Level
• FAC Amendments, Chapter 62‐701 (January 2010)– Specifically address CCA treated wood– Specifically address CCA treated wood– Prescribed liner system requirements for Class III landfills
• Florida Stat te Chapter 403 Amendments• Florida Statute Chapter 403 Amendments – 75% recycling goal by 2020– Requires each county to implement a program for recycling C&D waste
– All C&D waste must be processed prior to disposal– Requires reporting of amount of C&D waste q p gprocessed and recycled prior to disposal
– Presumption that C&D facilities will be required to have liners

Regulatory, Policy, General Climate County LevelCounty Level
• Orange County Green Government Initiatives– Orange County targets for its Climate Change Plan– Orange County targets for its Climate Change Plan (Reductions based on 2005 GHG emissions):
• 15% reduction by 2010• 28% reduction by 201528% reduction by 2015• 40% reduction by 2020
– Goal #5 ‐ “Adopt Policies to Support Recycling, Methane Recovery & Biomass Energy”y gy
• Objective G ‐ Increase existing recycling goals for private landfills
• Objective H ‐ Help establish local markets for recycled construction materialsconstruction materials
– Goal #7 ‐ “Adopt Policies to Support Green Buildings”
Regulatory, Policy, General ClimateCounty Comprehensive Policy PlanCounty Comprehensive Policy Plan
• The “Conservation Element” objective OBJ C1.10‐ “Orange j gCounty shall conserve energy resources for future generations– policy C1.10.3 : “Orange County shall investigate and implement
alternative means of reducing the County's solid waste and dependency on fossil fuels ”dependency on fossil fuels.
• The “Solid Waste Element” relevant policies:– SW1.1.13 The County shall encourage and support the
permitting of Class III or Construction and Demolition landfills p gover a wide geographic area
– SW1.2.2 Orange County shall continue to promote private sector participation in resource recovery systems to the extent feasibleSW1 2 7 Orange County shall support the establishment of a– SW1.2.7 Orange County shall support the establishment of a wallboard recycling facility and discourage the land filling of wallboard from private and public disposal facilities

Highlights
• Class III and C&D Waste will continue to be generatedgenerated
• Based on the reported information, approximately 20% of the C&D waste stream is being recycled C db d d l b h• Concrete, cardboard and metal appear to be the most commonly and easily recycled materials
• Reporting of amount generated and recycled is not p g g yconsistent
• Barriers to recycling:Lack of Established End Markets– Lack of Established End Markets
– Landfilling Affordability vs. the Cost to Recycle– Lack of Infrastructure

Vision for the SWIRP
• Provides a theme for the SWIRPE l f Vi i St t t• Examples of a Vision Statement:– Design long‐term, sustainable, integrated waste management solutions for the Target Waste Types in Orange County.”
– “No unprocessed Target Waste Types will be delivered to landfills for disposal.” p
– “Promote private sector participation in resource recovery systems for Target Waste Types in Orange County”Types in Orange County
• Group Discussion
Guiding Principles for the SWIRP
• Provide insight into shaping the goals of the projectproject.
• Community specific (reflect community values)• Examples of Guiding Principles:Examples of Guiding Principles:
– “Create Green jobs” – “Establish Public/private partnerships” – “County leadership as a model for diversion practices”
– “Protect public health and the environment”Protect public health and the environment
• Group Discussionp

Goals for the SWIRP
• Specific to the SWIRP • Reflect the vision and guiding principlesReflect the vision and guiding principles• Measurable (quantitative or qualitative)• Examples of Goals:
– “60% diversion of Target Waste Types by 2015”– “Develop and adopt new rules and incentives to reduce
Target Waste disposal”“Att t t l t t d k t tl l ki– “Attract at least two new end markets currently lacking for Target Waste Types in Orange County by 2015”
– “Create at least 50 new jobs associated with recycling by 2015”2015
• Group Discussion

Strategies for the SWIRP
• Group Discussion– Incentives– Policies– Regulations– Specificationsp