Class G Airspace Survey Data Report v1 - Home - UKFSC Briefings _ Presentations/ATM - Class... ·...
79
Class G Airspace Modelling Feasibility Study Dissemination of Survey Data
Transcript of Class G Airspace Survey Data Report v1 - Home - UKFSC Briefings _ Presentations/ATM - Class... ·...

Class G Airspace Modelling Feasibility Study
Dissemination of Survey Data

QINETIQ/10/02788 Page 2
Executive Summary Part of the remit of the Airspace and Safety Initiative (ASI), chaired by the CAA, is to enhance safety of airspace users operating outside controlled airspace. A particular problem in this respect is that, due to the lack of any general requirement to carry radios, transponders or file a flight plan, there are no accurate statistics detailing the number of flights that take place in Class G airspace. Furthermore, any changes to the size and shape of controlled airspace will result in an equal and opposite change to the size and shape of uncontrolled airspace. To properly assess such changes, the level of traffic in both controlled and uncontrolled (i.e. Class G) airspace needs to be understood.
To address these concerns, the ASI commissioned QinetiQ to conduct a 6-month feasibility study in April 2010 to determine the viability of using computer modelling techniques to predict the level of activity taking place within Class G airspace. The provision of data from users of Class G airspace formed a key input to the study. Moreover, it is recognised that the information supplied to the project provides a valuable insight into the operating and behavioural patterns of different airspace user groups.
Detailed analysis of the data obtained from the various surveys is provided in this report. It is hoped that by publishing this information, individual airspace users will have a better understanding of what other Class G airspace users are likely to be doing, and this increased awareness should improve overall safety.
In order to obtain relevant data for the feasibility study, a number of surveys were designed and circulated to pilots, airfields and individuals with specialist knowledge of specific types of activity known to take place in Class G airspace. This document provides a statistical summary of the information that was supplied through these surveys.
Whilst the information in this document has been checked for obvious errors and is considered to be credible, its authenticity and accuracy cannot be guaranteed. Furthermore, due to the anonymous nature of the on-line survey, we have no means of verifying whether the data provided is an accurate reflection of the activity that actually takes place in Class G airspace.
QINETIQ/10/02788 Page 3
Abbreviations AGL Above Ground Level
ANO Air Navigation Order
AOC Air Operator Certificate
AOPA Aircraft Owners and Pilots Association
ASI Airspace and Safety Initiative
ATZ Aerodrome Traffic Zone
BGA British Gliding Association
BHPA British Hang Gliding and Paragliding Association
BMAA British Microlight Aircraft Association
CAA Civil Aviation Authority
IFR Instrument Flight Rules
ILS Instrument Landing System
IMC Instrument Meteorological Conditions
JAA Joint Aviation Authorities
km Kilometres
kt Knots (nautical miles per hour)
LAA Light Aircraft Association
MOD Ministry of Defence
mph Miles per hours
MTOM Maximum Take-Off Mass
MTW Mountain Wave
NM Nautical Miles
NPPL National Private Pilot’s Licence
P1/S Flight by a qualified pilot with an Instructor or Examiner present
PPL(H) Private Pilot’s Licence (Helicopter)
PUT Pilot Under Tuition (i.e. not acting as Pilot-in-Command)
QFE Height above aerodrome
SE Single Engine
SEP Single Engine Piston
SPHG Self-Propelled Hang Glider
SR Sunrise
SS Sunset
SVFR Special VFR
TE Twin Engine
VFR Visual Flight Rules

QINETIQ/10/02788 Page 4
List of contents Executive Summary 2
Abbreviations 3
List of contents 4
1 Introduction 5
1.1 Background 5
1.2 On-Line Survey 5
1.3 Specific Activity Questionnaires 6
1.4 Caveat 6
1.5 Structure of this Report 6
1.6 Acknowledgements 7
2 Hot Air Balloon Activity 8
3 Foot Launched Motor Paraglider Activity 13
4 Glider Activity 19
5 Gyrocopter Activity 26
6 Flexwing Microlight Activity 31
7 Fixed Wing Microlight Activity 37
8 Hang Gliding Activity 43
9 Paragliding Activity 49
10 Single Engine Helicopter Activity 55
11 Twin Engine Helicopter Activity 61
12 Single Engine Piston Activity (450-5700 kg) 67
13 Light Twin Activity (<5,700 kg) 72
14 Parachute Aircraft Activity 78
15 Summary 79

QINETIQ/10/02788 Page 5
1 Introduction
1.1 Background
Part of the remit of the Airspace and Safety Initiative (ASI), chaired by the CAA, is to enhance safety of airspace users operating outside controlled airspace. A particular problem in this respect is that, due to the lack of any general requirement to carry radios, transponders or file a flight plan, there are no accurate statistics detailing the number of flights that take place in Class G airspace. Furthermore, any changes to the size and shape of controlled airspace will result in an equal and opposite change to the size and shape of uncontrolled airspace. To properly assess such changes, the level of traffic in both controlled and uncontrolled (i.e. Class G) airspace needs to be understood.
To address these concerns, the ASI commissioned QinetiQ to conduct a 6-month feasibility study in April 2010 to determine the viability of using computer modelling techniques to predict the level of activity taking place within Class G airspace. The provision of data from users of Class G airspace formed a key input to the study. Moreover, it is recognised that the information supplied to the project provides a valuable insight into the operating and behavioural patterns of different airspace user groups.
Detailed analysis of the data obtained from the various surveys is provided in this report. It is hoped that by publishing this information, individual airspace users will have a better understanding of what other Class G airspace users are likely to be doing, and this increased awareness should improve overall safety. A good analogy in this respect is road safety; safe drivers will understand other road users’ needs, and anticipate their actions.
1.2 On-Line Survey
An on-line survey was developed for the purpose of obtaining information from individual pilots about the type of flying undertaken, the number of hours flown and the nature of activities conducted. Individuals were asked to describe the type of aircraft they fly, the capacity in which they fly (i.e. student, qualified pilot, instructor etc.) and summarise the flights recorded in their log books for the past 12 months.
Over 1,600 people participated in the on-line survey, and this has enabled a statistical picture to be produced for many of the popular types of aviation activity. This data is summarised in the following sections.
The survey deliberately did not ask for personal details, and the information provided cannot be traced to specific individuals.

QINETIQ/10/02788 Page 6
1.3 Specific Activity Questionnaires
In order to gain detailed information about specific activities, a set of ‘long answer’ questionnaires were designed. These were sent to national organisations representing the interests of each activity such as the BGA, BMAA, LAA, and AOPA. The questionnaires were then forwarded to individuals with extensive experience of the activity, and in particular, those with knowledge of particular aspects of the activity. For example, the Gliding surveys were forwarded by the BGA to individuals with experience in the following specific areas:
���� Ab-initio training
���� Local Area Cross-Country
���� Cross-Country Competitions
���� Aerobatics
���� Wave Cross-Country
This cascade approach ensured that information was gathered from a wide range of activities conducted in Class G airspace.
1.4 Caveat
This report provides a statistical summary of the information supplied to the ASI through the various surveys that were conducted as part of the Class G Airspace Modelling ‘Pilot’ study. Whilst the information has been checked for obvious errors and is considered to be credible, its authenticity and accuracy cannot be guaranteed. Furthermore, due to the anonymous nature of the on-line survey, we have no means of verifying whether the data provided is an accurate reflection of the activity that actually takes place in Class G airspace.
1.5 Structure of this Report
Following this introductory section, summary data for the various types of activity conducted in Class G airspace is provided. The following airspace user categories are provided:
• Hot Air Balloon • Paraglider
• Foot Launched Motor Paraglider • Single Engine Helicopter
• Glider • Twin Engine Helicopter
• Gyrocopter • Single Engine Piston (450-5700 kg)
• Flexwing Microlight • Light Twin (<5700 kg)
• Fixed Wing Microlight • Parachute Aircraft
• Hang Glider
Each section has the same sub-headings to allow comparative analysis.

QINETIQ/10/02788 Page 7
1.6 Acknowledgements
The information contained in this report has been assembled from the responses that individuals and stakeholder organisations have provided in connection with the Class G airspace feasibility study. Over 1,600 individuals provided responses to the on-line survey; we also received detailed information from civil airfields, military units, flying clubs and groups representing a wide range of general aviation activities.
Whilst it is not possible to mention each and every person that contributed, the ASI would like to specifically acknowledge the contribution made by the following organisations:
Abingdon (612 Sqn VGS)
Aircraft Owners and Pilots Association (AOPA)
Army Aviation Centre, Middle Wallop
Black Mountains Gliding Club
Bustard Flying Club
British Gliding Association (BGA)
British Hang Gliding & Paragliding Association (BHPA)
British Microlight Aircraft Association (BMAA)
Cabair Helicopters Ltd
Cheshire Helicopters
Chilbolton Flying Club
Civil Aviation Authority
DAATM
Devon & Somerset Gliding Club
Empire Test Pilots School, Boscombe Down
Farnborough Airport (TAG Aviation)
Flying TV Ltd
GS Aviation (Clench Common)
Kestrel Gliding Club
Light Aircraft Association (LAA)
London Gliding Club
London Oxford Airport
Oakley Flying Club
NATS Ltd
PDG Helicopters
Pennine Helicopters Ltd
RAF Benson
RAF Boscombe Down
RAF Brize Norton
RAF Odiham
RAF Lyneham
Redlands Airfield
Scottish Gliding Association
Skydive London
Southern Sailplanes
Southampton University Air Squadron
Starspeed Ltd
Thruxton Airfield
West London Aero Club
Western Power Distribution

QINETIQ/10/02788 Page 8
2 Hot Air Balloon Activity
2.1 General Requirements
Unfortunately, no specific activity questionnaires have been received from Hot Air Balloon pilots. The following information has been obtained from commercial balloon operator websites.
2.1.1 Air Stability
Balloon flights require stable air, with no strong thermals or temperature inversions.
2.1.2 Visibility
In the UK hot air balloon flights are carried out under Visual Flight Rules (VFR). This requires the predicted visibility for any planned flight to be as follows:
At heights of below 3,000 ft:
� Clear of cloud
� In sight of ground
� 1NM horizontal flight visibility (private flight)
� 3NM horizontal flight visibility (commercial flight)
At heights of 3,000 ft or more:
� 1.5 NM horizontal clearance to cloud
� 1,000 ft vertical clearance to cloud
� 5 NM horizontal flight visibility (for commercial flights)
Additionally it must be possible to maintain a 500 ft clearance to any person, vessel, vehicle or structure (except during take-off and landing).
2.1.3 Wind Speed
The maximum permitted wind speed at ground level will be between 10 and 15 kt depending on the size of balloon.
2.1.4 Cloud Base
No limits stated.

QINETIQ/10/02788 Page 9
2.2 On-Line Survey
2.2.1 Sample Size
A total of 45 valid responses to the on-line survey were received from Hot Air Balloon pilots. This can be summarised as follows:
Student Pilots 0
Qualified Pilots 32
Instructors 3
Commercial Pilots 10
Examiners 0
Note: Analysis is not provided for instructors as the sample size is too small.
2.2.2 Annual Logged Hours
The average (annual) logged hours for Hot Air Balloon pilots were as follows:
Total PUT or P1/S
Student Pilots - -
Qualified Pilots 31.3 3.0
Instructors N/A N/A
Commercial Pilots 43.6 0.8
Examiners - -
The maximum and minimum (annual) logged hours for Hot Air Balloon pilots were as follows:
Max. Min.
Student Pilots - -
Qualified Pilots 180 3
Instructors N/A N/A
Commercial Pilots 113 20
Examiners - -

QINETIQ/10/02788 Page 10
2.2.3 Operating Times
Users indicated the following split between hours flown on weekdays and weekend/bank holidays.
Weekday Weekend Bank Holiday
Student Pilots - -
Qualified Pilots 27.5% 72.5%
Instructors N/A N/A
Commercial Pilots 26.3% 73.7%
Examiners - -
Users indicated the likelihood of flying activity taking place during different periods throughout the day, for (i) weekdays and (ii) weekend/bank holidays. For each series, the sum of the values over the 24 hour period equals 1.0 (i.e. 100%). Note: this chart does not show the amount of flying that takes place, and for example, a higher weekday value compared to weekend value does not necessarily mean that more flying takes place on weekdays.
SR-0900 0900-1230 1230-1600 1600-SSSS-2200
2200-SR
0.0
0.1
0.2
0.3
0.4
0.5
0.6
Weekday Weekend
This shows a strong preference to operate between sunrise (SR) and 0900, and between 1600 and sunset (SS), both on weekdays and weekends/bank holidays.

QINETIQ/10/02788 Page 11
2.2.4 Flight Duration
By dividing the total hours by the number of flights made, it is possible to derive the average (mean) flight duration.
Total Hours No. Flights Ave. Duration (h:mm)
Student Pilots - - -
Qualified Pilots 31.3 31.2 1:00
Instructors N/A N/A N/A
Commercial Pilots 43.6 42.7 1:01
Examiners - - -
The following table indicates the percentage distribution of flights in terms of their duration.
0-2 h 2-3 h 3-4 h 4-5 h ≥ 5h
Student Pilots - - - - -
Qualified Pilots 88.6% 9.1% 1.3% 0.5% 0.5%
Instructors N/A N/A N/A N/A N/A
Commercial Pilots 98.1% 1.6% 0.3% 0.0% 0.0%
Examiners - - - - -
2.2.5 Type of Flights
Balloon pilots indicated the following split between ‘Return-to-Base’ and ‘Land Away’ flights.
Return-to-Base
Land Away
Student Pilots - -
Qualified Pilots 0% 100%
Instructors 0% 100%
Commercial Pilots 0% 100%
Examiners - -
Observation: As balloons rarely land at the same place they lift-off from, the above figures are entirely expected.
QINETIQ/10/02788 Page 12
2.2.6 Operating Area
Balloon pilots indicated the percentage of flights conducted within different distances of the launch site.
2.5 NM 10 NM 25 NM 50 NM (or more)
Student Pilots - - - -
Qualified Pilots 35% 49% 7% 9%
Instructors N/A N/A N/A N/A
Commercial Pilots 3% 32% 65% 0%
Examiners - - - -
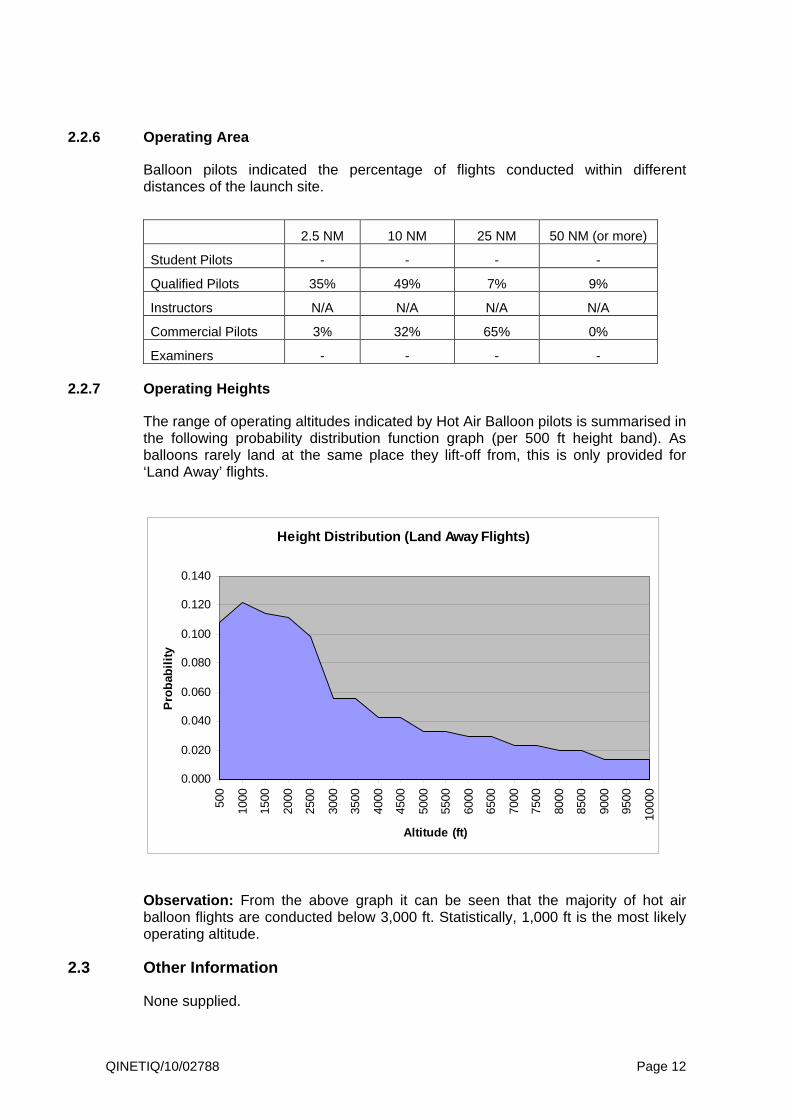
2.2.7 Operating Heights
The range of operating altitudes indicated by Hot Air Balloon pilots is summarised in the following probability distribution function graph (per 500 ft height band). As balloons rarely land at the same place they lift-off from, this is only provided for ‘Land Away’ flights.
Height Distribution (Land Away Flights)
0.000
0.020
0.040
0.060
0.080
0.100
0.120
0.140
500
1000
1500
2000
2500
3000
3500
4000
4500
5000
5500
6000
6500
7000
7500
8000
8500
9000
9500
1000
0
Altitude (ft)
Pro
bab
ilit
y
Observation: From the above graph it can be seen that the majority of hot air balloon flights are conducted below 3,000 ft. Statistically, 1,000 ft is the most likely operating altitude.
2.3 Other Information
None supplied.

QINETIQ/10/02788 Page 13
3 Foot Launched Motor Paraglider Activity
3.1 General Requirements
The following information about Foot Launched Motor Paraglider activity has been supplied by the BHPA.
3.1.1 Air Stability
Stable, dry air is generally required for operation to take place.
3.1.2 Visibility
Operation in accordance with Visual Flight Rules (VFR). A minimum visibility of 5 km is required.
3.1.3 Wind Speed
Operation will generally take place if the surface wind is less than 15 mph (and from an appropriate direction for the launch site).
3.1.4 Cloud Base
No limits specified.
3.2 On-Line Survey
3.2.1 Sample Size
A total of 26 valid responses to the on-line survey were received from Foot Launched Motor Paraglider pilots. This can be summarised as follows:
Student Pilots 3
Qualified Pilots 19
Instructors 4
Examiners 0
Note: Analysis is not provided for student and instructors as the sample size is too small.

QINETIQ/10/02788 Page 14
3.2.2 Annual Logged Hours
The average (annual) logged hours for Foot Launched Motor Paraglider pilots were as follows:
Total PUT or P1/S
Student Pilots N/A N/A
Qualified Pilots 43.8 12.0
Instructors N/A N/A
Examiners - -
The maximum and minimum (annual) logged hours for Foot Launched Motor Paraglider pilots were as follows:
Max. Min.
Student Pilots N/A N/A
Qualified Pilots 100 10
Instructors N/A N/A
Examiners - -
3.2.3 Operating Times
Users indicated the following split between hours flown on weekdays and weekend/bank holidays.
Weekday Weekend Bank Holiday
Student Pilots N/A N/A
Qualified Pilots 38.6% 61.4%
Instructors N/A N/A
Examiners - -
Users indicated the likelihood of flying activity taking place during different periods throughout the day, for (i) weekdays and (ii) weekend/bank holidays. For each series, the sum of the values over the 24 hour period equals 1.0 (i.e. 100%). Note: this chart does not show the amount of flying that takes place, and for example, a higher weekday value compared to weekend value does not necessarily mean that more flying takes place on weekdays.

QINETIQ/10/02788 Page 15
SR-09000900-1230 1230-1600
1600-SSSS-2200
2200-SR
0.00
0.05
0.10
0.15
0.20
0.25
0.30
0.35
0.40
0.45
Weekday Weekend
Observation: This shows that the most popular time for operation is 1600 to sunset on a weekday. Early morning flights are also quite popular during the week, suggesting that some pilots will take the opportunity to fly either side of the normal working day, if weather permits.
3.2.4 Flight Duration
By dividing the total hours by the number of flights made, it is possible to derive the average (mean) flight duration.
Total Hours No. Flights Ave. Duration (h:mm)
Student Pilots N/A N/A N/A
Qualified Pilots 43.8 42.8 1:01
Instructors N/A N/A N/A
Examiners - - -
The following table indicates the percentage distribution of flights in terms of their duration.
0-2 h 2-3 h 3-4 h 4-5 h ≥ 5h
Student Pilots N/A N/A N/A N/A N/A
Qualified Pilots 93.1% 6.1% 0.8% 0.0% 0.0%
Instructors N/A N/A N/A N/A N/A
Examiners - - - - -
QINETIQ/10/02788 Page 16
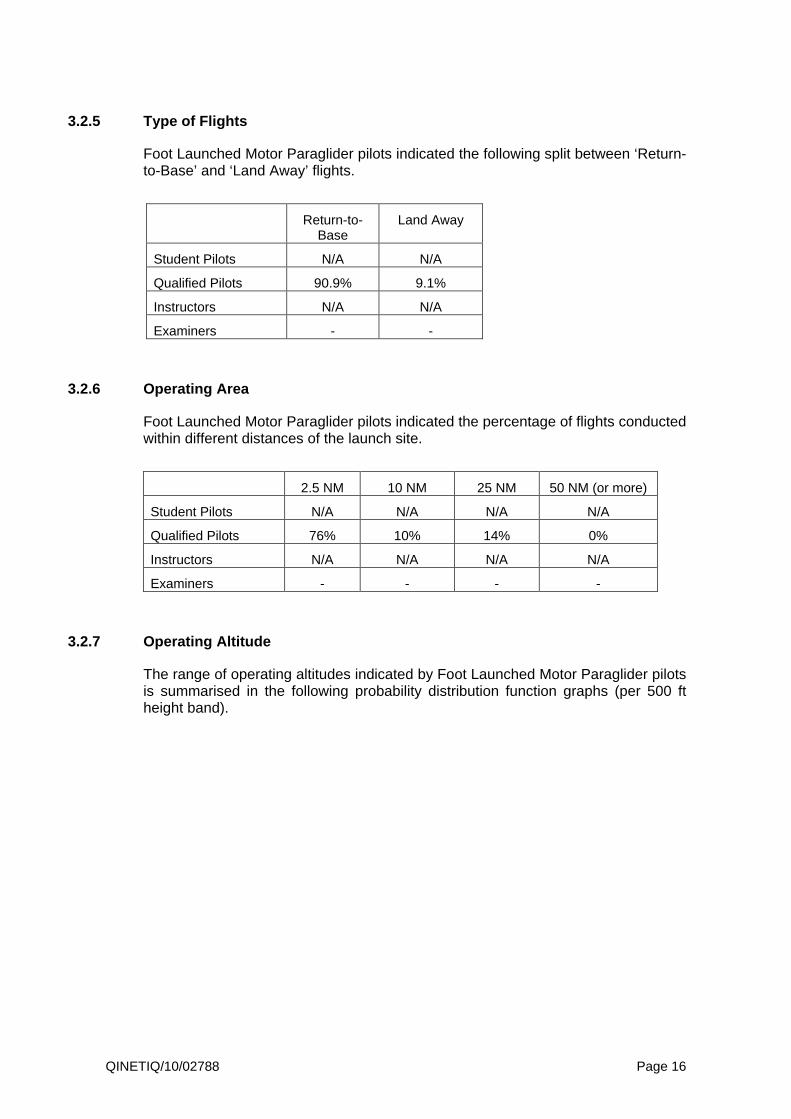
3.2.5 Type of Flights
Foot Launched Motor Paraglider pilots indicated the following split between ‘Return-to-Base’ and ‘Land Away’ flights.
Return-to-Base
Land Away
Student Pilots N/A N/A
Qualified Pilots 90.9% 9.1%
Instructors N/A N/A
Examiners - -
3.2.6 Operating Area
Foot Launched Motor Paraglider pilots indicated the percentage of flights conducted within different distances of the launch site.
2.5 NM 10 NM 25 NM 50 NM (or more)
Student Pilots N/A N/A N/A N/A
Qualified Pilots 76% 10% 14% 0%
Instructors N/A N/A N/A N/A
Examiners - - - -
3.2.7 Operating Altitude
The range of operating altitudes indicated by Foot Launched Motor Paraglider pilots is summarised in the following probability distribution function graphs (per 500 ft height band).

QINETIQ/10/02788 Page 17
Height Distribution (Return-to-Base Flights)
0.000
0.020
0.040
0.060
0.080
0.100
0.120
0.140
0.160
0.180
0.200
500
1000
1500
2000
2500
3000
3500
4000
4500
5000
5500
6000
6500
7000
7500
8000
8500
9000
9500
1000
0
Altitude (ft)
Pro
bab
ilit
y
Height Distribution (Land Away Flights)
0.000
0.020
0.040
0.060
0.080
0.100
0.120
0.140
0.160
0.180
0.200
500
1000
1500
2000
2500
3000
3500
4000
4500
5000
5500
6000
6500
7000
7500
8000
8500
9000
9500
1000
0
Altitude (ft)
Pro
bab
ilit
y
Observation: For local (return-to-base) flights that return to the launch site, the most likely operating altitude is around 1,000 ft, and few flights are conducted above 3,000 ft. For ‘Land Away’ flights, operation at greater altitude is more likely. It is worth noting that 1,500 ft to 2,000 ft is the most popular altitude range for cross-country flights.

QINETIQ/10/02788 Page 18
3.3 Other Information
The Air Navigation Order (ANO) defines this type of activity as “Self-Propelled Hang Glider” (SPHG) and includes powered paragliders and hang gliders.
BHPA Club Pilot (power) should remain within 2 NM of the launch site. The vast majority of other flights will be conducted within 5 NM of the launch site.
Foot Launched Motor Paraglider pilots are unlikely to penetrate Class D airspace, and will rarely operate inside an Aerodrome Traffic Zone (ATZ).
There are estimated to be around 1,000 active pilots in the UK. These machines are generally operated from a willing farmer’s field, so at any time when winds are light and the weather is dry – especially summer evenings, they may appear.
QINETIQ/10/02788 Page 19
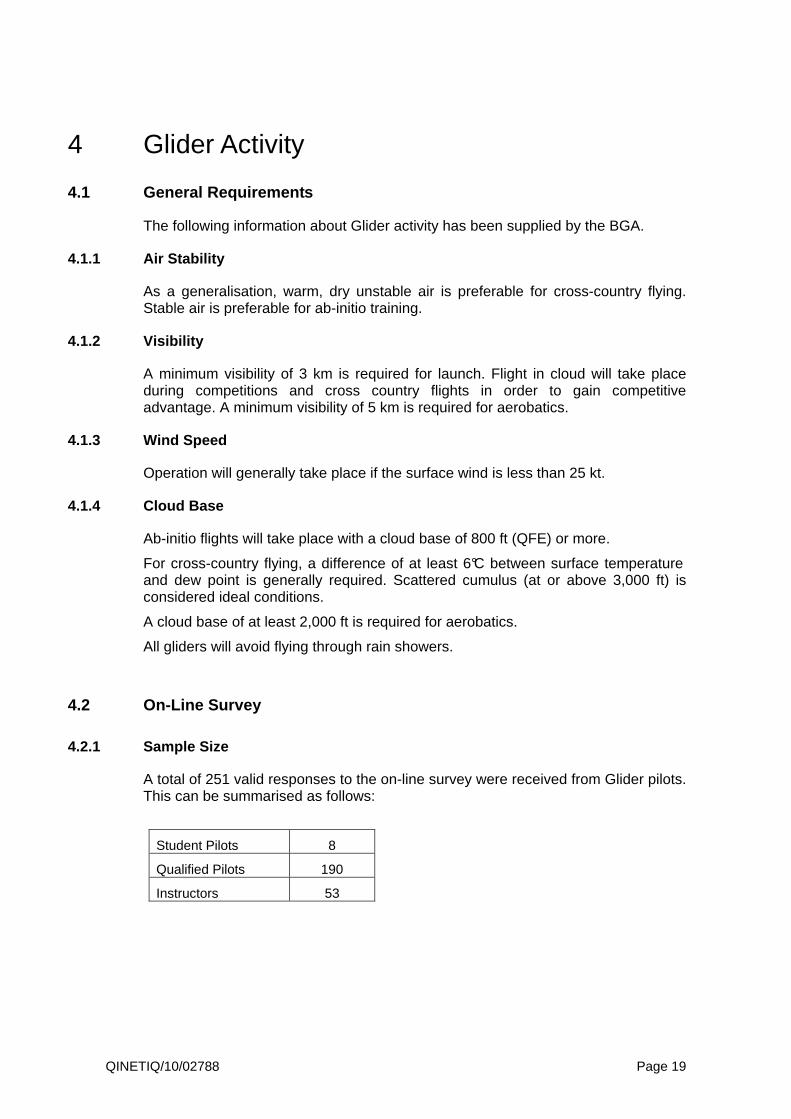
4 Glider Activity
4.1 General Requirements
The following information about Glider activity has been supplied by the BGA.
4.1.1 Air Stability
As a generalisation, warm, dry unstable air is preferable for cross-country flying. Stable air is preferable for ab-initio training.
4.1.2 Visibility
A minimum visibility of 3 km is required for launch. Flight in cloud will take place during competitions and cross country flights in order to gain competitive advantage. A minimum visibility of 5 km is required for aerobatics.
4.1.3 Wind Speed
Operation will generally take place if the surface wind is less than 25 kt.
4.1.4 Cloud Base
Ab-initio flights will take place with a cloud base of 800 ft (QFE) or more.
For cross-country flying, a difference of at least 6°C between surface temperature and dew point is generally required. Scattered cumulus (at or above 3,000 ft) is considered ideal conditions.
A cloud base of at least 2,000 ft is required for aerobatics.
All gliders will avoid flying through rain showers.
4.2 On-Line Survey
4.2.1 Sample Size
A total of 251 valid responses to the on-line survey were received from Glider pilots. This can be summarised as follows:
Student Pilots 8
Qualified Pilots 190
Instructors 53

QINETIQ/10/02788 Page 20
4.2.2 Annual Logged Hours
The average (annual) logged hours for Glider pilots were as follows:
Total PUT or P1/S
Student Pilots 21.0 13.5
Qualified Pilots 59.2 4.2
Instructors 67.2 1.6
The maximum and minimum (annual) logged hours for Glider pilots were as follows:
Max. Min.
Student Pilots 60 8
Qualified Pilots 214 8
Instructors 256 7
4.2.3 Operating Times
Users indicated the following split between hours flown on weekdays and weekend/bank holidays.
Weekday Weekend Bank Holiday
Student Pilots 50.3% 49.7%
Qualified Pilots 43.1% 56.9%
Instructors 34.3% 65.7%
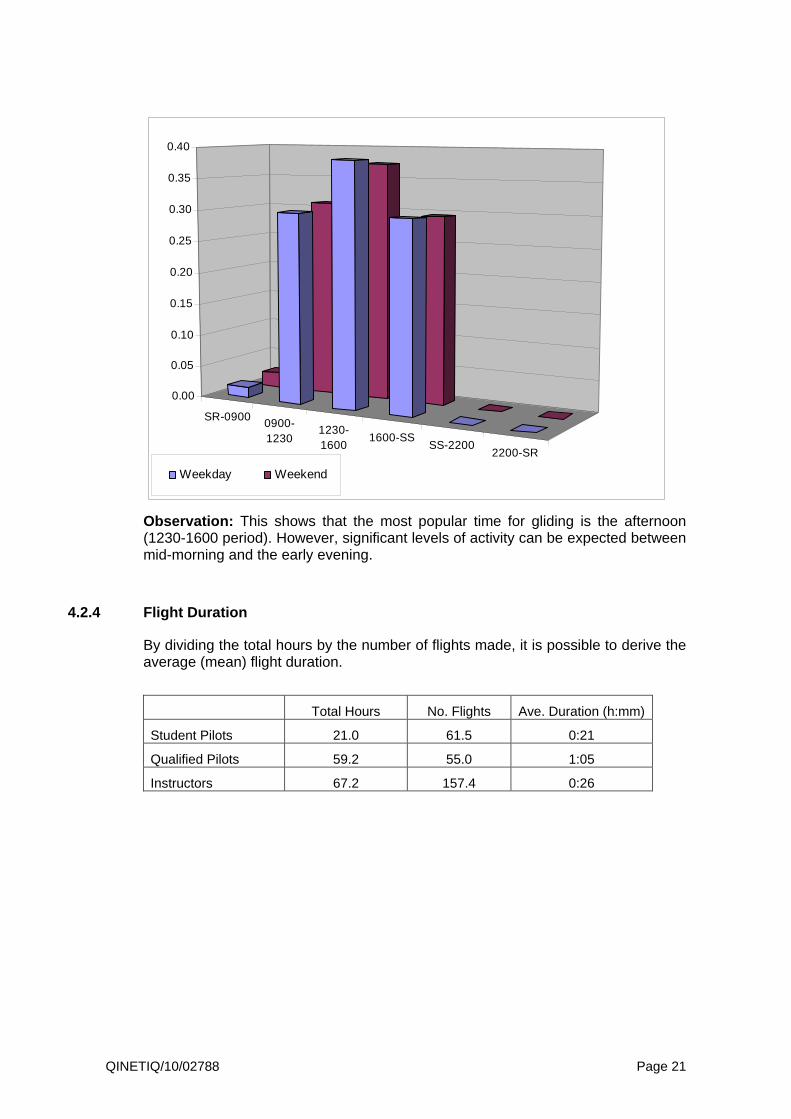
Users indicated the likelihood of flying activity taking place during different periods throughout the day, for (i) weekdays and (ii) weekend/bank holidays. For each series, the sum of the values over the 24 hour period equals 1.0 (i.e. 100%). Note: this chart does not show the amount of flying that takes place, and for example, a higher weekday value compared to weekend value does not necessarily mean that more flying takes place on weekdays.
QINETIQ/10/02788 Page 21
SR-09000900-1230
1230-1600
1600-SSSS-2200
2200-SR
0.00
0.05
0.10
0.15
0.20
0.25
0.30
0.35
0.40
Weekday Weekend
Observation: This shows that the most popular time for gliding is the afternoon (1230-1600 period). However, significant levels of activity can be expected between mid-morning and the early evening.
4.2.4 Flight Duration
By dividing the total hours by the number of flights made, it is possible to derive the average (mean) flight duration.
Total Hours No. Flights Ave. Duration (h:mm)
Student Pilots 21.0 61.5 0:21
Qualified Pilots 59.2 55.0 1:05
Instructors 67.2 157.4 0:26

QINETIQ/10/02788 Page 22
The following table indicates the percentage distribution of flights in terms of their duration.
0-2 h 2-3 h 3-4 h 4-5 h ≥ 5h
Student Pilots 97.6% 1.4% 0.5% 0.2% 0.2%
Qualified Pilots 64.6% 13.3% 9.9% 7.4% 4.9%
Instructors 89.9% 4.5% 2.3% 2.1% 1.2%
4.2.5 Type of Flights
Glider pilots indicated the following split between ‘Return-to-Base’ and ‘Land Away’ flights.
Return-to-Base
Land Away
Student Pilots 100% 0%
Qualified Pilots 95.5% 4.5%
Instructors 97.4% 2.6%
4.2.6 Operating Area
Glider pilots indicated the percentage of flights conducted within different distances of the launch site.
2.5 NM 10 NM 25 NM 50 NM (or more)
Student Pilots 100% 0% 0% 0%
Qualified Pilots 40% 14% 15% 31%
Instructors 88% 7% 4% 1%
4.2.7 Operating Altitude
The range in operating altitude indicated by Glider pilots is summarised in the following probability distribution function graphs (per 500 ft height band). These graphs show that there is very little difference in the height distribution profiles between ‘Return-to-Base’ and ‘Land Away’ flights. Furthermore, gliders are equally likely to operate at a wide range of altitudes of between 1,000 ft and 5,000 ft.

QINETIQ/10/02788 Page 23
Height Distribution (Return-to-Base Flights)
0.00
0.01
0.02
0.03
0.04
0.05
0.06
0.07
0.08
0.09
0.10
500
1000
1500
2000
2500
3000
3500
4000
4500
5000
5500
6000
6500
7000
7500
8000
8500
9000
9500
1000
0
Altitude (ft)
Pro
bab
ilit
y
Height Distribution (Land Away Flights)
0.00
0.01
0.02
0.03
0.04
0.05
0.06
0.07
0.08
0.09
0.10
500
1000
1500
2000
2500
3000
3500
4000
4500
5000
5500
6000
6500
7000
7500
8000
8500
9000
9500
1000
0
Altitude (ft)
Pro
bab
ilit
y
4.3 Other Information
The following additional information in response to the indicated questions was obtained from BGA Instructors:
QINETIQ/10/02788 Page 24
Winch Launches For a given site, do all winch launches release at roughly the same height?
“No. Winching can be quite hazardous and as a result much of the training is conducted in premature termination of the launch to make sure that the pupil can cope with the eventuality of a launch failure. As a result probably 30% are practice launch failures which might be terminated from 50 ft up to maximum launch height which is either determined by the CAA permission or conditions on the day. A normal full height launch in calm to moderate conditions is in the range of 800 ft to 1,200 ft AGL, but on windy days with lighter gliders this may well go much higher.”
What is the minimum time between winch launches?
“Time between launches on a busy day is about 20 seconds. We use a six drum winch and can therefore make six consecutive launches on these time scales with a 5 minute break whilst the six cables are drawn out to the launch point again. Although we have this capacity it is unusual for us to do more than about 100 winch launches on any day, based primarily on demand.”
Aero-tow Launches
What is a typical release height? “Many people release at about 2,000 ft but the answer on a soaring day is when we fly through good lift at a height where one could reasonably expect to get established and have a good days flying out of it. My average release height this season has been 1,400ft but the aerobatics pilots will often tow to 4,000ft. I am sure that if one were to draw a distribution curve then it would peak at about 2,000 ft and slant towards the higher side, with a few early releases for rope break practice at about 2-300ft then a gap to about 800ft being the lower end of the soaring pilots comfort zone for climbing away. Then an increasing distribution up to 2,000ft (a mental block that some pilots seem to have) and then a gentle tailing off towards the 4,000ft.”
Gliding Competitions
“Competition tasks cannot be set through class D airspace in the interests of fairness (some might be granted access whilst others not). They are nearly always routed through some local “Pinch Points” as it is almost impossible to avoid them. These include the western end of the Luton Zone, Benson/Brize/Lyneham and the two parachute drop zones at Weston on the Green and Hinton in the Hedges. These frequently cross the ILS into Oxford.” “Launching of a competition grid will not start until it is safe to keep 50 or more gliders soaring locally in the start zone and therefore during competitions, flying generally starts later in the day than during normal operations. The launch rate is faster but all aero-tow as opposed to a mixture of winch and aero-tow. The towing routes are defined and therefore there is a better flow of returning tugs than during normal operations, but is consequently more annoying to neighbours. As most tasks set are intended to be racing tasks the flight durations are normally less than during normal operations, so perhaps a task of 300-400 kms might be set in

QINETIQ/10/02788 Page 25
competition whereas under normal operations, with an earlier start and a later finish, tasks of 500km+ might have been set on the day.”
Wave Flying “Wave flying can be reasonably predicted by the appearance of “MTW” in the Met Office F215 aviation forecasts. This will generally result in flying above cloud base.”
“Flights conducted in Mountain Wave can typically be up to 6 hours in duration, and be conducted. Over the altitude range 6,000 – 10,000 ft.”
Weather Limitations
Gliders will not launch in rain, or if the flight is likely to encounter rain.
Gliders will not launch into low cloud.
Gliders will not launch with rain/snow/ice on any of the glider’s flying surfaces.

QINETIQ/10/02788 Page 26
5 Gyrocopter Activity
5.1 General Requirements
Unfortunately, no specific activity questionnaires have been received from Gyrocopter pilots or operators.
5.2 On-Line Survey
5.2.1 Sample Size
A total of 5 valid responses to the on-line survey were received from Gyrocopter pilots. This can be summarised as follows:
Student Pilots 0
Qualified Pilots 5
Instructors 0
Examiners 0
It is recognised that this is a very small sample size, and any statistical summary may not be truly representative of actual activity.
5.2.2 Annual Logged Hours
The average (annual) logged hours for Gyrocopter pilots were as follows:
Total PUT or P1/S
Student Pilots - -
Qualified Pilots 51.0 43.0
Instructors - -
Examiners - -
The maximum and minimum (annual) logged hours for Gyrocopter pilots were as follows:
Max. Min.
Student Pilots - -
Qualified Pilots 80 11
Instructors - -
Examiners - -

QINETIQ/10/02788 Page 27
5.2.3 Operating Times
Users indicated the following split between hours flown on weekdays and weekend/bank holidays.
Weekday Weekend Bank Holiday
Student Pilots - -
Qualified Pilots 34.0% 66.0%
Instructors - -
Examiners - -
Users indicated the likelihood of flying activity taking place during different periods throughout the day, for (i) weekdays and (ii) weekend/bank holidays. For each series, the sum of the values over the 24 hour period equals 1.0 (i.e. 100%). Note: this chart does not show the amount of flying that takes place, and for example, a higher weekday value compared to weekend value does not necessarily mean that more flying takes place on weekdays.
SR-09000900-1230
1230-1600
1600-SSSS-2200
2200-SR
0.00
0.05
0.10
0.15
0.20
0.25
0.30
0.35
0.40
0.45
Weekday Weekend
Observation: No clear patterns of activity can be seen from the above diagram, and this is potentially due to the small sample size. As might be expected, no flying occurs at night.
QINETIQ/10/02788 Page 28
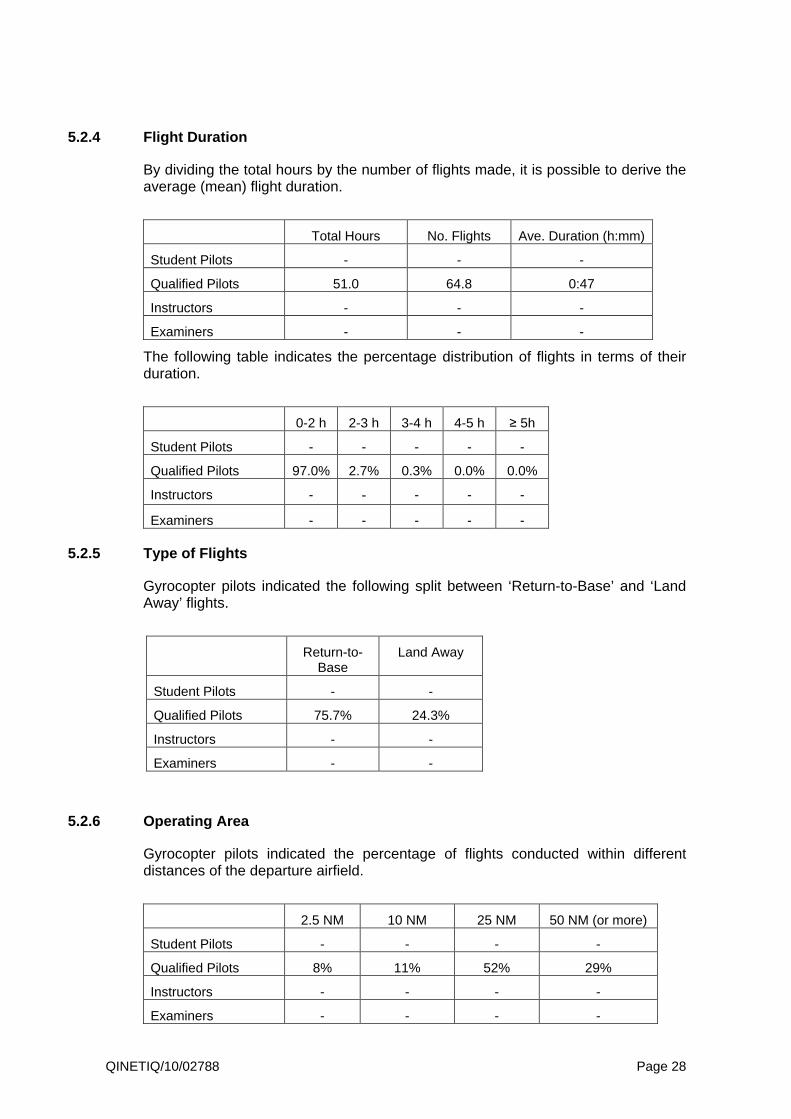
5.2.4 Flight Duration
By dividing the total hours by the number of flights made, it is possible to derive the average (mean) flight duration.
Total Hours No. Flights Ave. Duration (h:mm)
Student Pilots - - -
Qualified Pilots 51.0 64.8 0:47
Instructors - - -
Examiners - - -
The following table indicates the percentage distribution of flights in terms of their duration.
0-2 h 2-3 h 3-4 h 4-5 h ≥ 5h
Student Pilots - - - - -
Qualified Pilots 97.0% 2.7% 0.3% 0.0% 0.0%
Instructors - - - - -
Examiners - - - - -
5.2.5 Type of Flights
Gyrocopter pilots indicated the following split between ‘Return-to-Base’ and ‘Land Away’ flights.
Return-to-Base
Land Away
Student Pilots - -
Qualified Pilots 75.7% 24.3%
Instructors - -
Examiners - -
5.2.6 Operating Area
Gyrocopter pilots indicated the percentage of flights conducted within different distances of the departure airfield.
2.5 NM 10 NM 25 NM 50 NM (or more)
Student Pilots - - - -
Qualified Pilots 8% 11% 52% 29%
Instructors - - - -
Examiners - - - -

QINETIQ/10/02788 Page 29
5.2.7 Operating Altitude
The range of operating altitude indicated by Gyrocopter pilots is summarised in the following probability distribution function graphs (per 500 ft height band).
Height Distribution (Return-to-Base Flights)
0.00
0.05
0.10
0.15
0.20
0.25
0.30
500
1000
1500
2000
2500
3000
3500
4000
4500
5000
5500
6000
6500
7000
7500
8000
8500
9000
9500
1000
0
Altitude (ft)
Pro
bab
ilit
y
Height Distribution (Land Away Flights)
0.00
0.05
0.10
0.15
0.20
0.25
0.30
500
1000
1500
2000
2500
3000
3500
4000
4500
5000
5500
6000
6500
7000
7500
8000
8500
9000
9500
1000
0
Altitude (ft)
Pro
bab
ilit
y
Observation: For both ‘Return-to-Base’ and ‘Land Away’ flights, 1,500 ft is the most likely altitude. For ‘Land Away’ flights, operation is more likely to take place over a broader altitude range.

QINETIQ/10/02788 Page 30
5.3 Other Information
None supplied.
QINETIQ/10/02788 Page 31
6 Flexwing Microlight Activity
6.1 General Requirements
The following summary of general requirements about Flexwing Microlights was supplied by the BMAA.
6.1.1 Air Stability
“Flying Flexwing Microlights in turbulent air can be uncomfortable, and will discourage many pilots from flying in the middle part of the day (particularly during summer months).”
6.1.2 Visibility
“A visibility of at least 3 km is required outside controlled airspace. 10 km is required for SVFR inside controlled airspace.”
6.1.3 Wind Speed
“Surface winds of up to 15 kt are within the capability of most pilots flying modern aircraft. However, weight-shift microlights have no yaw control, and landing in a crosswind is a skilled technique using roll control alone. This limits the crosswind capabilities of the pilot. Most Flexwing Microlights are limited to about 10 kt of crosswind. However, because Microlights don’t need much space in which to take-off or land, it is often possible to use different runway/open areas to that in use by other aircraft with better crosswind capabilities.” “Flexwing Microlights have a relatively low cruising speed, and therefore wind speed can greatly influence range. If there is a significant difference in wind speed between the surface and a cruising level it is likely that a pilot will fly at a level that improves range, or restricts it the least.”
6.1.4 Cloud Base
“Due to the fact that most Microlight circuits are between 500 and 800 ft, it is not unusual for activity to take place with a cloud base as low as 1,000 ft.”
6.2 On-Line Survey
6.2.1 Sample Size
A total of 32 valid responses to the on-line survey were received from Flexwing Microlight pilots. This can be summarised as follows:

QINETIQ/10/02788 Page 32
Student Pilots 2
Qualified Pilots 28
Instructors 2
Examiners 0
Note: Analysis is not provided for student and instructors as the sample size is too small.
6.2.2 Annual Logged Hours
The average (annual) logged hours for Flexwing Microlight pilots were as follows:
Total PUT or P1/S
Student Pilots N/A N/A
Qualified Pilots 54.4 3.1
Instructors N/A N/A
Examiners - -
The maximum and minimum (annual) logged hours for Flexwing Microlight pilots were as follows:
Max. Min.
Student Pilots N/A N/A
Qualified Pilots 150 12
Instructors N/A N/A
Examiners - -
6.2.3 Operating Times
Users indicated the following split between hours flown on weekdays and weekend/bank holidays.
Weekday Weekend Bank Holiday
Student Pilots N/A N/A
Qualified Pilots 37.7% 62.3%
Instructors N/A N/A
Examiners - -
QINETIQ/10/02788 Page 33
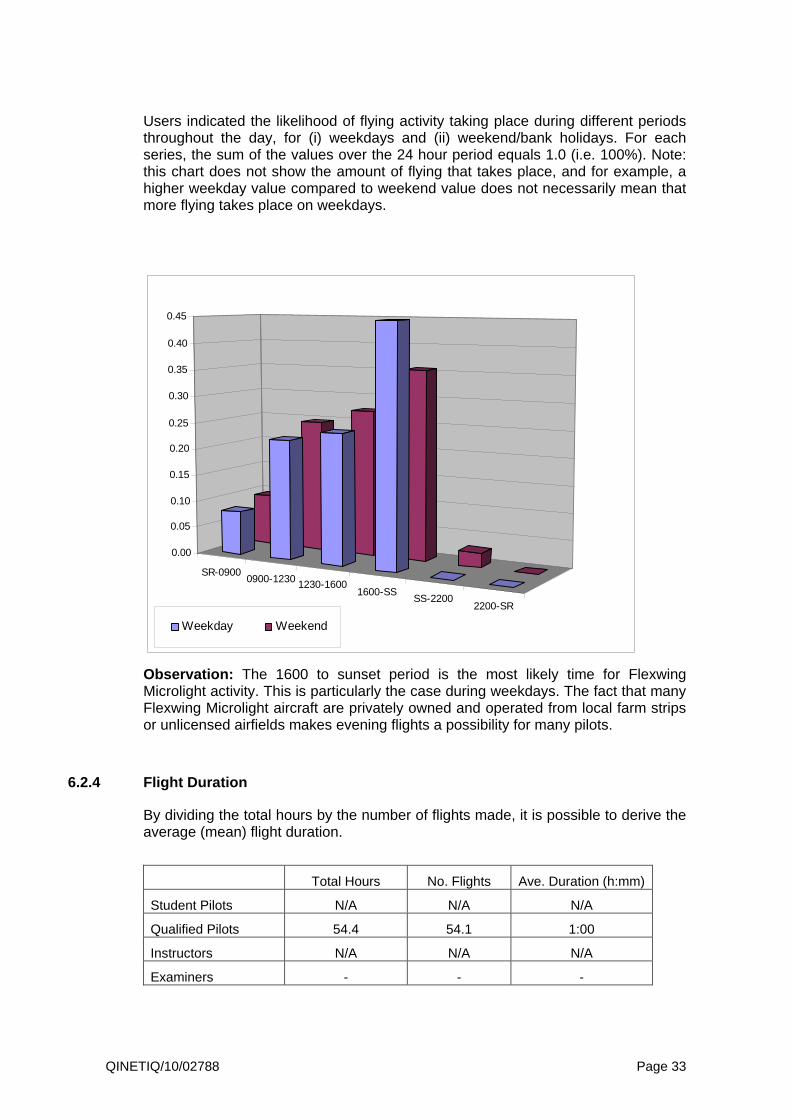
Users indicated the likelihood of flying activity taking place during different periods throughout the day, for (i) weekdays and (ii) weekend/bank holidays. For each series, the sum of the values over the 24 hour period equals 1.0 (i.e. 100%). Note: this chart does not show the amount of flying that takes place, and for example, a higher weekday value compared to weekend value does not necessarily mean that more flying takes place on weekdays.
SR-09000900-1230 1230-1600
1600-SSSS-2200
2200-SR
0.00
0.05
0.10
0.15
0.20
0.25
0.30
0.35
0.40
0.45
Weekday Weekend
Observation: The 1600 to sunset period is the most likely time for Flexwing Microlight activity. This is particularly the case during weekdays. The fact that many Flexwing Microlight aircraft are privately owned and operated from local farm strips or unlicensed airfields makes evening flights a possibility for many pilots.
6.2.4 Flight Duration
By dividing the total hours by the number of flights made, it is possible to derive the average (mean) flight duration.
Total Hours No. Flights Ave. Duration (h:mm)
Student Pilots N/A N/A N/A
Qualified Pilots 54.4 54.1 1:00
Instructors N/A N/A N/A
Examiners - - -

QINETIQ/10/02788 Page 34
The following table indicates the percentage distribution of flights in terms of their duration.
0-2 h 2-3 h 3-4 h 4-5 h ≥ 5h
Student Pilots N/A N/A N/A N/A N/A
Qualified Pilots 85.4% 12.0% 2.5% 0.1% 0.0%
Instructors N/A N/A N/A N/A N/A
Examiners - - - - -
6.2.5 Type of Flights
Flexwing Microlight pilots indicated the following split between ‘Return-to-Base’ and ‘Land Away’ flights.
Return-to-Base
Land Away
Student Pilots N/A N/A
Qualified Pilots 57.6% 42.4%
Instructors N/A N/A
Examiners - -
6.2.6 Operating Area
Flexwing Microlight pilots indicated the percentage of flights conducted within different distances of the departure airfield.
2.5 NM 10 NM 25 NM 50 NM (or more)
Student Pilots N/A N/A N/A N/A
Qualified Pilots 35% 25% 17% 23%
Instructors N/A N/A N/A N/A
Examiners - - - -
6.2.7 Operating Altitude
The range of operating altitudes indicated by Flexwing Microlight pilots is summarised in the following probability distribution function graphs (per 500 ft height band).

QINETIQ/10/02788 Page 35
Height Distribution (Return-to-Base Flights)
0.00
0.02
0.04
0.06
0.08
0.10
0.12
0.14
0.16
500
1000
1500
2000
2500
3000
3500
4000
4500
5000
5500
6000
6500
7000
7500
8000
8500
9000
9500
1000
0
Altitude (ft)
Pro
bab
ilit
y
Height Distribution (Land Away Flights)
0.00
0.02
0.04
0.06
0.08
0.10
0.12
0.14
0.16
500
1000
1500
2000
2500
3000
3500
4000
4500
5000
5500
6000
6500
7000
7500
8000
8500
9000
9500
1000
0
Altitude (ft)
Pro
bab
ilit
y
Observation: There is very little difference between the above charts. Both show that Flexwing Microlights are most likely to operate below 3,000 feet, The most likely operating altitude for return-to-base flights is 1,500 ft, whereas between 2,000 and 2,500 ft is most likely for land away flights. Perhaps surprisingly, a significant number of users claim to operate at altitudes of up to 9,000 ft.

QINETIQ/10/02788 Page 36
6.3 Other Information
The following information was supplied by the BMAA in response to the survey questionnaire:
Number of Flexwing Aircraft
“There are estimated to be around 1,100 Flexwing Microlights in the United Kingdom.”
Range/endurance
“Most new Flexwing Microlights carry around 65 litres of fuel. Typical flight duration of 5 hours at 60 knots. Some aircraft cruise at higher speeds, up to 80 knots with a reduced range due to higher fuel consumption. There are a few pilots who regularly will fly for the duration of the aircraft in a single leg although I would estimate that between 1 and 2 hour flights are more normal. Pilots may make a flight of say 1.5 hours, land and warm up/take a comfort break/socialise and then go on again to another landing. Flying for 4 to 5 hours throughout a day, ranging up to 150 miles from home base is fairly common.”
Operating Altitude “The height above ground will depend upon the type of surface, the more undulating/rougher such as moorland the higher the flight is likely to be made to allow for a greater gliding range in the event of engine failure. Microlights cannot enter Class A airspace, unless it is a zone when under SVFR, so microlights will not fly above the base of Class A airspace.
It is likely that flights will be lower in winter than summer but as the normal flight level is not very high, not 5-6 thousand feet for example, there will not be a great variation between winter and summer.”

QINETIQ/10/02788 Page 37
7 Fixed Wing Microlight Activity
7.1 General Requirements
The following summary of general requirements about Fixed Wing Microlights was supplied by the BMAA.
7.1.1 Air Stability
“Although Fixed Wing Microlight aircraft are less susceptible to turbulence than Flexwing aircraft, the light weight/low inertia of many aircraft in this category can make flight in turbulent/unstable air unpleasant and undesirable.”
7.1.2 Visibility
“A visibility of at least 3 km is required outside controlled airspace. 10 km is required for SVFR inside controlled airspace.”
7.1.3 Wind Speed
“This will vary considerably across the fleet. Some machines with a respectable cruising speed can have quite a low crosswind limit. However, because Microlights don’t need much space in which to take-off or land, it is often possible to use different runway/open areas to that in use by other aircraft with better crosswind capabilities (rather than struggle with a crosswind).” “Gusting winds pose a particular problem for low inertia aircraft.”
7.1.4 Cloud Base
“Due to the fact that most Microlight circuits are between 500 and 800 ft, it is not unusual for activity to take place with a cloud base as low as 1,000 ft. One consequence of this is that circuit flying can often take place when cross-country flying is not viable.”
7.2 On-Line Survey
7.2.1 Sample Size
A total of 77 valid responses to the on-line survey were received from Fixed Wing Microlight pilots. This can be summarised as follows:

QINETIQ/10/02788 Page 38
Student Pilots 1
Qualified Pilots 72
Instructors 4
Examiners 0
Due to the small sample of Student Pilots and Instructors, no statistical analysis is provided.
7.2.2 Annual Logged Hours
The average (annual) logged hours for Fixed Wing Microlight pilots were as follows:
Total PUT or P1/S
Student Pilots N/A N/A
Qualified Pilots 54.5 3.8
Instructors N/A N/A
Examiners - -
The maximum and minimum (annual) logged hours for Fixed Wing Microlight pilots were as follows:
Max. Min.
Student Pilots N/A N/A
Qualified Pilots 250 12
Instructors N/A N/A
Examiners - -
7.2.3 Operating Times
Users indicated the following split between hours flown on weekdays and weekend/bank holidays.
Weekday Weekend Bank Holiday
Student Pilots N/A N/A
Qualified Pilots 46.3% 53.7%
Instructors N/A N/A
Examiners - -
QINETIQ/10/02788 Page 39
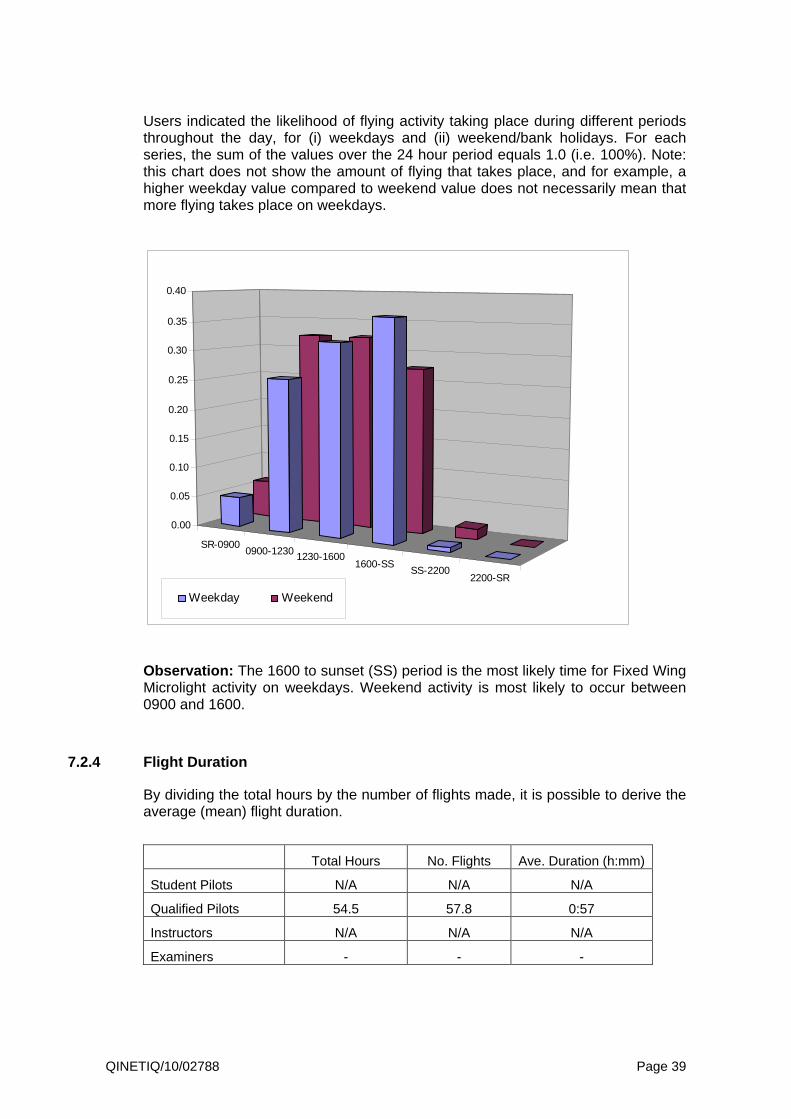
Users indicated the likelihood of flying activity taking place during different periods throughout the day, for (i) weekdays and (ii) weekend/bank holidays. For each series, the sum of the values over the 24 hour period equals 1.0 (i.e. 100%). Note: this chart does not show the amount of flying that takes place, and for example, a higher weekday value compared to weekend value does not necessarily mean that more flying takes place on weekdays.
SR-09000900-1230 1230-1600
1600-SSSS-2200
2200-SR
0.00
0.05
0.10
0.15
0.20
0.25
0.30
0.35
0.40
Weekday Weekend
Observation: The 1600 to sunset (SS) period is the most likely time for Fixed Wing Microlight activity on weekdays. Weekend activity is most likely to occur between 0900 and 1600.
7.2.4 Flight Duration
By dividing the total hours by the number of flights made, it is possible to derive the average (mean) flight duration.
Total Hours No. Flights Ave. Duration (h:mm)
Student Pilots N/A N/A N/A
Qualified Pilots 54.5 57.8 0:57
Instructors N/A N/A N/A
Examiners - - -

QINETIQ/10/02788 Page 40
The following table indicates the percentage distribution of flights in terms of their duration.
0-2 h 2-3 h 3-4 h 4-5 h ≥ 5h
Student Pilots N/A N/A N/A N/A N/A
Qualified Pilots 92.3% 6.9% 0.6% 0.2% 0.0%
Instructors N/A N/A N/A N/A N/A
Examiners - - - - -
7.2.5 Type of Flights
Fixed Wing Microlight pilots indicated the following split between ‘Return-to-Base’ and ‘Land Away’ flights.
Return-to-Base
Land Away
Student Pilots N/A N/A
Qualified Pilots 48.2% 51.8%
Instructors N/A N/A
Examiners - -
7.2.6 Operating Area
Fixed Wing Microlight pilots indicated the percentage of flights conducted within different distances of the departure airfield.
2.5 NM 10 NM 25 NM 50 NM (or more)
Student Pilots N/A N/A N/A N/A
Qualified Pilots 12% 13% 30% 45%
Instructors N/A N/A N/A N/A
Examiners - - - -
7.2.7 Operating Altitude
The range of operating altitudes indicated by Fixed Wing Microlight pilots is summarised in the following probability distribution function graphs (per 500 ft height band).

QINETIQ/10/02788 Page 41
Height Distribution (Return-to-Base Flights)
0.00
0.02
0.04
0.06
0.08
0.10
0.12
0.14
0.16
0.18
0.20
500
1000
1500
2000
2500
3000
3500
4000
4500
5000
5500
6000
6500
7000
7500
8000
8500
9000
9500
1000
0
Altitude (ft)
Pro
bab
ilit
y
Height Distribution (Land Away Flights)
0.00
0.02
0.04
0.06
0.08
0.10
0.12
0.14
0.16
0.18
0.20
500
1000
1500
2000
2500
3000
3500
4000
4500
5000
5500
6000
6500
7000
7500
8000
8500
9000
9500
1000
0
Altitude (ft)
Pro
bab
ilit
y
Observation: In both of the above charts, it can be seen that the most likely operating altitude is between 1,500 and 2,500 ft. Land away flights are more likely to operate between 3,000 and 3,500 ft.

QINETIQ/10/02788 Page 42
7.3 Other Information
Comment from the BMAA:
“Modern, high performance Fixed Wing Microlights can out perform some older, traditional light aircraft so you can expect to see them anywhere when the weather is generally good.”

QINETIQ/10/02788 Page 43
8 Hang Gliding Activity
8.1 General Requirements
The following summary of general requirements about Hang Gliding was supplied by the BHPA.
8.1.1 Air Stability
Preference for strong thermal activity. Heavy or prolonged precipitation will prevent activity taking place.
8.1.2 Visibility
A visibility of at least 5 km is required.
8.1.3 Wind Speed
The following ‘ideal’ wind speed requirements are associated with different types of paragliding activity: Training hops <10 mph surface wind ideal Training descents (top to bottom) <10 mph surface wind ideal Tow circuits <15 mph surface wind ideal Aero-tow circuits <15 mph surface wind ideal Ridge soaring 12 to 25 mph surface wind ideal Ridge soaring cross-country 12 to 25 mph surface wind ideal Thermal soaring <20 mph surface wind ideal Thermal soaring cross-country <20 mph surface wind ideal Wave soaring <25 mph surface wind ideal Wave soaring cross-country <25 mph surface wind ideal
Note: A wind speed of 10 mph greater than the maximum ideal will prevent the activity taking place.
8.1.4 Cloud Base
Not specified.
8.2 On-Line Survey
8.2.1 Sample Size
A total of 9 valid responses to the on-line survey were received from Hang Glider pilots. This can be summarised as follows:
QINETIQ/10/02788 Page 44
Student Pilots 0
Qualified Pilots 8
Instructors 1
Examiners 0
Note: Analysis is not provided for Instructors as the sample size is too small.
8.2.2 Annual Logged Hours
The average (annual) logged hours for Hang Glider pilots were as follows:
Total PUT or P1/S
Student Pilots - -
Qualified Pilots 25.1 0.0
Instructors N/A N/A
Examiners - -
The maximum and minimum (annual) logged hours for Hang Glider pilots were as follows:
Max. Min.
Student Pilots - -
Qualified Pilots 55 10
Instructors N/A N/A
Examiners - -
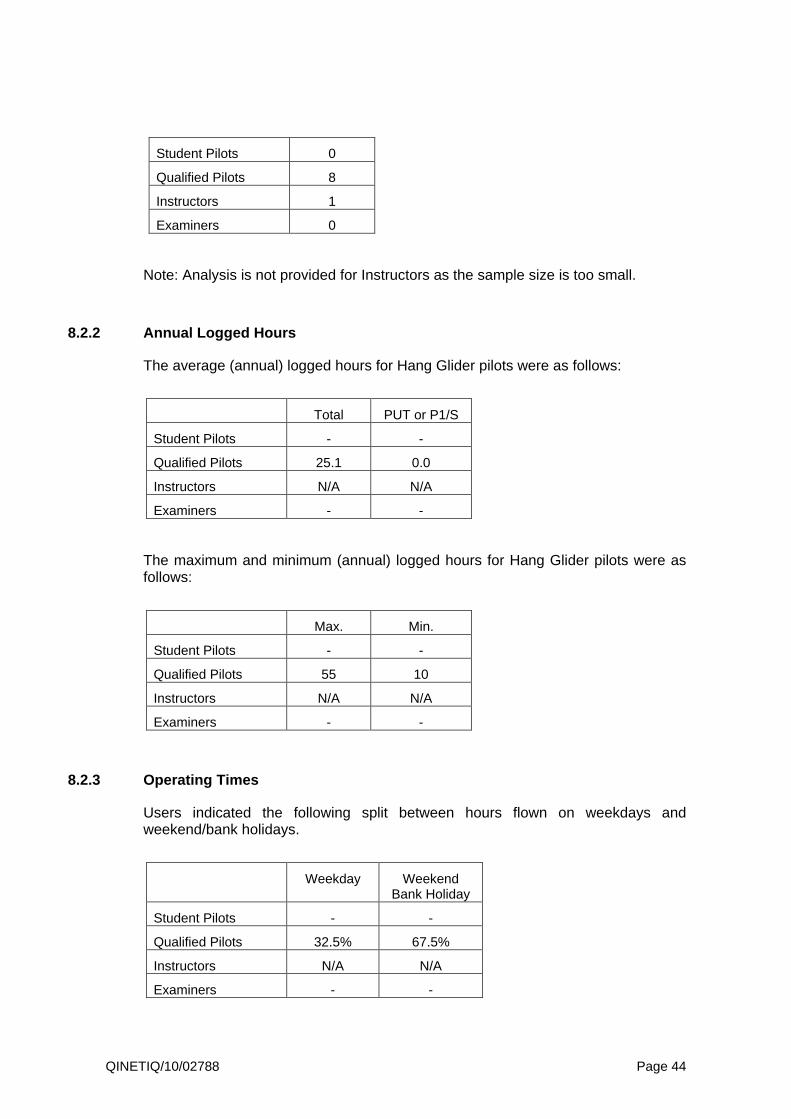
8.2.3 Operating Times
Users indicated the following split between hours flown on weekdays and weekend/bank holidays.
Weekday Weekend Bank Holiday
Student Pilots - -
Qualified Pilots 32.5% 67.5%
Instructors N/A N/A
Examiners - -
QINETIQ/10/02788 Page 45
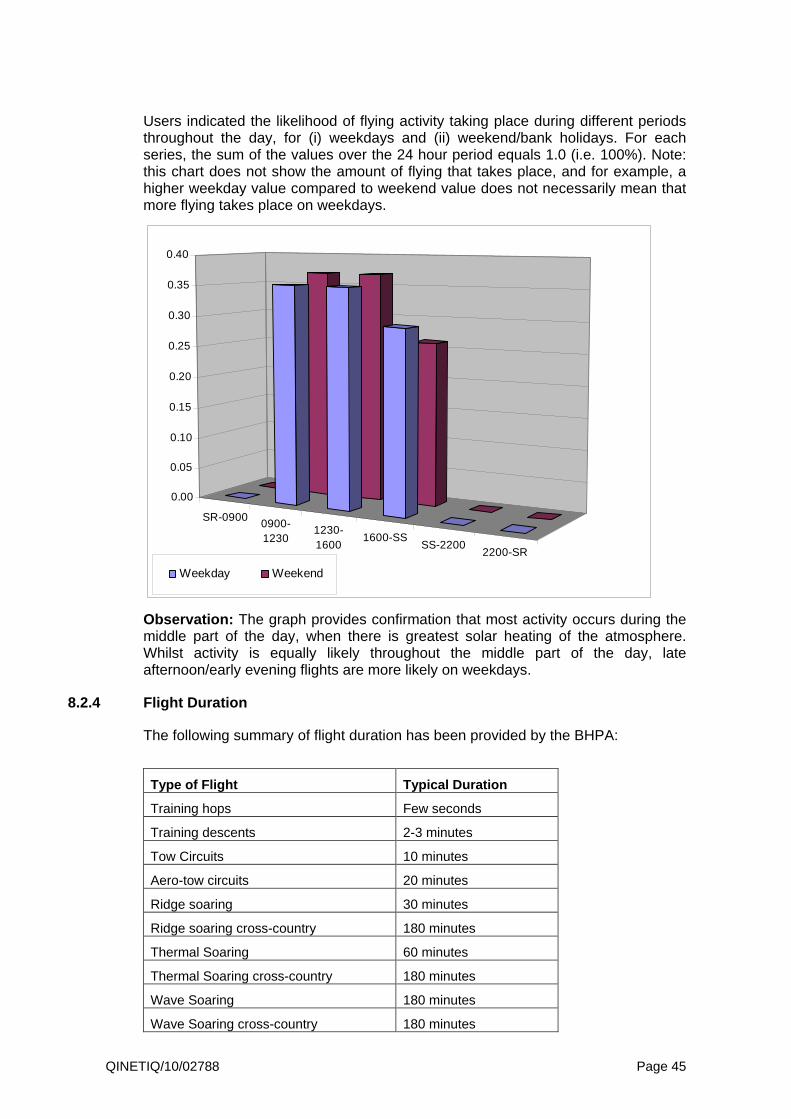
Users indicated the likelihood of flying activity taking place during different periods throughout the day, for (i) weekdays and (ii) weekend/bank holidays. For each series, the sum of the values over the 24 hour period equals 1.0 (i.e. 100%). Note: this chart does not show the amount of flying that takes place, and for example, a higher weekday value compared to weekend value does not necessarily mean that more flying takes place on weekdays.
SR-09000900-1230
1230-1600
1600-SSSS-2200
2200-SR
0.00
0.05
0.10
0.15
0.20
0.25
0.30
0.35
0.40
Weekday Weekend
Observation: The graph provides confirmation that most activity occurs during the middle part of the day, when there is greatest solar heating of the atmosphere. Whilst activity is equally likely throughout the middle part of the day, late afternoon/early evening flights are more likely on weekdays.
8.2.4 Flight Duration
The following summary of flight duration has been provided by the BHPA:
Type of Flight Typical Duration
Training hops Few seconds
Training descents 2-3 minutes
Tow Circuits 10 minutes
Aero-tow circuits 20 minutes
Ridge soaring 30 minutes
Ridge soaring cross-country 180 minutes
Thermal Soaring 60 minutes
Thermal Soaring cross-country 180 minutes
Wave Soaring 180 minutes
Wave Soaring cross-country 180 minutes
QINETIQ/10/02788 Page 46
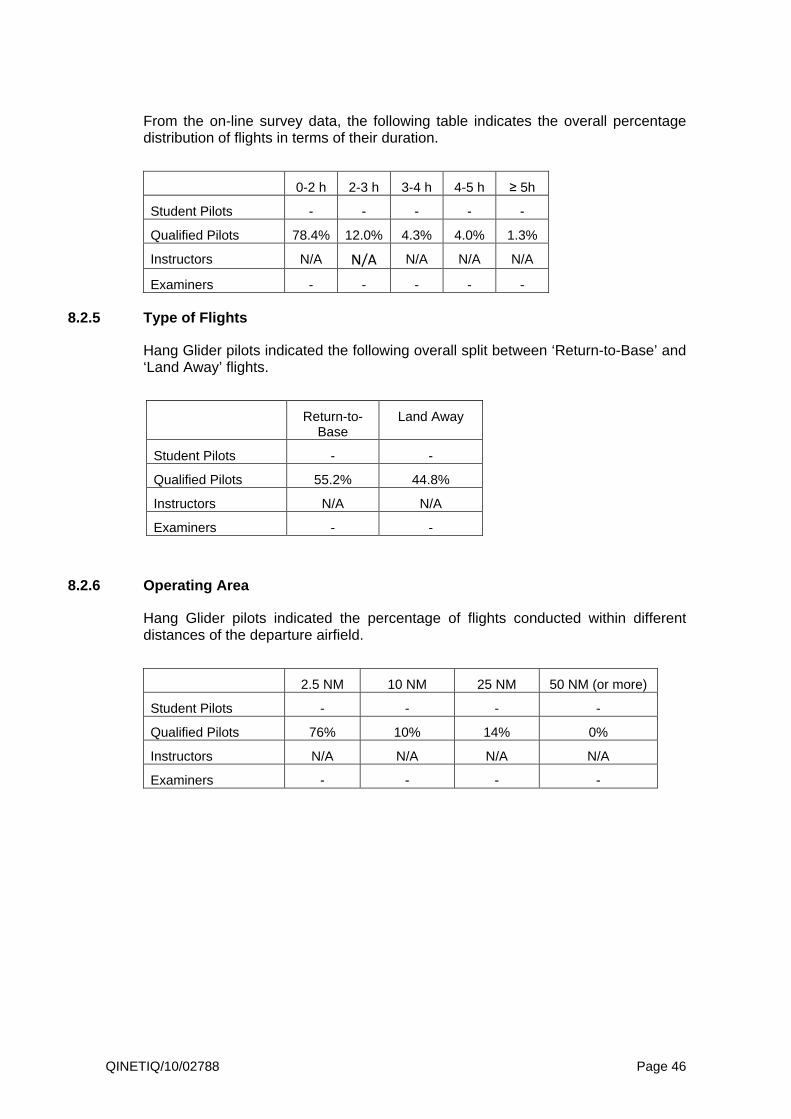
From the on-line survey data, the following table indicates the overall percentage distribution of flights in terms of their duration.
0-2 h 2-3 h 3-4 h 4-5 h ≥ 5h
Student Pilots - - - - -
Qualified Pilots 78.4% 12.0% 4.3% 4.0% 1.3%
Instructors N/A N/A N/A N/A N/A
Examiners - - - - -
8.2.5 Type of Flights
Hang Glider pilots indicated the following overall split between ‘Return-to-Base’ and ‘Land Away’ flights.
Return-to-Base
Land Away
Student Pilots - -
Qualified Pilots 55.2% 44.8%
Instructors N/A N/A
Examiners - -
8.2.6 Operating Area
Hang Glider pilots indicated the percentage of flights conducted within different distances of the departure airfield.
2.5 NM 10 NM 25 NM 50 NM (or more)
Student Pilots - - - -
Qualified Pilots 76% 10% 14% 0%
Instructors N/A N/A N/A N/A
Examiners - - - -
QINETIQ/10/02788 Page 47
8.2.7 Operating Altitude
The BHPA provided the following summary of operating height for the different types of Hang Glider flights:
Type of Flight Maximum Height
Training hops <50 ft AGL
Training descents <500 ft AGL
Tow Circuits <2,000 ft AGL
Aero-tow circuits <3,000 ft AGL
Ridge soaring <500 ft above the hill top
Ridge soaring cross-country <1,000 ft above the hill top
Thermal Soaring <5,000 ft AGL
Thermal Soaring cross-country <5,000 ft AGL
Wave Soaring <10,000 ft above the hill top
Wave Soaring cross-country <10,000 ft AGL
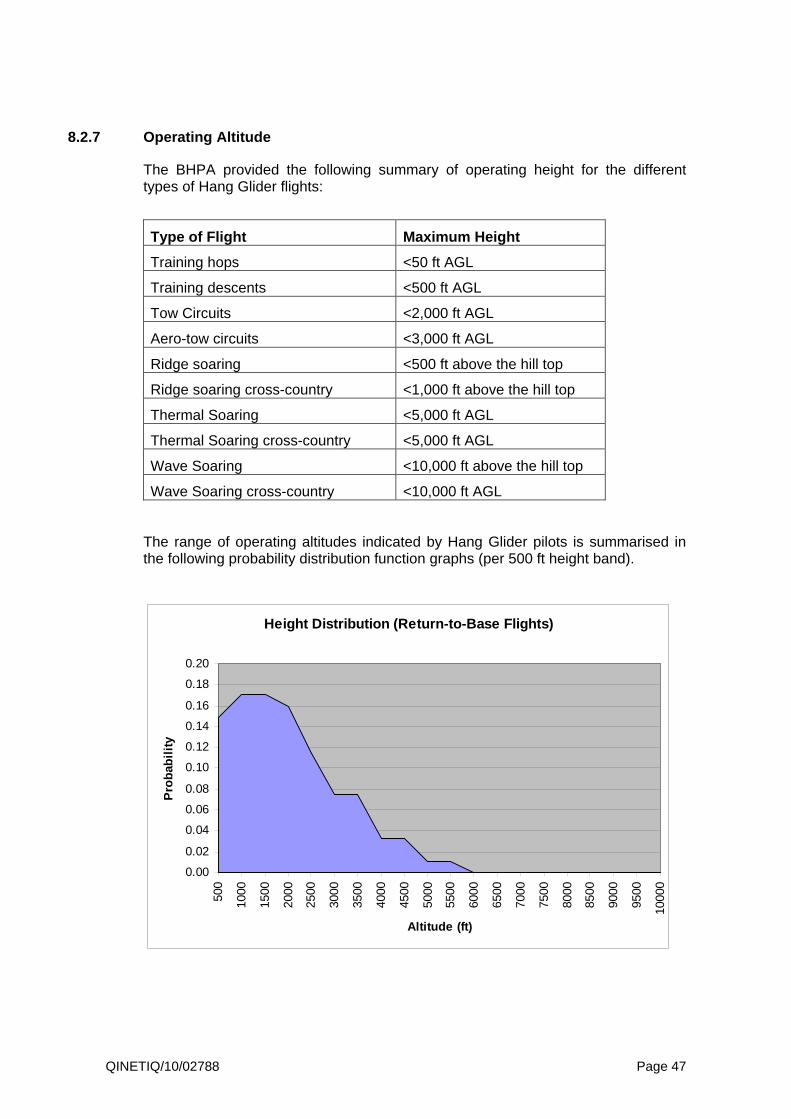
The range of operating altitudes indicated by Hang Glider pilots is summarised in the following probability distribution function graphs (per 500 ft height band).
Height Distribution (Return-to-Base Flights)
0.00
0.02
0.04
0.06
0.08
0.10
0.12
0.14
0.16
0.18
0.20
500
1000
1500
2000
2500
3000
3500
4000
4500
5000
5500
6000
6500
7000
7500
8000
8500
9000
9500
1000
0
Altitude (ft)
Pro
bab
ilit
y

QINETIQ/10/02788 Page 48
Height Distribution (Land Away Flights)
0.00
0.02
0.04
0.06
0.08
0.10
0.12
0.14
0.16
0.18
0.20
500
1000
1500
2000
2500
3000
3500
4000
4500
5000
5500
6000
6500
7000
7500
8000
8500
9000
9500
1000
0
Altitude (ft)
Pro
bab
ilit
y
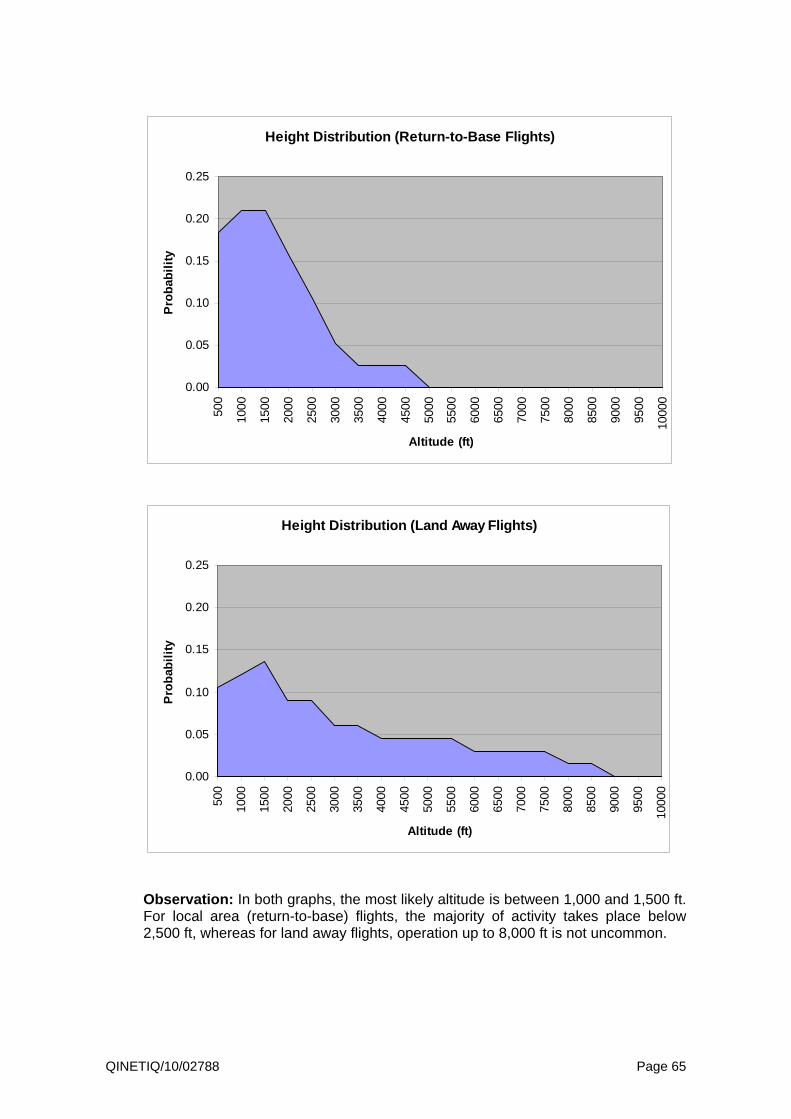
Observation: The above graphs suggest that, whilst flights can be conducted at altitudes of up to 10,000 ft, the most likely operating altitude is around 1,500 ft. Cross-country (land away) flights tend to operate at higher altitudes.
8.3 Other Information
There are estimated to be around 1,000 active Hang Glider pilots in the UK.
When the weather conditions allow thermal soaring flights to be made then many hang gliders, paragliders and sailplanes will all be airborne engaged in this activity. This will be during the hours of the day when the sun is high enough – typically 10 am to 5 pm.

QINETIQ/10/02788 Page 49
9 Paragliding Activity
9.1 General Requirements
The following summary of general requirements about Paragliding was supplied by the BHPA.
9.1.1 Air Stability
Preference for strong thermal activity. Heavy or prolonged precipitation will prevent activity taking place.
9.1.2 Visibility
A visibility of at least 5 km is required.
9.1.3 Wind Speed
The following ‘ideal’ wind speed requirements are associated with different types of Paragliding activity: Training hops <10 mph surface wind ideal Training descents (top to bottom) <10 mph surface wind ideal Tow circuits <15 mph surface wind ideal Ridge soaring 10 to 18 mph surface wind ideal Ridge soaring cross-country 10 to 18 mph surface wind ideal Thermal soaring <18 mph surface wind ideal Thermal soaring cross-country <20 mph surface wind ideal
Note: A wind speed of 10 mph greater than the maximum ideal will prevent the activity taking place.
9.1.4 Cloud Base
Not specified.
9.2 On-Line Survey
9.2.1 Sample Size
A total of 27 valid responses to the on-line survey were received from Paraglider pilots. This can be summarised as follows:

QINETIQ/10/02788 Page 50
Student Pilots 1
Qualified Pilots 26
Instructors 0
Examiners 0
Analysis is not provided for Students as the sample size is too small.
9.2.2 Annual Logged Hours
The average (annual) logged hours for Paraglider pilots were as follows:
Total PUT or P1/S
Student Pilots N/A N/A
Qualified Pilots 64.1 1.4
Instructors - -
Examiners - -
The maximum and minimum (annual) logged hours for Paraglider pilots were as follows:
Max. Min.
Student Pilots N/A N/A
Qualified Pilots 200 8
Instructors - -
Examiners - -
9.2.3 Operating Times
Users indicated the following split between hours flown on weekdays and weekend/bank holidays.
Weekday Weekend Bank Holiday
Student Pilots N/A N/A
Qualified Pilots 44.8% 55.2%
Instructors - -
Examiners - -
QINETIQ/10/02788 Page 51
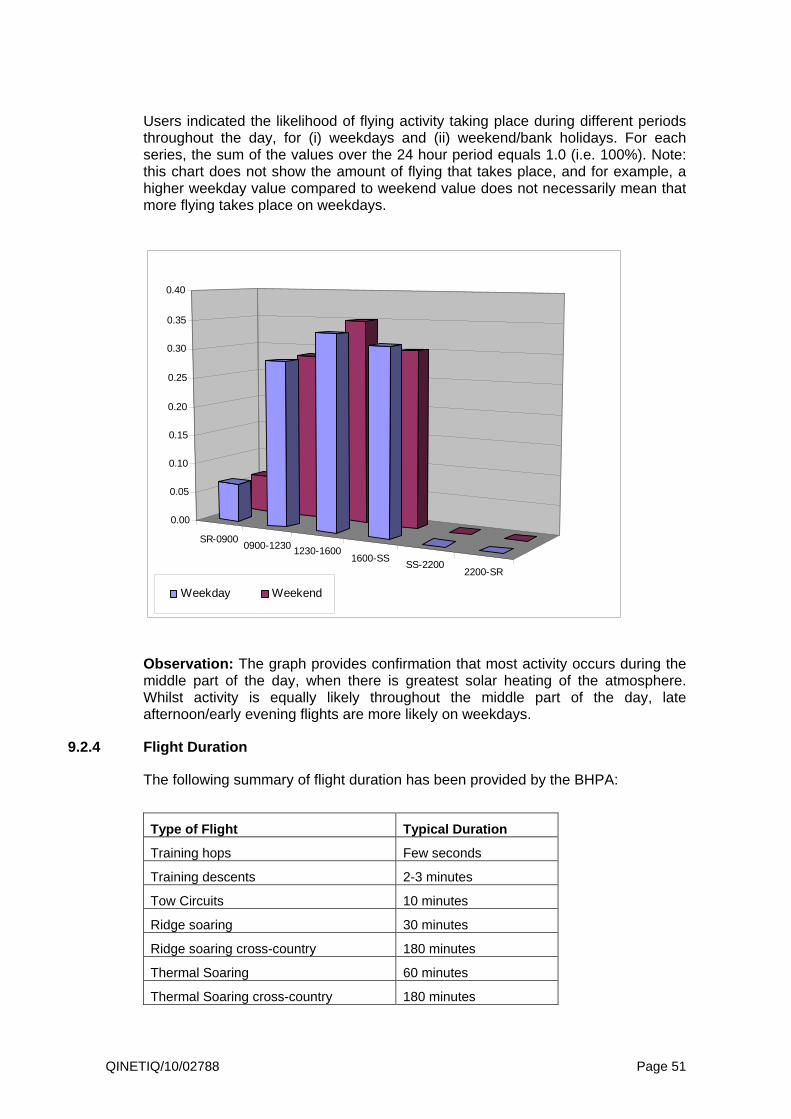
Users indicated the likelihood of flying activity taking place during different periods throughout the day, for (i) weekdays and (ii) weekend/bank holidays. For each series, the sum of the values over the 24 hour period equals 1.0 (i.e. 100%). Note: this chart does not show the amount of flying that takes place, and for example, a higher weekday value compared to weekend value does not necessarily mean that more flying takes place on weekdays.
SR-09000900-1230 1230-1600
1600-SSSS-2200
2200-SR
0.00
0.05
0.10
0.15
0.20
0.25
0.30
0.35
0.40
Weekday Weekend
Observation: The graph provides confirmation that most activity occurs during the middle part of the day, when there is greatest solar heating of the atmosphere. Whilst activity is equally likely throughout the middle part of the day, late afternoon/early evening flights are more likely on weekdays.
9.2.4 Flight Duration
The following summary of flight duration has been provided by the BHPA:
Type of Flight Typical Duration
Training hops Few seconds
Training descents 2-3 minutes
Tow Circuits 10 minutes
Ridge soaring 30 minutes
Ridge soaring cross-country 180 minutes
Thermal Soaring 60 minutes
Thermal Soaring cross-country 180 minutes

QINETIQ/10/02788 Page 52
From the on-line survey data, the following table indicates the overall percentage distribution of flights in terms of their duration.
0-2 h 2-3 h 3-4 h 4-5 h ≥ 5h
Student Pilots N/A N/A N/A N/A N/A
Qualified Pilots 72.8% 20.1% 4.9% 1.5% 0.7%
Instructors - - - - -
Examiners - - - - -
9.2.5 Type of Flights
Paraglider pilots indicated the following overall split between ‘Return-to-Base’ and ‘Land Away’ flights.
Return-to-Base
Land Away
Student Pilots N/A N/A
Qualified Pilots 73.3% 26.7%
Instructors - -
Examiners - -
9.2.6 Operating Area
Paraglider pilots indicated the percentage of flights conducted within different distances of the departure airfield.
2.5 NM 10 NM 25 NM 50 NM (or more)
Student Pilots N/A N/A N/A N/A
Qualified Pilots 76% 10% 14% 0%
Instructors - - - -
Examiners - - - -

QINETIQ/10/02788 Page 53
9.2.7 Operating Altitude
The BHPA provided the following summary of operating height for the different types of Paraglider flights:
Type of Flight Maximum Height
Training hops <50 ft AGL
Training descents <500 ft AGL
Tow Circuits <2,000 ft AGL
Ridge soaring <500 ft above the hill top
Ridge soaring cross-country <1,000 ft above the hill top
Thermal Soaring <5,000 ft AGL
Thermal Soaring cross-country <5,000 ft AGL
The range of operating altitudes indicated by Paraglider pilots is summarised in the following probability distribution function graphs (per 500 ft height band).
Height Distribution (Return-to-Base Flights)
0.00
0.05
0.10
0.15
500
1000
1500
2000
2500
3000
3500
4000
4500
5000
5500
6000
6500
7000
7500
8000
8500
9000
9500
1000
0
Altitude (ft)
Pro
bab
ilit
y

QINETIQ/10/02788 Page 54
Height Distribution (Land Away Flights)
0.00
0.05
0.10
0.15
500
1000
1500
2000
2500
3000
3500
4000
4500
5000
5500
6000
6500
7000
7500
8000
8500
9000
9500
1000
0
Altitude (ft)
Pro
bab
ilit
y
Observation: The above graphs show a relative small difference between return-to-base and land away flights, with a more or less uniform likelihood of operation taking place anywhere between surface and 5,500 ft.
9.3 Other Information
The following information was received from the BHPA: “There are estimated to be around 4,000 active Paraglider pilots in the UK.”
“For ridge soaring on hill or cliff sites, the wind direction needs to be perpendicular (to within +/- 15 degrees) of the hill/cliff face.”
“The majority of flights will take place within 1 NM of the launch site.”
“When the weather conditions allow thermal soaring flights to be made then many paragliders, hang gliders and sailplanes will all be airborne engaged in this activity. This will be during the hours of the day when the sun is high enough, typically 10 am to 5 pm.”

QINETIQ/10/02788 Page 55
10 Single Engine Helicopter Activity
10.1 General Requirements
In the UK, Single Engine (SE) Helicopters are restricted to operation under VFR except for aerial work. VFR is not permitted at night.
10.1.1 Air Stability
Not a relevant factor.
10.1.2 Visibility
A visibility of at least 1500 m is required.
10.1.3 Wind Speed
For VFR operation, a maximum wind speed of between 40 and 50 kt can be tolerated. This value will be dependent on the individual aircraft and pilot’s level of experience.
10.1.4 Cloud Base
A minimum cloud base of 600 ft is generally required. Higher values will be required for over flight of built-up (congested) or mountainous areas.
10.2 On-Line Survey
10.2.1 Sample Size
A total of 18 valid responses were received to the on-line survey from SE Helicopter pilots. This can be summarised as follows:
Student Pilots 0
Qualified Pilots 13
Instructors 1
Commercial1 4
Examiners 0
It is recognised that this is a very small sample size, and any statistical summary may not be truly representative of actual activity. Analysis is not provided for Instructors as the sample size is too small.
1 Despite being a very small sample size, we have included analysis of ‘Commercial’ single engine helicopter activity in this section due to the significantly different patterns of activity associated with this type of use.

QINETIQ/10/02788 Page 56
10.2.2 Annual Logged Hours
The average (annual) logged hours for SE Helicopter pilots were as follows:
Total PUT or P1/S
Student Pilots - -
Qualified Pilots 85.0 2.4
Instructors N/A N/A
Commercial 93.8 1.5
Examiners - -
Note: The average annual number of hours flown by qualified pilots (i.e. PPL(H)) is dominated by a small number of responses with more than 200 hours per year. These are believed to be SE helicopters that are used by their owners in connection with a business (but not operated for hire or reward). This practice is recognised as being quite common, and as such, the corresponding records have not been suppressed.
The maximum and minimum (annual) logged hours for SE Helicopter pilots were as follows:
Max. Min.
Student Pilots - -
Qualified Pilots 500 4
Instructors N/A N/A
Commercial 250 3
Examiners - -
Clearly, there is a wide range in the number of hours flown by private SE Helicopter pilots. In contrast to the SE helicopters that are used in connection with a business, there will be many other pilots that only maintain a low number of hours due to the relatively high hourly operating costs.
10.2.3 Operating Times
Users indicated the following split between hours flown on weekdays and weekend/bank holidays.
Weekday Weekend Bank Holiday
Student Pilots - -
Qualified Pilots 55.7% 44.3%
Instructors N/A N/A
Commercial 42.5% 57.5%
Examiners - -
QINETIQ/10/02788 Page 57
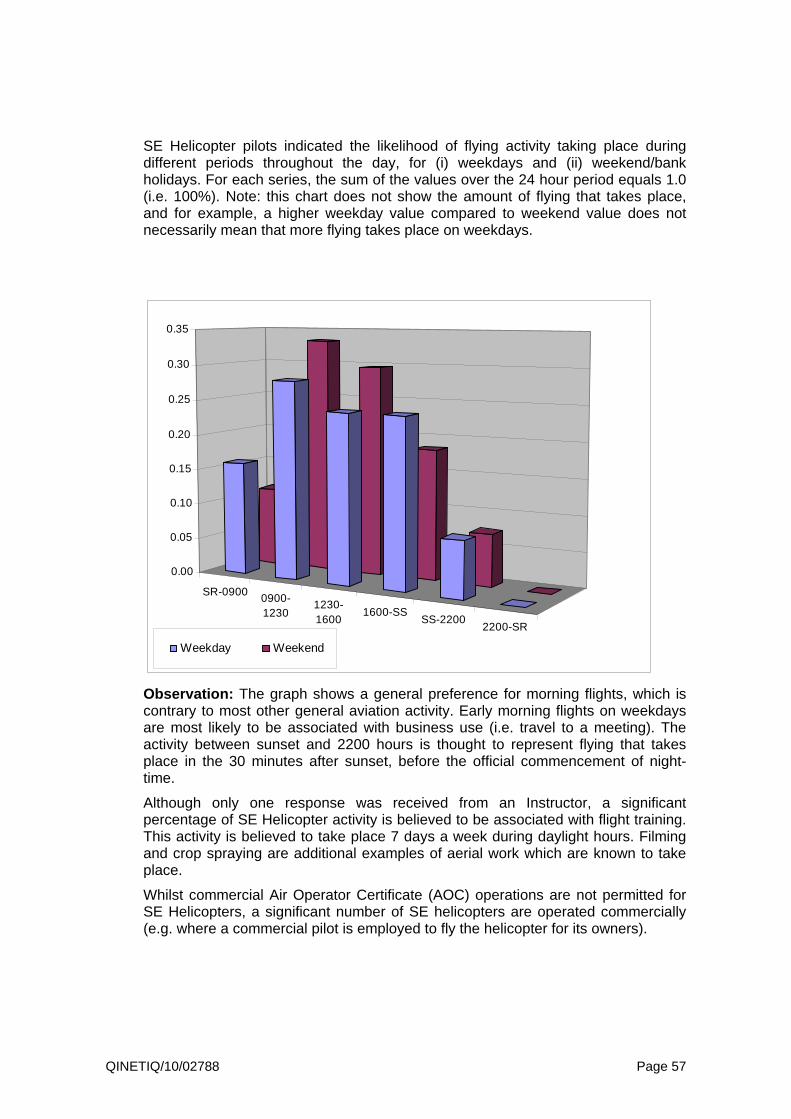
SE Helicopter pilots indicated the likelihood of flying activity taking place during different periods throughout the day, for (i) weekdays and (ii) weekend/bank holidays. For each series, the sum of the values over the 24 hour period equals 1.0 (i.e. 100%). Note: this chart does not show the amount of flying that takes place, and for example, a higher weekday value compared to weekend value does not necessarily mean that more flying takes place on weekdays.
SR-09000900-1230
1230-1600
1600-SSSS-2200
2200-SR
0.00
0.05
0.10
0.15
0.20
0.25
0.30
0.35
Weekday Weekend
Observation: The graph shows a general preference for morning flights, which is contrary to most other general aviation activity. Early morning flights on weekdays are most likely to be associated with business use (i.e. travel to a meeting). The activity between sunset and 2200 hours is thought to represent flying that takes place in the 30 minutes after sunset, before the official commencement of night-time.
Although only one response was received from an Instructor, a significant percentage of SE Helicopter activity is believed to be associated with flight training. This activity is believed to take place 7 days a week during daylight hours. Filming and crop spraying are additional examples of aerial work which are known to take place.
Whilst commercial Air Operator Certificate (AOC) operations are not permitted for SE Helicopters, a significant number of SE helicopters are operated commercially (e.g. where a commercial pilot is employed to fly the helicopter for its owners).

QINETIQ/10/02788 Page 58
10.2.4 Flight Duration
From the on-line survey data, the following table indicates the overall percentage distribution of flights in terms of their duration.
0-2 h 2-3 h 3-4 h 4-5 h ≥ 5h
Student Pilots - - - - -
Qualified Pilots 64.0% 27.2% 5.3% 2.0% 1.5%
Instructors N/A N/A N/A N/A N/A
Commercial 90.0% 10.0% 0.0% 0.0% 0.0%
Examiners - - - - -
10.2.5 Type of Flights
SE Helicopter pilots indicated the following overall split between ‘Return-to-Base’ and ‘Land Away’ flights.
Return-to-Base
Land Away
Student Pilots - -
Qualified Pilots 38.8% 61.2%
Instructors N/A N/A
Commercial 70.4% 29.6%
Examiners - -
10.2.6 Operating Area
SE Helicopter pilots indicated the percentage of flights conducted within different distances of the departure airfield.
2.5 NM 10 NM 25 NM 50 NM (or more)
Student Pilots - - - -
Qualified Pilots 13% 31% 29% 27%
Instructors N/A N/A N/A N/A
Commercial 10% 8% 12% 70%
Examiners - - - -

QINETIQ/10/02788 Page 59
10.2.7 Operating Altitude
The range in operating altitude indicated by Qualified (PPL(H)) SE Helicopter pilots is summarised in the following probability distribution function graphs (per 500 ft height band). There were insufficient responses to analyse the commercial category of use.
Height Distribution (Return-to-Base Flights)
0.00
0.05
0.10
0.15
0.20
0.25
0.30
500
1000
1500
2000
2500
3000
3500
4000
4500
5000
5500
6000
6500
7000
7500
8000
8500
9000
9500
1000
0
Altitude (ft)
Pro
bab
ilit
y
Height Distribution (Land Away Flights)
0.00
0.05
0.10
0.15
0.20
0.25
0.30
500
1000
1500
2000
2500
3000
3500
4000
4500
5000
5500
6000
6500
7000
7500
8000
8500
9000
9500
1000
0
Altitude (ft)
Pro
bab
ilit
y

QINETIQ/10/02788 Page 60
10.3 Other Information
It is estimated that 80% of SE Helicopter operations are restricted to day VFR. The remaining 20% are Instrument Flight Rules (IFR) capable and used for Aerial Work.

QINETIQ/10/02788 Page 61
11 Twin Engine Helicopter Activity
11.1 General Requirements
The following general requirements are relevant to Twin Engine (TE) Helicopters.
11.1.1 Air Stability
Not a relevant factor.
11.1.2 Visibility
A visibility of at least 1500 m is required for day VFR operation.
A visibility of 500 m is required for flight in IMC (day).
A visibility of 5 km is required for night-time operations.
11.1.3 Wind Speed
For VFR operation, a maximum wind speed of 50 kt can be tolerated. For IMC/night this limit will typically reduce to 40 kt.
11.1.4 Cloud Base
A minimum cloud base of 600 ft is generally required for VFR.
For IMC, a minimum cloud base of more than 200 ft is required for safe take-off and landing.
11.2 On-Line Survey
11.2.1 Sample Size
A total of 12 valid responses to the on-line survey were received from TE Helicopter pilots. This can be summarised as follows:
Student Pilots 0
Qualified Pilots 1
Instructors 0
Commercial 11
Examiners 0
It is recognised that this is a very small sample size, and any statistical summary may not be truly representative of actual activity. Analysis is not provided for Qualified (private) pilots as the sample size is too small.
As might be expected, there are very few non-commercial TE Helicopter pilots, and it is not possible to perform analysis on the single response that was received for this category.

QINETIQ/10/02788 Page 62
11.2.2 Annual Logged Hours
The average (annual) logged hours for TE Helicopter pilots were as follows:
Total PUT or P1/S
Student Pilots - -
Qualified Pilots N/A N/A
Instructors - -
Commercial 190.4 3.3
Examiners - -
The maximum and minimum (annual) logged hours for TE Helicopter pilots were as follows:
Max. Min.
Student Pilots - -
Qualified Pilots N/A N/A
Instructors - -
Commercial 400 50
Examiners - -
Clearly, there is a wide range in the number of hours flown by commercial TE Helicopter pilots.
11.2.3 Operating Times
Users indicated the following split between hours flown on weekdays and weekend/bank holidays.
Weekday Weekend Bank Holiday
Student Pilots - -
Qualified Pilots N/A N/A
Instructors - -
Commercial 68.3% 31.7%
Examiners - -
TE Helicopter pilots indicated the likelihood of flying activity taking place during different periods throughout the day, for (i) weekdays and (ii) weekend/bank holidays. For each series, the sum of the values over the 24 hour period equals 1.0 (i.e. 100%). Note: this chart does not show the amount of flying that takes place, and for example, a higher weekday value compared to weekend value does not necessarily mean that more flying takes place on weekdays.

QINETIQ/10/02788 Page 63
SR-09000900-1230
1230-1600
1600-SSSS-2200
2200-SR
0.00
0.05
0.10
0.15
0.20
0.25
Weekday Weekend
Observation: The graph shows that activity can take place at any time, day or night, weekdays and weekends. Early morning activity is more likely during the week.
A significant proportion of commercial helicopter traffic is VIP air charter. As well as daytime flights, many flights are associated with transporting VIPs to and from sports or entertainment events. Flights to and from such events account for much of the evening/night-time activity.
11.2.4 Flight Duration
From the on-line survey data, the following table indicates the overall percentage distribution of flights in terms of their duration.
0-2 h 2-3 h 3-4 h 4-5 h ≥ 5h
Student Pilots - - - - -
Qualified Pilots N/A N/A N/A N/A N/A
Instructors - - - - -
Commercial 90% 10% 0% 0% 0%
Examiners - - - - -
11.2.5

QINETIQ/10/02788 Page 64
11.2.6 Type of Flights
TE Helicopter pilots indicated the following overall split between ‘Return-to-Base’ and ‘Land Away’ flights.
Return-to-Base
Land Away
Student Pilots - -
Qualified Pilots N/A N/A
Instructors - -
Commercial 45.2% 54.8%
Examiners - -
11.2.7 Operating Area
TE Helicopter pilots indicated the percentage of flights conducted within different distances of the departure airfield.
2.5 NM 10 NM 25 NM 50 NM (or more)
Student Pilots - - - -
Qualified Pilots N/A N/A N/A N/A
Instructors - - - -
Commercial 3% 15% 40% 42%
Examiners - - - -
11.2.8 Operating Altitude
The range of operating altitudes indicated by Commercial TE Helicopter pilots is summarised in the following probability distribution function graphs (per 500 ft height band).
QINETIQ/10/02788 Page 65
Height Distribution (Return-to-Base Flights)
0.00
0.05
0.10
0.15
0.20
0.25
500
1000
1500
2000
2500
3000
3500
4000
4500
5000
5500
6000
6500
7000
7500
8000
8500
9000
9500
1000
0
Altitude (ft)
Pro
bab
ilit
y
Height Distribution (Land Away Flights)
0.00
0.05
0.10
0.15
0.20
0.25
500
1000
1500
2000
2500
3000
3500
4000
4500
5000
5500
6000
6500
7000
7500
8000
8500
9000
9500
1000
0
Altitude (ft)
Pro
bab
ilit
y
Observation: In both graphs, the most likely altitude is between 1,000 and 1,500 ft. For local area (return-to-base) flights, the majority of activity takes place below 2,500 ft, whereas for land away flights, operation up to 8,000 ft is not uncommon.

QINETIQ/10/02788 Page 66
11.3 Other Information
The following information was received from commercial helicopter operators:
“It is estimated that 20% of TE Helicopter operations are restricted to day VFR. The remaining 80% are IMC/night capable.”
“Significant commercial helicopter activity usually occurs at the following annual events:
Cheltenham Gold Cup (March) – typically 120 helicopters
Royal Ascott (June) – typically 60-80 helicopters
Silverstone Grand Prix (July) – typically 80-100 helicopters
Aintree Grand National (April) – typically 25 helicopters
RAC Rally (November) – typically 30 helicopters”

QINETIQ/10/02788 Page 67
12 Single Engine Piston Activity (450-5700 kg)
12.1 General Requirements
The following general requirements are relevant to Single Engine Piston (SEP) aircraft (referred to hereafter as ‘Light Single’) with a Maximum Take-off Mass (MTOM) between 450 and 5700 kg.
12.1.1 Air Stability
Not a relevant factor.
12.1.2 Visibility
For CAA/JAA PPL(A), a visibility of at least 3 km is required for day VFR operation (below 3,000 ft).
For NPPL, a visibility of at least 5 km is required for day VFR operation (below 3,000 ft).
A visibility of 1,800 m is required for take-off (IMC rated pilots).
A visibility of 5 km is required for night-time operations.
12.1.3 Wind Speed
Very dependent on aircraft design. Cross-wind limits can vary from as low as 10 kt to 30+ kt.
12.1.4 Cloud Base
A minimum cloud base of 600 ft is generally required for VFR.
Not stated for IMC/night.
12.2 On-Line Survey
12.2.1 Sample Size
A total of 633 valid responses to the on-line survey were received from pilots in this category. This can be summarised as follows:
Student Pilots 24
Qualified Pilots 544
Instructors 46
Commercial 13
Examiners 6
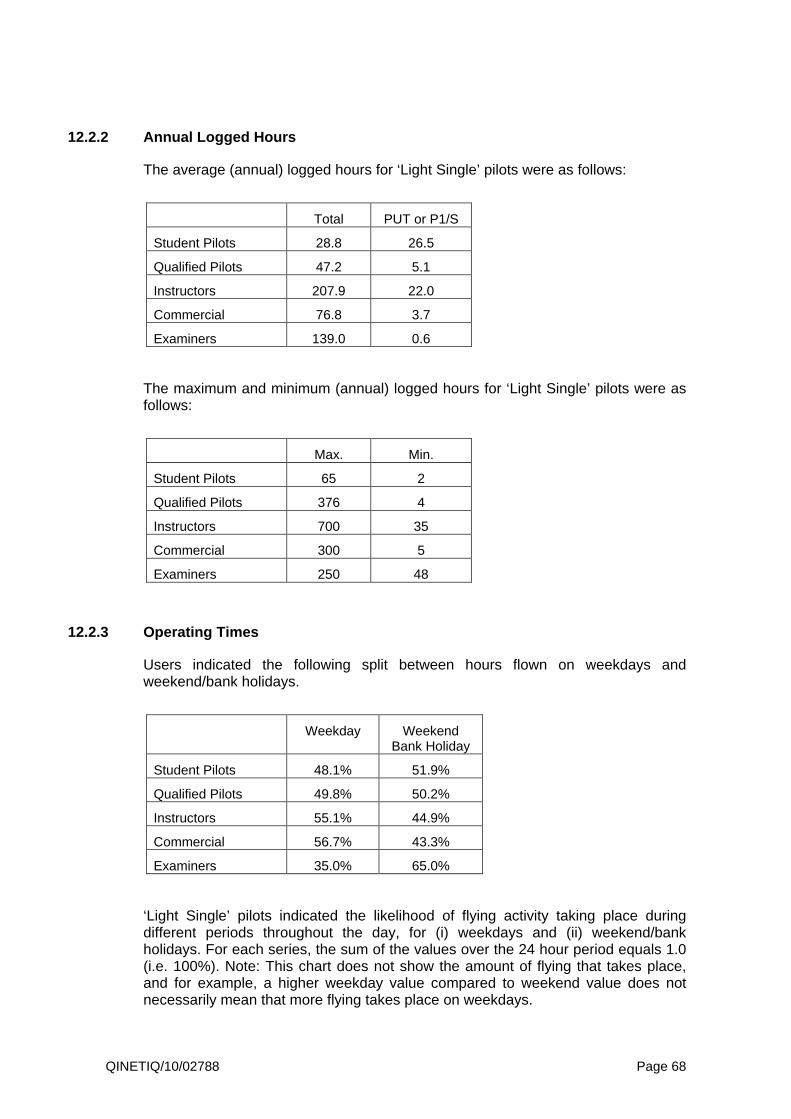
QINETIQ/10/02788 Page 68
12.2.2 Annual Logged Hours
The average (annual) logged hours for ‘Light Single’ pilots were as follows:
Total PUT or P1/S
Student Pilots 28.8 26.5
Qualified Pilots 47.2 5.1
Instructors 207.9 22.0
Commercial 76.8 3.7
Examiners 139.0 0.6
The maximum and minimum (annual) logged hours for ‘Light Single’ pilots were as follows:
Max. Min.
Student Pilots 65 2
Qualified Pilots 376 4
Instructors 700 35
Commercial 300 5
Examiners 250 48
12.2.3 Operating Times
Users indicated the following split between hours flown on weekdays and weekend/bank holidays.
Weekday Weekend Bank Holiday
Student Pilots 48.1% 51.9%
Qualified Pilots 49.8% 50.2%
Instructors 55.1% 44.9%
Commercial 56.7% 43.3%
Examiners 35.0% 65.0%
‘Light Single’ pilots indicated the likelihood of flying activity taking place during different periods throughout the day, for (i) weekdays and (ii) weekend/bank holidays. For each series, the sum of the values over the 24 hour period equals 1.0 (i.e. 100%). Note: This chart does not show the amount of flying that takes place, and for example, a higher weekday value compared to weekend value does not necessarily mean that more flying takes place on weekdays.
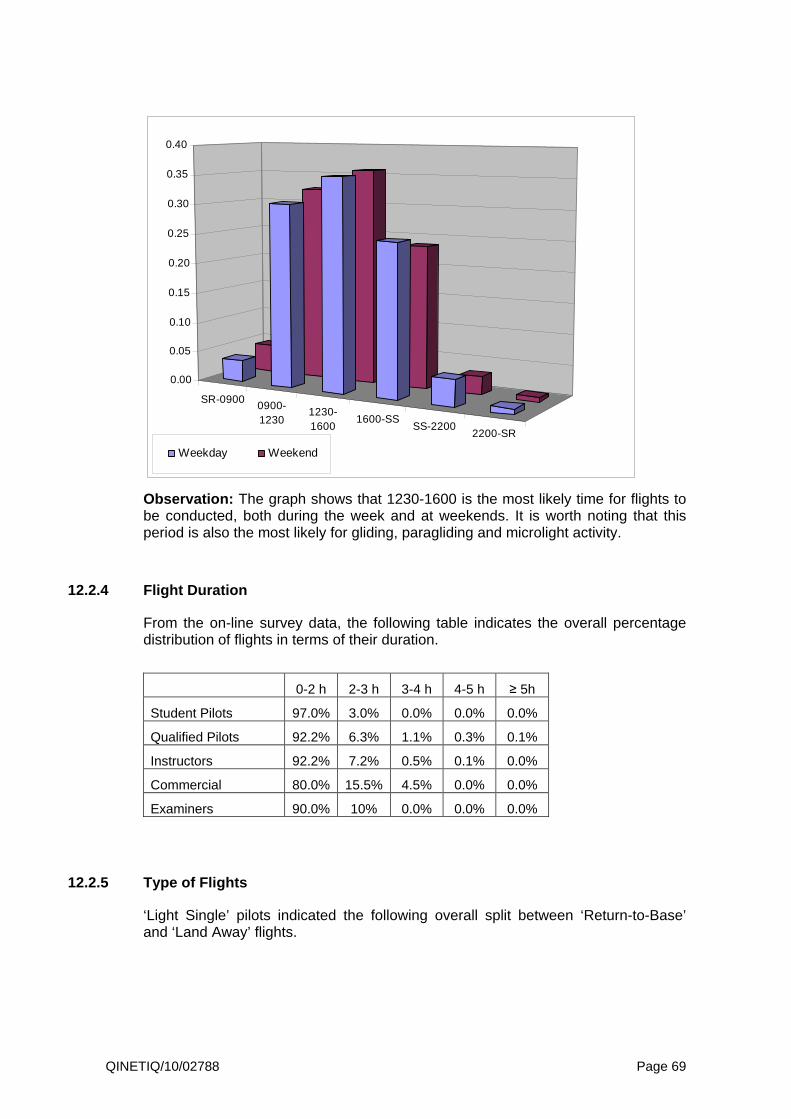
QINETIQ/10/02788 Page 69
SR-09000900-1230
1230-1600
1600-SSSS-2200
2200-SR
0.00
0.05
0.10
0.15
0.20
0.25
0.30
0.35
0.40
Weekday Weekend
Observation: The graph shows that 1230-1600 is the most likely time for flights to be conducted, both during the week and at weekends. It is worth noting that this period is also the most likely for gliding, paragliding and microlight activity.
12.2.4 Flight Duration
From the on-line survey data, the following table indicates the overall percentage distribution of flights in terms of their duration.
0-2 h 2-3 h 3-4 h 4-5 h ≥ 5h
Student Pilots 97.0% 3.0% 0.0% 0.0% 0.0%
Qualified Pilots 92.2% 6.3% 1.1% 0.3% 0.1%
Instructors 92.2% 7.2% 0.5% 0.1% 0.0%
Commercial 80.0% 15.5% 4.5% 0.0% 0.0%
Examiners 90.0% 10% 0.0% 0.0% 0.0%
12.2.5 Type of Flights
‘Light Single’ pilots indicated the following overall split between ‘Return-to-Base’ and ‘Land Away’ flights.

QINETIQ/10/02788 Page 70
Return-to-Base
Land Away
Student Pilots 84.5% 15.5%
Qualified Pilots 42.2% 57.8%
Instructors 87.2% 12.8%
Commercial 29.7% 70.3%
Examiners 50.9% 49.1%
12.2.6 Operating Area
‘Light Single’ pilots indicated the percentage of flights conducted within different distances of the departure airfield.
2.5 NM 10 NM 25 NM 50 NM (or more)
Student Pilots 45.0% 23.5% 20.7% 10.8%
Qualified Pilots 22.1% 6.4% 24.2% 47.3%
Instructors 39.3% 21.8% 24.2% 14.7%
Commercial 5.7% 3.7% 11.4% 79.2%
Examiners 46.0% 26.1% 19.2% 8.7%
12.2.7 Operating Altitude
The range of operating altitude indicated by ‘Light Single’ pilots is summarised in the following probability distribution function graphs (per 500 ft height band).

QINETIQ/10/02788 Page 71
Height Distribution (Return-to-Base Flights)
0.00
0.02
0.04
0.06
0.08
0.10
0.12
0.14
0.16
0.18
0.20
500
1000
1500
2000
2500
3000
3500
4000
4500
5000
5500
6000
6500
7000
7500
8000
8500
9000
9500
1000
0
Altitude (ft)
Pro
bab
ilit
y
Height Distribution (Land Away Flights)
0.00
0.02
0.04
0.06
0.08
0.10
0.12
0.14
0.16
0.18
0.20
500
1000
1500
2000
2500
3000
3500
4000
4500
5000
5500
6000
6500
7000
7500
8000
8500
9000
9500
1000
0
Altitude (ft)
Pro
bab
ilit
y
Observation: In both graphs, the most likely altitude is between 1,500 and 2,500 ft. For local area (return-to-base) flights, the majority of activity takes place below 3,000 ft, whereas for land away flights, operation up to 10,000 ft is claimed.
12.3 Other Information
None provided.

QINETIQ/10/02788 Page 72
13 Light Twin Activity (<5,700 kg)
13.1 General Requirements
Unfortunately, no specific activity questionnaires have been received from Light Twin pilots.
13.2 On-Line Survey
13.2.1 Sample Size
A total of 27 valid responses to the on-line survey were received from Light Twin pilots. This can be summarised as follows:
Student Pilots 0
Qualified Pilots 13
Instructors 2
Commercial 11
Examiners 1
Due to the small sample of Instructors and Examiners, no statistical analysis is provided.
13.2.2 Annual Logged Hours
The average (annual) logged hours for Light Twin pilots were as follows:
Total PUT or P1/S
Student Pilots - -
Qualified Pilots 59.8 5.0
Instructors N/A N/A
Commercial 178.1 4.1
Examiners N/A N/A

QINETIQ/10/02788 Page 73
The maximum and minimum (annual) logged hours for Light Twin pilots were as follows:
Max. Min.
Student Pilots - -
Qualified Pilots 220 11
Instructors N/A N/A
Commercial 450 5
Examiners N/A N/A
13.2.3 Operating Times
Users indicated the following split between hours flown on weekdays and weekend/bank holidays.
Weekday Weekend Bank Holiday
Student Pilots - -
Qualified Pilots 69.6% 30.4%
Instructors N/A N/A
Commercial 67.6% 32.4%
Examiners N/A N/A
Qualified (private) Light Twin pilots indicated the likelihood of flying activity taking place during different periods throughout the day, for (i) weekdays and (ii) weekend/bank holidays. For each series, the sum of the values over the 24 hour period equals 1.0 (i.e. 100%). Note: this chart does not show the amount of flying that takes place, and for example, a higher weekday value compared to weekend value does not necessarily mean that more flying takes place on weekdays.

QINETIQ/10/02788 Page 74
SR-09000900-1230 1230-1600
1600-SSSS-2200
2200-SR
0.00
0.05
0.10
0.15
0.20
0.25
0.30
0.35
Weekday Weekend
Observation: Private Light Twin activity is most likely to occur during daylight hours. At weekends, the most likely period for operation is between 0900 and 1230.
Commercial Light Twin pilots indicated the likelihood of flying activity taking place during different periods throughout the day:
SR-09000900-1230 1230-1600
1600-SSSS-2200
2200-SR
0.00
0.05
0.10
0.15
0.20
0.25
Weekday Weekend

QINETIQ/10/02788 Page 75
Observation: Commercial Light Twin activity is fairly evenly spread-out, and equally likely to take place during the day or night.
13.2.4 Flight Duration
By dividing the total hours by the number of flights made, it is possible to derive the average (mean) flight duration.
Total Hours No. Flights Ave. Duration (h:mm)
Student Pilots - - -
Qualified Pilots 59.8 45.1 1:20
Instructors N/A N/A N/A
Commercial 178.1 142.6 1:15
Examiners N/A N/A N/A
The following table indicates the percentage distribution of flights in terms of their duration.
0-2 h 2-3 h 3-4 h 4-5 h ≥ 5h
Student Pilots - - - - -
Qualified Pilots 83.1% 13.1% 3.8% 0.0% 0.0%
Instructors N/A N/A N/A N/A N/A
Commercial 76.5% 7.3% 5.5% 5.7% 5.0%
Examiners N/A N/A N/A N/A N/A
13.2.5 Type of Flights
Light Twin pilots indicated the following split between ‘Return-to-Base’ and ‘Land Away’ flights.
Return-to-Base
Land Away
Student Pilots - -
Qualified Pilots 23.3% 76.7%
Instructors N/A N/A
Commercial 52.2% 47.8%
Examiners N/A N/A

QINETIQ/10/02788 Page 76
13.2.6 Operating Area
Light Twin pilots indicated the percentage of flights conducted within different distances of the departure airfield.
2.5 NM 10 NM 25 NM 50 NM (or more)
Student Pilots - - - -
Qualified Pilots 21.9% 7.3% 29.5% 41.3%
Instructors N/A N/A N/A N/A
Commercial 6.8% 4.1% 9.2% 79.9%
Examiners N/A N/A N/A N/A
13.2.7 Operating Altitude
The range of operating altitude indicated by both Qualified (private) and Commercial Light Twin pilots is summarised in the following probability distribution function graphs (per 500 ft height band).
Height Distribution (Return-to-Base Flights)
0.00
0.02
0.04
0.06
0.08
0.10
0.12
0.14
500
1000
1500
2000
2500
3000
3500
4000
4500
5000
5500
6000
6500
7000
7500
8000
8500
9000
9500
1000
0
Altitude (ft)
Pro
bab
ilit
y

QINETIQ/10/02788 Page 77
Height Distribution (Land Away Flights)
0.00
0.02
0.04
0.06
0.08
0.10
0.12
0.14
500
1000
1500
2000
2500
3000
3500
4000
4500
5000
5500
6000
6500
7000
7500
8000
8500
9000
9500
1000
0
Altitude (ft)
Pro
bab
ilit
y
Observation: There is a striking difference between local (return-to-base) and land away flights, with the majority of local flights being conducted between 1,500 and 3,500 ft. For land away flights, operation is most likely between 2,500 and 6,500 ft.
13.3 Other Information
None provided.

QINETIQ/10/02788 Page 78
14 Parachute Aircraft Activity
14.1 General Requirements
The following requirements are relevant to Parachute activity.
14.1.1 Air Stability
Not specified.
14.1.2 Visibility
A visibility of greater than 5 km is required.
14.1.3 Wind Speed
A steady 10 kt is considered ideal.
For Static Line, activity will take place if the maximum (steady) wind speed does not exceed 15 kt.
For Free-Fall, activity will take place if the maximum (steady) wind speed does not exceed 20 kt. However, inexperienced parachutists are generally limited to 15 kt.
14.1.4 Cloud Base
For Static Line, activity will not take place if the cloud base is less than 4,000 ft.
Cloud base requirements for Free Fall not stated.
14.2 On-Line Survey
No data was supplied for Parachute activity.
14.3 Other Information
The following information was supplied by parachute aircraft pilots:
“A flight (carrying parachutists) is referred to as a ‘lift’.”
“A Static Line ‘lift’ comprises one pass of the drop zone at 2,000 ft AGL then 6 at 3,500 ft AGL. For each sortie, the parachute aircraft will typically be airborne for 20-25 minutes.”
“A Free-Fall ‘lift’ generally comprises 2 or 3 tandem pairs plus one cameraman. For each sortie, the parachute aircraft will typically be airborne for 30 minutes.”
“During the right weather conditions, a busy drop zone may have around 15 ‘lift’ sorties per day. Consequently, parachute aircraft spend a significant percentage of time in the air.”
“”Parachute aircraft will typically operate within 3-4 NM of the drop zone.”

QINETIQ/10/02788 Page 79
15 Summary This report provides a statistical summary of the information supplied to the ASI through the various surveys that were conducted as part of the Class G Airspace Modelling ‘Pilot’ study. Whilst the information has been checked for obvious errors and is considered to be credible, its authenticity and accuracy cannot be guaranteed. Furthermore, due to the anonymous nature of the on-line survey, we have no means of verifying whether the data provided is an accurate reflection of the activity that actually takes place in Class G airspace.
Despite these limitations, the data contained within this summary report provides a valuable insight into many of the activities that are conducted within Class G airspace. Specifically, this report provides information relating to the weather conditions that are most conducive for each type of activity, and the operating characteristics of flights (altitude range, flight duration, area of operation etc.).
By sharing this information amongst all users of Class G airspace, it is hoped that this will create greater awareness of other airspace users’ needs and priorities, and this increased awareness should improve overall safety.
- - - END - - -