Clarity on Commodities Trading - KPMG | US · PDF fileClarity on Commodities Trading 3...
68
Commodities Trading 06 Trading places Perspectives on selected international trading locations 28 Evolving trends A look at the main trends affecting commodity trading 52 Trade flows An analysis of the evolution of commodities trade flows Clarity on April 2015 Transforming with agility
Transcript of Clarity on Commodities Trading - KPMG | US · PDF fileClarity on Commodities Trading 3...

Commodities Trading
06Trading placesPerspectives on selected international trading locations
28Evolving trendsA look at the main trends affecting commodity trading
52Trade flowsAn analysis of the evolution of commodities trade flows
Clarity on April 2015
Transforming with agility

2

Clarity on Commodities Trading
11
Clarity on
Commodities Trading
C O N T E N T
E D ITO R I A L
03 Transforming with agility
04 Highlights
C H A P T E R I
06 Trading places
08 Switzerland: a powerful trading hub on a solid foundation
12 Houston, Texas: an energy powerhouse16 London: setting the standard20 Dubai, United Arab Emirates: a trading legacy24 Singapore: a premier commodity hub
C H A P T E R I I
28 Evolving trends
30 Survival of the fittest: navigating through turbulent markets
34 Agile transformation: how business and IT transformation is changing
38 A new policy for an age of transparency 42 Geared for change: regulations trends
impacting the commodity trading sector46 Taxing times50 Market trends
C H A P T E R I I I
52 Trade flows
54 Iron ore 56 Copper58 Soybean60 Crude oil
6 4 P I N B OA R D
6 5 C O N TAC T S & I M P R I N T

2

Clarity on Commodities Trading
3
E D ITO R I A L
Commodity trading companies today operate in a highly competitive and dynamic environment where change is one of the few constant factors. Complexity of doing business is being increased by changes in regulation, business models and trade flows.
With a world population expected to grow almost 40% by 2050, the middle class rising in emerging countries and the continuation of industrialization, there is a structural increase in the demand for commodities. While trading companies have an essential role to play to link this demand to new sources of supply, this will require investments in infrastructure and global coverage. At the same time, trading companies need to maintain agility as external factors are creating unforeseen changes in trade flows, currencies and commodity prices.
Companies that will succeed will have flexible cost structures, clear entry and exit strategies and most importantly should be prepared to expect the unexpected.
With this publication, KPMG wants to illustrate the growing importance of the commodity trading sector to the global economy. By focusing on the main trends affecting commodity trading and the perspectives of our specialists on the developments visible in various trading hubs, we want this to be the next piece in your transformation journey.
Richard Sharman
Richard SharmanHead of Commodities Trading
Transforming with agility
4
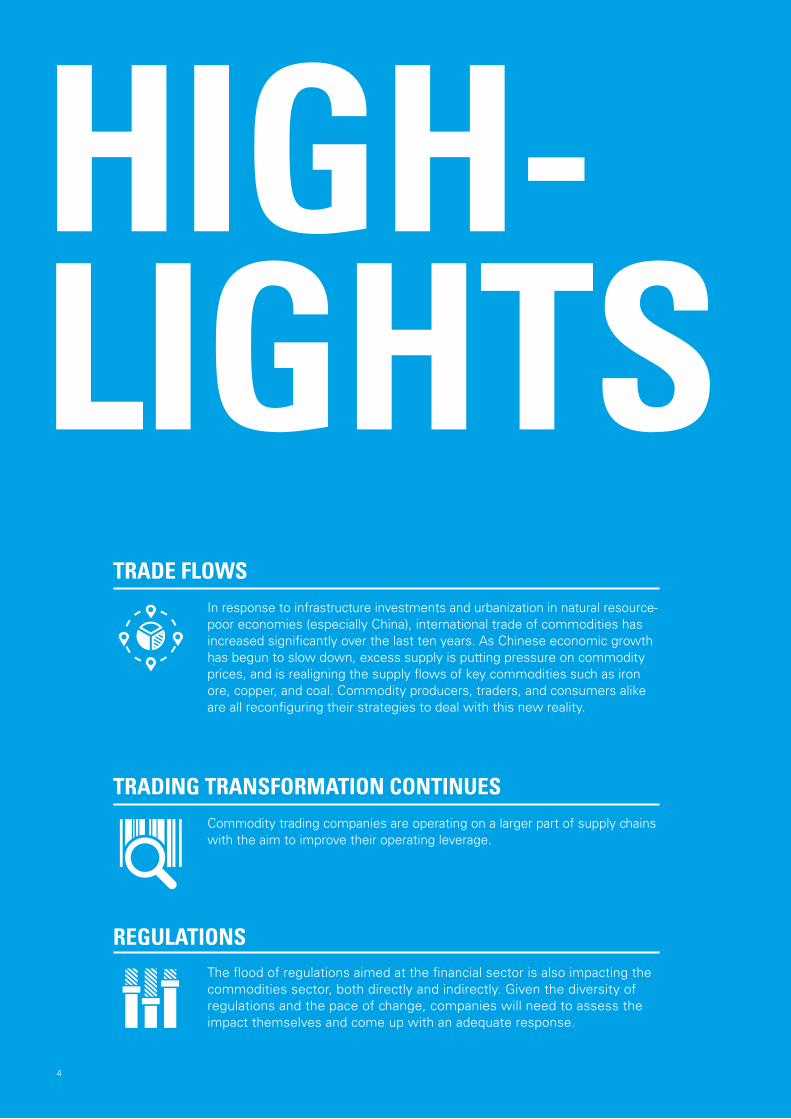
In response to infrastructure investments and urbanization in natural resource poor economies (especially China), international trade of commodities has increased significantly over the last ten years. As Chinese economic growth has begun to slow down, excess supply is putting pressure on commodity prices, and is realigning the supply flows of key commodities such as iron ore, copper, and coal. Commodity producers, traders, and consumers alike are all reconfiguring their strategies to deal with this new reality.
4
TRADE FLOWS
Commodity trading companies are operating on a larger part of supply chains with the aim to improve their operating leverage.
TRADING TRANSFORMATION CONTINUES
The flood of regulations aimed at the financial sector is also impacting the commodities sector, both directly and indirectly. Given the diversity of regulations and the pace of change, companies will need to assess the impact themselves and come up with an adequate response.
REGULATIONS
HIGH-LIGHTS

Clarity on Commodities Trading
55
Regulatory changes, increased capital requirements and reduced trading opportunities have forced many financial institutions to leave commodity trading. These exiting financial institutions provide opportunities for trading companies to fill the gap.
FINANCIAL INSTITUTIONS EXITING PHYSICAL COMMODITY TRADING
As a consequence of utilizing new sources of capital and opening up to external investors, commodity trading companies will have to embrace a more transparent and open dialogue with stakeholders.
STAKEHOLDERS’ COMMUNICATION
To reduce complexity and costs, there is a trend towards IT integration. At the same time, IT needs to be more flexible and adaptive to changes, a strategy the trading industry is familiar with.
AGILE IT OPERATIONS
Increasingly, countries face international competition trying to entice businesses based on attractive tax rates. The current wave of international tax reform is creating uncertainty over the tax position of existing business structures.
TAX
The decision where to establish a business is not only driven by competitive tax rates. Companies also consider infrastructure, legal systems, regulations and the quality of the workforce. Successful trading clusters show that governments strategically create favorable conditions for trading companies.
GOVERNMENTS FACILITATE STRONG TRADING CLUSTERS
Resource restriction, climate change and behavioral changes will drive technological developments focused on energy efficiency, recycling, localized energy generation and food production.
LONG-TERM TRENDS
HIGH-LIGHTS
6
Change is one of the few constants. This is the common message from our specialists when they observe developments in various trading hubs. Commodities traders are under pressure to continuously revisit their role in the supply chain and reassess the value they add to markets. In fact, this need is not limited only to companies. It applies equally to the countries in which the traders operate. Countries compete to attract businesses and employment. They do this primarily by offering attractive tax rates, robust legal systems and good infrastructure, as well as on the basis of labor costs and standards of living. These qualities can vary in attractiveness as trade flows, currencies and commodity prices change – sometimes instantly – having potentially significant implications for where a business deems to be an appropriate base.
TRADING PLACES Perspectives on selected international trading locations
CHAPTER I
6

Clarity on Commodities Trading
77

88

Clarity on Commodities Trading
9
Switzerland has a long tradition of being one of the world’s leading centers of commodities trading. There is a hub of diverse companies active in and around the commodities industry, including banks that specialize in the financing of commodities trading, companies providing inspection services, shipping companies, insurance companies, law firms, escrow agents and consultants. It is in the interest of Switzerland to maintain the strong fundamentals of the industry, specifically its attractiveness as a business location from a tax, infrastructure, regulation and quality of living perspective.
SWITZERLANDA powerful trading hub on a solid foundation
9

10
are well trained and specialized. Switzerland’s strategic location in Europe, ideally situated between American and Asian time zones, makes it possible to trade with Asia, the Middle East, and the continental US on the same day. The country’s modern infrastructure, good transpor-tation system and flexible employment laws are further arguments that favor Switzerland as a center for commodi-ties trading.
As a business location for commodities trading, Switzerland faces international competition from places such as Singapore, Dubai, China, the United States and the United Kingdom.
addition to other factors that contrib-ute to Switzerland’s appeal as a busi-ness location, such as the availability of well-trained personnel and a gener-ally high standard of living, the coun-try’s sophisticated and stable financial system makes it particularly attractive as a commodities trading center. Commodity traders must be able to rely upon the availability of special-ized financial service providers that of-fer highly sophisticated financing and arbitrage products tailored to the spe-cific needs of the commodity industry. A Masters in International Trading, Commodity Finance and Shipping program ensures that new workers come into the market every year who
he building blocksThe reasons for Switzerland’s major role in global commodities trading include a stable
and predictable political, economic, and legal environment, a competitive corporate taxation regime and a busi-ness-friendly regulatory climate. In
Reijer Barendregt, KPMG in Geneva
T
C H A P T E R I T R A D I N G P L AC E S

Clarity on Commodities Trading
11
However, with its attractive effective statutory corporate income tax rates, binding advance tax rulings, an exten-sive network of tax treaties (with close to 90 nations), investment protection agreements (over 100), a VAT rate of 8% and a competitive personal income tax system, Switzerland still remains very attractive.
Being adaptive to changeRecent referendums (specifically the Stop Mass Immigration Initiative, the referendum on limiting the highest sal-ary in a company to twelve times the lowest salary and the referendum on executive pay) and the decision of the Swiss National Bank (SNB) to stop its currency intervention may somewhat undermine the idea of a stable and pre-dictable political, economic, and legal environment. However, these events should be seen as a response to the instability that surrounds Switzerland, which inevitably affects the open economy of Switzerland. Another in-terpretation of this could be that it is precisely these responses (and ongoing dialogues) that demonstrate the strength and the flexibility of the Swiss economy.
Switzerland’s reputation has recently been a bit more tarnished as concerns have been raised about the lack of transparency of Swiss-based banks, which have been under fire for several years for allegedly helping clients evade taxes. Concerns regarding trans-parency and the damaging effect to the
country’s reputation have also affected the commodity trading industry. This has resulted in a background report on the commodities industry to the atten-tion of the Swiss Federal Council. The Swiss Federal Council expects all companies to conduct themselves responsibly and with integrity, to comply with human rights, environmental and social responsibili-ty standards but is re-luctant to produce in-dustry-specific regulation. The recom-mendations highlight the need for improved transparency concern-ing derivative trading, money laundering, tax evasion, physical com-modity trading, finan-cial flows from resource extracting companies to governments and prod-uct flows. Commodity trading compa-nies, fully aware of the stakes, have engaged proactively in the voluntary improvement of their governance. To ensure a level playing field, Switzerland will engage itself to have the regula-tions it will implement align with reg-ulations implemented by other major financial centers.
The fundamentals matterThere is currently no evidence of com-panies moving away from Switzerland in droves. Much will also depend on the framework of the Corporate Tax
Reform III and the ongoing dialogue with the EU on corporate taxation. Based on the current draft of the legis-lation, it appears that Switzerland will be able to maintain a competitive tax regime.
Concerns around transparency, referen-dums and the strength of the Swiss franc should not affect Switzerland’s competitiveness. Ultimately, Switzerland is competitive because of its underlying strengths, such as a highly specialized workforce, an excellent banking system, competitive taxes and a high standard of living. In the end, these fundamentals matter.
Switzerland recognizes the importance of the commodity trading industry for its economy and will protect its interests through effective regulations that will strengthen the industry to create a level playing field.

1212

Clarity on Commodities Trading
13
Dominating Houston’s industrial landscape, energy is vital to the city’s economy. With many of the world's largest energy trading companies either headquartered or having major trading offices in Houston – BP, Shell, Chevron, Vitol (to name but a few), the city thrives on its commodities business. Oil, gas and refined products take pride of place in an industry that spans both financial and trading activities. An extremely large physical commodities community completes the mix.
HOUSTON, TEXASAn energy powerhouse
13

14
subsequent emergence of shale pro-duction methods, both of which have added to the city’s fortunes. Indeed, George Mitchell, the “father of frack-ing,” was a major contributor to Houston area business, residential de-velopment, and arts communities. Energy trading in deregulated markets remains strong in Houston, and there remains considerable interest in shale plays, even at low prices, primarily due to ongoing infrastructure invest-ments and the effect that increased supply has on downstream industries such as chemical manufacturing lique-fied natural gas (LNG) exportation.
executives. There has also been consid-erable investment in related industries such as chemicals, technology, and ad-vanced manufacturing.
Deregulation and shale: reinvigorating the city’s fortunesHaving gone through difficult times in the 1980s because of its dependency on the energy industry, Houston’s economy diversified over the next two decades. Even so, Houston is once again well served by the energy sector.Much of this success can be attributed to the postderegulation merchant ener-gy boom of the early 2000s and the
he commodities business achieved critical mass in Houston many years ago. In addition to those di-rectly involved in the en-
ergy business, an entire service indus-try has sprung up – from engineers to financial accountants to business
Brian O’Neal, KPMG in Houston
T
C H A P T E R I T R A D I N G P L AC E S

Clarity on Commodities Trading
15
A future burning brightProspects for the city’s energy indus-try are aided by the fact Texas has made great strides to be a busi-ness-friendly state, particularly in terms of taxation and regulation. Corporate law and taxes are condu-cive, with relatively low corporation tax and the lack of a personal income tax drawing businesses and talented professionals to the state. A certain de-gree of forward thinking has also played its part. The late 1990s saw a heavy investment in com-munications and infrastructure by Houston’s government. And of course its sheer proximity to natural resources should not be underestimated. Such factors mean the future remains bright.
Some challenges persistEnergy in Houston faces com-mon challenges, though few are uniquely attributable to the city itself. In speaking to executives across energy trading companies, a common concern is the ability (and cost) to keep pace with reg-ulatory change. As the industry moves towards greater transpar-ency, many businesses are investing heavily in compliance with an evolv-ing regulatory landscape. Environmental regulations are also a key concern for the industry’s execu-tives. In addition to well-publicized opposition to hydraulic fracturing, a number of ongoing updates to environ-mental regulations are addressed and planned for by Houston’s top energy companies on an annual basis.The falling price of oil is also a major
cause for concern at energy trading companies as well as associated indus-tries that rely on oil and refined prod-ucts (e.g. oil field services, drilling companies, engineering firms, etc.). Depressed oil prices cause capital needs to come to the fore. As a result, organizations along the value chain are looking to become more flexible. Many energy traders in particular are looking closely at their business models.
Even taking these challenges into ac-count, continued investment in capital projects and human resources can be expected. Especially as the overall US infrastructure for oil refining, com-modity transportation, and power gen-eration and transmission is expected to lag behind future needs. A lion’s share of future investment is likely to focus on Houston, given the concentration of major energy players here and the vast existing pool of skilled resources.
So what does the future hold for the corporate landscape?The combination of low oil prices and highly leveraged midtier producers means consolidation can be expected to gather pace from late 2015. Once existing hedges expire, sustained oil production at USD 40 per barrel could cause considerable financial difficul-ties and drive multiple companies to seek relief in asset sales and divesti-
tures. Larger players are already closely observing such small businesses, considering possible asset purchases and entity acqui-sitions in the near future. As far as the bigger picture is concerned, there is a clear shift in global energy dynamics as a result of the US’s mass exploita-tion of shale deposits. With mod-erate pricing expected to endure for some time, impacts will be felt across multiple industries and global populations. Houston’s history with the indus-try, ability to carry through mar-ket lows and highs, and concen-tration of talent mean it will continue to exert significant in-fluence on this changing market environment.
Houston remains extremely attractive as a commodities hub. Continued de-velopment is expected across crude oil, gas and refined products. The industry will continue to evolve – as it has for decades – and is working hard to en-hance its risk management and capital management approaches. All in all, the city remains an extremely exciting place to do business – with a future full of enthusiasm and, well … energy.
If trading is squeezed by low market liquidity, and capital situations restrict proprietary trad-ing, we may see a number of companies shift their focus towards asset ownership, optimization, and tax-advantaged corporate restructuring.

1616

Clarity on Commodities Trading
17
From the City coffee houses that gave rise to some of the world’s first stock exchanges in the 17th century to the Brent Crude benchmark that emerged in the 1970s, London has played an important role in the evolution of commodity trading. London continues to set the standard today through global benchmarks for metals and oil as well as by having the largest natural gas market in Europe.
LONDON Setting the standard
17

18
match buyers and sellers in the OTC market. It has exchanges and trading houses specializing in industrial metals, agricultural commodities and energy futures. Events such as International Petroleum Week and LondonMetal Exchange Week bring industry players together every year.
The city’s cosmopolitan character and cultural offerings attract skilled per-sonnel from all over the world who fill a diversity of roles within commodity
thriving ecosystem of trade and financeAs a world financial center, it is the place that market participants
come to structure, fund and hedge their trades. London sets itself apart as a hub for trading commodities from other trading centers in Switzerland and Singapore thanks to a high density of the industry’s key institutions, events and people. The city is home to major commodity brokerages that actively
AJames Maycock, KPMG in London
C H A P T E R I T R A D I N G P L AC E S

Clarity on Commodities Trading
19
trading. A London address still holds prestige value for company owners. In addition, investors and traders from other countries are drawn by the ease of doing business in the UK: barriers to entry are low, assets are safeguarded by the rule of law and the political sys-tem is stable.
Weighing the EU relationship and new regulationMarket observers are monitoring sever-al variables in the current political envi-ronment. The UK is gearing up for a closely contested election in May 2015. Amid the broader political uncertainty in the short term, a key issue in the up-coming election is the UK’s relation-ship with Europe – especially with a potential yes/no referendum in 2017 – as well as the impact of EU regulation and the emergence of a more joined-up approach from regulators across borders more generally. A raft of regulatory measures followed the 2007-2008 financial crisis in re-sponse to calls for more transparency and oversight. One effect of such regu-lation, including MiFID II (the EU Directive on Markets in Financial Instruments), REMIT (the EU Regulation on Energy Market Integrity and Transparency), EMIR (European Market Infrastructure Regulation on OTC derivatives) as well as various
directives re-garding capital requirements, is that many banks have abandoned oth-erwise profit-able commodi-ty trading lines due to the un-certainty sur-rounding the additional costs they may impose. Although the liquidity gap left by the banks has not yet been filled, this seems to be a short-term issue. The larger question on the minds of all market players is the ultimate financial burden of the coming regulatory and tax schemes.
Finding opportunity in current market dynamicsWhilst foreign currency risk looks set to become a longer-term trend global-ly, with central banks continuing to experiment with interest rates and quantitative easing, commodity traders in London are accustomed to manag-ing foreign currency exposure since they have always done their business in dollars.
Volatility has returned to the commod-ity markets in the form of weak prices and shifts in global energy sources.
Traders accordingly have new opportunities to match supply and demand throughout the energy supply chain, using shipping and storage.
Market watchers see more potential for vertical integration within the in-dustry. In the North Sea in particular, where assets are mature, new players including fund managers are also tak-ing the opportunity to diversify their portfolios as more established oil com-panies move to new frontier territories.
Given the increasingly global nature of energy markets as well as financial markets, London appears well posi-tioned to profit from its location at the confluence of capital flows, talent mi-gration and broader trends in business.

2020

Clarity on Commodities Trading
21
To understand Dubai and its strategic focus on commodities trading, look at aspects of its past to see how central this business is to Dubai’s success. Dubai began as a village centered on fishing and pearl trading and grew on the back of this trading legacy. However, as Sami Al Qamzi, Director General, Department of Economic Development (DED), says: “While retail trade has always played an important role in Dubai’s growth, it has undergone a major transformation and modernization in the last ten years. Trade has and continues to be one of the key pillars in the overall structure of our local economy and a main driver for its growth with the rising curve in trade volumes as an indicator of the success of its developmental strategies.”
DUBAI, UNITED ARAB EMIRATESA trading legacy
21

22
has become an attractive place to do business, with Western markets shifting trade and financial flows from the West to the East. This also has to do with the massively increased regulatory burden of conducting commodity and deriva-tives businesses in Western markets.
Dubai, with its first-world infrastruc-ture and ideal geographic location, is ideally placed to play its part in these flows.
Now established as a global player in gold, diamond and tea trading In particular for gold flows, Dubai has been able to capitalize on both its
Emirates with over 9,000 registered companies under license. Ahmed Bin Sulayem, Executive Chairman of DMCC, is quoted on their website as saying: “Trading will always be a key component of Dubai’s vision of be-coming a dynamic and diverse econo-my, and the gateway to the emerging markets of the Middle East. As an interna-tional commodities hub, DMCC plays an important role in the evolution and economic growth of Dubai.”
A location central to global commodities flowsIn addition to this strategic focus on trade, Dubai’s success is in part due to its central location. It is midway be-tween East Asia and western Europe, as well as Central Asia in the north and Africa in the south. At a time when the the European and the American econo-mies are growing only sluggishly, Asia
ommodities trading as a strategic government initiativeAt the heart of this growing trade is
Dubai’s commodities industry. In 2002, as a central strategic govern-ment initiative, the Dubai Multi Commodities Centre (DMCC) was es-tablished with a mandate to provide the physical, market and financial in-frastructure required to set up and op-erate a thriving commodities market-place. This was seen as vital for Dubai to be a global gateway for the com-modities trade. Today, DMCC is the largest free zone in the United Arab
Luke Ellyard, KPMG in the Lower Gulf
C
C H A P T E R I T R A D I N G P L AC E S
Businesses are also aware that they can go more directly from production in the west (Africa and South America) or north (Russia) to consumption in Asia.

Clarity on Commodities Trading
23
proximity to the key consumer mar-kets of India and China and its value as a trade hub and channel from the international market to its ultimate destinations. It is currently the world’s leading physical gold market with over 40% of the world’s gold passing through the emirate, with some giving Dubai the nickname City of Gold. This is also true for flows in other commodities, such as diamonds. DMCC has grown exponentially in terms of diamond trading in recent years. Diamonds are following the West-to-East. The Dubai Diamond Exchange now has over 600 precious stones and diamond companies and is one of the top three diamond trading centers in the world. Tea is reversing the West-to-East pattern, shifting fur-ther west. The UAE is the world’s largest reexporter of tea with a 60% share of the market. Again DMCC plays a key role in global tea trading and logistics. Both diamonds and tea are now established because of what Dubai can offer to this global com-modities flow.
Other factors contributing to the success Dubai has two main commodities ex-changes: the Dubai Gold and Commodities Exchange (DGCX), lo-cated in the DMCC, and the Dubai Mercantile Exchange (DME). The DME is located in the Dubai International Financial Center (DIFC), a financial free zone designed to pro-mote financial services within the UAE, which is regulated by the Dubai Financial Services Authority. It is the main energy-focused commodities ex-change east of the Suez and home to the world’s third largest crude bench-mark, the Oman Crude Oil Futures Contract (DME Oman) which is estab-lished as the crude oil benchmark for the region and historically established markets for Middle Eastern crude oil exports to Asia. However, whilst the DMCC as a free zone acts as a focal point for commod-ities trading, there are many other fac-tors contributing to the success,
including world-class air and port free-zone facilities. Other attractivefactors, such as Dubai’s strong securi-ty and good customs, combined with the rest of the infrastructure, make Dubai a place where cash and physi-cally settled ETD and OTC commodi-ties contracts are viable options for global as well as local businesses. The available skill set is constantly im-proving, meaning that companies es-tablishing themselves in Dubai can find (or easily import) the skilled labor they require. Telecoms and associated trading technologies are also constant-ly improving. Where once they may have been viewed as a deterrent to set up shop in the region, this is no longer the case.
Positively countering the geopolitical and regulatory challenges facedGiven Dubai’s location, it is impossi-ble to ignore the rise of religious ex-tremism in the Middle East and Africa. The region has its fair share of politi-cal tension. However, Dubai is part of the UAE, which has a reputation for being a low-crime and politically sta-ble country, considered a safe haven for people and money flows from the rest of the region. Another aspect that cannot be ignored is the fall of the oil price. However, since the formation of the UAE in 1971, Dubai has transformed itself from an oil-and gas-dependent state to a broadly diversified economy based on international trade, banking, tourism, real estate and manufacturing. Oil has played a progressively diminishing role in the emirate’s economic profile. In 1985, the oil sector contributed just un-der half of Dubai’s GDP. By 1993 that figure had fallen to 24%, and now it is under 5%. Perversely for its location, Dubai has the potential to gain from the rise in trade flows expected from the falling costs of transport fuel.
From a regulatory perspective the challenge is the economic fallout from 2008, which is now affecting how the derivatives business is conducted in and between economic areas. Central
counter parties (CCPs) are considered a key element of the infrastructure in the financial system of any economy, integral in managing risk within the fi-nancial system, and European Market Infrastructure Regulation (EMIR) is focusing on the financial security of CCPs, the integrity and capability of CCP management, capital and struc-ture. Broadly, EMIR requirements for capital and structure are becoming benchmarks within the industry and the Emirates Securities and Commodities Authority, the federal regulator, is like-ly to adopt these standards in new reg-ulation. This would be beneficial for Dubai because it will give global insti-tutions increased confidence in the regulatory environment, reduce risk within well-capitalized CCPs, and therefore give institutions added com-fort in engaging with local CCPs.These positive regulatory steps, pro-viding a regulatory environment in many ways equivalent to Europe, sim-ply enhance Dubai as a location in which global entities are happy to con-duct commodities business.
So what does the future hold for Dubai? One of the six key themes in the re-cently published city’s vision for 2021 is that it will aim to be a “Pivotal Hub in the Global Economy.” Dubai has also been awarded the World Expo for 2020 which will be held under the theme “Connecting Minds, Creating the Future” and is projected to attract 25 million visitors, 70% from over-seas. Both of these projects are central to Dubai’s growth over the coming years and reinforce the view that Dubai will continue to focus on devel-oping its role as a trading center in the world of commodities flows. It is hard to imagine where the Dubai commodity industry will be in ten years, but assuming flows and capital continue to move to the East, regula-tion, systems and infrastructure reach operational maturity, and the market continues to develop at the pace of the last ten years, it will be an exciting place to be!

24
Singapore’s evolution towards becoming one of Asia’s premier commodity trading hubs has been a carefully crafted process. Through government pragmatism, proactivity and foresight, Singapore is jostling with Hong Kong and Shanghai to become Asia’s chief commodity trading hub.
SINGAPOREA premier commodity hub
24

Clarity on Commodities Trading
25
SINGAPOREA premier commodity hub
25

26
trading. In agriculture, it sees about 20% of global trade and ranks second – behind Switzerland – for metals and minerals. It is, nonetheless, the gov-ernment’s cultivation of an attractive business environment that has cata-lyzed the “little red dot” into a global commodity and financial powerhouse.
Business havenA key competitive advantage Singapore has over Southeast Asian rivals is that it is both a trading and banking hub, with both growing hand in hand. The city-state’s physical and paper market has flourished because the
markets of the West and energy-de-mand centers of the East.It has emerged as the world’s third largest transshipment port, largest bun-ker market and boasts a reputation for maritime and logistical proficiency. Its deep-water berths can accommodate Suezmax, Panamax oil tankers and very large crude carriers (VLCC), sup-plementing the development of a large, well-integrated and sophisticated downstream supply chain.
Supported by world-class infrastruc-ture, it is perhaps little surprise that Singapore handles approximately 15% of the world’s physical crude oil
ocated along the cross-roads of busy sea-lanes and supported by a natural deep-water harbor, Singapore has long facili-
tated Asia’s rising appetite for com-modities. Indeed, Singapore sits strate-gically between the traditional supply
L
Hak Bin Pek, KPMG in Singapore
C H A P T E R I T R A D I N G P L AC E S

Clarity on Commodities Trading
27
commodity market has long had ac-cess to a trade finance platform, sup-ported by transparency and a robust attitude to the rule of law.
The implementation of innovative fis-cal incentives has drawn a stream of international trading companies to set up shop in Singapore.
The “Global Traders programme” (GTP), established in 2001, offers a corporate tax rate of 10% to traders. Companies can qualify for a 5% rate if they commit to hiring local Singaporeans and make significant use of Singapore’s banking and financial services, among other criteria. In a rel-atively short time, the GTP has con-tributed substantially to the country’s economy and has been a critical factor in its ascendance as not just a regional, but also as a global commodity hub.
Unfolding market trendsThe global commodity industry is con-tinuously evolving, involving a vast number of players across a broad sup-ply chain. In the last few years, a mix of financial players have left and en-tered the sector.
In the face of capital requirements, stress-testing measures and generally poor performance, a number of large investment banks have sold their phys-ical assets and exited physical trading plays. By contrast, as the oil and gas industry braces itself against weak prices, and cash flow constraints mount, M&A opportunities have emerged in Asia. The region is witness-ing a raft of private equity and hedge fund players seeking entrance into the market. A number of these are
positioning themselves in Singapore, providing innovative sources of invest-ment and, in some cases, are likely to opportunistically acquire distressed assets.
Against a backdrop of low and volatile crude oil prices, physical traders are pursuing contango trading strategies by storing oil in anticipation that crude prices will rise in the future.Singapore’s storage capacity, com-bined with vast storage developments in Pengerang, Malaysia and Batam, Indonesia, has resulted in the Malacca Straits becoming the world’s largest oil trading hub, surpassing the Amsterdam, Rotterdam and Antwerp (ARA) region. These develop-ments have resulted in prices moving beyond a Free-on-Board (FOB) Singapore basis, towards a broader FOB “Straits” basis. The extra storage will enhance trading flexibility and boost liquidity for the oil commodity industry in Singapore.
Long-term developmentsAsia, particularly after the Fukushima accident in 2011, is anticipated to be the core LNG demand market, with demand expected to rise threefold over the next 20 years.
In light of relatively high natural gas prices vis-à-vis the US and Europe, calls for the creation of a transparent and liquid LNG regional spot market have intensified. Singapore, which opened its first LNG Terminal in 2013 and has plans to build a second, has well-established ambitions to position itself as the region’s chief LNG trad-ing hub, leveraging its mature com-modity trading infrastructure. Indeed, as of 2015, Singapore LNG
Corporation (SLNG) offers Storage & Reload Services (S&R).
In conjunction with support for a more transparent and liquid LNG market comes support for the same in the electricity markets. Currently, the Energy Market Authority is providing incentives to electricity producers to facilitate a futures market, with the in-tention to provide a mechanism for hedging risk, as well as providing a platform for potential new entrants.
Whilst Singapore provides an excel-lent platform for a regional commodi-ties trading center, it also faces certain constraints and limitations such as the constraint of land, lack of indigenous resources, high labor costs and short-age of talents in some disciplines.
The successful companies tend to be the ones who are able to capitalize on Singapore’s advantageous position but also from the greater ASEAN market and resources as a whole. Those who leverage on innovative technologies and effective supply chain manage-ment across the region will be able to benefit most from the ASEAN region.
The good news is that Singapore is sitting in the middle of such a high-growth region; companies that make the right planning and strategic approach will often be rewarded.
As demonstrated in several other international markets, the end goal of more transparency and liquidity is greater competition, which itself exerts downward pressure on prices – a boon for consumers.

28
EVOLVING TRENDS
CHAPTER II
28

Clarity on Commodities Trading
29
Governments and regulators have a lot on their plates. Particularly as they seek to manage financial stability and avoid future economic crises. The way in which financial markets function – and the fast pace at which they change – adds to the difficulties. A wealth of new regulations have been proposed in the aftermath of the 2007 – 2008 financial crisis. Too many of these regulatory responses reflect the old state of affairs and the countries’ attempts to manage national interest in light of historical trends.
If a level playing field is to be achieved, a more coordinated global approach is needed to the regulation and taxation of international businesses. Some key developments such as DoddFrank and EMIR are aligned to a certain extent. For taxation, the BEPS action plan is providing international direction through the OECD. Furthermore, a series of private initiatives are being undertaken to develop standards that have truly global reach. The Extractive Industries Transparency Initiative (EITI) is one such example, aiming to enhance the transparency of commodity trade flows on a global basis. Businesses must develop their own strategies to respond to these changes. To draw a parallel with digital disruption, organizations are increasingly moving away from traditional detailed strategy and planning approaches, towards a more flexible approach. This is necessary due to the sheer speed with which change occurs – meaning that organizations have months to respond, rather than years.
Commodity trading companies tend to be very agile, with a track record of being able to respond quickly to change. Many are investing in physical assets, infrastructure and logistics to support their trading operations. In doing so, they are removing supply bottlenecks and extending their control over the supply chain in the quest for more sustainable, higher profit margins. The risk is that their extended reach will come at the expense of agility. With this in mind, successful companies may well be the ones that manage to achieve flexible cost structures, clear exit strategies and are well prepared to expect the unexpected.
29

30
SURVIVAL OF THE FITTEST NAVIGATING THROUGH TURBULENT MARKETS
30
C H A P T E R I I E VO LV I N G T R E N D S

Clarity on Commodities Trading
31
2014 saw steep falls for certain key commodities (such as crude oil and soybeans), while extending the decline in others (iron ore, coal, copper, wheat, etc.). Traders have also been working in a lowervolatility context, making directional plays such as cashandcarry oil trades scarcer. Against this backdrop, trading firms have looked to strengthen core platforms, increase supply chain efficiency (to increase trade margins), and selectively invest in assets that enhance their position in the supply chain or provide access to longterm price upside (such as in upstream mining or energy assets). Resource companies have been affected by the lowerprice environment, with smaller players becoming vulnerable due to the reduced profitability on weaker balance sheets. With 2015 opening with prices still low, major players are now looking at where and how to play in the new context.
LOW PRICING DRIVING STRATEGIC AND TACTICAL OPPORTUNITIES
Continued weaker pricing in iron ore, aluminum, coal, and the recent slump in crude oil pricing have been driven by a combination of large volumes of supply coming online as well as weaker demand from China, whose economy has driven the major shifts in commodity flows over the past decade. The weaker pricing is now driving industry consolidation and shutdown of production facilities. Rio Tinto expects 85 mtpa of iron ore supply to come off the market in 2015, principally from highercost Chinese mines, but also from troubled smaller Australian mines (such as Fortescue). Similar situations can be observed in the copper (e.g.
Altona), coal and aluminum markets, where production costs and logistics costs are key pivots to viability. In oil, increased volumes on the market (in the face of the Saudi production push) have led to US new oil rig count decreasing in early 2015.
We expect the current situation to trigger a significant wave of consolidation in mining as well as oil and gas. The weak pricing over 2014 is expected to persist in the near future and will put continued pressure on midsized resource firms with relatively high production costs. As such, companies with available cash reserves (e.g. sovereign wealth funds, top mining companies, Chinese resource companies) or structured financing (e.g. physical traders) are likely to take advantage of
the opportunity the lower asset prices are presenting to acquire or joint venture with struggling smaller miners or upstream oil production companies and add them to their core operations.
The opportunities in upstream operations are traditionally not a core focus of commodity traders who prefer to own assets tied to logistics, which enhance their endtoend trading margin, and avoid flat price risk exposure. However,traders with a positive long term view of the prospects for global economic recovery are now looking for ways to play an expected rebound in commodity prices over the medium term, and if upstream assets can be used effectively to construct a solid yet hedged position, they will move on appropriate assets.
31
Clarity on Commodities Trading

32
As opportunities appear on the market, new players such as private equity funds, sovereign wealth funds, and hedge funds are participating in investments, thereby limiting trading house exposure. Current examples are Cargill along with Permira recently seeking to invest in valueadded animal feed business Nutreco, Carlyle joining up with Vitol in oil storage or Mubadala partnering with Impala (Trafigura) in port operations. Although announced transactions are more in processing and logistics, a number of attempts to transact in upstream assets have also been brokered. In addition PE firms have invested equity in trading houses, such as KKR in MCS Capital and Oaktree in Hetco, signaling the increasing trend of commodity traders looking for new sources of longterm capital to increase their business reach. In a more extreme version of this trend, the Singapore wealth fund
Temasek now controls 80% of Olam, the listed agriculturefocused trader. Where trading houses are creating JVs to enter upstream assets, they structure transactions with offtake agreements, which provide them with proprietary access to product flow, allowing them to create more complex trading structures with a greater degree of optionality.
A further effect of the low prices has been to trigger an increase in prefinancing by traders, whereby they will lock in a significant volume of offtake at fixed pricing. This allows them to establish a floor for access to product, secure supply and provide muchneeded cash to the production or mining firm to finance working capital, and continue with exploration or other capex programs. The increase in prefinancing is also a consequence of the retreat by banks from structured trade finance, and trading
houses have flexed their balance sheets to step into the void – to the point that some have considered acquiring banks.
RESOURCE-HEAVY TRADERS FOCUSING ON CORE OPERA-TIONS, BANK REGULATION DRIVING EXITS
Given the past year’s poor results and next year’s weak projections, announcements of reductions in costs and decreased budgets for capital outlays have flooded the mining market. Conjecture has run rampant with the more extreme example of Rio Tinto’s announcement that it had been informally approached by Glencore to gauge interest in a possible merger. A tieup would indeed release huge synergies and cost reductions, especially relating to both companies’ coal
C H A P T E R I I E VO LV I N G T R E N D S
PRODUCERS
• UPSTREAM OIL
(EXPLORATION AND
PRODUCTION)
• COAL MINES
• UPSTREAM GAS
• ORE MINES
• SOFT COMMODITY
PRODUCERS
UPSTREAM TRADING
• INTEGRATED TRADERS
(MAJORS AND NOCS)
• LARGE INDEPENDENT
TRADERS
• INTEGRATED
AGRICULTURE FOCUS
• MIDSIZE AND SMALL
NICHE TRADERS
PROCESSORS
• INTEGRATED REFINERS
• INDEPENDENT
REFINERS
• TRADING REFINERS
• GAS FRACTIONATION
• COAL WASHING
• METAL SMELTERS
• MILLING/GRINDING FOR
SOFT COMMODITIES
DOWNSTREAM
• INTEGRATED TRADERS
(MAJORS AND NOCS)
• LARGE INDEPENDENT
TRADERS
• INTEGRATED
AGRICULTURE FOCUS
• MIDSIZE AND SMALL
NICHE TRADERS
CONSUMERS
• POWER COMPANIES
• PETROCHEMICAL
FIRMS
• DOWNSTREAM OIL
FIRMS
• INDUSTRY
PHYSICAL TRADING COMPANIES USE LOGISTIC AND PRICING CAPABILITIES TO SOURCE, STORE AND SHIP COMMODITIES
SOURCING AND OFFTAKE AGREEMENTS
TANKER/CARGO CHARTERING
OWNED AND LEASED STORAGE CAPACITY
KEY CUSTOMER CONTRACTS
32

Clarity on Commodities Trading
33
assets in Australia. Given recent stock prices, however, such a merger would be difficult in the short term – the markets will be watching and speculating heavily from April 2015 when discussions can begin again. Furthermore, we expect continued divestment of noncore assets as resource compa-nies respond to low commodity pric-es, depressed share prices and the resulting demands of investors.
The market is also seeing the increased divestment of physical commodity trading arms by banks as financial institutions are exposed to increasing scrutiny by regulators. Even prior to the US Senate’s release of its findings on Wall Street banks’ involvement with physical commodity trading, Mercuria acquired a position of J.P. Morgan’s physical commodities business. Morgan Stanley is relaunching the sale process of its oil trading and storage business (following the attempted sale to Rosneft), which signals major banks’ exit as key players in the physical commodity trading market. Banks will retain instead their role in certain areas of financing and thereby reduce costly regulatory compliance.
ENHANCING THE VALUE CHAIN
Commodity trading companies have continued to seek opportunities to strengthen their value chains through acquisitions. We expect to see deals sparked by traders’ desire to own storage facilities, as most expect commodity prices to rise from their current levels in the foreseeable future (reflected, for example, in crude oil’s contango forward price curve). Most oil storage is still captive (i.e. owned by oil majors), and given the capital efficiency initiatives in place in those companies, we can expect more storage to be released to market, particularly in regions where demand has softened, such as Europe’s ARA terminals area.
Given the flat trading conditions of the last two years (with very low volatilities), traders have sought to increase their share of all commodity trades, increasing the volume of physical and paper products traded to maintain their absolute margins. Increasing control of the logistics chain is providing improved operating leverage to take advantage of this increase in scale in trading operations.Along this vein, another area of strategic investment is gaining control of ports with expected growth of commodity flows. These are being seen as key to developing longterm delivery cost advantages for traders across most commodity classes, including softs. Trafigura has demonstrated this by joining forces with Mubadala Development for a controlling stake in Brazil’s iron orefocused Porto Sudeste terminal. Glencore has similarly acquired a 50% stake in the Barcarena port in northern Brazil from ADM to increase their presence in soybean trade. Soft commodity traders will continue to expand their presence in port infrastructure such as terminals, jetties and storage facilities, particularly in developing markets.
Refining facilities have attracted less attention as excess supply has, on the whole, created unfavorable conditions for owners of these assets. This has been evident in the sugar market, where Brazilian sugar refineries have been difficult to sell. In addition, oil refineries, particularly in Europe, have seen margins squeezed, as lower demand, low pricing and higher relative costs reduce their appeal especially in the face of a revitalized US refining sector, which has become a net exporter once more. Traders have struggled with many refined product categories and are rethinking their positions across these desks for 2015. Going forward, this could result in increased mothballing of unprofitable refineries or much lower valuations for any transactions.
CONCLUSION
In summary, commodity prices are still heavily reliant on the dynamics of the Chinese economy, but struc-tural changes in key industries, such as the US oil and gas or Australian iron ore sectors, have also triggered significant shifts in product flow, whose impact is influencing the markets. Where anticipated, these shifts are allowing major traders to benefit from strong sourcing and marketing positions. Where traders are following the market, we are seeing traders performing strategic reviews of their noncore assets, with the larger, more diversified traders mothballing assets and/or focusing on cost reduction while waiting for commodity prices to in-crease. The smaller, less diversified resource players will be forced to consider selling their noncore (or high-cost) assets at relatively low prices. Look for private equity and other financial investors to enter the M&A market searching for bargains in the hope of commodity prices rising in the future. Traders will continue to pick up logistical assets in order to extend their scale advantages in key product platforms. Resulting from these trends is an expected reshuffling of assets in favor of the larger, more financially sound traders and new market entrants looking for bargains.
33
Clarity on Commodities Trading
Bryan DeBlanc, KPMG in Zurich, and James Carter, KPMG in Geneva
34
AGILE TRANSFORMATION HOW BUSINESS AND IT TRANSFORMATION IS CHANGING
C H A P T E R I I E VO LV I N G T R E N D S
34

Clarity on Commodities Trading
35
The commodity trading industry is facing increased competition and higher demand for valueadded products and services. This leads to increased cost pressure and a general urgency to transform the business. Many organizations are cleaning up their environment aiming at more efficient IT. However, those cost reduction initiatives alone do not address the overall need for IT to become more flexible. A new pattern is evolving that profoundly changes the way of business and IT transformation.
35
Clarity on Commodities Trading

36
Many organizations in the commodity trading industry are challenged with a complex and heterogeneous IT architecture and with a number of large “bigbang,” highcost and lowvalue IT projects. To reduce costs, application landscapes are harmonized, reducing redundant systems and moving towards central solutions. The scope of IT projects is reduced but budget overruns remain. Experience shows organizations can move to a more flexible and beneficial way of transforming their business through three key processes.
STRATEGY AND PLANNING – DON’T MAKE PLANS, EXPERIMENT ON IDEAS
Organizations are increasingly moving away from the traditional approach of detailed strategy and planning followed by one large transformation, towards a more flexible approach.
In this approach, the strategy clearly states the direction and focuses on the benefits to be achieved (“why”). This sets the scene for an ideation process, which identifies and prioritizes “what” exactly should be done. The best ideas are moved towards pilot stage, tested and, if the benefits are not there, discarded. This does not mean that the strategy is less important. It aims to instead reduce the effort and time of planning every detail before moving to the real transformation. As a result, steering can effectively be done on a quarterly rather than a yearly basis.
PORTFOLIO MANAGEMENT – ALLOW 25% OF YOUR PROJECTS TO FAIL
Some of the ideas planned in an agile organization will not make it to the final stage and will be canceled after piloting. Given the amount of project overruns and large projects that fail after years of implementation today, this is actually
TODAY
IT PROJECTS
TIME TO LIVE
SOLUTIONS
GOVERNANCE
PRINCIPLE
SOME, BIG
2 - 3 YEARS
BIG APPLICATIONS
CENTRALIZED (ONE SIZE FITS ALL)
BUY BEFORE BUILD
MANY, SMALL
2 - 3 MONTHS
SMALL APPLICATIONS
DECENTRALIZES(ONE PLATFORM FITS ALL)
FLEXIBILITY BEFORE EFFICIENCY
TOMORROW
good news. This way you are able to identify the real winners and move efforts in the right direction. It requires an environment, though, that effectively evaluates ideas and treats “failed” projects as a necessary step in an overall learning process.
ENTERPRISE ARCHITECTURE (EA) – BUILD SMALL TEAMS, ALIGNMENT WILL FOLLOW
Alignment of business and IT is one of the evergreens of the past with many challenges and many efforts to address them. Enterprise Architecture (EA) is one of the disciplines aiming to close this gap. Many organizations have put a lot of sweat and tears into establishing EA in their organization and only a few have realized real benefits. Looking at the technology side of EA, it is now time to really make IT as a service happen and realize many of the hypes we have seen in the past (serviceoriented architecture).
C H A P T E R I I E VO LV I N G T R E N D S
36

Clarity on Commodities Trading
37
Facing the business side of EA, the alignment of business and IT will be driven through establishing smaller teams. Those teams will make the plans (i.e. architect the enterprise) in close collaboration and there will naturally be a much smaller gap between them. This will increase competencies of EA in the business where it belonged all along.
LEAD THE CHANGE – FOUR KEY STEPS WE ENCOURAGE YOU TO TAKE
Successful organizations have managed to drive the conversation of agile transformation, engage the business stakeholders and communicate the change within the IT organization. Of the many different approaches, four key steps prevail:
Step 1 – the team: build an ATeam that understands the agile transformation
and covers (at least) the business strategy, business front office, digital technologies and software development.
Step 2 – the bigger picture: put the team in a room, align the objectives and direction and give them time to ideate.
Step 3 – the reality check: validate the ideas and assess the current capabilities of your IT to fulfill pilot candidates.
Step 4 – the pilot: push towards pilots (minimal viable products), using a greenfield approach, and test the results.
It is in the genes of commodity trading companies to deal with constant change, as markets are volatile and changes in trade flows, currencies and commodity prices can incur instantly. As changes are happening so quickly companies need to react fast. Commodity trading companies are very agile and have proven that they
TODAY
ENTERPRISE WIDE PLANNING ARCHITECTS PER LAYER:
PILOT-SPECIFIC TEAM COVERING ALL LAYERS:
TOMORROW
37
Clarity on Commodities Trading
can respond quickly. Strategies that move away from the traditional approach of detailed strategy and planning towards a more flexible approach are common in the commodity trading industry. From this perspective an IT strategy that is similarly agile would clearly make sense.
With increasing experience of small teams doing pilots and stronger involvement of the business, the shift from “big bang” IT projects to small and successful solutions might just become a reality.
Markus Steinbrecher, KPMG in Zurich
BUSINESS
APPLICATION
INFORMATION
TECHNOLOGY
BUSINESS
APPLICATION
INFORMATION
TECHNOLOGY

3838
C H A P T E R I I E VO LV I N G T R E N D S

Clarity on Commodities Trading
39
A NEW POLICY FOR AN AGE OF TRANSPARENCY
On 18 November 2014, Trafigura announced its new policy to support the Extractive Industries Transparency Initiative (EITI), the global standard for improving transparency of revenues from natural resources, and to disclose its payments for oil to governments that are members of the EITI. Through these decisions Trafigura took an important step towards improved trans-parency in the global commodity trade.
Clarity on Commodities Trading
39

4040
C H A P T E R I I E VO LV I N G T R E N D S
At the EITI Global Conference in Sydney, in May 2013, the EITI Board adopted the EITI Standard, a result of years of consultations and negotiations. The Standard took the EITI from being a relatively narrowly focused revenue transparency mechanism to a wider platform for reforms of natural resource management. The Standard requires that each country publish an annual EITI Report that contains, among other things, information about the legal and fiscal provisions relevant to extractives, organization of stateowned enterprises (SOEs), production, license allocations and registers. The Standard contains recommendations on contracts disclosure and a provision on the disclosure of oil sales by SOEs. The EITI Board may refine the Standard further to result in the approval of a common set of reporting guidelines applicable to both trading companies and SOEs.
THE EITI STANDARD

Clarity on Commodities Trading
41
section 1504 in the DoddFrank Act in the US and the EU Transparency Directive requiring that extractive companies with publicly listed shares and instruments report payments to governments, by project. The EITI considers there to be complementarity between these reporting requirements and the EITI. Having company data in stock exchanges in the US and Europe is welcome but needs to be complemented by the EITI bringing transparency to government data and engaging stakeholders in the producing countries themselves.
The EITI is increasingly becoming a forum where companies, civil society and governments meet to reach compromises that further a common agenda of transparency and accountability in the management of natural resources. With the increasing global focus on transparency in the trading of oil, gas and minerals, it is time for commodities trading companies to join this debate.
RESULTS OF TRANSPARENCY
While the EITI has been successful in bringing transparency to the extractive sector, one of the key challenges ahead is to ensure that the wealth of data generated by the EITI is understood, analyzed and used to encourage change and improvements in the extractive sector. Some early examples of how the EITI is being used to initiate reforms include:• In Chad, the government has estab
lished revenue recording and monitoring systems after EITI reports identified inadequate record keeping systems.
• In Ghana, closer scrutiny of royalties transferred by the central government to the local level has led the government to develop guidelines for the utilization of local revenue and to open separate bank accounts that facilitate revenue tracking.
• In Myanmar, the EITI has become a platform for conversations on needs for reforming stateowned enterprises and how to manage the revenues from oil and gas sustainably.
• In Mongolia, the EITI has helped harmonize and enforce auditing practices across government agencies contributing to strengthening public financial management.
• In Nigeria, the government is developing a new calculation model for royalty payments from oil after the EITI identified a US$ 2 billion underassessment.
MANDATORY DISCLOSURE
There have been extensive debates in recent years about mandatory disclosure requirements for oil, gas and mining companies in the US and Europe. This refers to legislation, particularly
The commodities trading industry plays an important role in feeding the global market with oil, gas, minerals and metals necessary for economic development. This much is widely appreciated. What is often less obvious is the key role these trading companies play in providing revenues to governments of re-source-rich countries. Acting often as an intermediary between export-ers and importers of crude oil, for example, an oil trading company transfers not only oil from one country to another, but also signifi-cant amounts of capital from the oil consumer to the oil producer.
Until recently, the proceeds from the sale of these resources went unnoticed and were not publicly recorded in most countries. Such secrecy breeds abuse, corruption, mismanagement, resentment and sometimes conflict. This is why a commitment to disclose payments to governments will be an important act of industry leadership by the trading sector. This is also the reason why the EITI is calling on trading companies to step up and join the global effort towards more transparent commodities trading. In this way, they will contribute in deepening stakeholders’ understanding of the cost of secrecy, and in furthering the debate towards more responsible disclosure.Bringing transparency to the interaction between trading companies and resourcerich governments is a necessary step if we are to ensure that citizens benefit from the resources that belong to them. A common set of comprehensive and practical reporting guidelines will ensure a level playing field for the trading industry and a response to the increasing global demands for reporting, transparency and, ultimately, accountability.
Jonas Moberg, Head of Secretariat, Extractive Industries Transparency Initiative (EITI).
Clarity on Commodities Trading
41

42
GEARED FOR CHANGE REGULATIONS TRENDS IMPACTING THE COMMODITY TRADING SECTOR
42
C H A P T E R I I E VO LV I N G T R E N D S

Clarity on Commodities Trading
43
Clarity on Commodities Trading
43
ON 19 NOVEMBER 2014, THE UNITED STATES SENATE’S PERMANENT SUB-COMMITTEE ON INVESTIGATIONS (PSI) PUBLISHED A NEARLY 400-PAGE-LONG REPORT ON WALL STREET BANKS AND THEIR INVOLVEMENT IN PHYSICAL COMMODITIES TRADING AND STORAGE ACTIVITIES. HOW DO SUCH REPORTS AFFECT REGULATORS?
While one can disagree about the facts and results as they are present-ed in this report, what cannot be de-nied is the fact that such reports and public hearings increase the pressure on regulators to come up with new regulations addressing risk manage-ment, behavior and conduct, mixing banking and commerce as well as safeguards in general. Some constit-uents could argue that existing and future regulations are mainly geared towards financial institutions. However, such a view would proba-bly be shortsighted and ignore the commodities sector’s dependencies on financial institutions to provide trade finance services along the value chain from preexport financing to
warehouse financing. Potential regu-lations could have a direct or indirect impact on the commodities sector. However, there is still some leeway if such challenges are addressed pro-spectively, leveraging existing frame-works. The commodity trading sector is well aware of the status of current discussions on regulation and trans-parency. However, the pace at which some of these changes occur has accelerated and should not be under-estimated. It has to be assumed that regulators have learnt their lesson from the recent financial crisis and are under pressure to respond. How could regulations have direct or indirect repercussions on commodity trading companies?

44
COMMODITY TRADING COMPANIES DIRECTLY OR INDIRECTLY AFFECTED BY KEY REGULATIONS
REGULATIONS DRIVEN BY SEVERAL INSTITUTIONS
Central banksBasel Committee ECBFEDBoE
Deleveraging of banks’ balance sheets• Maximum leverage ratios• Minimum target capital requirements• Minimum liquidity ratios• Credit valuation adjustments
Reduced access to financing• Less availability of letters of credits• Difficulty to raise syndicated and
structured loans• Increasing costs across all trade
finance products
Complexity and cost intensity of trading activities are increasing• Systems and processes given new
reporting requirements• Working capital requirements
(clearing fees, margin, collateral)• Increasing compliance requirements
(monitoring, investigations, compliance framework, AML, sanctions)
Changes due to banks’ exit/spin-off commodity trading• Less market making, reduced
hedging tools• Banks to spin off commodity trading
units and sell physical assets
Regulation of OTC derivatives• Central clearing and reporting• Capital and margin requirements• Reporting to central trade repository• Daily markettomarket/collateral
needs• Trading on organized trading venues• Position limits• Regulatory oversight/interventions
Regulation of European power and gas markets• Prohibits market abuse in the whole
sale market
Limits to banks’ trading activities• Ban of proprietary trading (financial,
physical)• Potential limits to banks ownership/
control of physical trading assets (e.g. storage)
Financial regulatory authoritiesSECFCAFINMABaFin
Policy makersEuropean UnionUnited States
REGULATORY CHANGES IMPACT ON COMMODITY TRADING COMPANIES
C H A P T E R I I E VO LV I N G T R E N D S
44

Clarity on Commodities Trading
45
balance sheet, market, credit and operational risk perspective but increasingly also from a reputational, conduct, legal and compliance risks perspective, which are harder to capture given their qualitative nature. A “wait and see” strategy may not be the right approach. Instead, it is a good idea to prospectively enhance and implement governance and control frameworks to address reputational, conduct, legal and compliance risks beside market, credit and operational risks early on. Annual testing should be considered in order to ensure operating effectiveness and to reassess the design of such governance and control frameworks. It is further recommended to actively manage transparency requirements by implementing selfregulatory measures that can be based on existing initiatives but should be further developed and geared towards the commodity trading sector. The ultimate aim of such counteraction is to not increase the pressure on governments and regulators to introduce more stringent laws and regulations beyond what is currently on the horizon.
including a provision dealing with minerals exported from the Democratic Republic of the Congo and neighboring countries.
MARKET CONDUCT, TRANSPARENCY AND CONSUMER PROTECTION (MIFID II AND REMIT)
REMIT, the Regulation on Energy Market Integrity and Transparency, an EU regulation influencing electricity and gas products, aims to reduce insider trading and market manipulation. Another EU regulation, MiFID II (Markets in Financial Instruments Directive 2), is mainly geared towards financial institutions providing investment services by for instance reducing exemptions, increasing the scope of products covered and tightening reporting requirements. MiFID II compliments other regulations such as REMIT and EMIR in the EU and could therefore have both direct and indirect impact on commodity traders. Switzerland has responded to these acts (EMIR and DoddFrank OTC Derivative regulations) by developing its own Swiss Financial Market Infrastructure Act (FinfraG).
WHAT NEXT?
The pace of new and potential regulation has increased, regardless of whether such new regulation impacts the commodity trading sector directly or indirectly. The pressure on regulators is higher than ever. Major stakeholders such as financial institutions are directly impacted by a wave of regulations. Specifically banks will have to consider the counterparties/clients they do business with, not only from a
CAPITAL AND LIQUIDITY REQUIREMENTS FOR FINANCIAL INSTITUTIONS (BASEL III AND IV)
Regulators are forcing banks to deleverage their balance sheets by increasing capital and liquidity requirements, which will impact the availability of financing. Even in countries where banks are currently able to use riskbased models to calculate capital requirements, developments in Basel IV suggest that the favorable impact on capital requirements from using riskbased models is likely to be limited going forward. Another trend that can be observed is the increased focus on leverage ratios rather than capital as leverage ratios are less vulnerable to underlying risk models and, as such, are supposed to provide a better comparison among financial institutions across different jurisdictions.
REGULATIONS COVERING OTC DERIVATIVES AND CONFLICT MINERALS (DODD-FRANK AND EMIR)
In the US, DoddFrank, and in particular Title VII, has increased regulations covering OTC derivatives with the ultimate aim to enhance transparency by introducing organized trading facilities, central clearing, central margin and central reporting, to name only a few cornerstones of the regulation. In the European Union, EMIR (the European Market Infrastructure Regulation) is the EU equivalent to Title VII in DoddFrank. While the objectives are more or less the same, there are differences in complexity and cost to comply with such regulations. Besides this, the DoddFrank Act goes further by including several “miscellaneous” provisions,
Clarity on Commodities Trading
45
Ralph Dicht, KPMG in Zurich

46
TAXING TIMES
C H A P T E R I I E VO LV I N G T R E N D S
46

Clarity on Commodities Trading
47
The tax framework has been playing a role when it comes to business location. In view of the recent developments at the level of the OECD (in particular on Base Erosion and Profit Shifting, short BEPS) it is worthwhile to take a look at what may be of particular concern for the commodity trading industry in the area of taxation.
Clarity on Commodities Trading
47
The G20OECD project on BEPS is an ambitious action plan encompassing 15 areas that are perceived to have the greatest potential for abuse by international companies. The goals of the plan are to identify concrete strategies for addressing tax base erosion
and taxpayer profit shifting. The OECD aims to provide governments with coordinated domestic and international instruments to prevent international companies from paying too little or no taxes.

48
Rewards that previously would have flowed contractually to riskbearing locations (i.e. for providing access to atrisk capital) may flow to key people functions postBEPS. The same is true for rewards flowing to assets. The OECD’s nearfinal guidance on transfer pricing for intangible assets downplays the value attributed to legal ownership of intangible property (e.g. trademarks, patents) and ensures value is attributed to the individuals managing particular assets.
This change is significant. For commodity trading companies, much of the substance that creates value lies in its people – its traders and the staff who set overall trading strategies, negotiate longterm supply or customer contracts, manage risk, and determine asset investments.
C H A P T E R I I E VO LV I N G T R E N D S
Looking ahead, traditional commodity trading structures may no longer be appropriate. For example, a centralized trading model – with a single central trading entity that provides trading support and financial capital and earns the majority of group profits, and a network of trading service providers in key locations earning relatively low returns – may no longer be straightforward under BEPS, especially where there are deemed to be key decision makers in the trading operations.
As many commodity traders rely on derivative and physical traders who often operate on a global basis across such locations as Switzerland, London, New York, Houston and Singapore, it is critical to review significant people functions against the creation of value across the entire group value chain.
48
ALIGNING VALUE CREATION WITH LOCATION OF PROFITS
The BEPS action plan seeks to address scenarios where multinational groups can unfairly reallocate profits between different tax jurisdictions. In particular, BEPS targets situations where risks and the resulting rewards are not aligned with valuecreating substance – by which the OECD means significant people functions. It also requires a review of overall value chain profitability in determining entitybased profitability. Of particular focus going forward will be aligning the value creation process – and specifically the location of key employees – with the location of profits.

Clarity on Commodities Trading
4949
Clarity on Commodities Trading
In summary, the current wave of international tax reform is creating uncertainty over the tax position of existing business structures. The G20OECD action plan on BEPS will create significant uncertainty in tax outcomes, which could lead to more tax disputes and threaten the effectiveness of existing commodity trading operating models. As we move into the new postBEPS world, tax executives of commodity trading companies should among others assess existing structures and consider whether they could defend them against substancebased challenges, monitor the impact of international tax changes on commodity trading operations in both OECD and nonOECD jurisdictions and consider advance pricing arrangements to reduce transfer pricing risk. As long as the commodity trading company’s business substance is real and welldocumented, its relatedparty pricing practices are sound and comprehensive tax compliance processes are followed, the centralized trading operation model would likely remain effective in a postBEPS world.
Stefan Kuhn, KPMG in Zurich
For many traders, comparison of the tax outcomes for existing business models in a pre and a postBEPS world may lead to very different results.
TAX TRANSPARENCY AND COUNTRY-BY-COUNTRY REPORTING
In light of perceptions that international companies are able to abuse the current system, in part due to the lack of information shared between tax authorities on a taxpayer’s global presence and profitability, the OECD and domestic governments are expected to insist on countrybycountry reporting in the near future in order to facilitate this sharing of information between tax authorities.
Under these proposals, international companies would have to disclose information such as revenue, profits, location of employees and assets, cash tax payable and flows of royalty, interest and other payments between jurisdictions. This will draw the focus to those jurisdictions that receive large payments and have transactions with highrisk (i.e. lowtax) jurisdictions.
Complying with these detailed reporting rules will be a substantial compliance burden. The rules will also likely lead to more questions and challenges from tax authorities as they seek to understand how the local share of the overall group reward was determined.
To read more on this topic, please consult our recent global report: Commodity trading companies – Meeting the challenge of tax and regulatory change.

50
• Banks moving out of commodity trading• Correlation between commodities
reducing after high correlation during super cycle
• Diversification will increase optionality
• National oil companies extend trading activities
• Refining margins in Europe structurally under pressure
• Pressure on prices due to new sources of supply
• Improved efficiency structurally lowers demand for transport fuels
• Increased access to resources due to technological developments
• Population and income growth key drivers behind growing demand
• Technological developments and behavioral changes will cause unpredictable shifts in markets
• Investments in infrastructure required tounlock new resources and markets
• Prices, technology and policies drivechanges in fuel mix
• Economies become less energyintensive relative to GDP
• Embedding of environmental costs in energy prices
• Carbon capture and storage (CCS) to offset carbon emissions
• Natural gas will gain market share• Convergence of natural gas prices globally• Shale gas production will expand in
other regions outside the US • Localized energy generation• Policy changes cause unpredictability
for renewables
50
CURRENT TRENDS
ENERGY
LONG-TERM TRENDS
C H A P T E R I I E VO LV I N G T R E N D S
SIGNIFICANT TRENDS AFFECTING COMMODITIES TRADING

Clarity on Commodities Trading
51
• Slowing growth in China• Urbanization continues• New supply arriving due to past
investments spurred by high prices• Reduction in capex of investments• Prices are approaching bottom of the cycle
• Real crop prices down from recent peaks but to stay on a higher plateau
• Production growing in developing countries• Price incentives for investment in
agriculture have increased• Unpredictability due to weather conditions• Investments in infrastructure needed• Changing consumption patterns
• Increasing reliance on recycling for supply of metals
• Change in application of materials will cause shift in demand
• Top suppliers high market share
• Technological developments will driveincrease in supply
• Politics continue to plan an important role in agricultural production
• Climate change may affect production• Africa increasingly seen as an
opportunity for investment
51
CURRENT TRENDS
AGRICULTURAL COMMODITIES
METALS
LONG-TERM TRENDS
Clarity on Commodities Trading
SIGNIFICANT TRENDS AFFECTING COMMODITIES TRADING

52
Trade flows
CHAPTER III
52
Clarity on Commodities Trading
53
China’s rapid industrial expansion has driven an extraordinary increase in its demand for all metal ores over the past decade (from USD 7.2 billion in 2003 to USD 148.8 billion in 2013 according to International Trade Center statistics). In the race to meet this demand, mining companies have responded by ramping up their production capabilities around the globe. At the same time, other BRIC and emerging economies enjoyed swift economic development, fueled in part by the growth in commodities demand. As they have done so, they have developed their own domestic need for commodity resources. Demand for metals has abated as Chinese economic growth has begun to slow. Early 2015 has seen Brazil and Russia facing recession, leading to a fall in demand for many resources relating to construction and industry. Such resources include iron ore for steel, aluminum, and energy resources to drive production. The ongoing sluggishness of economic recovery elsewhere, especially in Europe, has failed to help pick up the shortfall. Of the major economies, only the US (which has a considerable resource base) has shown real improvement. This situation has left many producers in a position of excess production, with oversupply of iron ore, copper, coal and aluminum, among many other commodities. As smaller miners and energy producers struggle in a lowprice environment, a sizeable rebalancing is presently underway, which is expected to lead to consolidation through a mix of mergers, shutdowns, and buyouts. This is combining with a drive by top mining groups such as Rio Tinto, BHP, Glencore and others to expand their market shares. The impacts on commodity flows are still working through the system. Global commodity supply and logistics chains have undergone substantial realignment over the past decade to feed China’s growth. While these chains will remain in place, they may cater more to those largest corporate players who can ensure their role as a key strategic supplier. The reversal of energy imports into the US over the past four to five years has meanwhile shifted flows of crude oil from countries such as Nigeria, which has had to find new markets (e.g. India). Elsewhere, the political situation in the Ukraine is affecting Russian gas exports to the benefit of Qatar, which has seen its LNG exports rise even further (a 5.4fold increase in volume between 2003 and 2013). In the soft commodities market, the main product impacted by these global trade trends is soybean, the export volume of which has almost doubled between 2004 and 2014. China now imports more than 60% of the world’s soybeans. Sugar has been impacted by an overcapacity in the processing/refining stage, with many Brazilian refineries operating at a loss. Abundant sugarcane supply has been influenced by the increasing capability of farmers across the globe to develop largescale sugar plantations. Developed economies, where sugar consumption is highest, have seen flattening import demand, with the UK dropping from first place in 2004 to seventh in 2013. China now ranks as the leading importer, increasing its intake by nearly four times between 2004 and 2013.
53

5454
Iron ore trade in 2014 Major trade flows (in million tons exported)
C H A P T E R I I I T R A D E F LOW S
Principal exporters of iron ore
CIS (Russia)Total: 22.9
8.6
6.6
2.3
2
1.8
1.6
SwedenTotal: 23.7
7
6.13
2.6
2.6
2.4
CanadaTotal: 40.2
106.3
4.7
4
2.7
12.5
Source: Trade Map, International Trade Statistics, International Trade Center (ITC).

Clarity on Commodities Trading
5555
Australia grew nearly twice as fast as the global export market in USD terms (15.4 x versus 8.4 x), and faster in volume terms, increasing market share from 27% to 48% from 2004 to 2013, leveraging its strategic position relative to China and other Asian markets.
Brazil maintained its second position, but saw production volumes flatten from 2011.
China increased its share of volume of global iron ore imports from 31% to over 65% from 2004 to 2014 (208 million tons to 933 million tons).
China
Japan
Republic of Korea
Chinese Taipei
Indonesia
Netherlands
Argentina
France
Slovakia
Turkey
Key iron ore export destinations
Clarity on Commodities Trading
United Kingdom
India
Hong Kong, China
Germany
Saudi Arabia
Finland
Poland
Czech Republic
Austria
Others
UkraineTotal: 40.8
19.5
5
4.9
4.6
3.4
3.4
BrazilTotal: 344.4
179.993.5
30.8
15.813.8 10.6
578.7
AustraliaTotal: 724.6
76.8
50.815.3 1.9 1.1
South AfricaTotal: 67.1
8.7
6.3
4.7
4.63.5
39.3

5656
C H A P T E R I I I T R A D E F LOW S
Copper trade flows evolution in the past ten yearsMain producers exporting to consumer markets (from 2004 to 2014 in 1,000 tons sold)
Copper is an increasingly fragmented production market; the top four exporters held 73% market share in USD terms in 2004, which has dropped to 61% in 2013.
Chile is the leading exporter of copper ore and concentrates (32% market share in USD terms in 2013), together with Peru (14%). Australia, Indonesia, and more recently Canada and the US combine to take another 25% of the market. The next seven exporting nations generate 19% market share.
333
326
507
448
271155
248
195
221
144
225
186
Indonesia
2004 Total: 1,805
2014Total: 1,454
32 11994 123
3 74
15 61
4 2213 24
Canada
2004 Total: 161
2014Total: 423
13 11037 287
0.8 4
5 17
0.3 52 10
US
2004 Total: 58.1
2014Total: 433
China
Japan
India
Republic of Korea
Brazil
Philippines
Mexico
Key copper export destinations
Spain
Chile
Canada
Germany
US
Others
Source: Trade Map, International Trade Statistics, International Trade Center (ITC).
Clarity on Commodities Trading
5757
686
2,597
339
3,111
533
1,241
171
1,293
148
462
188
754
Chile
2004 Total: 2,065
2014Total: 9,458
346491
216
1,107
54 94
454 266
77 10037 131
Australia
2004 Total: 1,184
2014Total: 2,189
273
494
585
1,983
398
831198
243
58
136
95
162
Peru
2004 Total: 1,607
2014Total: 3,849
Clarity on Commodities Trading

5858
C H A P T E R I I I T R A D E F LOW S
The top two soybean exporters, Brazil and the US, held 77% market share in 2013, in line with the 78% they held in 2004.
Soybean exports have increased by 3.7 times in value (1.8 x in volume) in that period, driven by demand from China.
In line with other commodities, China now imports over 60% of global soybean exports.
Soybean trade flows evolution in the past ten yearsTop three producers exporting to consumer markets (from 2004 to 2014 in 1,000 tons sold)
Others
Japan
Spain
Chinese Taipei
China
Indonesia
Egypt
Thailand
Netherlands
Germany
Turkey
Mexico
US
Bangladesh
France
Italy
Key soybean export destinations
Source: Trade Map, International Trade Statistics, International Trade Center (ITC).

Clarity on Commodities Trading
59
Clarity on Commodities Trading
59
166
149
957 706
4,342
6,156
229
503275
122
551
146
8621,062
6,601
1,5421,244
1,636
2,000
3,569 2,120
32,664
5,678
5,960
1,059
1,470
7,103
9,988
9,403
31,343
1,630
1,989
3,120 1,818
3,288
3,562
USBrazilArgentina
2004 Total: 25,603
2004 Total: 19,247
2004 Total: 6,520
2014Total: 50,170
2014Total: 45,691
2014Total: 7,782

6060
C H A P T E R I I I T R A D E F LOW S
Crude oil imports evolution in the past ten years for Europe, China and the United States
European countries monthly crude oil imports 2004 – 2014Million BBL per month
75
60
45
70
55
40
25
65
50
30
35
20
Jan 0
4
May
07
Sep 10
Sep 04
Jan 0
8
May
11
May
05
Sep 08
Jan 1
2
Sep 06
Jan 1
0
May
13
Sep 14
Jan 0
6
May
09
Sep 12
Jan 1
4
FranceGermanyItalyNetherlandsSpainUK
Source: The JODI (Joint Oil Data Initiative) Oil World Database

Clarity on Commodities Trading
6161
Clarity on Commodities Trading
Significant shifts in oil trade flows in the last five years have contributed to current lowpricing environment.
Major market shifts as US shale oil production has reduced reliance on imports, especially from West Africa, but also Venezuela.
Saudi Arabia’s increased production has added to a situation of oversupply, leading to dramatically lower prices per barrel.
Key decline in import volume for major European markets such as France and Italy.
Million BBL per month
600
500
400
300
200
100
Jan 0
4
Jan 0
8
Jan 0
6
Jan 1
0
Jan 1
3
Jan 0
5
Jan 0
9
Jan 1
2
Jan 0
7
Jan 1
1
Jan 1
4Ju
l 04
Jul 0
8Ju
l 06
Jul 1
0
Jul 1
3Ju
l 05
Jul 0
9Ju
l 12
Jul 0
7Ju
l 11
Jul 1
4
US monthly crude oil imports, production, refinery intake 2004 – 2014
Refinery IntakeImportsProduction

6262
C H A P T E R I I I T R A D E F LOW S
350
300
250
200
150
100
50
China monthly crude oil imports, production, refinery intake 2004 – 2014Million BBL per month
Jan 0
4
Jan 0
8
Jan 0
6
Jan 1
0
Jan 1
3
Jan 0
5
Jan 0
9
Jan 1
2
Jan 0
7
Jan 1
1
Jan 1
4Ju
l 04
Jul 0
8Ju
l 06
Jul 1
0Ju
l 13
Jul 0
5Ju
l 09
Jul 1
2Ju
l 07
Jul 1
1Ju
l 14
Refinery IntakeImportsProduction
Crude oil imports evolution in the past ten years for Europe, China and the United States
China has increased its share of global oil imports from 5% in 2004 to 13% in 2013, while the US has maintained its position as top importer with 16% in 2013, down from 26% in 2004.
China’s oil import strategy has prioritized a balanced portfolio of supplying nations, which benefits the role of major oil traders.

Clarity on Commodities Trading
6363
Clarity on Commodities Trading
China’s crude oil imports by source 2013
19%
14%
9%
9% 8%
8%
6%
4%
4%
3%
2%
2%
12%
Saudi Arabia
Angola
Russia
Iran
Oman
Iraq
Venezuela
Kazakhstan
UAE
Kuwait
Congo
Brazil
Others
China’s total crude oil imports for 20132.26 billion barrels
Source: EIA, FACTS Global Energy, ITX, The Handbook of Global Energy Policy
64
Evolving Markets, Sustainable ResultsCommodity trading companies Meeting the challenge of tax and regulatory change
Latest issues
Mining Update: Issue 3
No paper chase: Transforming risk management
Mining: From volume to value
Global Energy Institutekpmg.com/energy
Global Mining Institutekpmg.com/mining
KPMG Global Mining and Global Energy InstitutesThese institutes are international knowledgesharing platforms that will provide you with valuable industry research, and insights on current issues and trends.
Global publications and industry insights
P I N B OA R D
Market Update: Oil & Gas

Articles may only be republished by written permission of the publisher and quoting the source “KPMG’s Clarity on Commodities Trading.”
The information contained herein is of a general nature and is not intended to address the circumstances of any particular individual or entity. Although we endeavor to provide accurate and timely information, there can be no guarantee that such information is accurate as of the date it is received or that it will continue to be accurate in the future. No one should act on such information without appropriate professional advice after a thorough examination of the particular situation. © 2015 KPMG Holding AG/SA, a Swiss corporation, is a member of the KPMG network of independent firms affiliated with KPMG International Cooperative (“KPMG International”), a Swiss legal entity. All rights reserved. Printed in Switzerland. The KPMG name and logo are registered trademarks.
C O N TAC T S & I M P R I N T
For further information on Commodities Trading, please contact:
Richard SharmanHead of Commodities TradingKPMG United KingdomPhone +44 7990 [email protected]
Reijer BarendregtAuditKPMG SwitzerlandPhone +41 79 781 80 [email protected]
James CarterDeal AdvisoryKPMG SwitzerlandPhone +41 79 504 25 [email protected]
Bryan DeBlancDeal AdvisoryKPMG SwitzerlandPhone +41 79 409 40 [email protected]
Ralph DichtRegulatory & Risk ManagementKPMG SwitzerlandPhone +41 79 697 52 [email protected]
Luke EllyardFinancial ServicesKPMG Lower Gulf Phone +97 [email protected]
Stefan KuhnCorporate TaxKPMG SwitzerlandPhone +41 79 438 88 [email protected]
James MaycockRegulatory & Risk ManagementKPMG United KingdomPhone +44 7795 [email protected]
Brian O’NealRisk ConsultingKPMG United StatesPhone +1 832 725 [email protected]
Hak Bin PekEnergy and Natural ResourcesKPMG SingaporePhone +65 [email protected]
Paul RieveleyLead Partner, AuditKPMG SwitzerlandPhone +41 79 540 44 [email protected]
Esther RoeterBusiness DevelopmentKPMG SwitzerlandPhone +41 79 632 36 [email protected]
Markus SteinbrecherIT AdvisoryKPMG SwitzerlandPhone +41 79 136 98 [email protected]
PublisherKPMG AGBadenerstrasse 172P.O. Box 1872CH8026 Zurich
Phone +41 58 249 31 31Fax +41 58 249 44 [email protected]
Concept and editingMareva Freites Lecerf,Reijer Barendregt & James Carter,KPMG AG
DesignSalma AlKhadra &Geertjan van Beusekom,van Beusekom design & brand solutions
Illustrations and graphicsSalma AlKhadra
Pictures[Cover] Getty Images[Editorial] Daniel Hager[Inside pages] Getty Images
PrintGfK, Hergiswil
Clarity on Commodities Trading