
CLARITY and Beyond: Tools for Integrated Brain Mapping
10
Institute of Medical Engineering and Science Department of Chemical Engineering Picower Institute for Learning and Memory Massachusetts Institute of Technology Cambridge, Massachusetts CLARITY and Beyond: Tools for Integrated Brain Mapping Kwanghun Chung, PhD © 2014 Chung
Transcript of CLARITY and Beyond: Tools for Integrated Brain Mapping

© 2014
Institute of Medical Engineering and ScienceDepartment of Chemical Engineering
Picower Institute for Learning and MemoryMassachusetts Institute of Technology
Cambridge, Massachusetts
CLARITY and Beyond: Tools for Integrated Brain Mapping
Kwanghun Chung, PhD
© 2014 Chung


© 2014 Chung
27
IntroductionA major challenge in biology remains obtaining detailed high-resolution information from a complex system while maintaining the global perspective needed to understand system function. Here we address this challenge using the CLARITY method for efficient transformation of intact tissue into a nanoporous hydrogel-hybridized form (cross-linked to a three-dimensional [3D] network of hydrophilic polymer chains) that is fully assembled but optically transparent and macromolecule-permeable. We demonstrate transformation of rodent brains using this method, which enables intact-tissue imaging of many elements: long-range circuit projections, local circuit wiring, cellular relationships, subcellular structures, protein complexes, nucleic acids, and neurotransmitters. We also show how CLARITY is compatible with both immunocytochemistry and in situ hybridization in nonsectioned tissue, enabling the delivery and retrieval of exogenous macromolecules throughout the intact mouse brain for molecular phenotyping and allowing sequential rounds of staining and destaining. Finally, we demonstrate that CLARITY enables fine-structural analysis of clinical samples, including nonsectioned human tissue banked for years in formalin from a psychiatric disease clinical setting. These capabilites open the door to transmuting human tissue into a physically stable, intact form suitable for probing the structural and molecular underpinnings of physiological function and disease.
Extracting detailed structural and molecular information from intact biological systems has long been a fundamental challenge across fields of investigation and has spurred considerable technological innovation (Denk et al., 1990; Helmchen and Denk, 2005; Dodt et al., 2007; Livet et al., 2007; Micheva and Smith, 2007; Li et al., 2010; Susaki et al., 2014). In particular, the study of brain structure–function relationships may benefit from intact-system tools (Kasthrui and Lichtman, 2007; Defelipe, 2010); in general, much valuable information on intrasystem relationships and joint statistics will become accessible from undertaking the full structural analysis of intact systems rather than piecemeal reconstruction across preparations. Yet even tissue structure in itself provides only a certain level of insight without detailed molecular phenotyping, which is difficult to achieve within intact tissue.
We have set the goal of rapidly transforming intact tissue into an optically transparent and macromolecule-permeable construct while preserving
native molecular information and structure. We took note of the fact that packed lipid bilayers are implicated in rendering tissue poorly accessible both to molecular probes and to photons; these bilayers simultaneously create diffusion-barrier properties relevant to chemical penetration and light-scattering properties at the lipid-aqueous interface. Thus, we reasoned that if lipid bilayers could be removed nondestructively, light and macromolecules might penetrate deep into tissue, allowing 3D imaging and immunohistological analysis without disassembly. However, removing lipid membranes that provide structural integrity and retain biomolecules would inevitably damage tissue with profound loss of cellular and molecular information. Therefore, first providing a physical framework would be required to physically support the tissue and secure biological information.
Hydrogel–Electrophoretic Tissue TransmutationWe began providing a physical framework for the tissue by infusing hydrogel monomers (here, acrylamide and bisacrylamide), formaldehyde, and thermal initiators into tissue at 4°C (Fig. 1). In this step, formaldehyde not only cross-links the tissue but also covalently links the hydrogel monomers to biomolecules, including proteins, nucleic acids, and small molecules. Next, polymerization of the biomolecule-conjugated monomers into a hydrogel mesh is thermally initiated by incubating infused tissue at 37°C for 3 h, at which point tissue and hydrogel become a hybrid construct. This hydrogel–tissue hybridization physically supports tissue structure and chemically incorporates biomolecules into the hydrogel mesh. Importantly, lipids and biomolecules lacking functional groups for conjugation remain unbound and therefore can be removed from the hybrid. To efficiently extract lipids, we developed an active-transport organ electrophoresis approach, which we termed ETC (electrophoretic tissue clearing), capitalizing on the highly charged nature of ionic micelles. This method expedites lipid extraction by orders of magnitude.
Whole Adult Mouse Brain ImagingTo test anticipated features of the technology, we used CLARITY to process the brain of a 3-month-old Thy1-EYFP line-H mouse, in which the cytosolic fluorescent protein enhanced yellow fluorescent protein (EYFP) is expressed in projection neurons (Feng et al., 2000). Within 8 d, the intact adult brain was transmuted into a lipid-extracted and structurally stable hydrogel–tissue hybrid. Scattering still occurs owing to heterogeneously distributed protein/nucleic acid complexes in the hybrid. However,
CLARITY and Beyond: Tools for Integrated Brain Mapping

© 2014 Chung
28
NOTES
Figure 1. CLARITY. Tissue is cross-linked with formaldehyde (red) in the presence of hydrogel monomers (blue), covalently linking tissue elements to monomers, which are then polymerized into a hydrogel mesh. Electric fields applied across the sample in ionic detergent actively transport micelles into (and lipids out of) the tissue, leaving fine structure and cross-linked biomolecules in place. Bottom left boxed region, ETC chamber. Reprinted with permission from Chung et al. (2013), their Fig. 1.

© 2014 Chung
29
after immersion in refractive index (RI)–specified solutions matching the CLARITY hybrid (e.g., 85% glycerol or FocusClear, both RI ~1.45), the intact brain becomes uniformly transparent (Figs. 2a–c).
Imaging depth in clarified tissue appeared to be limited only by working distance (WD) of the objective (here 3.6 mm, though 8 mm WD/0.9 NA objectives are available). Therefore, to image the 5- to 6-mm-thick
adult mouse brain, we next imaged the dorsal half of the brain followed by inversion and imaging of the ventral half (Fig. 2d, e). Figure 2f shows a volume of unsectioned mouse brain with visualization through cortex, hippocampus, alveus, and thalamus (Fig. 2g–l). We observed that tissue expanded slightly with ETC and returned to original size after RI matching. This transient change did not cause net tissue deformation, and fine structural details such as membrane-localized
CLARITY and Beyond: Tools for Integrated Brain Mapping
Figure 2. Intact adult mouse brain imaging. a–d, Whole mouse brains (3 months old): a, before CLARITY (quote from Ramón Y Cajal, 1904); b, after CLARITY. Thy1–eYFP line-H mouse brain after hydrogel–tissue hybridization, ETC, and refractive-index matching. c, Fluorescence image of brain in b. d, Dorsal aspect is imaged using single-photon (1p) microscopy, then the brain is inverted and ventral aspect imaged. e, 3D rendering of clarified mouse brain. Left, dorsal half; Right, ventral half. Scale bar, 1 mm. f, Nonsectioned mouse brain tissue showing cortex, hippocampus, and thalamus. Scale bar, 400 μm. (g–l). Optical sections from f showing negligible resolution loss even at ~3400 µm depth. g, h, z = 446 µm; i, j, z = 1683 µm; k, l, z = 3384 µm. h, j, and l, Boxed regions in g, i, and k. Scale bars, 100 μm. m, Cross-section of axons in clarified striatum of Thy1-ChR2-EYFP line: membrane-localized ChR2-EYFP. Scale bar, 5 μm. n, Dendrites and spines of neurons in clarified Thy1-EYFP line-H cortex. Scale bar, 5 μm. Reprinted with permission from Chung et al. (2013), their Fig. 2.

© 2014 Chung
30
NOTES
Figure 3. Molecular phenotyping in intact tissue. a, Protein loss percentages in clarified mouse brain compared with conventional methods; n = 4 for each condition. b, Rendering of 1-mm-thick, nonsectioned coronal block of Thy1-EYFP mouse immunostained for GFP. Scale bar, 500 μm. c, 3D rendering of boxed region in cortex in b shows EYFP fluorescence (left) and anti-GFP staining (right). d, Left, Colocalization of GFP staining. Right, Optical sections at different depths in 3D rendering. Scale bar, 100 μm. e–f, 500-µm-thick block of line-H brain immunostained for synapsin-I (red)/PSD-95 (blue) for 3 d. e, Left, Optical sections. Right, enlarged images of boxed regions on left. Individual synaptic puncta resolved throughout depth. EYFP: white. f, Average immunofluorescence cross-section of PSD-95 puncta. g, Full width at half maximum (FWHM) of average immunofluorescence cross-section of PSD-95 puncta versus depth. Insets: average puncta at z = 20 µm, z = 200 µm. h, Staining in hippocampus. Left, GABA; middle, PV; right, overlay. Scale bar, 20 μm. i, In situ hybridization in clarified 500 µm mouse brain block showing dopamine receptor D2 (Drd2) mRNA in striatum. LV, lateral ventricle. Blue, DAPI. Scale bars: Left, 100 μm; Right, 20 μm. j, k, Axonal fibers of TH-positive neurons in NAc and CPu. j, 3D rendering of 1-mm-thick clarified mouse brain block stained for TH (red) and DAPI (green). aca, anterior commissure. Scale bar, 500 µm. k, Maximum projection, NAc/aca volume in j. Scale bar, 50 μm. Reprinted with permission from Chung et al. (2013), their Fig. 3.

© 2014 Chung
31
proteins (Fig. 2m), dendritic spines (Fig. 2n), and synaptic puncta (Fig. 3e–g) remained securely in place.
Molecular Phenotyping of Intact Tissue VolumesInterrogating molecular features at subcellular resolution in an intact brain with known global wiring properties may be of value; however, conventional labeling techniques involve (1) loss of native molecules after permeabilization required for access to intracellular targets, (2) time-intensive thin sectioning and reconstruction, or (3) when multiple rounds of labeling are attempted, damage due to harsh probe removal processes. We hypothesized that CLARITY could overcome these three major difficulties by enabling intact-tissue and multiple-round molecular phenotyping.
First, CLARITY may preserve native antigens with unusual completeness owing to the hydrogel-hybridization process. To quantify molecular preservation associated with tissue–hydrogel fusion, we compared protein loss in clarified mouse brain to loss from conventional methods (Fig. 3a). Of total protein, ~65% was solubilized (lost) when conventionally PFA-fixed tissue blocks were cleared by 4% SDS for one week. Scale, a tissue-clearing method using 4M urea, allowed ~41% protein loss over the same interval. Even PFA-fixed tissue treated only with 0.1% Triton X-100/PBS, a mild detergent–based permeabilization buffer used in conventional histology, allowed significant loss of ~24% protein. However, when hydrogel-hybridized tissue was cleared with the stringent 4% SDS solution of CLARITY, only ~8% protein loss was seen, indicating that chemical tethering of biomolecules into hydrogel mesh can enhance the preservation of molecular components.
Second, we found that CLARITY, which increases tissue permeability by replacing lipid bilayers with nanoporous hydrogel, enables rapid diffusion of molecular probes deep into intact tissue, and thereby allows access to preserved biomolecules without sectioning. In a 1-mm-thick clarified coronal block of mouse brain, uniformly antibody-stained over 3 d (Fig. 3b), quantitative colocalization analysis revealed that EYFP fluorescence and anti–green fluorescent protein (GFP) staining overlapped throughout the block (Figs. 3c, d).
Third, CLARITY was found to enable multiround molecular phenotyping (Fig. 4); the stable framework allowed effective removal of antibodies without fine-structural damage or degraded antigenicity. We performed three consecutive rounds of staining in
1-mm-thick coronal blocks from a Thy1-EYFP H-line mouse brain, observing effective antibody removal and preserved EYFP-positive neuronal morphology as well as restaining capability. Although extensive validation would be required to fully map the extent to which CLARITY secures molecular information, this result demonstrates that elution largely preserves integrity of tissue structure, cellular architecture, fluorescence signals (Figs. 3d–f), and diamino-phenyl-indol (DAPI) DNA staining (Fig. 3g). Moreover, repeated TH staining in the first and third rounds revealed identical staining patterns and signal intensity, confirming that antigenicity is retained throughout multiple rounds of staining/elution. To investigate axonal projections of the tyrosine hydroxylase (TH) neurons further, we clarified 1-mm-thick coronal blocks of mouse brain that were stained and imaged using tyrosine hydroxylase. As shown in Figures 3j and k, projections of tyrosine hydroxylase–positive fibers were readily visualized in the neocortex, nucleus accumbens, caudate putamen, and amygdala. We also found that the CLARITY hydrogel-conjugation process preserves small molecules, such as the neurotransmitter GABA (Fig. 3h).
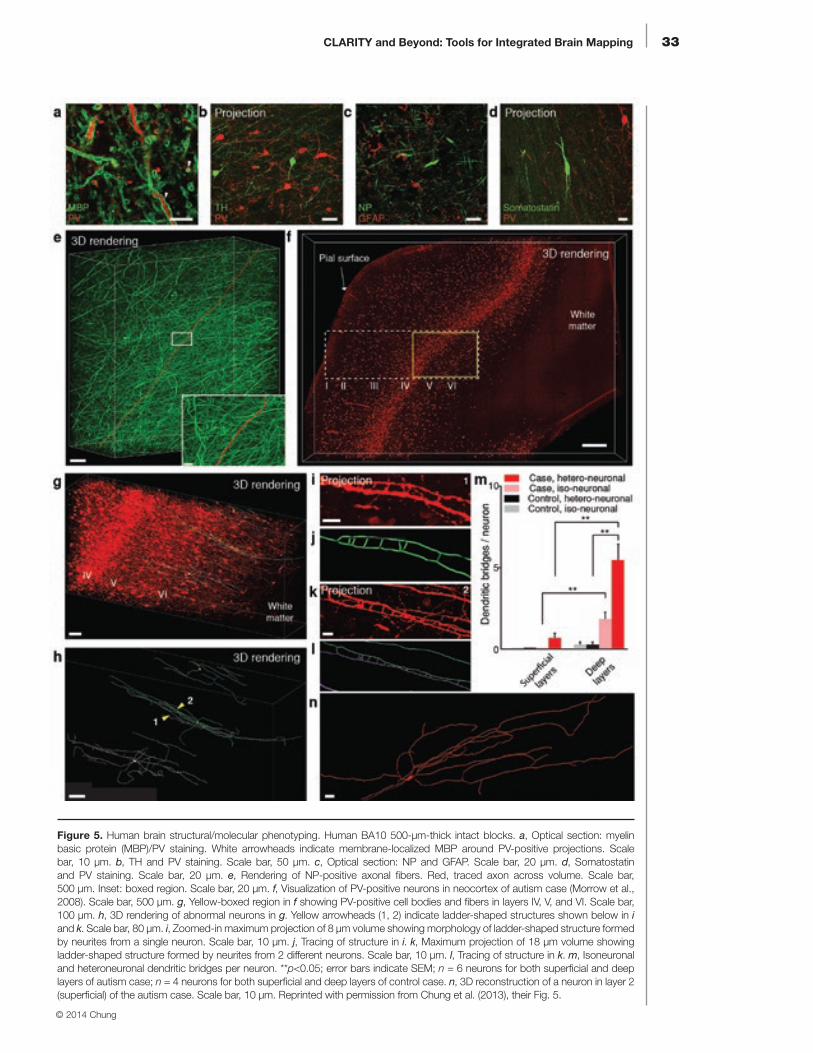
Human Tissue Imaging and Molecular PhenotypingWe found that CLARITY functioned in long-banked human brain, enabling immunohistological visualization and identification of neurons and projections over large volumes (Figs. 5a–g). In 0.5-mm-thick blocks of frontal lobe from an autistic patient, stored in formalin for >6 years, we were able to stain for axons with neurofilament protein (NP) and myelin basic protein (MBP) and to trace individual fibers (Fig. 5e). In addition, by staining for parvalbumin (PV), we could visualize the distribution of PV-positive interneurons in neocortex over large volumes (6.7 × 4.7 × 0.5 mm) and trace individual PV-labeled processes (Figs. 5g–n).
Unlike mechanical sectioning methods, which may involve deformation of tissue and uncertainty in registration across sections, CLARITY preserves continuity of structure, which not only allows tracing of neurites over distances but also provides a class of distinct information about the morphology of traced neurons. As one example, we found that many PV-positive interneurons in this human sample, selectively in deep layers, displayed isoneuronal and heteroneuronal dendritic bridges (Figs. 5g–m). These ladder-like connections (not typical of control brain) instead resemble abnormalities observed with mutations in the Down syndrome cell-adhesion molecule (Dscam) protein or protocadherins
CLARITY and Beyond: Tools for Integrated Brain Mapping

© 2014 Chung
32
(Pcdhs); mutations in the latter family are associated with autism-spectrum disorder (Morrow et al., 2008). Although extensive work would be required to define the incidence and implications of abnormal PV neurons, the observation illustrates the structural and molecular capability that clarified tissue provides by virtue of volumetric continuity, which may help shed light on the structural underpinnings of neuropsychiatric disease (de Anda et al., 2012).
DiscussionUsing this hydrogel–tissue fusion and ETC technology, intact tissue can be rapidly transformed into optically and chemically accessible form while retaining structural and molecular information, thereby enabling the imaging of entire adult vertebrate brains as well as multiple-round molecular phenotyping without thin sectioning. CLARITY-optimized long-WD objectives will improve imaging
NOTES
Figure 4. Multiround molecular phenotyping of intact tissue. a, First round. Volume rendering of 1-mm-thick block of Thy1-EYFP mouse immunostained for TH in nonsectioned form. Scale bar, 500 μm. b, Antibodies eluted from block in a. c, Second round. 3D rendering of same block now immunostained for PV (red)/GFAP (blue)/DAPI (white). d–f, Maximum projections of 100 µm volume of yellow-boxed region in a, b, and c, respectively. Scale bar, 100 μm. g, Optical section of white/dotted-box region in c showing DAPI. CA, cornu ammonis; DG, dentate gyrus. Scale bar, 100 μm. h–i, TH channel of white-box region in a (h) and j (i). TH antige-nicity preserved through multiple elutions. Scale bar, 100 μm. j, Third round. Block in a–c immunostained for TH (red) and choline acetyltransferase (ChAT) (blue). k, 3D view of hippocampus in c showing EYFP-expressing neurons (green)/PV-positive neurons (red)/GFAP (blue). Scale bar, 200 μm. Alv, alveus. Reprinted with permission from Chung et al. (2013), their Fig. 4.
© 2014 Chung
33CLARITY and Beyond: Tools for Integrated Brain Mapping
Figure 5. Human brain structural/molecular phenotyping. Human BA10 500-µm-thick intact blocks. a, Optical section: myelin basic protein (MBP)/PV staining. White arrowheads indicate membrane-localized MBP around PV-positive projections. Scale bar, 10 μm. b, TH and PV staining. Scale bar, 50 μm. c, Optical section: NP and GFAP. Scale bar, 20 μm. d, Somatostatin and PV staining. Scale bar, 20 μm. e, Rendering of NP-positive axonal fibers. Red, traced axon across volume. Scale bar, 500 μm. Inset: boxed region. Scale bar, 20 μm. f, Visualization of PV-positive neurons in neocortex of autism case (Morrow et al., 2008). Scale bar, 500 μm. g, Yellow-boxed region in f showing PV-positive cell bodies and fibers in layers IV, V, and VI. Scale bar, 100 μm. h, 3D rendering of abnormal neurons in g. Yellow arrowheads (1, 2) indicate ladder-shaped structures shown below in i and k. Scale bar, 80 μm. i, Zoomed-in maximum projection of 8 µm volume showing morphology of ladder-shaped structure formed by neurites from a single neuron. Scale bar, 10 μm. j, Tracing of structure in i. k, Maximum projection of 18 µm volume showing ladder-shaped structure formed by neurites from 2 different neurons. Scale bar, 10 μm. l, Tracing of structure in k. m, Isoneuronal and heteroneuronal dendritic bridges per neuron. **p<0.05; error bars indicate SEM; n = 6 neurons for both superficial and deep layers of autism case; n = 4 neurons for both superficial and deep layers of control case. n, 3D reconstruction of a neuron in layer 2 (superficial) of the autism case. Scale bar, 10 μm. Reprinted with permission from Chung et al. (2013), their Fig. 5.

34
NOTES depth and resolution, further enhancing the acquisition of integrated structural and molecular information from intact systems.
Turning immense datasets into useful insights remains a key challenge. Computational approaches to image segmentation, 3D registration, and automated tracing require further development. Although much remains to be refined, new approaches to intact-systems biology may dovetail with existing optogenetic-control or activity-imaging methods. Moreover, efficient molecular phenotyping (as with c-Fos) may help map populations with altered activity downstream of the directly modulated population, across the same intact brain. Together with its capability for intersectional definition of cells via sequential rounds of labeling, and broad application domain (including mouse, zebrafish, and human), these data suggest that CLARITY provides access to structural and molecular information that may help support a newly integrative understanding of large-scale intact biological systems.
AcknowledgmentsThis chapter was adapted and excerpted from a previously published article: Chung et al. (2013), Structural and molecular interrogation of intact biological systems, Nature 497:332–337.
ReferencesChung K, Wallace J, Kim SY, Kalyanasundaram S,
Andalman AS, Davidson TJ, Mirzabekov JJ, Zalocusky KA, Mattis J, Denisin AK, Pak S, Bernstein H, Ramakrishnan C, Grosenick L, Gradinaru V, Deisseroth K (2013) Structural and molecular interrogation of intact biological systems. Nature 497:332–337.
de Anda FC, Rosario AL, Durak O, Tran T, Graff J, Meletis K, Rei D, Soda T, Madabhushi R, Ginty DD, Kolodkin AL, Tsai LH (2012) Autism spectrum disorder susceptibility gene TAOK2 affects basal dendrite formation in the neocortex. Nat Neurosci 15:1022–1031.
DeFelipe J (2010) From the connectome to the synaptome: an epic love story. Science 330:1198–1201.
Denk W, Strickler JH, Webb WW (1990) Two-photon laser scanning fluorescence microscopy. Science 248:73–76.
Dodt H, Leischner U, Schierloh A (2007) Ultramicroscopy: three-dimensional visualization of neuronal networks in the whole mouse brain. Nat Methods 4:331–336.
Feng G, Mellor RH, Bernstein M, Keller-Peck C, Nguyen QT, Wallace M, Nerbonne JM, Lichtman JW, Sanes JR (2000) Imaging neuronal subsets in transgenic mice expressing multiple spectral variants of GFP. Neuron 28:41–51.
Helmchen F, Denk W (2005) Deep tissue two-photon microscopy. Nat Methods 2:932–940.
Kasthuri N, Lichtman JW (2007) The rise of the “projectome.” Nat Methods 4:307–308.
Li A, Gong H, Zhang B, Wang Q, Yan C, Wu J, Liu Q, Zeng S, Luo Q (2010) Micro-optical sectioning tomography to obtain a high-resolution atlas of the mouse brain. Science 330:1404–1408.
Livet J, Weissman TA, Kang H, Draft RW, Lu J, Bennis RA, Sanes JR, Lichtman JW (2007) Transgenic strategies for combinatorial expression of fluorescent proteins in the nervous system. Nature 450:56–62.
Micheva KD, Smith SJ (2007) Array tomography: a new tool for imaging the molecular architecture and ultrastructure of neural circuits. Neuron 55:25–36.
Morrow EM, Yoo SY, Flavell SW, Kim TK, Lin Y, Hill RS, Mukaddes NM, Balkhy S, Gascon G, Hashmi A, Al-Saad S, Ware J, Joseph RM, Greenblatt R, Gleason D, Ertelt JA, Apse KA, Bodell A, Partlow JN, Barry B, et al. (2008) Identifying autism loci and genes by tracing recent shared ancestry. Science 321:218–23.
Ramón Y Cajal S (1904) Textura del sistema nervioso del hombre y de los vertebrados. Vol 2. Nicholas Moya.
Susaki EA, Tainaka K, Perrin D, Kishino F, Tawara T, Watanabe TM, Yokoyama C, Onoe H, Eguchi M, Yamaguchi S, Abe T, Kiyonari H, Shimizu Y, Miyawaki A, Yokota H, Ueda HR (2014) Whole-brain imaging with single-cell resolution using chemical cocktails and computational analysis. Cell 157:726–739.
© 2014 Chung