Clara Rodriguez - Changing Race - Latinos, The Census and the History of Ethnicity (Critical America...
282
Transcript of Clara Rodriguez - Changing Race - Latinos, The Census and the History of Ethnicity (Critical America...

CHANGING RACE
CRITICAL AMERICA
Richard Delgado and Jean StefancicGeneral Editors
White by Law: The Legal Construction of RaceIan F. Haney López
Cultivating Intelligence: Power, Law, and the Politics of TeachingLouise Harmon and Deborah W. Post
Privilege Revealed: How Invisible Preference Undermines AmericaStephanie M. Wildman with Margalynne Armstrong,Adrienne D. Davis, and Trina Grillo
Does the Law Morally Bind the Poor? or What Good’s the ConstitutionWhen You Can’t Afford a Loaf of Bread?
R. George Wright
Hybrid: Bisexuals, Multiracials, and Other Misfits underAmerican Law
Ruth Colker
Critical Race Feminism: A ReaderEdited by Adrien Katherine Wing
Immigrants Out! The New Nativism and the Anti-ImmigrantImpulse in the United States
Edited by Juan F. Perea
Taxing AmericaEdited by Karen B. Brown and Mary Louise Fellows
Notes of a Racial Caste Baby: Color Blindness and the End ofAffirmative Action
Bryan K. Fair
Please Don’t Wish Me a Merry Christmas: A Critical History ofthe Separation of Church and State
Stephen M. Feldman
To Be an American: Cultural Pluralism and the Rhetoricof Assimilation
Bill Ong Hing
Negrophobia and Reasonable Racism: The Hidden Costs of BeingBlack in America
Jody David Armour
Black and Brown in America: The Case for CooperationBill Piatt
Black Rage Confronts the LawPaul Harris
Selling Words: Free Speech in a Commercial CultureR. George Wright
The Color of Crime: Racial Hoaxes, White Fear, Black Protectionism,Police Harassment, and Other Macroaggressions
Katheryn K. Russell
The Smart Culture: Society, Intelligence, and LawRobert L. Hayman, Jr.
Was Blind, But Now I See: White Race Consciousnessand the Law
Barbara J. Flagg
The Gender Line: Men, Women, and the LawNancy Levit
Heretics in the Temple: Americans Who Reject the Nation’sLegal Faith
David Ray Papke
The Empire Strikes Back: Outsiders and the Struggle overLegal Education
Arthur Austin
Interracial Justice: Conflict and Reconciliation inPost–Civil Rights America
Eric K. Yamamoto
Black Men on Race, Gender, and Sexuality: A Critical ReaderEdited by Devon W. Carbado
When Sorry Isn’t Enough: The Controversy over Apologies andReparations for Human Injustice
Edited by Roy L. Brooks
Disoriented: Asian Americans, Law, and the Nation StateRobert S. Chang
Rape and the Culture of the CourtroomAndrew E. Taslitz
The Passions of LawEdited by Susan A. Bandes
Global Critical Race Feminism: An International ReaderEdited by Adrien Katherine Wing
Law and Religion: Critical EssaysEdited by Stephen M. Feldman
Changing Race: Latinos, the Census, and the History ofEthnicity in the United States
Clara E. Rodríguez

C L A R A E . RO D R Í G U E Z
CHANGING RACELatinos, the Census, and the History ofEthnicity in the United States
aNew York University Press • New York and London

NEW YORK UNIVERSITY PRESSNew York and London
© 2000 by Clara E. RodríguezAll rights reserved
Library of Congress Cataloging-in-Publication DataRodríguez, Clara E., 1944–Changing race : Latinos, the census, and the history of ethnicity /Clara E. Rodríguez.p. cm. — (Critical America)Includes bibliographical references and index.ISBN 0-8147-7547-0 (pbk. : alk. paper) — ISBN 0-8147-7546-2 (cloth : alk. paper)1. Hispanic Americans—Census. 2. Hispanic Americans—Race identity.3. Hispanic Americans—Ethnic identity. 4. Categorization (Psychology).5. Race—Social aspects—United States. 6. Ethnology—United States.7. United States—Census. 8. United States—Race relations. I. Title. II. Series.E184.S75 R64 2000305.8'00973—dc21 00-008629
New York University Press books are printed on acid-free paper,and their binding materials are chosen for strength and durability.
Manufactured in the United States of America
10 9 8 7 6 5 4 3 2 1
Contents
Introduction ixAcknowledgments xv
I The Fluidity of Race
1 Latinos in the U.S. Race Structure 3
2 The Idea of Race 27
3 Stories of Self-Definition 47
II Historical Constructions
4 Whites and Other Social Races 65
5 The Shifting Color Line 87
6 Race in the Americas 106
III Race and the Census
7 The “Other Race” Option 129
8 Redefining Race in 2000 153
Appendix A: Data Limitations and the Undercount 177Appendix B: The Biological Concept of Race in the United States 182Appendix C: A Technical Oversight or Racial Flux? 187Appendix D: Free People of Color 193Notes 199References 229Index 265About the Author 283
vii

Introduction
Ethnicity is a hotly contested subject in the academy; even the term pro-vokes intense scholarly debate. In addition, academic definitions anddiscussions of ethnicity are complex, with different disciplines empha-sizing different aspects of the phenomenon. Anthropologists and soci-ologists focus on social and cultural factors and take for granted thepsychodynamics of individuals. Conversely, psychologists place socialphenomena in the background, stressing the importance of individualcognition and emotions (Leets, Clement, and Giles 1996). Social psy-chologists argue that all these dimensions must be linked through self-identification and that culture and the individual must be consideredtogether.
Unfortunately, much of the scholarly writing on ethnicity is nottheoretically rigorous. A recent analysis of ethnicity in the social sci-ence literature, reviewing 190 articles and 10,000 citations publishedbetween 1974 and 1992 (Leets, Clement, and Giles 1996), found thatan overwhelming majority (82%) of the articles lacked any coherenttheoretical foundation from which to view ethnicity.1 Moreover, themajority were not empirical, and many did not report how they hadmeasured ethnicity.
Most of the articles (43%) dealt with ethnicity only secondarily andusually measured ethnicity as a geopolitical category, for example, Hin-dus in India. Only 22 percent reflected multiple dimensions of ethnicity,acknowledged overlapping categories, or included objective and sub-jective components of ethnicity. Some scholars equated ethnicity withrace. Generally, most investigators regarded ethnicity as an objective,self-evident social reality that needed little, or no further, elaboration.2
Ethnicity and race, however, have a fluidity and complexity that arenot often acknowledged but nonetheless are evident. When we reflecton how or why we consider an individual or a group to be “ethnic,” wethink, for example, of language or dialect; common cultural and/or ge-ographic origin; religion; physical difference from us, such as height,
ix
skin color; food, music, and artistic preferences and creations; politicalinterests in their country of origin and/or in the United States; institu-tions that represent and maintain the group; and an internal or externalsense of distinctiveness. Indeed, all these variables surface when weconsider the multifaceted population of Latinos in the United States.
The experience of Latinos in the United States demonstrates that eth-nicity involves both internal and external components, which are cul-turally, politically, and subjectively influenced and multileveled (Isajiw1993:418ff; Leets, Clement, and Giles 1996; van den Berghe 1981:254–261). Consider the situation of Jews in Europe during World War II andLatinos in today’s United States. During the war, Jews were regarded asa “race,” even though they are a religious-ethnic group. On a personallevel, a person might have identified himself or herself as either a de-vout Jew or a secular person of Jewish ancestry. But on an instrumentallevel, this person might also have been a German. And the externalidentification of this person during the Nazi regime was both non-Ger-man and nondesirable. In the United States today, a person may bePuerto Rican or Mexican on a personal level, Latino on an instrumentallevel, and Hispanic to the government. Some people might classify thisperson as black, white, or Asian. Others think of Latinos as a brownrace, and still others, as a multiracial ethnic group. This book discussesthis distinction-plus-duality. For simplicity’s sake, and in order to ap-pear compatible with what appears to be the prevailing language usageof most publishers, the terms “white” and “black” were not capitalizedin this volume.
This book emphasizes the multidimensional nature of individualracial identity (Hartman 1994, 1995). Hansen (1995) has provided ex-amples of a number of these dimensions in the case of African Ameri-cans: self-definition (do I consider myself black?), perception (am I con-sidered black by others?), and treatment (am I treated as if I wereblack?). He also points out that these three elements are not always con-gruent. Rand Reed (1994) added a few other related dimensions: Whatis the person biologically? Sociologically? When is race determined? Atbirth? Death? And by whom? By parents? By an unknown observer?These different levels coexist, with some more salient than others at dif-ferent times.
As befits a complex subject, Changing Race draws on empirical researchand methodologies from many scholarly fields. For historical back-
x INTRODUCTION
ground, I drew on archival records of state and federal censuses and in-terpretive writings of the times. For a view into the shifting “official”definitions of race and ethnicity, I examined the standard referenceworks, such as Webster’s Collegiate Dictionary from 1898 to 1994. I alsoanalyzed secondary sources for insight into the meaning of race andethnicity from antiquity to the present. In addition, I investigated workson race in several Latin American countries. For a more contemporaryanalysis, I reviewed the relevant works in this area and also used sev-eral methodologies. For example, I used in-depth interviews for thecase studies of identity in order to explore areas rarely covered in con-ventional social science research. According to Carlos Martin, a formercolleague of mine at the Smithsonian Institution’s National Museum ofAmerican History, personal accounts often give an entirely differentand more holistic view of “race” in general and of Latinos in particular.For patterns of Hispanic racial identification and the reasons for thesepatterns, I looked at national 1990 census data. I also used various formsof statistical analysis and original survey data from earlier works toprovide quantifiable insights into the interplay of “identity” data andeconomic status. Finally, I relied on legal writings for the discussion ofthe “in-between” identities of several groups caught in the contradic-tions of racial identity in the United States.
Conceptually, this book is positioned as follows: Academic disci-plines offer at least four theoretical approaches to ethnicity, includingthe assimilationist and the pluralist models, the most common and tra-ditional approaches in the United States. Assimilationists assume thatethnicity will be eliminated over time through assimilation, and plural-ists believe that ethnic groups will change by adapting to or accommo-dating the host society. Sociobiological theorists assume that biologicalunderpinnings and variables in social interactions are of prime impor-tance. And Marxist theorists use a conflict orientation, in which everythesis produces an antithesis that results in a new synthesis that alsoproduces a new antithesis, and so on. These (Marxist) conflict theoristscan be subdivided into (1) dependency theorists, who focus on politicaleconomic relations, and (2) postmodern theorists (Leets, Clement, andGiles 1996). My theoretical stance in regard to identity, ethnicity, andrace most approximates postmodernist theory.
Postmodernist theorists argue that there is not a true and know-able self. Rather, one’s identity is relative and is constantly negotiatedthrough relationships and situational contexts. Instead of a core of
INTRODUCTION xi

identity, or self, one has a plurality of selves, each of which surfacesin a particular situation. Thus, an individual is not committed toonly one identity, and similarly, one’s ethnic identity is variable andsubject to the active construction of the individual (Leets, Clement,and Giles 1996).
In this volume, I stress the centrality of situational influences and therole of individuals in the active construction of multiple identities. Thatis, I see individual identity as relational and situational. But I also main-tain that many people have a core of identity, or a self, that is made upof multiple identities—or, in the words of the postmodernists, a plural-ity of selves. I thus disagree with those scholars who believe that indi-viduals are not committed to only one true identity. Rather, I maintainthat individuals may have only one true and knowable self but thattheir ethnic identity also may be variable and subject to an individual’sparticular construction of it and to the political and economic contextsin which this person functions.
PURPOSES
In the first chapter, I explain that the concept of race can be construedin a variety of ways and that the experience of Latinos in the UnitedStates is a good example of the social constructedness of race. I alsodescribe two situations seldom mentioned but often experienced. Thefirst is that categories often come between people, and the second isthat people often fall between categories. Examples of the first areparticularly striking in the Native American community. As Forbesnoted, placing Native Americans who have married African Ameri-cans into the “black” category has resulted in Native Americans’being divided and losing some of their members (1990:44 ff). In somecases, even whole tribes were denied federal recognition as Indiantribes, for example, the Shinnecock Indians of Long Island and theRamapo Mountain Indians in New Jersey, New York, and Connecti-cut. This categorization has also had a significant impact on the livesof these “red-black” peoples, not just in terms of identity, but also interms of more immediate losses of land and treaty-protected rightsand benefits. An example of how people fall between categories wasmost recently illustrated in the demands of multiracial individualsfor a census category that would accommodate the many and increas-
xii INTRODUCTION
ing numbers of people who argue that they do not fit into any of theestablished census groupings.
Although ostensibly removed from their real lives and everyday ac-tivities, categories and classifications do affect people in the UnitedStates. As this book shows, which and how people are counted hasmany ramifications. Moreover, although many believe that census datado not pertain to identity but, rather, are needed to address past dis-crimination, we also know that all race data lead to some sort of reifica-tion, which often affects the way in which peoples and individuals seethemselves and others. That it is important to clarify these issues andthe processes that lead to governmental classification is another reasonthat I wrote this book.
A final purpose for writing this book was to shed light on an areafraught with conflict, emotion, and politics. Race in the United Statesis a complicated, political, and emotional subject. As a report by theU.S. General Accounting Office indicated, “[The] collection of thesetypes of data is technically complex and publicly controversial”(1997:1). I hope that a better understanding of what has too oftenbeen used as a divisive and sometimes cruel issue can be addressedopenly, honestly, and humanely. In this way, we can abolish racial hi-erarchies and become more respectful of one another’s unique andvalued histories.
GOVERNMENT AND DICTIONARY DEFINITIONS
OF RACE
Much of this book’s focus is on official racial labels and categories, bothpast and present. I am aware, of course, that government records mayreflect somewhat “arbitrary racial categories imposed by a white officialor by white prejudice” and that this often contradicts other classifica-tions, for example, familial traditions, that may have greater sociocul-tural and psychological meanings and that may also provide bonds anda sense of belonging that government categories do not (Forbes 1990:38,41, 45). I also know that government categories are not always the bestor most satisfactory measures of group affiliation.
Nonetheless, government definitions or measures of race are themost geographically comprehensive, most readily available, and mostnumerically determinate tools we have. Census categories provide
INTRODUCTION xiii

insight into how a society’s ideologies and dominant ideas and beliefsare reflected in official government classifications. To a degree, they alsorepresent public consensus on how populations are viewed andcounted. I do recognize, however, that this is only one measure of race,which has its own inherent difficulties. Moreover, because they exercisea reflective as well as a regulatory role in society, census categories mustbe considered carefully and from new viewpoints. This is what I wantto accomplish in Changing Race.
xiv INTRODUCTION
Acknowledgments
As I sat down to write these acknowledgments, I remembered when,not too long ago, the New York Women’s Agenda presented to me, andothers, its STAR award and I was asked to say a few words. Ron Gault,a friend who was in the audience, later chided me, saying somethinglike “God, you thanked everyone in the whole wide world . . . yourmother, your father, all your sisters, your brothers, etc., etc.” And I toldhim, “Yeah, they all helped.”
I also thought about my acknowledgments in an earlier book, inwhich I quoted Tato Laviera, a celebrated Puerto Rican poet, who onceobserved, “With every word I write I give thanks to 50 people.” It is thesame feeling that I have now, that there are so many people to thank.Writing this book has been long and difficult, and many people helpedme with their consistent and unquestioned support for “whatever it isyou’re doing.” Here I count my family—my children Gelvi and José;my husband Gel; my mother Clarita; my sisters Minny and Myrna;my brother Jimmy; my cousin Lena; my nieces and nephew María,Michelle, and Tony; and my extended family, who are too numerous tolist individually; and, finally, Rosa and Gloria, who also supported me.
Other people helped me more directly, such as my talented editors atNew York University Press: Stephen Magro, Niko Pfund, and DespinaGimbel, five anonymous reviewers, Fordham University for giving mesome time off to complete the project, the Russell Sage Foundation andits staff for facilitating my work during the year I spent there as a visit-ing scholar, all the the authors cited in this work and those not cited butwho contributed to its development, and the following individuals whocontributed in unique and significant ways to its completion: CristinaBryan, Katie Courtice, Gregory De Freitas, Richard Delgado, VanessaEstrada, Norma Fuentes-Mayorga, Ian Haney-López, Charles Kamasaki,J. Kehaulani Kauanui, Ray Lohier, Terri Ann Lowenthal, Carlos Martin,Barbara Mundy, Nadine Naber, Jeff Passel, Olivia Carter-Pokras, RaedynRivera, Eric Rodríguez, Jean Stefancic, and Frank Torres. I thank you all.
xv


PART I
THE FLUIDITY OF RACE

1
Latinos in the U.S. Race Structure
AC C O R D I N G TO D E F I N I T I O N S common in the United States, I ama light-skinned Latina with European features and hair texture. I wasborn and raised in New York City; my first language was Spanish; andI am today bilingual. I cannot remember when I first realized that thecolor of one’s skin, the texture of one’s hair, or the cast of one’s featuresdetermined how one was treated in both my Spanish-language andEnglish-language worlds. I do know that it was before I understoodthat accents, surnames, residence, class, and clothing also determinedhow one was treated.
Looking back on my childhood, I recall many instances when thelighter skin color and European features of some persons were admiredand terms such as pelo malo (bad hair) were commonly used to refer to“tightly curled” hair. It was much later that I came to see that this Eu-rocentric bias, which favors European characteristics above all others,was part of our history and cultures. In both Americas and theCaribbean, we have inherited and continue to favor this Eurocentrism,which grew out of our history of indigenous conquest and slavery(Shohat and Stam 1994).
I also remember a richer, more complex sense of color than the sim-ple dichotomy of black and white would suggest, a genuine aestheticappreciation of people with some color and an equally genuine valua-tion of people as people, regardless of color. Also, people sometimesdisagreed about an individual’s color and “racial” classification, espe-cially if the person in question was in the middle range, not just with re-gard to color, but also with regard to class or political position.1
As I grew older, I came to see that many of these cues or clues to sta-tus—skin color, physical features, accents, surnames, residence, andother class characteristics—changed according to place or situation. Forexample, a natural “tan” in my South Bronx neighborhood was attrac-tive, whereas downtown, in the business area, it was “otherizing.” I also
3
recall that the same color was perceived differently in different areas.Even in Latino contexts, I saw some people as lighter or darker, de-pending on certain factors such as their clothes, occupation, and fami-lies.2 I suspect that others saw me similarly, so that in some contexts, Iwas very light, in others darker, and in still others about the same aseveryone else. Even though my color stayed the same, the perceptionand sometimes its valuation changed.
I also realize now that some Latinos’ experiences were differentfrom mine and that our experiences affect the way we view the world.I know that not all Latinos have multiple or fluctuating identities. For afew, social context is irrelevant. Regardless of the context, they seethemselves, and/or are seen, in only one way. They are what the Cen-sus Bureau refers to as consistent; that is, they consistently answer in thesame way when asked about their “race.” Often, but not always, theyare at one or the other end of the color spectrum.
My everyday experiences as a Latina, supplemented by years ofscholarly work, have taught me that certain dimensions of race are fun-damental to Latino life in the United States and raise questions aboutthe nature of “race” in this country. This does not mean that all Latinoshave the same experiences but that for most, these experiences are notsurprising. For example, although some Latinos are consistently seen ashaving the same color or “race,” many Latinos are assigned a multi-plicity of “racial” classifications, sometimes in one day! I am remindedof the student who told me after class one day, “When people first meetme, they think I’m Italian, then when they find out my last name isMendez, they think I’m Spanish, then when I tell them my mother isPuerto Rican, they think I’m nonwhite or black.” Although he had notchanged his identity, the perception of it changed with each additionalbit of information.
Latino students have also told me that non-Latinos sometimes as-sume they are African American. When they assert they are not “black”but Latino, they are either reproved for denying their “race” or told theyare out of touch with reality. Other Latinos, who see whites as other-than-me, are told by non-Latinos, “But you’re white.” Although not allLatinos have such dramatic experiences, almost all know (and are oftenrelated to) others who have.
In addition to being reclassified by others (without their consent),some Latinos shift their own self-classification during their lifetime. Ihave known Latinos who became “black,” then “white,” then “human
4 LATINOS IN THE U.S . RACE STRUCTURE

beings,” and finally again “Latino”—all in a relatively short time. I havealso known Latinos for whom the sequence was quite different and thetime period longer. Some Latinos who altered their identities came to beviewed by others as legitimate members of their new identity group. Ialso saw the simultaneously tricultural, sometimes trilingual, abilitiesof many Latinos who manifested or projected a different self as they ac-climated themselves to a Latino, African American, or white context(Rodríguez 1989:77).
I have come to understand that this shifting, context-dependent ex-perience is at the core of many Latinos’ life in the United States. Even inthe nuclear family, parents, children, and siblings often have a widerange of physical types. For many Latinos, race is primarily cultural;multiple identities are a normal state of affairs; and “racial mixture” issubject to many different, sometimes fluctuating, definitions.
Some regard racial mixture as an unfortunate or embarrassing term,but others consider the affirmation of mixture to be empowering. Lu-gones (1994) subscribes to this latter view and affirms “mixture,” mesti-zaje, as a way of resisting a world in which purity and separation areemphasized and one’s identities are controlled: “Mestizaje defies con-trol through simultaneously asserting the impure, curdled multiplestate and rejecting fragmentation into pure parts . . . the mestiza . . . hasno pure parts to be ‘had,’ controlled” (p. 460). Also prevalent in theupper classes is the hegemonic view that rejects or denies “mixture”and claims a “pure” European ancestry. This view also is commonamong middle- and upper-class Latinos, regardless of their skin coloror place or origin. In some areas, people rarely claim a European ances-try, such as in indigenous sectors of Latin America, in parts of Brazil,and in the coastal areas of Colombia, Venezuela, Honduras, andPanama (see, e.g., Arocha 1998; De La Fuente 1998). Recently, some Lati-nos have encouraged another view in which those historical compo-nents that were previously denied and denigrated, such as indigenousand African ancestry, were privileged (see, e.g., Moro: La Revista de nues-tra vida [Bogota, Colombia, September 1998]; La Voz del pueblo Taino [Thevoice of the Taino people]), official newsletter of the United Confedera-tion of Taino People, U.S. regional chapter, New York, January 1998).
Many people, however—mostly non-Latinos—are not acquaintedwith these basic elements of Latino life. They do not think much aboutthem, and when they do, they tend to see race as a “given,” an ascribedcharacteristic that does not change for anyone, at any time. One is either
LATINOS IN THE U.S . RACE STRUCTURE 5

white or not white. They also believe that “race” is based on genetic in-heritance, a perspective that is just another construct of race.
Whereas many Latinos regard their “race” as primarily cultural,others, when asked about their race, offer standard U.S. race terms, say-ing that they are white, black, or Indian. Still others see themselves asLatinos, Hispanics, or members of a particular national-origin groupand as belonging to a particular race group.3 For example, they mayidentify themselves as Afro-Latinos or white Hispanics. In some cases,these identities vary according to context, but in others they do not.
I have therefore come to see that the concept of “race” can be con-structed in several ways and that the Latino experience in the UnitedStates provides many illustrations of this. My personal experienceshave suggested to me that for many Latinos, “racial” classification isimmediate, provisional, contextually dependent, and sometimes con-tested. But because these experiences apply to many non-Latinos aswell, it is evident to me that the Latino construction of race and theracial reading of Latinos are not isolated phenomena. Rather, the gov-ernment’s recent deliberations on racial and ethnic classification stan-dards reflect the experiences and complexities of many groups and in-dividuals who are similarly involved in issues pertaining to how theysee themselves and one another (U.S. Department of Commerce 1995;U.S. Office of Management and Budget 1995, 1997a and b, 1999; thesedeliberations will be reviewed in chapter 8).
Throughout my life, I have considered racism to be evil, and I op-pose it with every fiber of my being. I study race to understand its in-fluence on the lives of individuals and nations because I hope that hon-est, open, and well-meaning discussions of race and ethnicity and theirsocial dynamics can help us appreciate diversity and value all people,not for their appearance, but for their character.
“OTHER RACE” IN THE 1980 AND 1990 CENSUSES
It was because of my personal experiences that I first began to writeabout race (Rodríguez 1974) and that I was particularly sensitive toLatinos’ responses to the censuses’ question about race. The U.S. Cen-sus Bureau’s official position has been that race and ethnicity are twoseparate concepts. Thus, in 1980 and in 1990, the U.S. census asked peo-ple to indicate their “race”—white, black, Asian or Pacific Islander,
6 LATINOS IN THE U.S . RACE STRUCTURE

American Indian, or “other race”—and also whether or not they wereHispanic. (The two questions used in the 1980 and 1990 censuses areshown in figures 1.1 and 1.2). As table 1.1 shows, Latinos responded tothe 1990 census’s question about race quite differently than did non-Latinos. Whereas less than 1 percent of the non-Hispanic population re-ported they were “other race,” more than 40 percent of Hispanics chosethis category. Latinos responded similarly in the previous decennialcensus (Denton and Massey 1989; Martin, DeMaio, and Campanelli1990; Rodríguez 1989, 1990, 1991a; Tienda and Ortiz 1986). Althoughthe percentages of the different Hispanic groups choosing this categoryvaried, all chose it more often than did non-Hispanics (see table 1.1,which shows a wide range in the proportion of Hispanic-origin groupschoosing “other race” in the 1990 census).
In addition, the many Hispanics who chose this category wrote—inthe box explicitly asking for race—the name of their “home” Latinocountry or group, to “explain” their race—or “otherness.”4 The fact thatthese Latino referents were usually cultural or national-origin terms,such as Dominican, Honduran, or Boricua (i.e., Puerto Rican) under-scores the fact that many Latinos viewed the question of race as a ques-tion of culture, national origin, and socialization rather than simply bi-ological or genetic ancestry or color. Indeed, recent studies have foundthat many Latinos understand “race” to mean national origin, national-ity, ethnicity, culture (Kissam, Herrera, and Nakamoto 1993), or a com-bination of these and skin color (Bates et al. 1994:109; Rodríguez 1991a,1992, 1994a; Rodríguez and Cordero-Guzmán 1992). For many Latinos,the term race or raza is a reflection of these understandings and not ofthose often associated with “race” in the United States, for example, de-fined by hypodescent.5 Studies have found that Latinos also tend to seerace along a continuum and not as a dichotomous variable in which in-dividuals are either white or black (Bracken and de Bango 1992; Ro-dríguez and Hagan 1992; Romero 1992).
This does not mean that there is only one Latino view of race.Rather, there are different views of race within different countries,classes, and even families. Latinos’ views of race are dependent on acomplex array of factors, one of which is the racial formation process intheir country of origin. Other variables also influence their views ofrace, for example, generational differences, phenotype, class, age, andeducation. But even though there is not just one paradigm of LatinAmerican race, there are some basic differences between the way that
LATINOS IN THE U.S . RACE STRUCTURE 7

8
4. Is this person ———? Fill in one circle.
o White o Asian Indiano Black or Negro o Hawaiiano Japanese o Guamaniano Chinese o Samoano Filipino o Eskimoo Korean o Aleuto Vietnamese o Other—specifyo Indian (Amer.) Print tribe ________. __________________
7. Is this person of Spanish/Hispanic origin or descent? Fill in one circle.
o No, not Spanish/Hispanic.o Yes, Mexican, Mexican-Amer., Chicano.o Yes, Puerto Rican.o Yes, Cuban.o Yes, other Spanish/Hispanic.
FIG. 1.2. Race and Hispanic-Origin Questions on the 1990 Census
FIG. 1.1. Two Questions about Race and Hispanic Origin on the 1980 Census

Latinos view race and the way that race is viewed overall in the UnitedStates.
In the United States, rules of hypodescent and categories basedon presumed genealogical-biological criteria have generally domi-nated conceptions of race. Racial categories have been few, discrete,and mutually exclusive, with skin color a prominent element. Cate-gories for mixtures—for example, mulatto—have been transitory. Incontrast, in Latin America, racial constructions have tended to bemore fluid and based on many variables, like social class and pheno-type. There also have been many, often overlapping, categories, andmixtures have been consistently acknowledged and have had theirown terminology. These general differences are what Latinos bringwith them to the United States, and they influence how they viewtheir own and others’ “identity.”
Although Latinos may use or approach “race” differently, this doesnot mean that “race” as understood by Latinos does not have overtonesof racism or implications of power and privilege—in either Latin Amer-ica or the United States. Indeed, the depreciation and denial of African
LATINOS IN THE U.S . RACE STRUCTURE 9
Table 1.1Racial Self-Classification by Selected Hispanic-Origin Groups, 1990
White Black NAI APIa Other
Mexican 50.6 0.9 0.6 0.4 47.4Puerto Rican 46.4 6.5 0.3 1.0 45.9Cuban 83.8 3.7 0.2 0.4 12.0Other Spanishb 52.4 6.5 1.0 2.1 38.0
Dominican 29.26 29.96 1.02 c 39.76Ecuadoran 50.81 1.90 1.68 c 45.62Colombian 64.46 2.33 1.34 c 31.87Guatemalan 42.95 0.89 1.67 c 54.48Salvadoran 38.53 1.27 1.10 c 59.10Panamanian 32.97 35.50 2.94 c 28.59
Total Hispanic 52.1 3.0 0.7 0.9 43.5Non-Hispanic 83.1 12.9 0.8 3.1 0.1Total population 199.5 29.8 2.0 7.2 9.7
(millions)
Rows sum to 100% except for rounding.a API = Asian and Pacific Islander; NAI = Native American Indian.b Includes both those who gave a Latino referent and those who identified themselves only asHispanic.c These two categories were combined because of small numbers.
Source: 1990 PUMS (Public Use Micro Sample) 1% sample. (These numbers may not be identical totables based on the 100% census survey or the 5% PUMS because of sampling variability.)
and Amerindian characteristics are widespread.6 Everywhere in LatinAmerica can be found “a pyramidal class structure, cut variously byethnic lines, but with a local, regional and nation-state elite character-ized as ‘white.’ And white rules over color within the same class; thosewho are lighter have differential access to some dimensions of the mar-ket” (Torres and Whitten 1998:23).
Even those countries that subscribe to a racial ideology of mestizaje7
often maintain racial and class hierarchies that favor upper-class inter-ests and political agendas, privilege European components, ignoreracialisms, and neutralize expressions of pluralism by indigenous orAfrican-descended groups (Martínez-Echazábal 1998). That the aware-ness of these issues is increasing is evidenced by Torres-Saillant’s ap-peal to Dominican historians to embrace a narrative that “privileges themany rather than the few” (1998:140). As one Jamaican student travel-ing in the Spanish-speaking Caribbean noted, the attitude there towardrace is similarly destructive but strikingly different from that in theUnited States. Unfortunately, time has not altered the fact that “color”and its associated connotations continue to convey and determine thetreatment that many receive in the Americas and the Caribbean.
When they migrate to the United States, some Latinos become moreaware of the racism existing in their own country of origin, and otherLatinos begin to question their conceptions of ethnic, racial, and na-tional identities. Identities often thus become “a terrain of ideologicalcontestation” (Duany 1998b:149; Foner 1998; Oboler 1995; Omi andWinant 1995; Torres-Saillant 1998). It was this ideological contestationthat was manifested when Latinos checked the “other race” categoryand wrote in their national origins, ethnicity, and so forth on the decen-nial census forms. Thus, most of the 40 percent of Hispanics whomarked the “other race category” and wrote in a Latino referent wereasserting that they were “none of the above.” Others—non-Latinos—might fit them into one or more of the groups listed on the basis of color,phenotype, or biological or ancestral knowledge of “race” origin, butculturally or politically these Latinos did not see themselves as “white,”“black,” or “Asian or Pacific Islander”—or just one of these (Rodríguez1992). According to their own, more culturally defined perspective ofrace, the “race” groups listed on the census were “social groups” but didnot include their own social group. This is why many Latinos still mark“other” on census forms and fill in the space specifying their nationalorigin. Still others disagree with the race structure mirrored in the cen-
10 LATINOS IN THE U.S . RACE STRUCTURE

sus’s race question and choose the “other race” category because theyare more than “one of the above” race categories; that is, they are mestizo,mulatto, black Latino, or another mixture (Davis et al. 1998a; Rodríguez1992; Rodríguez and Cordero-Guzman 1992; Rodríguez et al. 1991).
Although the remaining 60 percent of Hispanics chose one of thecensus’s standard race categories, this does not necessarily mean thatthey all have assimilated or adopted the United States’ racial classifica-tion system. Rather, some Latinos believe that this is how they are seenand will always be seen in the United States and accept or understandthat this is their race in this country. Others, however, choose one of thestandard categories because that is what they are considered in theircountry of origin. As one Bolivian respondent explained in an interviewconducted by the census, “I chose ‘white.’ I am considered white in mycountry” (Davis et al. 1998a:III-19).8 Still others are aware of the “offi-cial” pressure to mark one of the standard categories. As one Hispanicrespondent in a census study indicated, “I do not consider myselfwhite, but this is what the government says I am.” Another respondentsaid, “I don’t belong to any of these groups: probably I can be in ‘Someother race’ and say ‘Hispanic’; but I decided to use ‘White.’” Still an-other checked the white category but added, “I am a Hispanic white”(Davis et al. 1998a:III-20–21). These responses suggest that even thoughsome Hispanics choose a standard race category, they believe that theyalso have other, or multiple, identities.
Other Hispanics choose the standard race categories for the samereasons that members of other groups do. They determine that “biolog-ically,” or in terms of “blood quantum,” they fit into a particular cate-gory (Davis et al. 1998b:48 ff). Finally, some Hispanics do not want to be(or admit to being) “other than white,” “other than black,” or “otherthan indio” (i.e., a member of an indigenous nation). That is, they iden-tify culturally and/or politically with members of a particular category.
Latinos’ responses to the census are discussed in more depth later.Suffice it to say at this point that in my many years of research in thisarea, I have noticed in my and others’ work that “race” is a recurring,sometimes amusing and benign, and sometimes conflictual issue.9 ForLatinos, responses to questions of race are seldom as simple andstraightforward as they tend to be for most non-Hispanic whites (Ro-dríguez et al. 1991).
These “other race” responses presented a problem to the CensusBureau because they differed from previous responses and therefore
LATINOS IN THE U.S . RACE STRUCTURE 11
could not be easily fit into the existing race structure. What was to bedone with the nearly 10 million Hispanics who answered the race ques-tion in this way? In what category were they to be placed? How werethey to be reported or tabulated? In short, how was this group to be un-derstood? When analyzing these results, references to this “data qual-ity” problem were couched in terms of responses in “the other race” cat-egory. But the overwhelming majority (97.5%) who chose this categorywere “Hispanic,” and they accounted for 40 percent of the total numberof Hispanics (U.S. General Accounting Office 1993:26). How, then, wasthis “other race” group (or Hispanic component) to be understood oraccommodated in a country that for most of its history had employedan overarching dual racial structure with four presumed major colorgroups, that is, white, black, Asian or Pacific Islanders, and NativeAmerican Indian?
This group, moreover, represented a growing number of people. In1990, those who had checked the “other race” category represented thecountry’s second-fastest growing racial category (after Asian and Pa-cific Islanders) (Rodríguez 1991b:A14; U.S. General Accounting Office1993). In addition, the population of Latinos was growing seven timesfaster than the population of the nation as a whole. Between 1980 and1990, it had increased by half while the white (non-Hispanic) popula-tion increased by only 6 percent (U.S. Bureau of the Census 1991:table1; U.S. Bureau of the Census 1993c:2).10 By 1999, the number of Hispan-ics in the United States (30 million) was greater than the total popula-tion of Canada.
As we will see, the search for solutions to this and other problemshas contributed to a radical reexamination of the concept of race by theU.S. government. This reexamination included numerous hearings,conferences, and massive studies of hundreds of thousands of house-holds and resulted in the decision to reverse the Census Bureau’s two-hundred-year policy. For the first time, in the 2000 census, respondentswere allowed to choose more than one racial group when answering thequestion about race.
Demographic and Other Changes
Also contributing to the question about the nature of race arebroader demographic trends, such as immigration and the concentra-tion (and consequently greater visibility) of racial and ethnic minorities
12 LATINOS IN THE U.S . RACE STRUCTURE
in populous states and metropolitan areas (Edmonston, Goldstein, andTamayo Lott 1996). Added to this is the wide range of physical types ofmany immigrant groups, for example, Middle Easterners and Latinos,as well as the trend toward racial and ethnic intermarriage, particularlybetween those of high socioeconomic status (Edmonston, Lee, and Pas-sel 1994; Kalmijn 1993; Rolark, Bennett, and Harrison 1994; Spickard1989).
These new trends contrast with past patterns, in which those in in-terracial unions were usually marginal, foreign born, or part of ex-ploitative slave relationships (Berry 1963; Williamson 1984). Con-versely, many of the children of these modern unions are attending uni-versity and will undoubtedly assume leadership positions in the future,in which their positions on multiracial identities will carry the weightof their class positions. The percentage of interracial marriages rosefrom 0.4 percent in 1960 to 2.2 percent in 1991 (Rolark, Bennett, and Har-rison 1994), and the number of births to parents of two different racestripled, from 1.2 percent of all births in 1971 to 4.4 percent in 1995(Atkinson, MacDorman, and Parker 1999).11 Indeed, the seriousnesswith which the proposal to include a multiracial category was receivedsuggests that these forces have already influenced the way that race andethnicity are viewed (see chap. 8).
In addition to these demographic trends, the greater affirmation ofa mixed-race identity and the increasing use and acceptance of self-identification instead of observer identification have produced a moreheterogeneous and more tenuous concept of race (Edmonston, Lee, andPassel 1994; Root 1992b, 1996) in the census and elsewhere. In this re-gard, it is interesting that in 1990, half (50.6%) the children of interracialunions were classified as “white” on the census form by their parent(s)(Bennett, McKenney, and Harrison 1995:table 5), whereas in the past,census takers would most likely have classified such children accordingto the race of the nonwhite parent.12 These trends are changing the“face” of the United States and will intensify in the twenty-first century,contributing to the growing trend to view race as many Latinos alreadydo, as race-ethnicity.
Blurred Boundaries
As increasing numbers of physically heterogeneous groups—suchas Latinos—have become more concentrated and/or more visible,
LATINOS IN THE U.S . RACE STRUCTURE 13

questions of what constitutes “whiteness” and nonwhiteness have sur-faced. Can individuals seen as white and those seen as nonwhite bemembers of the same race group? Where does whiteness—or black-ness—begin? These questions have led to a reanalysis of whiteness andfundamental reconsiderations of race and ethnicity. (See, e.g., the fol-lowing works, which examine how whites see themselves, how white-ness has been—or has not been—achieved by certain groups in Ameri-can history and law, and how race and ethnicity are being rethought:Brodkin Sacks 1994; Delgado and Stefancic 1997; Ferrante and Brown1998; Frankenberg 1993; Gallagher 1999; Haney López 1996; Ignatiev1995; Waters 1990.)
More and more native-born Americans see that many people’sracial/ethnic definitions of themselves are at variance with others’ def-inition of them. For example, white-appearing, third-generation Lati-nos, who sometimes no longer even speak Spanish, may insist they are“not white” or declare themselves to be “brown,” “black,” or “other.”Government officials, office managers, criminal justice administra-tors—that is, those who are responsible for counting race and ethnicity,are increasingly realizing that individuals—particularly the growingnumbers of new and existing minorities—often define their “race”quite differently than they would be defined by others.13
THE PROPOSAL TO MAKE LATINOS A RACE
In July 1993, the U.S. Office of Management and Budget announced thatit would review the racial and ethnic categories used to collect govern-ment data (U.S. Office of Management and Budget 1997a). A number ofproposals to amend the current categories were made. One proposalthat received quite a bit of media attention was to add a “multiracial”category. Another proposal, even though it involved greater numbers ofpeople, received considerably less attention: to make Hispanics a race.14
This proposal was subsequently referred to as “the combined question”because it would list “Hispanic” as a category along with the other racecategories. That is, it would reclassify what the census had consideredan “ethnic group”—in which Hispanics could be of any race—to a“race” group in which all Hispanics were of one race.
What made this proposal curious was that Hispanics did notwholeheartedly initiate or support it, in contrast to other proposals con-
14 LATINOS IN THE U.S . RACE STRUCTURE
sidered at the time.15 Even more striking was the fact that evidently fewLatinos noticed the lack of a Hispanic constituency. Although three His-panic organizations were occasionally cited as supporting the proposal(del Pinal 1994; Wright 1994), a close look at their statements shows thiswas not exactly the case. Rather, their statements indicated reserva-tions, questions, support for relabeling the race question “race/ethnic-ity,” and a need for more research (National Council of La Raza 1995;U.S. House Committee 1994k, 1994p).
As the final chapter in this book makes clear, Hispanics were a sig-nificant but silent presence in the process, which was extraordinarygiven the striking population growth of Latinos in the United States. InMarch 1997, the Latino population was “officially” 29.7 million, or 11percent of the total U.S. population (Reed and Ramirez 1998:table 1).This figure did not include, however, the 3.6 million Hispanics wholived in Puerto Rico (Hispanic Link, March 6, 1995, p. 1; Rodríguez1994b) or those Hispanics who lived in the United States but were notcounted.
The U.S. Supreme Court recently decided in favor of total counts forthe 2000 census, and not statistical sampling. The debate surroundingthis highly politicized issue did not clearly explain the discrepanciesthat exist in each group with regard to the undercount.16 After NativeAmericans on reservations, who had an undercount rate of 12.2 percent,Hispanics had the highest undercount of all racial-ethnic groups, or 5.0percent in the 1990 decennial census. African Americans followed with4.4 percent, and non-Hispanic whites had an undercount rate of lessthan 1 percent (or 0.7%) (U.S. Bureau of the Census 1997:4). Moreover,about 4 million people, “most of them affluent whites living in suburbsthat tend to vote Republican” were counted twice (Holmes 1999:24; andsee app. A for a discussion of the undercount issue).
But despite the undercount, the growth of the Hispanic populationhas been dramatic. Hispanic youths already outnumber black youths(Vobejda 1998:A2). Indeed, the U.S. Census projects that the Hispanicpopulation will surpass the African American population by 2005, andit is expected to be about a quarter of the total U.S. population by 2050(Day 1996:63,13; Larmer 1999). However, if immigration and birthratescontinue to climb, some of these changes may occur much sooner thanthat.
Notwithstanding the lack of support by this substantial and grow-ing group, the proposal to make Hispanics into a separate race persisted
LATINOS IN THE U.S . RACE STRUCTURE 15

and became one of the primary propositions that the Office of Manage-ment and Budget examined in its extensive review between 1995 and1997. The proposal was eventually dropped, however, when it becameevident that making Hispanics into a separate race would result infewer being counted—and in fewer whites being counted (U.S. Bureauof the Census 1996a, 1997).
MULTIRACIAL AMERICANS AND LATINOS
The insistence on self-definition—particularly within one’s own lin-guistic and philosophical framework—is central to the challenges toracial construction in the United States today. The insistence on identityin one’s own terms is a major nexus between the issues raised by themultiracial movement and those raised by Latinos. Both groups seek, orhave, definitions of self and their group that are often outside the bira-cial structure created in the United States. Furthermore, those who are“white” are dominant and thus determine who is “nonwhite” or“other.” Many Latinos, and many in the multiracial movement, arechallenging these rigid categorizations, along with the implied racialhierarchy.
Hispanics and those in the multiracial movement are often seenand defined as distinct groups, yet there are interesting overlaps. “Mul-tiracial” Americans and those who go by the terms interracial, mixedrace, and biracial are defined as “persons who identify with more thanone race group” (Bennett, McKenney, and Harrison 1995:1). (Racegroup refers only to white, Asian or Pacific Islander, black, or NativeAmerican groups.) The census defines as “Hispanics” those who clas-sify themselves as being of Hispanic or Spanish origin on the census,adding, “Hispanics may be of any race.” (The census defines origin asthe ancestry, nationality group, lineage, or country of birth of a personor his or her parents or ancestors before their arrival in the United States[U.S. Bureau of the Census 1993b:B-12].)
Yet many Hispanics claim a multiple “racial” ancestry. Indeed, inrecent census tests, more Hispanics chose the “multiracial” category(6.7%) than did non-Hispanics (less than 1%), and about one-third of allthose in the multiracial category were Hispanic (U.S. Bureau of the Cen-sus 1996a:13 and table 12). In addition, because many Latinos see raceas a cultural construct, some consider themselves Latinos and “multira-
16 LATINOS IN THE U.S . RACE STRUCTURE
cial” because one parent is white, black, Asian, or Pacific Islander andthe other is Hispanic or because each parent has a different Hispanic na-tional origin.
HISTORICAL CONSTRUCTS
An analysis of U.S. decennial census classifications shows the clear his-torical progression toward a more definitive bipolar structure. Al-though the taxonomy of race has changed, we can see in historical andlegislative documents the evolution of two fundamental and sociallyconstructed polarities that place “whites” at one end and “other socialraces” at the other. Although each of these polarities has been and con-tinues to be fluid, this basic dichotomous structure has prevailedthroughout most of the census’s two-hundred-year history. It is withthis historically evolved bipolar structure that groups who have notbeen “quite white” or “quite black” have contended in the past, and itis in this structure that Latinos and other groups are entangled today.
Although this bipolar structure has been overarching, providing thebasic racial structure of the various “racial” groups, there is and proba-bly always has been a great deal of heterogeneity within the two polar-ities. Moreover, the boundaries between these polarities have alwaysbeen ambiguous and shifting. Finally, alterations of group and individ-ual classifications have been both unofficial and legal and bureaucratic.
For some people throughout U.S. history, the labels applied by thecensus and the identities created or used by the individuals and groupsthemselves have always differed. Furthermore, these externally createdlabels and identities have changed, so, for example, the Mohawks of theHotinonshonni Confederacy refer to themselves—and recognize thatthey are also referred to—as “Iroquois,” “Native American,” or simply“Indian.”
IMMIGRANTS AND THE RACIALIZATION PROCESS
In the past, new immigrants immediately underwent a racializationprocess, which conveyed an implicit hierarchy of color and power. Thetwo elements of this racialization process were (1) the acceptance of andparticipation in discrimination against people of color (Bell 1992; Du
LATINOS IN THE U.S . RACE STRUCTURE 17

Bois 1962:700 ff; Morrison 1993) and (2) negotiations regarding thegroup’s placement in the U.S. racial-ethnic queue (Jacobson 1998; Ro-dríguez 1974; Smith 1997; Takaki 1994). Immigrants undergoing thisracialization process discriminated implicitly or explicitly against oth-ers because of their color and status. Indeed, some immigrants realizedthat one way to become “white,” or more acceptable to whites, was todiscriminate against others seen as “nonwhite” (Ignatiev 1995; Kim1999; Loewen 1971). Kim (1999) reviewed the historical experience ofAsian Americans being triangulated with blacks and whites through asimultaneous process of valorization and ostracism. This racial trian-gulation continued to reinforce white racial power and insulate it fromminority encroachment or challenge.
Some immigrants discriminated against blacks and/or other de-preciated minorities by not living with “them,” not hiring “them” inenclave economies, or articulating prejudices against “them.” Institu-tionalized discrimination and normative behavior aided racializationso that, for example, it became difficult to rent or sell to members ofcertain groups because of exclusionary practices. Nearly all immi-grant groups experienced this seldom-mentioned but indisputabledimension of the Americanization process. Critical to the racializa-tion process was the belief that there was always some “other” groupto which one was superior. Indeed, this process has been an effectivemeans of protecting the status quo because it made it difficult to un-derstand and pursue areas of common interest and resulted in di-vide-and-conquer outcomes.
Imputed and Self-Defined Race for Latinos
Latinos—and many other groups—come to the United States withdifferent views of race and with their own racial hierarchies. The rela-tion of these people’s racialization to their hierarchies in the UnitedStates has not been widely studied. But it is clear that when they arrive,they too become part of a racialization process in which they are differ-entiated according to the official perception of their race, which may ormay not be the same as their own perception. This racial reclassificationimmerses immigrants in a social education process in which they firstlearn—and then may ignore, resist, or accept—the state-defined cate-gories and the popular conventions concerning race (particularly one’sown) (Rodríguez 1994a).
18 LATINOS IN THE U.S . RACE STRUCTURE

The racialization process also includes contradictory views of theway that Hispanics are generally regarded. At one extreme, Hispanicsare a Spanish-speaking white ethnic group who are simply the mostrecent in the continuum of immigrant groups and are expected to fol-low the traditional path of assimilation. Another view holds that theterm Hispanic—which has generally been unknown to new immi-grants from Latin America—is subtly “colored” by negative andracial associations. For example, the stereotyped image (for both His-panics and non-Hispanics) of a Hispanic is “tan.” Within this per-spective, Hispanics are often referred to as “light skinned,” not aswhite. Yet many Hispanics would be seen as white, black, or Asian ifit were not known that they were Hispanic. But seeing Hispanics/Latinos as “light” clearly restricts their “whiteness” and thus makesthem nonwhite by default, but not a member of other race groups.Thus, many Hispanics entering this country become generically“nonwhite” to themselves, or to others, regardless of their actual phe-notype or ancestry.
The United States’ racialization process affects all groups’ sense ofwho they are and how they are seen, in regard to color and race. Thereare few studies of this concerning Latinos, but some autobiographiessuggest that the racialization process has had a significant impact (see,e.g., Rivera 1983; Rodriguez 1992; Santiago 1995; Thomas 1967).Whether this has been a dissonant impact and has affected Latinos’ mo-bility and the quality of life has not yet been determined.
Some Latinos, influenced by movements such as the Black Powermovement, Afrocentrism, Pan-Africanism and African diaspora phi-losophies, and the celebration of negritude, have come to see them-selves, and sometimes their group, as black. Terms like Afro-Latino, blackCuban, and black Panamanian are now common, and some Latinos cele-brate their African roots. Others focus on their Amerindian or indige-nous component, while still others see themselves only as white ormixed or identify themselves only ethnically.
A Dominican student of mine told me that each of her and herhusband’s children claimed a different identity. So they had one blackchild, one white child, and one Dominican child. Each of the childrenhad different friends and tastes. Many variables contribute to and in-teract with the racialization process to determine how individuals de-cide on their group affiliation. Generation, phenotype, previous andcurrent class position, and the size and accessibility of one’s cultural
LATINOS IN THE U.S . RACE STRUCTURE 19
or national-origin group, as well as the relative size of other groups,all affect how individual Latinos identify themselves.
DISCRIMINATION
Most Latinos believe that they are discriminated against as a group. Inone of the largest and most comprehensive surveys of Latinos, 80 per-cent of Mexicans, 74 percent of Puerto Ricans, and 47 percent of Cubansreported “a lot” or “some” discrimination against their own group, ageneral perception that appeared to be unrelated to skin color (de laGarza et al. 1992:94–95). Falcon (1995), for example, found that PuertoRicans’ phenotype was not related to their perception of group dis-crimination.
Thus, although darker or more visible Latinos may experiencemore direct discrimination, looking white or light does not substan-tially alter their perception of discrimination. Indeed, it may sometimeshave the opposite effect. That is, lighter Latinos may more often be in aposition to observe discrimination. They may be assumed to be whiteand consequently be better able to see how others are treated or thatthey are treated differently from those who are darker. Moreover, allLatinos, regardless of color, may experience discrimination, for His-panicity is based on more than skin color. Other clues, such as accent,residence, surname, or first name, can reveal that a person is Hispanic.Thus, despite an individual’s physical appearance as “white,” knowl-edge of this person’s Hispanicity often causes a readjustment of status.The perception shifts from “I thought you were one of us” to “You’re another”—and even an accent is heard where it was not before. This typeof redefinition or reclassification may be imposed more often on lighterLatinos and may make them just as conscious of discrimination asdarker Latinos are. Therefore, even though “color” or phenotype is sig-nificant in an individual Latino’s experience, all physical types can anddo experience discrimination.17
Considerable evidence shows that the discrimination Latinos per-ceive is very real, for example, disparities in judicial treatment (Díaz-Cotto 1996:416–417; Haney López 1996:138–139, 252–253) and evidenceof housing discrimination (Denton and Massey 1989; James, McCom-ings, and Tynan 1984; Massey and Denton 1990; Yinger 1995). In NewYork City, black and Hispanic immigrants—particularly those from the
20 LATINOS IN THE U.S . RACE STRUCTURE
Dominican Republic—continue to live in the least desirable housing,pay among the highest percentages of income for rent, and have thelowest rates of home ownership compared with European, Russian,and Asian immigrants (Hevesi 1998; Schill, Friedman, and Rosenbaum1998). Moreover, because of where they live, Hispanics and blacks inNew York City—whether they are foreign born or native born—haveless access to medical care, higher crime rates, and greater concentra-tions of poverty and housing-code violations (Rosenbaum et al. 1999).
Individuals who are clearly identified as “Hispanic” by theirnames, résumés, accents, and, sometimes, stereotypical looks experi-ence greater job discrimination than do equally qualified whites (Ben-dick 1992; Cross et al. 1990; Fix, Galsten, and Stryk 1993). Also, Hispan-ics experienced greater employment discrimination as a result of the1986 Immigration Reform and Control Act (Bendick 1992; U.S. GeneralAccounting Office 1990). With the passage of legislation sanctioningemployers for hiring undocumented workers, many Hispanics who arecitizens or legal residents were not hired for jobs for which they werequalified because employers thought they might have been in theUnited States illegally. Given these findings, it is not surprising that areview of judicial cases involving employment discrimination based onnational origin found that most of the litigation pertained to Hispanics(del Valle 1993).
Studies of employer preferences in hiring also suggest that dis-crimination against Hispanics is widespread in the labor market(Holzer 1997; Hossfeld 1994; Moss and Tilly 2000). In these studies, theemployers interviewed had definite beliefs and preferences concerningthe suitability of different groups for different jobs, including “negativeattitudes” toward “workers of color” (Moss and Tilly 2000). Accordingto Darity and Mason (1998:81), employers “set up a racial/ethnic gen-der ranking of potential hires” that favored white men and womenworkers over Hispanics and blacks. These studies underscore the dis-advantages that race/color (and ethnic) markers can bring to employ-ment and hiring practices (Darity and Mason 1998:81).
The literature on the effect of labor market discrimination on earn-ings and occupational attainments has yielded a complex array of find-ings that reflect not just differing theoretical perspectives but also vari-ations in sampling and methodology (Meléndez and Rodríguez 1992;Meléndez, Rodríguez, and Barry Figueroa 1991:293).18 More recently,the focus of labor market research has moved beyond measuring the
LATINOS IN THE U.S . RACE STRUCTURE 21
extent of in-market discrimination to the effect of premarket factors(e.g., human capital characteristics like educational attainment) andpreemployment skills (e.g., punctuality). These researchers argue thatHispanics receive less compensation or are less often hired because theydo not have the same preemployment skills as others and because pre-market factors keep them out of the competition. But they gloss over therole of discrimination in premarket factors. For example, where onelives (or can live) influences early educational options and social, polit-ical, and personal networks. These, in turn, affect subsequent educa-tional opportunities, which influence scores on tests, which influenceeducational options and outcomes.
In addition, although the lack of preemployment skills is oftenmentioned as a reason for Hispanics’ lower incomes, there has been lit-tle systematic or scientific research on whether Hispanics as a wholehave fewer preemployment skills. This explanation is reminiscent ofearlier images of African Americans as lazy and shiftless when in factmore were working in the fields and other arduous occupations thanothers were.19 Similarly, Hispanics who often have poorly paid jobswithout benefits, security, or full-time employment (Boisjoly and Dun-can 1994) and are overly represented in “jobs others won’t do” are seento lack preemployment skills. Yet in order to hold jobs, such as takingcare of other people’s children, lawns, homes, meals, and apartmentbuildings and working in the food and textile industries, they must ar-rive on time and operate quickly and efficiently.
From a more journalistic and contrastive perspective, Skerry (1990)contends that since Hispanics are not a race, they cannot be subject toracial discrimination in employment. Nonetheless, we have seen thatalthough some Hispanics identify themselves as a cultural or ethnicgroup, others may see them as a “Spanish” race or as nonwhite.Whether ascribed race or self-reported race is more determinant of howHispanics are treated in the United States has not yet been resolved orstudied systematically.20
Some research, however, indicates that Hispanics who report theyare black or are seen as black are more segregated and less successful ingaining access to predominantly Anglo residential areas than are theirwhite Hispanic counterparts (Denton and Massey 1989; Massey 1988;Massey and Denton 1993:113 ff; Rosenbaum 1996). In addition, Latinoswho classify themselves as white or are identified as white (or light) fare
22 LATINOS IN THE U.S . RACE STRUCTURE

better with regard to earnings, hourly wages, and other socioeconomicvariables than do other Latinos (Arce, Murguía, and Frisbie 1987;Gómez n.d.; Katzman 1968; Relethford et al. 1983; Rodriguez 1990,1991a; Telles and Murguía 1990). Moreover, “black Hispanics sufferclose to ten times the proportionate income loss due to differential treat-ment of given characteristics than white Hispanics” (Darity and Mason1998:72).
The results of these studies suggest a need to continue collecting“race” data on Hispanics, for they indicate a possible economic rent,color credit, or tax paid, depending on perceived or imputed race. (Thedifferences found within Latino groups, however, are less pronouncedthan those between white Latinos and non-Hispanic whites.) These find-ings parallel those found in the African American community, in whichthose with a lighter skin color had higher socioeconomic outcomes andthose with a darker skin color were moderately associated with beingworking class and having a low income or little education (Hughes andHertel 1990; Keith and Hering 1991; Krieger, Sidney, and Coakley 1998).Interestingly, as in the case of Falcon’s 1995 study of Puerto Ricans’ phe-notype, color shade did not seem to be related to self-reported experi-ences of racial discrimination (Krieger, Sidney, and Coakley 1998).
AN UNEQUAL PLAYING FIELD
Whether or not the result of discrimination, the demographic picture ofHispanics suggests that disparities exist in regard to standard socioeco-nomic indicators. For example, in 1996, more Hispanics were living inpoverty than whites and even blacks. Hispanic men were more likelythan white men to be employed, but they had higher unemploymentrates. Despite the high numbers of Hispanics in the labor force, their in-come continued to be two-thirds that of whites, with family incomeslightly below the black average. Among married-couple families inwhich at least one person was working, Hispanics had the highestpoverty rates and the lowest income levels, compared with both whiteand black families. Hispanics also paid a higher proportion of their in-come for housing than did either whites or blacks (National Council ofLa Raza 1997). Hispanics were less adequately covered by health insur-ance, having lower health insurance rates and pension benefits than did
LATINOS IN THE U.S . RACE STRUCTURE 23
either whites or blacks (del Pinal and Singer 1997:36–37; NationalCouncil of La Raza 1997; Santos and Seitz 2000).
Finally, while high school completion rates have improved forwhites and blacks, for the last thirty years, more Hispanics have con-tinued to drop out of school. In 1994, this figure was 2.5 times the ratefor blacks and 3.5 times the rate for whites. One in five Hispanics agedsixteen to twenty-four has left school (Secada 1998:5). Both U.S.-bornand foreign-born Latinos continue to lag with regard to education(Chapa and Wacker 2000). And these results are not simply a transitoryreflection of the increased number of unskilled Hispanic immigrants.Whereas other studies have concentrated on past and continuing struc-tural, institutional, and discriminatory barriers that many Latinogroups face (De Freitas 1991:4–5; 53–94; Morales 2000; Morales andBonilla 1993; Rodríguez 1989:85–105; Torres 1995; Torres and Rodríguez1991), at least two studies have concluded that the negative standing ofLatinos relative to that of other groups cannot be attributed to immi-gration (Grenier and Cattan 2000; Valenzuela 1991).
The economic boom at the end of the twentieth century has had amodest trickle-down effect. As compared with the past, Latinos todayhave a higher rate of home ownership, college completion, and earn-ings for college graduates, particularly for young Latinas (NationalCouncil of La Raza 1997; Reimers 2000). In addition, different picturesemerge when we examine diverse Hispanic groups by region, genera-tion, and the like. For example, Cubans in Florida and Puerto Ricans inTexas typically live at a higher socioeconomic level than do Hispanicsas a whole (García 1996; Pedraza-Bailey 1985; Portes and Bach 1985;Rivera-Batiz and Santiago 1997; Rodríguez 1991a:27, 46). Nevertheless,the broad indicators suggest that Hispanics’ general socioeconomic sit-uation is not favorable. Moreover, the perception and evidence point to-ward discrimination. In other words, the playing field is not level,which further complicates issues of race.
The Reality of Race
This book emphasizes the social constructedness of race and howLatino experiences in the United States illustrate race as a social con-struction.21 We should not, however, lose sight of the continuing signif-icance of race. The research still shows that race and ethnicity influence
24 LATINOS IN THE U.S . RACE STRUCTURE
where and how people live, work, shop, and play and how they aretreated in everyday social interactions and in institutions. Race is dif-ferent, and it also feels different (Edley 1996). Racial/ethnic categoriesin the United States are still socially meaningful indicators of racial sub-ordination, privilege, and denomination (Bhopal and Donaldson 1999:784; Krieger, Williams, and Zierler 1999:782).22
My own life experiences have demonstrated the social constructed-ness of race, and this book shows that “race” is not fixed, is imperfectlymeasured, is at variance with scientific principles, is often conflatedwith the concept of “ethnicity,” and is under increasing scientific criti-cism and popular interrogation. Nonetheless, race is still real; it still ex-ists.23 We may question its necessity, the right of anyone to establishsuch markers, and its validity as a scientific concept. We may see it asunjust and want to change it. But we must acknowledge its significancein our lives. It can be deconstructed, but it cannot be dismissed.
Race as a Changing Concept
The concept of race is changing in the United States and LatinAmerica and around the world. Increasingly, we find both exclusionistand inclusive definitions of racial and ethnic identities that go beyondnation-state boundaries, for example, in organizations such as theAryan Nation and its international cousins, organizations for indige-nous peoples worldwide, the various movements and organizations ofAfrican and African-descended peoples, and various diasporas. In ourincreasingly global world, all these definitions and movements helpchange race. Hanchard, speaking specifically about African-descendedpopulations in the United States, argues that restrictions on their “citi-zenship and movement in the United States” have led “black politicalactors” to mobilize politically and transnationally (1999:1). Adding tothe increased identification as African-descended populations are theaffirming and reclaiming of ancestral identities that have always ex-isted and were featured during the black power, American Indian, Chi-cano, Puerto Rican, and Asian American movements of the 1960s and1970s. Similar restrictions and affirmation can be found among mem-bers of other populations when they travel throughout the world, andthey also lead to greater and broader identification with ancestralgroups. Opposing trends can be found as well, toward more restrictive
LATINOS IN THE U.S . RACE STRUCTURE 25

ethnic identifications and rivalries, such as in the ethnic cleansing ineastern Europe and Rwanda. Whether these trends will result in a morehomogenous concept of race, built on U.S. race constructs, or in agreater variety of racial constructs remains to be seen. But even thoughthe outcome may not yet be clear, it is clear that race is changing.
26 LATINOS IN THE U.S . RACE STRUCTURE

2
The Idea of Race
T H E R E S U LT S O F recent censuses, as well as the personal experiencesof Latinos and non-Latinos, raise the question of what race is in theUnited States. Latinos’ wide range of physical types, their history, andtheir more “social” or cultural views of race have historically chal-lenged U.S. racial constructions, and the government has had difficultycategorizing them. As the next chapters will show, Latinos are not alonein this regard, as other groups have had similar histories and presentsimilar challenges. But it has been the increase in the two i’s, immigra-tion and intermarriage, that has made questions of racial classificationmore salient and has led to the question of just what race is.
In this chapter, we begin exploring these questions by examining“the many faces of race,” its multidimensional nature. We then turn torace as it has been commonly understood in the United States or, as U.S.courts have termed it, race “in the common understanding” (HaneyLópez 1996:85, 91, 107). This understanding sees race as a “self-evident‘fact’ requiring no protracted thought” (Hannaford 1996:3) and as ex-isting in the same way in all places and times. We challenge this idea,however, when we examine (1) studies of “race” in the past, (2) howother governments count their populations, (3) the literature on“mixed” race, (4) changing U.S. census classifications, and (5) standardreference sources of racial definitions over time. Evident in these exam-inations are the fluidity and variability of race over time and place andits overlap with ethnicity, which is dependent on context.
THE MANY FACES OF RACE
Race has many dimensions and so is often used and defined in differentways. For example, race can be as defined by official bodies, such as thecensus or state governments. This is state-defined race. Race also is the
27

perception or experience of laypersons. This is often referred to as pop-ular race, folk race, or race “in the common understanding” (Jensen 1988;Wright 1994:50). Although state-defined race is often thought of as re-flecting popular race, they often influence each other. For instance, lawconstructs race, and states can define, restrict, or privilege races throughlegislation (Haney López 1996:19). Race is also studied by scholars whoexamine racial ideologies or ideas in public pronouncements, policies,or literary works. This is referred to as ideological race (e.g., Graham1990; Horsman 1981; Stanton 1960).
In both academia and more popular circles, we find the “whateveryou think it is” concept of race, which is often a shifting combination ofall of the above and frequently translates into the “you know one whenyou see one” idea. Some people think of race as “identity” and “howyou see yourself.” Others consider race to be determined more by “howothers see you.” These two views sometimes conflict, hence, golf champTiger Woods’s dilemma in which his view of himself as being of mixedrace conflicts with the view that many have of him as “black.”1 In real-ity, racial definitions are often both external (what others think) and in-ternal (what the subject thinks). This external-internal axis is also de-scribed as “imputed versus self-defined race” or “objective versus sub-jective” definitions of race. Each of these different internal/externalusages is strongly affected by cultural and class considerations. Butthese nuances or different definitions of race are generally not ac-knowledged in people’s everyday conversations.
RACE IN THE UNITED STATES
In the United States, race as defined “in the common understanding”has usually been simple and straightforward. On the simplest, least re-flective, and most practical plane of interaction in the United States,race is often thought of as one’s biological ancestry, manifested mostclearly in skin color. Within this one-dimensional conception, colorterms are frequently used to designate different “races.” Thus, there areostensibly four color groups, roughly corresponding to geographic re-gions: black (Africa), white (Europe), red (North America), and yellow(Asia). In this color palette, what makes a person “white” is the absenceof any “black” or nonwhite blood, and what makes a person “black” isthe presence of “black” blood. White is white because it is not mixed
28 THE IDEA OF RACE
with any other color; it is “pure.” “Black” blood, however, is “potent”or “polluting,” in that it takes only a small amount of “black blood” (an-cestry) to make someone “black.” This concept is referred to in aca-demic circles as hypodescent, or “the one-drop rule.” (Davis 1992; Root1992b; Williamson 1984; Wright 1994).2
Despite these different color terms, in all four cases, the white cate-gory is the norm or referent, and the other three groups are nonwhite.We can understand the significance and power inherent in this con-struction of groups if we imagine a similar classification schema thatuses another defining category. In this case, we would have reds andnonreds or yellows and nonyellows. In broad and blunt terms, this isthe way in which “race” has been simply understood in the UnitedStates; this has been its social construction.
These four race-color groups have had and continue to have corre-sponding categories on census forms, one of which individuals mustchoose, and not more than one.3 The fact that the four categories havebeen presented as mutually exclusive conveys the impression that eachof the groups is a “pure” race (Lee 1993). Although this has been the im-pression, the reality was and is quite different. Appendix B contains acloser review of contemporary critiques of “race” as constructed in theUnited States. In short, it has been challenged on the grounds that it isillogical and inaccurate; based on unscientific assumptions; more deter-mined by contextual, political, economic, and social factors than gener-ally acknowledged; and generally dismissed by scholars in the field(see, e.g., Begley 1995:67; Gregory and Sanjek 1994:6–7; Gutin 1994:73;Marks 1994, 1995; Rosin 1994; Sanjek 1994; Shreeve 1994:60; Washburn1963; Wills 1994:81).
More journalistic treatments have also found fault with this concept(see, e.g., the following extensive treatments: Barringer 1993; DiscoverNovember 1994; Lemonick and Dorfman 1999; Morrison 1993; MotherJones October 1997; Newsweek February 13, 1995; Rosin 1994; The SciencesMarch/April 1997; Weissman 1990; Wood 1994; Wright 1994). The factthat this issue has appeared in the popular press indicates that it hasgone well beyond modest academic contemplation. In addition to, oralong with, this academic and journalistic examination has been an of-ficial, high-level, and massive reconsideration of racial-ethnic cate-gories for the 2000 census, resulting in the decision to eliminate the Cen-sus Bureau’s “choose-only-one-category” standard that has contributedto the myth of pure races.
THE IDEA OF RACE 29

Given the U.S. racial classification system’s reliance on color, weshould look at the critiques of the race concept’s emphasis on color andcolor differences among population groups. Population groups do varyby skin color. Thus, groups like the Scandinavians, who have lived forlong periods in areas with little sun, have less melanin in their skin onaverage than do Africans who have lived for a long time close to theequator. Melanin is the chemical substance responsible for color in theskin. It protects humans from the sun’s ultraviolet rays, so in areas ofthe world where these rays are stronger, people’s skin contains greateramounts of melanin. Likewise, in areas where there are fewer ultravio-let rays, skin pigmentation is lighter.4 Consequently, skin color is anadaptive—evolved—characteristic, but it is independent of other ge-netic characteristics. That is, color can be inherited independently ofhair texture or color.
Geneticists examining the role of melanin have determined that it ismost likely not related to differences affecting intelligence, personality,or ability (Wills 1994). Therefore, color—ostensibly the principal markerdistinguishing groups or “races” in the United States—must act in con-cert with other variables to determine differences among groups, for byitself it does not seem to play a major role. Indeed, if the presence or ab-sence of melanin were related to variables such as intelligence, wewould expect that within population groups, tanning ability would re-flect greater or lesser intelligence. But if you think for a moment aboutbeach-tanning profiles, you will quickly dismiss this hypothesis!
RACE IN THE PAST
Until recently, race in the United States was generally seen to be auniversal given—uncomplicated, unchangeable, and unavoidable.Indeed, U.S. sociology textbooks often describe race as an “ascribed”characteristic, in contrast to “achieved” characteristics such as educa-tion and income.
Some scholars contend, however, that what we understand as“race” today is what we used to understand as “ethnicity” (Bernal 1987;Dunn and Dobzhansky 1952:107–108; Sanjek 1994; Shreeve 1994:60;Snowden 1983; Thompson 1989). Other studies argue that race as weunderstand it in the United States today is a modern invention with noequivalent in pre-Columbian history (Bernal 1987; Hannaford 1996;
30 THE IDEA OF RACE

Snowden 1983; Thompson 1989). Hence, referring to “blacks” in ancienthistory is incorrect, because people then identified themselves and wereidentified primarily by religion, language, culture, and other variables,and not by color.
Some writers maintain that ancient societies did not harbor thecolor prejudice of modern times (Hannaford 1996; Harris 1977; Jallohand Maizlish 1996:9; Snowden 1983; Thompson 1989). In fact, Snowdenbelieves that “this is the view of most scholars who have examined theevidence” (1983:63). In essence, the ancients made ethnocentric judg-ments about societies; subscribed to narcissistic canons of physicalbeauty; considered themselves civilized and others, barbarians; but didnot regard black skin color as a sign of inferiority. The Greeks and Ro-mans did not establish color as an obstacle to integration into society,and color was not the basis for judging a person.
In regard to immigrants, Snowden argues that black émigrés werenot excluded from the opportunities available to others of alien extrac-tion, nor were they handicapped in fundamental social relations.Rather, they were “physically and culturally assimilated: in science,philosophy, and religion,” and “color was not the basis of a widely ac-cepted theory concerning the inferiority of blacks” (1983:108). Egyp-tians, for example, saw their land as the only one that really matteredand considered outsiders to lack some elements of humanity. But “oncea foreigner came to live in Egypt, learned the language and adoptedEgyptian dress, he or she was accepted as one of ‘the people’” (Snow-den 1983:89).5
Thompson, focusing specifically on the Roman Empire, supportsSnowden’s view concerning the relative absence of color prejudice(1989:10 ff). Thompson asserts that “a black in possession of symbols ofhigh status received appropriate deference from those of lower (gen-uine or apparent) status irrespective of colour and ethnic identity or ori-gins.” This was the case “even if he happened to be passing through adistrict whose population lacked current familiarity with the sight ofblack faces.” The treatment he received depended above all “on the per-sonal status and deference-position of each of the parties in the en-counter, and there was considerable variety in the statuses and (positiveand negative) deference positions of blacks.” There were, however, fewblacks above the rank of plebeian (Thompson 1989:158–159).6
Thompson also agrees with Snowden that what “race” is today wasnot what it was in the past and so it would be wrong to apply today’s
THE IDEA OF RACE 31
assumptions to past relations (1989:10 ff).7 “Of course the notion of acollective mind precisely and exclusively linked at any given point intime with a particular skin colour (let alone the idea of an eternally fixed‘white’ or ‘black’ or ‘yellow’ mentality) is an utter absurdity” (Thomp-son 1989:8). He points out that “differences in cultural habits, and inquality and scale of material goods” were as important in determiningsocial distance as is “somatic distance” or “what is today popularlycalled ‘race.’” In our world, Thompson maintains, terms like European,whites, and blacks symbolize a particular cultural situation and powerrelationship. These symbolic assumptions were not relevant to the an-cient Romans, however, who saw the majority of the world’s white in-habitants as “savages” and “benighted barbarians.” Therefore, to theRomans, “white people” was not a meaningful sociocultural category(Thompson 1989:10 ff).8
In their review of much of the classical literature, Harris (1977),Hannaford (1996), and Bernal (1987) agree that the idea of race as weknow it today is not evident in these early works. Kinship, nationality,and cultural or religious identity had meaning then, but “skin colour initself” had “no more meaning than height or weight” (Thompson1989:8). Referring to later interpreters of these works—who, Hannaford(1996) and Bernal (1987) argue, did racialize early classical writings—Thompson says: “It is the mind of the observer that, drawing on past ex-perience, renders pigmentation and other physical traits a repository ofmessages about personal beliefs, cultural habits, and social status, andmakes these traits a focus of passionate sentiments transcending themerely aesthetic” (1989:8).
Intermarriage was not prohibited and was common (Thompson1989:40, 44, 95).9 In addition, the hypodescent rule did not exist. Rather,“in the Roman perceptual context the progeny (and even less so themore distant descendants) of an Aethiops did not necessarily fall intothe category of Aethiops: some were perceived as ‘swarthy,’ someas ‘white,’ and some as Aethiops, the classification in all cases depend-ing entirely on the individual’s physical appearance” (Thompson1989:158).
Snowden (1983) studied African blacks in northeast Africa and theSudan and the Kushites in southern Egypt during ancient times. He ex-amined meetings of blacks and whites, images, inscriptions, and litera-ture and concluded that their views were largely the result of first im-pressions and a long history of contact and relations between the an-
32 THE IDEA OF RACE

cients and long-established African nations. Blacks had first been en-countered as military men (often as part of conquering armies).Aethiops (Africans) were seen as civilization’s pioneers, astrologists,and writers and also were known to have had long-term territorial in-tegrity, material resources, and trade. “There was clear-cut respectamong Mediterranean peoples for Ethiopians and their way of life.And, above all, the ancients did not stereotype all blacks as primitivesdefective in religion and culture” (Snowden 1983:59).10 This contrastswith Americans’ first view of blacks—as slaves. Furthermore, in antiq-uity, slavery was independent of race or class, and most slaves werewhite. As Snowden (1983) put it, the ancients enslaved all conqueredpeople, whereas the moderns, only the colored races.
UNRESOLVED ISSUES
Embedded in these views of race in the past are a number of unresolvedissues. One is relative size. Snowden (1983) examined—but took issuewith—the postulate that the relatively small size of the black popula-tion at that time helped minimize the hostility toward them. He arguesthat the exact ratio of blacks to whites is not known because the ancientsdid not consider color sufficiently significant to mention it. Neverthe-less, Snowden feels that blacks were more numerous than previouslythought. The emphasis on counting “pure” Negroes, he argues, is mis-leading and tends to underestimate the number of blacks, just as suchan approach in the United States now would tend to underestimate thenumber of blacks. He also notes that blacks are often depicted in potteryand artwork, suggesting that they were more numerous. But icono-graphical evidence of blacks has been neglected.
Another issue is selectivity. Harris maintains that we have reallytwo streams of information from the classical writers: one favorable tothe people of Africa and one not favorable and that the unfavorablecharacterization has “had the greatest influence on the image and treat-ment of blacks in our own times” (1977:xx). Did the authors just citedignore the unfavorable literature? Were the classic views of peoples far-ther south in Africa more negative (in comparison with the views ofpeoples closer to the Mediterranean)?
Although the issue of whether darker-skinned groups were re-garded less or more favorably than today has not been resolved, there
THE IDEA OF RACE 33
is general agreement that the ancients referred to as Aethiopes(Africans) had a highly developed civilization and that Africans andother Europeans had substantial and influential contacts before the de-velopment of Greek civilization (see, e.g., Harris 1977: 61–62, 67–147, 89;also see pp. 5–15 for a discussion of the derivation and meanings of theterm Aethiopes).
Another issue is that many of these sources refer only indirectly toblacks or Aethiops, even though they have been the focus of the re-search on blacks in antiquity. In no texts do the blacks speak for them-selves. In addition, references to blacks are often made by those with, atbest, second-hand information or by travelers. Therefore, one wondershow reliable these analyses are for interpreting color and race attitudes.Finally, there is the problem of accuracy concerning sources like worksof fiction, scriptures, and pagan texts written from the perspective ofthe elite, who were remote from blacks (conversation with Prof. LuciusOutlaw at Haverford College).
These issues are countered by the argument that the reason thereare no texts in which blacks speak for themselves is that those peoplesreferred to as black today did not see themselves as such then, nor werethey seen as such by others. Moreover, the application of this modern-day, racialized lens to the past is problematic. An example is the Egyp-tians, who are sometimes referred to as African and therefore must be“black.” Yet Bernal (1987) asserts that because the Egyptians were geo-graphically positioned at an important trading point, their populationcontained many different physical types. This assertion leads to twoquestions: One is whether darker-skinned Egyptians held or evinced adifferent identity but did not write about it. The second is whetherEgyptians at that time saw themselves as a “black” or “nonwhite”group distinct from other groups. These issues continue to be debatedtoday.11
THE SHIFT TO A RACIALIZED PARADIGM
Regardless of how much the same or different race was in the past fromwhat it is today, a number of scholars agree that the way in which racewas conceptualized underwent a major shift, although not all agree onexactly how and when this shift began. Most believe that it was in placeby the time that routes through Asia and the New World had begun to
34 THE IDEA OF RACE
be explored (see, e.g., Bernal 1987; Hannaford 1996; Johansen 1982:84;Sanjek 1994; Shreeve 1994; Snowden 1983; Thompson 1989).12 Bernal(1987) sees this as a shift from the ancient model to the Aryan model andargues that this shift was reinforced between 1785 and 1850 by the as-cendant paradigms of progress, romanticism, and scientific racism.Also aiding this shift were the French Revolution and the consolidationof northern expansion into other continents (Bernal 1987:22 ff).
According to Thompson, this shift encompassed not merely “thejustification of the historically peculiar configuration of ‘white’ mas-ter/conqueror set against ‘coloured’ slave/subject” but also a rewritingof history that diminished and denigrated the role and contributions ofAfricans and Asians to civilization—to say nothing of those of NativeAmericans (1989:10–11). Also obscured in this process were the earlierrelations between blacks and Europeans and the earlier conceptions ofrace. Thompson estimated that the shift occurred in the eighteenth cen-tury when Europeans (at home and in their colonies) began to attachgreater significance to somatic distance than to religious and other cul-tural differences between themselves and other peoples.13 Thompson(1989) contends that in earlier times, non-Europeans were seen as “es-sentially” different but that they always believed that people of all eth-nic categories could move from one socioeconomic category to another.
Snowden contends that arguments for the “naturalness” and aboli-tion of slavery were mustered only in the New World (1983:70 ff). Be-fore this, a color association with slaves did not exist, since slaves wereof many colors, although most were European and North African(Forbes 1988:101). According to Thompson, the European outlookchanged when people became highly conscious of the distance betweenculture and technological and material power that came to separate thewhite from the nonwhite parts of the world. This was reinforced by theinstitution of all-black slavery and by European imperialism on othercontinents. This power distribution determined the world and casteinto which people were born.
Sanjek pointed out that by the 1700s, efforts were made to “fit” ex-ploited peoples into “natural” schemes that would rationalize their op-pressed position and included the devaluation of peoples of color(1994:1–17, esp. 5). A number of works have traced the emergence ofthese “scientific” racial classification efforts in western Europe and theUnited States during this period (see, e.g., Banton 1983; Barzun 1965;Bieder 1986; Freedman 1984; Gossett 1963; Gould 1981; Jordan 1968;
THE IDEA OF RACE 35

Sanjek 1994:5; Stanton 1960; Thomas 1989:29–31). Other works have cri-tiqued and disproved the results of these earlier “scientific” studies(Gould 1978, 1981; see Sanjek 1994:5 for a review of this literature).
Mixture and “Pigmentocracies”
Despite the racist paradigm that developed after the fifteenth cen-tury, people throughout the world began to interbreed, resulting in“varying social constructions” of racial identity in the United States, theCaribbean, Latin America, South Africa, and elsewhere (Sanjek 1994:4).These various constructions of racial identity were affected by the pre-dominant ideological racial paradigm of the times. Racial rankingswere understood and communicated through these paradigms and im-plemented through legal frameworks that specified racially determinedlimits to social interaction (Sanjek 1994). Later chapters analyze thesesocial formations more closely. In short, although also affected by thesame shift and therefore fundamentally racialist, the development of“race” in Latin America remained closer to earlier conceptions ofrace/ethnicity.
Governments Count “Peoples” around the World
When we examine how other countries count their populations, wefind that not all ask about “race” or “color”—indeed, only a minoritydoes. Even ethnicity has not been found to be a universal populationcharacteristic; nor is there general agreement on what constitutes eth-nicity.14 Tamayo Lott (1997; 1992) notes that a dominant theme of amajor international census conference was that ethnicity is constructeddifferently in each country—that for some race was a dimension of eth-nicity, while for others ethnicity was a dimension of race. For non-whites, race was more important than ethnicity because it representedtheir unequal power relations with Whites.
Bates et al. (1995:433–35) reviewed a nonrandom sample of recentcensuses in 45 countries. They found that tribe, nationality, linguisticgroup or dialect, district or country of birth, religion or sect, ethnicgroup, citizenship, indigenous or aboriginal origin, race, and skin colorwere among the criteria used (alone or in combination) to count popu-lations in these countries. In half of the countries, questions about race
36 THE IDEA OF RACE
and ethnicity were not asked. They also found that direct inquiriesspecifically about “race or color” were “rare” and were concentrated incountries in or near the Caribbean region (Bates et al., 1995:434). Al-though this was not a representative sample, it does indicate that manygovernments do not ask about race/ethnicity, and that different cul-tural, political, ethnic, and religious criteria are used to measure anddistinguish populations.
The data collected by the UN (United Nations 1992) also reveal agreat deal of fluidity and variability with regard to how different na-tion-states classify “race” groups in their countries. Different variablesare used as bases for group classification, e.g., ethnic nationality, race,color, language, religion, customs of dress or eating, tribe, or variouscombinations of these factors (United Nations 1980:79; 1985). Indeed, itis difficult to make international comparisons because the data gath-ered are dependent on national circumstances (which are highly vari-able) (United Nations 1980; 1985). Many countries collect data on mi-nority groups for reasons that are quite similar to those of the UnitedStates, i.e., because they are concerned with the equal participation ofall groups and the equitable distribution of benefits to all groups(United Nations 1989:30–31).
Finally, a survey of the censuses of 51 countries in the Americasover the last 40 years (Almey, Pryor, and White 1992) examined howrace and ethnicity questions were asked and found that 31% (16) ofthe countries they surveyed did not include race/ethnicity questionson their national censuses, while 68.6% (35) did. The authors alsofound that many people did not want to, or were unable to, respondto ethnic background questions. The authors concluded that these re-sults question the assumption often made that everyone has an eth-nicity. Moreover, they found that there was “no consensus on whatcriteria determines ethnicity” (Almey, Pryor, and White 1992:3).Those countries that did distinguish drew from a variety of factors indifferent combinations to determine ethnicity, e.g., language, countryof birth, residence, color, race, and religion. In addition, the studymaintained that census questions on ethnicity elicited multiple re-sponses and that these responses changed over time.15 In all threeAmericas, there was a striking fluidity and variability of race and eth-nicity between countries and over time.
Even in countries that share ostensibly similar “racial,” “cultural,”
THE IDEA OF RACE 37
or political identities, different approaches are sometimes taken. Forexample, English-speaking countries with common historical and po-litical ties, e.g., Australia, Canada, and Britain, ask very different ques-tions on their censuses. Britain, for example, has various categories ofBlacks (Caribbean and African) and Asian Indians (Bangladeshi, In-dian) (Sillitoe and White 1992; White and Pearce 1993). Australia doesnot ask about race, but has an open-ended question that asks about an-cestry and a question that asks about aboriginal descent (Cornish 1992).These countries have also changed their questions and categories overtime. The fluctuations inherent in the classification process can also beseen in the experience of other countries, which have altered their crite-ria to accommodate new populations and/or to be in accord with newpolitical regimes, e.g., Russia and Malaysia. (Statistics Canada and U.S.Bureau of the Census 1993)
Canada provides an interesting example of change and continuity.For example, it still collects data on their indigenous population andon the Métis, people who are the result of indigenous and Europeanmixing. It has also included an ethnic origin question in all but its 1891census. It recently reintroduced a race question after not having hadone in its census for decades. On its 1996 census, it referred to races as“population groups” and further clarified that its term “the visible mi-nority population” referred to those who were “non-Caucasian in raceor non-white in colour.” Finally, they added that the term populationgroup should not be confused with citizenship or nationality. Theirrace/population group question included the following detailed cate-gories, with allowance to specify more than one: White, Chinese,South Asian (e.g., East Indian, Pakistani, Punjabi, Sri Lankan), Black(e.g., African, Haitian, Jamaican, Somali), Arab/West Asian (e.g., Ar-menian, Egyptian, Iranian, Lebanese, Moroccan), Filipino, South EastAsian (e.g., Cambodian, Indonesian, Laotian, Vietnamese), LatinAmerican, Japanese, Korean, Other—Specify_____. (1996 Canadiancensus form and instructions.)
The results of these surveys suggest considerable change fromcountry to country. Consequently, “persons migrating from one coun-try to another are likely to encounter an official schema for classifyingorigin, race, or ethnicity, which is quite foreign to them.” (Bates et al1995:435) Indeed, Duany’s 1997 study comparing Dominicans that mi-grated to Puerto Rico with those that migrated to New York City pres-ents evidence for this.
38 THE IDEA OF RACE

THE SHIFTING LITERATURE ON MIXTURE IN THE
UNITED STATES
The literature on mixture in the United States also is changing. In par-ticular, the extent to which the mixture of races has been acknowledgedhas changed, and the way in which it is discussed is different as well.Unfortunately, in the United States in the past, “mixture” tended to beeither ignored or demeaned (Root 1992a, 1995). Early studies of com-munities of mixed groups tended to portray them as unfortunate or“pathetic folk of mixed ancestry who never know quite where they be-long . . . neither fish nor fowl” (Berry 1963:vii). The term used to refer tocommunities in which two or more “races” had mixed was triracial iso-lates, a term that conveyed the marginality of such groups. These com-munities, which were referred to by names such as Melungeons, BrassAnkles, Croatan, or Red Bones, were described as existing in geo-graphic isolation, having marginal status, and occurring in particulargeographic situations, for example, in “forbidding swamps or inacces-sible and barren mountain country.” There was general agreement inthis literature that the members of these communities were reluctant tobe identified as black and that they had relatively high growth rates(Berry 1963:32; Thornton 1987:210 ff).
On the level of the individual, the most prevalent image was that ofthe tragic mulatto, the result of a slave woman raped by her master(Orbe and Strother 1996). Although later research has begun to exploreinstances of white women and black men who had children together(Hodes 1997), until recently the literature generally conceived of mul-tirace persons as marginal, with “neither/nor status, cultural malad-justment, limited social assimilation, incomplete biological amalgama-tion, and pathological personalities” that were often the outcome oflabyrinthine relationships between marginality and colonialism(Williams 1992:281). Mixed-race persons were thus viewed and treatedas by-products of exploitative sexual unions between colonialists andmembers of indigenous or colonized groups (Williams 1992:281).16 Ear-lier studies of intermarriage in the United States also found a higherproportion of foreign whites and marginal whites in mixed marriages(Williamson 1984:112). But particularly during the country’s early for-mation, there must have been consensual unions in which women ofcolor exercised some power or that involved white women and men ofother races.
THE IDEA OF RACE 39
In recent years, a new paradigm has developed in which the earlierliterature is challenged and new perspectives are emphasized (Root1992b, 1995). For example, triracial isolates have been relabeled as plu-ralists, runaways, and refuseniks (Daniel 1992). Daniel maintains that “de-spite their patent Eurocentrism, these strategies . . . may be legitimatelyviewed as diverse tactics of resistance to oppression utilized by indi-viduals of African descent. While some individuals may seek to con-front oppression head-on, passers and pluralists seek to turn oppres-sion on its head by subverting the racial divide” (1992:70). He furtherargues that other ways of subverting the racial divide have included“passing,” blue vein (i.e., when the skin color is light enough to revealblue veins) societies, and the development of elite creole groups. Inaddition, the recent literature stresses “the complex realities” of mul-tiracial people, the “multiple sensibilities” that come from their havingboth insider and outsider perspectives, and their highly developed ca-pabilities to adapt “to various environments, different cultural settings,and paradoxical situations” (Williams 1992:283).
The new literature has also examined areas formerly neglected, sig-naling a new perspective on mixture. For example, scholars have stud-ied settings in which intermarriage is common, for example, Hawaii(Grant and Ogawa 1993; Labov and Jacobs 1986); the significance ofcolor differences in the African American community (Russell, Wilson,and Hall 1992); the merging of diverse racial-ethnic groups under pan-ethnic categories (Lopez and Espiritu 1993); children of mixed parent-age (Cauce et al. 1992; Field 1996; Jacobs 1992; Johnson, R. 1992; Root1992c; Taylor-Gibbs and Hines 1992; Tizard and Phoenix 1993); philo-sophical dimensions of mixture (Zack 1995); critiques (Jacobs 1992;Johnson, D. 1992; Miller 1992; Nakashim 1992; Root 1992a; Valverde1992); explorations of the applicability of conventional psychologicaltheories to mixed-race families (Stephan 1992); and the fluidity andshifting contexts of racial constructions (Gregory and Sanjek 1994).
Contributing to the changing paradigm reflected in this literature isthe increase in the numbers and types of individuals in interracial fam-ilies. In the past, it was lower-class whites who intermarried, but today,it is upper-class whites (Spickard 1989) and higher-status blacks(Kalmijn 1993) who are intermarrying.17 In addition, in the past, mixed-race children were born to black women and white men, whereas today,most are born to white women and black men (Williamson 1984:112).Recently Kalmijn (1993), analyzing 1970–1980 marriage license data in
40 THE IDEA OF RACE

thirty-three states, found that the incidence of intermarriage has risensince the 1960s, especially between high-status black males and lower-status white females. Kalmijn’s research (1993) reinforces the link ear-lier found between status and race in intermarriage (Davis 1941; Heer1966; Merton 1941; van den Berghe 1960). In other words, those minori-ties with a higher socioeconomic status marry members of the majoritywith a lower socioeconomic status, thereby exchanging one person’s“racial caste prestige” for the other’s socioeconomic prestige (Kalmijn1993:122–123). Spickard (1989:349) noted that leftist intellectuals, col-lege professors, artists, entertainers, and people with elite internationalcareers are those most likely to intermarry. Rolark, Bennett, and Harri-son’s analysis (1994) of multiracial responses on the 1990 census foundthat the number of interracial marriages rose from 0.4 percent in 1960 to2.2 percent in 1991. Two-thirds of these marriages were between blackmales and white females.18
CHANGING CLASSIFICATIONS IN THE UNITED STATES
In the United States, racial classifications have also been more variableand fluid than generally acknowledged. Definitions of race vary bystate and sometimes are regionally based, often changing over time andin response to political and legal events (Bell 1973; Davis 1992;Domínguez 1986; Haney López 1996; Schafer 1993; Williamson 1984).Davis offered an early example of these changes: in Virginia, the defini-tion of who was “white” became more and more restrictive in order tolimit intermarriage. That is, in the 1800s, a “white” person was anyonewho was less than one-quarter Negro; these people could marry otherwhites. By 1924, however, legislators prohibited anyone with “a singledrop of Negro blood” from marrying a white person (Cose 1995:70).
Although there is little awareness in everyday speech of the lack ofuniformity or cohesion that has existed or exists in state-defined race inthe United States, racial criteria are not as clear-cut or unchanging asmany believe. The U.S. government and, more specifically, the CensusBureau, which is responsible for counting people by race, do not have asingle criterion or principle to determine different races. Rather, theycurrently use several, for example, national origin, tribal affiliation andmembership, and physical characteristics (McKenney and Bennett1994:16). Moreover, these criteria are not applied in the same way to all
THE IDEA OF RACE 41
groups (Hahn 1992). For instance, whereas tribal affiliation is critical toidentifying Native Americans, it is not used at all to identify whites orblacks.
In addition, the format and terminology that the U.S. census hasused in the question on race have changed over time (Lee 1993). In somecensuses, groups have been assigned racial categories. For example,mulattoes were a racial category in the 1850, 1860, 1870, 1890, 1910, and1920 censuses. “Mexicans” were a “race” in 1930 but not before or afterthen. Finally, before 1980, “race” was generally determined and/or re-ported by the census interviewer. Since 1980, however, people havechosen their own race from a list of categories. Moreover, the way thatpeople see themselves and the way that the census takers or othersrecord their race are not always the same.
Although the public has adhered to a rather rigid belief in race as abiological fact, some census officials have come to believe that “race” ismore social than biological. Accordingly, as early as the 1950 census,“race” was explained as follows:
The concept of race, as it has been used by the Bureau of the Census, isderived from that which is commonly accepted by the general public.It does not, therefore, reflect clear-cut definitions of biological stock,and several categories obviously refer to nationalities. . . . Although itlacks scientific precision, it is doubtful whether efforts toward a more sci-entifically acceptable definition would be appreciably productive,given the conditions under which census enumerations are carriedout. (U.S. Bureau of the Census 1953:35, italics added)
Here, the census is acknowledging that “race” is a social constructionand not a scientific criterion, as the courts had earlier concluded. In ad-dition, the census now admitted the significance of geographic “con-text” or “social setting” in making racial determinations and concededthat it was difficult to classify individuals by race without sufficientnumbers of their group in the area where they were being interviewed.19
THE CONFLATION OF RACE AND ETHNICITY
More recently, the U.S. census has become aware of the overlap of raceand ethnicity, as reflected in a recent census report noting that this issue
42 THE IDEA OF RACE
should be examined further for the 2000 census (McKenney and Bennett1994:23–24). This is a significant departure from the census’s past posi-tion, treating “race and ethnicity as two separate concepts” (McKenneyand Bennett 1994:16; U.S. House Committee 1994f). The idea that “race”and “ethnicity” overlap is not new, but demographic changes (e.g., in-creasing numbers of Latinos, Asians, and mixed-race individuals) andgreater “ethnic” self-identification have brought this idea to the fore-front. In particular, it is the experience of Latinos in the United Statesthat most clearly illustrates the interrelatedness of “race” and ethnicity.
Even dictionary definitions of race reveal the overlap between raceand ethnicity. Moreover, according to Webster’s Collegiate Dictionary, thisoverlap has existed for some time. In all the editions between 1898 and1994, most definitions of “ethnic” refer to races, and some definitions of“race” sound like ethnic definitions (Rodríguez and López-Hernández1995). These definitions also have shifted over time, from a singular andnarrow biological definition of race to the inclusion of more culturaland social definitions (see table 2.1).
For example, in the first edition (1898), race is biologically definedas meaning “the descendants of a common ancestor; lineage; breed;stock” (Rodríguez and López-Hernández, 1995; Webster’s Collegiate Dic-tionary 1898:660). In 1936, “the race of doctors” is used as one exampleof “race” (Webster’s Collegiate Dictionary 1936). In 1973, “the English” iscited as an instance of “race” used as “a class or kind of people unifiedby community of interests, habits or characteristics.” This example is re-peated in the 1983 edition and appears most recently in the 1994 edition(Webster’s Collegiate Dictionary 1973:950; 1983:969; 1994:961). In sum,some definitions of “race” begin to sound like definitions of “ethnicity”or culturally distinguishable classes.
At present, primary definitions of race still refer to “a breeding stockof animal,” and secondary definitions refer to “a class or kind of indi-viduals with common characteristics, interests or habits . . . or a kind ofpeople unified by community of interests, habits, or characteristics.” Inessence, the biologically based definition of “race” as a “breeding stock”has been retained, but additional definitions have been added to in-clude other, more cultural or social definitions. The inclusion of thesebroader, somewhat overlapping definitions of race and ethnicity in acommonly used dictionary is somewhat surprising, particularly be-cause ethnicity in the United States (and in the U.S. census) has gener-ally been considered separate from race.
THE IDEA OF RACE 43
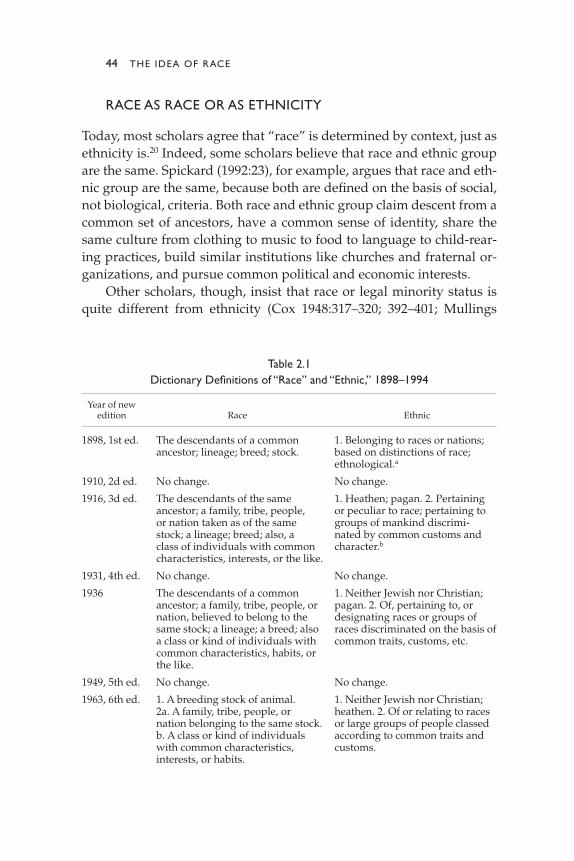
RACE AS RACE OR AS ETHNICITY
Today, most scholars agree that “race” is determined by context, just asethnicity is.20 Indeed, some scholars believe that race and ethnic groupare the same. Spickard (1992:23), for example, argues that race and eth-nic group are the same, because both are defined on the basis of social,not biological, criteria. Both race and ethnic group claim descent from acommon set of ancestors, have a common sense of identity, share thesame culture from clothing to music to food to language to child-rear-ing practices, build similar institutions like churches and fraternal or-ganizations, and pursue common political and economic interests.
Other scholars, though, insist that race or legal minority status isquite different from ethnicity (Cox 1948:317–320; 392–401; Mullings
44 THE IDEA OF RACE
Table 2.1Dictionary Definitions of “Race” and “Ethnic,” 1898–1994
Year of newedition Race Ethnic
1898, 1st ed. The descendants of a common 1. Belonging to races or nations;ancestor; lineage; breed; stock. based on distinctions of race;
ethnological.a
1910, 2d ed. No change. No change.
1916, 3d ed. The descendants of the same 1. Heathen; pagan. 2. Pertainingancestor; a family, tribe, people, or peculiar to race; pertaining toor nation taken as of the same groups of mankind discrimi-stock; a lineage; breed; also, a nated by common customs andclass of individuals with common character.bcharacteristics, interests, or the like.
1931, 4th ed. No change. No change.
1936 The descendants of a common 1. Neither Jewish nor Christian;ancestor; a family, tribe, people, or pagan. 2. Of, pertaining to, ornation, believed to belong to the designating races or groups ofsame stock; a lineage; a breed; also races discriminated on the basis ofa class or kind of individuals with common traits, customs, etc.common characteristics, habits, orthe like.
1949, 5th ed. No change. No change.
1963, 6th ed. 1. A breeding stock of animal. 1. Neither Jewish nor Christian;2a. A family, tribe, people, or heathen. 2. Of or relating to racesnation belonging to the same stock. or large groups of people classedb. A class or kind of individuals according to common traits andwith common characteristics, customs.interests, or habits.
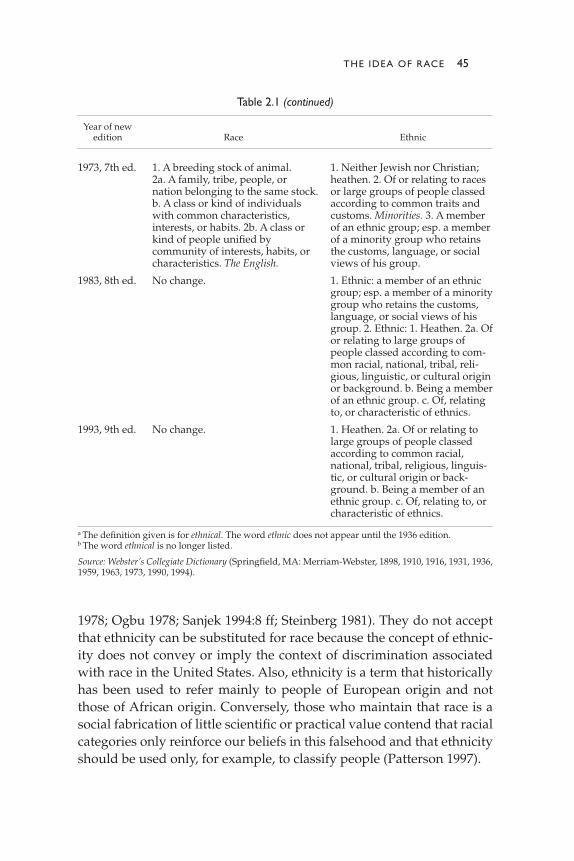
1978; Ogbu 1978; Sanjek 1994:8 ff; Steinberg 1981). They do not acceptthat ethnicity can be substituted for race because the concept of ethnic-ity does not convey or imply the context of discrimination associatedwith race in the United States. Also, ethnicity is a term that historicallyhas been used to refer mainly to people of European origin and notthose of African origin. Conversely, those who maintain that race is asocial fabrication of little scientific or practical value contend that racialcategories only reinforce our beliefs in this falsehood and that ethnicityshould be used only, for example, to classify people (Patterson 1997).
THE IDEA OF RACE 45
Table 2.1 (continued)
Year of newedition Race Ethnic
1973, 7th ed. 1. A breeding stock of animal. 1. Neither Jewish nor Christian;2a. A family, tribe, people, or heathen. 2. Of or relating to racesnation belonging to the same stock. or large groups of people classedb. A class or kind of individuals according to common traits andwith common characteristics, customs. Minorities. 3. A memberinterests, or habits. 2b. A class or of an ethnic group; esp. a memberkind of people unified by of a minority group who retainscommunity of interests, habits, or the customs, language, or socialcharacteristics. The English. views of his group.
1983, 8th ed. No change. 1. Ethnic: a member of an ethnicgroup; esp. a member of a minoritygroup who retains the customs,language, or social views of hisgroup. 2. Ethnic: 1. Heathen. 2a. Ofor relating to large groups ofpeople classed according to com-mon racial, national, tribal, reli-gious, linguistic, or cultural originor background. b. Being a memberof an ethnic group. c. Of, relatingto, or characteristic of ethnics.
1993, 9th ed. No change. 1. Heathen. 2a. Of or relating tolarge groups of people classedaccording to common racial,national, tribal, religious, linguis-tic, or cultural origin or back-ground. b. Being a member of anethnic group. c. Of, relating to, orcharacteristic of ethnics.
a The definition given is for ethnical. The word ethnic does not appear until the 1936 edition.b The word ethnical is no longer listed.
Source: Webster’s Collegiate Dictionary (Springfield, MA: Merriam-Webster, 1898, 1910, 1916, 1931, 1936,1959, 1963, 1973, 1990, 1994).
This conflation of and/or confusion between race and ethnicity hasbeen at the root of some of the positions taken throughout the UnitedStates’ history. For example, in the debate between Takaki (1994) andSchlesinger (1992), the issue was presented as follows: In the history ofthe United States, were diverse ethnic (meaning race and ethnic) groupsassimilated into one melting pot? Or is it a segmented, racialized his-tory comprising an official, articulated white history and a neglected, asyet largely unwritten, history (or histories) of not-white groups—withtwo melting pots?
At present, the issue of whether race and ethnicity are independentor overlap (and to what degree) has still not been resolved. Lee (1993)noted in her review of census categories over time that historically, raceand ethnicity have been confused. Indeed, race and ethnicity are oftendiscussed as if they were separate, somewhat independent concepts,which seems still to be the census’s official position. Hispanics, for ex-ample, are regarded as members of an ethnic group that can be of anyrace. But the recent proposal to make Hispanics a race suggests pressureto view Hispanics as a race and thereby to fold them into the UnitedStates’ racial structure. The common juxtaposition of Hispanics withgroups such as whites, blacks, and Asian and Pacific Islanders rein-forces this intention.
46 THE IDEA OF RACE

3
Stories of Self-Definition
T H E R E A S O N T H AT both Latinos and non-Latinos choose particularcategories on the census has only recently received much research at-tention (see, e.g., Elias-Olivares and Farr 1991; Kissam, Herrera, andNakamoto 1993; Martin, DeMaio, and Campanelli 1990; McKay and dela Puente 1995; Rodríguez and Cordero-Guzmán 1992; Tucker et al.1996:22–28). Even if we assume that Latinos who pick the traditionalU.S. race categories do so for the same reasons that non-Latinos do, thisstill does not explain those who do not identify with “any of the above.”
The following case studies look at why some people choose the“other race” category and how they decide on their particular “identi-ties.” Although the case studies are not meant to be representative, theyare not unusual. These personal accounts are from a sample of sixtyLatinos living mainly in the Northeast (see Rodríguez et al. 1991 for amore detailed discussion of this research project). The respondentswere selected by snowball sampling, and the researchers chose a spreadof class levels and national origins. This method ensured finding a di-verse group of Latinos willing to be interviewed at length on an issuethat is, for many, sensitive. As might be expected, given the northeastslant of the sample, 61 percent consisted of Latinos of Caribbean origin,mainly from the Dominican Republic (33%) and Puerto Rico (28%). Fivepercent were “mixed,” that is, had parents from different Spanish-speaking countries, and 1 percent had one non-Latino parent. The re-maining 34 percent came from Central and South America. Of thethirty-six women and twenty-four men, 8 percent described their back-grounds as upper or middle class, 45 percent as working class, and 15percent as lower class. The remaining 32 percent did not indicate theirclass background. One-quarter of the sample was raised in Spanish-speaking countries, but only 15 percent of the interviews were con-ducted in Spanish. All but two of the fifteen trained interviewers werebilingual and generally were members of the groups they interviewed.1
47
Most of the pre- and posttest interviews took place between 1989 and1990, but a few were conducted later. The respondents were not paidand were interviewed in a variety of home, school, and office settings,where privacy, adequate time, and relaxed comfort had been arrangedbefore the interview.
The research team and I created an extensive, detailed, bilingualquestionnaire and tested it for a year and a half. It contained 107 open-ended and structured questions and covered a wide variety of areas.The interviewers were instructed to determine the respondent’s pheno-type—as white, black, or “other”—before beginning the interview. Therespondents were asked first to fill out a duplicate of the 1980 censusquestion on race, and then they were asked to explain why they had an-swered the question as they did. The next questions were (in order ofappearance): How would you describe yourself racially? What do youconsider yourself to be: white, black, or other? What color are you:white, black, or other? How do you think North Americans see you:white, black, or other? How would you describe yourself over the tele-phone to a person who has never met you but who has arranged to meetyou in a crowded place? How would you classify, in terms of color andfeatures, the other people in your family on this (five-point) scale? Doyou think your identity has changed over time?
The case studies presented here are of persons (not using their realnames) who identified themselves as “other race.” During the inter-view, the first four described here appeared to be at ease with their“racial” identities. All four checked the “other race” category on thecensus question and supplied a Latino referent. All four viewed their“race” in different terms: three according to their Latino heritage andone according to his Latino and black heritage. Based on their pheno-types, the first was categorized as “white,” the second and third as“black,” and the fourth as “in-between.” In fact, this fourth person ex-plained that depending on the eye of the beholder, he can be white,mixed, black, or “Hispanic.”
JOSÉ PETERSON OR JP: THE HYPHENATED AMERICAN
This respondent was named José Peterson because this composite namehas both Anglo and Hispanic elements. We chose the nickname JP, withits business-tycoon connotation, because at the time of the interview, he
48 STORIES OF SELF-DEFINITION
perceived himself to be (and was understood to be) assimilating intowhite corporate America. He is single, twenty-five, and a college grad-uate working as an administrator in the arts. JP’s parents migrated fromPuerto Rico to New York when they were in their early twenties and set-tled in a section of the city with a high incidence of violent crime. JPlived here for the first eight years of his life until his parents moved toa more stable working-class area where he continues to live. His familyspeaks both Spanish and English at home, but JP says his Spanish is notgood. JP indicated that his background was working class because hisfather did manual labor. He is the fourth child in a family of five siblingsand the first to go to college.
On the census race question, JP checked “other” and specified“Puerto Rican American.” He explained that he attributed his PuertoRican heritage to his parents but that he identified as American becausehe was born in the United States. He added that he was bicultural be-cause “various aspects of both the American and Puerto Rican cultures”influenced him.
But when asked questions that he interpreted as referring to hisphysical appearance, JP answered consistently and unequivocally thathe was “white.” For example, when asked how he would racially iden-tify himself—as white, black, or other—he answered white because ofhis European (Spanish) background. He also referred to being “white”when asked about his color, how North Americans viewed him, andhow he would describe himself over the phone. He classified everyonein his family as white except for two grandmothers who, he explained,had “Indian blood.” Finally, JP was classified by the Puerto Rican inter-viewer as “white.”
When he understood the questions to be asking about his physicalappearance, JP consistently answered that he was white. But he did notfeel it necessary to explain why he did not then select the white race cat-egory. When he understood the questions to be asking about his cul-tural identity, however, he said he was a “hyphenated American.” In ef-fect, when JP answered the census question on race, he assumed thatthe categories represented other major social-cultural-racial-politicalgroups in the United States, and he supplied his own (hyphenated)group. Although he clearly saw himself as physically white, he identi-fied himself as “other (Puerto Rican–American) race.”
Even though JP identified as “other race,” his adaptation to the U.S.racial system followed the familiar immigrant assimilation model. He
STORIES OF SELF-DEFINITION 49
answered the questions in much the same way that second-generationEuropean Americans usually answered them. For example, GreekAmericans or Italian Americans would see themselves as culturally theproduct of both the old country and the United States, as JP did. But ear-lier immigrants probably would not have mentioned that their grand-mother had Indian blood.
CELIA: LATINA, BLACK,AND PROUD . . . AND NOT
AFRICAN AMERICAN
Celia was named after the salsa singer Celia Cruz because of the manysimilarities she appeared to share with her. Celia identified herself as“other race,” and on the census question, she wrote in “black HispanicPanamanian.” Celia came to the United States from Panama when shewas eighteen years old. She has four children, all over the age of seven-teen, and has been married to her husband for more than twenty-fiveyears. She rose through the ranks to become an account coordinator atthe same place where she has worked for more than twenty years. Celialived through the racial insensitivity of the 1950s, the racial awakeningof the 1960s, and the renewed racial hatreds of the 1980s. Yet she saysthat throughout the constant racial turbulence, she always knew “whoshe was.” She emphasized that she is both Hispanic and black and hasstrong roots in both identities. Celia often mentioned her love of His-panic culture and her pride in being born and raised as a Panamanian.Her feelings about the “black” portion of her self-identification areequally strong, and on the family chart, she labeled all the members ofher family as black. Her tone was unwavering on this point; her iden-tity has never changed.
Celia realized that most North Americans saw her to be like “anyother black” but noted that she felt uneasy with American-born blacks.She sensed that they strongly disliked blacks from other countries. To il-lustrate, Celia described an experience she had had at a playgroundwith two of her children when they were young. She said that when shebegan talking and a black American woman there heard her accent, thewoman verbally abused her, and so Celia left the playground. Celia is ablack Hispanic Panamanian and proud of it. But she is not a blackAmerican, and she does not see herself as black according to U.S. defi-
50 STORIES OF SELF-DEFINITION
nitions of blackness. So she did not check off the “black” category on thecensus question.
FAT JOE (LATINO)
Fat Joe (Latino) was given this name because of his two passions, hislove for his Puerto Rican culture and his love of rap music—he had beenboth a disk jockey and a rap artist. Born and raised in the suburbs ofWashington, D.C., Fat Joe was twenty-seven, recently married to anAfrican American model, temporarily working as a cab driver in At-lanta, and about to complete a master’s degree in the social scienceswhen he was interviewed in New York City. Both his parents had im-migrated to Washington in the 1960s from Puerto Rico, where both hadbeen teachers. His father had been recruited to work in a governmentagency. Fat Joe described his family and upbringing as middle class andrecalled his growing up as being filled with “good memories” and ashaving friends that he had kept despite moving from one suburbanneighborhood to another. Few Puerto Ricans lived in these neighbor-hoods; rather, they were made up mostly of other Latinos, blacks, andwhites. The main language he spoke at home was Spanish, but he andhis wife speak English. Over the years, he has frequently visited PuertoRico, but he has never lived there. At the time of this interview, Fat Joewas intending to obtain a more advanced graduate degree.
He chose the “other race” category on the census question andwrote in “black Puerto Rican.” When asked why he had answered inthis way, he first said that was how he always answered this question(about racial classification). But he then added that if it had been an of-ficial census question, he would have answered “black.” Or if the list in-cluded “Puerto Rican,” he would have marked that. He would not havechecked “Hispanic” because that category was too vague and generalfor him. His responses illustrate the significance of context to Latinos re-sponding to questions of race.
Fat Joe’s first response also indicates his strong identity as bothblack and Latino, which was repeated in subsequent questions. Whenasked how he would describe himself racially, he answered, “As aPuerto Rican of African descent.” When asked how he thought NorthAmericans saw him, he said that everybody saw him as a black
STORIES OF SELF-DEFINITION 51
American until they talked to him and found out about his back-ground. Presented with three categories, white, black, and other, hechose “black” but added that he was of a “brown” color. To him,“black” meant that it racially described his body as being of Africandescent. He said he identified as black because his ancestors werebrought over from West Africa to the Caribbean. When asked how hewould describe himself to someone over the phone, he replied,“Black, 5’10”, 220 pounds, bald head and beard.” Only when askedthe general nonracialized question of how he identified himself didhe say, “By my name.”
Fat Joe described all the members of his family, including himself,as “black” except for a maternal grandmother, whom he said was“white.” He also indicated that they all would see themselves as“black.” When asked what he felt his roots were, he answered, “PuertoRican, I guess.” He considered himself to have been “raised as a PuertoRican” but also stated that African Americans, white Americans, andtheir culture had “rubbed off me as well.” He said he could “relate” ina lot of ways, except when it came to food. The people in the southernUnited States could not understand why he could not relate to collardgreens—because he had been raised with arroz and abichuelas (rice andbeans) and pasteles.
Asked to recall experiences outside his family in which people re-acted to his race, Fat Joe said there were hundreds. For example, as asenior in high school, he was at the beach when a bunch of white guyssped by screaming “nigger.” Contrary to the experience of many Lati-nos, Fat Joe (Latino) is consistently assumed to be black and seldomanything else. Thus, only in specific contexts is he thought to be Latino.As he said, only if he is in a Latino store and reading something in Span-ish will someone speak to him in Spanish. People are always sur-prised—and doubtful—when he tells them he is Puerto Rican, for he isgenerally assumed to be any other kind of Caribbean but Puerto Rican.Although this used to bother him, he says that now that he has studiedthe history of these areas, he understands why people react this way,that there are “phenotypically more African-looking people in the Do-minican Republic and Cuba than in Puerto Rico.”
Fat Joe indicated that he has probably assumed a black identity onoccasion, noting that “if an African American refers to me as a ‘brother,’I acknowledge the background.” However, he has known others who
52 STORIES OF SELF-DEFINITION
were darker than he who would have taken offense at the reference. Hisassumption of this identity did not have an emotional impact on him—it was “just what I am.”
Fat Joe’s identity has changed over time. He has no specific mem-ory of when he first became aware of his color or of his being PuertoRican, but he assumes that he must have become aware of color whenhe first started to play with other children, when he was three or four,and of his Puerto Rican ethnicity when he brought friends home. He de-scribed the two neighborhoods where he had been raised as having fewPuerto Ricans, but he also noted that his family’s circle of friends in-cluded many Puerto Ricans. He admitted that he had changed the wayhe viewed his color, facial features, and hair texture, explaining thatwhen he was younger, he was sensitive about his more African pheno-type, even though his hair was less kinky than that of his friends. Col-orism and “joking” about “too kinky” hair seemed to be part of grow-ing up among his friends. In fact, he joked that now he would love tohave kinky hair—any kind of hair.
Fat Joe reached an important turning point in the formation of hisidentity when he started applying to college. His parents sat him downand told him that he should take advantage of the fact he was pheno-typically black and Puerto Rican. So he added his mother’s last name, aSpanish surname. He attended a large public university and believesthat he was counted as Hispanic and not as black, partly because he wasthe only one of his friends who received handouts on Hispanics. But inhigh school and college, he did not spend much time on Puerto Ricanculture; rather, he “delved into the black side of me.” He studied blackliterature and participated in African American activities. Midwaythrough college, he decided to major in African American studies andbegan to pay more attention to his Latino side. Then, when he had topick a topic for his senior thesis, he chose a connection to his PuertoRican culture. This focus in African American studies was distinctive,and he thought it would be helpful.
Fat Joe (Latino) seems to have had a variety of experiences, andwhen he was interviewed, he seemed comfortable with his identity as ablack Latino and interested in celebrating, and knowing more about,both these heritages. His feelings were echoed by the Costa Rican–bornDelina D. Pryce, who pointed out, “Being Latina and black are not mu-tually exclusive, but mutually complementary. Being black and Latina
STORIES OF SELF-DEFINITION 53
has influenced and shaped my views, my thoughts, my experiences—who I am. Never would I deny either because they’re both me. And Ilike me. All of me.”
MR.ARCO IRIS’S RAINBOW IDENTITIES
Mr. Arco Iris is yet another representative of the “other race” category.His name means “rainbow” in Spanish, and he is always addressed as“Mr.” because at sixty-two, he has a respected and established positionas a professional in the criminal justice system. Born and raised in EastHarlem and the South Bronx (predominantly black and Hispanic neigh-borhoods), he is the son of parents who migrated from Puerto Rico toNew York before World War II. He described the household in which hewas raised as Spanish speaking and lower middle class. He considershis roots to be in Harlem, for he has lived in Puerto Rico only a shorttime. Although Mr. Arco Iris is fluent in Spanish, he is more comfortablespeaking English. His wife is West Indian, and they have three children.
In response to the census race question, Mr. Arco Iris checked“other” and wrote “Puerto Rican” in the space next to it. But when an-swering “How would you describe yourself racially” and “What doyou consider yourself to be,” he stated, in both instances, “I am a mix-ture of black, white, and possibly Indian.” He noted that his racial iden-tity had changed over time. “As a child, I perceived myself as a PuertoRican and distinctly apart from black and white. But as I grew, I under-stood Puerto Rican as a mixture, and I could identify with both blacksand whites.” The way he viewed his ancestry also has changed: “Iwould have considered myself more white up to the age of nine. As Igot older, I developed a broader definition of race and acknowledgedgreater mixture.”
Mr. Arco Iris described his color as “brown” and explained thatNorth Americans tend to see him as a “brown-skinned Puerto Rican ora light-skinned black.” His interviewer described him as “notwhite/not black.” On a five-point color scale, Mr. Arco Iris labeled hismother as a one (light) and his father as a five (dark), and he identifiedhimself as a four. This was darker than the interviewer’s view of Mr.Arco Iris, as a three (intermediate in color). When asked why he char-acterized himself as darker than North Americans might see him, Mr.Arco Iris stated that “four is more biologically accurate” and further ex-
54 STORIES OF SELF-DEFINITION
plained that he identified himself as dark out of respect for and loyaltyto his brown-skinned father.
Mr. Arco Iris and others like him identify strongly with color andexpress a preference for racial diversity and mixture. They take pride inthemselves as combinations of African, European, and Native Ameri-can.2 The identification of Mr. Arco Iris’s race also varies according tothe eye of the beholder. He noted that since childhood he has been re-garded as white, black, Greek, Arab, and Asian. These many instancesof mistaken identity have prompted him, perhaps more than many oth-ers, to think about his identity. His racial identification mirrors this self-reflection, representing a unique innovation and resolution within anessentially biracial system.
These four persons, with different backgrounds, are phenotypicallywhite, black, and in-between. They emphasize not just physical but alsocultural variables. Furthermore, they are at ease with how they have re-solved their identities, even though some data gatherers thought theirresponses showed that they misunderstood or were confused by thequestion. At this point in their lives, they seemed confident and indi-cated that it was all right to be “other,” although they did not mentionthis specifically. The following two stories reflect the more conflictualand stressful dimensions of Latino identity resolution.
JOSÉ ALI: THE PRESSURE TO BE BLACK
The name José Ali is a combination of the common Latino name Joséwith Ali, borrowed from Muhammad Ali, the former heavyweightchampion. José Ali is a Dominican, twenty-four years old, single, anda full-time student at a public university. He has a part-time job in anadvertising firm where the majority of his coworkers are white. Hisparents are immigrants from the Dominican Republic. José Ali wasraised in New York and has visited the Dominican Republic onlyonce, when he was five. He lived in a predominantly Hispanic neigh-borhood until he was eight years old, and Spanish was the only lan-guage spoken at home until he was twelve. He later moved to an-other area of New York with a large African American population. Hedescribes his family as working class: his father worked in the metalgoods industry, and his mother was an office worker. He does nothave a Hispanic surname.
STORIES OF SELF-DEFINITION 55
José Ali answered “other, Hispanic” to the census race question andexplained: “By inheritance I am Hispanic. However, I identify morewith blacks because to white America, if you are my color, you are a nig-ger. I can’t change my color, and I do not wish to.” He consistently al-luded to his identification as black when answering other racial itemsin the interview, for example, “Hispanic, yet identifies as black” and “Idescribe myself as black.” When asked what the word black meant tohim, he replied, “As other people see me.” Finally, when asked, “Whydo you see yourself as black?” his answer was, “Because when I wasjumped by whites, I was not called a ‘spic,’ but I was called a ‘nigger.’”
During the interview, José Ali noted that he assumes everybody athis job believes he is black and he does not “want to burst their bubble.”He said that he goes along with their assumption as long as he is treatedwell but admitted that he accepts this identity because it would takehim too much time to explain why he is culturally not an African Amer-ican. He pointed out that “when you are seen as a certain race, you arealso seen culturally the same.” But when people assume that he is anAfrican American, they are “disregarding my own feelings. They don’task, they simply assume.” (The Dominican interviewer described himas “a stereotypically dark-skinned Latino or a light-skinned Afro-American.”)
Asked if his identity had changed over time, José Ali answered yes.“I realized that although I feel Hispanic, I was not seen as Hispanic orLatino, but as black. Now, I agree with whoever thinks I’m black. Thereis no point in trying to prove that I’m not black . . . after being practi-cally attacked by whites because of the way I look. I decided to acceptthe fact that no matter who I feel to be, I am categorized as black.”
Thus, even though José Ali says he is “other race, Hispanic,” hisresponses reveal the pressures that some Latinos feel to identify as anAmerican black. This conflict was first described in the literature onthe Puerto Rican migration (Colon 1982; Iglesias 1980).3 (It was per-haps best portrayed in Piri Thomas’s 1967 Down These Mean Streets,and it has been discussed most recently by Brady 1988, Santiago 1995,and Comas-Díaz 1996. For recent discussions of race and gender inPuerto Rico, see Barbosa 1991, Ramos Rosado 1987, and Valcarcel1994.) This imposition of the black-white racial order on Latinos sepa-rates them into “whites” and “blacks” and in the process attempts tocreate new African Americans and so-called hyphenated (European)Americans. Latinos understand this phenomenon as their being iden-
56 STORIES OF SELF-DEFINITION
tified racially but not culturally. Other Latinos in the sample felt simi-larly confused or pressured to be “white.” Consequently, today Lati-nos are pressured to be categorized according to their color ratherthan their national heritage and culture.4
VICTORIA: A CELEBRATION OF COLOR
The next case illustrates the tensions inherent in assimilation througheducation. In contrast to José Ali, Victoria first strongly assimilated into“whiteness.” Then after a period of conflict and struggle, she acknowl-edged her resentment of this assimilation and began to celebrate hercolor. She was named Victoria because she seemed to have been victo-rious in overcoming the obstacles that caused her pain and confusion.Victoria is a single, thirty-year-old Chicana graduate student who wasborn and raised in a small town on the U.S.-Mexican border. Almost allthe town’s residents are Mexican and work in the fields, although herparents do not. Her father has a working-class occupation, and hermother is a homemaker. Victoria has several sisters, and her family isProtestant. She has been to Mexico only once, when she was twenty-three, and she described this trip as consciousness raising.
During her interview, Victoria consistently placed herself in an in-termediate position, choosing “other” on the census question and spec-ifying “Hispanic.” She gave her color as “brown” and said that NorthAmericans saw her as “other,” not “white” or “black.” Even whenasked how she would describe herself over the phone to someone shehad never met (but would meet), she said she always was careful tonote her tan coloring. Even though the interviewer thought that Victo-ria could be regarded as white with a summer tan, she consistentlyidentified herself as “not white”; indeed, a nonwhite color seemed to bean important part of her racial identity. (But nonwhite was apparentlynot the same to her as black.) Victoria saw herself as Hispanic becauseshe was not white and not black and because historically she (and hergroup) had had a different relationship to those two groups.
When Victoria finished elementary school, she went to a junior highschool where she was placed on the accelerated track. Here most of herclassmates were Anglos. She describes this period as when she wentfrom being a “smart Chicana” to being a “smart white.” Most of herfriends were white, and her sisters would make fun of and mimic her
STORIES OF SELF-DEFINITION 57

“whiteness.” Victoria remembered that a group of mejicanos (Mexicans)once showed their disapproval of her hanging around with whites bycalling her a Tía Taca (the equivalent of Uncle Tom). At the white parties,Victoria said she knew that she was not a beauty because of her skincolor, so she compensated by developing a good “personality.” Herawareness of being different (and less attractive or acceptable) becauseof her skin color was so acute that when she became part of a group tra-ditionally made up of “pretty girls,” she assumed she was included be-cause she was “nice.” She also remembered that she always wanted tobe a cheerleader, but somehow this was not what Mexican girls did.
When Victoria went to the local community college, she continuedto excel academically and was very active in student government. Shealso recalled the following experience that subsequently made her feelvery ashamed: One day the dean patted her on the shoulder and toldher, “I’m so glad you’re not like the other Mexicans,” considering this acompliment. Asked how she felt about the remark, Victoria said that itmade her uncomfortable but remembered that she had looked up andsmiled.
Until she went to another college, in California, Victoria did not re-alize the significance of the dean’s remark. When she did, she first re-acted with fury at having denied her heritage and having accepted theimplication that her accomplishments were an exception to the rule. Shelater also resented what she perceived as the limitations of Mexican cul-ture. As she explained, she traveled a long road in a short time, frombeing identified as white to being proud of being Mexican to beingangry at Mexican patriarchy. In essence, Victoria saw her education as avehicle that helped her escape certain sexual and racial boundaries, butshe also felt that while doing so, she had had experiences that damagedher self-image, such as when she was treated as a credit to her race.5
Clearly, family dynamics and other antecedent factors influencehow people decide on a racial identity. Victoria is an interesting ex-ample of these dynamics. She described her family as having consid-erable physical variation and herself as the darkest one. Accordingly,she rated herself a four on the scale while giving everyone else in herfamily an average of 2.5. Although the interviews were not calculatedto elicit deep psychological motivations, it seems that Victoria’s self-described position as “the darkest in her family” may have influ-enced her drive to be high achieving and her desire to be “white.” Shesaid during her interview that she did not remember openly saying
58 STORIES OF SELF-DEFINITION

that she wanted to be “white,” that at the time she felt she was justfollowing her intellectual interests. On reflection, however, she saidthat she wanted to be white culturally and that her desire to be“white” was subconscious.
Excelling in school and being accepted by whites may have addedto the low value she felt as a dark woman. Whether her educational ac-complishment was recognized by others in her life (Latinos and non-Latinos) is unclear, because their responses were filtered through Victo-ria’s eyes. But she appears to have been praised by white officials andrejected by her more “Mexican” family and community. It also is likelythat some whites resisted or resented her efforts and that some Mexi-canos were proud of her achievements. What is perhaps most importanthere is that Victoria’s drive to achieve may have stemmed from her per-ception that she was not highly valued because she was dark. In effect,her academic achievement was compensation. Whether it was also a cryfor greater acceptance (by whites and perhaps other Latinos) we do notknow.
Another less openly acknowledged and perhaps more positive sideeffect of being the darkest in the family surfaced in Victoria’s account.She described in detail the treatment that Blanca, her “light-skinned,green-eyed sister,” received as la favorita (the favored one). Victoria re-ferred to the “privileges of color” that Blanca enjoyed and how this con-trasted with her own treatment and that of her other sisters. For exam-ple, in the division of household chores, she and her sisters always weregiven the harder, less desirable work, for example, carrying out thetrash. She also noted that even today, at family gatherings, the dark sis-ters brought the food that took hours to prepare, and la favorita broughtthe paper goods.
Victoria also noted the impact of this differential treatment on thedevelopment of her sisters. She believed that because Blanca was so“privileged,” that is, because she was protected and treated as fragileand delicada (delicate), she never developed the independence andstrength that her other, darker, sisters did. In effect, Victoria’s darker sis-ters also compensated for their skin color by developing other areas oftheir personalities and lives. According to Victoria, they knew theywould always have to struggle in life, which helped them deal with ad-versity. Blanca, however, never ventured beyond her traditional subur-ban existence, did little that was innovative or challenging, and did notdevelop the strong character of the others. According to Victoria, she
STORIES OF SELF-DEFINITION 59

was psychologically and constitutionally weaker than the others, whowere active in community and activist movements.
Victoria did not have strong negative feelings about her differentialtreatment. Instead, they seemed to be a dull dislike of the attitudes im-plicit in this behavior, that is, the depreciation of color and the fascina-tion with or glorification of European physical types. She did not ap-pear angry at Blanca. When asked about this, she explained that whenshe was growing up, family love overrode these dynamics and thatother factors also influenced her treatment, for example, age, position inthe family, and sexuality. Consequently, despite the depreciation ofdark color that Victoria perceived in her family, it did not divide thefamily, nor were the darker members excluded. Rather, color appears tohave been the basis of an implicit hierarchy that challenged those whowere darker to compensate in various ways.
Victoria’s maturation involved viewing differently both her cul-tural identity and her feelings about her color. She came to appreciatethe beauty of her darker color, and she credited Chicano men with help-ing her appreciate and celebrate her dark color.
MARIO: SELF-IDENTIFIED AND IMPUTED RACE
Mario represents another, quite different, example of the influence offamily dynamics. Mario is a common name used by both Italians andPuerto Ricans. He identified himself on the census as “other race” andwrote in “Puerto Rican.” As an infant, he was adopted and raised by aPuerto Rican couple. Biologically, however, Mario was the child of anAfrican American mother and an Italian American father. Even thoughhe is aware and proud of his black and European ancestry, he charac-terizes himself as Puerto Rican because of his immersion in the PuertoRican culture, but others not familiar with his background might iden-tify him as a black American.
For Mario, as for many others, his racial and ethnic identity is onlypartially in the eye of the beholder. Rather, to him his identity is how hehas lived rather than his biological ancestry. In his mind, his subjectiveview of his racial-ethnic identity supersedes any race classification thatothers may ascribe to him because of his appearance or his biologicalancestry. Although in our sample, subjective and external views oftenplayed off against each other, in Mario’s case, his subjective view was
60 STORIES OF SELF-DEFINITION

determinant. In the interview, he identified himself simply and solely asPuerto Rican, whereas some of the respondents in the preceding exam-ples were torn between self-identity and that imputed by others.
These case studies are examples of the various identities of those whosay they are “other race” and specify a Latino referent. Some of themeasily accept being “other,”6 but others feel the pressure to be white,black, or brown and to assume the multiple identities they sometimesdevelop. Some persons in the sample described the resolutions to thesepressures as “intense.”
As these case studies showed, racial identities change over time—for example, from white to brown or from tan to white as the respon-dents progressed from childhood to adulthood7—and according to con-text—for example, in their home, their job, or their school. Forces suchas socioeconomic class, phenotype, family, the United States’ racialstructure, and experiences in school, jobs, and social settings also areimportant determinants of racial identity. Consequently, the way inwhich race is constructed in the family, school, or society influences theway in which Latinos identify themselves and may create multipleidentities, for example, white at home and brown on the job, or viceversa.
These case studies also challenge the way in which race and racialidentity are generally defined in the United States, where phenotypeand genotype are primary and racial identity is unchanging and unam-biguous. Although all these respondents answered “other race” on thecensus question on race, many Latinos choose one of the standard U.S.race categories. But even in these situations, identity is complex. For ex-ample, in the larger sample, one of the respondents who identified her-self as “white” on the census question described herself racially as “anAmerican with Cuban blood” and stated that North Americans saw heras “Hispanic.” She also defined the term white as “the comparative colorof my skin to other groups. It is not my background, my race, my atti-tude toward others or my income.” She distinguished between herwhite skin and her culture, explaining that this is “what I appear to be”(white) to other groups. This view might be quite different from that ofnon-Latinos who identified themselves as white.
The larger sample contained even more dramatic examples show-ing that Latinos’ racial identity is complex and fluid. For example, aprofessional woman from Puerto Rico stated that she was “white” in
STORIES OF SELF-DEFINITION 61

her home and neighborhood but, because of her lower socioeconomicorigin, was “less white” in the traditional upper-class Puerto Rican fam-ily into which she had married. In the United States, where she was la-beled “Hispanic” or “Puerto Rican” because of her accent, name, andcultural style, she was “nonwhite.”
The case studies also demonstrate the resistance of many Latinosto bipolar racial classifications, despite the pressures from both insideand outside their culture. Finally, the case studies demonstrate thatLatinos’ racial identity is not just genetically determined but that itdepends on many variables, including phenotype, social class, lan-guage, phenotypic variation within the family, and neighborhood so-cialization. In addition, for Latinos, “race” is individually as well associally constructed.
A story told by one of the interviewers in the research project seemsa fitting end to this chapter, for it illustrates people’s creativity whendefining themselves in particular political and economic contexts. Theinterviewer was a young Latina, of Caribbean origin, raised in a barrioin New York City during a time when the phrase “black is beautiful”was popular. She recalled that as a child, she and her three sisters, all ofwhom were different colors, would walk down the street, arm in arm,chanting “black is beautiful,” “white is wonderful,” and “trigueña is ter-rific.” She could not remember other people’s reactions or even whetherthey (the sisters) spent much, if any, time discussing or analyzing this.But she remembered that it happened.
62 STORIES OF SELF-DEFINITION

PART I I
HISTORICAL CONSTRUCTIONS

4
Whites and Other Social Races
A S A F O R M E R census official once pointed out, decennial censusesoften reflect a country’s historical needs, and the information collectedis deemed necessary for the national interest and for the needs of smallgeographic areas (Estrada 1993:497). These “historical needs” are seendifferently by different political groups, however, and when govern-ments try to create statistical representations of its populations, theprocess is predicated on political and ideological choices. Thus the re-sulting categories generally reflect a political consensus on who is to becounted, how, and how often (Lee 1993). These categories describe thepopulation(s) from the perspective of those who have the power to se-lect them, and in turn, they influence the way that populations seethemselves.
Over time, U.S. decennial census classifications have moved to-ward a more sharply defined bipolar structure. Basically, two sociallyconstructed polarities have evolved that contain “whites” at one endand “other social races” at the other. Although each polarity has beenand continues to be fluid, this dichotomy has prevailed throughoutmost of the census’s two-hundred-year history. At various times, dif-ferent divisions are featured, for example, white, black, and mulatto orwhite, black, Chinese, and Indian. But even in these instances, the basicdichotomous structure of “whites and other social races” has been re-tained. It is this bipolar structure that groups—those not quite white orblack—have contested in the past, and it is this structure that Latinostoday resist (Halter 1993; Leonard 1992; Loewen 1971; Smith 1993).
This chapter traces the decennial censuses’ changing classificationof race. Besides some surprising changes over time, we will see the evo-lution of this bipolar structure. Among the surprises are that the U.S.Constitution did not refer to color or race when it set forth the criteriaon which the census was to be based. Rather, the initial distinctions per-tained to free or slave status and taxed Indians.
65

By 1790, however, when the first census was taken, the color termwhite was introduced, and so it was color—and not race—that becamethe primary term of classification. Color remained an essential categoryof the census for more than a century and a half and preceded race as acategory by nearly one hundred years. The concepts of color and racewere officially joined in the twentieth century and are the foundation ofthe bipolar structure that evolved.
THE EARLY CENSUSES
Because the United States of America was conceived as a democraticand representative government, its people had to be counted. In addi-tion, all the states had to agree on who was to be counted and how. The1787 Constitution of the United States established the outline of such acount in its criteria for apportionment, an immediate outcome of whichwas the structure of the census with regard to race.
According to article I, section 2, clause 3 of the U.S. Constitution(the apportionment rule), the population was to be counted every tenyears, and this became the mandate for the decennial census. The sameparagraph specifies:
Representatives and direct Taxes shall be apportioned among the sev-eral states which may be included within this Union, according totheir respective Numbers, which shall be determined by adding to thewhole Number of free Persons, including those bound to Service for aTerm of Years, and excluding Indians not taxed, three fifths of all otherPersons. (cited in Anderson 1988:9)
What is interesting about this excerpt is its vagueness. With the excep-tion of the oblique reference to Indians, “race” is not explicitly men-tioned. “Free Persons” does not specify “whites,” and persons ofAfrican descent are not directly mentioned.
Nonetheless, it is understood that “three fifths of all other Per-sons” refers to slaves, who were of African descent. That is, for appor-tionment purposes, persons in this category were to be counted asthree-fifths of a white person. In addition, indentured servants, mostof whom were from Europe, were to be counted as free persons. The
66 WHITES AND OTHER SOCIAL RACES
Constitution clearly states that untaxed Indians—most likely the ma-jority of Indians then—were not to be counted. But the implicationwas that taxed Indians would be counted. These were generally Indi-ans who lived in European settlements and were no longer affiliatedwith a tribe. They may also have included Indian women who hadmarried white men.
As Anderson noted, the apportionment rule incorporated into thecensus and the political fabric of the new nation a tradition of differen-tiating “these three great elements of the population”—the free, slave,and Indian populations (1988:12). The method used to determine ap-portionment was tantamount to deciding who was to be acknowl-edged, and how. These decisions reflected how various groups of peo-ple were viewed at that time, which groups were considered to be partof the constituent population, and which were not.
In the first census of 1790, being indentured or being a NativeAmerican did not prevent one from being counted. As long as they paidtaxes, Indians could be represented.1 Slaves, however, were not countedor represented. Thus the two main non-European components of theU.S. population were recognized in different ways. Being counted,however, was not by itself assurance of equal citizenship rights, for freewhite women were counted but could not vote, and free white menwho did not own property could not vote. But not being counted meantthat a person had no official place in society and being calculated as afraction of a free person meant that one was regarded as a different orlesser kind of person.
The Initial Reference Point
The 1790 census was taken one year after President George Wash-ington was inaugurated and included the population of the originalthirteen colonies plus the territories of Maine, Kentucky, Vermont, andTennessee (U.S. Bureau of the Census 1989:1). The questions asked thename of the head of the family and the number of persons living in eachhousehold who were free white males or free white females, both overand under sixteen years of age; all other free persons; and slaves. Thegender and age of the slaves or “other free people” were apparently notimportant (U.S. Bureau of the Census 1978:1).2 The interest in “freewhite males over the age of sixteen” reflected the need “to assess the
WHITES AND OTHER SOCIAL RACES 67
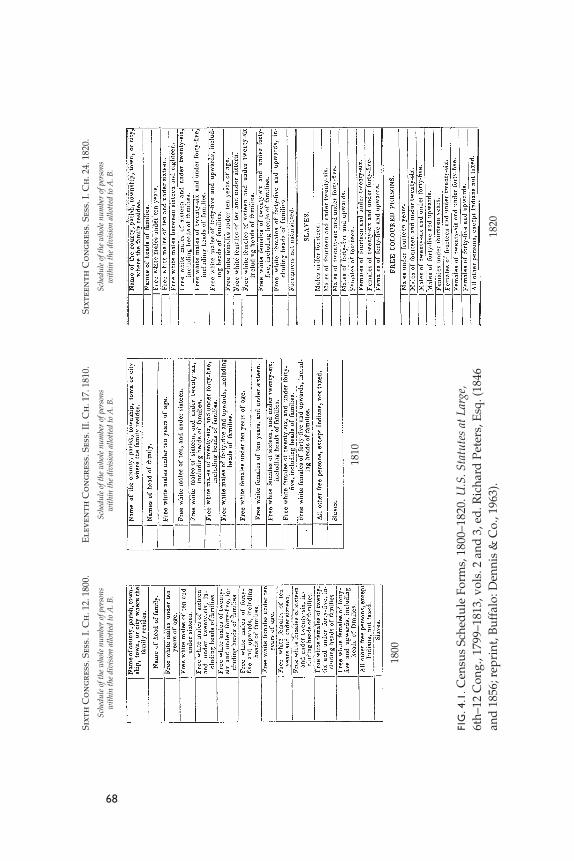
68
FIG
.4.1
.Cen
sus
Sche
dul
e Fo
rms,
180
0–18
20. U
.S. S
tatu
tes
at L
arge
,6t
h–12
Con
g., 1
799–
1813
, vol
s. 2
and
3, e
d. R
icha
rd P
eter
s, E
sq. (
1846
and
185
6; r
epri
nt, B
uffa
lo: D
enni
s &
Co.
, 196
3).
1820
1810
1800
Sixt
een
th C
on
gres
s. S
ess.
I. C
h. 2
4. 1
820.
Sche
dule
of t
he w
hole
num
ber
of p
erso
nsw
ithi
n th
e di
visi
on a
llott
ed to
A. B
.
Ele
ven
th C
on
gres
s. S
ess.
II. C
h. 1
7. 1
810.
Sche
dule
of t
he w
hole
num
ber
of p
erso
nsw
ithi
n th
e di
visi
on a
llott
ed to
A. B
.
Sixt
h C
on
gres
s. S
ess.
I. C
h. 1
2. 1
800.
Sche
dule
of t
he w
hole
num
ber
of p
erso
nsw
ithi
n th
e di
visi
on a
llott
ed to
A. B
.
country’s industrial and military potential” (U.S. Bureau of the Census1989:1).
Between the drafting of the Constitution in 1787 and the taking ofthe first census in 1790, the term white became an explicit part of thefirst category to be measured. The “slaves” category remained un-changed, and the third category was labeled “all other free persons.”Theoretically, those in political charge could have chosen another def-inition for the first category and, consequently, themselves. That is,they could have chosen “free English-speaking males over sixteen” or“free males of Christian descent” or “of European descent.” But theychose color. Having named the central category “white” gave a cen-trality and power to color that has continued throughout the historyof the census.
A Definitive Color Line
In the census’s first four decades, local authorities took the cen-sus, and so the information was not uniform. Hence, the categoriesused on the national census frequently differed from those used onthe state census. Finally in 1830, uniform census forms were intro-duced, although congressional records between 1800 and 1820 al-ready included schedules recommended for taking the census (seefigure 4.1).
By 1840, the census categories had established a number of pat-terns, and significant changes had been made as well. As table 4.1shows, between 1790 and 1840, the categories of “free whites” and“slaves” stayed the same. But in 1800 and 1810, the 1790 category “allother free persons” was changed to “all other free persons, except Indi-ans not taxed.” In 1820 it was subsumed under “free colored persons,”and in 1830 it disappeared altogether.3 The “free colored persons” cate-gory was retained in the 1840 census.
In 1830, when uniform census forms were introduced, the color linewas also more clearly established. The original color-free category “allother free persons” that appeared in the first three censuses had disap-peared. The major divisions were now more explicitly “colored”:whites, who were free, and coloreds, who were free or slave. (See ap-pendix C for a discussion of why the first three censuses did not containa color term and why the original “all other free persons” category wasreplaced by the “free colored” category.)
WHITES AND OTHER SOCIAL RACES 69
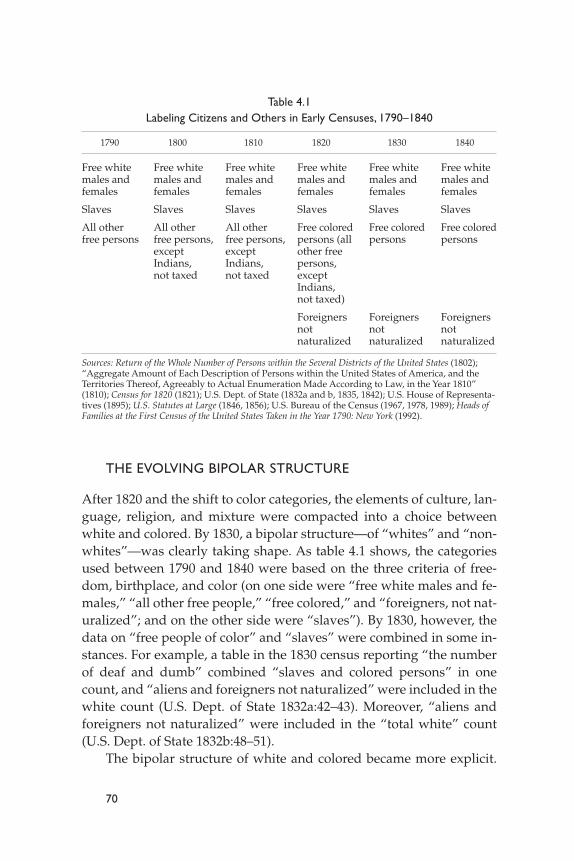
70
Table 4.1Labeling Citizens and Others in Early Censuses, 1790–1840
1790 1800 1810 1820 1830 1840
Free white Free white Free white Free white Free white Free whitemales and males and males and males and males and males andfemales females females females females females
Slaves Slaves Slaves Slaves Slaves Slaves
All other All other All other Free colored Free colored Free coloredfree persons free persons, free persons, persons (all persons persons
except except other freeIndians, Indians, persons,not taxed not taxed except
Indians,not taxed)
Foreigners Foreigners Foreignersnot not notnaturalized naturalized naturalized
Sources: Return of the Whole Number of Persons within the Several Districts of the United States (1802);“Aggregate Amount of Each Description of Persons within the United States of America, and theTerritories Thereof, Agreeably to Actual Enumeration Made According to Law, in the Year 1810”(1810); Census for 1820 (1821); U.S. Dept. of State (1832a and b, 1835, 1842); U.S. House of Representa-tives (1895); U.S. Statutes at Large (1846, 1856); U.S. Bureau of the Census (1967, 1978, 1989); Heads ofFamilies at the First Census of the United States Taken in the Year 1790: New York (1992).
THE EVOLVING BIPOLAR STRUCTURE
After 1820 and the shift to color categories, the elements of culture, lan-guage, religion, and mixture were compacted into a choice betweenwhite and colored. By 1830, a bipolar structure—of “whites” and “non-whites”—was clearly taking shape. As table 4.1 shows, the categoriesused between 1790 and 1840 were based on the three criteria of free-dom, birthplace, and color (on one side were “free white males and fe-males,” “all other free people,” “free colored,” and “foreigners, not nat-uralized”; and on the other side were “slaves”). By 1830, however, thedata on “free people of color” and “slaves” were combined in some in-stances. For example, a table in the 1830 census reporting “the numberof deaf and dumb” combined “slaves and colored persons” in onecount, and “aliens and foreigners not naturalized” were included in thewhite count (U.S. Dept. of State 1832a:42–43). Moreover, “aliens andforeigners not naturalized” were included in the “total white” count(U.S. Dept. of State 1832b:48–51).
The bipolar structure of white and colored became more explicit.
Although the censuses between 1830 and 1860 reported the numbers ofwhites, slaves, and free colored in separate columns, some of the tablescombined slaves and free colored.4 The hypodescent rule also becamemore explicit,5 and “other races” were put into the not-white or coloredcolumn. By the third decennial census (1820), whiteness was more pre-cisely defined, with the addition of the “foreigners not naturalized” cat-egory6 (see table 4.2). This category distinguished the foreign (mostlikely white and free) from the native-born white and free. Its introduc-tion suggests a distinction between the “whites” in the power structure,who were citizens by birth, and “probationary whites,” who were not(Ignatiev 1995; Jacobson 1998). In the 1850 census, the category of “freewhites” was changed to simply “whites,” which suggests that by thistime it was evident that all the people in this category were free.
As table 4.2 shows, from 1820 to 1880, census forms continued toask for “color,” but by the twentieth century, they shifted away from theterm color and substituted race. As table 4.3 indicates, “mixed” personswere counted, as there appeared to be a growing concern with measur-ing mixture more accurately, particularly after the Civil War. A categoryof “other races”—for example, Chinese, Indians, and Japanese—wasadded. Finally, more information, such as exact age, was collected for allpersons, regardless of race or color.
Beginning with the 1850 census, census takers were instructed togather information on the color, age, sex, and other characteristics ofeach slave and free colored person. This was a major shift, because pre-viously these groups had simply been listed as household members andinformation about them was not collected. Now these two “not-white”groups, the slaves and the free colored, were to be described as fully asthe white group.
Mulattoes
As table 4.3 shows, in both the free and slave populations, mulat-toes were counted for the first time in 1850, with similar proceduresused to count both the slaves and the free colored.7 According to thepublished data, mulattoes never constituted a large proportion of thetotal recorded “Negro” population—less than one-fifth in all but oneyear (Miller 1991:table 2; Williamson 1984:102). But given the difficul-ties of measuring those who attempted to “pass” and of “accurately”measuring “mulatto-ness,” these figures are not reliable.
WHITES AND OTHER SOCIAL RACES 71
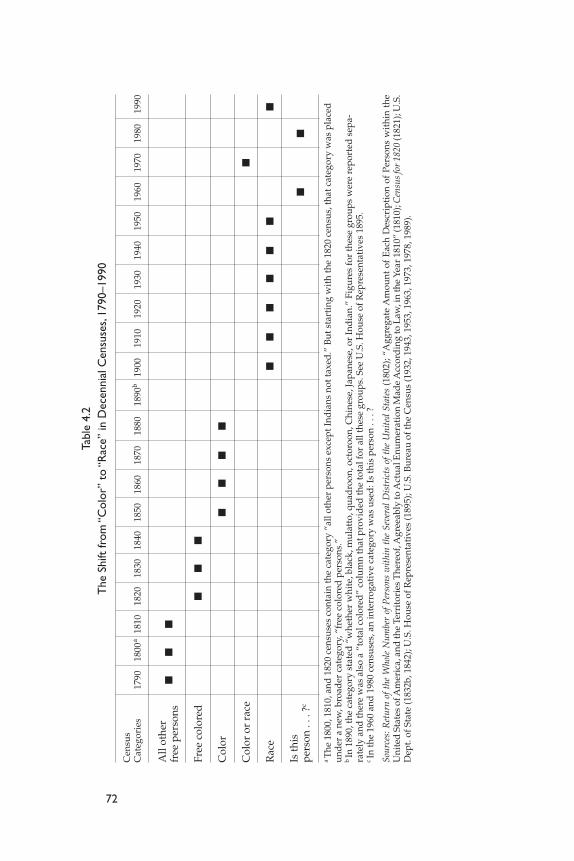
72
Tabl
e 4.
2T
he S
hift
from
“C
olor
” to
“R
ace”
in D
ecen
nial
Cen
suse
s,17
90–1
990
Cen
sus
Cat
egor
ies
1790
1800
a18
1018
2018
3018
4018
5018
6018
7018
8018
90b
1900
1910
1920
1930
1940
1950
1960
1970
1980
1990
All
othe
rfr
ee p
erso
ns■
■■
Free
col
ored
■■
■
Col
or■
■■
■
Col
or o
r ra
ce■
Rac
e■
■■
■■
■■
Is th
is■
■pe
rson
. . .
?c
aT
he 1
800,
181
0, a
nd 1
820
cens
uses
con
tain
the
cate
gory
“al
l oth
er p
erso
ns e
xcep
t Ind
ians
not
taxe
d.”
But
sta
rtin
g w
ith
the
1820
cen
sus,
that
cat
egor
y w
as p
lace
dun
der
a n
ew, b
road
er c
ateg
ory,
“fr
ee c
olor
ed p
erso
ns.”
bIn
189
0, th
e ca
tego
ry s
tate
d “
whe
ther
whi
te, b
lack
, mul
atto
, qua
dro
on, o
ctor
oon,
Chi
nese
, Jap
anes
e, o
r In
dia
n.”
Figu
res
for
thes
e gr
oups
wer
e re
port
ed s
epa-
rate
ly a
nd th
ere
was
als
o a
“tot
al c
olor
ed”
colu
mn
that
pro
vid
ed th
e to
tal f
or a
ll th
ese
grou
ps. S
ee U
.S. H
ouse
of R
epre
sent
ativ
es 1
895.
cIn
the
1960
and
198
0 ce
nsus
es, a
n in
terr
ogat
ive
cate
gory
was
use
d: I
s th
is p
erso
n . .
. ?
Sour
ces:
Ret
urn
of t
he W
hole
Num
ber
of P
erso
ns w
ithi
n th
e Se
vera
l Dis
tric
ts o
f the
Uni
ted
Stat
es(1
802)
; “A
ggre
gate
Am
ount
of
Eac
h D
escr
ipti
on o
f Pe
rson
s w
ithi
n th
eU
nite
d S
tate
s of
Am
eric
a, a
nd th
e Te
rrit
orie
s T
here
of, A
gree
ably
to A
ctua
l Enu
mer
atio
n M
ade
Acc
ord
ing
to L
aw, i
n th
e Ye
ar 1
810”
(181
0);C
ensu
s fo
r 18
20(1
821)
; U.S
.D
ept.
of S
tate
(183
2b, 1
842)
; U.S
. Hou
se o
f Rep
rese
ntat
ives
(189
5); U
.S. B
urea
u of
the
Cen
sus
(193
2, 1
943,
195
3, 1
963,
197
3, 1
978,
198
9).
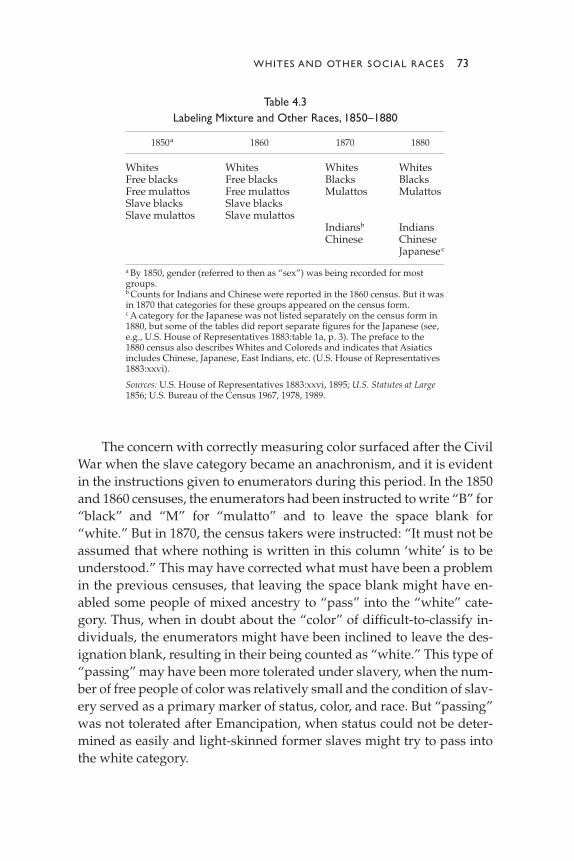
The concern with correctly measuring color surfaced after the CivilWar when the slave category became an anachronism, and it is evidentin the instructions given to enumerators during this period. In the 1850and 1860 censuses, the enumerators had been instructed to write “B” for“black” and “M” for “mulatto” and to leave the space blank for“white.” But in 1870, the census takers were instructed: “It must not beassumed that where nothing is written in this column ‘white’ is to beunderstood.” This may have corrected what must have been a problemin the previous censuses, that leaving the space blank might have en-abled some people of mixed ancestry to “pass” into the “white” cate-gory. Thus, when in doubt about the “color” of difficult-to-classify in-dividuals, the enumerators might have been inclined to leave the des-ignation blank, resulting in their being counted as “white.” This type of“passing” may have been more tolerated under slavery, when the num-ber of free people of color was relatively small and the condition of slav-ery served as a primary marker of status, color, and race. But “passing”was not tolerated after Emancipation, when status could not be deter-mined as easily and light-skinned former slaves might try to pass intothe white category.
WHITES AND OTHER SOCIAL RACES 73
Table 4.3Labeling Mixture and Other Races, 1850–1880
1850a 1860 1870 1880
Whites Whites Whites WhitesFree blacks Free blacks Blacks BlacksFree mulattos Free mulattos Mulattos MulattosSlave blacks Slave blacksSlave mulattos Slave mulattos
Indiansb IndiansChinese Chinese
Japanesec
a By 1850, gender (referred to then as “sex”) was being recorded for mostgroups.b Counts for Indians and Chinese were reported in the 1860 census. But it wasin 1870 that categories for these groups appeared on the census form.c A category for the Japanese was not listed separately on the census form in1880, but some of the tables did report separate figures for the Japanese (see,e.g., U.S. House of Representatives 1883:table 1a, p. 3). The preface to the1880 census also describes Whites and Coloreds and indicates that Asiaticsincludes Chinese, Japanese, East Indians, etc. (U.S. House of Representatives1883:xxvi).
Sources: U.S. House of Representatives 1883:xxvi, 1895; U.S. Statutes at Large1856; U.S. Bureau of the Census 1967, 1978, 1989.

The instructions for the 1870 census also advised enumerators to be“particularly careful in reporting the class Mulatto. The word is heregeneric, and includes quadroons, octoroons, and all persons having anyperceptible trace of African blood.” In addition, “Important scientificresults depend upon the correct determination of this class” (U.S. Bu-reau of the Census 1989:26). The concern with mixture (understoodmainly as the proportion of “black blood”) reached a peak in the 1890census, which counted quadroons (one-quarter “black blood”), oc-toroons (one-eighth “or any trace of black blood”), mulattoes (three-eighths to five-eighths black), and blacks (three-quarters or more)(Wright 1956:187).8 This more complicated racial scheme was unwork-able for the census, however, and it was omitted from the next one(Miller 1991:1; U.S. Census Office 1901:cxi).9
THE GROWTH OF A RACIST IDEOLOGY
The statement that “important scientific results” depended on the cor-rect classification of “mulattoes” and “blacks” suggests that the censusmay have been influenced by the then popular theories of scientificracism, which held that group differences could be “scientifically” at-tributed to “race.” It is widely believed today that in the nineteenth cen-tury, a racist ideology (based on color differences) developed thatserved the purpose of rationalizing expansion, slavery, and class differ-ences (Banton 1983; Barzun 1965; Bernal 1987; Bieder 1986; Freedman1984; Gossett 1963; Gould 1981; Johansen 1982:84; Jordan 1968; Sanjek1994:5; Snowden 1983; Stanton 1960; Thomas 1989: 29–31; Thompson1989). Horsman, who examined writings, politicians’ speeches, andnewspaper coverage of the period, found that after 1815, the “supposedlessons of the American experience hastened the collapse of Enlighten-ment theory and helped produce scientific theories of black and Indianinferiority. Along with this debasement of other races was to come anenhancement of the white race as superior ” and more explicitly statedcensus concerns about the mixing of the races (1981:115).
By 1850, the census publications already manifested a strong iden-tification with northern Europe and a desire to preserve, legitimize, ordevelop a northern European “racial” identity for the United States. Asthe 1850 census stated: “The great mass of the white population of thiscountry is of Teutonic origin, with a considerable admixture of Celtic”
74 WHITES AND OTHER SOCIAL RACES

(U.S. Secretary of the Interior 1853b:10). It was reasoned that with apredominantly northern European population, the United States wouldbe able to compete with its northern European counterparts, particu-larly since it was located on much the same latitude and had a climatesimilar to that of Europe (U.S. Secretary of the Interior 1853b:10–11).
The assumption was that climate had determined and would con-tinue to determine the evolution and progress of the different humanraces. The United States, imagined as a country whose population wasof primarily Anglo-Saxon and Teutonic origin, was seen as having aparticular destiny. According to the 1850 census,
As has been truly observed, “a race of men launched upon the tide ofexistence, have, by virtue of all the conditions, a determined course torun, which will make its own way, and fulfil its own destiny, in accor-dance with a system of laws as unalterable and supreme as thosewhich control the physical universe.” (U.S. Secretary of the Interior1853b:10)
Another assumption was that the same laws of life would prevail onboth sides of the Atlantic and “produce like results upon both conti-nents” (U.S. Secretary of the Interior 1853b:10).
To this end, the life expectancies of American whites were com-puted and compared with those in Europe and were found to be thesame for the “different branches of the Teutonic family of nations, intemperate climates.” The statistics were compared for England andMassachusetts, which are on the same latitude, and for those of Mary-land and France, which are also on the same latitude. That this type ofdiscourse should appear in the census volumes was unusual, as theytended to be rather bureaucratic and devoid of editorial positions. Thedeparture probably reflected the intensity of these issues before theCivil War.
This view of a future predestined by geographic location, the mi-gration of northern Europeans, and climatic features was undoubtedlythe basis of the concern with the growth of the “colored” population,which had evolved in more southern latitudes, in different climates,and from seemingly less advanced people. This concern also reflected aperceived threat to the numerical and political dominance of whitesand to the clear demarcation of the “races.” Whites may also havefeared that the colored (both slave and free) population might retaliate
WHITES AND OTHER SOCIAL RACES 75
against what one census publication referred to as the “governing race”(U.S. Secretary of the Interior 1852:20).
These concerns about the races’ mixing and the growth of the “col-ored” population had surfaced earlier in census documents. For exam-ple, in the preparation for the 1830 census, Congress specifically askedthe census for projections of this population’s growth and its impact onthe white population. The 1830 census accordingly prepared tablescomparing the 1790 and 1830 populations, in which it combined boththe free colored and slave populations (U.S. Dept. of State 1835). Also in1850, the census produced tables showing the ratio of increase of thewhite, free colored, and slaves since 1790 (U.S. Secretary of the Interior1853a:ix, lxxxvii).
Concern with the growth of the colored (both slave and free) pop-ulation may also have been rooted in the fear that they might retaliateagainst the “governing race” (U.S. Secretary of the Interior 1852:20).Indeed, the demographic picture of the populace at the start of thecensus taking shows that the “governing race” was not so much inthe majority (in all areas) as subsequent history texts suggested. In1790, those seen to be the military and commercial guardians of thesociety were not the overwhelming majority of the population. Freewhite males over the age of sixteen constituted only 20.7 percent ofthe total population, and slaves and “all other free persons” of allages accounted for 17.8 percent and 1.5 percent, respectively10 (Headsof Families, 1908/1992:8). The distribution of blacks by state at thistime also shows that some had very high proportions of “Negroes”(U.S. House of Representatives 1895:xcvi). For example, in 1790,blacks (both slave and free) constituted 44 percent of South Carolina,41 percent of Virginia, 36 percent of Georgia, 35 percent of Maryland,27 percent of North Carolina, 22 percent of Delaware, and 19 percentof Ohio Territory (Reference Library of Black America 1990:483). Thesedemographic findings may have fueled the concern of many aboutthe growth of the “colored” populations.
This concern continued throughout the nineteenth century. The lastcensus before the Civil War, in 1860, contained a table comparing thegrowth rates of the free colored, slave, and white populations by stateand territory between 1840 and 1850 (Kennedy 1862:table 1, p. 130) anda table showing the percentage increase of the free colored and slavepopulations between 1790 and 1850 (Kennedy 1862:17). Then, in the
76 WHITES AND OTHER SOCIAL RACES
1870, 1880, and 1890 censuses, maps were included that showed thedensity of the colored population and the proportion of colored in thetotal population (U.S. House of Representatives 1883, 1895; U.S. Secre-tary of the Interior 1872b).11
Occasionally, the census expressed concern with the growth of thecolored population. For example, when relating the history of AfricanAmericans in Maryland, a special census volume stated: “The tendencyof the colored race to encroach upon the numerical superiority of thewhite continued for twenty years longer, until, in 1810, they were foundto have attained the ratio of 38.22 in a hundred of the entire population,and the whites had declined correspondingly to 61.78” (U.S. Secretaryof the Interior 1852:20). It added that during the last twenty years, thenumber of colored had been more than double that of whites but that away had been found a way to check this growth:
There was in 1810, reason for apprehension that, in another half cen-tury, the blacks would become the preponderating race. There is rea-son to believe that this alarming tendency was checked by the intro-duction of new pursuits of industry, giving employment to a portionof the native population, which would otherwise have sought it be-yond the limits of the State and inviting into it emigrants from abroad.(U.S. Secretary of the Interior 1852:20)
These efforts, plus the encouragement of migration from Great Britainand Germany, “rescued the whites from the peril, which seemed to beimpending, of a loss of their numerical predominance” (U.S. Secretaryof the Interior 1852:20).
Free People of Color
Free people of color were a challenge to the distinction between theslave and free populations. On the one hand, they were free and there-fore perhaps entitled to the same rights as nonslaves. On the otherhand, they were of African descent and thus “not equal” to free whites.Because of the striking rise in their numbers in the two decades before1820, it became important to count them more precisely.12 (See appen-dix D for a more detailed discussion of the concerns with the growth ofthis group.)
WHITES AND OTHER SOCIAL RACES 77
Other Races
Before 1870, the census form offered a choice between two cate-gories, whites, defined in terms of the absence of any “black blood,” andcolored, defined by its presence. Then in 1870, categories for Chinese(and later Japanese) were added to the census form in response to theincreasing numbers of Asian immigrants toward the end of the nine-teenth century.13 The addition of Native Americans reflected the grow-ing recognition of their dependence on the U.S. government after theywere relocated onto reservations (Lurie 1974).
In 1870, data were gathered according to color (i.e., “whites,” “Chi-nese,” “Indian,” and “colored”—blacks and mulattoes) but were re-ported separately by group. Thus, under the heading “Color,” the enu-merators were to write in “white (W),” “black (B),” “mulatto (M),”“Chinese (C),” or “Indians (I)” (U.S. Secretary of the Interior 1872a:18,20–21; 1872b:606–609). According to Carlberg (1992), these additionsmay have been “color” groupings, but they did not represent the popu-lation referred to as “colored” at the time. In other words, they were not“colored” (as understood then), but they also were clearly not “white.”
This method of separately reporting information on the other raceswas continued in the 1880 census,14 but some tables and the introduc-tory section of the 1890 census contain a footnote that the “colored pop-ulation” included “persons of negro descent, Chinese, Japanese, andcivilized Indians” (U.S. House of Representatives 1895: 400–401, clxxx,681).15 Thus, it appeared that the earlier “white” and “colored” di-chotomy had begun evolving into a “white” and “other than white” di-chotomy, with many more categories in the “other than white” group.
Whiteness and Birthplace
The large influx of immigrants from southern and eastern Europealso led to a concern about how they were affecting the population atlarge. Hence, the 1880 census listed the proportion of “defective, de-pendent, and delinquent classes”—including the mentally disabled, re-tarded, blind, and deaf—among the native born, foreign born, whites,and colored (U.S. House of Representatives 1883:926 and table ix). Inaddition, the census gave the distribution of native-born colored in thepopulation according to state or territory of birth (U.S. House of Repre-sentatives 1883:477 and table xii).
78 WHITES AND OTHER SOCIAL RACES

This concern with immigrants and their impact on the total popu-lation was reflected again in the 1890 census, in the more elaboratemaps, charts, and sections on the foreign-born population. Maps andtables also showed the distribution in the United States of “Natives ofthe Germanic Nations” and of “Greco-Latins.” Pie charts describedchanges in the U.S. population over time in the birthplaces of native-born parents, foreign parents, foreign born, and colored. These werecalled the four “elements at each census” and were accompanied by ta-bles and discussions of the marital status of each (U.S. House of Repre-sentatives 1895:clxxix, 394, 681 ff). These reports suggest the continuingconcerns with preserving a national identity as a basically northern Eu-ropean people.
The United States’ bipolar structure was still in place at the end ofthe nineteenth century, although it had become more complex. Whiteswere clearly the central category by which others were defined—as ei-ther white or not white. Now, however, there were “other races” andalso more information on everyone. The official definition of “mulatto”was someone with any perceptible trace of African blood, which was animportant step in the development of the hypodescent rule. At thattime, the rule distinguished mulattoes from blacks, but eventually itwould define all blacks (Grieve 1996:56).
Concern with the impact of immigration on the total populationcontinued. Questions about immigrants and their racial origins werethe subject of the government’s massive Dillingham Report, whichfocused on immigration at the turn of the century (U.S. ImmigrationCommission 1911). The report used the phrase “races and peoples”throughout and entitled its ninth volume Dictionary of Races or Peo-ples. This reflected the ambiguity of whether Europe’s linguisticgroups were racial groups or peoples. Nonetheless, these variouswhite peoples were eventually accepted as Caucasian or Americanwhite (Jacobson 1998).
As the century drew to a close, questions of who was white andwho could be a citizen also began to be litigated in the courts, therebydefining whiteness even more narrowly (Haney López 1996). The per-sistence of the 1790 federal law requiring that naturalized citizens bewhite, in combination with other state laws that required one to be a cit-izen in order to own property, vote, hold office, and the like, continuedto restrict the rights of many nonwhite immigrants and to bring them tocourt in an attempt to be designated either “white” and/or a citizen.16
WHITES AND OTHER SOCIAL RACES 79
By the end of the nineteenth century, it was clear from these court casesthat a basic racial structure of whites and not-whites had evolved.
THE SECOND CENTURY
Color or Race, 1900–1940
The 1900 census dropped the 1890 attempt to count the black pop-ulation by blood quantum of one-eighth and so forth and admitted thatthese figures had been “of little value” (U.S. Census Office 1901:cxi). Butit still counted mulattoes and blacks as two subcategories of Negro,17
and a footnote to the “Negro” column indicated that this category in-cluded “all persons of Negro descent.” In addition, a special census ofNative Americans asked how much “white blood” they had (U.S. Bu-reau of the Census 1989:46). Thus, “blood” (and its effect on color) stillseemed to be an important, if not the principal, basis for establishing aperson’s color, which in turn determined his or her “race.”
The division between “white” and “other-than-white” becamemuch more clear-cut in the 1900 census. Now the data on blacks, Chi-nese, Japanese, Indians taxed, and Indians not taxed were listed underthe broader “Colored” column (U.S. Census Office 1901:483). Likewise,in the introduction to the 1900 census, whites and colored were care-fully distinguished: “From these tables it appears that the population ofthe entire area of enumeration in 1900 is composed of 66,990,788 whitepersons and 9,312,589 colored persons, the latter figure comprising . . .persons of negro descent, . . . Chinese, . . . Japanese, and . . . Indians”(U.S. Census Office 1901:cxi, numbers omitted).
Curiously, the 1900 census also added the term race to color and in-troduced the phrase color or race, which was used on all the censusforms for the next forty years (U.S. Bureau of the Census 1978, 1989).Used together, these terms reinforced the singularly physical interpreta-tion of racial construction in the United States. Nevertheless, both thewhite and other-than-white race groups were in fact social and politicalconstructions. Although the 1900 census text was clear with regard tothe division between races, it was slippery when classifying “mixed” orin-between groups. It noted, for instance, that the Croatans in NorthCarolina had been counted as white in 1890 and as Indian in 1900 (U.S.Census Office 1901:cxxiv).
80 WHITES AND OTHER SOCIAL RACES
The 1910 census addressed the issue of in-betweenness more di-rectly. It gave new instructions to the enumerators that formed the basisfor the following decennial censuses: “For all persons not falling withinone of these [race or color] classes they should write ‘Ot’ (for other). . . .For census purposes, the term ‘black’ (B) includes all persons who areevidently full-blooded negroes, while the term ‘mulatto’ (Mu) includesall other persons having some proportion or perceptible trace of negroblood” (U.S. Bureau of the Census 1989:ii, 50).
Perhaps influenced by the then politically ascendant eugenicsmovement, which also was influencing immigration legislation (Jacob-son 1998:133; Marks 1995:87 ff), the 1920 census reported in its intro-duction the “color or race” of the people in the United States’ outlyingpossessions—Guam, American Samoa, the Panama Canal Zone, theVirgin Islands, the Philippine Islands, and “Porto Rico” (Puerto Rico)and also a special census of “Porto Rico” (U.S. Dept. of Commerce, Bu-reau of the Census 1922:11). In addition, the census more explicitly de-fined blood “purity” and categories; for example, “The term ‘white’ asused in the census reports refers to persons understood to be pure-blooded whites.” Also, the “colored” applied to blacks, Indians, Chi-nese, Japanese, and “all other,” who were “Filipinos, Hindus, Koreans,Hawaiians, Malays, Siamese, and Maoris” (U.S. Dept. of Commerce,Bureau of the Census 1922:10; 1921:16).
The 1920 census still had a few tables counting mulattoes,18 but vol-ume 2 acknowledged the “considerable uncertainty” concerning “theclassification of Negroes as black and mulatto,” since the “accuracy ofthe distinction” depended largely on “the judgement and care em-ployed by the enumerators” (U.S. Dept. of Commerce, Bureau of theCensus 1921:16–17). Furthermore, figures for the same county variedgreatly depending on whether the census enumerators were black (as inthe 1910 census) or white (as in the 1920 census). Black enumeratorsfound a higher proportion of mulattoes. This awareness that racial per-ception was influenced by variables such as the interviewer’s race orthe community’s acceptance probably helped move the 1920 census toabandon the distinction between “mulatto” and “black,” thereby mov-ing the hypodescent rule to another level. Anyone with any black an-cestry was now simply “black” or “Negro.”
Paradoxically, the awareness that racial classification was sociallyconstructed, that is, influenced by personal and social factors, led to amore rigid adherence to genetic ancestry, which further reinforced the
WHITES AND OTHER SOCIAL RACES 81
hypodescent rule. The hypodescent rule also separated “race” from“ethnicity,” for regardless of ethnicity, one’s race was the main determi-nant of one’s status. Thus, race was the primary means of identification,and ethnicity was subordinated, obscured, or combined with race.
Williamson (1984), Davis (1992), and Domínguez (1986) discussedthis shift in the hypodescent rule and the involvement of both the gov-ernment’s definitions and people’s own self-affirming and self-deter-mining actions. Williamson, for example, argued that in the shift from athree- to a two-tier racial structure, a “new people” was born. A fusionof Europeans and Africans, they were proud and articulated their iden-tity most eloquently in the Harlem Renaissance of the 1920s (p. 111).When the Negro culture was embraced, “negritude” was also rede-fined, and “the beauty of all colors and features” was recognized (p. 58).Accordingly, race was redefined as based on descent and cultural defi-nitions rather than appearance. African Americans found strength intheir blackness and in that strength lay the power to stand apart fromthe world (p. 187). As Williamson noted, “The drive for a biracial soci-ety had reached its culmination . . . not by white dictation . . . but . . . bythe eager embracement of ‘blackness’ by American Negroes” (p. 3).19
The 1920 census also confirmed the hypodescent rule by specifyinghow mixed-race people were to be classified: “A person of mixed bloodis classified according to the nonwhite racial strain or, if the nonwhiteblood itself is mixed, according to his racial status as adjudged by thecommunity in which he resides.” The examples provided made clearthat “regardless of the amount of white blood,” a person with a mixtureof “Negro” or “Indian” blood was to be classified “either as an Indianor as a Negro, according to his racial status in the community in whichhe lives.” Finally, the white population was divided into four groupsdepending on birthplace (U.S. Dept. of Commerce, Bureau of the Cen-sus 1922:10).20
As table 4.4 indicates, although other categories were addedthroughout the twentieth century, the censuses taken between 1900 and1940 varied little from the basic structure established in 1920. This struc-ture contained three divisions (whites, Negroes, and other races) withina basically bipolar population of whites and colored. “Other races” in-cluded all those who were not white or Negro, for example, Japanese,Chinese, and Indians—all those who were nonwhite or colored.
There was, however, one interesting deviation. In 1930, “persons ofMexican birth or parentage who were not definitely reported as white
82 WHITES AND OTHER SOCIAL RACES
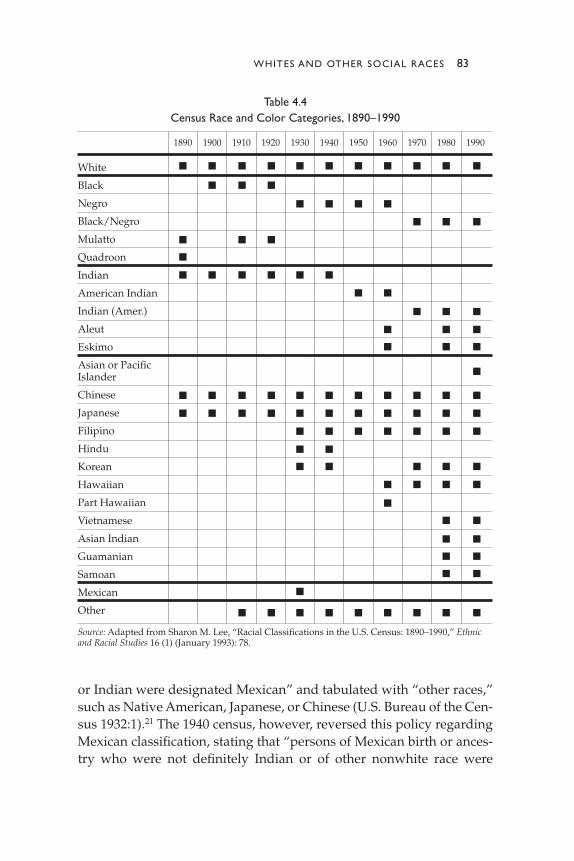
or Indian were designated Mexican” and tabulated with “other races,”such as Native American, Japanese, or Chinese (U.S. Bureau of the Cen-sus 1932:1).21 The 1940 census, however, reversed this policy regardingMexican classification, stating that “persons of Mexican birth or ances-try who were not definitely Indian or of other nonwhite race were
WHITES AND OTHER SOCIAL RACES 83
Table 4.4Census Race and Color Categories, 1890–1990
1890 1900 1910 1920 1930 1940 1950 1960 1970 1980 1990
White ■ ■ ■ ■ ■ ■ ■ ■ ■ ■ ■
Black ■ ■ ■
Negro ■ ■ ■ ■
Black/Negro ■ ■ ■
Mulatto ■ ■ ■
Quadroon ■
Indian ■ ■ ■ ■ ■ ■
American Indian ■ ■
Indian (Amer.) ■ ■ ■
Aleut ■ ■ ■
Eskimo ■ ■ ■
Asian or PacificIslander ■
Chinese ■ ■ ■ ■ ■ ■ ■ ■ ■ ■ ■
Japanese ■ ■ ■ ■ ■ ■ ■ ■ ■ ■ ■
Filipino ■ ■ ■ ■ ■ ■ ■
Hindu ■ ■
Korean ■ ■ ■ ■ ■
Hawaiian ■ ■ ■ ■
Part Hawaiian ■
Vietnamese ■ ■
Asian Indian ■ ■
Guamanian ■ ■
Samoan ■ ■
Mexican ■
Other ■ ■ ■ ■ ■ ■ ■ ■ ■
Source: Adapted from Sharon M. Lee, “Racial Classifications in the U.S. Census: 1890–1990,” Ethnicand Racial Studies 16 (1) (January 1993): 78.

returned as white” (U.S. Bureau of the Census 1943:3). Thus, within adecade, Mexicans were shifted from their own “Mexican” category tobeing included in the “white” category—unless they appeared to cen-sus interviewers to be “definitely Indian or of other Nonwhite races”(U.S. Bureau of the Census 1943:3; see table 4.4).
Fluctuating Labels, 1950–1990
Until 1940, “color or race” was consistently used as a label to de-scribe groups, but in the second half of the century, this practicechanged. As table 4.2 shows, in 1950, the census form used only “race.”In both 1960 and 1980, it simply asked, “Is this person . . . ?” and pro-vided a list of categories.22 In 1970, it was “color or race,” and in 1990, itwas again “race.” As this book goes to press, the question in the 2000census will be, “What is this person’s race?” and in a major departurefrom the census’s two-hundred-year history, more than one responsewill be allowed.
After World War II, the census first tried to explain the concept ofrace, and the 1950 census admitted that the concept lacked scientificprecision and was based on public opinion (U.S. Bureau of the Census1953:35). The census also recognized the importance of context in de-termining race: “Experience has shown that reasonably adequate iden-tification of the smaller ‘racial’ groups is made in areas where they arerelatively numerous but that representatives of such groups may bemisclassified in areas where they are rare” (U.S. Bureau of the Census1953:35). Similar admonitions were repeated in the 1960 census (U.S.Bureau of the Census 1963:xx).23 These questions mirrored the scientificand international community’s broader questioning of the concept ofrace, in the wake of the atrocities committed during World War II in thename of racial purity (see UNESCO 1952).
The question of “who was black” in the United States also was ex-amined more closely and was found to have different answers in dif-ferent states. In the years leading up to the 1954 Brown v. Board of Edu-cation decision outlawing segregation in the public schools, it was evi-dent that legal definitions of a “black” person varied as well. As HaneyLópez (1996:118–119) noted, some states used a broad “one-drop” rule;for example, in Alabama and Arkansas, anyone with one drop of Negroblood was black. Texas used the “all persons of mixed blood descendedfrom negro ancestry” standard. Tennessee followed the same rule but
84 WHITES AND OTHER SOCIAL RACES
included mestizos; it defined “blacks in terms of mulattos, mestizos, andtheir descendants, having any blood of the African race in their veins.”A number of states—Florida, Indiana, Missouri, Nebraska, North Car-olina, South Carolina, and North Dakota—followed a more precise andsimple one-eighth rule, and Oregon had a one-quarter rule. Utah lawused a similar blood-quantum approach that distinguished among mu-lattoes, quadroons, and octoroons.
Other states relied on what could be established. For example,Georgia referred to “ascertainable” nonwhite blood. Kentucky relied ona combination of any “appreciable admixture of Black ancestry and aone-sixteenth rule.” Louisiana adopted an “appreciable mixture ofnegro blood” standard, and Mississippi combined an “appreciableamount of Negro blood” and a one-eighth rule. Maryland used a “per-son of negro descent to the third generation” test. Interestingly, Okla-homa, the home of many resettled Indian nations, referred to “all per-sons of African descent,” adding that the “term ‘white race’ shall in-clude all other persons,” which suggests that Native Americans andothers were now “white.” Virginia appeared to differentiate black Indi-ans from blacks when it defined blacks as those in whom there was “as-certainable any Negro blood: with not more than one-sixteenth nativeAmerican ancestry.”
By 1970, the census appears to have begun departing from what itadmitted was a very unscientific, contextually dependent, and opinion-based approach and shifted to a self-classification of race. Although thecensus forms as a whole were still administered by census takers, the1970 census noted that information on race was “obtained primarilythrough self-enumeration” and that respondents self-classified them-selves “according to the race with which they identify themselves”(U.S. Bureau of the Census 1973:5).24 By 1980, census forms weremailed, and the recipients chose their race from the categories supplied.Self-classification continued in the 1990 and 2000 censuses.
THE LONG ROAD TO TODAY
From our current vantage point, it may seem surprising that through-out the census’s two-hundred-year history, color and not race has usu-ally been the term of reference. “Race” appeared on the census formonly at the start of the twentieth century when it was included with
WHITES AND OTHER SOCIAL RACES 85

“color” on the 1900 census. It was not until 1950 that “race” appearedby itself. In contrast, “color” was in the census legislation from its in-ception. Thus “color” was an integral characteristic of the census, per-sisting for more than 150 years in census forms, introductions, and in-structions to census takers25 (U.S. Bureau of the Census 1978, 1989).
Why was the term color retained for so long on the census? It mighthave been inertia or a reflection of the then commonly used term coloredpeople. Is the concept of color still commonly accepted today, eventhough the term has been discontinued officially? Finally, is the historyor legacy of this concept connected to the fairly recent introduction ofthe term people of color? This term is used, particularly in academia, todefine or unite what are, in effect, “other social races.”
The category that we think of today as “race” has undergone sev-eral transformations. Nonetheless, many people believe that racial clas-sifications are static and biologically based. These views were encour-aged by the government’s policy requiring individuals to choose onlyone category to identify themselves, which reinforced the impressionand myth of “pure” races (Lee 1993). Since these categories were basedon supposed color differences, census classifications also reinforced apresumable biological basis for what were really social distinctions anddefinitions. According to Lee (1993), the concepts of race and ethnicityhave been confused as well, viewing what are in effect “social group-ings” as biological races. This view began to change in 1950 with thecensus’s tacit admission that “race” is not a scientific concept but that itis often socially determined. This view has continued to change, and thebasic bipolar, hierarchical racial construction is being challenged as theresult of a series of events, such as increased and more diverse immi-gration, greater intermarriage, more global and intense economic com-petition, new scientific and technical discoveries, changes in the socioe-conomic positions of “other social races,” and new views of race.
86 WHITES AND OTHER SOCIAL RACES

5
The Shifting Color Line
D E S P I T E T H E OV E R A R C H I N G bipolar structure that emerges fromour review of census documents, there is and has probably always beena great deal of heterogeneity within the two polarities. Moreover, thelines between the two have not always been definite but have fluctu-ated. For example, some individuals and groups in the “other socialraces” have occasionally been classified as “white,” and mixed-racepersons have always blurred the boundaries of these socially con-structed polarities. Some people and groups have tried to alter theirclassification, and the census itself has changed the labels it uses to de-scribe various groups.
Among the groups that have legally contested their racial classifi-cation or had it changed are Filipinos, Afghans, Chinese, Japanese, Ko-reans, Syrians, Burmese, Mexicans, Hawaiians, Native Americans, andcertain mixtures (Haney López 1996). Sometimes the rulings regardingtheir racial status have been both curious and conflicting. For example,the 1854 case of People v. Hall ruled that Chinese immigrants in Califor-nia were “generically ‘Indians,’” and the 1893 case of Saito v. U.S. ruledthat Japanese immigrants were “Mongolian” (Almaguer 1994:10). Ar-menians were first classified as “Asiatic” until a federal court ruled in1909 that they were white (Haney López 1996:130–131; Takaki 1994:15).
This chapter focuses on the changes in the census classifications ofNative Americans, African Americans, Asian Indians, and Hispanics.These groups’ experiences are a good illustration of the shifts in racialplacement and labeling by the census over time, the groups’ challengesof their racial classification, and the influence of political factors onracial classification. In particular, the experiences of Native Americans,African Americans, and Asian Indians illustrate the historical relation-ship between challenges to racial classification and the awarding of cit-izenship. The Hispanic experience—although less contentious in thisregard—nonetheless highlights the extent to which “mixture” has been
87

perceived as problematic for full U.S. citizenship. All groups exemplifythe historical difficulty that the census has had dealing with mixtureand with groups who have not fit neatly into discrete categories ofcolor. Finally, these groups’ experiences underscore the extent to whichclassifications have been influenced by, and have influenced, politicalconsiderations.
NATIVE AMERICANS
The generic term used to refer to those peoples present when Euro-peans first arrived in North America has been modified only slightlyover the last one hundred years (see table 4.4). This vastly diverse set ofmultilingual, multicultural peoples were first misnamed “Indians” byChristopher Columbus, who thought that he had reached India. It is alabel that persists even today, although Native Americans is preferred.This persistence is perhaps reflective of the tendencies in this country’sracial structure to ignore differences among those classified as “notwhite.” Although the census did distinguish between “domesticated”or taxed Indians, referred to tribes in an “advanced state of civilization”who owned slaves (Kennedy 1862:11), and described blood quantum,the name used to describe the group as a whole has tended to stay thesame.
From 1860, when the census first counted untaxed Indians, to 1940,Native Americans were simply “Indians”; for the next twenty years,they were “American Indians”; and then between 1970 and 1990, theywere listed as “Indians (Amer.).” In the 2000 census, the category isAmerican Indian or Alaska Native. The censuses have always collectedtribal identification but only occasionally have reported it.
The U.S. Constitution states that taxed Indians are to be counted asequal to “whites” for apportionment purposes. Thus, Native Americansmay have first been counted as white—if they paid taxes. Then when allIndians were first counted separately in the 1860 census, they were clas-sified as a not-white, not-Negro group within the “other races” cate-gory, along with the Chinese.1 Beginning in 1970, they have been listed,along with Eskimos and Aleuts, in their own “Native American Indian”race category.
The Constitution does mention taxed Indians. The fact that the fed-eral government did not report taxed Indians separately led to the as-
88 THE SHIFTING COLOR LINE

sumption that taxed Indians had been included in the white counts. Alater census showed that this was the practice: “A few domesticated ortaxed Indians” had been earlier “included in the tables of the whites”(U.S. Secretary of the Interior 1853b:ix). The 1790 census form for NewHampshire, however, showed that taxed Indians were included in its“free colored” column, not in the “white” column (U.S. Bureau of theCensus 1967, 1989:276). It is not clear how these taxed Indians fromNew Hampshire were reported in the national figures. But this NewHampshire census suggests that how taxed Indians were counted inthese earlier censuses varied by locality. Very likely, how taxed Indianswere counted was determined by factors such as phenotype, the extentto which they had assimilated and/or intermarried, and how muchwealth and property they had acquired.
Eventually, the category of “taxed Indian” ceased to have any“practical relevance” and became “an anachronism” (Pevar 1983:155).In 1935, the U.S. Supreme Court ruled that all Indians were subject tofederal taxation (Superintendent v. Commissioner), and in 1940, for ap-portionment purposes, all Indians were included in the total number ofpersons (Clemence 1981). Although some Native Americans still are nottaxed (those on reservations do not pay federal taxes), the census haslong ceased to distinguish between those taxed and untaxed.
Of greater importance perhaps, from our present-day perspective,is that untaxed Indians were not counted. The 1850 census contained thefirst estimate of untaxed Indians (De Bow 1854a:41, 1854b), and the 1860census also included figures on Indians (Kennedy 1862:134–135). Butnot until 1870 was there a serious attempt to count such Indians, inorder to measure the country’s “true population” (U.S. Secretary of theInterior 1872a:22).2 By 1890, the census reported that there were moreuntaxed Indians (189,447) than taxed (84,160) (U.S. House of Represen-tatives 1895:cxxiv). The 1900 census was the first to classify systemati-cally all Indians residing in the United States, taxed and untaxed.
In addition to the early differentiation between taxed and untaxedIndians, Native Americans were also separated according to bloodquantum. In the 1860 census, for example, “half-breeds” were listedseparately from Indians. Again, how they were counted on the locallevel varied. In Wisconsin and in New Mexico Territory, they were tab-ulated both separately and in the white column, whereas in California,half-breeds and Chinese were listed separately under the white column(Kennedy 1862:134–135).
THE SHIFTING COLOR LINE 89

By 1870, the census admitted that “Indians” had intermixed to theextent that there were few persons of “pure Indian race”3 (U.S. Secre-tary of the Interior 1872a:19). Consequently, the census wondered howhalf-breeds should be classified racially. It began by defining the term aspopularly understood, that is, as including “persons with any percepti-ble trace of Indian blood, whether mixed with white or with negrostock” (U.S. Secretary of the Interior 1872a:19). It then asked: “Shall theybe regarded as following the condition of the father or of the mother?Or, again, shall they be classified with respect to the superior or to theinferior blood?” (U.S. Secretary of the Interior 1872a:19).
Although the census clearly regarded Indians as a different raceand half-breeds as having both “superior” (white) and “inferior” (In-dian) blood, it stated that the criteria applied to “the former slave pop-ulation” should not be applied to Indians (U.S. Secretary of the Interior1872a:19).4 Curiously, the census finally chose a socially dependent cri-terion that classified half-breeds as white if they lived with whites andhad the “habits of life” and “methods of industry” of whites. But if theylived in Indian communities, they were to be classified as Indian.5 Thisapproach was referred to as the “most logical and least cumbersometreatment of the subject,” especially if the census was “to trace andrecord all the varieties of this race” and considering the “small and fast-decreasing numbers” (U.S. Secretary of the Interior 1872a:19). Thus, al-though Native Americans were referred to as a race, the hypodescentrule was not strictly applied to them because behavior and communityrecognition were considered in determining the race of half-breeds.6
In chapter 4, we discussed the censuses’ difficulty—especially to-ward the end of the nineteenth century—ascertaining the extent towhich persons of African descent were “mixed.” The censuses alsowanted to gauge the extent of Indians’ “white” or “black” blood. Ac-cordingly, in 1890, the census questioned Native Americans living onreservations about this (Thornton 1987:217), and as noted earlier, the1900 special census of American Indians asked them how much “whiteblood” they had (U.S. Bureau of the Census 1989:46). The census usedthe amount of “Indian blood” as a basis not just for counting Indiansbut also for awarding treaty rights and defining identity. Wilson(1992:108–125) and Jaimes (1994:41–61) maintain that gauging this so-called blood quantum has had a deleterious effect on Native Americansand is at variance with the Indians’ own definitions of themselves. AsWilson noted, this blood quantum criterion imposes “non-Indian racial
90 THE SHIFTING COLOR LINE
(and racist) assumptions onto Native American thinking.”7 Before theEuropeans arrived, people intermarried across tribes but did not usethe concepts of “half-“ and “quarter-breeds” or blood quantum (Wilson1992:109, 116). Nonetheless, this blood quantum approach has di-vided—and continues to divide—the Native American community, asindividuals debate what it is to be “Indian” and who is more “Indian,”based on that person’s perceived blood quantum (Jaimes 1994).8
AFRICAN AMERICANS
The census history of African-descent persons is similar in some waysto that of Native Americans. Both were subdivided into two groups—one into free and slave and the other into taxed and untaxed. Initially,the “free colored” and the “taxed Indians” were small groups that werebetween whites and their respective unfree and untaxed groups interms of rights of citizenship. In addition, blood quantum was used inboth cases to subdivide and classify the groups. Finally, in both cases,one generic term was applied to all persons regardless of their highlydiverse cultural and linguistic backgrounds. But the two broad groupsalso had some important differences.
Most persons of African descent were first counted in a categorythat referred to their state of enforced lifetime bondage, that is, as“slaves” and thus as three-fifths of a person. Even within this categorythey were counted not as individuals but as part of a household. Thisclassification reflected their legal status as “property.” For example, thedata might show that the Henderson household contained one whitemale over sixteen years of age and one white female over sixteen, fourchildren of different sexes, and five slaves. The gender and age of slaveswere not reported separately until 1820, and other information was notavailable until 1840, when each slave was given a number (names werenot listed). In 1820, a separate “free colored persons” category was in-troduced and retained until slavery was abolished.
Both slave and free African Americans were subdivided accordingto their mixed heritage. Between 1850 and 1920, they could be either“black” or “mulatto,” and in 1890, smaller fractions of “black blood”were requested.
In contrast to Native Americans, the generic term used by the cen-sus to refer to persons of African descent did change substantially over
THE SHIFTING COLOR LINE 91
time. In the early censuses, the category used was “black.” Later, thecategory “Negro” was used, and it included both “blacks” and “mulat-toes.” Then between 1930 and 1960, the category Negro was used by it-self. Beginning in 1970, the category “black or Negro” was used, and inthe 2000 census, the category is “black, African Am., or Negro.” The in-clusion of “African American” is significant, for it is the first time thegroup has been given a label that suggests geographic origin ratherthan color or race. Only one other contemporary race term does notrefer specifically to geographic origin, the “white” census category.
BIRTHRIGHT, CITIZENSHIP, AND COLOR
Citizenship is related to the question of classification, for in the UnitedStates, classification as white meant that a person could be a citizen bybirthright or as a result of naturalization. Although the states had theright to restrict citizenship, they could not grant it to nonwhites.
Citizenship is perhaps a society’s most basic and significant defini-tion of rights and equality. Although the U.S. Constitution does not ex-plicitly define citizenship, it does give Congress the power to naturalizealiens. One of the first laws that Congress passed was the Naturaliza-tion Law of 1790, which required that naturalized citizens be white.Thus, almost from the nation’s inception, the general outlines of citi-zenship were in place: a white person who was born in the UnitedStates was automatically considered a citizen and, if foreign born, couldbecome a citizen. For a nonwhite person, however, citizenship was nota birthright, and a nonwhite, foreign-born person was prohibited bylaw from becoming a citizen.
Consequently, neither African Americans nor Native Americansborn in the United States could automatically become citizens. Al-though the path to full citizenship was different for Native Americansand African Americans, for both groups, citizenship was initially givento those in between, that is, to free people of color and to taxed Indians.A number of scholars have argued that these in-between groups did notenjoy a full citizenship status equal to that of whites; rather, it was a sec-ond-class citizenship status that was given to (and sometimes with-drawn from) them (see, e.g., Aptheker 1968; Fishel and Quarles 1970;Franklin 1967; Kettner 1978).
92 THE SHIFTING COLOR LINE
Native Americans
The relationship of the Native American nations to the new UnitedStates government changed over time. In the colonial period, govern-ment officials dealt with independent and unconquered tribes on thefringes of the white settlements as “sovereign political communities.”After 1776, “the central government assumed primary authority overIndian affairs—or at least over tribes outside the boundaries of existingstates” (Kettner 1978:288, 291).9 Since Native Americans were part ofthese sovereign political nations, they were initially seen to be “aliens”and not citizens. Furthermore, the naturalization laws that allowed Eu-ropean “aliens” to become citizens excluded Indians.
Some “Indians,” however, did become citizens in accordance withtheir “individual circumstances.” This meant that some de-tribalizedIndians were absorbed into the white population as citizens. Others ne-gotiated separate agreements and relationships with the British monar-chy, the different colonial governments, or, later, the U.S. governmentthrough their tribal governments. The extent of this “absorption” is notwell documented. Kettner, for example, cites one source that found in-creasingly “separate and unequal treatment of Plymouth’s Indians”and not absorption. But many were undoubtedly absorbed as they in-termarried and as white settlements gradually took over their landsand their status as tribes or sovereign political entities was challenged(Kettner 1978:289–299).
During the nineteenth century, this early status of “sovereign na-tions” gradually eroded (Johansen 1982; Lurie 1974). In 1831, the U.S.Supreme Court rejected the Cherokee Nation’s argument that it consti-tuted a “foreign state” in the sense in which this was understood in theU.S. Constitution. In Cherokee Nation v. Georgia, the Court argued that In-dian nations were “domestic dependent nations” occupying a “state ofpupilage.” According to Kettner (1978), this domestic, dependent na-tion status ultimately served the purposes of those who wished tomaintain control over the Indians without fully incorporating them intothe community of citizens. Being “domestic” allowed for the extensionof white laws over the Indian nations, for as “nations,” they were notgiven citizenship or protection.10
The federal courts and executive branch concurred in excludingtribes and tribal members from citizenship. Even after the passage of
THE SHIFTING COLOR LINE 93

the Fourteenth Amendment, which granted citizenship to all ex-slaves,the federal courts continued to rule against birthright citizenship forNative Americans. Instead, they were deemed to be perpetual inhabi-tants with few rights—not citizens. Finally, in the Dred Scott case of 1857(also important to determining the citizenship status of African Ameri-cans in the mid-nineteenth century), the Supreme Court argued that In-dians were “aliens incapable of qualifying for naturalization because ofthe naturalization law’s color restrictions” (Kettner 1978:294–296).11
Nevertheless, despite the federal courts’ decisions and the natural-ization laws restricting citizenship to free white immigrants during thenineteenth century, a number of treaties and statutes considered award-ing citizenship to Native Americans under certain conditions. For ex-ample, the Cherokee treaties of 1817 and 1819 provided for land grantsto heads of families “who may wish to become citizens of the UnitedStates” (Kettner 1978:292). Unfortunately, citizenship granted in thisway eroded tribal landownership systems and often led to “the de-struction of the tribal organization and government” (Kettner1978:293). After the removal of the Cherokees to Oklahoma in the 1830s,North Carolina agreed to consider in the same way as other citizensthose Cherokees who remained. Other examples are the treaties withthe Delawares in 1778, which envisioned the admission of a separate In-dian state as part of the Articles of Confederation, and the Cherokeetreaties of 1785 and 1835, which raised the possibility of congressionalrepresentation. However, neither of these last two provisions ever tookeffect (Kettner 1978:291, 294).
It is not known how many Indians became citizens through treatiesand by breaking relations with their tribes, but the commissioner of In-dian affairs reported in 1891 that before 1887, only 3,072 Indians hadbeen admitted to citizenship through such treaties and congressionalacts (Kettner 1978:293). With the Dawes Act of 1887, however, thesenumbers increased dramatically. This act admitted to citizenship thoseIndians who severed their relationship with their tribe and acceptedgrants of land in severalty. (It also resulted in the destruction of muchcommunal tribal ownership.) Additional legislation raised the numbersfurther; for example, an 1888 law allowed both Indian women whomarried citizens and Indians who enlisted to fight in World War I to be-come citizens. By the time the act to make all Native Americans citizenswas passed in 1924, two-thirds of them had already been admitted tocitizenship through these acts and treaties (Kettner 1978:300).
94 THE SHIFTING COLOR LINE
African Americans
Whereas the question of citizenship for Native Americans was amoot issue by those who saw Indians as belonging to (or having alle-giance to and citizenship in) another “nation”—albeit a domestic, de-pendent one—individual African Americans did not have allegiance toa comparable foreign organization. Moreover, before Emancipation,most African Americans were slaves, who were neither aliens nor citi-zens but property. Kettner suggested this was a legal convenience, for ifslaves could be seen as property, “judges could avoid fitting them intoestablished categories of membership or non-membership” (1978:301).
Immediately after the American Revolution, there were moves to-ward manumission, and during the first decades of the nineteenth cen-tury, slavery declined in the North, and the federal government for-mally outlawed it. But in the South, the rapid rise of cotton productionand the continued fear of an ever-expanding black population led to areversal of these early antislavery tendencies. Consequently, by the1830s, local laws in the South became primary, and federal laws, sec-ondary. Slavery and noncitizenship thus remained sanctioned by law inthe Southern states and by the federal government’s policy of compro-mise and withdrawal (Kettner 1978:302, 311).
The phrasing of the issue of slavery and citizenship before the CivilWar shows how entrenched slavery had become in some areas. Thequestion at that time was not whether free Negroes were citizens butwhether their status was that of a former slave or a free person, that is,whether they were property or persons. Those who held that they wereproperty argued that the manumission of slaves was an individual mas-ter’s decision; therefore, the state could not bestow citizenship. Since itwas the master’s right to relinquish ownership of his property, his prop-erty did not have the right to be a citizen, regardless of whether he orshe was a slave or an ex-slave. Thus, from this perspective, even freeNegroes were property, but without owners to command them.
In time, Southern states such as Tennessee and North Carolina re-treated from these explicitly dehumanizing stands and emphasizedmore active discrimination against free blacks and mulattoes as indica-tion of their separate status as a “degraded race” or a “third class.” Incircular fashion, they cited the discrimination as justification for theircontinued separate (and consequently discriminatory) treatment ofblacks with regard to citizenship rights. Similar arguments were used in
THE SHIFTING COLOR LINE 95
the U.S. Supreme Court in the Dred Scott case. In contrast, the Northerncourts favored citizenship for free Negroes, but they also supported dis-criminatory legislation for them (Kettner 1978:315, 320).
The issue of native-born free Negroes raised other questions. Oneconcerned gradations of rank within citizenship status—did free Ne-groes have second-class status? Another question was whether thestates could adopt a definition of citizenship that differed from that ofthe federal government. The latter question was particularly relevant tothe acquisition of new territories. If a slave moved with his master to aterritory or state where slavery was not legal, was he still a slave there?When he returned? These issues came to a head in the Dred Scott case.
Dred Scott, a slave in Missouri, was taken by his master to a non-slave territory for a number of years. When Scott returned to Missouri,he sued for his freedom in the state courts. When he lost his case, he ap-pealed to the federal courts, which would hear cases only when the lit-igants were “citizens of different states.” (During this period, the statestill determined citizenship.) Thus, the first question was whether DredScott was a citizen of Missouri. The U.S. Supreme Court (with the ma-jority of its justices from the South) decided that he was not a citizen be-cause he was a Negro and that residence in a free state or territory didnot result in a slave’s emancipation. The language used by the Court inthis case was particularly inflammatory. One justice referred to Negroesas “natural-born subjects” and “not citizens.” In rendering the Court’sdecision, Chief Justice Roger B. Taney stated:
In the opinion of the court, the legislation and histories of the times,and the language used in the Declaration of Independence, show, thatneither the class of persons who had been imported as slaves, nor theirdescendants, whether they had become free or not, were then ac-knowledged as a part of the people, nor intended to be included in thegeneral words used in that memorable instrument. (Dred Scott v. JohnF. A. Sandford 60 U.S. 393, 10 [1856])
Justice Taney added that blacks had been “regarded as beings of an in-ferior order, and altogether unfit to associate with the white race, eitherin social or political relations.” Moreover, they were seen to be “so farinferior, that they had no rights which the white man was bound to re-spect.” The rationale for not granting citizenship rights was the pre-vailing condition of such people. Justice Taney noted, “Indeed when we
96 THE SHIFTING COLOR LINE

look to the condition of this race in the several States at the time, it is im-possible to believe that these rights and privileges were intended to beextended to them” (Dred Scott v. John F. A. Sandford, 60 U.S. 393, 10, 13[1856]). He concluded that “the negro might justly and lawfully be re-duced to slavery for his benefit” (cited in Blaustein and Zangrando1968:162).
Some scholars have cited the Dred Scott decision as “the most far-reaching judicial statement of the nineteenth century” with regard torace relations and as “the case that set the stage for the Civil War”(Blaustein and Zangrando 1968:146). The case clarified in 1857 the na-tional status of both slaves and free Negroes. Justice Taney referred tothe Constitution to justify his decision, which, he said, differentiatedbetween “the citizen race, who formed and held the Government, andthe African race, which they held in subjection and slavery, and gov-erned at their own pleasure” (Dred Scott v. John F. A. Sandford, 60 U.S.393, 17 [1856]). In essence, those of the African race, whether slave orfree, were never intended to be citizens. Rather, the citizen race wasthe white race.
Only after the Civil War and the passage of the Fourteenth Amend-ment was the principle of birthright citizenship finally affirmed forAfrican Americans. The 1790 legislation was amended in 1870 to permitthe naturalization of “persons of African nativity” and “persons ofAfrican descent” (Kettner 1978:331, 345). Native Americans had to waituntil 1924 for legislation to make them citizens, and both groups are stillstruggling for equal rights.
For Native Americans, the price of citizenship was the surrender oftheir tribal lands, tribal relationships, and tribal culture. For AfricanAmericans, citizenship was granted initially by local regulations oragreements, which were replaced much later by federal policies. In bothcases, the federal policies differed from those for Europeans, and morerestrictive local policies and needs often drove more restrictive federalpolicies. In both cases, the citizenship status of those in between—thatis, taxed Indians and free people of color—often varied and was am-biguous. In some states, they could be citizens, but in others, they couldnot. In addition, the type of rights they had varied by state and changedover time in some states (Kettner 1978:301). The status and rights oftaxed Indians and free blacks were also undoubtedly related to wealth,property ownership, intermarriage, phenotype, and acculturation. Fi-nally, in both cases, these in-between groups disappeared.
THE SHIFTING COLOR LINE 97
Given that their own rights to equality were often challenged, it isinteresting that both Native Americans and free people of color ownedslaves, in the Americas and in Africa. Some scholars argue that it was adifferent type of slavery. The traditional servitude that existed inAfrican feudal society before the onset of the European slave trade didinclude people with virtually no freedom, but with few exceptions,“servants were regarded as human beings and not chattel. They couldmarry, own property, maintain their family unity, freely worship theirgod, and sometimes they became military commanders and evenrulers.” This kind of servitude is “not to be confused with Americanslavery in which the slave was regarded as chattel, and in some casesdefined as property” (Harris 1972:73). Among the indigenous peoplesof North America, slaves were often captives of war and could be In-dian, white, or black.
Only a few free people of color in the United States owned slaves,but a number of Indian nations did keep numerous slaves. Indeed, the1860 census devoted a section to Indian slavery, and tables in its ap-pendix listed the number of slaves held by “Indian tribes west ofArkansas, comprising the Choctaw, Cherokee, Creek, and Chickasawnations” (Kennedy 1862:10–11). These were southeastern tribes that hadbeen removed from slave-owning states and been resettled, mainly inOklahoma. (The census acknowledged that these groups were but a“small portion of the Indian tribes within the territory of the UnitedStates” [U.S. Secretary of the Interior 1853b:11].) The census calculatedthat slaves formed about 12.5 percent of the total Indian population inthese nations12 (U.S. Secretary of the Interior 1853b:11).
Some scholars contend that slavery among Indians and free peopleof color differed from that among European-descended peoples. TheCherokee Nation, for example, had early been a “haven for escapedblack men,” who often served as English-language “interpreters forfull-blooded masters.” Some also taught the Cherokees how to cultivatethe soil (Strickland 1975:79, 82). The Cherokees eventually promulgatedlaws similar to those of the states in which they resided. The lawstended to favor the Cherokees’ planter class, but they were “at suchvariance with the needs and expectations of the majority of the tribethat the laws were widely ignored” (Strickland 1975:83). Initially, theCherokees’ regulations regarding slavery resembled “more closely[those for] tenant farmers or hired servants, with little restriction on pri-vate life but a clear separation between the red and black races.” As
98 THE SHIFTING COLOR LINE

“plantation agriculture began to emerge, the role of the slave began toconform more closely to that of blacks in the southern cotton king-doms” (Strickland 1975:79–80). Legal restrictions on slaves were bor-rowed from those of Alabama and Georgia. However, the “evidenceclearly demonstrates that most of these restrictions were ignored” andthat agricultural crops were shared, slaves were allowed to keep gunsand were educated, and it was not uncommon for them “to possesshorses, cattle and swine” (Strickland 1975:81–82). There is mention of“only one minor slave uprising” (Strickland 1975:84). Slavery variedamong the Indian nations, for example, some intermarried to a greaterdegree and had fewer slaves, and the Seminoles—who had also been“transplanted from slaveholding states”—had no slaves and intermar-ried with ex-slaves (Katz 1986; Kennedy 1862:11).
The majority of free people of color had a personal interest in theirslaves. For example, they might have been married to a slave; the slavesmight have been the children of a free father; or they might have been“close friends who by law would have to leave the state if freed” (Fisheland Quarles 1970:128). In some instances, large numbers of slaves wereowned just for economic benefit (Fishel and Quarles 1970; Franklin1967:224 ff). Many free people of color also protested slavery andhelped slaves escape through their benevolent societies, schools,churches, and the abolitionist movement (Aptheker 1968; Du Bois1972:235–272; Fishel and Quarles 1970:128–132; Foner 1964; Rawick1972:109–113; Rose 1965).
Asian Indians
How individuals or groups are classified by their government isrelatively unimportant if the rights of all members of the society aretruly equal, regardless of race, color, ethnicity, class, or gender. It is onlybecause these rights, practices, and privileges have not been equal inthe United States that such classifications have become important.13 Aswe have seen, census categories have reflected, sustained, and, in somecases, established certain power relations because of the rights associ-ated with being classified as white in the United States. The extent towhich this has been the case is illustrated by the example of immigrantsfrom Asia who, for 162 years could not become citizens (and thereforecould not own land) in some states. The federal government’s 1790 nat-uralization law specified that only persons classified as free “white”
THE SHIFTING COLOR LINE 99
immigrants could become naturalized citizens (Kettner 1978:331, 345;Leonard 1992; Takaki 1994).14
The fluctuating racial classification of Asian Indians is an inter-esting example of both the extent to which racial definitions and clas-sifications can change and the role of political factors in influencingracial classifications. In some censuses, Asian Indians were countedas “white” and in others as “other race.” In the 1910 census, for exam-ple, Asian Indians were counted and classified as “other race,” but afootnote explained that “pure blood hindus” were ethnically whiteand had been so declared in several naturalization cases, but, it con-tinued, in the popular conception they were not seen as “white.”Consequently, they were included in the 1910 census with the “otherraces” category, along with the Chinese, Japanese, Filipinos, and oth-ers (Jensen 1988:252).
A 1923 Supreme Court case involving Asian Indians used the samereasoning. Bhagat Singh Thind v. U.S. 261US204 concerned the questionof whether Asian Indians were “white” and therefore eligible for citi-zenship. The Court concluded that although scientific and linguistic ev-idence indicated that Asian Indians were Caucasian, the common un-derstanding of people in the United States was that “white” meant Eu-ropean and Caucasian, not just Caucasian. Accordingly, at leastsixty-five Asian Indians were denaturalized between 1923 and 1927(Haney López 1996:91).
In effect, the 1923 Supreme Court’s decision legitimized the gov-ernment’s refusal to accept scientific definitions of race and to opt in-stead for a definition of race that was more socially acceptable at thetime. The “race” of Asian Indians could be defined in two ways: onewas seen to be scientific, and the other was based on what it wasbelieved “the common man” thought. It was the second one thatcounted.
In making this decision, the Court reversed the position it hadtaken just a year earlier. In Ozawa v. United States (1922), a Japanese im-migrant contended that since the color of his skin was white—indeed,whiter than that of many white persons—he should be classified as“white.” The Court then unanimously ruled that “the words ‘white per-son’ are synonymous with the words ‘a person of the Caucasian race’”(cited in Haney López 1996:85). Thind thus used this ruling to arguethat since he was a Caucasian, he was therefore white and eligible forcitizenship. However, the Supreme Court’s decision on Thind made
100 THE SHIFTING COLOR LINE
clear that “white” was what people believed it to be—or, as the Courtargued, “what the common man thought” (Haney López 1996:107). Inessence, race was socially determined.
Subsequent census classifications of Asian Indians reflected theCourt’s decision. The 1930 and 1940 censuses included a separate“Hindu” category (see table 4.3). Curiously, Asian Indians who wereMuslim or Christian were placed with Hindus in the “Hindu” category.Their racial classification at the local level varied, depending on theirskin coloring, the county, and the observer classifying them. For exam-ple, during this period, clerks issuing marriage licenses to Punjabis inCalifornia sometimes wrote “brown,” sometimes “black,” and some-times “white” for the Punjabi grooms (Leonard 1992:68).15
Toward the middle of the twentieth century, as India and Pakistanmoved toward independence, politics influenced racial classification.In 1945/46, after extensive lobbying by Asian Indians, legislation waspassed enabling them to become citizens.16 It was after this time thattheir classification as “white” commenced.17 Indians were subsequentlycounted as white in the census until 1980, when a separate “Asian In-dian” category was created. In 1990, Asian Indians became a subcate-gory under the generic “Asian and Pacific Islanders” (API) category. Inthe 2000 census, they are listed along with other groups from Asia or thePacific Islands but without the pan-ethnic API label.18
Thus, Asian Indians have progressed from being an undefinedracial category to being “other race”—that is, Caucasian but not white“in the common understanding” (or not European white)—to being“legally white,” to being listed as their own “Hindu” race categorywithout a generic label or group, to being part of the “Asian and PacificIslander” race group, to again being listed as a race along with otherAsian and Pacific Islander groups but not under this generic label.
Hispanics
The classification of Hispanics has also fluctuated in the U.S. cen-sus, not just because of “racial” classification changes, but also becausethe cultural criteria, such as language, surname, and “origin,” to deter-mine Hispanicity have changed.19 As noted in chapter 4, the 1930 cen-sus created a “Mexican” category for the race question (see table 4.3).Thus, in 1930, first- and second-generation Mexicans were of the “Mex-ican race” unless they were determined by the (usually white) census
THE SHIFTING COLOR LINE 101

interviewer to be definitely white, Negro, Indian, Chinese, or Japanese.Those in the Mexican category were considered part of “other races”along with groups such as the Japanese, Chinese, and Native Ameri-cans. In 1940, the census dropped the Mexican category and stated thatall Mexicans were to be reported as “white” unless they were deter-mined by the census interviewer to be “definitely Indian or of otherNonwhite races” (U.S. Bureau of the Census 1943:3).20 So Mexicansmoved from being Mexican unless determined otherwise in the 1930census to being white unless determined otherwise in the 1940 census.
This criterion, established in 1940, was also applied to other His-panics who immigrated to the United States in greater numbers afterWorld War II—for example, Puerto Ricans in the late 1940s and 1950s,Cubans during the 1960s, and Dominicans and Central and SouthAmericans in the late 1960s and 1970s. Accordingly, in the 1960 census,the instructions for determining race or color by observation directedthat “Puerto Ricans, Mexicans, or other persons of Latin descent wouldbe classified as ‘white’ unless they were definitely Negro, Indian, orsome other race” (U.S. Bureau of the Census, 1989:78). In the 1970 cen-sus, enumerators asked respondents to choose a category for race. If therespondents wrote in, for instance, “Mexican” or “Puerto Rican,” theenumerators moved them according to their appearance into the racialcategories listed (Lee 1993). Consequently, before 1980, most Hispanicswere classified as white.21 But in 1980 and 1990, when mail-back ques-tionnaires were instituted, Hispanics were permitted to classify them-selves, and they reported a variety of racial and ethnic groups.
With regard to the changing cultural criteria used to define Hispan-ics, in 1940 the census used a linguistic definition to determine who wasHispanic, and “persons of Spanish mother tongue” were reported.22 Inthe 1950 and 1960 censuses, the language criterion was replaced by“persons of Spanish surname.” In the 1970 census, in response to pres-sure from the Hispanic community for a Hispanic self-identifier(Choldin 1986), a subgroup of individuals were asked “about their ‘ori-gin,’” and respondents could choose among several Hispanic originslisted on the questionnaire (U.S. Bureau of the Census 1993c). (As thenext chapter explains, political factors also played a role in the decisionto include a Hispanic identifier in the 100 percent count of the 1980 cen-sus.) Thus, between 1940 and 1970, Hispanics were counted accordingto three different cultural criteria, linguistic (1940), surname (1950 and1960), and origin (1970).
102 THE SHIFTING COLOR LINE

In sum, over time, both various cultural criteria and various racialclassifications were used to classify Hispanics. In 1930, Mexicans werea “race” within the “other races” category unless the census interviewerdetermined they were white, black, or Native American. Between 1940and 1970, Mexicans and other Latinos were “white” unless they clearlyappeared to be Indian or Negro,23 and between 1980 and 2000, theycould be “of any race” they chose. In the 2000 census, the format usedto count Hispanics is essentially what it was in 1990, except that thequestion about whether or not a person is Hispanic comes before therace question.
In contrast to the other groups discussed in this chapter, citizenshipissues for Hispanics have been more a matter of defining citizenshipthan of securing it. Perhaps somewhat incongruously, citizenship wasgranted to many Spanish-speaking persons as a result of the treatiessigned after the United States invaded Florida, the Southwest, andPuerto Rico. Many questions, however, have been raised about whetherthis citizenship by conquest was an equivalent or a second-class citi-zenship, whether legal repression occurred after conquest, and whetherthis citizenship included cultural citizenship, that is, the right to speakSpanish and maintain one’s culture (Acuña 1988; Cabranes 1979; Floresand Benmayor 1997:1–23; Hernández 1997).
The legal case of Rodríguez, a “pure-blooded Mexican” who ap-plied to become a naturalized citizen illustrates the ambivalence andtenuousness attached to this citizenship by conquest, particularly inregard to “color.” Although a Texas court granted Rodríguez’s re-quest in 1897 to be granted citizenship because of the treaties’ exis-tence, it also remarked that “if the strict scientific classification of theanthropologist should be adopted, he would probably not be classedas white” (cited in Haney López 1996:61). This decision and whether“a person of [Mexican] descent may be naturalized in the UnitedStates” were later questioned in the courts (Haney López 1996:242, n.37). Thus, although the Texas court did allow a “pure-blooded Mexi-can” to naturalize, in rendering its judgment, it reinforced the moregeneral rule that color was still a bar to citizenship for nonwhitessuch as the Chinese and Japanese.
Although the census never tried to measure specific mixturesamong Hispanics, the changing instructions to enumerators regardinghow they were to classify Mexicans and the current census position thatHispanics can be of any race suggest that Hispanics are at least a mixed
THE SHIFTING COLOR LINE 103

lot. But are they a mixed lot in the same way that the United States as awhole is a mixed lot, or are they seen as mixing a lot? Horsman(1981:chaps. 11, 12, 13) argues the latter, maintaining that Americanssaw Mexicans as less fit because they had intermarried so much with In-dians and thus were not capable of governing the southwestern territo-ries. Although such a perspective can be seen to justify the expansion ofthe United States into the Southwest, some academics believe that thisperspective also influenced how all Latin Americans were viewed.
For example, Hayes-Bautista and Chapa contended that with thepromulgation of the Monroe Doctrine and the rise of Manifest Destiny,Latin Americans were racialized into a homogenous group (of Latinos)that transcended the boundaries of Latin American nations. In essence,with the annexation of other people and the incorporation of foreignterritories, racial identification replaced national identification, and the“conquered race” was relegated to a lower social class level than that ofthe “conquering race.” With Latin Americans continually cast as per-sons belonging to a less advanced and different race, the confusion ofrace for nationality continued. Hayes-Bautista and Chapa believe thatthe general North American public assumes that the “race” of LatinAmericans is a reality and that it is the antithesis of the civilized UnitedStates population (1987:62–63).
Whether Latin Americans were racialized into a Latino group dur-ing the nineteenth century or later has not been resolved. What is clearis that political factors have been important to the definitions of both cit-izenship and racial classification in the United States. It is also clear thatMexicans and other Latinos have confounded, and continue to con-found, the bipolar structure that evolved in the United States. In part,the reason is that they do not fit easily into the bipolar structure—nor insome cases do they wish to be—because of their varying phenotypes,mixture, and perspectives on race. Hispanics, perhaps more than othergroups, best illustrate the permeability and shifting lines of the bipolarstructure.
RACE IN REAL LIFE, THE ACADEMY, AND THE CENSUS
Historically, there have been many shifts in racial classification (Ander-son 1988; Forbes 1988; Lee 1993), even though the general impression isthat the concept of “race” has been unequivocal and unchanging in the
104 THE SHIFTING COLOR LINE

United States. As a recent extensive review of this subject pointed out,there is a “widespread popular perspective that race is biologically de-termined and permanent and that ethnicity is culturally determinedand equally permanent” (Edmonston, Goldstein, and Tamayo Lott1996:18). Yet a primary perspective in the social sciences now views raceand ethnicity as social constructions. Indeed, Almaguer holds that it hasbecome “axiomatic in sociological research to view racial categories associohistorical constructs whose meanings vary widely over time andspace” (1994:9).24
This contrast between the popular and the academic perspectivesof race is apparent at a time when the significance of racial classificationhas shifted. In the past, nonwhite petitioners to the courts often ar-gued—as did Plessy in Plessy v. Ferguson—that they should be classifiedas “white” so that they could be given the rights of whites. Thus, raceand ethnic definitions were often ways of excluding individuals fromequal membership in the society. More recently, defining groups hasbeen a way of including them and ensuring that particular groups arenot discriminated against. But whether race and ethnic classificationsare used to include or to exclude groups, the basic bipolar structure—that of whites and other social races—has prevailed. Nonetheless, thosein between have always been more dialectically engaged—individuallyand as groups—in contesting, resisting, rejecting, ignoring, transform-ing, or being transformed by census categories than is generally be-lieved and than census documents might indicate. Indeed, these cen-sus-based historical analyses may project a smoother sense of historythan what the lived experience has perhaps been. The reason is that inaddition to being labeled by the census (and by others in more casualsituations), individuals also identify themselves racially and ethnicallyfor reasons of pride and to express group affiliation, and these self-clas-sifications may differ in meaning as well as in actual terminology fromthose used by the census for both these in-between groups and othergroups.
THE SHIFTING COLOR LINE 105
6
Race in the Americas
I N L AT I N A M E R I C A and the United States, Europeans, Africans,Asians, and indigenous peoples mixed and produced “new people.”1
Few people, however, would deny that the population stew in theUnited States is quite different from that in Latin America. Indeed, anumber of scholars have noted the difference between the processes ofracial formation in the north and the south (Degler 1959; Denton andMassey 1989; Ginorio 1979; Harris et al. 1993; Petrullo 1947:16; Pitt-Rivers 1975; Rodríguez and Cordero-Guzmán 1992; Wade 1985; Wagley1965). Snowden argues that the concept of “race” in Latin America issimilar to that of the ancient peoples in the areas surrounding theMediterranean (1983:97), and others contend that in Latin America,“race” is more like a “social race” or an ethnicity (Pitt-Rivers 1975; Wa-gley 1965).
However, the concept of race in Latin America has been quite dif-ferent from the ancient view, in that it also implies a “pigmentocracy,”a racist paradigm in which honor, status, and prestige are signaled byskin color and phenotype. The whiter one’s skin and the more Euro-pean looking one is, the greater is one’s claim to honor and privilege.Conversely, the darker one’s skin is, the more closely associated one iswith African and Amerindian peoples—that is, the conquered and thelaborers.2 The recent literature has highlighted this difference and con-sequently stressed the similarities in this regard between racial forma-tion in the United States and Latin America.
POLARITIES ALONG THE NORTH-SOUTH AXIS
Latin America is a very large and extremely heterogeneous area. For avariety of reasons, studies of race by North Americans have usuallyfocused on just a few regions—for example, Brazil, the Spanish
106
Caribbean, and Mexico.3 Consequently, the following generalizationsmust be read with a number of provisos in mind. First, not all LatinAmerican countries have been adequately researched. Second, much ofwhat is reviewed here was written in English and thus does not coverthe literature written in Spanish or Portuguese that is not well known inthe United States. Third, even the Spanish and Portuguese studies maynot accurately incorporate or even consider the views of the less edu-cated or nonelite. Finally, at present, travel, communications, and theexchange of peoples and goods between Latin America and the UnitedStates are at all-time highs and are expected to increase in this era ofglobal transformation. Because race is a social construct, it has been andwill continue to be influenced by these changes.
Table 6.1 indicates the broad differences found in the literature. Thefirst of these four major differences between the north and south is thetendency in Latin America to see “race” as a social-racial constructionand in the United States to see it as a genealogical concept. In the Span-ish Caribbean and Latin America, ancestral “blood” is only one variabledetermining one’s race. Moreover, race is not necessarily passed downfrom generation to generation, as is implicit in a system based on hy-podescent or genetic inheritance. In the Spanish Caribbean, the parentsof a white child may be black or an intermediate shade. Accordingly, inthe Caribbean and Latin America, phenotype is often viewed as an “in-dividual marker,” whereas in the United States it is a group marker de-termining one’s reference group (Wright 1994). Of course, in almost allLatin American countries, certain phenotypes are associated with par-ticular linguistic or social/cultural groups, with cultural types, and/orwith stereotypes, for example, the tall Otavalo Andean Indians ofEcuador and the African-descended people of the Chocó in Colombia(see Arocha 1998 for an interesting analysis of the relationship of the lat-ter to issues of inclusion in Colombia).
A second, related, dimension is that race is not always based on justcolor. Other physical and social characteristics, such as facial features,hair texture, social class, dress, personality, education, linguistic iden-tity, cultural modes of behavior, relation of the referent to the speaker,and context are important to “racial classification” (Rodríguez andCordero-Guzmán 1992; Sanjek 1971:1128). Hence, a person who wouldbe considered white in the Spanish Caribbean might be consideredblack or nonwhite in the United States because of his or her color. Racein the Caribbean and Latin America is highly dependent on context
RACE IN THE AMERICAS 107
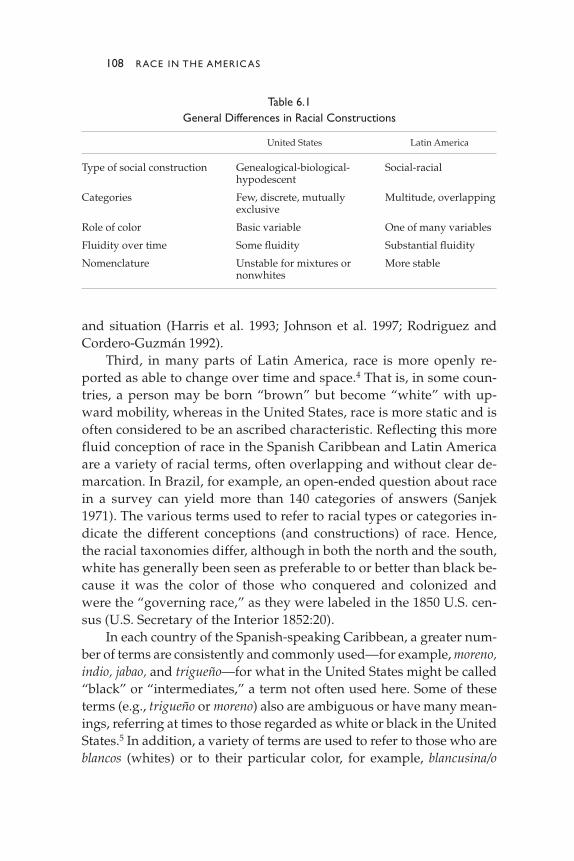
and situation (Harris et al. 1993; Johnson et al. 1997; Rodriguez andCordero-Guzmán 1992).
Third, in many parts of Latin America, race is more openly re-ported as able to change over time and space.4 That is, in some coun-tries, a person may be born “brown” but become “white” with up-ward mobility, whereas in the United States, race is more static and isoften considered to be an ascribed characteristic. Reflecting this morefluid conception of race in the Spanish Caribbean and Latin Americaare a variety of racial terms, often overlapping and without clear de-marcation. In Brazil, for example, an open-ended question about racein a survey can yield more than 140 categories of answers (Sanjek1971). The various terms used to refer to racial types or categories in-dicate the different conceptions (and constructions) of race. Hence,the racial taxonomies differ, although in both the north and the south,white has generally been seen as preferable to or better than black be-cause it was the color of those who conquered and colonized andwere the “governing race,” as they were labeled in the 1850 U.S. cen-sus (U.S. Secretary of the Interior 1852:20).
In each country of the Spanish-speaking Caribbean, a greater num-ber of terms are consistently and commonly used—for example, moreno,indio, jabao, and trigueño—for what in the United States might be called“black” or “intermediates,” a term not often used here. Some of theseterms (e.g., trigueño or moreno) also are ambiguous or have many mean-ings, referring at times to those regarded as white or black in the UnitedStates.5 In addition, a variety of terms are used to refer to those who areblancos (whites) or to their particular color, for example, blancusina/o
108 RACE IN THE AMERICAS
Table 6.1General Differences in Racial Constructions
United States Latin America
Type of social construction Genealogical-biological- Social-racialhypodescent
Categories Few, discrete, mutually Multitude, overlappingexclusive
Role of color Basic variable One of many variables
Fluidity over time Some fluidity Substantial fluidity
Nomenclature Unstable for mixtures or More stablenonwhites
(very white), cano/a (white, as in gray or white hair), rubia/o (blond),guera/o (blond), colorá/ado/a (reddish), and jincha/o (pale). In somegroups, the very term blanco or blanquito (white) is also increasinglyused to refer to removed, powerful, or upper-class persons, regardlessof their color, thereby underscoring the relationship between perceivedcolor and power. Finally, descriptive terms are used to refer to skin colorthat is not white-white, for example, piel canela (cinnamon skin),trigueño claro (light trigueño), and trigueño oscuro (dark trigueño).
Alvar found eighty-two racial terms used throughout Latin Amer-ica—and since the same term often has more than one meaning, helisted 240 definitions for them (1987:89–215). Many of these terms havebeen used for a long time and have different meanings in differentcountries. The following example from his work illustrates how com-plex these terms are. The term puchuelo was first cited by Father Morellin a work published in 1776, but he noted that it was coined much ear-lier. In Peru and Venezuela, puchuelo is defined as the result of a crossbetween a European and an ochavona. This cross is said to produce aperson of raza totalmente blanca (of the totally white race). Puchuelo isalso defined as the cross between a white person and a person who iscuarterona de mestizo (one-quarter mestizo). If the term is modified by denegro, “of blacks,” in Mexico the term means the child of a white and anochavona negra (or octoroon) (Alvar 1987:185). Some people may legiti-mately object to works like Alvar’s that analyze and itemize minute dif-ferences in conceptions of race as trivializing the inherent brutality ofslavery and racism. However, such works also demonstrate that bothresearchers and the lay public were aware of the magnitude of pheno-typic diversity and the complexity and fluidity involved in creatingsuch differences.
In contrast, in the United States, despite early and regional or localvariations—for example, in New Orleans—race is generally deter-mined by perceived or imputed biological inheritance. The “rule of hy-podescent,” according to which one drop of “black” blood makes a per-son “black,” has been applied most recently and most rigidly to AfricanAmericans.6 Because race and color are often used synonymously,African Americans are considered to be “black” regardless of their ap-pearance or other factors. Similarly, Asians are considered “yellow” andNative Americans “red.” Although other social variables are often partof racial determination in the United States, for example, accent orspeech or dress style, the basis is ancestry and color. Moreover, in the
RACE IN THE AMERICAS 109

United States, persons born black remain black no matter what theyachieve socially. Until recently, intermarriage between whites and non-whites (other than blacks) has resulted in their children’s race being de-fined as partialized, as in “half-breeds” or “part Asians,” for a numberof generations. Assimilation often has meant hyphenated American sta-tus for some groups, minoritization for other groups, and total Ameri-canization for those who most resemble Europeans.
Although African Americans have also developed a variety ofterms to refer to color tones (Russell, Wilson, and Hall 1992) andsome terms such as mulatto and half-breed have been used by govern-mental bodies in the past, the emphasis has been on constructing racecategories as if they were “pure” (Lee 1993). Even in the AfricanAmerican community, individuals never become fully white, as theydo in some Latino communities. Indeed, when a person of AfricanAmerican descent becomes white, it is because the individual is“passing,” that is, leaving the black community. Although some peo-ple in the African American community are seen as “white” byAfrican Americans, whites, and others, to use this as a self-designa-tion or category would be seen as denying their group, ancestry, or“true” identity. In contrast, in Latino communities, it is not uncom-mon to refer to individuals as Latino and white (in color), withoutany denial of ethnicity implied. At the same time, the terms white andLatino can be juxtaposed as two distinct cultural-racial groups, so tobe one is not necessarily to be the other. In contrast, in the UnitedStates, individuals are rarely considered both black/African Ameri-can and white (in color); they tend to be seen as mutually exclusive. Itis only with the recent increase in intermarriage that the children ofsuch unions have begun to use terms such as biracial and multiracialfor themselves and that these terms have become common ways ofdescribing individuals of “mixed” heritage. Those persons withoutimmediate “mixed” ancestry have not generally been so described,although increasingly many are claiming all their ancestries.
In essence, as noted in chapter 4, the racial taxonomy of the UnitedStates has reflected a small number of intermediate racial categoriesthat have fluctuated (in both official and everyday use) over time,whereas in the Spanish Caribbean and other parts of Latin America,many intermediate and stable categories have persisted over time. Asnoted earlier, the extent to which these different constructions of raceinfluence one another because of immigration to the United States,
110 RACE IN THE AMERICAS

transnational migration movements, and increased communicationsbetween both hemispheres is not yet clear.
DIFFERENCES AND SIMILARITIES
Although the differences between north and south pertain to racial con-structions, they may also obscure the similarities. First, both Americashave histories of indigenous conquest, slavery, and immigration. Sec-ond, in both Americas, race has been constructed to reflect and supportclass and power relations. Each country in Latin America has devel-oped its own racial constructions, but in all cases, they have tended tobenefit those in power. The ideological and practical racial distinctionsof the colonial structure of Latin America as a whole has favored theconquerors and colonizers. As Spickard noted,
From the point of view of the dominant group, racial distinctions area necessary tool of dominance. They serve to separate the subordinatepeople as Other. Putting simple, neat racial labels on dominated peo-ples—and creating negative myths about the moral qualities of thosepeoples—makes it easier for the dominators to ignore the individualhumanity of their victims. (1992:19)
A racial hierarchy was and is still evident today in Spanish-speakingAmerica, which has been reinforced in the Spanish-language media,particularly in the ever-popular television novelas or soap operas thatair in both Latin America and the United States. In most novelas, the pro-tagonists and major characters are usually played by northern Euro-pean–looking actors, and the marginal and lower-status service roles,such as maids and chauffeurs, are given to darker-skinned, non-Euro-pean actors (Subervi-Vélez et al. 1997:234–235).
Reasons for the Differences
The reasons offered for these differences are too numerous to be ex-plained fully here, so I will only summarize a few of them. One is thatSpain’s contact with North Africa made the Spanish more tolerant ofdifferent color groups than the northern Europeans were. That is,Mediterranean peoples tended to see darker-skinned people as white or
RACE IN THE AMERICAS 111
more like them than northern Europeans did. According to Forbes,Spaniards were used to a great variety of colors but did not associatethem with a concept of separate “races.” Thus, the Spanish Mediter-ranean world used a variety of color terms and had an awareness ofmany gradations in human physical types and subscribed to the gen-eral view that “human types changed gradually and blended into oneanother.” According to Forbes, this view was typical not just of Spainbut also of most observers before 1900 (Forbes 1988:268).7
Both Sanjek (1994) and Forbes (1988), however, contend that theSpanish way of viewing race shifted over time toward a more racial-ized view. Sanjek argues that despite the initially different views ofSpain and northern Europe regarding color and race, by the late sev-enteenth century, all European countries looked down on bothAfricans and Native Americans and were reluctant to sanction inter-marriage or to admit persons of mixed background to the full entitle-ments enjoyed by those of solely European ancestry (1994:1–17). “Asthe centuries of dispossession and enslavement of these peoples woreon, the ordinariness and economic utility of such treatment were ac-cepted more and more” (p. 5).
Spain adopted the Roman slave law codes, which were developedwhen a person of any race could be a slave. In this context, slavery was“an unfortunate accident that could befall any luckless one.” This con-ception of slavery as accidental and not racial “automatically endowed[African/black slaves] with the immunities contained in the ancientprescription” (Degler 1959:28). Consequently, the Spanish conceived ofslaves and Indians as vassals or royal subjects and thus as having cer-tain rights. This differed from the North American conception of slavesas property. This does not mean that the Spanish treatment of slaveswas more benevolent but, rather, that it was sanctioned and conceivedof differently. Indeed, Hoetink found in his study of the Caribbean that“there is no clear connection between the type of slavery practices, thatis, whether ‘cruel’ or ‘mild,’ and the positions attained by free blacks orcolored in the society” (1985:8).
A third difference noted is the influence of the Spanish CatholicChurch, which had a central role in the conquest of Latin America. InLatin America, it also promoted the conversion, baptism, and atten-dance of slaves at integrated religious services, whereas in the UnitedStates, the churches for blacks and whites were separate.8 For some, therole of the Catholic Church is seen to be analogous to that of the Span-
112 RACE IN THE AMERICAS

ish legal code. That is, in theory it promoted a positive cultural attitudetoward persons of color but in practice failed to carry it out (Denton andMassey 1989; Rodríguez and Cordero-Guzmán 1992).
The economies of many Latin American countries were more mixedand less dependent on slavery. As a result, slavery was less importantas an institution, and there were fewer slaves, both absolutely and pro-portionately. (Brazil and the Caribbean were the major exceptions.)This, together with the immigration of many Europeans and the sub-stantial numbers in some countries of indigenous peoples, may haveled to a conception of race that was fluid instead of dichotomous(Duany 1985; Hoetink 1985). Duany (1985) illustrated the significance ofeconomic development in racial formation by comparing the history ofrace relations in nineteenth-century Cuba and Puerto Rico. He contendsthat race relations in Cuba, which had a plantation economy, distin-guished more rigidly between the white planters and the nonwhiteplantation workers or slaves. In Puerto Rico, however, the absence of anextensive plantation economy created a large intermediate group of freecolored persons, which facilitated social-racial mobility (Hoetink1985:14; Williams 1984).9
The gender ratio was also quite different in early Spanish America.As Rodríguez and Cordero-Guzmán found, “the greater migration ofEuropean women and families to North America as compared withLatin America—where men predominated and European women werescarce—may also have influenced the relations between races and theconsequent conceptions of race that evolved” (1992:527). Indigenousand African women may more often have been mates of European men.The children of such unions were, in some cases, recognized and edu-cated, and they contributed to the formation of the criollo class (Burkett1978). In addition, the development of a large, free, African-descendedclass may also have produced greater differentiation. As appendix D ex-plains, the number and proportion of “free people of color” in theUnited States was never very large, peaking at less than 15 percent of allAfrican Americans.
RACE IN EARLY SPANISH AMERICA
Undoubtedly all these explanations contributed to the distinctive con-structions of race in Latin America, as compared with those in the
RACE IN THE AMERICAS 113

United States. When and how did these differences begin? Forbes sug-gests that the Latin American tendency to view individuals in a “pro-gression of colors” reflected a more Mediterranean worldview in whichnumerous shades were associated with Europeans, Africans, and soforth (1988:268). This approach, he argues, was brought by theSpaniards to the Americas and predated the extensive mixing that tookplace there. Even though his assumption has not been extensively re-searched, if we examine the records of early Spanish America, we find asociety with many, fluid, and overlapping race categories, determinedby various physical, social, and economic variables.
Early Spanish colonial records use color terms to describe Euro-peans, a practice not followed in the British colonies. Evidently, racewas determined by a variety of factors, such as reputation, legalprocess, choice, acculturation, and calidad (quality) and many differentterms were used to describe people physically.10 In addition, and againsomewhat in contrast to the British colonies, mixture (or mestisaje) wasrecognized in the writings and paintings of the time. Finally, the earlySpanish American literature refers to lower-class Spaniards (or whites)as a caste, suggesting that castes were not based just on color.
An example of how substantial the color variations were evenamong those classified as “Spaniards” is a 1677 roster of colonistsbound for New Mexico. It lists as Spaniards those individuals describedas having “fair skin,” others as having “dark complexions,” and stillothers listed as being “mestizos” or “dark.” Spaniards also were classi-fied by national origin, and so there were European Spaniards, MexicanSpaniards, and Spanish Indians (Gutiérrez 1991:197). Color was appar-ently an adjective that could be applied to persons of different national-origin groups.
These references contrast with the later practices in the Britishcolonies, whose European-descended population seldom referred todegrees or modifications of color. Greene and Harrington’s 1966 com-pilation of population estimates in the British colonies before 1790 re-flects this convention and indicates the common use of terms such aspeople, souls, inhabitants, or whites—with the last two terms sometimesmodified, as in European or white inhabitants—to count populations.11
Color terms were not used to describe Europeans, nor were those of“mixed race” generally reported as such. With some minor exceptions,the basic divisions were—as in the first decennial census—whites,slaves (or blacks), and Indians, by tribe.12
114 RACE IN THE AMERICAS
Settlers in early Spanish America also emphasized racial classifica-tion according to reputation or social acceptance (Gutiérrez 1991). Forexample, in his analysis of sixteenth- to eighteenth-century northernNew Spain (now New Mexico), Gutiérrez discovered that a Juan San-doval was listed “by appearance of white racial status.” Another manwas described as “mestizo, according to reputation,” and still anotherwas promoted to lieutenant because “he is known as a white man”(1991:198). Categories such as español, mestizo, and mulato were some-times used interchangeably with descriptions of physical color—likeblanco (white), pardo (roughly brown or gray), and prieto (black)—eventhough color had no real legal definition. Consequently, a person couldbe described as español mestizo (or a mestizo Spaniard).
Comments that a person “appeared to be,” “was reputed to be,” or“was known to be” of a certain race also indicated that classificationdepended somewhat on social perception and acceptance. This in turnsuggests that racial mixing and “passing” may have been prevalent onthis remote fringe of northern New Spain (Gutiérrez 1991:198). Exceptat the extreme ends of the color scale, however, there was no direct cor-respondence “between race and actual physical color” (Gutiérrez1991:197).
Other scholars writing about early Spanish America have notedthis malleability of “race” (Carroll 1991). MacLeod, for example, writ-ing about Central America in the seventeenth century, notes that manyIndians kept their “race” but became non-Indian through dress and theadoption of language and cultural customs—becoming culturally mes-tizos or Ladinos (1973:308, 383). Katzew reports that in Mexico duringthe eighteenth century, a number of newly wealthy families who weredescendants of Indians and slaves purchased certificates of legal“whiteness” (called gracias al sacar, which is translated literally today as“thanks to be taken out” but which may have had a different meaningat the time) (1996:12). At the same time, others manipulated their racialidentities for other purposes, as when mestizos identified themselvesculturally with Indians and adopted Indian hairstyles, language, andthe like in order to avoid paying tribute. Likewise, blacks adopted In-dian and Spanish customs.
Furthermore, according to Gutiérrez, in this early period in SpanishAmerica, a person’s status was based not solely on race but also on cal-idad (1991:202 ff). Calidad and color were often closely related. Spaniardsprized their honor, and many were persons of calidad because they lived
RACE IN THE AMERICAS 115
among (and were above) genízaros (detribalized Indians), who had beendishonored by their enslavement, and among the Pueblo Indians, whohad been conquered. Gutiérrez pointed out that much of what it meantto be “honorable” was a projection of what it meant to be a free, land-holding citizen of legitimate white ancestry. Conversely, those withouthonor were slaves, outcasts, or Indians. Nonetheless, the concept ofhonor was not necessarily rooted in racial-physical difference but was,rather, “a complex measure of social status based on one’s religion, eth-nicity, race, occupation, ancestry and authority over land” (Gutiérrez1991:206). Consequently, the resulting social order tended to favor thosemost akin to the European conquerors yet still allowed non-Europeansto improve their position.
This order differed somewhat from the system that evolved in theUnited States, which based social and racial status strongly, if not solely,on biological descent or appearance. Thus, calidad was not a conceptthat had an exact equivalent in the United States’ racial formationprocess. Moreover, even though concepts similar to calidad undoubt-edly could be found in the United States, for example, “god-fearing”and “honest,” these were not generally used in racial classifications. Asa minimum, it required “whiteness” to be a citizen, so people were firstmembers of a race and then were god-fearing, honest, or whatever.
Another difference is that in North America, mixtures were de-scribed only biologically, whereas in Latin and Central America, cul-tural descriptors were never completely abandoned (Forbes 1988).Latin Americans distinguished first between those of legitimate birthraised by the Spanish and those raised by Native Americans. This dis-tinction recognized that cultural factors or socialization influenced theidentity of the “hybrids.” Early North American colonists followed thissame path, but by the 1800s, and especially after the Civil War, “greaterand greater emphasis was placed upon wholly biological or ‘racial’ cat-egorization and differentiation in North America.” (Forbes 1988:269;see also Davis 1992; Logan Alexander 1991; Williamson 1984)
A number of scholars have noted the early use of various andchanging terms to physically describe “mixes” of people as well as theconquering Spaniards (Alvar 1987; Forbes 1988; O’Crouley 1972; Ro-dríguez, R. 1991:24). O’Crouley, for example, in his description of NewSpain in 1774, lists and defines several common terms used to describemixtures.13 Gutiérrez’s 1991 analysis of marriage and baptismal recordsin sixteenth- to eighteenth-century northern Mexico uncovered various
116 RACE IN THE AMERICAS
terms used to describe brides, grooms, babies, and parishioners. Thiscontrasts with the United States, where official documents or commonparlance did not use many terms to refer to mixtures of people. Manyof these terms are still commonly used in Latin America, for example,mestizo. Others, however, are no longer employed, for example, castizoor genizaro.14 MacLeod also noted the diverse categories in early CentralAmerica, for example, Spanish and Ladinos, mestizos, blacks, mulat-toes, Indios, English (1973:228). Finally, the casta paintings commis-sioned during the 1700s by wealthy Spaniards and criollos illustrate thenumerous terms used to describe the different “mixes” (Katzew 1996).15
Although in the United States, terms referring to “mixtures” werefew, in some parts of the Spanish-speaking Americas, numerous termswere used to refer to different kinds of mixes, for example, children ofindigenous and African parents (Forbes 1988:130). Gutiérrez (1991), ex-amining colonial records in Mexico dating between 1690 and 1846, alsofound a variety of terms used for different mixes. For example, coyoteand lobo (wolf) were widely used to refer to the “half-breed” children ofIndian slave women born in captivity.16 Color quebrado was a broad termthat did not specify the nature or extent of racial mixture but, rather,meant “broken color” or “half-breed.” The precise degree of racial mix-ture was not indicated. Hence, in contrast to the United States, the bloodquantum was not ranked, although like the United States, the sense thatmixture diminished “purity” was present.
Gutiérrez (1991) noted the various classifications of Indians andSpaniards in northern New Spain. If an Indian spoke Spanish, he or shewas known as an indio ladino. Indios were Pueblo Indians who lived intheir own towns and were economically and politically independent. Agenízaro was a detribalized Indian who lived in a Spanish town. Thisterm is no longer used, but at the time it appeared as a column headingin census counts. According to Gutiérrez, the status of genízaros wassimilar to that of domestics or slaves (1991:150).
With regard to early views of the influence of “non-Spanish blood”on future generations, the picture is quite complex. On the one hand,Spanish colonial records indicate that (black) race was not necessarilytransmitted from one generation to another (Forbes 1988:121). Al-though the records might classify a mother as negra (black), they mightalso classify her daughter as lora (brown)17 or might not indicate colorat all, which usually meant white. Gutiérrez’s 1991 analysis of earlyrecords also indicates that race was not necessarily inherited. In the
RACE IN THE AMERICAS 117

early period, marriage statistics seldom gave race, and mixing ap-peared to be common. This contrasts with how the children of Africanslaves or free people of color were classified in the United States. Writ-ers on the early Spanish American period also have not found evidenceof a strict view of hypodescent, as was prominent in the north.
Sometimes, however, racist views were clearly articulated, andthe biological and cultural supremacy of the Spanish and Europeanswas often explicitly stated or assumed. Also, some commentators ofthe time distinguished between the influence of “black blood” andthat of “Indian blood” on “Spanish blood.” For example, in PedroAlonso O’Crouley’s description of eighteenth-century New Spain, he,as a Spanish merchant from Cadiz, accepts without question the su-periority of Spaniards and refers without hesitation to the more in-delible stigma of mixture with Negroes as opposed to Indians(1972:20 ff). Another Spanish merchant writing at about the sametime affirms this view and stresses even more the supremacy of thewhite pole to the black (Katzew 1996:10–11). The question, of course,is whether such texts reflected the prevailing customs, the views ofthe elite class, or the observations and prejudices of these particularupper-class Spanish observers.
The casta paintings offer a similarly complicated view. What is un-usual about these paintings is that they depict the complexity of inter-mixing. Indeed, this appears to be the paintings’ purpose. Thus, we seea variety of mixtures, from children who appear to be white but whoseparents are described as not white, to those who appear to be black butwhose parents appear to be white. The paintings’ depiction and expli-cation of mixture are not found in the same degree in the north, wheremixing also occurred. It also is curious that in these paintings, the Span-ish who intermarry or interbreed are depicted as being of both genders.Similarly, the Indians or blacks are not always the female slaves or In-dian princesses commonly found in U.S. literature or folklore. Finally,in the early eighteenth century, each of these mixed persons is por-trayed as wealthy, whereas the later casta paintings show them in lessaffluent circumstances. Analysts today see the projections of wealth asreflecting the insecurities of the criollos and Spanish elite in the Ameri-can colonies who were attempting to convince Europeans and them-selves of the stability and prosperity in the New World. Although we donot know whether these paintings were more ideal than real or whetherthese terms were commonly used at that time, they nonetheless present
118 RACE IN THE AMERICAS
a striking visual contrast to how mixture was projected (or not) in thenorth.18
The casta paintings also show that the results of intermixture dif-fered depending on whether a black or an Indian was mixing with aSpaniard. As O’Crouley pointed out, a white and an Indian could havea “white” child, and thus the Indian stigma would disappear “becauseit is held as systematic that a Spaniard and an Indian produce a mestizo;a mestizo and a Spaniard, a castizo; and a castizo and a Spaniard, aSpaniard.” Thus, if intermarriage continued with the Spanish, theSpaniard would return. If, however, “Spanish stock is mixed with In-dian several times over, there is also a return to Indian” (O’Crouley1972:20). Some of the paintings depict this process.
Intermarriages with blacks also are described and depicted in thecasta paintings as producing white-appearing children, for example, al-binos and moriscos, but not as producing a “Spaniard.” The paintingsalso depict a return to “black,” that is, torno atras (a return backward).Thus, as the two Spanish merchants of the time maintained, whiteblood was not “redeemable” (i.e., recoverable) with blacks. Blacks andIndians could return to their original types, but Spaniards could returnto Spaniards only if the mixture had been with Indians.
It is likely, however, that as the mixtures continued to mix withother mixtures, the utility or relevance of these classifications or theo-ries diminished.19 After the third generation (when everyone has eightgrandparents), it was difficult to categorize the racial mixture defini-tively. In fact, the difficulty of classifying these mixtures was already ev-ident in at least two of the terms used in the casta paintings, tente en elaire (hold yourself in midair) and no te entiendo (I don’t understand you).All of this impeded “the creation of a fixed system of classification andrepresentation” (Katzew 1996:10). Consequently, even though Spanishcommentators may have employed a version of hypodescent at thetime, very likely only those concerned about maintaining the “purity”of their European ancestry and their “blood” claim to upper-class sta-tus or power would have worried about such distinctions (Gutiérrez1991:292).
Indeed, the casta paintings’ racial classifications may have been at-tempts to clarify and stabilize what was an increasingly fluid societywhose social and racial boundaries were uncertain (Katzew 1996). Sug-gesting the uncertainty of such boundaries are references in the litera-ture of that time to “castes,” which included whites and Spaniards.
RACE IN THE AMERICAS 119
MacLeod noted, for example, the concerns in seventeenth-century Cen-tral America about the growing number of castes, which included freeNegroes, mulattoes, mestizos, and déclassé white vagabonds(1973:141–42, 192, 211–213, 235, italics added).20 Siguenza y Góngoro,writing in the seventeenth century about the deplorable drinking habitsof the Indians and other groups of the Mexican population, describedthese groups as “composed of Indians, of Blacks both locally born andof different nations in Africa, chinos, mulattos, moriscos, mestizos, zam-baigos, lobos, and even Spaniards . . . who are the worst among such avile mob (cited in Katzew 1996:12, italics in original).
Finally, MacLachlan and Rodríguez wrote that although the colo-nials of New Spain (Mexico today) assumed that there was an ethnic hi-erarchy (and historians accepted this assumption), the notarial recordsindicate otherwise (1980:223). The records state that by the seventeenthcentury, wealth and status were not confined just to whites and that thepoor included all racial groups. In fact, some European immigrants re-mained quite poor, and mestizos of means occasionally had Spanish-born servants.
In essence, from early on, Latin America more freely acknowledgedthe influence of culture, class, and other social factors in determiningrace. As a consequence, many Latin American countries developedoverlapping racial categories on a continuum from light to dark, fromEuropean to indigenous, or from white to black, rather than discrete,mutually exclusive racial categories. Scholars of early Spanish Americaexplain that the racial system in place then had many of the same fea-tures found today. It was not bipolar (i.e., it had more than two cate-gories), and it was—as the preceding examples illustrate—apparentlyfluid, dependent on social perception, and quite complex. We also seein place by 1744 the use of intermediate terms such as pardo, a polite de-scription of individuals known to be mulattoes, and the use of the termmoreno for those who were negros (O’Crouley 1972). As noted earlier,these terms are still common in many Latin American countries today.
At the same time, pigmentation was emphasized, and implicit andsometimes explicit racism dominated the determination of one’s socialstatus. Biological descent was only one variable entering the racial cal-culus, but as in the United States, it may have been more stringently ap-plied to those with African ancestors than to those with Indian ances-tors. During the early Spanish colonial period, other characteristicssuch as class, physical type, social networks, or hairstyle and dress also
120 RACE IN THE AMERICAS
were important indicators of social status and ethnic identity (Gutiérrez1991:205 ff). Yet despite what may have been great fluidity in early colo-nial Spanish America, the race order relied on the existence of op-pressed “others” in order to define “the included.”
Racial Configurations
A comparison of differences and similarities between north andsouth may obscure the differences among the different countries inLatin America itself. As we saw in chapter 2, the various countries’racial and ethnic categories differ, as do the concepts and their defini-tions (Rout 1976:185–312). Some countries do not ask about race andethnicity, and sometimes these change over time (Almey, Pryor, andWhite 1992; Bates et al. 1995:433–435; Lee 1993; Martin, DeMaio, andCampanelli 1990; Miller 1991; Statistics Canada and U.S. Bureau of theCensus 1993).21 That is, race has been conceived differently in eachcountry in Latin America because each has had a different history (Scott1995:56).
For the countries in Central and South America, this variability de-pends on their history of settlement as well as political considerationsand policies concerning the collection (or noncollection) of race and eth-nic data. Almey, Pryor, and White (1992) examined how, during a forty-year period in the twentieth century, the censuses of fifty-one countriesclassified their populations with regard to race and ethnicity. Theyfound that the census forms of those countries whose settlers had a pre-dominantly European cultural background (e.g., Argentina, Chile,Costa Rica, and Uruguay) had no questions on race/ethnicity (Almey,Pryor, and White 1992:7). But the censuses of Central American and An-dean countries usually did include questions on ethnicity and race.
Moreover, the censuses of countries in the Americas that had slaveand plantation economies generally did ask about ethnicity and racebut used different terms for racial categories. For example, Cuba andBrazil used color terms to distinguish groups such as black, pardo (sim-ilar to brown), white, and yellow.22 The British West Indies, where Chi-nese and East Indian indentured labor was an important part of thecountry’s history, listed separate categories for these groups. Similarly,those countries where Syrians, Lebanese, and other Arabs immigratedin substantial numbers had separate categories for these groups. Somecountries included a category for “mixed,” and over time, others
RACE IN THE AMERICAS 121

replaced “black” with “African.” In the 1980 censuses for Belize, Barba-dos, and the Dominican Republic, the Portuguese were put into a cate-gory different from that for whites (Almey, Pryor, and White 1992).
Countries such as Bolivia, Guatemala, and Panama collected dataon their large indigenous and nonindigenous populations. But accord-ing to Almey, Pryor, and White (1992), the data on indigenous popula-tions were not consistent. In general, such information was collectedonly sporadically, and the categories changed over time. Moreover,those nations with small and rapidly disappearing indigenous popula-tions, for example, Brazil and Chile, did not attempt to use the nationalcensus to identify and count them (Almey, Pryor, and White 1992:8).Thornton noted that Belize counted Mayans and Caribs, those who aremixed Native American and black, and that some countries countedseparately those who speak another language (1987:222).
Settlement history is not the only variable determining how ques-tions of race and ethnicity are asked (Almey, Pryor, and White 1992) orhow racial ideologies are expressed. Government policies, conditions ofthe nation-state, balance of power, and external views of race also in-fluence how countries come to see or measure race. These factors—be-cause they vary by country—also lead to a multiplicity of racial ideolo-gies and policies (Graham 1990). For example, scholars have concludedthat between the late nineteenth and early twentieth centuries, Cubaand Argentina developed racial ideologies that openly or explicitly em-phasized and glorified whiteness and whitening (Andrews 1980; Helg1990; Rout 1976:193 ff); Brazil celebrated its “Racial Paradise or RacialMyth”;23 Puerto Rico talked about a sense of cryptomelanism (Serreno1945; for a more extensive review of the literature on race in PuertoRico, see Rodríguez 1996); Mexico celebrated “mestizaje and indi-genismo” (Gutiérrez 1991; Knight 1990); and Venezuela created a com-placent café con leche society (Wright 1990).24 These racial ideologies alsoinfluenced cultural self-definitions, preserved power relationships,shaped policies, and controlled the oppressed.25
Although these characteristics apply to particular countries, re-gional exceptions within countries and overlaps between countries canbe found as well. Moreover, a particular ideology may also be found inanother country; for example, El Salvador may also have a café con lechesociety. In addition, racial formation is constantly evolving, so the char-acteristics of one period may change.26 Moreover, these characteristicsare drawn from analyses of writings on race, which often reflect the
122 RACE IN THE AMERICAS
class biases of upper-class intellectuals and political elites in these coun-tries. Popular views of race may therefore be quite different from thesedescriptions, although one could argue that a country’s racial ideologyeventually affects everyone. The process is circular. “Race” is created bycultural practices; it is articulated in a particular way by writers; onceconstituted, it speaks to and about culture; and it influences the waypeople see themselves (Nobles 1995:128).
But these countries also have much in common. All have a legacy ofslavery and the oppression of non-European peoples, although somecountries were more dependent on slaves than others were. They allalso responded to the development of racialist theories in the nine-teenth century and to the shift in the balance of power during this pe-riod, with its attendant competition for political and economic domi-nance. Some countries responded similarly, for example, Cuba and Ar-gentina (Helg 1990), others differently, for example, Mexico (Knight1990). But the racialist theories and the popular thinking of the timetouched them all. This thinking, in turn, influenced each country’s poli-cies, especially with regard to immigration and national conceptions ofrace and identity. In effect, all the countries emphasized the desirabilityof whiteness and European immigration policies (Graham 1990). In thesame way that all Latin American countries were affected in the past byEurocentrism and racism, they continue to be affected in the present bynew movements, for example, Afrocentrism, Latinismo, and world-wide indigenous rights movements.
Racial Legacies
Despite its different historical constructions, “race” in the variousLatin American countries has been more fluid and has led to the cre-ation of more categories than the binary division adopted in the UnitedStates. Moreover, race in these countries has not been solely determinedby genetic inheritance but has been much affected by other variablessuch as class, phenotype, language, and degree of assimilation. Whenviewed through the U.S. racial lens, this view of race is more akin to eth-nicity, culture, or national origin, but from the Latin American perspec-tive, it is simply raza, “race.”
Recently, this view was manifested in the responses of many His-panics to the U.S. census’s questions about race. As noted earlier, at least40 percent of all Hispanics in the United States responded that they
RACE IN THE AMERICAS 123
were “other race,” and many of them wrote in a Latino referent, for ex-ample, their national origin or a cultural or ethnic label. Moreover, someof the findings of studies conducted by the census echo many of the dif-ferences between the U.S. and Latin American views of race just de-scribed.27 For example, and as will be discussed in the next chapter, sev-eral ethnographers found that Hispanics, especially recent immigrants,generally do not view race as a dichotomous variable but, rather, as acontinuum (Bracken and de Bango 1992; Rodríguez and Hagan 1991;Romero 1992). Respondents also conceptualize race “as a constellationof national origin, skin color and culture” (Bates et al. 1994:109). Finally,it was not only particular Hispanic groups that had difficulty with therace and Hispanic-origin questions, but all Hispanics, regardless of na-tional origin (de la Puente 1993:37–38).
A study by Kissam, Herrera, and Nakamoto (1993) found thatmany Hispanics understand “race” to be national origin, nationality,ethnicity, or culture and that for many Hispanics, “race” and “ethnicgroup” are closely related.28 According to this study, while the mean-ings of each of the three terms race, Hispanic origin, and ethnic group var-ied extensively from respondent to respondent, in contrast, the conceptof national origin was, for most, well understood. The study’s focusgroups confirmed the researchers’ in-depth interview findings (p. xi)and concluded that for the Hispanics they interviewed, race was closelytied to national origin and cultural identity and only weakly to pheno-type or genotype (p. 32).
The study also provides some intriguing discoveries about educa-tion and race. It found that education influenced the respondents’ an-swers, with those with more education responding in the way the cen-sus anticipated, especially to the race question. The study stated that inthe cognitive interview, race “provided one of the most frustrating bar-riers for low-literate Hispanic respondents” (Kissam, Herrera, andNakamoto 1993:22). Many of the less well educated respondentsscanned the first three racial-group terms, blanco (white), negro (black),and “indio” (Indian). They then eliminated each and in some caseswrote in a Hispanic term. Because of the overlap for many Hispanicsamong race, ethnicity, and national origin, even well-educated Hispan-ics “expressed annoyance when they realized that their preferred racialgroup term was part of the amorphous group of ‘otro grupo racial’ (otherrace)” (p. 23). The authors decided that for the respondents, choosingthe “other race” category conveyed a “disturbing and sometimes in-
124 RACE IN THE AMERICAS

sulting connotation to Hispanic immigrants about their role in ethnicinteractions in the United States” (p. 23). According to the authors, therespondents felt that they had no “label” of their own and only ageneric “other race” at the end of the list. The researchers concludedthat the message to the Hispanic respondents was that they were lessimportant than other races and that from the perspective of most of thestudy participants, the “census’s implicit conceptual framework . . .[was] considered inadequate” (p. x).29
These findings prompt several questions. How does the way that agroup is seen in the United States compare with the way it sees itself?How long does it take for groups to understand their placement or clas-sification on government forms? How might they resist, such as whenpeople who have always seen themselves as “Cuban” or “Peruvian” aretold that they are “Hispanic” and that this is the same as “Argen-tinean”? This is a repetition of the earlier immigrant experience inwhich Sicilians became “Italians” and Cherokees became “Indians.”
But today, these findings involve for Latinos, at least, an apparentchange in definitions of race. Many Latinos may come to the UnitedStates believing that race, ethnicity, and hispanidad (Hispanicism) all arerelated (because this is how “race” is socially constructed in LatinAmerica), but they soon learn that for U.S. census purposes, these aresupposedly distinct concepts; that contrary to what the ancients andother cultures believed, a race group is not the same as an ethnic group.Moreover, race is primarily biological or color based.
The following anecdote from one of the census studies illustratesanother dimension of the racialization process. It suggests that racialperceptions change over time in the United States. A focus group pre-dominantly made up of immigrant Hispanic women was confusedabout the racial question. A more acculturated Hispanic woman in thegroup told the others, “What they want you to put down is ‘white’”(conversation with de la Puente, January 6, 1993). This conflict betweenthe U.S. census’s articulation of “race” and the respondents’ views willbe discussed in more detail in the next chapter.
RACE IN THE AMERICAS 125


PART I I I
RACE AND THE CENSUS

7
The “Other Race” Option
HISPANICS AND THE U.S. CENSUS
As chapter 1 pointed out, the 1980 census represented a historical break.For the first time in its two-hundred-year history, the census asked therespondents to indicate their race and also if they were of Hispanic orSpanish origin (see figure 1.1 in chapter 1 which shows these ques-tions).1 Both questions produced surprising results, which provide afocus for a larger discussion about who reported they were “otherrace,” what contributed to their responses, and what issues their re-sponses raised. More broadly, these results and the explanations ofthem provide dramatic evidence of the fluidity and social constructionof race, as well as of the persistence and pull of the United States’ bipo-lar racial structure.
From the perspective of the mainstream press, one of the mostsignificant results of the 1980 and 1990 censuses was that the numberof people who checked categories that were “other than white” wasmuch higher than in the 1970 census. By 1990, one of every fourAmericans identified himself or herself as either Hispanic or notwhite, that is, of non-European descent or race. Time magazine usedthis subject as a cover story, in which it coined the colorful (and sub-sequently much used) metaphor “the browning of America” (Henry1990). Implicit—but largely unnoticed—in this phrase was the as-sumption that all Hispanics, Asians, Pacific Islanders, African Ameri-cans, or any others who checked any category other than “white”were “brown.”
The reverberations from this interpretation were many. For exam-ple, some corporations changed their marketing plans to be more in-clusive, and the definition of “American” was scrutinized even morecarefully than it had been during the 1960s. Although these revelationsabout the United States’ changing “racial-ethnic” composition received
129
considerable media attention, practically no notice was taken of His-panics’ responses to the race question.
In 1980, however, Hispanics’ responses to the question differed rad-ically from those of the non-Hispanic population, in that a substantialnumber of Hispanics (7.5 million, or 40% of all Hispanics) chose the“other race” option (Denton and Massey 1989; Martin, DeMaio, andCampanelli 1990; Rodríguez 1989; Tienda and Ortiz 1986). Many ofthem wrote in an explanation in the box asking for race. That is, afterchecking the “other race” box, they specified that they were Dominican,Honduran, Boricua, or some other cultural or national-origin term.(Another 57.7 percent of Hispanics indicated that they were white, and4.6 percent indicated that they were black, Asian, or Native American.)2
In contrast, less than 3 percent of the non-Hispanic population in allstates said they were “other race” (Rodríguez 1989).
Despite changes in the 1990 census’s race question, this pattern wasrepeated. A comparison of the race questions used in 1980 and 1990shows that some of the changes were calculated to reduce the likelihoodthat respondents would confuse race with national origin.3 For exam-ple, the label race was included in the race question and was also addedto the category of “other.” Indeed, in contrast to the 1980 question, inwhich the term race did not appear at all, in 1990 it appeared five timesin the question (see figure 1.2).
Nevertheless, the proportion of Hispanics who replied that theywere “other race” did not decline; rather, it increased by almost 3 per-cent in the 1990 census. In fact, the “other race” category was the secondlargest racial category (after “Asian and Pacific Islanders”), increasingby 45.1 percent between 1980 and 1990 (Rodríguez 1991b:A14; U.S.General Accounting Office 1993). Moreover, the overwhelming major-ity (97.5%) of those in the “other race” group were Latino (U.S. GeneralAccounting Office 1993:26).
“OTHER RACE” RESPONSES
The literature initially offered two explanations for why so many His-panics chose the “other race” option. One was that they had misunder-stood or had had difficulty with the question. Although most articlesdid not specifically refer to Hispanics’ “misunderstanding,” many didrefer to the “difficulty” that the race item posed or stated that Hispanic
130 THE “OTHER RACE” OPTION
respondents had “difficulty” responding to questions about race(McKenney and Bennett 1994:21; McKenney and Cresce 1993:173–222;McKenney et al. 1993; U.S. House Committee 1994f:9). One articlereferred to how Hispanics had “inappropriately identified their raceas ‘other’ (for example, some white Hispanics reported their race asother . . .)” (Buehler et al. 1989:458). This article went on to say that theCensus Bureau “corrected” the classification of race for many personsand created “race-corrected data” that were later used in their calcula-tions (Buehler et al. 1989:458). The second explanation was that the“other race” response represented “mixed-race” individuals, that is,mulattoes and mestizos. In essence, Hispanics who said they were“other race” and identified their national origin were seen to be either“mixed up” or “mixed.”4 Neither interpretation questioned the validityof the race question.
Further research showed that neither of these explanations was en-tirely satisfactory. Indeed, later analyses showed that it was not just His-panics who had “difficulty” with the race question. Census reinterviewstudies (i.e., studies that later interviewed those persons who filled outa census form) concluded that in addition to both foreign-born and na-tive-born Hispanics, many other foreign-born persons had difficulty re-porting in the race items (McKenney and Bennett 1994:22). In addition,other studies indicated that these responses resulted not from a misun-derstanding of the question but from a different understanding of race.As noted earlier, Kissam, Herrera, and Nakamoto (1993) observed thatmany Hispanics chose the “other race” option because they viewed raceas culture, national origin, ethnicity, or nationality or a combination ofthese and skin color (Bates et al. 1994:109; Rodríguez 1992, 1994a; Ro-dríguez and Cordero-Guzmán 1992; Rodríguez et al. 1991). These dif-ferent understandings of race also were evident in many colloquial ex-pressions, such as Mexican Americans’ references to themselves as razaand the common use of the term raza to refer to culture and national ori-gin, for example, la raza dominicana (the Dominican race), la raza colom-biana (the Colombian race), and la raza italiana (the Italian race).
There were other indications that Hispanics had different under-standings of race. For example, in the 1990 census race question, two-thirds of those who did not specify their race did write in their Hispanicethnicity (U.S. Office of Management and Budget 1995:44689). That is,they were not a race, they were Hispanic. Hispanics’ more cultural orethnic view of race was also revealed in the census’s methodological
THE “OTHER RACE” OPTION 131
and ethnographic studies investigating the reporting and undercountissues (see, e.g., Bracken and de Bango 1992; Romero 1992; Rodríguezand Hagan 1991; and Elias-Olivares and Farr 1991). As the InteragencyCommittee for the Review of the Racial and Ethnic Standards of the Of-fice of Management and Budget later noted, “Hispanics tend to see raceas a continuum and use cultural frames of reference when discussingrace” (U.S. Office of Management and Budget 1997a:36909).
The second assumption made about Hispanics’ divergent patternof racial responses was that those who reported they were “other” weremestizo or mulatto.5 This, too, has not been fully supported in subse-quent research, although it does account for some responses. Given afacsimile of the 1980 census question on race, Latino respondents wereasked first to answer the question and then to explain their choice of cat-egory.6 Of those who chose “other race,” only 11.5 percent referred to bi-ological “race” or mixture (Rodríguez 1992). Another 15.4 percent gaveboth physical and cultural reasons. The majority (63%) stated that theyhad chosen the “other race” option because “this was their culture,”and/or they referred to their family, birthplace, socialization, or politi-cal perspective. Representative answers were “Because that’s what myparents and family are”; “I have always known this is my culture”;“That’s where my roots are”; and “Although I was born in the UnitedStates, my parents are Dominican.” Thus, it does not appear that themajority of those Hispanics who say they are “other” do so becausethey see themselves as “mixed” (Rodríguez 1992). The assumption that“other race” represents mixed race may be true for some Latinos, but itcannot be assumed that it represents the view of all.
THE GOVERNMENT’S RESPONSE
Soon after the 1980 census’s results were published, few argued that the“other race” response represented a different understanding of race. In-deed, there was relatively little reaction after 1980 to the “other race” re-sponse, especially compared with the reactions ten years later after the1990 census, which led to public hearings and extensive research on thisissue.7 This delayed reaction was reflected in a high-level summary bythe U.S. Office of Management and Budget (1995), which stated that “ahigh percentage of Hispanics selected ‘other race’ in the 1990 decennialrace question” (U.S. Office of Management and Budget 1995:44690, ital-
132 THE “OTHER RACE” OPTION

ics added). It did not say, however, that this response was first given inthe 1980 census. It was only later that the U.S. General Accounting Of-fice noted that “in both the 1980 and 1990 Censuses, the Bureau foundthat Hispanics had difficulty classifying themselves by race” (1997:8).8
Would the situation have been handled or interpreted differently ifthe issue had not been race? In other words, if 40 percent of a group (ormore than 9 million people in 1990) had responded to any other ques-tion on the census (e.g., marital status, income) in a way that differedsignificantly from expectation or from the rest of answers, would the as-sumption have been that the group had difficulty with or misunder-stood the question? More likely, such a result would have meant thatthe question may not have been relevant to the group or that the re-sponse was not a misunderstanding but perhaps a different under-standing of the question. The following example illustrates this point.Consider gender identity. If 40 percent of any group of people statedthat they were neither male nor female, it seems likely that (1) such ananswer would have been noticed before the same result was obtainedagain ten years later and (2) a search would have been undertaken todetermine why the people answered in this way before concluding theydid not understand the question or that all of them were hermaphro-dites. But after the 1980 census results were known, alternative expla-nations were not seriously explored at the time. Only when the resultswere repeated in the 1990 census—despite attempts to discourage the“other race” response—were other explanations sought.
Despite the substantial changes in thinking about these issues, thenotion that Hispanics were confused lingered. For example, in hearingsheld in 1993 to reassess racial and ethnic standards, many of the expertwitnesses and federal representatives accepted the conclusion that His-panics were confused by or had difficulty classifying themselves interms of the race categories (see, e.g., U.S. House Committee 1994d:234,1994j:75; 1994m:55, 1994r:95. These hearings will be the focus of chapter8.). Moreover, as recently as 1997, according to the U.S. General Ac-counting Office, the Census Bureau’s evaluations in 1980 and 1990found that “Hispanics had difficulty classifying themselves by race”and that this difficulty led to inconsistent reporting (1997:8). The U.S.Office of Management and Budget’s interim report, while acknowledg-ing that “the [race] question may not be operating as intended,” stillstated that “some research supports the public comments that somerespondents are confused about how to respond to separate race and
THE “OTHER RACE” OPTION 133
Hispanic origin items” (1995:44679). It then cited the high proportion ofHispanics who marked “other” in the race question9 and remindedreaders that in the census reinterview studies, many Hispanics changedtheir classification when questioned by census personnel, again sug-gesting confusion. (The report did not note the possible role of the cen-sus interviewer in influencing this shift to another means of classifyingrace.) In 1999, the results of cognitive interviews conducted by the cen-sus led the Office of Management and Budget to decide that “there wasconfusion regarding the separation of Hispanic or Latino origin fromrace” (U.S. Office of Management and Budget 1999:10).
REASONS FOR CHOOSING THE
“OTHER RACE” CATEGORY
Many Hispanics chose “other race” because they saw that their na-tional origin, ethnicity, and so forth were different from the otherchoices on the census, that they were not the same as or just “white,”“black,” “American Indian,” or “Asian and Pacific Islander.” But con-text—often referred to as “external or methods effects”—also influ-enced how Hispanics responded to the race question.10 For example,whether the interviewer was Anglo or Hispanic or whether the re-spondent answered the questionnaire in private, over the phone, or inperson might have affected the answer. The structure of the question,that is, whether it was open-ended or closed, and the options offeredalso influenced the responses.
In regard to questions about race, some groups are unwavering. Forexample, regardless of who asks the question or how the question isasked, whites always say they are white, and African Americans al-ways say they are black (U.S. Office of Management and Budget1995:44675).11 But Hispanics are different, and their answers to ques-tions of race often vary considerably according to context.12 Many stud-ies refer to this variability to as inconsistency because respondents do notconsistently give the same answer (U.S. General Accounting Office1993:26). The following section reviews the research on how Hispanics’responses to questions of race are affected by (1) who asks and who an-swers the question, (2) the format of the question, and (3) the context inwhich the question is asked.
134 THE “OTHER RACE” OPTION

Who Asks and Who Answers the Question
The question of who determines “race”—that is, whether it is de-termined by the person being questioned or by someone else—is im-portant to determining Hispanics’ racial classification. Three examplesare illustrative. The introduction of self-identification in the censuscaused the proportion of “white” Hispanics to drop from 93.3 percentin the 1970 census to 57.7 percent in 1980. At the same time, the propor-tion of “other race” Hispanics rose from only 1 percent in the 1970 cen-sus (when census personnel determined racial classification) to 40 per-cent in 1980. The proportion of “black” Hispanics remained the same inboth years (Rodríguez 1991c:65, 81).
Second, in the 1990 census, 43 percent of Hispanics were “otherrace,” 52 percent were white, 3 percent were black, 1 was percent API,and less than 1 percent was American Indian (del Pinal 1994:4). But inMarch of the next year, when the Current Population Survey (CPS) wastaken, Hispanics were 96 percent white and 1.5 percent other race (delPinal 1994:2; U.S. Bureau of the Census 1992:3) (see table 7.1). This dis-crepancy in racial classification occurred because in the CPS data, a cen-sus interviewer determined racial classification and Hispanic origin,and the “other race” category was not even on the form. (The “otherrace” category was used only when respondents refused to be placedinto those specified on the form.) Consequently, in this case, the use ofcensus interviewers to classify Hispanics resulted in significantly more“white” Hispanics and significantly fewer Hispanics in the “other race”category. (The proportions classified as black, Native American, orAsian and Pacific Islander also decreased.)
Third, in the census’s Content Reinterview Study, personal inter-views were conducted with those who had earlier submitted their in-formation on the decennial census form. In a study of those who re-ported that they were “other race” in the 1980 census, only 10 percentwere similarly classified when reinterviewed by census personnel(McKenney, Fernández, and Masamura 1985). Martin, DeMaio, andCampanelli cited as a possible cause for this inconsistency “interviewerbehavior in the reinterview study” (1990:554). Although race was to beself-reported by respondents using a flashcard listing the race cate-gories, they stated that the interviewers might have changed the “otherrace” responses to “white” for respondents who “looked white.” Or
THE “OTHER RACE” OPTION 135
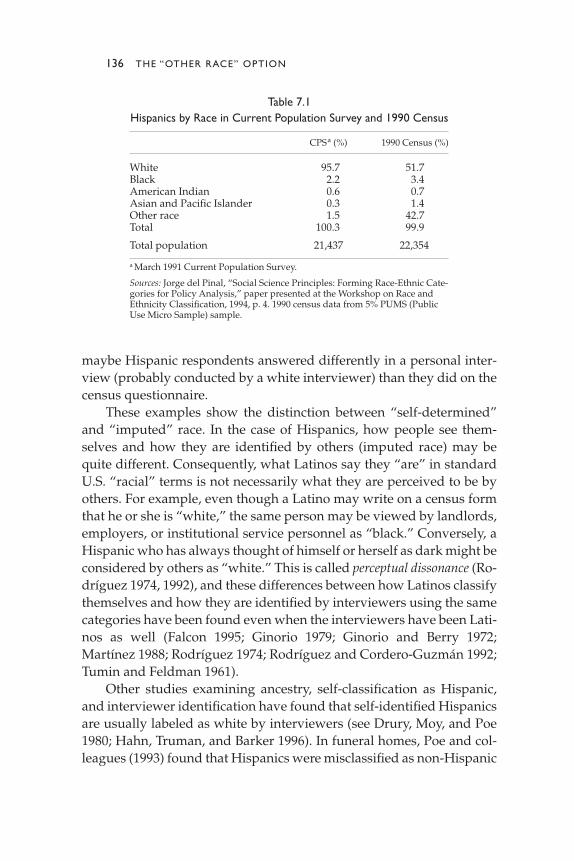
maybe Hispanic respondents answered differently in a personal inter-view (probably conducted by a white interviewer) than they did on thecensus questionnaire.
These examples show the distinction between “self-determined”and “imputed” race. In the case of Hispanics, how people see them-selves and how they are identified by others (imputed race) may bequite different. Consequently, what Latinos say they “are” in standardU.S. “racial” terms is not necessarily what they are perceived to be byothers. For example, even though a Latino may write on a census formthat he or she is “white,” the same person may be viewed by landlords,employers, or institutional service personnel as “black.” Conversely, aHispanic who has always thought of himself or herself as dark might beconsidered by others as “white.” This is called perceptual dissonance (Ro-dríguez 1974, 1992), and these differences between how Latinos classifythemselves and how they are identified by interviewers using the samecategories have been found even when the interviewers have been Lati-nos as well (Falcon 1995; Ginorio 1979; Ginorio and Berry 1972;Martínez 1988; Rodríguez 1974; Rodríguez and Cordero-Guzmán 1992;Tumin and Feldman 1961).
Other studies examining ancestry, self-classification as Hispanic,and interviewer identification have found that self-identified Hispanicsare usually labeled as white by interviewers (see Drury, Moy, and Poe1980; Hahn, Truman, and Barker 1996). In funeral homes, Poe and col-leagues (1993) found that Hispanics were misclassified as non-Hispanic
136 THE “OTHER RACE” OPTION
Table 7.1Hispanics by Race in Current Population Survey and 1990 Census
CPSa (%) 1990 Census (%)
White 95.7 51.7Black 2.2 3.4American Indian 0.6 0.7Asian and Pacific Islander 0.3 1.4Other race 1.5 42.7Total 100.3 99.9
Total population 21,437 22,354
a March 1991 Current Population Survey.
Sources: Jorge del Pinal, “Social Science Principles: Forming Race-Ethnic Cate-gories for Policy Analysis,” paper presented at the Workshop on Race andEthnicity Classification, 1994, p. 4. 1990 census data from 5% PUMS (PublicUse Micro Sample) sample.

on 19 percent of death certificates. Nationally, more than half of all His-panic infants who died within a year (between 1983 and 1985) wereclassified as either “white” or “black” on their death certificates, as were20 percent of Mexican, 48 percent of Puerto Rican, and 67 percent ofCuban infants (U.S. Office of Management and Budget 1997a:36910).This may seem morbidly amusing, but it has serious practical implica-tions for calculating infant mortality rates, for example. Other healthsurveys have found similar discrepancies between self-classification as“Hispanic” and interviewer identification as “white” or “black” (seeLindan et al. 1990; Massey 1980).
The Format of the Question
The format of the question also has an impact on how Hispanics re-spond. For example, the mere presence of an Anglo interviewer wasfound to influence responses. On the March 1980 Current PopulationSurvey, Hispanics identified themselves overwhelmingly as “white” toa census interviewer who presented them with four non-Hispanicchoices (Chevan 1990). One month later, however, when Hispanicswere filling out the census form in the privacy of their own homes andwere offered an “other race” alternative, 40 percent chose the “other”option (and wrote in a Latino referent). Thus, in the course of onemonth, the proportion of white Hispanics fell from 97 percent to 55.6percent.
How the question is structured or phrased also affects how His-panics respond. As Chevan (1990) noted, when Latinos are faced withrigid categories that do not include either a Hispanic or an “other” cat-egory, most Hispanics choose “white.” This was discovered to be thecase in the 1990 census reinterview studies. Many of those Latinos whohad said on the census form that they were “other race” shifted them-selves into the “white” category when interviewed later by census per-sonnel (McKenney et al. 1993). Rodríguez and Cordero-Guzmán (1992)found that if an open-ended question were used to ask Puerto Ricanstheir “race,”13 a wide variety of responses were elicited, but few saidthey were white (11.1%) or black (1.6%). The majority (57.5%) re-sponded with ethnic descriptors, for example, “Puerto Rican,” “Span-ish,” or “Latino.”
Part of the question’s context is the presence of other cultural groupsin the census’s race question, for example, Chinese and Japanese. Some
THE “OTHER RACE” OPTION 137
have argued that this may have prompted Hispanics to respond “other”and write in a Latino referent (Lowry 1982; Tienda and Ortiz 1986). Thisis quite plausible, for the appearance of these groups on the census formmight activate a sense of race more akin to that developed in LatinAmerica, that is, race as cultural or social (U.S. Bureau of the Census1992:3; Wagley 1965). The presence of such cultural groups on the cen-sus form became part of the context to which Latinos responded, andthis induced them to respond culturally as well. This is consistent withthe view that for Hispanics, racial self-classification is very dependenton context. In this case, the question included other cultural groups liketheirs, and so they responded to the question by also identifying them-selves culturally.14
The format—where the question is placed on the census form andhow the question is asked—also influences the responses. The formatand sequencing of the questions and the presence of other culturalgroups in the question were the main reasons offered that Hispanicschecked the “other race” category. In other words, because the formatof the question did not include the word race, the respondents mighthave mistakenly assumed that the question was asking about ethnicity.In addition, because the question about race preceded the questionabout Hispanic origin, Hispanics might have assumed that the racequestion was asking about their “Hispanicity” or Hispanic origin. Con-sequently, in 1990 the word race was inserted into the race question nu-merous times, and in 1997, it was decided to place the Hispanic ques-tion before the race question in the 2000 census because government re-search showed that “Hispanics appear less confused by the racequestion and do not select the ‘Other’ race category as often” when thisis done (U.S. Office of Management and Budget 1997a:36940).
Even though formatting issues did influence the “other race” re-sponses, they did not account for all the other race responses. As wehave seen, when the term race was reinserted into the question in 1990,the proportion of Hispanics saying that they were “other” rose. More-over, when Martin, DeMaio, and Campanelli (1990) reversed the se-quence of the race and Hispanic-origin questions in experimental tests(the Hispanic question was asked first), the percentage of Hispanicsborn in the United States who reported “other race” dropped. Foreign-born Hispanics, however, continued to report that they were “other.”
More recent experiments in which the Hispanic and race itemswere reversed resulted in fewer persons reporting they were “other,”
138 THE “OTHER RACE” OPTION
but the category of “other race” was not eliminated (Bates et al. 1994;McKenney et al. 1993; U.S. Office of Management and Budget1995:44679). The most recent and largest government surveys to dateobtained substantially the same findings (U.S. Bureau of the Census1996a, 1997; U.S. Office of Management and Budget 1997a:36912). AsBates and colleagues (1995:452, 455) concluded, “Other remained thepreferred race for a large minority.” These studies and their results willbe discussed again in chapter 8.
The Context in Which the Question Is Asked
The context in which the question is asked also influences re-sponses. From the respondents’ perspective, different contexts mayhave particular consequences, as illustrated by the Puerto Rican womanwho commented at a seminar on race: “The only time I respond that Iam ‘white’ on a questionnaire is when I’m applying for a mortgage or aloan.” Other situational factors affect how Latinos and other groups re-spond to questions about both race and ethnicity. Johnson and col-leagues, for example, found that 40 percent of their mixed-race and His-panic respondents changed the way they reported their racial/ethnicbackground depending on the context, social situation, options onapplication forms, or “perceived advantages in applying for scholar-ships, loans, school admissions, housing and employment” (1997:15).Changes in self-awareness and identification also were responsible forchanges in reported identity. Hispanics with two Hispanic parents were“much less likely (12.5%) to indicate ever having identified themselvesdifferently” (p. 15). Esbach and Gomez (1998) found similar contextualshifts among Hispanic youth, with their identifying more consistentlyas Hispanic in urban areas and less consistently in areas with few His-panics and also among English monolinguals.
WHO CHOOSES THE “OTHER RACE” RESPONSE?
Based on the presumption that the process of Americanization will pro-duce Americans with similar racial views, we would expect that thoseHispanics reporting that they are “other race” would be more likely tohave been in the United States for the least amount of time and to be for-eign born, have limited English skills and education, and low levels of
THE “OTHER RACE” OPTION 139

acculturation. This is not always the case, however. The relationshipsbetween these variables and how Latinos racially classify themselvesare complicated. Bates and colleagues’ multivariate analysis did notfind “conclusive evidence” that educational level, knowledge of Eng-lish, foreign or U.S. birthplace, or level of acculturation (i.e., whether ornot respondents were immigrants) were consistently associated withchoosing an “other race” response (1995:452–454). Moreover, my analy-sis of the 1990 census data shows a similarly complex picture. The fol-lowing section examines the largest Hispanic-origin groups (those withsubstantial proportions of U.S.-born individuals over the age of 18)with regard to each of the preceding variables.15
Those Least Educated
Do those who choose the “other race” category tend to be less edu-cated? Yes, but many of those with more education also check “otherrace.” As figure 7.1 indicates, the proportion of those who say they are“other race” does decline for all the major Hispanic-origin groups as ed-ucational attainment rises, but each group has a different slope and pro-file.16 In addition, self-classification as “other” remains substantial in allgroups, regardless of age or educational attainment.17 It is also consid-erably larger than the 2 percent or less of non-Latinos who choose the“other race” category.
In part, the higher numbers of Mexicans and Puerto Ricans indicat-ing they are “other race” is associated with the fact that they areyounger as a group. With greater age and education, Mexicans andPuerto Ricans report they are “white” more often and “other race” lessoften. For example, in the 1990 census data, more than 73 percent of col-lege-educated Mexicans (aged 45 to 90) reported they were “white,”compared with only 41 percent of young Mexicans (aged 18 to 26) whohad an eighth-grade education or less. The respective figures for PuertoRicans were 70 percent and 44 percent. Correspondingly, fewer of thissame older, educated group of Mexicans reported they were “otherrace” (22%), while more (58%) of the younger, less educated groupchose this option.
The most notable finding in this analysis was that the tendency toself-classify as “other race” persisted for substantial numbers of all His-panic groups, despite increasing age and education. Even in the oldestand most educated group (aged 45 to 90), for which classification as
140 THE “OTHER RACE” OPTION
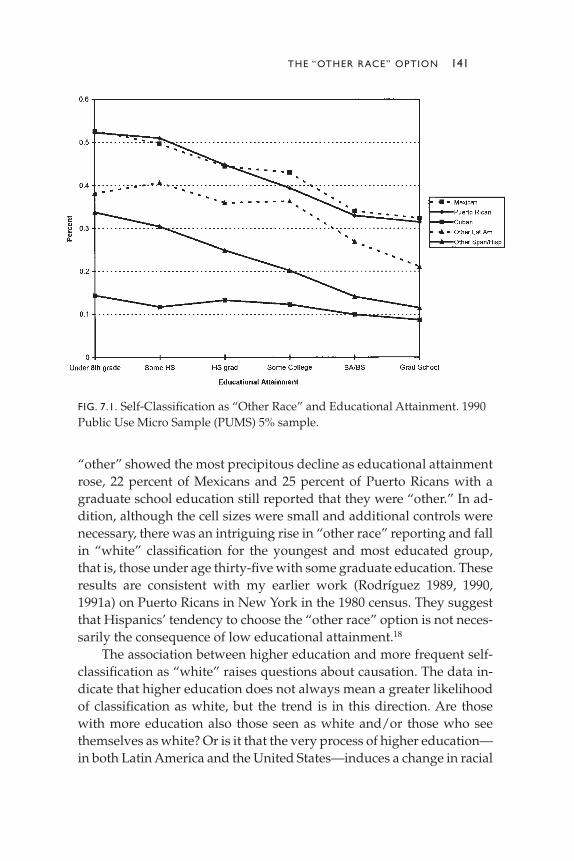
“other” showed the most precipitous decline as educational attainmentrose, 22 percent of Mexicans and 25 percent of Puerto Ricans with agraduate school education still reported that they were “other.” In ad-dition, although the cell sizes were small and additional controls werenecessary, there was an intriguing rise in “other race” reporting and fallin “white” classification for the youngest and most educated group,that is, those under age thirty-five with some graduate education. Theseresults are consistent with my earlier work (Rodríguez 1989, 1990,1991a) on Puerto Ricans in New York in the 1980 census. They suggestthat Hispanics’ tendency to choose the “other race” option is not neces-sarily the consequence of low educational attainment.18
The association between higher education and more frequent self-classification as “white” raises questions about causation. The data in-dicate that higher education does not always mean a greater likelihoodof classification as white, but the trend is in this direction. Are thosewith more education also those seen as white and/or those who seethemselves as white? Or is it that the very process of higher education—in both Latin America and the United States—induces a change in racial
THE “OTHER RACE” OPTION 141
FIG. 7.1. Self-Classification as “Other Race” and Educational Attainment. 1990Public Use Micro Sample (PUMS) 5% sample.
classification, so that individuals come to see and to identify themselvesas white?
Immigrants or U.S. Born?
Given that the foreign born tend to self-classify themselves differ-ently than do the U.S. born (Martin, DeMaio, and Campanelli 1990;McKenny and Bennett 1994:22), we would expect more foreign-bornHispanics to report they are “other race” and more native-born His-panics to classify themselves in traditional U.S. racial terms, that is, as“white,” “black,” or whatever. This is the case, but what is striking isthat there are still relatively high proportions of U.S.-born Hispanicswho choose the “other race” category, especially Mexicans and PuertoRicans.
In the three Hispanic-origin groups, with large proportions of U.S.-born individuals over the age of eighteen—that is, Mexicans, Puerto Ri-cans, and the “other Spanish/Hispanic” (OSH) group—more U.S.-bornLatinos classified themselves as “white,” “black,” or “API/NAI” thandid their foreign-born counterparts.19 Solid proportions of the U.S.-bornpersons in these groups, however, still classified themselves as “otherrace,” for example, 41.62 percent of U.S.-born Mexicans and 42.66 per-cent of Puerto Ricans born in the states. Figure 7.2 shows this distribu-tion for the largest group, Mexicans.20
De la Garza and colleagues obtained similar results from their sam-ple of 2,817 Latinos in the United States. They found, for example, that53 percent of foreign-born Mexicans and 44 percent of native-born Mex-icans chose the “other” category and supplied a Latino referent(1992:22–23). Finally, my analysis (Rodríguez 1989, 1990) of earlier 1980census data on Puerto Ricans in New York City found that 48 percent ofboth those born in Puerto Rico and those born in the states chose the“other race” category.21 In sum, it appears that although a majority ofU.S.-born Latinos choose traditional U.S. race categories, many alsochoose other race.
Those Who Speak Spanish at Home
Knowledge of the Spanish language is important to racial classifi-cation, for it conveys terms, concepts, and perspectives that do not exist
142 THE “OTHER RACE” OPTION

in English. For example, Spanish-language terms for “intermediate”racial types like trigueño or moreno are incorporated and influence one’sworldview. This may, in turn, make Latinos more likely to report thatthey are “other race,” for they view “racial” identities through differentlenses. The 1990 PUMS (Public Use Micro Sample) data do seem to sup-port the hypothesis that those who speak only English at home are morelikely to classify themselves in standard U.S. race terms, that is, as“white,” “black,” or API/NAI.22 This was true for almost all the His-panic-origin groups examined.
For example, the percentage of Mexicans who “speak only Englishat home” and classify themselves as “other” (37.3%) was considerablysmaller than those who speak Spanish at home (50.5%). For Puerto Ri-cans, the pattern was the same, with the respective figures being 27.8percent and 50.3 percent.23 Consequently, within these admittedlysmaller “English-only” Latino groups, more persons classified them-selves in traditional U.S. race terms, as “white,” “black,” or “API/NAI.”24 These results are consistent with earlier work that found ahigher percentage of those who spoke only English at home reporting
THE “OTHER RACE” OPTION 143
FIG. 7.2. Racial Self-Classification of Mexicans, 18 and Over, U.S. Born and For-eign Born, 1990. API includes Asian and Pacific Islanders; NAI includes Na-tive Americans. 1990 Public Use Micro Sample (PUMS) 5% sample.

that they were white or black (Rodríguez 1989, 1990). The relationshipof language to racial classification clearly is complex. As Bates and col-leagues noted, although a knowledge of English was not by itself con-sistently associated with choosing the “other race” response, speakingonly English at home did seem to influence the choice of more tradi-tional U.S. race terms. Therefore, speaking Spanish at home may also beassociated with classifying oneself as other race, but more research isneeded in this area (Bates et al. 1995:452–454).
The extent to which the Spanish language is retained and itsracial terminology and constructions are applied is, in turn, affectedby a Latino’s exposure to primary and secondary language environ-ments. For example, socialization (in a Spanish-language environ-ment) may be more important than birthplace to determining theracial self-classification of Hispanics. McKenney and colleagues’finding (1993) that speaking another language at home is associatedwith “inconsistency”—that is, with changing one’s racial classifica-tion, regardless of one’s proficiency in English—also suggests that ex-posure to Spanish-language environments is important to retainingintermediate and alternative views of race. The amount of travel toone’s country of origin may also affect language retention, assimila-tion, and racial self-classification. The circular migration and transna-tional migrations and communities associated with many Hispanicgroups, for example, Puerto Ricans, Dominicans, Colombians, andMexicans, are important in this regard.
Other variables may be significant. Rodríguez and Cordero-Guzmán (1992), for example, found that age, education, and the re-spondents’ perception of North Americans’ racial perception of themwere strongly related to Puerto Ricans’ racial self-classification.25 Moreresearch is needed to understand the role of these and other variables indetermining racial self-classification and identity. For example, doesliving in areas with a high proportion of Hispanics influence how His-panics racially classify themselves? What is the effect on Latinos’ self-classification of living near large (or small) proportions of othergroups?26 How does national origin, phenotype, or family color con-stellation—for example, being the darkest sibling in a family—affectracial self-classification? In particular, we need to investigate why manyLatinos born in the United States continue to classify themselves as“other” and to write in a Latino referent.
144 THE “OTHER RACE” OPTION
Those Who Have Been Here the Longest
The research on Latinos who have lived in the United States for along time is very limited, and the few data we do have—althoughoften qualitatively rich and provocative—are preliminary and onlyraise more questions. The assumption is if race is socially con-structed, then “persons migrating from one country to another arelikely to encounter an official schema for classifying origin, race orethnicity which is quite foreign to them” (Bates et al. 1995:435). Thequestion is whether the way that immigrants report their racechanges as their time in the United States increases. The followingstudies used different samples, time periods, and methodologies. Butbecause of these differences and the complexity of the question, thefindings must be interpreted cautiously.
Controlling for age, I found (Rodríguez 1989, 1990) that older,mainland-born Puerto Ricans in New York City classified themselves asblack and white more often than did younger, mainland-born PuertoRicans. I obtained the same result for Puerto Ricans born in Puerto Ricobut now living in New York, that the older they were, the more oftenthey classified themselves as white or black. However, Rodríguez andCordero-Guzmán (1992), controlling for age, education, and how thePuerto Rican respondents thought they were “racially classified byNorth Americans,” found that “length of time in the United States” wasonly moderately related to self-classification as white rather than otherrace.
Taking an ethnographic approach, Duany examined Dominicanmigration to the United States and Puerto Rico and found support forthe restructuring of “cultural conceptions of racial identity,” particu-larly regarding migration to the United States (1998b:148). He alsofound that transnationalism, that is, “back-and-forth” travel patterns,eroded hegemonic discourses in race and ethnicity in both the sendingand receiving countries (Duany 1998b) and contributed to redefinitionsof identity (Duany 2000).
Bates and colleagues (1995) found that more recent immigrants tothe United States reported that they were “other race” more often thanearlier immigrants did, but these results were not statistically signifi-cant. Latinos who had lived longer in the United States were also lessaffected by the reversal of the race and Hispanic-origin questions and
THE “OTHER RACE” OPTION 145
tended to choose the white and black categories (Bates et al. 1995).27 Inessence, reversing the sequence of the race and Hispanic-origin ques-tions appears to have affected the racial self-classification of Latinosborn in the United States, but not of those born abroad. This is consis-tent with the hypothesis that greater exposure to the United States in-creases the tendency to choose the white or black category.
If we compare the racial classification pattern of Hispanic immi-grants who arrived in the United States before 1980 with those who ar-rived after 1980, the pattern of racial classification varies considerablyby group. With regard to Mexicans, Puerto Ricans,28 Colombians, andSalvadorans, there is little difference in the racial configuration beforeand after 1980 (see table 7.2). At the same time, there were substantialchanges among Cubans,29 Dominicans,30 and Panamanians.31 Othergroups also show some, but relatively trivial, changes.32 It is temptingto conclude that these observations of racial classification patterns re-flect an alteration (or the lack thereof) in the racial classification of im-migrants the longer they live in the United States. It also is possible,however, that the changes represent a shift in the nature of the migra-tions before and after 1980 or that changes in the respective countriesare contributing to the differences in racial self-classification patterns,for example, changes in the way in which “race” is addressed by thesecountries’ political leaders.
Taken as a whole, the results of these studies and of more journalis-tic writings (see, e.g., Escobar 1999), suggest that the amount of timespent in the United States may not be sufficient by itself to determineracial self-classification. Just as important may be which years werespent in the United States or in the country of origin. The childhoodyears? Young adult years? Teenage years? Also important is the re-spondents’ subjective assessment of their time spent in the UnitedStates or their country of origin. This, in turn, may be influenced byother variables, such as relative socioeconomic status, discrimination,aspirations, and phenotype. Finally, whether immigrants who have ar-rived more recently have a different racial-classification pattern than dothose who arrived earlier varies by country of origin. That is, the natureand timing of immigration streams affect the racial classification pat-terns of Hispanic groups. The clearest example of this among Latinogroups are the Cuban migrations before Castro and soon after Castroand the Mariel boat lift (García 1996; Pedraza-Bailey 1985; Portes andBach 1985).
146 THE “OTHER RACE” OPTION

ALTERNATIVE VIEWS OR DENIAL
We also need to understand better whether the phrasing of the questionabout racial classification may frame the response. For example, asnoted earlier, an open question on race produced a majority of re-sponses that referred to what is considered in the United States as “eth-nicity” but generated a small fraction (12.7%) of responses that con-formed to traditional U.S. race categories, that is, white and black (Ro-dríguez and Cordero-Guzmán 1992). A closed question producedgreater numbers of respondents classifying themselves as white orblack, but the same proportion indicating they were “other.” In thisclosed question, however, fewer of those who said they were “other”(20%) used ethnic referents, and the majority (54.5%) used physical ref-erents; for example, they said they were intermediate or trigueño (awheat-colored individual).
If we think of the questions as representing contexts to which indi-viduals respond, did the open-ended question allow the Latinos in thisstudy to express their own view of race, and did the closed question re-strict their response? Even though the open-ended question in the 1992Rodríguez and Cordero-Guzmán study asked specifically about race, it
THE “OTHER RACE” OPTION 147
Table 7.2Percentage Differences, by Racial Classification and Hispanic-Origin Group,
of Immigrants Arriving before and after 1980
White (%) Black (%) API/NAI (%) Other (%) Total
Mexican -1.98 +0.31 +0.09 +1.76 1,733,947Puerto Rican -1.06 -0.19 +0.27 -1.13 251,486Ecuadoran -3.37 +0.14 +0.49 +2.73 58,421Colombian +1.58 +0.82 -0.24 +1.01 121,534Guatemalan -3.49 -0.74 -0.35 +2.39 120,658Salvadoran -0.32 +0.2 +0.35 -0.23 264,228Other Latin American +4.02 +2.2 +0.39 -5.85 322,604Other Spanish/Hispanic -9.64 +2.44 -1.63 +8.83 150,093Cuban -7.81 +2.6 +0.15 +5.06 174,328Dominican -0.28 +5.6 +0.19 -5.52 153,155Panamanian +0.54 -22.62 +2.2 -19.88 264,228Non-Hispanic -36.69 +5.06 +31.29 +0.33 3,902,646Total -23.77 +2.34 +14.59 +6.85 7,272,937
Figures indicate the percentage difference between pre-1980 and post-1980 immigrants. For example,the percentage of Mexicans reporting that they were white was lower for the post-1980 immigrants(43.37%) than for the pre-1980 immigrants (45.35%).
Source: 1990 (Public Use Micro Sample) 1% sample.
yielded several responses that ignored physical attributes, suggestingthat the respondents saw their “race” through their cultural frame ofreference. The closed question and the presence of categories for whiteand black, however, introduced a more North American racial contextin which the respondents answered in more physical-racial terms aboutthemselves. But we do not know to what extent these responses mayhave been influenced by the presence of a Latino interviewer.
From another perspective, we might argue that Latinos’ choice ofan ethnic descriptor, as opposed to a racial descriptor, reflects the disin-clination of many Hispanics to identify as black and that many moreLatinos would be classified or identified as black by others than thisstudy or the census figures indicate. According to Rodríguez andCordero-Guzmán (1992), when the question was closed and the re-spondents were asked whether they considered themselves to be white,black, or other, the number who said they were white increased sub-stantially, from 11.1 percent to 38.8 percent, and those who said theywere black increased slightly, from 1.6 percent to 5.1 percent. The smallproportion who said they were black raises the question of whetherthey had an aversion to classifying themselves as black or whether theyreally believed that they were simply not identified as black. We alsoneed to understand better why so few in the study responded “white”in the first open-ended question.
When Rodríguez and Cordero-Guzmán (1992) asked the respon-dents how they thought North Americans viewed them, the proportionanswering “black” doubled, from 5.1 to 11.9 percent, and the proportionassuming they would be seen as “white” fell from 38.8 to 30.5 percent.This suggests that more in the group thought they would be seen as“darker” when viewed through North American eyes. But the propor-tion who thought they would be seen as “other” stayed about the same.What changed was how they defined “other.” The number of “interme-diate” or trigueño terms that had been chosen by 30.6 percent of thegroup dropped, which is to be expected, since such terms or conceptsare not common in English. The largest percentage of the group thatchose the “other” category (28.5%) thought that they would be seen as“other, Spanish” or “other, Puerto Rican,” and another 11.5 percent didnot specify the kind of “other.” This shift in responses does indicate co-existing dual racial contexts and the respondents’ awareness of them.
If there are dual contexts in which the ways of viewing race (or un-derstanding the question about race) differ and if many Hispanics see
148 THE “OTHER RACE” OPTION

race as culture, national origin, and so forth, do they distinguish be-tween the concept of race and that of culture? In the United States, thesetwo concepts are distinct. In one small study, in which the respondentswere asked to define race and culture (Rodríguez 1992), many saw raceas inseparable and indistinguishable from culture, and others definedrace in geographic terms (as “where they came from”). Still others rec-ognized an intellectual distinction between race and culture but ig-nored it in their everyday lives or when describing their own identity orthemselves. Some respondents saw race as “independent of culture”and responded to questions of race and ethnicity in the way in whichthe census expected.33
McKay and de la Puente’s analysis (1995) of cognitive interviewscontained conceptual questions about race and ethnicity. But they de-cided that their respondents found the questions too difficult. Their re-sults thus differed from those of my 1992 study, which might have beenbecause of different methodologies and samples. McKay and de laPuente’s 1995 study used seventy-four respondents from various racialand ethnic backgrounds who had been recruited by community organ-izations, and my 1992 study used fifty-eight Latinos predominantlyfrom the Northeast. My questions were “How do you define race?” and“How do you define culture?” and McKay and de la Puente’s were“Please tell me what you think is the most important characteristic thatdefines race,” and “Do you think there is any difference between race,ethnicity, and ancestry?”
These results are intriguing but require more research with largernumbers to find out how other Latino groups in other parts of the coun-try would respond to standardized questions. What seems apparent atthis point is that many Latinos chose (and will choose) the “other race”category. Did they do so because they felt culturally or socially “none ofthe above” or because they refused to become officially “brown” in theeyes of North Americans? And what determines racial reporting in theother categories?
ASIANS, HAITIANS, JAMAICANS, AND RACE
Hispanics were not the only group that did not answer as expected orthat were seen to have problems with the race and ethnicity questionson the census. For example, in the census’s ethnographic studies, Straus
THE “OTHER RACE” OPTION 149

noted that of twenty respondents classified as Native Americans in theChicago census, only thirteen classified themselves as such in subse-quent interviews (1991:10). Wingerd found that the Haitians she stud-ied checked “other race” or left it blank (1995:17), and Bunte and Josephdiscovered that the Cambodians they studied were confused becausethey were not specifically listed in the Asian and Pacific Islander cate-gory (1992:10–11). All these results led to the conclusion that “the waypeople view their own ethnic or racial identity and the way they per-ceive the identity of others is a complex psychological and sociologicalphenomenon that needs to be better understood before modificationsare made to the race, Hispanic origin and ancestry questions on the cen-sus form” (de la Puente 1993:38).
The results of another not-yet published study by the census weresimilar (de la Puente 1993). In this study, foreign-born blacks and Asianand Pacific Islanders in Washington, D.C., San Francisco, and Miamiwere interviewed in English and were part of focus groups. This studyalso focused on cognitive understandings of race and ethnicity, in orderto determine the extent to which an English-speaking, foreign-bornblack’s, Asian’s, or Pacific Islander’s self-concept of race and ethnicitywould result in misreporting, nonresponses, inconsistent responses, orother problems. It was important, therefore, to understand the respon-dents’ thought processes and the terms they used when answeringquestions about race and ethnicity. For example, how did Haitians or Ja-maicans view such terms as “African American,” “Afro-American,” or“black”? Respondents were also asked about the Hispanic question, todetermine how much their culture and beliefs about race and ethnicityinfluenced their definitions of race, ethnicity, and ancestry.
The preliminary results indicate that these non-Hispanic groupsalso had different views of race, similar to those discussed in chapter 2as having existed in ancient times and also to those found in researchwith Hispanics (Rodríguez 1991c, 1992, 1994a; Rodríguez and Cordero-Guzmán 1992). In focused, cognitive interviews with twenty Filipinos,Chinese, Koreans, and Vietnamese, de la Puente (1993) found that therespondents:
• Tended to interpret “race” as “national origin.”• If born in the United States, checked “other” and wrote in, for ex-
ample, Chinese American for race, to acknowledge their “dual”origin.
150 THE “OTHER RACE” OPTION
• Had some awareness of the U.S. view of race but retained theirown views for self-definition.
• Had trouble understanding terms like ethnic origin and ancestrybecause of their limited proficiency in English.
When the respondents finally understood that the census wanted his-torical information in regard to ancestry, they supplied their nationalorigin, for example, “Chinese.”
Once we realize that the way race is currently viewed in the UnitedStates is not necessarily the way it is viewed by others or the way it hasbeen viewed historically, the question of how people view (or viewed)themselves becomes very interesting. For example, Judy Wingerd ob-served that in her research, Haitians in Miami considered it almost aninsult to be called black. Instead, the Haitians she interviewed had theirown register of colors and resisted being confined to one color. In Cre-ole, the term raz (race) is equivalent to “my people,” “the area of thecountry I’m from,” or “my history.” These concepts match Latinos’ ex-planations of why they checked “other race” and wrote in a Latino ref-erent, such as Puerto Rican, Dominican, or Honduran in response to thecensus’s race question (Rodríguez 1992).
EDUCATION AND RACIALIZATION
The role of education may be very important to constructing one’s con-cept of race. Most of the Haitian interviewees were both poorly edu-cated and immigrants to the United States, and they could not under-stand why race and culture were different concepts. Although theyounger people that Wingerd interviewed learned to call themselvesblack, some had different interpretations of the word. It may be that themore education that people have in any country, the more often they areexposed to either an alternative or the dominant view of race in theUnited States.
Summary
In summary, for Latinos, questions concerning “race” are verymuch affected by contextual variables, which in turn affect their re-sponses. The variation in Latinos’ responses (compared with the more
THE “OTHER RACE” OPTION 151

consistent responses of whites, African Americans, and Asians) reflectsthe influence of context. Who asks the question, who answers it, andhow and where it is asked—that is, whether the interviewer is Angloand a Hispanic category is a possible choice—the presence of other cul-tural groups as categories, and the question’s phrasing, structure, place-ment, format, and purpose all affect Latinos’ responses.
But what also is evident from this review is that many Latinos whochose the “other race” category saw their “race” as equivalent to theirnationality, culture, familial socialization, birthplace, skin color, ethnic-ity, or a combination of these. The respondents who answered “otherrace” to the race item were not necessarily “mixed” or mixed up, norwere they forced into the “other” response solely by context. Rather,they interpreted the question according to their own frame of reference,which differed from that generally used in the United States. Whetherthe tendency to choose “other race” represents (or incorporates) a de-nial of blackness or an alternative view of race needs further research.We also must ask whether this question itself reflects the hegemonic na-ture and pull of the United States’ bipolar racial structure. The U.S. Of-fice of Management and Budget stated that it changed its data collectionstandards and policy because it needed to collect information reflecting“the increasing diversity of our Nation’s population stemming fromgrowth in interracial marriages and immigration” (U.S. Office of Man-agement and Budget 1999:3). Our review of Latinos’ “other race” re-sponses sheds light on the complex dynamics underlying thesechanges; we will examine in the next chapter the political sources ac-companying these changes.
152 THE “OTHER RACE” OPTION
8
Redefining Race in 2000
I N N OV E M B E R 1 9 9 3 , Congressman Tom Sawyer, chair of the HouseSubcommittee on Census, Statistics, and Postal Personnel, completed aseries of hearings on federal measurements of race and ethnicity. Therewas nothing particularly remarkable about a series of hearings con-ducted by a fairly junior congressman, especially when they receivedrelatively little press attention. What made them extraordinary weretheir proposals.
THE PROPOSALS
The hearings focused on four proposals to amend the race item on theU.S. Census: (1) the addition of a multiracial category, (2) the additionof a special category for Middle Easterners/Arab Americans, (3) theshift of Native Hawaiians from the “Asian and Pacific Islander” cate-gory to the “Native American Indian” category, and (4) the inclusion of“Hispanic” as a race category.1 Except for the proposal on Hispanics,each had been advanced by representatives of the affected constituen-cies, and government officials and community representatives com-mented on the proposals (U.S. House of Representatives 1994).
Surprisingly, all four proposals challenged the status quo and theassumptions inherent in the government’s current racial and ethnicclassification. The proposals also implicitly reinforced the social con-structedness of race categories and their malleability and susceptibilityto political, intellectual, and social redefinition. But no groups formedalliances to support any of the proposals.2 Rather, the one area in whichthere was agreement was on the need for more research.
The U.S. Office of Management and Budget (OMB) also agreed atthe hearings to undertake a comprehensive review of the race and eth-nic categories used by government agencies, as it was responsible for
153
Directive 15, which specified and defined the categories (U.S. HouseCommittee 1994n). Directive 15 had been issued on May 12, 1977, tomeet the needs created by legislation passed to protect civil rights mon-itoring and enforcement, as well as the requirements of Public Law 94-311, passed one year earlier, which called for the collection, analysis,and publication of economic and social statistics on persons of Spanishorigin and descent.
Multiracial Americans
The multiracial proposal challenged the long-held assumptionthat racial categories were (or had to be) mutually exclusive.3
Whereas all the current racial categories assume one (predominant?)racial identity, that is, white, black, Asian or Pacific Islander, or Na-tive American Indian, a multiracial category would acknowledgethat a person could be more than one race. Even the “other” race cat-egory in the current census race question is mutually exclusive, forit is the choice to be checked when one is “none of the above.”4 Asnoted earlier, this mutually exclusive way of viewing race has en-abled North Americans in the United States to think of racial cate-gories as representing “pure” races (Lee 1993). The extent of mixing(miscegenation) between, for example, whites and blacks that hasproduced “mixed” children has thus been overlooked and the mythof “pure” races sustained.
Consequently, the possibility that a person might have more thanone racial identity (particularly at the same time) defied the conven-tional approach to race in the United States. This new approach ques-tioned the rule of hypodescent—in which one drop of black bloodmakes a person racially black (see Davis 1941; Russell, Wilson, andHall 1992; and Williamson 1984 for excellent analyses of the evolutionof this racial construction). Despite the traditional, exclusivist way ofviewing race, the concept of multiple identities, which was inherentin the multiracial proposal, is increasingly viewed as appropriate forpeople with various heritages. This concept is particularly relevant toHispanics and to other groups as well, for example, the children of in-terethnic or interracial marriages, ethnically identified Jews, and sec-ond-generation immigrants from many European, Caribbean, andAsian countries.
154 REDEFINING RACE IN 2000

Middle Easterners/Arab Americans
Although the multiracial proposal garnered the greatest media at-tention, it was the proposal for a “Middle Eastern” category that mostchallenged traditional and idealized assumptions about race and eth-nicity in the United States by pointing to precedents already in place.The proposal was for a Middle Eastern category, and the Arab Ameri-can representative who argued in its favor did so on behalf of the pop-ulation of the entire Middle East. She argued for “an ethnic non-racialclassification for persons from the Middle East”—whether or not Arab(U.S. House Committee 1994g:183).5 The Arab American representativecontended that Middle Easterners/Arab Americans deserved their owncategory for many of the same reasons that Hispanics and other groupshave their own categories. The arguments presented raised basic ques-tions about the nature of race and ethnicity, and the way they are deter-mined in the United States.
One argument was about self-classification versus classification byothers. Middle Easterners and Arab Americans have most recently beenclassified by the census as white, although a number of scholars havenoted that the media regard Arabs as nonwhite (Naber 1998; Shaheen1984; Shohat and Stam 1994). The Arab American representative alsopointed out at the hearings that in their personal lives, many Arabs andMiddle Easterners identified themselves as “people of color” and thatthis classification was increasingly influenced by current political andideological disputes and representations (U.S. House Committee1994g).6 According to one Arab American researcher, some Arab Amer-icans identify as white, and others as nonwhite, with a broad range ofphenotypical diversity—some Arab Americans have very dark skinand kinky hair, and others have blonde hair and blue eyes (Naber 1998).Moreover, some identify as nonwhite because they feel discriminatedagainst because of their political views or their Muslim identity, whichin mainstream American discourse is seen as different from and inferiorto a white identity (Naber 1998). Thus, some were embracing a not-white-American position at the same time that they were being classi-fied by the census as white.
Furthermore, because the census classifies Arab Americans aswhite, it is difficult to get a separate count for the group. The represen-tative argued that such counts were necessary because of current
REDEFINING RACE IN 2000 155
trends, such as discrimination against Arab Americans in the UnitedStates. This discrimination is seen as related to the politicization of eth-nicity, in which Arab Americans are often viewed negatively because ofthe United States’ changing political relations with some Arab nations.Another trend noted is the change in rates of immigration, with a more(physically and socially) diverse stream of Middle Easterners currentlycoming to the United States than in the past.
Also mentioned was the current context of pluralism, which en-couraged immigrant children to respect and be proud of their diversity,to view their native language as an asset, and to preserve their religiousand cultural practices. The representative noted that the current contextfavoring diversity conflicted with the speed with which Middle East-erners/Arab Americans were becoming Americanized. Consequently,they would continue as unassimilated (or visible) and persecuted mi-norities and therefore should be counted separately. In addition, theArab American representative pointed to “perhaps a demonstration ofcertain cultural disadvantages” that Arab Americans might experienceand to the possibly greater affirmative-action benefits and protectionsto be gained as a result of identifying as a minority. These protectionswere seen as necessary because of the discrimination against them,which has been documented by the American Arab Anti-Discrimina-tion Committee (Ekin and Gorchev 1992).
The Arab American Institute contended as well that both the His-panic and the Asian and Pacific Islander categories contained modelsrelevant to the reclassification of Middle Easterners. “The rationale forthe Hispanic classification was to measure a population sharing com-mon geographic and linguistic roots that could distinguish them fromthe rest of the white population” (U.S. House Committee 1994g:188).The institute pointed out that the Asian and Pacific Islander race cate-gory was similar in that it transcended precise racial characteristics andcovered a geographical region that represented many nationalities, lan-guages, and even racial groups.7 The proposed Arab American categorywould include Arabs, Iranians, Turks, Afghans, and others, who, it wasargued, had similar religious, linguistic, and cultural backgrounds;faced similar discrimination and exclusion; and were distinguishablefrom the European-based white majority.
Arab Americans noted a number of fluid and contextually depend-ent race constructs in the classification of Hispanics and Asians. For ex-ample, the focus on the increase in politically related discrimination, the
156 REDEFINING RACE IN 2000

cultural context celebrating diversity, the greater retention of culturaldifferences, the greater diversity of the immigrating population, andthe establishment of affirmative-action benefits all are context-depend-ent factors that influence how those affected view themselves and oth-ers. Moreover, the representative pointed out, “Just as self-definitionsinternal to racial minorities evolve and emerge, the lines between andaround race and ethnicity as identifiers continue to blur, shift and in-tersect over time” (U.S. House Committee 1994g:188).8
What was perhaps most interesting in the representative’s presen-tation is that her request did not represent “a racial redefinition, butrather a recognition of new realities.” In other words, Arab Americanswere not changing their “race”; rather, their position in American soci-ety had changed. In essence, they explained that in order to keep upwith the changing realities, Arab Americans should be counted as a sep-arate group, a new pan-ethnic group (Edmonston, Goldstein, andTamayo Lott 1996:33).
Some readers might view the Middle Eastern proposal as an at-tempt to capitalize on the benefits associated with the shift from an ex-clusionary to an inclusionary categorization. As a result of the civilrights movement, categories formerly used to exclude individuals nowhave been used to include individuals in affirmative-action programs,set-asides, and so forth (Fienberg 1994). This shift has introduced, how-ever, a new tension into the issue of classification, with some groupswanting to be classified as protected minorities so that they can benefitfrom these programs or because they need the programs’ protection.But it is also possible that—regardless of the benefits to be gained—Middle Easterners/Arab Americans, like Hispanics and other groupsor individuals, may simply want to be viewed in accordance with theirown self-conceptions of race and identity. Their position reflects a dif-ferent view of “race,” in which one’s (white or nonwhite) racial status isseen to bear no relationship to a group’s identity as a group. Indeed, ata later workshop, the Arab American Institute’s spokesperson insistedthat Arab racial identity is ethnic and not racial (Samhan 1994).
A Middle Eastern category was not established. In its final recom-mendations, the U.S. Office of Management and Budget noted that es-tablishing a new category would require a “consensus building effort toarrive at appropriate terminology and a definition” (U.S. Office of Man-agement and Budget 1997b:36934). Some of the issues in this group stillrequiring resolution were whether the term Arab American or Middle
REDEFINING RACE IN 2000 157

Eastern should be used. Should the category be defined as pertaining topersons whose “mother tongue” or culture was Arabic, or should thedefinition be more restrictive, and if so, which countries should beincluded?
Native Hawaiians
The request by Native Hawaiians to be counted in the “NativeAmerican” category, instead of in the “Asian and Pacific Islanders” cat-egory, also challenged another tradition: the use of geographic origin(with its implied biological characteristics) to determine race. Instead,Native Hawaiians insisted that their history as a conquered and indige-nous people be acknowledged, and not just their geographic location onthe Asian and Pacific side of the globe.
As Hawaii’s Senator Daniel Akaka explained, “Native Hawaiianshave a unique historical and political relationship with the UnitedStates” (quoted in Omandam 1997), which differs from that of NativeAmericans, who claim certain federal benefits based on earlier treatyagreements in which they exchanged land for perpetual educationaland health provisions. Before 1893, Hawaii’s treaties with the UnitedStates concerned friendship, commerce, and permission for U.S. shipsto enter Hawaiian waters and dock in its ports. Between 1826 and 1893,the United States recognized Hawaii as a sovereign nation and ex-tended it full diplomatic recognition. But in 1893, a U.S.-backed militarycoup overthrew the constitutional monarchy headed by Queen Lili-uokalani and in 1898 ceded Hawaiian lands to the United States (U.S.House Committee 1994o:199). It was in 1920 with the passage of theHawaiian Homes Commission Act that Native Hawaiians were firstclassified according to a blood quantum definition of 50 percent.
The Hawaiian proposal displayed the U.S. government’s colonialand imperialist past. In so doing, Native Hawaiians placed themselvesalongside groups like Native Americans, Puerto Ricans, and SpanishAmericans in the Southwest who do not consider themselves immi-grants to the United States but see themselves as part of the UnitedStates because the United States came to them and took over their land.Although the Hawaiians’ proposal was not supported, there has beensome change. In the 2000 census, Native Hawaiians are not listed underthe Asian and Pacific Islander category but have their own “NativeHawaiian” category along with other Pacific Islanders.
158 REDEFINING RACE IN 2000

Hispanics
Finally, the Hispanic proposal also reflected a radical departurefrom current policy. An important difference, however, was that it wasnot advanced by the constituent group. The proposal called for theelimination of the “Hispanic” identifier and the addition of a “His-panic” race category to the race question. The proposal challenged theCensus Bureau’s official position that race and ethnicity were separateconcepts, and it would reclassify what had been an “ethnic group”—inwhich Hispanics could be of any race—to a “race” group, in which allHispanics were one race.
The lack of constituent support for the proposal to include Hispan-ics as a race category was not noted during the hearings. Nor is it clearwho first advanced this proposal. This lack of Hispanic involvementcontrasted sharply with the Hispanics’ earlier involvement with thecensus. In 1970, “in response to demands by community groups for acomprehensive self-identification measure of Hispanic ethnicity,” sucha question was included in the 1970 census long forms, which were sentto 5 percent of households. This question relied on self-identificationand was not tied to parental birthplace or Spanish surname, as earlierquestions had been (McKenney and Cresce 1993:175–176).
According to Choldin, the census had resisted the demand for aquestion in which respondents would identify themselves as “His-panic,” arguing that it was too late to test such an item and that “ex-isting procedures for identifying Hispanic individuals were morevalid” (1986:407). But the White House intervened and instructed thesecretary of commerce to add a “Hispanic” self-identifier. Since mil-lions of questionnaires had already been printed, the compromisereached was that the question would appear on the long form sent to5 percent of households. (Only ten thousand copies of the long formhad been printed.) The question was also tested in the 1969 CurrentPopulation Survey.
The results of the 1970 mail-out, mail-back questionnaire were dis-puted and protested by Mexican American organizations who decidedon a class-action suit. It called for a new category on all the question-naires and for Mexican-American or Chicano face-to-face, Spanish-speaking enumerators, using Spanish-language questionnaires. Al-though the case never went to trial, the House subcommittee did holda series of hearings on statistics for “Spanish-speaking Americans.”9 It
REDEFINING RACE IN 2000 159
was these political forces that contributed to the emergence of the His-panic identifier on the 1980 census form.
This sometimes contentious and antagonistic history was not re-peated during the Sawyer hearings. Indeed, the Hispanic community’ssilence and lack of involvement on the issue of reclassification generallyand on the Hispanic proposal specifically were surprising. It is difficultto tell whether this resulted from the exclusion and obfuscation of theissues, a lack of awareness, a lack of Latino interest in the issue or in thecomplexity and perhaps perceived irrelevance of the discussions, an in-herent aversion to discussions of race, a sense that it did not matter howHispanics would be classified as long as they were counted, or a com-bination of all these and other factors.
Although the major, requisite Hispanic organizations were presentat the hearings, few representatives of the Hispanic community testi-fied. Likewise, there was little coverage of the issue in the Spanish- orEnglish-language media and few public discussions elsewhere.
When the Mexican American Legal Defense and Education Fund(MALDEF) and the National Council of La Raza (NCLR) testified atthese hearings, MALDEF indicated that a recommendation on“whether or how to change the Census’s Hispanic origin and race ques-tions would be premature” (U.S. House Committee 1994b:179). Bothgroups felt that the current Hispanic item should be retained; neitherendorsed the proposal as presented. Moreover, both recommended ad-ditional research before any change was made, and MALDEF addedthat any change contemplated should be targeted to reducing the dif-ferential undercount (U.S. House Committee 1994k:178–182).10
Only the National Council of La Raza made a statement at the hear-ings that was later cited as supporting this proposal (del Pinal 1994;Wright 1994). Yet a closer reading of the statement shows that by pro-posing that “Hispanic” be included as a category in the race item, thecouncil was also requesting that the item be relabeled Race/Ethnicity.(Its suggested question has this label; see U.S. House Committee1994p:178.) Moreover, the statement advocated retaining the currentseparate “Hispanic” identifier, whereas the proposal being consideredwould eliminate it. Perhaps because their position was misinterpretedby some, the National Council of La Raza decided to clarify its positionto the Office of Management and Budget (OMB): The NCLR “would beinclined to support the combination of the race and Hispanic originquestions into a question re-labeled ‘Race/Ethnicity,’ if testing indicates
160 REDEFINING RACE IN 2000
that such a question solicits a greater and more accurate response rate”(1995:8, italics in original).
The Census Bureau’s history concerning this issue also receivedscant attention in the hearings and other discussions of the proposal.Earlier, in 1984, the census formed and chaired interagency workinggroups (IWGs) to discuss the 1990 federal census data requirements.These groups were composed mainly of program specialists familiarwith census data and their applications. The IWG on race and ethnicitysupported retaining a separate question on Spanish/Hispanic originand concluded that a combined race/Spanish origin question (i.e., to in-clude “Hispanic” as a race group) “would not meet program needs andcould result in an undercount of the Spanish origin population” (U.S.Bureau of the Census 1990:5).
In addition, a proposal to count Hispanics as a race was introducedbefore the 1990 census but was so strongly opposed “through the mostaggressive campaign ever seen by the bureau” that agency officials de-cided to abandon it, fearing it would lose needed community support(Hispanic Link Weekly Report, May 26, 1986, p. 3). Subsequent attemptsby the census to institute such a proposal also were met with similar re-sistance (McKenney 1994).
A study (done after the proposal was made) did find that a major-ity of Hispanics preferred the combined question (U.S. Dept. of Labor,Bureau of Labor Statistics 1995:table 3),11 but this may reflect a differentunderstanding of the question. The study’s participants may have un-derstood it as “Do you want to be included?” rather than “Do you wantto be a ‘race’?” The preference for a combined question probably doesnot mean that Hispanics acknowledge or agree that they are a “race” inthe same way that the census conceptualizes this term. Moreover, asRuth McKay, a researcher at the Bureau of Labor Statistics, observed,“The respondents did not understand the consequences of combiningthe questions” (Torres 1996:4).
Given the history of the proposal in the Hispanic community andits lack of apparent support or even involvement, we might ask why theproposal was presented, and continued to be presented, as a seriousand legitimate proposal. A number of suppositions are possible. Mak-ing “Hispanics” a race would make life easier for the data gatherers be-cause there would be one item on the census instead of two and all so-cial races could be counted directly instead of subtracting Hispanicsfrom the various race categories. Having a combined question would
REDEFINING RACE IN 2000 161

also be cheaper for the Census Bureau, as there would be one less itemto tabulate. Indeed, one researcher at the hearings described getting de-tailed data on various race and ethnic groups as a “cumbersome andfallible process” (U.S. House Committee 1994m:54).
The proposal would also make the counting of Hispanics consistentacross government agencies. At present, the government counts His-panics in two ways, the census’s and that specified in Directive 15—theexecutive order resulting from a federal interagency agreement in 1977.Directive 15 places all people into five major racial/ethnic groups:“white,” “black,” “Asian and Pacific Islander,” “Native American In-dian,” and “Hispanic.” (The “other race” category is not included.)12
Those supporting the “Hispanic” race proposal may therefore havetried to adopt the Directive 15 model. But whereas the directive makesclear that it refers to both race and ethnicity, the census proposal re-ferred just to race.
In support of the Hispanic proposal, it could also be argued that theproposal was more like the Latino view of race in that it presented allthe “social races” together. Apparently, some persons subsequently ex-pressed support for a combined race/Hispanic-origin question because“many Hispanics do not identify as a race” and this would end the prac-tice “of using the term race which they see as a social rather than a sci-entific construct” (U.S. Office of Management and Budget 1995:44678).The term used in the proposal, however, was “race,” not “social race”and not ethnicity; and the proposal did not refer to ethnic or culturaldifferences among groups, which are central to Hispanic views of race.In essence, Hispanics were included in the model, but at the cost ofmaking them a race within a framework that privileged the white socialrace.
Some people may have supported the proposal because they felt itwas simply time to acknowledge a new nonwhite or “other” race in thecensus categories. According to their perspective, this new Hispanicrace would span a color continuum from “almost white” to “black.”Still others (both Hispanic and non-Hispanic) argued that Hispanicswere, for all intents and purposes, a race in the United States andshould therefore be counted as such. The NCLR, for example, notedthat despite the “technical” differences that might be found between“race” and “ethnicity,” the two terms were really used interchangeablyby society and were synonymous for “Hispanics.” Furthermore, be-cause Hispanics were treated as a “race,” it was important to be repre-
162 REDEFINING RACE IN 2000

sented in the race item (see chap. 1; Bendick 1992; de la Garza etal. 1992:94–95; Del Valle 1993; U.S. General Accounting Office 1990).Moreover, the lack of a Hispanic “race” category perpetuated theblack/white paradigm, which consistently excluded Hispanics. (How-ever, as noted earlier, what the NCLR envisioned as a “race” was some-what different from what was spelled out in the Hispanic proposal.13)Such approaches appeared to argue that Hispanics be called a “race” inreturn for recognition, as this might make the counts more accurate, re-solve the problem of Hispanic invisibility, alter the prevailing black/white axis and paradigm, and be more in keeping with changingdemographics.14
Although the proposal to make “Hispanics” a race received someattention by others testifying at the hearings, it was not enthusiasticallyendorsed by anyone. Indeed, some participants were explicitly againstit. For example, Arthur Fletcher, chair of the U.S. Commission on CivilRights, stated that the commission recommended “against reclassifyingHispanics as a racial group” because they were “a complex communityof races bound by common cultural, linguistic and geographic origins”(U.S. House Committee 1994b:253, 260). Tony Gallegos, chair of the U.S.Equal Employment Opportunity Commission, believed that the cen-sus’s successful experience with five racial/ethnic groups precludedthe need for such changes (U.S. House Committee 1994c:285–286).15 Butthe general consensus was that the proposal needed to be tested and itsimpact evaluated before it was put into operation (Morris 1994).
In addition, it was clear in the hearings that a multiracial categorywould cause more problems than it would solve. Some groups felt sucha category would jeopardize the numbers in their categories. It was notclear at the time, though, what a “Hispanic race” category would do tothe counts of other minorities. The lack of support continued, and theOffice of Management and Budget concluded that “most Federal agen-cies did not comment on whether race and Hispanic origin should becollected in one question or two questions. . . . Those few that com-mented were split on the issue” (1995:44678).
THE PERSISTENCE OF THE HISPANIC PROPOSAL
Despite the lukewarm reception and earlier resistance, the proposalcontinued to be considered seriously. When the Office of Management
REDEFINING RACE IN 2000 163
and Budget requested comments on the proposals being reviewed forthe “Standards for the Classification of Federal Data on Race and Eth-nicity” in 1994, it mentioned having “Hispanic as a racial designation,rather than as a separate ethnic category,” adding that combining raceand Hispanic origin has become one of “the more significant issues thathave been identified for research and testing” (U.S. Office of Manage-ment and Budget 1995:44690). Hispanic input into the proposal contin-ued to be minimal. Indeed, by the time the Hispanic Advisory Com-mittee to the Census was established in 1994, the proposal had alreadybeen discussed and researched. Instead, the meetings of the committeein 1995/96 were to discuss the findings from the National Content Sur-vey that had tested this combined question (U.S. General AccountingOffice 1997:8). At subsequent hearings on this proposal, Hispanic in-volvement did not greatly increase.
Nonetheless, the proposal persisted and became part of a massiveresearch effort. Of the four proposals presented at the House hearings,only two were pursued, the “Hispanic” proposal and the multiracialproposal. The Office of Management and Budget created the Intera-gency Committee for the Review of the Racial and Ethnic Standardsand, as part of this, an interagency research initiative. This research wasto evaluate the proposals for revising racial and ethnic reporting cate-gories and to determine the potential effect of any changes.
The Studies
The first study in this research agenda was a supplement to the Cur-rent Population Survey (CPS) that collected information on several keyissues, one of which was “the effect of adding ‘Hispanic’ to the list ofracial categories” (U.S. Dept. of Labor, Bureau of Labor Statistics1995:1). The Bureau of Labor Statistics designed the special supplementto the usual May 1995 Current Population Survey (CPS), so that it couldevaluate how the “inclusion of an Hispanic category in the list of races”would affect racial and ethnic data (U.S. Office of Management andBudget 1995:44690).16 This special supplement surveyed by phone morethan sixty thousand randomly selected households. The census alsoconducted cognitive research on this proposal, and by 1995, additionalresearch plans were made to examine larger samples (U.S. Office ofManagement and Budget 1995:44691).
164 REDEFINING RACE IN 2000
Other agencies were to carry out similar research. For example, theNational Center for Health Statistics, using an approach similar to thatof the Bureau of Labor Statistics (i.e., comparing combined and separaterace and Hispanic-origin questions), was to examine the effects of racialclassification changes on birth certificates. The Centers for Disease Con-trol and Prevention were to evaluate the recording of racial classifica-tions on death certificates. The Department of Health and Human Ser-vices (DHHS) was to conduct a literature search and make an inventoryof DHHS minority health databases. Finally, the National Center for Ed-ucation Statistics was to examine current issues, state legislation, andhow schools currently collect, maintain, and report racial and ethnicdata (U.S. Office of Management and Budget 1995:44690–44691).
In 1996, the Bureau of the Census conducted two other major stud-ies. Both sent self-administered, mail-back questionnaires to 90,000households for the National Content Survey (NCS) and 112,000 house-holds for the Race and Ethnic Targeted Test (RAETT). The NationalCenter for Education Statistics and the Office for Civil Rights in the De-partment of Education conducted surveys in public schools to deter-mine how they collect data. Finally, the National Center for Health Sta-tistics, the Office of the Assistant Secretary for Health, and the Centersfor Disease Control and Prevention studied the methods used to gatherdata in this area.
The CPS, NCS, and RAETT tested a number of innovations, includ-ing the introduction of a multiracial category, a proposal to make His-panics a race (subsequently called the combined format), and the reversalof the sequence of the race and Hispanic questions. Although several in-teresting and detailed results were produced, the net result of the CPS,NCS, and RAETT studies was that the combined format resulted infewer Hispanics and whites being counted (U.S. Dept. of Labor, Bureauof Labor Statistics 1995:table 1).17 Consequently, the proposal to make“Hispanic” a race was abandoned.
The Purpose of the Hearings
Why did the proposal to make “Hispanic” a race persist despite itslukewarm support? To answer this, we should ask, Why did these hear-ings take place at all? Why were they examining previously unexam-ined questions? What was their purpose?
REDEFINING RACE IN 2000 165

A later analysis of the revision process maintained that the OMBbegan to consider revising the federal standards for racial and ethnicclassification because of the demographic and social changes takingplace in the United States and because of the increasing dissatisfactionwith the current standard among data users, data providers, and thepublic (Edmonston, Goldstein, and Tamayo Lott 1996:35).18 Thus thepurpose of the hearings was to ascertain whether the way the federalgovernment measured race and ethnicity was satisfactory. The fact thatthis question was being asked at all signaled a major adjustment in theway that racial and ethnic concepts—until now taken at face value—might be viewed in the future. The “concerns” expressed at the hearingshinted at some of the underlying issues that led to this reexamination.
The Concerns Leading to the Hearings
Congressman Thomas Sawyer opened the hearings by citing threeconcerns: (1) the identification of multiracial persons, (2) Hispanics andMiddle Easterners who do not identify with any of the four major racialcategories, and (3) self-identification by foreign-born persons whoseunderstanding of race is often shaped by different definitions and un-derstandings in their countries or cultures of origin. Although only thesecond concern refers specifically to Hispanics, all three pertain to thembecause many are foreign born, many are seen to be multiracial, andmany have different views of race.
These concerns raise a number of questions, not the least of whichis why these issues were being addressed in 1993. For example, “theidentification of multiracial persons” implies that there is currentlysome interest in, or need to identify, multiracial persons. The last timethat the census counted in a separate category those people whom itviewed as multiracial was in 1920, when it classified “mulattoes” as arace category.
The third concern suggests an awareness of alternative views ofrace among the foreign born when it acknowledged that the under-standing of race and “self-identification by foreign-born persons” is“often shaped by different definitions and understandings in theircountries or cultures of origin.” The second concern, however, “His-panics and Middle Easterners who do not identify with any of the fourmajor racial categories,” raises the question of why it is acceptable forthe foreign born, but not the groups called “Hispanics” and “Middle
166 REDEFINING RACE IN 2000

Easterners,” to have different understandings of race. Was the assump-tion that these groups were born in the United States and not abroad? Ifso, then the real concern was that different understandings of “race”were persisting among Hispanics and Middle Easterners born in theUnited States
Preceding these hearings was a more general questioning andheightened awareness of the resurgence of racial and ethnic tensions onan international scale, for example, the Islamic fundamentalists’ con-flicts. In addition, in the U.S. scientific community there was a major re-examination of race and ethnicity. The fact that this was receiving spe-cial attention in the major media added to the need to reconsider themeaning of race and ethnicity (see, e.g., Barringer 1993; Bernal 1987;Discover November 1994; Marks 1994; Newsweek February 13, 1995;Rosin 1994; Wood 1994; Wright 1994).
Congressman Sawyer noted that the stated “concerns” had beenvoiced by “many people . . . during the 1990 census” (U.S. House Com-mittee 1994a). These “many people” may have been those gathering thedata or those constituencies interested in specific census issues. At thegovernmental level, the concern began to surface largely because of theresults of the 1980 and 1990 censuses. With the shift in the 1980 decen-nial census from interviewer-identified race to self-identified race, un-expected issues and questions emerged. According to a former censusofficial, the idea of “race and ethnicity” as a state of mind had not beenaccepted by the census earlier, but with the shift to self-identified race,the census recognized that this type of reporting raised other issues(Estrada 1994).
Data-Quality Problems
Four key problems were discussed in a report submitted to Con-gressman Sawyer by the General Accounting Office (GAO) earlierthat year:19
1. The growth of the “other race” category.2. Problems in the consistency with which some groups reported
their race and Hispanic origin.3. A high allocation rate for the Hispanic item.4. Some misreporting problems in both the race and the ethnicity
items.
REDEFINING RACE IN 2000 167
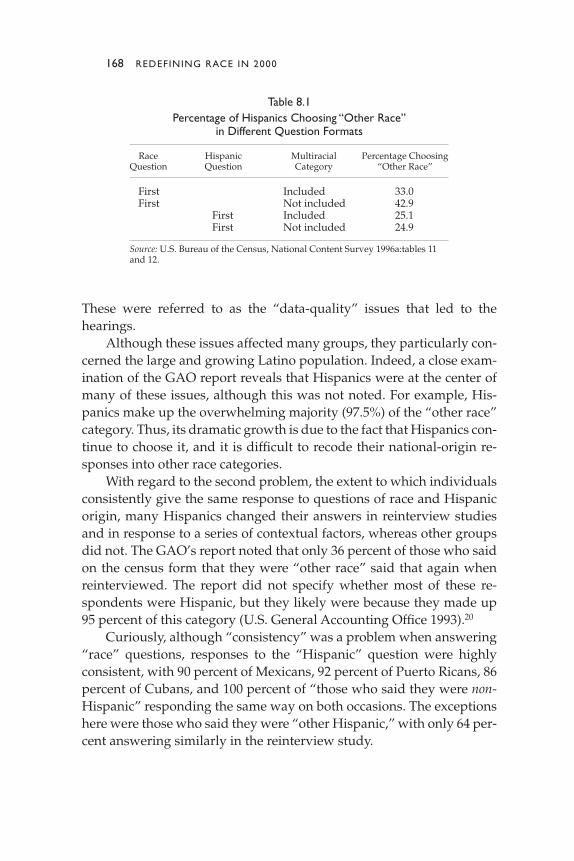
These were referred to as the “data-quality” issues that led to thehearings.
Although these issues affected many groups, they particularly con-cerned the large and growing Latino population. Indeed, a close exam-ination of the GAO report reveals that Hispanics were at the center ofmany of these issues, although this was not noted. For example, His-panics make up the overwhelming majority (97.5%) of the “other race”category. Thus, its dramatic growth is due to the fact that Hispanics con-tinue to choose it, and it is difficult to recode their national-origin re-sponses into other race categories.
With regard to the second problem, the extent to which individualsconsistently give the same response to questions of race and Hispanicorigin, many Hispanics changed their answers in reinterview studiesand in response to a series of contextual factors, whereas other groupsdid not. The GAO’s report noted that only 36 percent of those who saidon the census form that they were “other race” said that again whenreinterviewed. The report did not specify whether most of these re-spondents were Hispanic, but they likely were because they made up95 percent of this category (U.S. General Accounting Office 1993).20
Curiously, although “consistency” was a problem when answering“race” questions, responses to the “Hispanic” question were highlyconsistent, with 90 percent of Mexicans, 92 percent of Puerto Ricans, 86percent of Cubans, and 100 percent of “those who said they were non-Hispanic” responding the same way on both occasions. The exceptionshere were those who said they were “other Hispanic,” with only 64 per-cent answering similarly in the reinterview study.
168 REDEFINING RACE IN 2000
Table 8.1Percentage of Hispanics Choosing “Other Race”
in Different Question Formats
Race Hispanic Multiracial Percentage ChoosingQuestion Question Category “Other Race”
First Included 33.0First Not included 42.9
First Included 25.1First Not included 24.9
Source: U.S. Bureau of the Census, National Content Survey 1996a:tables 11and 12.
On the third problem, it was also the “Hispanic” item that had thehighest allocation rate.21 The Census Bureau allocates a particular re-sponse for questions left unanswered on the census questionnaire. Thisallocation procedure is based on a complicated series of steps for eachitem that best approximates the missing information.
The allocation rate for the Hispanic-origin question was not onlythe highest of all the questions, but it also increased from 4.2 percent in1980 to 10 percent.22 This was seen as particularly problematic: “The re-sults from the 1990 census showed that the Hispanic-origin item con-tinues to pose one of the more significant data quality challenges for theBureau in terms of allocation rate” (U.S. General Accounting Office1993:24).
Why was the allocation rate so high for the Hispanic question in1990? Why did 10 percent not answer the question about whether theywere Hispanic? The GAO report saw two underlying problems: Onewas that many persons who were not Hispanic skipped the question al-together because they did not see it as relevant.23 Another problem wasthat some Hispanics “equate their ‘Hispanicity’ with race by respond-ing ‘other race’ in the race item, indicating they are Hispanic in thespace the race item provides, and then skipping over the Hispanic ori-gin item because they see this item as superfluous” (U.S. General Ac-counting Office 1993:25). That is, “confusion” about the race item mighthave spilled over to problems with the Hispanic-origin item. The GAOreport does not explain what it means by “confusion” with the raceitem, the implication is that it refers to Hispanics’ responding they are“other race.” Two years later, the OMB stated that most of those whodid not respond to the “Hispanic” item were non-Hispanics (U.S. Officeof Management and Budget 1995:44689). Consequently, the reason forthe high nonresponse rate for the “Hispanic” item was more that non-Hispanics saw the question as irrelevant to them than that Hispanicswere “confused.”
The last problem, misreporting, refers to several problems but isseen to be principally the result of mistakes or misinformation. An ex-ample is those who responded they were “other Hispanic” and latersaid in the reinterview studies that they were not Hispanic at all butwanted to indicate they were “other than Span/Hisp.”24 Examples ofmisreporting in the race question are those who checked the “otherrace” category and wrote in a response that the census reclassified as
REDEFINING RACE IN 2000 169

one of the other four race categories, so “German” in “other race” wasreclassified as “white.” The report does not make clear to what extentHispanics were involved in this problem. Indeed, it is these early re-ports’ lack of reference to Hispanics’ specific reporting behavior that ismost puzzling, particularly because Hispanics were so central to manyof the concerns raised at the hearing.25
These problems notwithstanding, the GAO report concluded thatthe 1990 data on race and Hispanic origin were “generally of highquality” (U.S. General Accounting Office 1993:28). The report didnote a growing awareness of the population’s increasing diversity,but it was not Hispanics to whom it was alluding; rather, the reportcited the more than 200,000 codes that had to be developed to accom-modate all the write-ins in the “Asian and Pacific Islander,” “NativeAmerican Indian,” and “other race” categories (U.S. General Ac-counting Office 1993:28). The responses that produced the greatestnumber of codes because of write-in responses were the Ancestry andthe Native American Indian items (Edmonston, Goldstein, andTamayo Lott 1996:23).
FINDINGS FROM THE GOVERNMENT’S STUDIES
• Regardless of the format used, a substantial proportion of the an-swers remain in the “other race” category.
An important part of the “data-quality” issues addressed was the re-spondents’ tendency to choose the “other race” category. As we nowknow, almost all those (97%) in this category were Hispanic. The pur-pose of the proposal to make “Hispanic” a race was to reduce the num-ber of persons choosing the “other race” category. I suspect that the rea-soning was that if Hispanics saw their group represented with the oth-ers, they would choose “Hispanic” and not “other race.” In all threestudies, when Hispanics were made a race; that is, when the combinedquestion was used, the number of persons who chose the “other race”option dropped. But what the studies showed was that regardless of thecontext of the question, for example, whether or not a multiracial cate-gory was included or whether multiple responses were allowed, manypeople still chose the “other race” category.
170 REDEFINING RACE IN 2000
Sequencing was also thought to affect whether Hispanics chose the“other race” option; that is, if Hispanics were asked about their His-panic origin first, they would not choose “other race.” In all three stud-ies, placing the “Hispanic” question before the “race” question did re-duce—but did not eliminate—the number of persons choosing the“other race” option.
An example of this adherence to the “other race” response can beseen in the NCS study in which respondents were asked to choose theirrace under what might be considered—from a statistician’s perspec-tive—fitting conditions for discouraging an “other race” response (U.S.Bureau of the Census 1996a). Ideal conditions meant including a “mul-tiracial” category (so that those of mixed race could choose it) and plac-ing the “Hispanic” question before the race question (so that those whosaw “race” as “culture” and “national origin” would have already iden-tified themselves as such and could now choose their race). Under theseconditions, the proportion choosing “other race” did decline, but 25.17percent of Hispanics still chose this option (see table 8.1). (Although thiswas a substantial proportion, it was not statistically significant.)26
• Hispanics choose more than one category even when instructednot to.
Two other findings from these studies are relevant. One is that when thecombined question was used in the RAETT test, a high percentage of re-spondents (18% to 19%) checked that they were Hispanic and alsochecked one of the other race categories. Indeed, the Hispanic respon-dents checked more than one category even when they were instructednot to do so (U.S. Bureau of the Census 1997:4, chart I). Although the re-sults of the RAETT test can be generalized only to areas with relativelyhigh concentrations of Hispanics and other targeted populations, it isinteresting that the census’s Hispanic Advisory Committee recom-mended that respondents be allowed to choose “more than one” cate-gory on the “Hispanic” item as well. In other words, the committeethought it important that respondents be able to say they were both“Hispanic” and “not Hispanic” (those who might want to acknowledgea Hispanic component as well as a white, black, etc. component in theirresponse). This recommendation was considered but not accepted be-cause it had not been tested.
REDEFINING RACE IN 2000 171

• The responses of Hispanic-origin groups differed.
Finally, some of the studies showed that the various Hispanic-origingroups responded differently to the questions. For example, in the CPSstudy, when having to choose the “Hispanic” or another category in thecombined question, a minority of Cubans (39.92%) chose the “His-panic” category, compared with a majority of Mexicans (85.15%),Puerto Ricans (71.51%), and Central or South Americans (77.67%). Theintroduction of a multiracial category increased the percentage ofCubans who chose the “Hispanic” category, but it was still only 46.40percent. In the other Hispanic groups, the percentage choosing the“Hispanic” category also increased slightly or stayed about the same(U.S. Office of Management and Budget, 1997a:36916, table 4.4). Theseresults are consistent with those cited in chapter 7 regarding whochooses the “other race” option.
• Why Did Hispanics Choose “Other Race”?
As noted earlier, the reasons that some Hispanics continued to choosethe “other race” category are complex and require further research. Tosome degree, the context and format of the question influence thechoice. But the choice also reflects different conceptions of “race” andperhaps a resistance to the racial structure as articulated in the UnitedStates. This resistance may be traced to Hispanics’ objections to beingclassified as a uniform, subordinate, not-white race. Or it may irritateHispanics who see themselves as physically diverse and defined by na-tional origin or culture. In either case, making “Hispanic” a race mayhave been seen as a perpetuation and extension of the racialist thinkingof the past.
The OMB’s final recommendations cite findings that both sup-ported and did not support separate race and Hispanic-origin ques-tions. Those findings that did not support a combined question werethat the concepts of race and ethnicity were difficult to separate; thatHispanics want to identify their race in addition to their Hispanic ori-gin; that some Hispanics, including the Census Hispanic AdvisoryCommittee and most Hispanic organizations, opposed a single, com-bined question; that “Hispanic” was not considered a race by some re-spondents and users; and, finally, that a combined question would in-crease the need for additional tabulations because people would choose
172 REDEFINING RACE IN 2000

more than one category. Those findings that did support a single, com-bined question indicated that it would eliminate redundancy, therebyacknowledging that for many Hispanics, race, culture, and national ori-gin are the same.
Race in Formation
The OMB finally decided to retain the two-question format, but italso decided to allow individuals to choose more than one category.27
Moreover, it recommended that when self-identification was not feasi-ble or appropriate, a combined question could be used (U.S. Office ofManagement and Budget 1997a:36930, 36939). The recommendationthat a combined question be used when self-identification was not pos-sible suggested that attempts be made “to obtain proxy responses (fromfamily or friends) as opposed to using observer identification” in orderto ensure accurate data.
Unresolved Issues
According to the Office of Management and Budget, governmentresearch shows that less than 2 percent of persons are expected tochoose more than one race category (U.S. Office of Management andBudget 1999:4; Tucker et al. 1996). The preliminary Census 2000 DressRehearsal Results, although not representative of the country as awhole, also do not show many persons choosing more than one cate-gory (del Pinal 1999). Therefore, the OMB does not anticipate any sig-nificant impact on redistricting decisions or on total population countsused for apportionment or for compliance with one-person, one-voterequirements because of the “choose more than one” option (U.S. Officeof Management and Budget 1999:33 ff). But other researchers estimatethat the impact will be larger, that this shift may be greater than the netsize of the undercount (Goldstein and Morning 1999). Moreover, theyestimate that this shift will have different effects on the single-racegroups, with whites declining between 3 and 6 percent, blacks between3 and 7 percent, Native Americans between 15 and 25 percent, andAsian and Pacific Islanders between 4 and 9 percent.
This change in practice and policy has been put into effect. Butat this writing, there still are a number of unknowns. Unknown (andnot included in the preceding estimates) is the role of the media in
REDEFINING RACE IN 2000 173

influencing individuals to “choose more than one.” Also unknown arethe implications for race-based public policies. As Goldstein and Morn-ing (1999) asked, Will people who in the past said they were white andnow claim Native American Indian ancestors in the race question be el-igible for minority small business loans? Will those who previously saidthey were only black and now say they are white and black no longerbe eligible? Should some individuals (or groups) of more than one racebe protected classes and others not? For example, if those of Japanese-white ancestry are economically more advantaged than those of Viet-namese-black ancestry, should the latter be protected but not the for-mer? Last, it is not known how the data should be tabulated. A numberof possibilities are under discussion, but no firm decision has beenmade (U.S. Office of Management and Budget 1999).
Issues Raised
The “Hispanic” proposal, as well as the other proposals discussedat the initial hearings, raise a number of issues. They—and the eventsthat followed these hearings—also revealed the dynamics of racial for-mation as we approach the next millennium. All the proposals madeclear the extent to which race and the construction of racial categoriesare influenced by nonbiological factors, although this was seldom rec-ognized or expressed.
On a theoretical level, the proposal to make “Hispanic” a raceraised the issue of how Hispanics should be counted. Should they betreated as a European ethnic group (albeit multiracial) or as a separaterace? The first approach was (and is now) the one in effect in the census:Hispanics could be of any race. The second approach implied that His-panics were seen (and saw themselves?) as a distinct social group—arace—regardless of phenotype.
Hispanics, as well as many other groups, challenge the U.S. systemof racial classification because they do not fit neatly into the given cate-gories. They are neither a race nor a racially homogenous ethnic group.Rather, they are a diverse array of multiracial ethnic groups, bound to-gether by language, cultural ancestry, and discrimination in the UnitedStates. They can best be understood in a paradigm acknowledging thatthe social constructions popularly called “race” are really all socialgroupings that convey political, social, and cultural differentials.Within such a paradigm, Latinos and other “races” are clustered eth-
174 REDEFINING RACE IN 2000
nicities in a hierarchy of power growing out of the history of whites andother social races in the United States.
Hispanics contributed significantly, albeit silently, to the concernsvoiced and to the “data-quality” issues raised that prompted the hear-ings and subsequent research. Indeed, it might be said that Hispanicshave come to redefine everyone else, as in the use of terms such as “non-Hispanic whites” and “non-Hispanic blacks.” An interesting irony hereis that at the same time that the influx of Hispanics led to the redefini-tion of all other groups, the government attempted to redefine Hispan-ics as a race. Just as in 1930 when the government introduced a “Mexi-can” race category, as we end the twentieth century, the government isproposing to create a race category for all Hispanics. The increase innumbers at both times contributed strongly to these racial classificationprojects.
The “Hispanic” proposal also highlighted the role played by “race”or color in the United States. Making “Hispanic” a race and eliminatinga separate “Hispanic” identifier would not allow individuals to re-spond that they were, for example, both Hispanic and black (U.S.House Committee 1994k:179). As noted previously, research has shownthat Hispanics who classify themselves as white or who are classified aswhite by others fare better economically than those classified in otherracial categories (Arce, Murguía, and Frisbie 1987; Rodríguez 1990,1991a, 1992; U.S. Office of Management and Budget 1995:44678; Tellesand Murguía 1990). Using one combined question might make it moredifficult to determine which Hispanics are more likely to be victims ofdiscrimination. In addition, making “Hispanic” a race would make itdifficult to compare the data with past censuses. Finally, a combinedquestion might also dilute the counts of other race groups; for example,Hispanics who in the past might have reported that they were “black”or “white” might indicate instead that they were “Hispanic” (U.S. Of-fice of Management and Budget 1995:44678). As Rachel A. Joseph ar-gued, the counts and comparability of counts over time of NativeAmericans would be affected adversely by making “Hispanic” a race(U.S. House Committee 1994l). In 1990, 165,000 (or 8.5%) of the 2 millionwho said they were “Native American Indian” also reported that theywere of Hispanic origin.28
The hearings and the subsequent process showed “race” in forma-tion. They showed, and sometimes acknowledged, the difficulties andcontradictions of the current racial classification structure. While in the
REDEFINING RACE IN 2000 175

past and in public discourse, racial and ethnic concepts had often beenprojected as fairly immutable and not subject to diverse interpretations,it was now being publicly acknowledged on a national level that theseconcepts were not mutually exclusive but were fluid and “dynamic”(U.S. House Committee 1994f).29 Thus, on the one (conceptual) hand,the intermingling of the concepts was recognized, but on the other(practical or applied) hand, the concepts were treated as separate.
In stating the “lessons” from the hearings, Congressman Sawyerstated that “the categories had to be relevant to those responding if co-operation was to be secured.” This revealed the growing official con-cern that current categories might not be relevant to some respon-dents.30 This lesson also raises questions about the government’s abilityto identify individuals correctly and clearly. In addition, it suggests anemerging awareness of procrustean census tactics on the part of gov-ernment officials. Last, it poses the question of whether there is a con-flict between providing recognizable categories that are relevant to re-spondents and needing to gather uniform, comparative data.
Although the stated concerns and the final formulations raised anumber of questions, taken in concert they suggest the extent to which“race” and “ethnicity” are being reassessed in the public sphere. Theyalso reveal a changing demographic picture as well as a serious reex-amination of race by academics and policymakers that may be having asignificant influence on public discourse. The hearings also demon-strated that the government is beginning to question its former viewson race and ethnicity and to explore alternative views.
The final determination of how race and ethnicity will be measuredor viewed in the next century will depend on several factors. Demo-graphic diversity will continue. Individuals and groups will continue tohave their own particular and changing views on race. The incidence ofintermarriage and the number of interracial individuals will also con-tinue to grow. Consequently, if we are to understand the growing di-versity of this country, we must improve our understanding of howpeople view themselves.
176 REDEFINING RACE IN 2000
Appendix A
Data Limitations and the Undercount
When we examine data on the racial self-classification of individuals,we assume that the data reflect individual choice. But we do not knowwho fills out the census form and how the “race” of each person in ahousehold is determined. Generally, one person in the household fillsout the census forms, but which person that is, the mother, father, eld-est son, or whoever, may affect the racial classifications recorded.
The data on Hispanics do not include Brazilians, but they do in-clude persons from Spain. Although Brazilians are not considered His-panic because they do not speak Spanish, many Brazilians considerthemselves Latinos, though not usually Hispanics.
THE UNDOCUMENTED AND THE UNDERCOUNT
We do not know how many undocumented persons are included incontemporary census data, but we know that Latinos make up a largeproportion of the growing numbers of both undocumented and docu-mented immigrants. Different methods yield different estimates of theundocumented, with the total number ranging from 2 million to 5 mil-lion (Passel and Woodrow 1984; Woodrow-Lafield 1992, 1993). But be-cause we do not have estimates of how many undocumented arecounted in the census data, we must assume that they underestimatethe numbers of Latinos, though we do not know by how much. Despitethis underestimation, the numbers of Latinos have increased dramati-cally. As we have noted, in 1997 the U.S. population “officially” con-tained 29.7 million Latinos, or 11 percent of the total (Reed and Ramirez1998:table 1). In 1999, the official figure was 31.365 million. The Latinopopulation is also expected to continue to grow substantially. It ac-
177
counts for almost half of contemporary immigration (Passel 1993:1076),and it comprises 42.5 percent of the United States’ total foreign-bornpopulation (U.S. Bureau of the Census 1993c). This also is a populationwith a very high birthrate and a youthful median age, so that it wouldcontinue to grow even if all immigration were to cease.
Somewhat separate from, but also related to, the undocumentedissue is the undercount issue. Even though the Latino communitiesare large, growing, and diverse, Latino undercount rates have notbeen studied extensively. Hispanics are often not included in analysesbecause the data used are limited to race. For example, a historicalanalysis of undercount rates from 1940 to 1990 by Robinson and col-leagues (1993) did not include Hispanic undercount rates. The official1990 undercount estimate for Hispanics is 5.2 percent (Hispanic Link,August 1994, p.2), but this seems conservative, given the large num-ber of estimated undocumented and documented Latino immigrants(Passel 1993:1076; Passel and Woodrow 1984; Woodrow-Lafield 1992,1993). Given the diversity and rapid growth of the Hispanic popula-tion, it is surprising that the Hispanic undercount has not receivedmore attention.
In general, undercount rates overall have been found to varywidely by age, race, geography, and homeownership status, with blackmales having consistently higher rates over time than the total popula-tion (Hogan 1993; Robinson et al. 1993). Hogan’s (1993) analysis of 1990undercount rates indicates that the rates for Hispanics also variedwidely. For example, Latinos who did not own property but lived inlarge urbanized areas of the Northeast were undercounted by an esti-mated 6.72 percent, but if they lived in similar areas of the Midwest andowned property, they were overcounted by 4.33 percent.
DIFFERENT METHODS, DIFFERENT ESTIMATES
Why the undercount rates differ is very complicated, particularly forLatinos because of how they identify or are identified racially. Both mayaffect the undercount estimates (Passel 1993:1076). If Hispanics are re-ported as “white” in vital statistics data or if they report themselves as“other” or “black” in census data, they will be counted in these cate-gories and not as “Hispanics.” If Hispanics are reassigned to a “His-panic” category, estimates of undercount or any other counts will be un-
178 APPENDIX A
derstated (see U.S. Bureau of the Census 1992 for estimates of theseeffects).1
How Hispanics identify household units also affects undercounts.Examining the census’s Current Population Survey, McKay (1993)found that Hispanics often omitted boarders as part of the household.Or the census takers would not recognize that a housing unit mighthave more than one household living in it. As do members of manyAfrican American communities, respondents distinguished betweenpeople who were “living with” and those who were “staying with” afamily unit. Thus, boarders or people who were “staying with” themwere often not counted.
There are many reasons that individuals are not counted in the cen-sus. One is that they are missed because they live in irregular and com-plex household arrangements. Some households were not counted be-cause their living quarters were not visible to postal clerks because theywere, for example, behind and/or above a commercial establishment.Other reasons are that people move, fear government and outsiders,and speak English poorly (de la Puente 1993).
OMISSIONS
Besides not being counted by the census, respondents may not supplyall the information asked for on the census forms. Fein (1990) examinedthe causes of census omissions among different racial and ethnic groupsand found some factors that were common “sources of omission” fordifferent groups and other factors that were unique to particulargroups.2 He concluded that because 40 percent of the differences amonggroups could not be explained by the available indicators, “idiosyn-cratic social, cultural, and economic aspects of ethnicity constitutemajor sources of census omission” (Fein 1990:297). Certain groups—blacks, Mexican Americans, and Puerto Ricans—were less motivated tofill out forms than other groups were (non-Hispanic whites, other His-panics, and Asian and Native Americans).3 Puerto Ricans had the high-est omission rate, followed by blacks, Mexicans, other Hispanics,Asians, and Native Americans.
Most interesting was Fein’s conclusion that for Puerto Ricans, ed-ucation seemed to measure something other than the respondent’sability (1990:296). In other words, those who most often omitted
APPENDIX A 179

information were those with the most education. Thus, althoughmost of the reasons for the undercount are straightforward, such ashousehold structure and fear of government, apparently other, lesstangible factors influence it as well.
IMPLICATIONS
One result of the scanty research on the Latino undercount is that we donot have a clear view of the parameters of this population and its futureimpact on the United States. This affects the “visibility”—or the lack ofit—of the Latino population at all levels, but particularly at the policylevel. More generally, given the size and rapid growth of this popula-tion, such data are important to general analyses of the population.
Other implications pertain to current practice. Both Passel (1993:1076) and Vobejda (1991:9) observed that individuals who checked“other race” on the census forms were reclassified to determine under-count estimates. The Census Bureau estimates undercounts by compar-ing their population counts with birth, death, and immigration records.In order to match the census numbers to those administrative recordsthat do not use an “other race” category, the bureau had to reassignracial categories to those who designated “other race” on the census. Asnoted earlier, about 43 percent of Hispanics in the nation (or approxi-mately 9 million persons) chose the “other race” option, making upmore than 97 percent of the “other race” category. These assignments tostandard race categories are increasingly problematic (Passel 1993:1076), and they also present a picture different from that given by thecensus without these reassignments.
Also not well studied is how this practice affects the socioeconomicand health profiles of the resulting categories. Would, for example,whites’ median income be higher without this reassignment? This maynot be a problem at the national level at which the impact is not great,but what about at the local level or in geographic areas where substan-tial numbers of Latinos live? When just racial data are examined andHispanics have not been selected out, the question of how the presenceof Hispanics in all those categories influences results is seldom ad-dressed or considered.
A final implication again involves an undercount. Despite issuingan official undercount estimate, the census figures were not revised to
180 APPENDIX A
include it, thus negatively affecting the representation of Latinos. Ac-cording to an article in Hispanic Link (August 1994:2), including under-count figures could have benefited districts with large Latino popula-tions. Areas such as southern California, Texas, and New York wouldlikely have made adjustments that could have increased the represen-tation of Latinos. Also, changing the figures might have created an extracongressional seat for both California and Arizona, though at the ex-pense of Wisconsin and Pennsylvania. Moreover, it could have gener-ated more income for Los Angeles and New York City, the latter the pri-mary plaintiff in the undercount suit. (For comprehensive analyses ofthe litigation of the 1990 undercount suit, see Anderson and Fienberg1999.)
APPENDIX A 181

Appendix B
The Biological Concept of Race in the United States
The biological concepts of race and its implicit assumptions have beenchallenged on a number of grounds.
IT IS ILLOGICAL
The concept of “pure races,” which underlies the biological conceptof race in the United States, has been shown to be illogical and to bedisregarded by many today. For example, in the past when peoplefrom two U.S. race categories had a child, the child was placed in thesame category as the nonwhite parent; that is, the “hypodescent rule”was applied. The child was considered—as the prefix hypo- implies—less than white; thus he was nonwhite.1 Even though the child washalf white and half black, he was placed in the “black” category andwas viewed as solely black and not in any way white. In essence, andcontrary to logic, even though the child was not purely “black,” hewas classified as being so.
In the case of a child of two nonwhites, other considerations enteredthe picture, such as physical type and socialization, but generally blackancestry predominated in classification, and the child was classified as“black.” In neither instance was “purity” a factor, but the classificationas only one race contributed to the myth of racial purity. Race was amaster status, and considerations of ethnicity or culture were relegatedto issues of color and race.
Contemporary practice, which allows people to choose their ownrace, shows that the majority of Asian/white couples state that the raceof their children is “white.”2 In the case of Native American/whiteunions, the race reported for children tends to be consistent with that of
182
the mother, regardless of whether she is Native American or white.Only in the case of black/white unions are the majority of childrengiven the race of the black parent, regardless of whether this is the fa-ther or the mother. Yet even in this case, the majority is just 66 percent(Bennett, McKenney, and Harrison 1995:18, 35–36, 22). Thus, present-day racial self-classifications deviate from earlier approaches, makingracial categories even less “pure.”
GROUPS ARE NOT REALLY JUST ONE COLOR
Second, the concept of race, particularly as it has been constructed andunderstood in the United States, has been criticized on the grounds thatpeople are not really one color. For example, people “who are called‘white’ are really pinkish, light grayish, creamy, very light brown,ruddy reddish and so on. Few are truly white-white. The term is sym-bolic and non-specific. The same is true of the term ‘black’” (Forbes1988:95). Lee observed that some “white”-looking people are classifiedas “black” and that some whites are darker in color than are some non-whites, for example, Asians; that not all “blacks” are black; and thatmost whites are really “pinkish-yellowish.” The theory here (i.e., thecolor categories) differs from the reality. Or as Lee phrased it, there is avariance between the ideology of beliefs and the reality of observations(1993:93).
OTHER VARIABLES AND CONTEXT ARE IMPORTANT
According to Forbes, the classification of “many dark, curly-haired Ital-ians, Egyptians and Middle Eastern-South Asian groups” as white hasbeen based more on the recognition of their political and cultural ac-complishments than on their physical resemblance to blond Scandina-vians. It seems that many of these “so-called Caucasoid groups couldjust as well be regarded as being non-white or intermediate (mixed)types of people” (1990:6–7).
Although color terms are used, cultural, political, and economicvariables enter the racial calculus as well, and race often depends oncontext (Haney López 1996:xiii). Contexts affecting racial classificationinclude the political/legal, social, and economic frameworks that
APPENDIX B 183
encompass individuals and groups. These contexts vary over time, andimplicit in these frameworks are variables that influence racial and eth-nic classifications, for example, national origin, religion, language, mi-nority status, tribal membership (Bates et al. 1995:433–435), or the vari-ables mentioned in the introduction to this book (Leets, Clement, andGiles 1996:2).
In short, considerations other than color or biological ancestry areimportant to constructing these categories and classifying individuals.For example, many persons are put into the “red” group because theyare seen, or they see themselves, as members of a political unit called atribe or a nation. They are not “red” in color. Others are “black” becausetheir ancestors were classified as “black” or because currently theyidentify culturally, politically, or spiritually with this group. Some peo-ple alter their classification as “white” and become members of othergroups (e.g., the “red” group) when they develop a sense of culturalpride or, more crassly, so that they can be considered affirmative-actioncandidates. Thus, “race” in the United States is not just “color.”
IT IS DISREGARDED BY SCIENTISTS AND ITS SCIENTIFIC
UNDERPINNINGS ARE QUESTIONED
Third, the assumptions underlying the simple but classical conceptionof U.S. race as a scientific or biological construct have been intenselyquestioned. For example, the assumptions that biological race is agiven; that hypodescent is a natural law; that some geographic regionsare homogeneous; and that ethnicity is less important than color andrace have been questioned in both the academic literature and the pop-ular press. Earlier questioning in the academic anthropological com-munity preceded the inquiry in the popular press. A 1989 survey indi-cated that about 70 percent of cultural anthropologists and 50 percent ofphysical anthropologists rejected race as a biological category (Begley1995:67; see also Sanjek 1994).
Common to the relatively recent, critical literature on race is adistrust of the validity of race as a biological concept and an increas-ing awareness of the illogic of the United States’ racial constructions.In much of this literature, experts argue that the differences withingroups are often greater than the differences between groups (Begley1995:67; Gregory and Sanjek 1994:6–7; Gutin 1994:73; Marks 1994,
184 APPENDIX B
1995; Rosin 1994; Shreeve 1994:60; Washburn 1963; Wills 1994:81). AsMarks put it, fieldwork revealed, and genetics later quantified, thatthere is far more biological diversity within any group than betweengroups (1994:34).3
Moreover, specialists contend that what generally varies from onepopulation to the next is the proportion of people in these groups dis-playing a particular trait or gene. For example, Marks (1994) pointedout that hair color varies greatly among Europeans and native Aus-tralians, but not among other peoples. He also noted that Africans aremore biologically diverse than Europeans. At present, both academicand popular research is concerned not with whether there are rigid bi-ological distinctions between races but with when our most recent com-mon ancestors lived and when subpopulations branched off (Goldsteinand Morning 1999:5; Lemonick and Dorfman 1999).
The sense in this literature is that although there appear to beclearly visible differences among groups, in fact these are just popula-tion clusters. In other words, what we use to distinguish groups, for ex-ample, pigmentation, eye form, and body build, are anatomical proper-ties, but they are not restricted to particular groups. Rather, they are dis-tributed along geographical gradients, as are nearly all the geneticallydetermined variants detectable in the human gene pool. In essence, thephysical characteristics that appear to mark these groups (and thatsome people see as equivalent to distinct categories or races of people)are distributed along gradients. This variation is gradual, and these gra-dients span populations.
Three factors account for the variation of populations: (1) naturalselection, (2) genetic drift, and (3) gene flow. Natural selection occurs aspeople, that is, populations, adapt to their surroundings. Those who arebest able to survive in a particular environment live to reproduce oth-ers who will carry their genetic heritage. Through natural selection,populations become differentiated from other populations. Geneticdrift also contributes to the variation of groups. Random fluctuations ina gene pool occur as a result of genetic drift. These random fluctuationsincrease the uniqueness of populations, differentiating them from otherpopulations, but in nonadaptive ways. Finally, as humans have mi-grated, developed trade networks, and engaged in the political con-quests of other populations, intermarriage and “other child-producingunions” have resulted. This has increased the gene flow between popu-lations, making neighboring populations more similar (Marks 1994:34).
APPENDIX B 185
Geographic barriers are also cited as important to creating different de-velopment paths for different population groups (Diamond 1997).
Consequently, “the racial categories with which we have become sofamiliar are the result of our imposing arbitrary cultural boundaries inorder to partition gradual biological variation” (Marks 1994:34). Theseculturally constructed categories that we develop and call “races” arediscrete and are unlike biological, graduated distinctions. Moreover,our conception of “pure” racial types is also a construction. Thus, for ex-ample, very light skinned groups in cold, northern latitudes are notpure types or populations; rather, they are those best adapted to theseenvironments.
Despite the recent, extensive criticism of the concept of race andeven though “scientists have been broadly unable to come up with anysignificant set of differences that distinguishes one racial group fromanother, the controversy over racial differences persists” (Morganthau1995:64). For example, the recent controversy over racial differences inintelligence was revived—but not settled—by books like the best-sell-ing The Bell Curve by Richard Hernstein and Charles Murray.
186 APPENDIX B
Appendix C
A Technical Oversight or Racial Flux?
Given that the “color” term and concept endured in the U.S. census formost of the nineteenth century and a large part of the twentieth century,an intriguing question is why the first three censuses did not contain acolor term. Related to this question is why the original “all other freepersons” category was replaced by the “free colored” category.1
CHANGE IN TERMINOLOGY, NOT DEFINITION
One explanation is that the shift to a color category was inconsequen-tial. The category then represented only a very small proportion of thepopulation—1.5 percent (or 59,557) in 1790 (Wright 1956:49). It could beargued that the shift reflected a mere change in terminology but not indefinition (Bill Creech, National Archives, conversation, November1995). In other words, the people in this category were the free colored,even though it was not so named. (This was the position that later cen-suses took with regard to the meaning of this category. See, e.g., U.S.House of Representatives 1895:xcv–xcvi; U.S. Secretary of the Interior1853a:table xxxvii; 1853a:xxxvi, 6, 926, tables ix and lxvii.)
Missing or Miscellaneous Information
The “all other free persons” category may have included errors andthe “don’t knows.” It may have reflected the most generic category pos-sible for what was then a very unstandardized process of data gather-ing. No specific instructions were issued to census takers until 1820(U.S. Bureau of the Census 1989:ii), and before 1830, the states designedtheir own forms and categories. Thus, the information they collected
187
varied. For the early censuses, marshals submitted their returns to thefederal government “in whatever form they found convenient andsometimes with added information” (U.S. Bureau of the Census 1978:7).
In addition, many states changed the categories they used from onedecennial census to another. For example, the Massachusetts censusform of 1810 counted “free white males,” “free white females,”“slaves,” and “all other free persons, except Indians, not taxed.” In its1820 census, when it was no longer a slave state, Massachusetts kept allthese categories except “slaves” and added “free colored persons” and“foreigners, not naturalized.” Massachusetts’s 1820 census also askedfor the age and gender of the “free colored persons” (U.S. Bureau ofthe Census 1978). In other states, of course, the category of “slaves”remained.
Change in Political Leadership
Another view is that the shift simply reflected political changes inleadership. From the beginning of the census, some of the foundingfathers had been interested in counting the “colors” of the free popu-lation. Indeed, all the legislative acts mandating the 1790, 1800, and1810 censuses specified that the “colors of free persons” be reported(Jackson and Teeples 1976; U.S. Bureau of the Census 1967:43).2 Butthe census categories did not reflect this requirement, and it is notclear why.3
The 1820 legislation was similar to the earlier legislative acts butalso included a substantially different schedule form (U.S. Statutes atLarge 1963:548). On this schedule, foreigners were “white,” and thethird category (“all other free persons”) was placed under the “col-ored” category. The emphasis on color in this census is also seen inSecretary of State John Quincy Adams’s instructions to the marshals,in which he specifically noted the need to count the population ac-cording to “sex, color, age, condition of life” (U.S. Bureau of the Cen-sus 1967:133, italics in original). This letter was published at the frontof the 1820 census.4
President James Madison had earlier proposed a more comprehen-sive first census to Congress, arguing that the census should count thenumbers engaged in the different “professions and arts.” He also sug-gested that Congress count “free blacks” along with “free white men,”
188 APPENDIX C

“free white women,” and “slaves.” (Wright 1956:132–133) Some in Con-gress opposed a census that did more than count individuals,5 but itmay be that President Madison and Secretary of State Adams finallyhad their way in the 1820 census.
RACIAL FLUX
Alternatively, the absence of a color term before 1820 may also have re-flected the influence of an earlier period of racial formation in theUnited States in which there was a great deal of flux and classificationsmay have been more fluid and differently determined. A number ofscholars note that in the very early colonial period, an individual’s sta-tus was not “determined solely on the basis of race” (Franklin 1967:225ff; Higginbotham 1978:22). One’s status as a free person may have beenmore important than color.
Color may also have been viewed differently at that time. It is in-teresting that of twenty-six reprinted advertisements from the Pennsyl-vania Gazette for “white indentured servants who fled their masters”(1728–1790), more than a quarter of the runaways—or seven of thetwenty-six ads—were described as “brown,” “swarthy,” “dark,” or “ofa brownish complexion” (Smith and Wojtowicz 1989:5, 161–172). In ad-dition, Meaders discovered in his more extensive review of runaway in-dentured servants between 1729 and 1760 in Pennsylvania that therewere “a few black and Indian indentured fugitive servants” (1993:xi). Inhis sample of 1,036 runaway servants and apprentices, he found that5.79 percent were of unknown or mixed race, Indian, or black (p. 505).Thus the group referred to today as “white” included some who weredescribed then as “not-white” or “dark.”
Some colonial figures suggest that there was more heterogeneityduring this period than is generally acknowledged today. According toParrillo’s analysis of colonial data, in 1776, Africans accounted for 39.2percent of the population of the southern states and 20.5 percent of thetotal; and African Americans and Native Americans together weremore numerous than the English in the South (1994:530). The Englishalso made up only 46.9 percent (less than half) of the total U.S. popula-tion of 2.587 million. In addition, Galenson found that whereas in thenorthern colonies, blacks constituted less than 10 percent of the total
APPENDIX C 189

190
FIG. C.1. Heads of Families, New York 1790.
population in 1770, in Maryland, Virginia, North Carolina, South Car-olina, and Georgia, they made up 35 to 61 percent of the total popula-tion (1981:119).
This also was a period when substantial numbers of individualswere described in early colonial data as “unassigned,” including“those of mixed or unknown nationality and/or living in the backcountry.” They constituted 6.6 percent of the total white population in1790 and more than 10 percent of the populations of Connecticut(26%), Maine (24%), New Hampshire, Vermont, and Rhode Island.Although unassigned, they were included in the white colonialcounts (Parrillo 1994:533). These people may have been the first prod-ucts of the American amalgam of European groups and may alsohave included taxed Indians and those mixed with taxed Indians, aswell as persons of some African descent. In any case, they illustratethe flux and variability characteristic at the time, even with regard togroups classified as white.
The “all other free persons” category may also have included per-sons not of African descent, for example, taxed Indians, mestizos, or“other” free people who were not seen as simply white, such as Asiansand Arabs. But the general assumption in the literature and in later cen-sus reports was that this early category consisted of “free blacks.”6 Whoexactly was in the “all other free persons” category has not yet been de-termined. My own analysis of the largest ward (i.e., political district) inNew York City in 1790, Montgomery Ward, reveals a rather complexpicture.
As figure C.1 indicates, New York City’s 1790 census records showthe name of the head of the family and then the number in each familywho were free whites (by age, sex, and headship status), slaves, and “allother free persons.” It is generally understood that in the 1790 census,“a family where there is a name of the head of the family with nothingwritten after it . . . is likely to be a free black family” (Carlberg 1992:33).In New York City, of all the households with members in the “all otherfree persons,” 44.4 percent were in households listed without lastnames. But the majority (55.6%) lived in households that had last namesand included white persons as well as slaves in some cases. Five house-holds without last names had only white persons resident (Heads ofFamilies 1992:119–124).7
It is likely that many people in this category were “free people ofAfrican descent.” But they may also have been of Native American
APPENDIX C 191
descent or various combinations of European, Asian, African, or NativeAmerican ancestry. In any case, we need to find out who else mighthave been in this category and whether there were regional variationswith regard to its composition during this period of racial flux and not-yet-crystallized categories of color.
192 APPENDIX C
Appendix D
Free People of Color
THE EARLY PERIOD, 1790–1840
The free population of color grew by 82.1 percent between 1790 and1800 and then by 71.9 percent between 1800 and 1810. In the follow-ing decade, however, the growth rate dropped dramatically, growingonly 25.3 percent between 1810 and 1820, as shown in figure 4.1 andtable 4.1. It was in 1820 that the category “free colored persons” wasintroduced and included “all other free persons” (U.S. Bureau of theCensus 1967:sec. vi, tables 20 and 17). After 1820, the numbers andproportion of “free colored” did not increase much (see figures D.1and D.2). Indeed, the proportion of all African Americans who werefree actually declined between 1840 and 1860. Figure D.2 illustrateshow the gap between the free and unfree grew substantially between1820 and 1860. The proportionate decline in the free population oc-curred despite the passage of legislation in 1807 prohibiting the im-portation of foreign slaves (see Blaustein and Zangrando 1968:53–57for a description of this act, as well as other statutes passed by Con-gress to restrict the slave trade). Part of the increase in the number ofslaves was due to the admission of new states during this period. Ofthese states, Arkansas (1836), Florida (1845), and Texas (1845) enteredas slave states.
It still is curious that the population of free people of color didnot grow significantly during this period. One possibility is that after1820, free people of color were no longer counted as they had beenbefore when there was no color term in the third category, “all otherfree persons,” or that many were perhaps not counted at all after1820. In her local-area study of free women of color in the nineteenthcentury, Logan Alexander (1991) decided that they usually did not
193

194
FIG. D.1. Proportion of African Americans Who Were Free, 1790–1860. TheNegro Almanac 1971:344.
FIG. D.2. The Increase in Numbers of Slaves and Free African Americans,1790–1860. The Negro Almanac 1971:344.
bother to register for the census, perhaps because they realized thatthere were unpredictable swings in the freedoms allowed free peopleof color. Bell (1973) noted that the legislation concerning free peopleof color fluctuated from liberal to more restrictive in different states.Accordingly, people who might have been counted in this groupwhen the category was not “colorized” might have realized by 1820that if they were counted as “colored,” their freedoms might be cur-tailed (Bell 1973; Logan Alexander 1991). This precarious status wasalso mentioned in a 1907 census report summarizing the first hun-dred years of the census. It stated that in earlier times, a “free negro”was believed to be a threat or have an “unfavorable influence” onother slaves in the same “neighborhood” (U.S. Bureau of the Census1967:37; see also Fishel and Quarles 1970:127–144; Franklin 1967:214–241; Frazier 1962:117 ff). Last, some “free colored persons” probablypassed into the white population (Hodes 1997:67 ff).
BLURRED BOUNDARIES
The growth of a free, mixed population threatened to blur groupboundaries, making it impossible to distinguish the “white” from the“colored.” The reality of the extent to which “miscegenation” had mademany “visibly white” can be seen in the numerous advertisementspromising rewards for runaway slaves who could pass for white, thesuspected black ancestry of a number of famous “white” Americans,and the invisible African ancestry of noted black leaders (Blockson andFry 1977).
The following anecdote suggests how many mixed people were inthe South, where the majority of slaves and free people of color lived.When the South Carolina legislature tried to define race by suggestingthat “a Negro” was any person with even a single drop of nonwhiteblood, George Tillman objected: “Gentlemen,” he solemnly declared,“then we must acknowledge that there is not a full-blooded Caucasianon the floor of this convention!” (Blockson and Fry 1977:107). If thechains of slavery were lifted, it was expected it would be even more dif-ficult to maintain the boundaries between “white” and “not white.”
This concern appears to have been behind the admonitions to thecensus enumerators in 1850 (when mulattoes were first counted) tobe very careful about determining color, to indicate whether the free
APPENDIX D 195
person was “mulatto” or “black” (U.S. Secretary of the Interior1853b:xxii, italics added). In the section explaining the schedules (i.e.,census forms) for free inhabitants, the instructions state, “It is verydesirable that these particulars be carefully regarded” (U.S. Secretaryof the Interior 1853b:xxii). In the instructions given for determiningthe color of slaves, this phrase was not included; rather, enumeratorswere told that “the color of all slaves should be noted” (U.S. Secretaryof the Interior 1853b:xxiii). Thus, it was very important to distinguishcolor among the free colored but not among the slaves. Instructionsfor the section on mortality, which also required free and slave indi-viduals to be identified according to whether they were mulatto orblack, carried no such admonition (Jackson and Teeples 1976). Colordistinctions among the dead were apparently not as important.
The census of 1860 was taken on the eve of the Civil War. It too ex-amined the general population growth of the free colored and con-cluded that it was “a stationary population,” that they had as manydeaths as births (Kennedy 1862:6). It also concluded, however, that “itis important to observe the growing disparity between the pace atwhich the white and colored races are advancing in this country.” Thenumber of whites was increasing faster than that of slaves, and the freecolored had the lowest rate of increase.1
These differential growth rates were seen to be relevant to the issueof possible emancipation: “Leaving the issue of the present civil war fortime to determine, it should be observed, if large numbers of slavesshall be hereafter emancipated, so many will be transferred from afaster to a slower rate of increase” (Kennedy 1862:8). The assumptionwas that given the current rates of increase for both groups, if slaveswere emancipated, they would not increase as rapidly as they hadwhen they were slaves.2 This led proslavery advocates to conclude in-congruously that slavery was more beneficial than freedom to personsof African descent.
AFTER THE CIVIL WAR
As Williamson (1984) and Davis (1992) argue, it was after the Civil Warthat the need to distinguish all people of color (i.e., those who had beenslaves as well those who had been free) from whites became more in-tense. Without slavery, it was important to discern any “perceptible
196 APPENDIX D
trace” among the now-freed population as a way of maintaining the an-tebellum social structure.3 Having been lost on the battlefield, the strug-gle over the social status of African Americans moved to the area ofracial classification.4
As noted earlier and as table 4.4 shows, the concern with determin-ing “traces” of Negro blood continued, and by 1890, the census appearsto have become obsessed with distinguishing the amount of Negroblood in individuals (Wright 1956:187). Although this obsession hadeased by the next census, the same approach was echoed in the 1894Supreme Court case of Plessy v. Ferguson. The plaintiff held that heshould have the rights of a white man because he was seven-eighthswhite and only one-eighth black. The Supreme Court’s ruling againstthe petitioner thereupon made tenable and authenticated the concept ofhypodescent and legitimized the Jim Crow legislation of the day formany decades to come.
APPENDIX D 197


Notes
NOTES TO INTRODUCTION
1. Although this review was quite extensive, less mainstream journals,such as the Journal of Ethnic Studies or the Latino Studies Journal, were not in-cluded. Therefore, the findings may be more typical of practices in the moretraditional social science publications.
2. In this book I rely more heavily on commonly used definitions of raceand ethnicity—that is, those used in the dictionary and by the census—and lessheavily on definitions that represent academic consensus. Since census defini-tions come largely out of political and bureaucratic negotiation, they are, in thisregard, more useful for my purposes, and they also are relevant to the issuesand data I analyze.
NOTES TO CHAPTER 1
1. In her study of Spanish-speaking Caribbeans, Dominguez states that“an individual may be identified as indio, trigueno, blanco, prieto, or whatever indifferent contexts by different people or even by the same person” (1986: 275).
2. Except when specifically referring to women, I use the word Latino torefer to both women and men. At the descriptive level, my analyses of how Lati-nas and Latinos classify themselves racially have not revealed significant dif-ferences. But under more controlled conditions, some labor market differencesby race and gender have been noted (Gómez n.d.; Rodríguez 1991a).
3. In this book, I use both Hispanic and Latino, in part because both termsare used in the literature and I try to use those of the authors I cite when dis-cussing their work. Works based on census material, for example, tend to usethe term Hispanic, mainly because this is the category under which the datawere collected. Other works refer to surveys employing the term Latino. See thefollowing for different arguments concerning the preferred term: Gimenez1989; Hayes-Bautista and Chapa 1987; Oboler 1995; Treviño 1987.
4. According to Jorge del Pinal, 42.7 percent of the Hispanics who chosethe “other race” category in the 1990 census gave a Latino referent. However,94.3 percent of “other race” persons who provided a write-in gave a Latino ref-erent (personal communication, July 30, 1999). In addition, two-thirds of all
199
those who did not specify their race wrote in their Hispanic ethnicity (U.S. Of-fice of Management and Budget 1995:44689).
5. Hypodescent is also referred to as the “one-drop rule,” in which “onedrop” of “nonwhite or black blood” determines a person’s “race.”
6. The degree to which racism is perceived and experienced in the Latinoframework may be related to phenotype. Consequently, those farthest from ei-ther the local mean or the ideal European model may be those most subject to,and therefore most aware of, racism and discrimination. In the dominant U.S.framework, those farthest from the stereotyped “Latin look” may be those mostacutely aware of, or in the best position to observe, discrimination.
7. Martínez-Echazábal uses the word “mestisaje as a way of avoiding theEnglish term miscegenation because in the Anglo-American context miscegena-tion refers exclusively to the sexual union of two people of different races whilein the Ibero-American contexts it signals both biological and cultural interracialmixing” (1998:38).
8. Two sets of cognitive, face-to-face interviews were commissioned by theU.S. Bureau of the Census in order to evaluate the race and Hispanic-originquestions on the Census 2000 form. One set (Davis et al. 1998a) examined theformatting of these questions, and the other (Davis et al. 1998b) evaluated twoversions of the race question and the revised Hispanic-origin question on theCensus 2000 form. The two samples questioned fifty-nine Hispanics from dif-ferent parts of the nation.
9. This will be covered in chapter 3, but see Davis et. al. (1998a:III-22–23)for light and humorous discussions of skin color in the cognitive interviews.
10. The Hispanic population increased from 4.5 percent of the total U.S.population in 1970 to 9 percent in the 1990 census, and the white non-Hispanicpopulation decreased from 83.5 percent in 1970 to 79.6 percent in 1980 to 75.6percent in 1990 (del Pinal and Garcia 1993; U.S. Bureau of the Census 1972,1982). Between 1980 and 1990, the black population increased by 13 percent,Native Americans increased by 38 percent, and Asian and Pacific Islanders in-creased by 108 percent. The growth rates of Hispanic-origin groups differed,with Mexicans increasing by 54 percent, Puerto Ricans by 35 percent, Cubans by30 percent, and other Hispanics by 67 percent (del Pinal 1993).
11. Atkinson, MacDorman, and Parker (1999) noted that their analysis ofthe 4 million births in the United States each year may slightly underestimate thepercentage of interracial births.
12. Asian/white unions are more likely to classify their children as“white” instead of “Asian.” This pattern is similar among Native Americansand contrasts with the two-thirds of children in black/white families who haveconsistently been identified as “black” in the last few decennial censuses. Con-sequently, the high proportion of interracial children classified as “white” can,to some degree, be explained by the composition of interracial couples. In 1990,
200 NOTES TO CHAPTER 1
Asian/white couples accounted for the largest proportion of interracial cou-ples, that is, almost one-third (31%); American Indian/white couples were thesecond largest group (22%); and black/white couples comprised fewer thanone-seventh. The “other race” category, which consisted mainly of Hispanics,accounted for almost one-third, and most of these marriages were to whites(Bennett, McKenney, and Harrison 1995:22, 12–13).
13. Numerous scholars have noted differences between observed and re-spondent-reported race (see, e.g., Edmonston, Goldstein, and Tamayo Lott1996; Falcon 1995; Hahn 1994; Hahn, Mendlein, and Helgerson 1993; Massey1980; McKenny and Bennett 1994; McKenney, Fernandez, and Masamura 1985;McKenney et al. 1993; Rodríguez 1974, 1989; Rodríguez and Cordero-Guzmán1992; Tumin and Feldman 1961).
14. Those responding that they were “multiracial” in a series of surveysconducted by various government agencies rarely reached 2 percent (U.S. Of-fice of Management and Budget 1997a), whereas the proportion of Hispanicsin the population was 11 percent of the population (Reed and Ramírez1998:table 1).
15. For example, the proposal for a multiracial category was actively sup-ported and advanced by organizations such as Project RACE and the Associa-tion of Multiethnic Americans. The Arab American Institute argued for the ad-dition of a special category for Arab Americans, and the proposal to shift Na-tive Hawaiians from the “Asian and Pacific Islander” category to the “NativeAmerican Indian” category was supported by Senator Daniel Akaka fromHawaii, the National Coalition for an Accurate Count of Asians and Pacific Is-landers, and representatives of Native Hawaiians (U.S. House of Representa-tives 1994o).
16. The U.S. Supreme Court decided in January 1999 that the Census Bu-reau could not use sampling to help produce the official population figure thatwould be used to determine the number of House seats that each state wouldbe allocated. However, the Court did not explicitly rule on whether samplingwould be permitted to establish where precisely in a state people live, and it isthis information that is used to draw boundaries for congressional and state leg-islative districts (Holmes 1999:24).
17. The privileging of one color or type over others in the group is often theresult of historical practices and the effect of racial policies pursued withinbipolar systems. It is a tendency found in many oppressed groups and oftenleads to unnecessary divisions and acrimony within the group. See, for exam-ple, Russell, Wilson, and Hall 1992 on the antecedents of “colorism” in theAfrican American community and Jaimes 1994 on how blood quantum policiescontributed to internal jockeying for Indian-ness.
18. Results from the following studies reflect the resulting mélange offindings from the use of local versus national databases or differing models,
NOTES TO CHAPTER 1 201
controls, and foci. For example, Stolzenberg (1982) found that occupationaldiscrimination against Hispanics affects only first-generation, non-English-speaking immigrants. Torres (1992) discovered discrimination in earningsagainst all Puerto Ricans but more often against island-born Puerto Ricanwomen and men than against those born in the mainland United States.Reimers (1985), examining wage-gap differences among Hispanics of differ-ent national origins and non-Hispanic whites, found that discrimination var-ied in importance in explaining the wage gap and was not a major factor withregard to the gap between Hispanic and non-Hispanic women. But Meléndez(1991) saw discrimination as important to explaining a large proportion ofthe wage gap between Hispanic and non-Hispanic New Yorkers. Kossoudji(1988) discovered that Hispanics have paid more dearly for their lack of Eng-lish-language skills than have Asians, at every skill level.
19. The classic film Ethnic Notions conveys this message well by juxtapos-ing the media images in a particular historical context against the reality of thattime.
20. Telles and Lim (1998) addressed this question in Brazil and found theinterviewer’s classification to be more useful for determining treatment.
21. In other words, “race” is a set of socially constructed meanings subjectto change and contestation through power relations and social movements. Theconception of subordinate social races can be eliminated only when the struc-tures that support these conceptions are eliminated, for example, dual labormarkets, residential segregation, discriminatory institutional and legal treat-ment, and segregated school systems. Given the socially constructed nature ofrace, racial identity is historically flexible and culturally variable, and it is em-bedded in a particular social context (Duany 1998b; Omi and Winant 1995).
22. For an interesting discussion of whether race should be employed as aresearch category in public health research, see Fullilove 1998 and various com-ments on this article in the subsequent volume of the American Journal of PublicHealth (1999).
23. Marks (1994) maintains that folk concepts of race—flawed and scien-tifically deficient as they may be—are passed down from generation to genera-tion, just as genetic material is inherited. This is part of what keeps the conceptof race real.
NOTES TO CHAPTER 2
1. Tiger Woods refers to himself as “Cablinasian”—Ca, Caucasian; bl,black; in, Indian; and Asian. Some African Americans maintain that regardlessof how he sees himself, the average American would see him as black (Ebony,“Black America and Tiger’s Dilemma,” July 1997, pp. 28–30, 138).
2. In this simple conception of race, the “red” and “yellow” color groups
202 NOTES TO CHAPTER 1
are also defined as nonwhite. However, it appears that “blood quantum,” thatis, the amount of “red” or “yellow” blood and not the “one-drop” criterion, wasused to determine “race.” There is, however, some disagreement in the litera-ture about the extent to which the hypodescent rule was (and is) rigidly appliedto all white/nonwhite mixes. See Root 1992a and c and 1995, who says that thehypodescent rule has been rigidly enforced for Asian mixes by the Asian, black,and white communities, and Davis 1992, who argues otherwise.
3. As noted earlier, the 2000 decennial census offered the option of choos-ing more than one race category.
4. According to Wills (1994), the evolution of skin color was not a one-timeevent. Instead, it appears that groups had different skin colors at different timesin their evolutionary history.
5. This, he argues, was quite different from the reactions of whites, whowere struck by the novelty of Africans’ skin. “To wash an Ethiopian white” wasa common expression in Greek and Roman literature, but it was used to de-scribe futile labors or the unchangeability of nature, not to designate negative“racial” attributes (Snowden 1983, 7).
6. Thompson (1989:10 ff) points out that because most Aethiops were inhumble positions, this led to their association with humble status. Nonetheless,he argues that this association was not a prejudice, that the treatment of a per-son of color depended on his or her status and not color.
7. Although Thompson (1989) basically agrees with Snowden (1983), he isalso somewhat critical because he feels that Snowden does not take into accountRoman perceptions of race. Thompson (1989) contends that he, however, doesdo this in his own work.
8. According to Thompson, the Greco-Roman view distinguished amongthe “developed” world of pale brown (albus) Mediterranean people, a barbar-ian “underdeveloped” world, and another barbarian but cultivated world(1989:10 ff).
9. With regard to the ancients’ aesthetic preferences, Snowden found afew more expressed preferences in classical literature for white beauty thanthose for black or dark beauty. But this, he said, was not strange. What wasstrange was “the number of those in the Greco-Roman world who rejectedthe norm of whiteness and openly stated their rejection” (1983:79). Thomp-son agreed that some scholars interpret Roman comments about blacks in lit-erature and iconography as reflecting “race prejudice,” “color prejudice,”and “racism” but that in these cases, people were confusing racism and eth-nocentrism (1989:11).
10. Snowden found that the ancients did not make color the focus of irra-tional sentiments or the basis for uncritical evaluation, and he concluded thatthe image of Ethiopians in Greek and Roman literature was essentially favor-able (Snowden 1983:55, 59). He also did not find in Greek drama any specifically
NOTES TO CHAPTER 2 203
antiblack sentiments, even though the Greeks had confronted Ethiopians as en-emies in the Persian wars (Snowden 1983:48).
11. See, for example, Bilger’s review (1997) of the contemporary debate be-tween Frank M. Snowden Jr. and Molefi K. Asante, director of African-Ameri-can Studies at Temple University in Philadelphia.
12. Shreeve argues that the concept of race did not exist until the Renais-sance, when ships could navigate the open ocean. Even people like MarcoPolo in the thirteenth century or the Islamic explorer Ibn Batuta in the four-teenth century never thought in racial terms, because traveling by foot andcamel rarely allowed them to cover more than twenty-five miles a day: “Itnever occurred to them to categorize people, because they had seen every-thing in between. . . . [T]hat changed when you could get into a boat, sail formonths, and wind up on a different continent entirely. When you got off, boydid everybody look different! Our traditional racial groupings aren’t defini-tive types of people. They are simply the end points of the old mercantiletrade networks” (1994:60).
13. Hannaford maintains that these changes were foreshadowed in earlierwritings, but his view of “race” is considerably broader than that of other writ-ers. When talking about the racialization process, he includes differences basedon language, culture, disposition, and appearance, as well as color (1996:1).
14. The question of what categories or terms are used to describe or counta population is important for language is not a transparent window; it is ascreen through which a culture views its world. Moreover, “naming” has bothdescriptive as well as prescriptive power. For example, the term Hispanic wasfirst introduced by the census in 1980 to describe persons of Spanish origin andit is today used by some to identify themselves outside of the census context.
15. On a more theoretical level, the authors concluded that ethnicity lackedreplicability and a shared meaning and had multiple dimensions and overlap-ping categories (Almey, Pryor, and White 1992).
16. According to Williams, “Most of the research on racially blended peo-ples and their families reflects Eurocentric bias, painting interraciality as prob-lematic” (1992:281).
17. A recent analysis of Asians’ intermarriages did not find a consistent re-lationship between education and intermarriage (Lee and Yamanaka 1990).
18. There was, however, considerable variation between race and ethnicgroups with regard to intermarriage. Native Americans had the greatest per-centage of “outmarriage,” followed by Asian and Pacific Islanders and those of“other race,” who were mainly Hispanic. Whites and blacks had very low ratesof outmarriage (3% and 6.2%, respectively). Thus, even though the majority ofintermarriages were between whites and blacks, 97 percent of whites and 92.8percent of blacks married others within their own “race” group.
Hispanics (like Native Americans and Asian and Pacific Islanders) also
204 NOTES TO CHAPTER 2
had relatively high outmarriage rates, with some variation by Hispanic sub-group. “Other Hispanics” (50.3%) and Puerto Ricans (45.1%) married “out”more than Mexicans (30.6%) or Cubans (36.8%) did. A large proportion mar-ried non-Hispanics: 28.3 percent of Mexican, 35.4 percent of Puerto Rican,25.7 percent of Cuban, and 43.6 percent of “other Hispanic” marriages wereto non-Hispanics. The reason may be that Hispanic subgroups are geographi-cally concentrated and separated from one another and there are more eligi-ble non-Hispanic marriage partners. The three fastest-growing groups in thecountry—Native Americans, Asian and Pacific Islanders, and Hispanics—had the highest rates of outmarriage.
19. In sum, the report stated that in areas where they are relatively numer-ous, the smaller “racial” groups are reasonably well identified but in areaswhere they are rare, they may be misclassified (U.S. Bureau of the Census1953:35).
20. These political-legal, social, and economic contexts contain the vari-ables that influence racial and ethnic classifications, for example, national ori-gin, religion, language, minority status, and tribal membership (Bates et al.1995:433–435) or those found in the academic literature (Leets, Clement, andGiles 1996).
NOTES TO CHAPTER 3
1. Although it was desirable for the interviewer and interviewee to havesimilar backgrounds, this similarity might have introduced biases not readilyidentifiable. So, in order to check for bias, the interviewers were asked to sum-marize two of their interviews. The other interviewers then reviewed and ed-ited the summaries, checking for inconsistencies and personal and factual con-clusions, and asked additional questions. In some cases, the interviewers askedthe respondent for additional information or read the summary to him or herfor confirmation or validation. Finally, the original interviewers rewrote thesummary.
2. I have stated elsewhere that the consolidation of these multiple identi-ties represents a unique form of resistance to the United States’ dichotomizedracial structure (Rodriguez 1994a).
3. Forbes noted a similar pressure on Native Americans by whites andblacks in the United States to be black Americans (1990:33 ff).
4. Paradoxically, at the same time that U.S.-born and foreign-born Latinosare experiencing these pressures, the increasing number of Latino immigrantsto the United States is enforcing Latinos’ more traditional focus on nationalidentity and cultural differences between themselves and other groups, bothLatino and non-Latino.
5. See Hurtado 1997, who emphasizes the significance of the Chicano
NOTES TO CHAPTER 3 205

movement at that time in shaping the evolution of her own identity as astrongly and proudly identified Chicana.
6. According to a number of studies, some Latino respondents do not likethe “other race” classification (Kissam, Herrera, and Nakamoto 1993; Johnsonet al. 1997). These respondents maintain that “‘other’ implies you don’t belongto a group” or represents marginality (Johnson et al. 1997:3). Yet some of thecase studies described here convey the sense that it is all right to be “other.” Thisdoes not mean, however, that these respondents endorse the category of “otherrace” but, rather, that being “none of the above” is not a problem for them.
7. For most European Americans, racial identity is less complicated andmore straightforward. The following example of a young white middle-classwoman responding to the racial questions used in these case studies illustratesthe “normative” position. The woman was born in the Midwest and was agraduate student on the West Coast. She was at least third-generation northernEuropean on both her maternal and paternal sides. In response to the censusitem, she checked “white.” When asked why she had answered in this way, shereplied, “Because I’m white.” She added that she had not bothered to look at theother categories to see whether they might be more appropriate, for she did notconsider herself “ethnic.”
The young woman’s responses to the other racial identifiers were similarlyunvarying. She described herself as being “white, as white as they come.” Theonly times she did not answer “white” was when the question did not specifi-cally address race—as when asked how she would describe herself over thephone (she said she would describe her clothing) or whether her identity hadchanged (she said it did when she got married, became a graduate student, etc.).When asked, “How do you identify yourself?” she first stated she was awoman, then white, and finally identified her current student role and futureoccupational goals.
This woman’s responses reflect her life in the United States. Her racialidentity is clear, although factors such as class, national origin, religion, or pig-mentation may affect the way in which other European Americans identifytheir race.
NOTES TO CHAPTER 4
1. A much later decennial census confirmed this practice of counting onlytaxed Indians: “Those bound for a term of years have always been taken amongthe free; Indians not taxed always excluded” (U.S. Secretary of the Interior1853b:xvi).
2. The fact that neither the sex nor the ages of free or slave African Ameri-cans were requested indicates the relative unimportance of these groups in thesocial hierarchy at the time.
206 NOTES TO CHAPTER 3

3. In the 1830 census, sex and age were also requested for the first timewithin this third category and within the “slaves” category (U.S. Bureau of theCensus 1989:20).
4. For example, in the 1840 census for Maine, tables were included withcolumns for “Deaf and dumb, blind and insane white persons” and for “Deafand dumb, blind and insane colored persons.” The colored included both freepersons and slaves (U.S. Dept. of State 1842: table entitled “Aggregate Amountof Each Description of Persons within the District of Maine,” n.p.).
The 1850 decennial census described and presented data for the popula-tion’s three classes: whites, free colored, and slave (U.S. Secretary of the Interior1853a:xxxii), but it also combined the “free colored” and “slave” populations tocalculate projected population increases (U.S. Secretary of the Interior 1853a:tablexxxvii) and the ratio of illiterate persons to total population (De Bow 1854a:153).
5. By the 1890 census, the hypodescent rule was firmly in place, and tablefootnotes explicitly indicate that “Negro” “includes all persons of negro de-scent” (U.S. House of Representatives, 1895:xcv–xcvi). Moreover, in compilingtables of census data gathered earlier, the former “all other free persons” andfree colored categories were combined with the “slaves” category to determinethe percentage of blacks in the total population between 1790 and 1890 (U.S.House of Representatives, 1895:xcv).
6. Although foreign-born whites were separated from native-born whitesfor the first time in 1830, this did not affect the total count of whites. The “for-eign born” have been counted in every decennial census since then.
7. The 1850 and 1860 censuses followed the same procedures, but in 1860the actual categories “white, black, or mulatto” appeared on the census formunder the “color” column. The next census, in 1870, used the 1860 format butadded letter codes in the column head (i.e., “W,” “B,” and “M”).
8. In the 1890 census, the question was, “Whether white, black, mulatto,quadroon, octoroon, Chinese, Japanese or Indian.” The instructions to the enu-merators referred to “Color.” (U.S. Bureau of the Census 1989:34, 36)
9. The 1900 census, in fact, noted that these figures’ worthlessness hadbeen acknowledged in the 1890 census (U.S. Census Office 1901:cxi).
Interestingly, only one table in the 1890 population census volume pre-sented the data collected on the various categories of mixtures. It was entitled“Colored Population Classified as Negroes, Mulattoes, Quadroons, Octoroons,Chinese, Japanese, and Civilized Indians, by States and Territories: 1890” (U.S.House of Representatives 1895:table 10, p. 397). In the other tables, the data onrace and color were generally presented in the columns for Negroes, Chinese,Japanese, and the Civilized Indian Population.
10. These latter categories made up smaller proportions of the southwestand northern territories, 9.6 percent and 1.0 percent, respectively (Heads of Fam-ilies 1992).
NOTES TO CHAPTER 4 207
11. Maps showing the density of foreign population were also included inthis 1870 census (U.S. Secretary of the Interior, 1872b).
12. As the next chapter explains, the legal and citizenship status of freemulattoes was originally not clear, and few states specified their status. Differ-ent states resolved the issue differently (see Kettner 1978:287–333).
13. Counts for Indians and Chinese were reported in the 1860 census, butit was not until 1870 that categories for these groups appeared on the censusform.
14. In the 1880 census, the “Asiatic” category was also more explicitly de-fined as including Chinese, Japanese, East Indians, and so on and not includingNative Americans or “half-breeds” (U.S. House of Representatives 1883:xxxvi).
15. The table in the introduction of the 1890 census also included a sepa-rate column tabulating “persons of Negro descent” (U.S. House of Representa-tives 1895:clxxx).
16. When the Fourteenth Amendment was passed, persons of African ori-gin could become naturalized citizens, but persons of Asian origin could not.
17. Mulattoes and blacks were also counted in the 1910 and 1920 censuses.18. One exception was the distribution of the mulatto and black popula-
tion by state for 1910 and 1920 (U.S. Dept. of Commerce, Bureau of the Census,1921:102).
19. Williamson (1984) and Davis (1992) see as ironic, but beneficial, the for-mation of races in which people of African descent have triumphed over nega-tive definitions and arrived at authentic and more constructive self-definitions.According to Williamson, it was the acceptance of the “one-drop” rule that wasthe antithesis to assimilation into white culture—which mulattoes and blackshad earlier pursued—and the start of building a separate culture for blacks.Wacquant (1994) sees this shift as demonstrating how “resistance” and the for-mation of an oppositional cultural identity may, under certain historical condi-tions, prompt the dominated to collude in the perpetuation of their own exclu-sion. From yet another perspective, the hypodescent rule is seen to have hadmore deleterious consequences: “The function of the one-drop rule was to so-lidify the barrier between black and white, to make sure that no one who mightpossibly be identified as black also became identified as white. For a mixed per-son, then, acceptance of the one-drop rule means internalizing the oppressionof the dominant group, buying into the system of racial domination” (Spickard1992:19).
20. The four categories were (1) both parents native born, (2) one parentnative born and the other foreign born, (3) both parents foreign born, and (4)foreign born oneself. The last two categories were often combined in tables be-cause they were thought not to “differ greatly in characteristics” (U.S. Dept. ofCommerce, Bureau of the Census 1922:10).
21. Census takers were instructed that “in order to obtain separate figures
208 NOTES TO CHAPTER 4

for Mexicans, it was decided that all persons born in Mexico, or having parentsborn in Mexico, who were not definitely white, Negro, Indian, Chinese, orJapanese, would be returned as Mexicans (Mex)” (U.S. Bureau of the Census1989:60). This same census also contained a table entitled “Estimated Numberof Mexicans Included in the White Population in 1920,” that is, the number ofMexicans who had been miscounted as “whites” in the previous census. Thetable was accompanied by a chart of the number of Mexicans in selected states,their birthplace, and whether they were of foreign or mixed parentage (U.S. Bu-reau of the Census 1932:2).
22. The list of categories included white, Negro, American Indian, Japan-ese, Chinese, Filipino, Hawaiian, Part Hawaiian, Aleut. Eskimo, and “(etc.).”
23. Although the 1960 census stated that race was derived from what was“commonly accepted by the general public” (U.S. Bureau of the Census1963:xx), it still maintained that groups of “color” included “Negroes, AmericanIndians, Japanese, Chinese, Filipinos, Koreans, Asian Indians, and Malayanraces” and added that “other races” included all “racial stocks” not listed sepa-rately.
24. Interestingly, although self-classification was accepted, the enumera-tors’ manual also contained a long list of possible classifications and how theywere to be reported. “For example, ‘Chicano,’ ‘La Raza,’ ‘Mexican American,’‘Moslem,’ or ‘Brown’ were to be changed to white, while ‘Brown (Negro)’would be considered as Negro or Black for census purposes” (U.S. Bureau of theCensus 1989:83). Consequently, persons who said they were “brown” werewhite unless they indicated they were also “Negro.” Enumerators were also in-structed to assume that unless they learned otherwise, the respondent’s rela-tives living in the unit were also of the same race.
25. Many of the decennial censuses contained introductory sections inwhich the census explained terms, concepts, procedures, and changes from theprevious census and noted problems in conducting the census. The terms usedin these “introductions” were not necessarily the same as those used on the cen-sus form. For example, in 1950, “color and race” were explained in the intro-duction, but the census form simply referred to “race.” The terms used in the in-troductions also varied over time, although the term color was kept until 1960(U.S. Bureau of the Census 1932, 1943, 1953, 1963, 1989:69).
NOTES TO CHAPTER 5
1. Many other groups were also counted in the “other race” category, forexample, Filipinos, but it was the Chinese (first counted in 1860) and the Japan-ese (first counted in 1870) who were reported separately because they were seento constitute the largest “other race” groups.
2. The 1870 census states, “An Indian not taxed should, to put it upon the
NOTES TO CHAPTER 5 209
lowest possible ground, be reported in the census just as truly as the vagabondor pauper of the white or the colored race. The fact that he sustains a vague po-litical relation is no reason why he should not be recognized as a human beingby a census which counts even the cattle and horses of the country” (U.S. Sec-retary of the Interior 1872a:22).
Correspondence to the Hon. James A. Garfield, chair of the Census Com-mittee, from Dr. Franklin B. Hough (February 5, 1869) also notes the concern atthe time with counting the recently freed black population and Indians, wholived on reservations but who were not otherwise counted because they werenot receiving annuities from the United States or who did not live on reserva-tions but lived in U.S. territories, for example, Alaska (Ninth Census of the UnitedStates 1869:13 ff).
3. The report specifically noted “how few of pure Indian race are to befound outside of Government reservations” and how variously mixed wereothers in camps or settlements popularly known as Indian (U.S. Secretary of theInterior 1872a:19).
4. The report did not endorse the criterion applied to former slaves inwhich children born of slave mothers were to be slaves. It stated that this un-fortunate criterion “was the bad necessity of a bad cause, which required everypoint to be construed against freedom” (U.S. Secretary of the Interior 1872a:19).
5. The 1870 census report states, “Where persons reported as ‘half-breeds’are found residing with whites, adopting their habits of life and methods of in-dustry, such persons are to be treated as belonging to the white population.Where, on the other hand, they are found in communities composed wholly ormainly of Indians, the opposite construction is taken. . . . In a word, in the equi-librium produced by the equal division of blood, the habits, tastes, and associ-ations of the half-breed are allowed to determine his gravitation to the one classor the other” (U.S. Secretary of the Interior 1872a:19).
6. An issue on which there is some difference of opinion but little system-atic research is how Europeans perceived Native Americans in terms of color.Many Native Americans have intermarried, yet they are today classified as aseparate race. However, Wilson (1992:117) argues that Indians were not seen asa “significantly darker race” until the 1750s and that they were not called “red”until after 1800. He maintains that Indians were looked down on because oftheir “brutishness” but that this was seen to be the result of custom and envi-ronment and that it was partially ameliorated by the virtues of physical hardi-ness, stoicism, and hospitality. Although they were referred to in negative termssimilar to those used for Africans, such comments did not usually refer to coloror physical features. Rather, it was “warfare, alien customs, and the enraging re-fusal of Indians to accept the white man’s ‘civilization’” that contributed to neg-ative views of Indians (quoted in Wilson 1992:117).
7. Wilson argues that the acceptance of the blood quantum approach rep-
210 NOTES TO CHAPTER 5
resents a “victory of the principles of racial stratification over ethnicity” andthat it also “contributes to the confusion between race and ethnicity, as Indiansare viewed and treated variously as a race and as an ethnic group” (1992:119).
8. Wilson (1992) cites the experiences of two of his students as illustratingthe way in which Native Americans commonly internalize these state defini-tions. One student had consistently expressed a preference to be with full-bloods until she discovered that she herself was not full-blooded. Another feltconsternation at discovering he was more Filipino than Native American.
9. The Continental Congress of 1775 had already established northern,middle, and southern departments with boards of commissioners authorized toconclude treaties with organized tribes. A permanent standing committee onIndian affairs was established in 1776 (Kettner 1978:291).
10. As Kettner stated, “The idea of combining dependency and wardshipwith the idea of a separate allegiance and nationality was perhaps inconsistent;but it sufficed to exclude the Native Americans from the status and the privi-leges of American citizenship” (1978:300).
11. In this regard, it is interesting that in most court decisions before theCivil War, slaves whose masters lived in or were adopted by Indian nations(e.g., the Choctaw) were not under the jurisdiction of Indian laws. Nor couldwhite men who were adopted into Indian tribes alter the obligations they owedas a result of their primary citizenship (Kettner 1978:298–299). That is, federallaw took precedence in matters of citizenship and slavery.
12. This census also counted the number of free people of color and ofwhites living in these particular nations (Kennedy 1862:10–11).
13. On an individual level, the desire to be white (as opposed to any othercolor) has been rooted in the privileges and rights that this color offers. If thiswere not the case, why would anyone want to be white instead of what they ac-tually were? In other words, if the privileged color were yellow, then it wouldbe the desired color. This was recently illustrated in South Africa afterapartheid’s demise in 1994 when some “blacks” who had earlier passed into“colored” status as relief from repression reverted to their black racial identities(Duke 1998).
14. The 1790 law was in effect until 1952 when the Walter-McCarren Act re-versed this policy. It states that “the right of a person to become a naturalizedcitizen of the United States shall not be denied or abridged because of race”(Takaki 1994:26). There is evidence that some nonwhite immigrants were “mis-takenly granted U.S. citizenship” before 1952—for example, the Chinese be-tween 1850 and 1882 and at least 420 Japanese immigrants before 1910 when theOzawa v. U.S. ruling stated unequivocally that the Japanese were “aliens ineli-gible for citizenship” (Almaguer 1994:10).
15. Interestingly, some of the Punjabis in California married MexicanAmerican women in order to be able to own land (in their wives’ names)
NOTES TO CHAPTER 5 211
(Leonard 1992). In this way, they circumvented the prohibition against non-white, foreign-born individuals owning land.
16. The law, which was officially entitled the “India Immigration and Nat-uralization Act of 1946” (and unofficially known as the Luce-Celler Bill), also al-lowed greater numbers of Indians to immigrate to the United States.
17. When exactly the classification of Asian Indians as white began is amatter of some debate. They were clearly entitled to citizenship rights in1946/47 and could own land. Some, particularly those of the second generation,were classified as white because of their physical appearance, while others werenot (Leonard 1992:207). However, as late as 1960, the U.S. Bureau of the Censusstill indicated in its census instructions that Asian Indians were to be classifiedas racially “other” and that “Hindu” was to be written in for them (1989:78). Itwas the same 1960 census that classified as “white” those southern Europeans,Middle Easterners, and those Hispanics who were not definitely any of theother races. Not until the 1970 census did the instructions indicate that a re-sponse suggesting Indo-European stock (which included Asian Indians) was tobe included in the white category (U.S. Bureau of the Census 1973:app. 5).
18. The groups included with Asian Indians are Filipinos, Japanese, Ko-rean, Vietnamese, Native Hawaiian, Guamanian or Chamorro, Samoan, OtherAsian, and Other Pacific Islanders. The last two categories allow individuals towrite in their “race.”
19. See Tienda and Ortiz 1986 for a very good analysis of the census itemsin the 1980 census that are associated with an “Hispanic” identification.
20. In 1940, the census explained the procedure in the following way: “Per-sons of Mexican birth or ancestry who were not definitely Indian or of otherNonwhite races were returned as White” (U.S. Bureau of the Census 1943:3).
21. In 1970, for example, 93.3 percent of Hispanics were classified as“white” (U.S. Bureau of the Census 1972:table 2).
22. A question about one’s “mother tongue,” or language spoken at home,was included in the 1910, 1920, 1930, 1940, 1960, 1970, 1980, and 1990 censuses(U.S. Bureau of the Census 1973: app. C).
23. In all likelihood, appearance was determined by white census enu-merators, as the majority of census enumerators during this period were white.
24. The National Research Council’s recent analysis of the discussionsabout the changing federal standards for racial and ethnic classification took asimilar approach. For example, see pp. 2, 15, and 18 in Edmonston, Goldstein,and Tamayo Lott 1996.
NOTES TO CHAPTER 6
1. This concept of “new people” is borrowed from Williamson (1984), al-though he uses it to refer solely to African Americans in the United States. As
212 NOTES TO CHAPTER 5

used in this chapter, Latin America refers to Spanish- or Portuguese-speakingCentral and South America and the Spanish-speaking Caribbean.
2. Russell, Wilson, and Hall (1992) argue that similar ideas developed inthe African American community and flow from earlier distinctions betweenfield and house slaves, who often had European ancestors. See also Frazier1962:162–175.
3. See, for example, Adams 1989, who argues that the size of theAmerindian population that survived in Central America is an important, butneglected, variable in understanding the histories and current-day situations ofmany Central American countries.
4. The classic example of changing “race” over space is given in the de-scription of how the “race” of a Latin American man can change from “white”in Puerto Rico to “mulatto” or “mestizo” in Mexico to “black” in the UnitedStates. This example also illustrates each country’s distinct racial constructions.
5. Although these terms are fluctuating and ambiguous and vary some-what from country to country, some rough equivalents for common terms aretrigueño/a (wheat colored), jabao (high yellow), moreno (dark skinned, with a va-riety of hair textures and features), and indio (Indian prototype, straight haired).
6. Davis refers to the hypodescent rule as assigning racially mixed personsto the status of the subordinate group. He contends that this “American culturaldefinition of blacks is taken for granted as readily by judges, affirmative-actionoffices and black protestors as it is by Ku Klux Klansmen.” He also states thatthis rule is also known as the “one black ancestor rule” because it is not as strin-gently applied to other nonwhites (1992:5).
7. Forbes (1988) argues that the evolution of the term mestizo (or hybrid) re-flects this shift. He contends that the word hybrid was formerly used to refer toany type of mixture, for example, wild and tame or citizen and stranger. Butgradually, a narrow, more “racial” concept of hybrid was emphasized, whichcame to be called mestizaje in Latin America.
8. See Denton and Massey 1989, who reviewed the central role of theCatholic Church with regard to the consideration of African slaves as havingsouls and therefore being worthy of saving.
9. Hoetink (1985) also argues that the non-Hispanic Caribbean hadsharper class divisions, and the Hispanic Caribbean had more continuity.
10. According to Gutiérrez, calidad was a summation of several measuresof social worth in the community: religion, race, ethnicity, legitimacy, occupa-tion, and ownership of land (1991:202 ff).
11. It is unclear to what extent this secondary source, first published in1932, may have overlooked—and consequently obscured—particular notationsof color or mixture in the originals.
12. It is possible that in the period before the first decennial census, racialclassifications may have been less rigid. See appendix C, which describes the
NOTES TO CHAPTER 6 213
evidence for this in Smith and Wojtowicz’s 1989 and Meaders’s 1993 analyses ofadvertisements for runaway indentured servants between 1728 and 1790.
13. O’Crouley’s 1972 text also contains illustrations and descriptions of the“modes of dress” of these mixtures and families.
14. According to O’Crouley (1972), mestizo referred to the cross between aSpaniard and an Indian, castizo to the cross between a Spaniard and a mestizo.
15. The genre of casta (caste) painting was developed in the beginning ofthe eighteenth century, mainly in Mexico and Peru. The casta paintings were aseries of fourteen to twenty paintings that depicted families and individualsthat had interbred, and their offspring. Although little is known about whospecifically commissioned them, it is assumed that they must have beenwealthy peninsular Spaniards or criollos, that is, persons of full or partial Euro-pean descent born and/or raised in the Spanish colonies. They were oftenpainted by unknown, indigenous, or mestizo painters (García Sáiz 1996).
16. These were often the unacknowledged children of slave owners. It iscurious that both these terms referred to animals, whereas terms referring toother “mixes” did not. This may have reflected the negative view of such chil-dren or simply the strongly agrarian environment of the time.
17. Forbes says that the term loro (or the feminine lora) was the archaic termused in Spain for people from North Africa, the Canary Islands, the Americas,or India. It was sometimes used to refer to mixed individuals, but it was alsoused to apply to brown-skinned persons. He also notes that the first Spanish ex-plorers referred to the indigenous people as loro colored but that after 1570, theuse of this term declined. Today this is the term used for a “parrot” (1988:111).
18. As Cotter 1996 and the essays in Katzew 1996 suggest, interpreting theracial climate that these paintings reflect is quite difficult. Cotter, for example,concluded that they represent a fictional melting pot with mixed messages ofhalf-celebration and half-coercion and that this is the legacy of Latin Americatoday.
19. Gutiérrez found in his analysis of northern Mexico that the vast major-ity of racial mixing in 1750 and in 1790 occurred among mixed bloods. In otherwords, “like married like.” He argues that this might have made more preciseracial or physical distinctions less important or possible. However, he rejects thenotion that persons were blind to race (1991:292). Klor de Alva (1996:60 ff) andMacLeod (1973) also noted the expansion in number and variety of mixed peo-ples during the early colonial period.
20. According to MacLeod 1973, these groups were free but were not seento be the social or legal equals of Creoles or Peninsulares. They were viewed asantisocial elements who served as intermediaries with the Indians. Their rapidgrowth and their possible alliance with the Indians also were feared.
21. Specifically, this has been found to be the case with regard to censuscategories in Canada (Statistics Canada and U.S. Bureau of the Census 1993), in
214 NOTES TO CHAPTER 6

the United States (Lee 1993; Martin, DeMaio, and Campanelli 1990; Miller 1991),and in the Americas (Almey, Pryor, and White 1992).
22. Stephens defined pardo or parda as “gray” or “brown” (1989:341).23. The literature in this area on Brazil is extensive; see the following for an
analysis of past and more contemporary views of the development of race ide-ology and practices in Brazil: Andrews 1980, 1991; Brookshaw 1986; Degler1986; Dzidzienyo 1993; Fernandes 1969, 1979; Fontaine 1985; Frazier 1942; Han-chard 1994; Hellwig 1992; Margolis and Carter 1979; Nobles 1995; Silva andHasenbalg 1992; Skidmore 1990; Telles 1992, 1993, 1994; Winant 1992).
24. Café con leche is translated literally as “coffee with milk,” and in LatinAmerica, this color covers a range from beige to mocha. Mestizaje refers to a bi-ological and cultural mixture, as in the term mestizo, which refers to someonewho is half-Indian and half-Spanish. Indigenismo refers to the indigenous pop-ulation, and cryptomelanism is a term created to signify the death of “melanin,”or color.
25. Graham perhaps best described the influence of such ideologies: “It isnow commonplace among historians to refer to hegemonic ideologies throughwhich, it is argued, dominant classes shape the entire culture of their society,creating the predominant intellectual categories and limiting the possible rangeof any challenge. These ideologies are accepted (at least for awhile) by the verygroups who are thereby controlled. The idea of race as it was formulated in the19th century seems to have served that function” (1990:1).
26. As Winant pointed out, race is always being contested and defined.Elites, popular movements, state agencies, religions, and intellectuals of alltypes develop racial projects that interpret and reinterpret the meaning of race(Winant 1992:183).
27. These were studies conducted or commissioned by the census as partof its efforts to determine why people were either missed or erroneously in-cluded in the last decennial census. A number of reasons were found for the un-dercount of various groups in diverse areas of the country. They were (1) irreg-ular and complex household arrangements (plus the fact that different groupsconceived of households differently and would, therefore, not include personsliving in the household but not considered members of the household, for ex-ample, boarders; (2) irregular housing (some households were not counted be-cause their living quarters were not visible to postal clerks, being, for example,behind and above a commercial establishment); (3) residential mobility; (4) fearof government and outsiders; and (5) a poor command of English (de la Puente1993:37).
28. This study used cognitive, in-depth interviews and focus groups inWashington, D.C., San Francisco, and Los Angeles. The sample was chosen soas to include immigrants for whom English was not their first language, as wellas Hispanics who spoke only English.
NOTES TO CHAPTER 6 215
29. When comparing Hispanics with other “races,” the researchers as-sumed that Hispanics were a “race.” It is unclear whether they shared theLatino view of “race” or if they were using another criterion. As noted earlier,according to the current census policy, Hispanics can be of any race.
The question about ethnic origin did not elicit within-country ethnicity, forexample, Mayan Guatemalan. The authors recommended that to gather suchinformation, the census should change the phrase “ethnic origin” and ask: Cuales el origen de esta persona? “What is this person’s origin?”
NOTES TO CHAPTER 7
1. The Census Bureau asked a similar question in the 1970 census, but itwas included only in the 5 percent sample questionnaire. The question askedfor the person’s origin or descent and provided five categories: Mexican, PuertoRican, Cuban, Central or South American and Other Spanish, and a final “No,none of these.” (McKenney and Cresce 1993). With regard to the race question,what had been eight categories in the 1970 census became, through modifica-tions and additions, fourteen categories in 1980. These fourteen categories werelisted under the four major categories, that is, white, black, Asian and Pacific Is-lander, and Native American Indian.
2. I examined these data by gender and found few differences betweenmales and females with regard to the general issue of racial classification. Con-sequently, I have not presented separate data for men and women.
3. A subcategory called “Asian and Pacific Islander” was also included forthe first time in 1990.
4. Denton and Massey (1989) and Massey and Denton (1992) explicitlymentioned this interpretation. Others, e.g., Rosenbaum (1996) and Rodríguez(1990, 1991a), did not define the category as a mixed-race category but did usethe category in their analyses. Given the predominance of the bipolar perspec-tive, some readers assumed that if the category was called “other race,” it hadto mean that those in the category were “other than white or black,” that is, mu-lattoes or mestizos.
5. See Rodríguez 1990 and Massey and Denton 1992, who noted thedifficulties of discerning race from Hispanics’ subjective responses on thecensus.
6. This sample is described in chapter 3. These were preliminary results.7. There was some reaction. In 1988, the U.S. Office of Management and
Budget proposed adding an “other” racial category to Directive 15, but mem-bers of Congress, some of the federal agencies, and “members of some of the mi-nority communities” opposed it (U.S. House Committee 1994n:215).
8. With the exception of some articles, for example, Wright 1994 and San-dor 1994, there was also relatively little coverage of the issue in the popular
216 NOTES TO CHAPTER 6
press. Neither the English- or the Spanish-language media took much notice ofthe 1980 results.
9. It also referred to the 10 percent of the general population who did notanswer the Hispanic-origin question.
10. External effects on identification have been acknowledged for NativeAmericans. A U.S. Department of Labor study of racial and ethnic identificationrecognized that the identification of American Indian, Eskimo, or Aleut “maynot be straightforward” and “may have a reliability problem and be sensitive tomethods effects (e.g., the way the question is asked)” (1995:2).
11. With regard to the race question, 98 percent of whites, 96 percent ofblacks, and 91 percent of Asian and Pacific Islanders gave the same answer dur-ing a reinterview study that they had given on the census questionnaire (U.S.General Accounting Office 1993:22 ff).
12. Reporting race was less consistent for Hispanics and a number of othergroups, for example, multiple-race persons, the foreign born, and persons whodid not read or speak English well (U.S. General Accounting Office 1993:22 ff).
13. The question asked was “How would you describe yourself racially?”14. A recent and dramatic example of how just the presence of particular
groups on census forms could influence responses was noted in the last Cana-dian census. By including the category “Canadian” in its list of sample answers,next to its question on ethnic origins, the number of people who reported thisancestry increased eight times over that in 1991 (Norris 1999:A9).
15. This analysis was based on the 1990 PUMS (Public Use Micro Sample)5 percent sample and included individuals who answered affirmatively to theHispanic-identifier question on the 1990 census. In this analysis, Mexicans,Puerto Ricans, and Cubans refer to those who checked one of these categorieson this census question. The “other Latin American” (OLA) group are thosewho indicated their “origin” from a Spanish-speaking country in the Caribbeanor Central or South America. The “other Spanish/Hispanic” (OSH) group arethose respondents who reported in a less country-specific way, for example,that they were “Hispanic,” “Spanish,” “Spanish American,” “mestizo,” or“Meso-American Indian.” (See appendix A for a discussion of the data limita-tions of the 1990 census.)
16. For example, the distribution of Cubans was different from that ofMexicans and Puerto Ricans. Cubans with both little and much education re-ported they were “other race” much less often than did the other groups. Only14.4 percent of Cubans with an eighth-grade education or less classified them-selves as “other,” whereas the proportions of Mexicans and Puerto Ricans withan equivalent education were higher and similar, 52.7 percent and 52.3 percent,respectively.
17. For example, among those with a graduate education, the proportionclassifying themselves as “other race” continued to be substantial for Mexicans
NOTES TO CHAPTER 7 217
(32.3%) and Puerto Ricans (31.4%). Figures for the other groups were “otherLatin Americans” (21.1%), “other Spanish/Hispanics” (11.5%), and Cubans(8.7%).
18. The 1990 data do not show self-classification as black to be associatedwith age or education in any consistent or distinct pattern. Because the numbersreporting they were Asian, Pacific Islander, or Native American Indian were sosmall, they are not discussed in detail.
19. Of the “other Spanish/Hispanic” group, 70.74 percent of those eight-een and older were born in the United States; Mexicans, 41.60 percent; andPuerto Ricans, 42.66 percent.
20. Differences between how the U.S. born and the foreign born reportedrace were slight in some cases. For example, 56.2 percent of U.S.-born Mexicansreported that they were white, compared with 44.8 percent of immigrant Mex-icans, and somewhat more Mexican immigrants in this age group (54.0%) re-ported that they were “other,” compared with the U.S.-born group (41.62%).The differences were smaller for Puerto Ricans: 48.09 percent of Puerto Ricans,eighteen and older, who were born in the states classified themselves as white,compared with 47.4 percent of those born abroad. Similarly, 42.66 percent ofthose born in the states reported that they were “other,” compared with 47.8percent of those born abroad. The differences were more marked for the “otherSpanish/Hispanic” group, with 63.19 percent of those born in the United Statesreporting that they were white, compared with 52.9 percent of those bornabroad. The figures for those reporting that they were “other” were 23.87 per-cent for the U.S. born and 25.9 percent for the foreign born. In addition, more ofthe foreign-born persons in the OSH group reported they were “black” or“Asian and Pacific Islander.”
21. Earlier research on Puerto Ricans in New York City suggested somepreliminary evidence of a “browning” phenomenon, in which individualssee themselves as, or identify themselves with, nonwhites. This is a reversalof the “whitening” process more prevalent in Latin America (see Rodríguez1974). I discovered (Rodríguez 1989, 1990) that among mainland-born PuertoRicans, a slightly higher proportion classified themselves as black, and feweras white, than did island-born Puerto Ricans. I obtained similar results in1990 for U.S.-born Mexicans and Puerto Ricans, but not for the OSH group.But generalizations about “browning” versus “whitening” are risky becausethe cell sizes were small; for example, 70 percent of the OSH group was bornon the mainland.
22. “Speaking only English at home” is only a partial proxy for languageknowledge. We cannot assume that because individuals report they speak“only English at home,” they do not speak Spanish at all.
23. The pattern is the same for other groups, though with differences of de-gree. Among Cubans, 10.5 percent of those who speak only English checked
218 NOTES TO CHAPTER 7

“other race,” compared with 12.4 percent of Cubans who speak Spanish athome. For “other Latin Americans,” the respective figures are 23.7 and 36.1 per-cent, and for the “other Spanish/Hispanic” group, 18.7 and 36.4 percent.
24. For Mexicans speaking only English, the figures are 58.4 percent white,1.9 percent black, and 2.4 percent API/NAI. This contrasts with 48.3 percentwhite, 0.5 percent black, and 0.6 percent API/NAI for those who speak Spanishat home. This pattern also holds for Puerto Ricans, other Spanish/Hispanic,and other Latin Americans. Interestingly, a lower proportion of Cubans speak-ing only English reported that they were white (76.6%), compared with Cubanswho speak Spanish at home (84.4%). But consistent with the general pattern ofthe other groups, higher percentages of those who speak only English reportedthat they were black or API/NAI.
25. This study used logit regression to analyze the original survey data of258 travelers to Puerto Rico—half of the sample lived in Puerto Rico and theother half in the United States. It controlled for age, education, amount of timespent in the United States, and the respondents’ perception of how NorthAmericans saw them racially.
26. I found (Rodríguez 1989) that for Hispanics, identifying as “other race”in 1980 was positively associated with the density of the Hispanic population ina particular state and negatively associated with the proportion of blacks in thatstate. It was not associated, however, with the proportion of whites in a partic-ular state. I believe that the more salient the biracial structure was, that is, thegreater the proportion of blacks was, the more likely Hispanics were to givebiracial classifications for themselves as white or black. Conversely, the greaterthe proportion of Hispanics was, the more likely they would identify as “otherrace” and write in a Latino referent. There was a great deal of variation fromstate to state in the proportion of Hispanics who identified as “other race,” from6 percent in West Virginia to 48.5 percent in Kansas.
27. According to Bates and colleagues (1994), reversing the Hispanic andrace items also reduced Hispanics’ nonresponse rates for this question, but theamount of reduction varied in three experiments conducted in 1990.
28. Puerto Ricans are not immigrants, but the census does provide the yearthat they first came to the mainland to stay. See Rodriguez 1989c for a discus-sion of the (im)migrant status of Puerto Ricans.
29. Of Cubans who immigrated within the last ten years, 78.25 percentidentified as white, compared with 86.06 percent of those who immigrated be-fore 1980. More of the recent immigrants identified as black (4.95%) or “other”(16.24%), compared with the earlier immigrants, 2.35 percent of whom identi-fied as black and 11.18 percent as “other.” Many recent Cuban refugees—de-scribed in the popular press as “Marielitos”—were seen as “darker” and as hav-ing lower-class origins than the earlier waves of post-Castro immigrants.
30. In the Dominican case, although the proportion who classified
NOTES TO CHAPTER 7 219

themselves as white was the same for both recent and earlier immigrants,the proportion of immigrants checking “black” increased, from 26.77 per-cent to 32.27 percent. However, the percentage of recent immigrants indicat-ing they were “other” decreased, from 43.68 to 38.16 percent.
31. Panamanians had another transformation, with the percentage classi-fying themselves as black dropping from 46.94 to 24.32 percent and the propor-tion reporting that they were “other” rising from 22.16 to 42.04 percent after1980. The apparently greater shifts in the Panamanian group may have been af-fected by the group’s relatively smaller size.
32. For example, there was a slight decrease in the number of Ecuadorianand Guatemalan immigrants classifying themselves as white and an increase inthose reporting they were “other.” Also, many fewer of the OSH group classi-fied themselves as white before 1980 (56.78%) compared with the last ten years(47.14%). However, given the polyglot composition of this latter group, it is dif-ficult to determine the reason for this.
33. In other words, they classified themselves as racially white and an-swered questions in cultural terms.
NOTES TO CHAPTER 8
1. Other proposals were made or discussed, for example, Katzen, from theOMB, referred to proposals to provide an open-ended question to solicit infor-mation on race and ethnicity or to combine the concepts of race, ethnicity, andancestry, but these did not receive much attention at this time (1994:219).
2. Although no major alliances were projected, many of those testifying,particularly the federal representatives, did comment on the proposals and ex-pressed support (or the lack of it) for the different proposals. For example, theNational Coalition for an Accurate Count of Asians and Pacific Islanders didsupport the proposal of Native Hawaiians as presented (U.S. House Committee1994r:95). Others provided qualified commentary on the proposals. The pro-posal for a multiracial category particularly engaged the attention of many ofthose at the hearings, although it too was not endorsed by most of the privateor public groups testifying. Indeed, Dr. B. Tidwell of the National Urban League(U.S. House Committee 1994d) was more explicit than others about oppositionto the multiracial proposal when he expressed concern about the potential im-pact of such a category on the numerical representation of blacks.
3. Many reject this mutually exclusive approach (see Graham 1994; Root1992b, 1996), but others resist a “mixed race” classification (see Jones 1994; Sin-clair 1994).
4. This “other race” category was not viewed as a satisfactory option bythe multiracial groups, for it implied to them that individuals were “none of theabove” while their position was that they were “more than one of the above.”
220 NOTES TO CHAPTER 7
As noted earlier, this position resonates with some Hispanics, who also feel thatthey are “more than one of the above.”
5. It should be noted that at this point in the process, the representative ac-knowledged that the group’s constituency had not yet formed a consensus ap-proach with regard to ethnicity, race, and minority status.
6. Although increasingly used in the United States, the term people of colorhas also been used in more international contexts. It is both a cultural/ethnicand a political definition of identity that is often a response to the privilegedconception of the term white.
7. The “Asian and Pacific Islander” census category had thirty differentethnic groups, each with its own language, health statistics, education, income,and history in the United States (U.S. House Committee 1994h).
8. In this context, they gave the example of persons from the Indian sub-continent who had not been considered “Asian” and had lobbied successfullyto be counted not as “whites” but separately within the “Asian and Pacific Is-lander” category.
9. This was a subcommittee of the U.S. House of Representatives Commit-tee on Post Office and Civil Service. It held hearings on May 28, 1974; June 12,1974; March 21, 1975; March 21, 1975; and June 1, 1976.
10. The MALDEF statement also indicated that a more important problemwas the “lack of a uniform definition of ‘Hispanic’ throughout the Federal Gov-ernment”—for example, the Department of Labor included Americans ofBrazilian and Portuguese ancestry in its definition of “Hispanic,” but the cen-sus did not (U.S. House Committee 1994k:178). MALDEF argued that this lackof uniformity compromised the data on Hispanics.
11. In this study, all four groups had a “preference for Hispanic origin as aracial category.” The range for all four groups was 61 to 74 percent expressingthis preference, with those who had received the combined question having ahigher majority (U.S. Dept. of Labor, Bureau of Labor Statistics 1995:table 3).
12. The approach taken in Directive 15 is compatible with the Census Bu-reau’s approach, for census data can be manipulated and presented in the formrequired by Directive 15. Many governmental agencies, as well as academic andprivate-sector researchers, collect their data using the Directive 15 categories.
Directive 15 has been criticized because its classification criteria are notuniformly applied to all groups. The directive establishes four criteria for clas-sifying persons into racial or ethnic categories: (1) descent from original peoplesof specific regions or nations, (2) a specific cultural origin, (3) cultural identifi-cation or affiliation, and (4) physical race itself. The directive includes as“white” any person with origins in any of the original peoples of Europe, NorthAfrica, or the Middle East. Thus, Arabs from these areas are classified as white,but a specific cultural origin is used to classify Hispanics and not Arabs (Hahn1992, 1994; Hahn, Mendlein, and Helgerson 1993).
NOTES TO CHAPTER 8 221

13. Specifically, the NCLR statement said: “While we recognize and un-derstand that there is a technical difference between the terms ‘race’ and eth-nicity, frequently these terms are interchangeably used by society. The practicalconsequences of ‘Hispanic’ as a ‘race’ then, warrant that it be included in theracial identifier question. The absence of such categorization [i.e., Hispanic]contributes to a ‘black-white’ paradigm currently used to discuss the concept ofand issues related to race in the U.S.; as the changing demographics confirm,that paradigm is neither accurate nor useful” (U.S. House Committee1994p:177).
14. As just noted, the NCLR also attached to its position paper recom-mended census questions that included retitling the race item “Race/Ethnicity”and retaining the separate Hispanic question. Hence, although it appeared to bein favor of making “Hispanic” a race, the NCLR supported “the considerationof a question that would read, ‘Race/Ethnicity,’ followed by the ‘White, non-Hispanic,’ ‘black, non-Hispanic,’ the other categories as currently listed, and‘Hispanic’” (U.S. House Committee 1994p:177). Thus, the NCLR would makethe race question a race/ethnicity item. This suggests that its view of “race” wasstill more akin to the “social race” concept associated with Latin Americanviews of race (Pitt-Rivers 1975; Wagley 1965).
15. This comment suggests that when race and ethnicity are explicitlycombined and defined as such, many issues disappear. Fernández seemed torecommend a similar approach in his testimony, that whenever informationwas sought on both racial and ethnic groups, a category called “multiracial/multiethnic” be used (1992:128).
16. Two other issues were also examined: (1) the inclusion of a multiracialcategory and (2) preferences for such terms as “African-American” or “Latino.”
17. These findings were first evident in the special Current Population Sur-vey sample, which was divided into four panels, two of which were asked aquestion in which Hispanics were listed as a category in the race question, andthe other two were asked separate race and Hispanic-origin questions. The re-spondents were first visited and then interviewed a number of times by phonefor more than a year (U.S. Dept. of Labor, Bureau of Labor Statistics 1995). Theproportion that identified as “Hispanic” dropped significantly (by 20% to 25%)when the combined question was used. Fewer Hispanics also reported theywere “white” (4% to 5% less) (U.S. Dept. of Labor, Bureau of Labor Statistics1995:4, table 8). As indicated in the study, “a higher percent of people identifiedthemselves as Hispanic when they were asked a separate question than whenHispanic was included as a racial category” (U.S. Dept. of Labor, Bureau ofLabor Statistics 1995:2).
The extent to which different Hispanic groups chose the “Hispanic” racegroup varied by national origin, with Cubans being “more likely to identify as
222 NOTES TO CHAPTER 8
‘White’ in all panels” compared with the other Hispanic-origin groups (U.S.Dept. of Labor, Bureau of Labor Statistics 1995:4). Thus, some groups, such as“Cubans and ‘Other Hispanic’ are less likely to be included as Hispanics whenHispanic is included in the list of races” (Tucker et al. 1996:45). This is in keep-ing with the findings discussed in chapter 7 on who chooses the “other race”category.
18. Specific dissatisfactions were that there had been little research on thesubstantive meaning or relevance of the Directive 15 categories and that somerespondents did not identify with or find applicable any of the available cate-gories while others encountered technical difficulties because of the currentwording of the directive. Examples of these difficulties were that persons ofHispanic ethnicity were explicitly assumed in Directive 15 to be either white orblack and not Asian and Pacific Islander or American Indian and Alaskan Na-tive. There was no race category that included persons native to Central andSouth America, no race category for blacks from areas in the world other thanAfrica, and uncertainty about many persons from northern Africa. There alsowere problems with classifying Brazilians and persons from Spain who were in-cluded with Hispanics and were thus separated from other European groups(Edmonston, Goldstein, and Tamayo Lott 1996:25).
19. The report was a response to the request for information from the com-mittee overseeing the preparation of the 2000 census. It also indicated that theGovernment Accounting Office had earlier provided the subcommittee with in-formation on December 15, 1992.
20. Other groups that also did not consistently give the same responsewere Native Americans (only 59% were consistent) and “Other Asian or PacificIslanders” (18%) (U.S. General Accounting Office 1993).
21. In 1990, the allocation rate for the race question was 2 percent. In otherwords, 2 percent of those who responded to the census form did not answer thisquestion; consequently they were allocated (assigned) to another race. This ratewas comparable to the allocation rates for other questions on the census, but itdid represent an increase from 1.5 percent in 1980 (U.S. General Accounting Of-fice 1993).
22. The census indicated that the increase from 1980 to 1990 in the His-panic-origin allocation rate was due to a lower level of follow-up in 1990. In1980, the census corrected missing or inconsistent information in phone calls orvisits. In 1990, funds for these correcting activities were given to other areas, forexample, unanticipated cost increases and new program priorities (U.S. GeneralAccounting Office 1993). A preliminary analysis did not find any consistent biasin the 10 percent allocated (U.S. General Accounting Office 1993).
23. This report did not indicate the response rate for Hispanics and non-Hispanics on the Hispanic-origin question.
NOTES TO CHAPTER 8 223
24. This was termed high inconsistency in the Other-Hispanic category.25. In making this statement, I am not advocating a conspiracy theory or
even suggesting that those who organized the hearings were remiss in theirarrangements. Rather, I am referring to the general lack of Hispanic input in allthe discussions concerning reevaluations of the race and ethnic measures. Thehearings were just a reflection of this.
26. As noted earlier, this is not to say that sequencing and the presence ofa multiracial category are unimportant, for when the race question was askedfirst and the “multiracial” category was not included, more Hispanics (42.9%)chose “other race” (see table 8.1). When a mixed-race category was offered andthe race question was asked first, 33 percent chose “other race.” This suggeststhat—as discussed in earlier chapters—for some Hispanic respondents, “otherrace” represents a mixed-race response. The presence of the multiracial cate-gory reduced the number that chose the “other race” category in the race-firstscenario (U.S. Bureau of the Census 1996a:table 11). However, as the figures in-dicate, this was not the case for all, for 33 percent still chose the “other race” re-sponse under these same conditions.
Moreover, there are other indications of the importance of sequencing.When we asked the “Hispanic” question first, the proportion of Hispanics whochose the “other race” category was almost the same, regardless of whether amultiracial category was offered (25.1%) or not (24.9%). Thus, a quarter of theHispanics still chose “other race” even when a multiracial option was availableand they had already indicated their Hispanic identity (U.S. Bureau of the Cen-sus 1996a:table 12). In the RAETT study, changing the sequence also reduced—but did not eliminate—the number of nonresponses to the “Hispanic” question(de la Puente et al. 1997).
27. Other changes include the separate listing of Asian Pacific Islandergroups without a generic category called Asian or Pacific Islander. The OMBalso allowed the census to use, in the 2000 census only, a sixth category, called“Some other race” (print race) (U.S. Office of Management and Budget 1999:13).
28. This group of 165,000 was not uniformly distributed (U.S. House Com-mittee 1994l).
29. The then–acting director of the census stated that “the dynamic natureof ethnicity and to a lesser extent, race, further complicates the evaluations ofthe questions. Ethnicity totals are in constant flux. Ethnicity distributionschange as a result of new immigration flows, new and different ways of identi-fying ethnicity, blending, and intermarriage, and the emergence of new ethnicidentities” (U.S. House Committee 1994f:14). See also U.S. Bureau of the Census1990:5 for recent assessments of the race and ethnicity questions.
30. Congressman Sawyer’s two other lessons were that there was a need“to continue to collect race and ethnic data” and that there “should continue tobe uniform data across government agencies.”
224 NOTES TO CHAPTER 8
NOTES TO APPENDIX A
1. The National Center for Health Statistics, for example, coded Hispanicsinto the “white” category on vital statistics records (McKenney and Bennett1994:21).
2. The common factors were age, relationship to household head, and in-come. Factors that varied by group were household size, sex, education, anddistrict office mail response rates. The differences between groups decreasedwhen covariates were added.
3. Mail response rates were also generally lower in the 1980s than in the1970s, despite the census’s efforts to improve response rates (Fein 1990:298).
NOTES TO APPENDIX B
1. The American College Dictionary (New York: Random House, 1957:595)states that the term hypo is a “prefix meaning ‘under’ either in place or in degree(‘less’ or ‘less than’).”
2. In 1990, Asian/white marriages constituted the largest group of interra-cial marriages, 31 percent. In the majority of Asian/white unions, the father iswhite. About as many American Indian women marry whites as do AmericanIndian men. In the majority of black/white marriages, the father is black (Ben-nett, McKenney, and Harrison 1995:table 1).
3. The growing consensus on this statement is evident in Gutin’s commentabout scientists involved with the Human Genome Diversity Project. She saysthat the scientists repeat, almost like a “mantra,” that “the patterns of variationthat appear at the genetic level cut across visible racial divisions.” This geneticunity means, for instance, that “white Americans, though ostensibly far re-moved from black Americans in phenotype, can sometimes be better tissuematches for them than are other black Americans” (1994:73).
NOTES TO APPENDIX C
1. This shift has not been given much attention in the literature or in mostaccounts of changes in census classifications (see, e.g., Anderson, 1988; U.S. Bu-reau of the Census 1978, 1989). The question is why researchers and others havenot more closely examined it. One possibility is that the shift may have beenseen as inconsequential because of the size of the category. Or it may have beenseen as reflecting a change in terminology but not in the definition of the group.In other words, the researchers may have simply assumed that the category re-ferred to people of color and not been aware of the absence of a color term ordeemed the absence to be insignificant. Nonetheless, this difference in censuscategories was the first notable change since the census began. The one other
NOTES TO APPENDIX C 225

change, the inclusion of the term “except Indians not taxed” in the “all otherfree persons” category in 1800 seems to have been one mainly of clarification.
2. The first act, which established the 1790 census, authorized U.S. mar-shals to count the inhabitants in their districts, “omitting Indians not taxed, anddistinguishing free persons, including those bound to service for a term ofyears, from all others; distinguishing also the sexes and colours of free persons,and the free males of 16 years and upward from those under that age” (Wright1956:43). The subsequent legislative acts establishing the 1800, 1810, and 1820censuses were similar in that they retained this phrasing.
3. If we knew how the first census law was put into effect, we might knowwhy “colors of free persons” was not determined, despite the legal requirementto do so. Just how President George Washington and Secretary of State ThomasJefferson put the first census law into operation is “not definitely known”(Wright 1956:44). A search of correspondence files “did not reveal any record ofcorrespondence with the marshals” for the 1790 census other than that relatingto the transmission of their commissions (Wright 1956:44). A letter dated March31, 1790, containing two copies of the census act was sent to the state governors,and they may have instructed the marshals (Wright 1956:44).
4. The 1820 census also counted for the first time the gender and ages of“free colored persons” and of “slaves.” But the gender and age of “foreigners”or of “all other persons, except Indians not taxed” were not recorded (U.S.Statutes at Large 1963:550; Census for 1820 1821:no. 1, n.p.). Interrogatory 33 inthe 1820 census specifically instructs the assistants of the marshals to determine“how many other persons, EXCEPT INDIANS NOT TAXED?” (Census for 1820,1821:no. 5, n.p.).
5. Actually, the House passed Madison’s proposal, but the Senate did not.Since Senate sessions were closed during this period, it is not known exactlywhy the Senate did not approve it.
6. The shift from “all other free persons” to categories of color was onlyminimally addressed in the decennial censuses. For example, the 1850 censusnotes in one table that the “free colored persons” category includes “THOSERETURNED UNDER THE DENOMINATION OF “ALL OTHER FREE PER-SONS, EXCEPT INDIANS NOT TAXED” (capitalization in the original). A foot-note to this table adds that “it is proper to remark, that prior to 1820 the returnsof slaves and free negroes were made in gross numbers, without regard to sexor age; and, indeed, at that period a small portion of the latter class were re-turned under the general appellation of [following in italics] all other free persons,except Indians not taxed” (U.S. Secretary of the Interior 1853a:table xxxvii). Re-gardless of how this footnote is interpreted, that is, as acknowledging an erroror a simple shift, the change was clearly not worthy of much discussion. More-over, most of the later tables (comparing these population groupings over time)completely ignored the distinction between “all other free persons” and “free
226 NOTES TO APPENDIX C

colored” (see, e.g., U.S. House of Representatives 1895:xcv–xcvi; U.S. Secretaryof the Interior 1853a:xxxvi, 6, 926, tables ix and lxvii).
7. The city’s wards also varied greatly in the proportions in their popula-tions of (a) slaves and (b) “all other free people.” For example, while slaves con-stituted only 6 percent of New York City’s total population, they constituted23.5 percent of the total population of the borough of Harlem. Similarly, while“all other free people” constituted 3.3 percent of New York City’s total popula-tion, they constituted 5.1 percent of the total population of Harlem (Heads ofFamilies 1992:119–124).
NOTES TO APPENDIX D
1. Given that this census was taken on the eve of the Civil War, the accu-racy of its figures is unreliable, as are the figures of many of the earlier censuses.
2. This census found that the population of whites had risen by 38 percent,while that of slaves and free colored had increased by less than 22 percent be-tween 1850 and 1860. The previous seventy years showed a similar contrast, 485percent versus 757 percent. The report also predicted that many of the emanci-pated slaves would be of mixed descent, since “in 1850 one-ninth part of thewhole colored class were returned as mulattoes.” Finally, it discussed the num-bers of Negroes who had gone to Liberia between 1820 and 1856, the majorityof whom had been free (Kennedy 1862:8).
3. The phrase “any perceptible trace” raises some interesting possibilities.If a “trace” was not perceptible, then it is possible that they might have beenclassified as “white.” However, residence, family, and other social factors mayalso have influenced perception. The question is whether, according to this cri-terion, classification was based more on “perception” than on known biologicaldescent (Miller 1991).
4. Before the Civil War, the majority of people of African descent had beenslaves. As long as individuals were slaves, their appearance (specifically, theirsimilarity to whites) was not of major consequence. After slavery, the possibil-ity of passing and becoming “white” became more of a threat. Williamson(1984) and Hodes (1997) found that fierce opposition to miscegenation and mu-lattoes surfaced after the Civil War.
NOTES TO APPENDIX D 227

References
Acuña, Rodolfo. 1988. Occupied America: A History of Chicanos. 3d ed. New York:Harper & Row.
Adams, Richard N. 1989. “The Conquest Tradition of Mesoamerica.” The Amer-icas, October, pp. 119–136.
“Aggregate Amount of Each Description of Persons within the United States ofAmerica, and the Territories Thereof, Agreeably to Actual EnumerationMade According to Law, in the Year 1810,” microfilm of photocopy of table,1810.1 (Dubester 10) supplied by the Social and Economic Statistics Ad-ministration Library, National Archives, Suitland, MD.
Almaguer, Tómas. 1994. Racial Fault Lines: The Historical Origins of White Su-premacy in California. Berkeley and Los Angeles: University of CaliforniaPress.
Almey, Marcia, Edward T. Pryor, and Pamela M. White. 1992. “National CensusMeasures of Ethnicity in the Americas.” Proceedings of the InternationalUnion for the Scientific Study of Populations Conference on the Peoplingof the Americas, vol. 3. Vera Cruz, Mexico, May 23.
Alvar, Manuel. 1987. Léxico del mestizaje en Hispanoamérica. Madrid: Edicionescultura hispanica, Instituto de cooperación Iberoamericana.
American College Dictionary. 1957. New York: Random House.Anderson, Margaret. 1988. The American Census. New Haven, CT.: Yale Univer-
sity Press.Anderson, Margo, and Stephen E. Fienberg. 1999. Who Counts? The Politics of
Census-Taking in Contemporary America. New York: Russell Sage.Andrews, George Reid. 1980. The Afro-Argentines of Buenos Aires, 1800–1900.
Madison: University of Wisconsin Press.———. 1991. Blacks and Whites in Sao Paulo, Brazil: 1888–1988. Madison: Uni-
versity of Wisconsin Press.Aptheker, Herbert, ed. 1968. A Documentary History of the Negro People in the
United States: From Colonial Times through the Civil War. Vol. 1. New York:Citadel Press.
Arce, Carlos H., Edward Murguía, and W. Parker Frisbie. 1987. “Phenotype andLife Chances among Chicanos.” Hispanic Journal of Behavioral Sciences 9(1):19–32.
229
Arocha, Jaime. 1998. “Inclusion of Afro-Colombians: Unreachable NationalGoal?” Latin American Perspectives 25 (3) (May):70–89.
Atkinson, Jonnae O., Marian F. MacDorman, and Jennifer Parker. 1999. “Trendsin Births to Parents of Two Different Races: United States, 1971 to 1995.”Paper presented at the National Conference on Health Statistics, August2–4, Washington, DC.
Banton, Michael. 1983. Racial and Ethnic Competition. Cambridge: CambridgeUniversity Press.
Barbosa, Belen A. 1991. “La ‘Mujer Negra.’” Paper presented at the Symposiumon Racial Discrimination to Commemorate the Abolition of Slavery. Uni-versity of Puerto Rico, San Juan, March 6.
Barringer, Felicity. 1993. “Ethnic Pride Confounds the Census.” New York Times,May 9, p. 3.
Barzun, Jacques. 1965. Race: A Study in Superstition. New York: Harper.Bates, Nancy A., Elizabeth A. Martin, Theresa J. De Maio, and Manuel de la
Puente. 1995. “Questionnaire Effects on Measurements of Race and Span-ish Origin.” Journal of Official Statistics 11 (4): 433–459.
Bates, Nancy A., Manuel de la Puente, Theresa J. DeMaio, and Elizabeth A. Mar-tin. 1994. “Research on Race and Ethnicity: Results from Questionnaire De-sign Tests.” Paper presented at the U.S. Census Bureau’s annual researchconference, March 20–23, Rosslyn, VA.
Begley, Sharon. 1995. “Three Is Not Enough.” Newsweek, February 13, pp. 67–69.Bell, Derrick. 1973. Race, Racism and American Law. 3d ed. Boston: Little, Brown.———. 1992. Faces at the Bottom of the Well: The Permanence of Racism. New York:
Basic Books.Bendick, Marc Jr. 1992. Discrimination against Latino Job Applicants: A Controlled
Experiment. Washington, DC: Fair Employment Council of Greater Wash-ington.
Bennett, Claudette N., Nampeo McKenney, and Roderick Harrison. 1995.“Racial Classification Issues Concerning Children in Mixed Race House-holds.” Paper presented at the annual meeting of the Population Associa-tion of America, San Francisco.
Bernal, Martin. 1987. Black Athena: The Afro-Asiatic Roots of Classical Civilization.New Brunswick, NJ: Rutgers University Press.
Berry, Brewton. 1963. Almost White. New York: Macmillan.Bhopal, Raj S., and Liam J. Donaldson. 1999. “Bhopal and Donaldson Respond
to Krieger.” American Journal of Public Health 89 (5): 784.Bieder, Robert E. 1986. Science Encounters the Indian, 1820–1880: The Early Years
of American Ethnology. Norman: University of Oklahoma Press.Bilger, Burkhard. 1997. “The Last Black Classicist.” The Sciences 37 (2): 16–19.Blaustein, Albert P., and Robert L. Zangrando. 1968. Civil Rights and the Ameri-
can Negro. New York: Washington Square Press.
230 REFERENCES

Blockson, Charles L., and Ron Fry. 1977. Black Genealogy. Baltimore: Black Clas-sic Press.
Boisjoly, Johanne, and Greg J. Duncan. 1994. “Job Losses among Hispanics inthe Recent Recession.” Monthly Labor Review, June, pp. 16–23.
Bracken, Karen, and Guillermo de Bango. 1992. “Hispanics in a Racially andEthnically Mixed Neighborhood in the Greater Metropolitan New OrleansArea.” Ethnographic Evaluation of the 1990 Decennial Census Report 16. Pre-pared under Joint Statistical Agreement 89-45 with Hispanidad ’87, Inc.Washington, DC: U.S. Bureau of the Census.
Brady, Vivian. 1988. “Black Hispanics: The Ties That Bind.” Centro boletin 2 (3)(Spring): 44–47.
Brodkin Sacks, Karen. 1994. “How Did Jews Become White Folks?” In Race, ed.Steven Gregory and Roger Sanjek. New Brunswick, NJ: Rutgers UniversityPress.
Brookshaw, David. 1986. Race and Color in Brazilian Literature. Metuchen, NJ:Scarecrow Press (first published in Portuguese in 1983).
Buehler, James W., Donna F. Stroup, Douglas N. Klaucke, and Ruth L. Berkel-man. 1989. “The Reporting of Race and Ethnicity in the National NotifiableDiseases Surveillance System.” Public Health Reports 104 (September/Octo-ber): 457–465.
Bunte, Pamela, and Rebecca Joseph. 1992. “The Cambodian Community ofLong Beach: An Ethnographic Analysis of Factors Leading to Census Un-dercount.” Ethnographic Evaluation of the 1990 Decennial Census Report 9.Prepared under Joint Statistical Agreement 89-31, with Community Ser-vice Council of Broward County, Inc. Washington, DC: U.S. Bureau of theCensus.
Burkett, Elinor C. 1978. “Indian Women and White Society: The Case of Six-teenth-Century Peru.“ In Latin American Women: Historical Perspectives, ed.Asuncion Lavrin. Westport, CT: Greenwood Press.
Cabranes, José A. 1979. Citizenship and the American Empire: Notes on the Legisla-tive History of the United States. New Haven, CT: Yale University Press.
Carlberg, Nancy Ellen. 1992. Beginning Census Research. Anaheim, CA: CarlbergPress.
Carroll, Patrick J. 1991. Blacks in Colonial Veracruz: Race, Ethnicity and RegionalDevelopment. Austin: University of Texas Press.
Cauce, Ana Mari, Yumi Hiraga, Craig Mason, Tanya Aguilar, Nydia Ordonez,and Nancy Gonzales. 1992. “Between a Rock and a Hard Place: Social Ad-justment of Biracial Youth.” In Racially Mixed People in America, ed. Maria P.P. Root. Newbury Park, CA: Sage.
Census for 1820. 1821. Washington, DC: Gales and Seaton (microfilm).Chapa, Jorge, and Craig Wacker. 2000. “Latino Unemployment: Current Issues
and Future Concerns.” In Strengthening Employment Opportunities for Latino
REFERENCES 231

Workers: Ideas for Policy and Practice, Report on the State of Hispanic America1999, ed. Sonia M. Pérez. Washington, DC: National Council of La Raza.
Chevan, Albert. 1990. “Hispanic Racial Identity: Beyond Social Class.” Paperpresented at the American Sociological Association, Washington, DC, Au-gust 14.
Choldin, Harvey. 1986. “Statistics and Politics: The ‘Hispanic Issue’ in the 1980Census.” Demography 23 (3): 403–417.
Clemence, Ted. 1981. “‘Indians Not Taxed’ and the Census ApportionmentBase.” U.S. Bureau of the Census. Unpublished manuscript. (This paperdoes not represent the views of the census.)
Colon, Jesus. 1982. A Puerto Rican in New York and Other Sketches. New York: In-ternational Publishers.
Comas-Díaz, Lillian. 1996. “LatiNegra: Mental Health Issues.” In The MultiracialExperience: Racial Borders As the New Frontier, ed. Maria P. P. Root. NewburyPark, CA: Sage.
Cornish, John. 1992. “Australia’s Experience with Census Questions on Ethnic-ity.” In Challenges of Measuring an Ethnic World: Science, Politics and Reality,ed. Statistics Canada and U.S. Bureau of the Census. Proceedings of the JointCanada–United States Conference on the Measurement of Ethnicity, Ottawa,Canada. Washington, DC: U.S. Government Printing Office.
Cose, Ellis. 1995. “One Drop of Bloody History.” Newsweek, February 13, pp.70–72.
Cotter, Holland. 1996. “Faces from a Fictional Melting Pot.” New York Times, Oc-tober 4, p. C1.
Cox, Oliver C. 1948. Caste, Class, and Race: A Study in Racial Dynamics. New York:Monthly Review Press.
Cross, Harry, with Genevieve Kenney, Jane Mell, and Wendy Zimmermann.1990. “Employer Hiring Practices: Differential Treatment of Hispanic andAnglo Job Seekers.” Washington, DC: Urban Institute Report 90-4.
Daniel, Reginald. 1992. “Passers and Pluralists: Subverting the Racial Divide.”In Racially Mixed People in America, ed. Maria P. P. Root. Newbury Park, CA:Sage.
Darity, William A. Jr., and Patrick L. Mason. 1998. “Evidence on Discriminationin Employment: Codes of Color, Codes of Gender.” Journal of Economic Per-spectives 12 (2) (Spring): 63–90.
Davis, Diana K., Johnny Blair, Howard Fleischman, and Margaret S. Boone.1998a. Cognitive Interviews on the Race and Hispanic Origin Questions on theCensus 2000 Dress Rehearsal Form. Report prepared by Development Asso-ciates, Inc., Arlington, VA, under contract from the U.S. Census Bureau,Population Division, May 29.
Davis, Diana K., Johnny Blair, Nancy Goudreau, Margaret S. Boone, Loretta R.Johnston, and Eliodoro Robles. 1998b. Research on Race and Hispanic Origin
232 REFERENCES
for Census 2000. Report prepared by Development Associates, Inc., Arling-ton, VA, under contract from the U.S. Census Bureau, Population Division,December.
Davis, James F. 1992. Who Is Black? One Nation’s Definition. University Park:Pennsylvania State University Press.
Davis, Kingsley. 1941. “Intermarriage in Caste Societies.” American Anthropolo-gist 43: 388–395.
Day, Jennifer Cheeseman. 1996. Population Projections of the United States by Age,Sex, Race, and Hispanic Origin: 1995 to 2050. U.S. Bureau of the Census, Cur-rent Population Reports, P25-1130. Washington, DC: U.S. GovernmentPrinting Office.
De Bow, J. D. B. 1854a. (Superintendent of the United States Census) StatisticalView of the United States Embracing Its Territory, Population—White, Free, Col-ored, and Slave—Moral and Social Condition, Industry, Property, and Revenue;the Detailed Statistics of Cities, Towns and Counties. Washington, DC: A. O. P.Nicholson, Public Printer.
———. 1854b. (Superintendent of the United States Census) Statistical View ofthe United States Embracing Its Territory, Population—White, Free, Colored, andSlave—Moral and Social Condition, Industry, Property, and Revenue; the De-tailed Statistics of Cities, Towns and Counties. Washington, DC: BeverleyTucker, Senate Printer.
De Freitas, Gregory. 1991. Inequality at Work: Hispanics in the U.S. Labor Force.New York: Oxford University Press.
Degler, Carl N. 1959. Out of Our Past: The Forces That Shaped Modern America.New York: Harper & Row.
———. 1986. Neither Black nor White: Slavery and Race Relations in Brazil and theUnited States. Madison: University of Wisconsin Press.
De La Fuente, Alejandro. 1998. “Race, National Discourse, and Politics in Cuba:An Overview.” Latin American Perspectives 25 (3) (May): 43–69. Issue 100 en-titled “Race and National Identity in the Americas” and edited by HelenSafa.
de la Garza, R. O., L. DeSipio, C. F. Garcia, J. Garcia, and A. Falcon. 1992. LatinoVoices: Mexican, Puerto Rican and Cuban Perspectives on American Politics.Boulder, CO: Westview Press.
de la Puente, Manuel. 1991. “In Search of the Causes of the Differential CensusUndercount of Racial and Ethnic Minorities: Overview of EthnographicStudies of Census Undercount.” Paper presented at the eighty-sixth annualmeeting of the American Sociological Association, Cincinnati.
———. 1993. “Why Are People Missed or Erroneously Included by the Census:A Summary of Findings from Ethnographic Coverage Reports.” Paper pre-sented at the U.S. Bureau of the Census’s 1993 research conference on un-dercounted ethnic populations, May 5–7, Richmond, VA.
REFERENCES 233
de la Puente, Manuel, Nampeo McKenney, Roderick Harrison, and ClaudetteBennett. 1997. “Results of the 1996 Race and Ethnic Targeted Test(RAETT).” U.S. Bureau of the Census, Population Division and DecennialStatistics Division, Working Paper no. 18, May. Washington, DC: U.S. Gov-ernment Printing Office.
Delgado, Richard, and Jean Stefancic. 1997. Critical White Studies: Looking behindthe Mirror. Philadelphia: Temple University Press.
del Pinal, Jorge. 1993. “Research on Race and Ethnicity, Cognitive Interviews:Phase I.” Project 6120. U.S. Census Bureau, Center for Survey Methods,July 8.
———. 1994. “Social Science Principles: Forming Race-Ethnic Categories forPolicy Analysis.” Paper presented at the Workshop on Race and EthnicityClassification: An Assessment of the Federal Standard for Race and Eth-nicity Classification, National Research Council, Commission on Behav-ioral and Social Sciences and Education, Committee on National Statistics,February 18.
———. 1999. “Some Findings from the 2000 Census Dress Rehearsal, Race andEthnicity Data.” Paper presented at the Race and Ethnic Advisory Com-mittee Meeting, U.S. Bureau of the Census. Reston, VA, July 16.
del Pinal, Jorge, and Jesus M. Garcia. 1993. “Hispanic Americans Today.” U.S.Bureau of the Census. Current Population Reports, P23–183. Washington,D.C.: U.S. Government Printing Office.
del Pinal, Jorge, and Audrey Singer. 1997. “Generations of Diversity: Latinos inthe United States,” Population Bulletin 52 (3).
del Valle, Manuel. 1993. “National Origin and Alienage Discrimination.” In Em-ployment Discrimination: Law and Litigation, ed. Merrick T. Rossein. Deer-field, IL: Clark Boardman Callaghan.
Denton, N. A., and D. S. Massey. 1989. “Racial Identity among Caribbean His-panics: The Effect of Double Minority Status on Residential Segregation.”American Sociological Review 54: 790–808.
Diamond, Jared. 1994. “Race without Color.” Discover, November, pp. 83–89.———. 1997. “Continental Divides.” The Sciences 37 (2) (March/April):
32–37.Díaz-Cotto, Juanita. 1996. Gender, Ethnicity, and the State: Latino and Latina Prison
Politics. Albany: State University of New York Press.Discover. 1994. special issue, “The Science of Race.” November.Domínguez, Virginia R. 1986. White by Definition: Social Classification in Creole
Louisiana. New Brunswick, NJ: Rutgers University Press.Dred Scott v. John F. A. Sandford. 60 U.S. 393, 13. 1856. Supreme Court of the
United States, December 1856.Drury, T. F., C. S. Moy, and G. S. Poe. 1980. “Going beyond Interviewer Obser-
vations of Race in the National Health Survey.” Classification Issues in Mea-
234 REFERENCES
suring the Health Status of Minorities. Hyattsville, MD: U.S. Public HealthService.
Duany, Jorge. 1985. “Ethnicity in the Spanish Caribbean: Notes on the Consoli-dation of Creole Identity in Cuba and Puerto Rico, 1762–1868.” EthnicGroups 6: 99–123.
———. 1998a. “Blurred Frontiers: The Socioeconomic Impacts of TransnationalMigration on the Hispanic Caribbean and the United States.” Paper pre-pared for the conference One Hundred Years of Transformation: TheCaribbean and the United States, 1898–1898, Lehman College, City Uni-versity of New York, Bronx, October 13–15.
———. 1998b. “Reconstructing Racial Identity: Ethnicity, Color and Classamong Dominicans in the United States and Puerto Rico.” Latin AmericanPerspectives 25 (3) (May): 147–172.
———. 2000. “Nation on the Move: The Construction of Cultural Identities inPuerto Rico and the Diaspora.” American Ethnologist 27 (1).
Du Bois, W. E. B. 1962. Black Reconstruction in America, 1860–1880. Cleveland:World Publishing.
———. 1972. John Brown. New York: International Publishers.Duke, Lynn. 1998. “South Africa’s Race Charade Ends.” Washington Post, July
26, p. A01.Dunn, L. C., and Theodosius Dobzhansky. 1952. Heredity, Race and Society. New
York: New American Library of World Literature.Dzidzienyo, Anani. 1993. “Brazilian Race Relations Studies: Old Problems, New
Ideas?” Humboldt Journal of Social Relations 19 (2): 109–129.Edley, Christopher F. 1996. Not All Black and White: Affirmative Action, Race and
American Values. New York: Hill & Wang.Edmonston, Barry, Joshua Goldstein, and Juanita Tamayo Lott. 1996. “Spotlight
on Heterogeneity: The Federal Standards for Racial and Ethnic Classifica-tion.” Committee National Statistics, National Research Council. Washing-ton, DC: National Academy Press.
Edmonston, Barry, S. M. Lee, and J. S. Passel. 1994. “U.S. Population Projectionsfor National Origin Groups: Taking Race and Ethnic Ancestry into Ac-count.” Proceedings of the American Statistical Association, Social Statistics Sec-tion. Washington, DC: American Statistical Association.
Ekin, Larry, and Leila Gorchev, eds., 1992. Report on Anti-Arab Hate Crimes: Po-litical and Hate Violence against Arab Americans. Washington, DC: AmericanArab Anti-Discrimination Committee.
Elias-Olivares, Lucia, and Marcia Farr. 1991. “Sociolinguistic Analysis of Mexi-can-American Patterns of Non-Response to Census Questionnaires.”Ethnographic Exploratory Research, Report 16, Final Report for Joint Statisti-cal Agreement 88-25, sponsored by the Center for Survey Methods Re-search, U.S. Bureau of the Census.
REFERENCES 235
Eschbach, Karl, and Christina Gómez. 1998. “Choosing Hispanic Identity: Eth-nic Identity Switching among Respondents in High School and Beyond.”Social Science Quarterly 79 (1): 74–90.
Escobar, Gabriel. 1999. “Dominicans Face Assimilation in Black and White.”Washington Post, May 14, p. A03.
Estrada, Leobardo F. 1993. “The Politics of the Census: A Reflection of theDilemmas in U.S. Society.” In Challenges of Measuring an Ethnic World: Sci-ence, Politics and Reality, ed. Statistics Canada and U.S. Bureau of the Cen-sus. Washington, DC: U.S. Government Printing Office.
———. 1994. “Selected Federal Agency Experience.” Comments at the Work-shop on Race and Ethnicity Classification: An Assessment of the FederalStandard for Race and Ethnicity Classification, Committee on National Sta-tistics, National Research Council, Washington, DC, February 17–18.
Falcon, Angelo. 1995. “Puerto Ricans and the Politics of Racial Identity.” InRacial and Ethnic Identity: Psychological Development and Creative Expression,ed. Ezra Griffith, Howard Blue, and Herbert Harris. New York: Routledge& Kegan Paul.
Fein, David J. 1990. “Racial and Ethnic Differences in U.S. Census OmissionRates.” Demography 27 (2) (May):185–302.
Feinlieb, Manning. 1994. Statement of Manning Feinlieb, the Director of the NationalCenter for Education Statistics: Hearings before the Subcommittee on Census, Sta-tistics and Postal Personnel of the Committee on Post Office and Civil Service,House of Representatives, 103 Cong., 1st sess., April 14, 1993, ser. no. 103-7, pp. 70–83.
Fernandes, Florestan. 1969. The Negro in Brazilian Society. New York: ColumbiaUniversity Press.
———. 1979. “The Negro in Brazilian Society: Twenty-Five Years Later.” InBrazil Anthropological Perspectives: Essays in Honor of Charles Wagley, ed.Maxine L. Margolis and William E Carter. New York: Columbia UniversityPress.
Fernández, Carlos. 1992. “La Raza and the Melting Pot: A Comparative Look atMultiethnicity.” In Racially Mixed People in America, ed. Maria P. P. Root.Newbury Park, CA: Sage.
Ferrante, Joan, and Prince Brown Jr. 1998. The Social Construction of Race and Eth-nicity in the United States. New York: Longman.
Field, Lynda D. 1996. “Piecing Together the Puzzle: Self-Concept and GroupIdentity In Biracial Black/White Youth.” In The Multiracial Experience:Racial Borders As the New Frontier,” ed. Maria P. P. Root. Newbury Park, CA:Sage.
Fienberg, Stephen E. 1994. Comments on “Social Science and Statistics Perspec-tives” at the Workshop on Race and Ethnicity Classification: An Assess-ment of the Federal Standard for Race and Ethnicity Classification, Com-
236 REFERENCES

mittee on National Statistics, National Research Council, Washington, DC,February 17–18.
Fishel, Leslie H., and Benjamin Quarles. 1970. The Black American: A Documen-tary History. Glenview, IL: Scott Foresman.
Fix, Michael, George Galsten, and Raymond Stryk, eds. 1993. Clear and Con-vincing Evidence: Measurement of Discrimination in America. Washington, DC:Urban Institute.
Flores, William V., and Rina Benmayor. 1997. Latino Cultural Citizenship: Claim-ing Identity, Space and Rights. Boston: Beacon Press.
Foner, Nancy. 1998. “West Indian Identity in the Diaspora: Comparative andHistorical Perspectives.” Latin American Perspectives 25 (3) (May): 173–188.
Foner, Philip S. 1964. Frederick Douglass: A Biography. New York: Citadel Press.Fontaine, Pierre Michel, ed. 1985. Race, Class and Power in Brazil. Los Angeles:
University of California at Los Angeles Center for Afro-American Studies.Forbes, Jack D. 1988. Black Africans and Native Americans. New York: Basil
Blackwell.———. 1990. “The Manipulation of Race, Caste and Identity: Classifying
Afroamericans, Native Americans and Red-Black People.” Journal of EthnicStudies 17 (4): 1–51.
Fox, Geoffrey. 1996. Hispanic Nation: Culture, Politics and the Constructing of Iden-tity. Tucson: University of Arizona Press.
Frankenberg, Ruth. 1993. The Social Construction of Whiteness: White Women RaceMatters. Minneapolis: University of Minnesota Press.
Franklin, John Hope. 1967. From Slavery to Freedom: A History of Negro Americans.3d ed. New York: Knopf.
Frazier, E. Franklin. 1942. “Some Aspects of Race Relations in Brazil.” Phylon, 3dqtr., pp. 287–295.
———. 1962. Black Bourgeoisie: The Rise of a New Middle Class in the United States.New York: Collier Books.
Freedman, Bernard J. 1984. “Caucasian.” British Medical Journal 288 (March):696–698.
Fullilove, M. T. 1998. “Abandoning “Race” As a Variable in Public Health Re-search—An Idea Whose Time Has Come.” American Journal of Public Health88: 1297–1298.
Galenson, David W. 1981. White Servitude in Colonial America: An EconomicAnalysis. Cambridge: Cambridge University Press.
Gallagher, Charles A. 1999. Rethinking the Color Line: Readings in Race and Eth-nicity. Mountain View, CA: Mayfield.
García, María Cristina. 1996. Havana USA: Cuban Exiles and Cuban Americans inSouth Florida, 1959–1995. Berkeley and Los Angeles: University of Califor-nia Press.
García Saiz, María Concepción. 1996. “The Artistic Development of Casta
REFERENCES 237

Painting.” In New World Orders: Casta Painting and Colonial Latin America,ed. Ilona Katzew, curator. New York: Americas Society.
Gilbertson, Greta, Joseph P. Fitzpatrick, and Lijun Yang. 1996. “Hispanic Inter-marriage in New York City: New Evidence from 1991.” International Mi-gration Review 30: 445–459.
Gimenez, Martha. 1989. “Latino/‘Hispanic’—Who Needs a Name? The Caseagainst a Standardized Terminology.” International Journal of Health Services19 (3): 557–571.
Ginorio, Angela. 1979. “A Comparison of Puerto Ricans in New York withNative Puerto Ricans and Native Americans on Two Measures of Accul-turation: Gender Role and Racial Identification.” Ph.D. diss., FordhamUniversity.
Ginorio, Angela, and Paul C. Berry. 1972. “Measuring Puerto Ricans’ Percep-tions of Racial Characteristics.” Summary. Proceedings of the 80th AnnualConvention of the American Psychological Association 7:287–288.
Goldstein, Joshua R., and Ann J. Morning. 1999. “The Multiple Race Populationof the United States: Issues and Estimates.” Paper presented at the NationalConference on Health Statistics. Washington, DC: National Center forHealth Statistics, August 2–4.
Gómez, Christina. n.d. “The Continual Significance of Skin Color: An Ex-ploratory Study of Latinos in the Northeast.” Hispanic Journal of BehavioralSciences, currently under review.
Gossett, Thomas. 1963. Race: The History of an Idea in America. New York:Schocken Books.
Gould, Stephen Jay. 1978. “Morton’s Ranking by Cranial Capacity.” Science 200:503–509.
———. 1981. The Mismeasure of Man. New York: Norton.———. 1994. “The Geometer of Race.” Discover, November, pp. 65–69.Graham, Richard. 1990. Introduction to The Idea of Race in Latin America,
1870–1940, ed. Richard Graham. Austin: University of Texas Press.Graham, Susan. 1994. “Challenges and Emerging Issues: Multi-racial People.”
Paper presented at the Workshop on Race and Ethnicity Classification: AnAssessment of the Federal Standard for Race and Ethnicity Classification,Committee on National Statistics, National Research Council, Washington,DC, February 17–18.
Grant, Glen, and Dennis M. Ogawa. 1993. “Living Proof: Is Hawaii the An-swer?” Annals of the American Academy of Political and Social Science 530 (No-vember): 137–154.
Greene, Evarts B., and Virginia D. Harrington. 1966. American Population beforethe Federal Census of 1790. Gloucester, MA: Peter Smith.
Gregory, Steven, and Roger Sanjek, eds. 1994. Race. New Brunswick, NJ: Rut-gers University Press.
238 REFERENCES
Grenier, Guillermo, and Peter Cattan. 2000. “Latino Immigrants in the LaborForce.” In Strengthening Employment Opportunities for Latino Workers: Ideasfor Policy and Practice, Report on the State of Hispanic America 1999, ed. SoniaM. Pérez. Washington, DC: National Council of La Raza.
Grieve, Victoria Marie. 1996. “Any Perceptible Trace: Representations of theMulatto in the United States Census, 1850–1920.” Master’s thesis, Univer-sity of Georgia.
Gutiérrez, Ramon A. 1991. When Jesus Came, the Corn Mothers Went Away: Mar-riage, Sexuality, and Power in New Mexico, 1500–1846. Stanford, CA: StanfordUniversity Press.
Gutin, Jo Ann C. 1994. “End of the Rainbow.” Discover, November, pp. 71–75.Hahn, Robert A. 1992. “The State of Federal Health Statistics.” Journal of the
American Medical Association. 267 (2) (January): 268–271.———. 1994. “The Coding of Race and Ethnicity in Federal Health Statistics:
Problems and Prospects.” Paper presented at the Workshop on Race andEthnicity Classification, Committee on National Statistics, National Acad-emy of Sciences, Washington, DC, February 17–18.
Hahn, Robert A., James M. Mendlein, and Steven D. Helgerson. 1993. “Differ-ential Classification of American Indian Race on Birth and Death Certifi-cates, U.S. Reservation States, 1983–1985.” The Provider, January, pp.8–11.
Hahn, Robert A., B. I. Truman, and N. D. Barker. 1996. “Identifying Ancestry:The Reliability of Ancestral Identification in the United States by Self,Proxy, Interviewer, and Funeral Director.” Epidemiology 7: 75–80.
Halter, Marilyn. 1993. Between Race and Ethnicity: Cape Verdean American Immi-grants, 1860–1965. Urbana-Champaign: University of Illinois Press.
Hanchard, Michael George. 1994. Orpheus and Power: The Movimento Negro of Riode Janeiro and Sao Paulo, Brazil, 1945–1988. Princeton, NJ: Princeton Univer-sity Press.
———. 1999. “The Color of Suberversion: Racial Politics and Immigration Pol-icy in the United States.” EpiCenter: The Newsletter of the International Centerfor Migration, Ethnicity and Citizenship 4, no. 1 (Winter):1, 6–7.
Haney López, Ian. 1996. White by Law: The Legal Construction of Race. New York:New York University Press.
Hannaford, Ivan. 1996. Race: The History of an Idea in the West. Baltimore: JohnsHopkins University Press, and Washington, DC: Woodrow Wilson CenterPress.
Hansen, Chris. 1995. “Race/Ethnicity and Data Collection.” Poverty and Race 4(2) (March/April): 17–18.
Harris, Joseph E. 1972. Africans and Their History. New York: New American Li-brary.
———, ed. 1977. Africa and Africans As Seen by Classical Writers (The William Leo
REFERENCES 239
Hansberry African History Notebook). Vol. 2. Washington, DC: Howard Uni-versity Press.
Harris, Marvin, Consorte Gomes, Lang Josildeth, and Byrne Brian Joseph. 1993.“Who Are the Whites? Imposed Census Categories and the Racial Demog-raphy of Brazil.” Social Forces 72 (2): 451–462.
Hartman, Chester, ed. 1994. “Race/Ethnic Categories: Do They Matter? A Sym-posium.” Poverty and Race, part 1, vol. 3, no. 6 (November/December).
———, ed. 1995. “Race/Ethnic Categories—A Symposium.” Poverty and Race,part 2, vol. 4, no. 7 (January/February).
Hayes-Bautista, D. E., and J. Chapa. 1987. “Latino Terminology: ConceptualBasis for Standardized Terminology.” American Journal of Public Health 77:61–68.
Heads of Families at the First Census of the United States Taken in the Year 1790: NewYork. 1992. Baltimore: Genealogical Publishing (originally published by theU.S. Government Printing Office, 1908).
Heer, David M. 1966. “Negro-White Marriage in the United States.” Journal ofMarriage and the Family 28: 262–273.
Helg, Aline. 1990. “Race in Argentina and Cuba, 1880–1930: Theory, Policies,and Popular Reaction.” In The Idea of Race in Latin America, 1870–1940, ed.Richard Graham. Austin: University of Texas Press.
Hellwig, David J., ed. 1992. African-American Reflections on Brazil’s Racial Par-adise. Philadelphia: Temple University Press.
Henry, William A. III. 1990. “The Browning of America” and “Beyond the Melt-ing Pot.” Time, April 9, pp. 28–31.
Hernández, José 1997. Conquered Peoples in America. Dubuque, IA: Kendall/Hunt.
Herrnstein, Richard J., and Charles Murray. 1994. The Bell Curve: Intelligence andClass Structure in American Life. New York: Free Press.
Hevesi, Dennis. 1998. “Black and Hispanic Immigrants Lag in Housing Study.”New York Times, May 4, p. 1.
Higginbotham, Leon A. Jr. 1978. In the Matter of Color: Race and the American LegalProcess, the Colonial Period. New York: Oxford University Press.
Hodes, Martha. 1997. White Women, Black Men: Illicit Sex in the Nineteenth-Cen-tury South. New Haven, CT: Yale University Press.
Hoetink, H. 1985. “‘Race’ and Color in the Caribbean.” Washington, DC: Smith-sonian Institution, Woodrow Wilson International Center for Scholars,Latin American Studies Program.
Hogan, Howard. 1993. “The 1990 Post-Enumeration Survey: Operations andResults.” Journal of the American Statistical Association 88 (423) (September):1047–1060.
Holmes, Steven A. 1999. “The Big Census Issue: Using Sampling in Redistrict-ing.” New York Times, nat’l sec., February 14, p. 24.
240 REFERENCES

Holzer, Harry. 1997. What Employers Want: Job Prospects for Less-Educated Work-ers. New York: Russell Sage Foundation.
Horsman, Reginald. 1981. Race and Manifest Destiny: The Origins of AmericanRacial Anglo-Saxonism. Cambridge, MA: Harvard University Press.
Hossfeld, Karen J. 1994. “Hiring Immigrant Women: Silicon Valley’s ‘Simple’Formula.” In Women of Color in U.S. Society, ed. Maxine Baca Zinn and Bon-nie Thornton Dill. Philadelphia: Temple University Press.
Hughes, Michael, and Bradley R. Hertel. 1990. “The Significance of Color Re-mains: A Study of Life Chances, Mate Selection, and Ethnic Consciousnessamong Black Americans.” Social Forces 68 (4): 1105–1120.
Hurtado, Aída. 1997. “Understanding Multiple Group Identities: InsertingWomen into Cultural Transformations.” Society for the Psychological Study ofSocial Issues 53 (2): 299–328.
Iglesias, Cesar Andreu. 1980. Memorias de Bernardo Vega: Una contribución a lahistoria de la comunidad puertorriqueña en Nueva York. Rio Piedras: Edi-ciones huracán.
Ignatiev, Noel. 1995. How the Irish Became White. New York: Routledge & KeganPaul.
Isajiw, Wsevolod W. 1993. “Definition and Dimensions of Ethnicity: A Theoret-ical Framework.” In Challenges of Measuring an Ethnic World: Science, Politicsand Reality, Proceedings of the Joint Canada–United States Conference on theMeasurement of Ethnicity, April 1–3, 1992, Ottawa. Washington, DC: U.S.Government Printing Office.
Jackson, Ronald Vern, and Gary Ronald Teeples. 1976. New York 1810 CensusIndex. Bountiful, UT: Accelerated Indexing Systems.
Jacobs, James H. 1992. “Identity Development in Biracial Children.” InRacially Mixed People in America, ed. Maria P. P. Root. Newbury Park, CA:Sage.
Jacobson, Mathew. 1998. Becoming Caucasian: Whiteness and the Alchemy of theAmerican Melting Pot. Cambridge, MA: Harvard University Press.
Jaimes, Annette M. 1994. “American Racism: The Impact on American-IndianIdentity and Survival.” In Race, ed. Steven Gregory and Roger Sanjek. NewBrunswick, NJ: Rutgers University Press.
Jalloh, Alusine, and Stephen E. Maizlish, eds. 1996. The African Diaspora. CollegeStation: Texas A&M University Press.
James, Franklin, Betty L. McComings, and Eileen Tynan. 1984. Minorities in theSunbelt. Rutgers, NJ: Center for Urban Policy Research.
Jensen, Joan. 1988. Passage from India. New Haven, CT: Yale University Press.Johansen, Bruce E. 1982. Forgotten Founders: Benjamin Franklin, the Iroquois, and
the Rationale for the American Revolution. Ipswich, MA.: Gambit.Johnson, Deborah J. 1992. “Developmental Pathways: Toward an Ecological
Theoretical Formulation of Race Identity in Black-White Biracial Chil-
REFERENCES 241
dren.” In Racially Mixed People in America, ed. Maria P. P. Root. NewburyPark, CA: Sage.
Johnson, Ronald C. 1992. “Offspring of Cross-Race and Cross-Ethnic Marriagesin Hawaii.” In Racially Mixed People in America, ed. Maria P. P. Root. New-bury Park, CA: Sage.
Johnson, Timothy, Jared B. Jobe, Diane O’Rourke, Seymour Sudman, Richard B.Warnecke, Noel Chavez, G. Chapa-Resendez, and Patricia Golden. 1997.“Dimensions of Self Identification among Multiracial and Multiethnic Re-spondents in Survey Interviews.” Evaluation Review 21: 671–687.
Jones, Lisa. 1994. bulletproof diva: Tales of Race, Sex and Hair. New York: Double-day.
Jordan, Winthrop. 1968. White over Black: American Attitudes toward the Negro,1550–1812. Baltimore: Penguin Books.
Kalmijn, Matthijs. 1993. “Trends in Black/White Intermarriage.” Social Forces 72(1) (September): 119–146.
Katz, William Loren. 1986. Black Indians: A Hidden Heritage. New York:Atheneum.
Katzen, Sally. 1994. “Statement of Sally Katzen, Administrator, Office of Infor-mation and Regulatory Affairs, Office of Management and Budget,” at theHearings before the Subcommittee on Census, Statistics, and Postal Per-sonnel of the Committee on Post Office and Civil Serivce, House of Repre-sentatives, 103 Congress, 1st session, July 29, 1993, Serial No. 103–7, pp.213–220.
Katzew, Ilona. 1996. “Casta Painting: Identity and Social Stratification in Colo-nial Mexico.” In New World Orders: Casta Painting and Colonial Latin Amer-ica. New York: Americas Society.
Katzman, M. 1968. “Discrimination, Subculture, and the Economic Perfor-mance of Negroes, Puerto Ricans and Mexican-Americans.” American Jour-nal of Economics and Society 27 (4): 371–375.
Keith, Verna M., and Cedric Hering. 1991. “Skin Tone and Stratification in theBlack Community.” American Journal of Sociology 97 (3) (November):760–78.
Kennedy, Joseph C. G. 1862. Preliminary Report on the Eighth Census: 1860. Wash-ington, DC: U.S. Government Printing Office.
Kettner, James H. 1978. The Development of American Citizenship, 1608–1870.Chapel Hill: University of North Carolina Press.
Kim, Claire Jean. 1999. “The Racial Triangulation of Asian Americans.” Politicsand Society 27 (1) (March): 105–138.
Kissam, Edward, Enrique Herrera, and Jorge M. Nakamoto. 1993. “HispanicResponse to Census Enumeration Forms and Procedures.” Task order no.46-YABC-2-0001, contract no. 50-YABC-2-66027, submitted by Aguirre In-
242 REFERENCES
ternational, 411 Borel Ave, Suite 402, San Mateo, CA 94402, to U.S. Bureauof the Census, Center for Survey Methods Research, March.
Klor de Alva, Jorge J. 1996. “Mestizaje from New Spain to Aztlán: On the Con-trol and Classification of Collective Identities.” In New World Orders: CastaPainting and Colonial Latin America, Ilona Katzew, curator. New York: Amer-icas Society Art Gallery.
Knight, Alan. 1990. “Racism, Revolution and Indigenismo: Mexico, 1910–1940.”In The Idea of Race in Latin America, 1870–1940, ed. Richard Graham. Austin:University of Texas Press.
Kobayashi, Audrey. 1993. “Representing Ethnicity: Political Statistexts.” InChallenges of Measuring an Ethnic World: Science, Politics and Reality, ed. Sta-tistics Canada and U.S. Bureau of the Census. Washington, DC: U.S. Gov-ernment Printing Office.
Kossoudji, S. 1988. “English Language Ability and Labor Market Opportunitiesof Hispanic and East Asian Immigrant Men.” Journal of Labor Economics 6(2): 205–208.
Krieger, Nancy, Steven Sidney, and Eugenie Coakley. 1998. “Racial Discrimina-tion and Skin Color in the CARDIA Study: Implications for Public HealthResearch.” American Journal of Public Health 88 (9) (September): 1308–1313.
Krieger, Nancy, David Williams, and Sally Zierler. 1999. “‘Whiting Out’ WhitePrivilege Will Not Advance the Study of How Racism Harms Health” andRelated Letters to the Editor by James W. Buehler, Richard Rabin, MindyThompson Fullilove, Raj S. Bhopal, and Liam J. Donaldson. American Jour-nal of Public Health 89 (5): 782–785.
Labov, Teresa, and Jerry A. Jacobs. 1986. “Intermarriage in Hawaii, 1950–83.”Journal of Marriage and the Family 48 (February): 79–88.
Larmer, Brook. 1999. “Latino America.” Newsweek, July 19, pp. 48–51.Lee, Sharon M. 1993. “Racial Classifications in the U.S. Census: 1890–1990.” Eth-
nic and Racial Studies 16 (1) (January):75–94.Lee, Sharon M., and Keiko Yamanaka. 1990. “Patterns of Asian Intermarriage
and Marital Assimilation.” Journal of Comparative Family Studies 21(2):287–305.
Leets, Laura, Richard Clement, and Howard Giles. 1996. “Explicating Ethnicityin Theory and Communication Research.” Multilingua. 15 (2): 115–147.
Lemonick, Michael D., and Andrea Dorfman. 1999. “Up from the Apes: Re-markable New Evidence Is Filling in the Story of How We BecameHuman.” Time, August 22.
Leonard, Karn Isaksen. 1992. Making Ethnic Choices: California’s Punjabi MexicanAmericans. Philadelphia: Temple University Press.
Lindan, C. P., N. Hearst, J. A. Singleton, A. I. Trachtenberg, N. M. Riordan, D. A.Tokagawa, and G. S. Chu. 1990. “Underreporting of Minority AIDS Deaths
REFERENCES 243
in San Francisco Bay Area, 1985–1986.” Public Health Reports 104:(4):400–404.
Loewen, James W. 1971. The Mississippi Chinese: Between Black and White. Cam-bridge, MA: Harvard University Press.
Logan Alexander, Adele. 1991. Ambiguous Lives: Free Women of Color in RuralGeorgia, 1789–1879. Fayetteville: University of Arkansas Press.
Lopez, David, and Yen Espiritu. 1993. “Pan Ethnicity in the United States: ATheoretical Framework.” Ethnic and Racial Studies 13 (2): 198–224.
Lowry, Ira. S. 1982. “The Science and Politics of Ethnic Enumeration.” In Eth-nicity and Public Policy, vol. 1, Ethnicity and Public Policy Series, ed. Win-ston Van Horne and Thomas V. Tonnesen. Milwaukee: University of Wis-consin Press.
Lugones, María. 1994. “Purity, Impurity, and Separation.” Signs 19 (2) (Winter):458–479.
Lurie Oestrich, Nancy. 1974. “Historical Background.” In The American IndianToday. Deland, FL: Everett Edwards.
MacLachlan, Colin M., and Jaime E. Rodríguez. 1980. The Forging of the CosmicRace: A Reinterpretation of Colonial Mexico. Berkeley and Los Angeles: Uni-versity of California Press.
MacLeod, Murdo. 1973. Spanish Central America: A Socioeconomic History,1520–1720. Berkeley and Los Angeles: University of California Press.
Margolis, Maxine L., and William E. Carter, eds. 1979. Brazil Anthropological Per-spectives: Essays in Honor of Charles Wagley. New York: Columbia UniversityPress.
Marks, Jonathan. 1994. “Black, White, Other: Racial Categories Are CulturalConstructs Masquerading as Biology.” Natural History, December, pp.32–35.
———. 1995. Human Biodiversity: Genes, Race, and History. New York: Aldine deGruyter.
Martin, E., T. J. DeMaio, and P. C. Campanelli. 1990. “Context Effects for CensusMeasures of Race and Hispanic Origin.” Public Opinion Quarterly 54 (4):551–566.
Martinez, Angel R. 1988. “The Effects of Acculturation and Racial Identity onSelf-Esteem and Psychological Well-Being among Young Puerto Ricans.”Ph.D. diss., City University of New York.
Martínez-Echazábal, Lourdes. 1998. “Mestizaje and the Discourse of Na-tional/Cultural Identity in Latin America, 1845–1959.” Latin American Per-spectives 25 (3) (May): 21–42. Issue 100 entitled “Race and National Identityin the Americas” and edited by Helen Safa.
Massey, Douglas S. 1988. “Ethnic Residential Segregation: A Theoretical Syn-thesis and Empirical Review.” Sociology and Social Research 69 (3): 317–350.
244 REFERENCES

Massey, Douglas S., and Nancy A. Denton. 1990. “Patterns of NeighborhoodTransition in a Multiethnic World.” Demography 28: 41–64.
———. 1992. “Racial Identity and the Spatial Assimilation of Mexicans in theUnited States.” Social Science Research 21: 235–260.
———. 1993. American Apartheid: Segregation and the Making of the Underclass.Cambridge, MA: Harvard University Press.
Massey, James. 1980. “A Comparison of Interviewer Observed Race and Re-spondent Reported Race in the National Health Interviewer Survey.”American Statistical Association’s 1980 Social Statistics Proceedings. Houston:American Statistical Association.
McKay, Ruth B. 1993. “Undercoverage of Hispanics in Household Surveys.”Monthly Labor Review, September, pp. 38–42.
McKay, Ruth B., and Manuel de la Puente. 1995. “Cognitive Research in De-signing the CPS Supplement on Race and Ethnicity.” Paper presented at theU.S. Bureau of the Census annual research conference, March 19–23, Ross-lyn, VA.
McKenney, Nampeo R. 1994. Comments made at the Workshop on Race Eth-nicity Classification: An Assessment of the Federal Standard for Race andEthnicity Classification, Committee on National Statistics, National Re-search Council, February 17–18, Washington, DC.
McKenney, Nampeo R., and Claudette E. Bennett. 1994. “Issues Regarding Dataon Race and Ethnicity: The Census Bureau Experience.” CDC-ATSDRWorkshop, Public Health Reports 108 (1) (January/February): 16–25.
McKenney, Nampeo R., Claudette Bennett, Roderick Harrison, and Jorge delPinal. 1993. “Evaluating Racial and Ethnic Reporting in the 1990 Census.”Reprinted from the Proceedings of the Section on Survey Research Methods ofthe American Statistical Association. Washington, DC: American StatisticalAssociation.
McKenney, Nampeo R., and Arthur R. Cresce. 1993. “Measurement of Ethnicityin the U.S. Census Bureau.” In Challenges of Measuring an Ethnic World: Sci-ence, Politics and Reality. Proceedings of the Joint Canada—United States Con-ference on the Measurement of Ethnicity, April 1–3. Washington, DC: U.S.Government Printing Office.
McKenney, Nampeo R., E. W. Fernandez, and W. T. Masamura. 1985. “TheQuality of the Race and Hispanic Origin Information Reported in the 1980Census.” Proceedings of the Survey Research Methods Section of the AmericanStatistical Association, Washington, DC: American Statistical Association,pp. 46–50.
Meaders, Daniel. 1993. Eighteenth-Century White Slaves: Fugitive Notices, vol. 1,Pennsylvania, 1729–1760. Documentary Reference Collections. Westport,CT: Greenwood Press.
REFERENCES 245
Meléndez, Edwin. 1991. “Labor Market Structure and Wage Differences in NewYork City: A Comparative Analysis of Hispanics and Non-Hispanic Blacksand Whites.” In Hispanics in the Labor Force: Issues and Policies, ed. EdwinMeléndez, Clara E. Rodríguez, and Janice Barry-Figueroa. New York:Plenum Press.
Meléndez, Edwin, and Clara E. Rodríguez, eds. 1992. “Puerto Rican Povertyand Labor Markets.” Special issue of the Hispanic Journal of Behavioral Sci-ences 14 (1) (February).
Meléndez, Edwin, Clara E. Rodríguez, and Janis Barry Figueroa, eds. 1991. His-panics in the Labor Force: Issues and Policies. New York: Plenum Press.
Merton, Robert K. 1941. “Intermarriage and the Social Structure: Fact and The-ory.” Psychiatry 4: 361–374.
Miller, A. T. 1991. “Measuring Mulattoes: The Changing U.S. Racial Regime inCensus and Society.” Paper presented at the annual meeting of the Popu-lation Association of America, May.
Miller, Robin L. 1992. “The Human Ecology of Multiracial Identity.” In RaciallyMixed People in America, ed. Maria P. P. Root. Newbury Park, CA: Sage.
Morales, Rebecca. 2000. “What a Latino Worker Finds in the U.S. Labor Mar-ket.” Strengthening Employment Opportunities for Latino Workers: Ideas forPolicy and Practice. Report on the State of Hispanic America 1999, ed. Sonia M.Pérez. Washington, DC: National Council of La Raza.
Morales, Rebecca, and Frank Bonilla. 1993. Latinos in a Changing U.S. Economy:Comparative Perspectives on Growing Inequality. Newbury Park, CA: Sage.
Morganthau, Tom. 1995. “What Color Is Black?” Newsweek, February 13, pp.63–65.
Morris, Milton. 1994. “Report from Rapporteur Milton Morris of the Joint Cen-ter for Political and Economic Studies.” Presented at the Workshop on Raceand Ethnicity Classification, Committee on National Statistics, NationalAcademy of Sciences, Washington, DC, February 17–18.
Morrison, Tony. 1993. “On the Backs of Blacks.” Time, special issue (Fall), p. 57.Moss, Philip, and Chris Tilly. 2000. “Why Opportunity Isn’t Knocking: Racial
Inequality and the Demand for Labor.” In Urban Inequality in Four Cities, ed.Lawrence Bobo, Alice O’Connor, and Chris Tilly. New York: Russell SageFoundation.
Mullings, Leith. 1978. “Ethnicity and Stratification in the Urban United States.”Annals of the New York Academy of Sciences 218: 10–22.
Naber, Nadine. 1998. “White—But Not Quite? An Examination of Arab Ameri-can In/Visibility.” AAUG Monitor 13 (3): 1–16. Washington, DC: Associa-tion of Arab-American University Graduates.
Nakashim, Cynthia L. 1992. “An Invisible Monster: The Creation and Denial ofMixed-Race People in America.” In Racially Mixed People in America, ed.Maria P. P. Root. Newbury Park, CA: Sage.
246 REFERENCES

National Council of La Raza. 1995. “Accurate Racial/Ethnic Data Should DriveCategory Review.” Poverty and Race 4 (1) (January/February): 7–9.
———. 1997. A Portrait of Hispanic Economic Status. Washington, DC: NationalCouncil of La Raza.
Nobles, Melissa. 1995. “‘Responding with Good Sense’: The Politics of Race andCensuses in Contemporary Brazil.” Ph.D. diss., Yale University.
Norris, Alexander. 1999. “Some Opt to Be Just ‘Canadian’ in Origin.” The Gazette(Montreal), June 1, p. A9.
Oboler, Suzanne. 1995. Ethnic Labels/Latino Lives: Identity and the Politics of (Re)Presentation in the United States. Minneapolis: University of MinnesotaPress.
O’Crouley Alonso, Pedro. 1972. A Description of the Kingdom of New Spain (1774),trans. and ed. Sean Galvin. New York: John Howell Books.
Ogbu, John. 1978. Minority Education and Caste: The American System in Cross-Cultural Perspective. New York: Academic Press.
Omandam, Pat. 1997. “Hawaiians Get Census Category: The Next Census WillList Native Hawaiians Alone, Apart from Asians.” Honolulu Star-BulletinOctober 29.
Omi, Michael, and Howard Winant. 1995. Racial Formation in the United States.New York: Routledge & Kegan Paul.
Orbe, Mark E., and Karen E. Strother. 1996. “Signifying the Tragic Mulatto: ASemiotic Analysis of Alex Haley’s Queen. Howard Journal of Communications7: 113–126.
Parrillo, Vincent. 1994. “Diversity in America: A Sociohistorical View.” Sociolog-ical Forum 9 (4): 523–545.
Passel, Jeffrey S. 1993. Comment on “Estimation of Population Coverage in the1990 United States Census Based on Demographic Analysis,” by Gregory J.Robinson, Bashir Ahmed, Prithwis Das Gupta, and Karen A. Woodrow.Journal of the American Statistical Association 88 (423) (September): 1074–1977.
Passel, Jeffrey S., and K. A. Woodrow. 1984. “Geographic Distribution of Un-documented Immigrants: Estimates of Undocumented Aliens Counted inthe 1980 Census by State.” International Migration Review 18: 642–671.
Patterson, Orlando. 1997. “The Race Trap.” New York Times, op. ed. sec., July 11.Pedraza-Bailey, Sylvia. 1985. Political and Economic Migrants in America: Cubans
and Mexicans. Austin: University of Texas Press.Petrullo, V. 1947. Puerto Rican Paradox. Philadelphia: University of Pennsylvania
Press.Pevar, Stephen L. 1983. The Rights of Indians and Tribes. New York: Bantam
Books.Pitt-Rivers, Julian. 1975. “Race, Color and Class in Central America and the
Andes.” In Majority and Minority, ed. Norman R. Yetman and C. Hoy Steele.Boston: Allyn & Bacon.
REFERENCES 247

Poe, G. S., E. Powell-Griner, J. K. McLaughlin, K. Robinson, and J. Placek. 1993.“A Comparability Study of the Responses to the 1986 National MortalityFollow-back Survey to Similar Demographic Items from the Death Certifi-cate.” Vital and Health Statistics, Data Evaluation and Methods Research, ser. 2,no. 118. Washington, DC: U.S. Department of Health and Human Services,Public Health Service, Centers for Disease Control and Prevention, Na-tional Center for Health Statistics.
Portes, Alejandro, and Robert L. Bach. 1985. Latin Journey: Cuban and MexicanImmigrants in the United States. Berkeley and Los Angeles: University ofCalifornia Press.
Poverty and Race. 1994. “Race/Ethnic Categories: Do They Matter? A Sympo-sium.” Part 1, vol. 3, no. 6 (November/December).
———. 1995. “Racial/Ethnic Categories: Do They Matter? A Symposium.” Part2, vol. 4, no. 2, pp. 13–18. (March/April).
Pryce, Delina D. 1999. “Black Latina.” Hispanic, March, p. 56.Ramos Rosado, Marie. 1987. “La Mujer Puertorriqueña negra: La Otra cara de
la historia.” Homines 10 (2): 491–497.Rand Reed, Kathleen. 1994. “Comments by the Representative of the American
Society of Minority Health and Transplant Professionals.” Presented at theWorkshop on Race and Ethnicity Classification, Committee on NationalStatistics, National Academy of Sciences, Washington, DC, February 17–18.
Rawick, George P. 1972. From Sundown to Sunup: The Making of the Black Com-munity. Westport, CT: Greenwood Press.
Reed, John, and Roberto R. Ramirez. 1998. “The Hispanic Population in theUnited States: March 1997 (Update).” Washington, DC: U.S. Department ofCommerce, Economics and Statistics Administration, Current PopulationReports, P20-511.
Reference Library of Black America. 1990. Vol. 2, comp. and ed. Harry A. Ploski,with Otto J. Lindenmeyer and Ernest Kaiser. New York: Bellwether Pub-lishing.
Reimers, Cordelia. 1985. “A Comparative Analysis of the Wages for Hispanics,Blacks, and Non-Hispanic Whites.” In Hispanics in the U.S. Economy, ed. G.Borjas and M. Tienda. Orlando, FL: Academic Press.
———. 2000. “Compensation for the Latino Worker.” In Strengthening Employ-ment Opportunities for Latino Workers: Ideas for Policy and Practice, Report onthe State of Hispanic America 1999, ed. Sonia M. Pérez. Washington, DC: Na-tional Council of La Raza.
Relethford, John H., Michael P. Stern, Sharon P. Gaskill, and Helen P. Hazuda.1983. “Social Class, Admixture, and Skin Color Variation in Mexican-Americans and Anglo-Americans Living in San Antonio, Texas.” AmericanJournal of Physical Anthropology 61: 97–102.
Return of the Whole Number of Persons within the Several Districts of the United
248 REFERENCES

States. 1802 Washington, DC: Printed at the Apollo Press by Wm. Duaneand Son.
Rivera, Edward. 1983. Family Installments: Memories of Growing up Hispanic. NewYork: Penguin Books.
Rivera-Batiz, Francisco, and Carlos Santiago. 1997. Puerto Ricans in the U.S.: AChanging Reality. 4th printing. Washington, DC: National Puerto RicanCoalition.
Robinson, Gregory J., Bashir Ahmed, Prithwis Das Gupta, and Karen AWoodrow. 1993. “Estimation of Population Coverage in the 1990 UnitedStates Census Based on Demographic Analysis.” Journal of the American Sta-tistical Association 88: 1061–1071.
Robinson, Gregory J., and Yvonne J. Gist. 1992. “The Effect of Alternative RaceClassification Rules on the Annual Number of Births by Race: 1968–1989.”Paper presented at the annual meeting of the Population Association ofAmerica, Denver, April 30–May 2.
Robinson, Gregory J., and Susan Lapham. 1991. “Inconsistencies in Race Clas-sifications of the Demographic Estimates and the Census.” DemographicAnalysis Evaluation Project D9, Preliminary Research and EvaluationMemorandum no. 82, Population Division, U.S. Bureau of the Census.
Rodríguez, Clara. 1974. “Puerto Ricans: Between Black and White.” Journal ofNew York Affairs 1 (4): 92–101.
———. 1989. Puerto Ricans: Born in the USA. Boston: Unwin Hyman.———. 1990. “Racial Identification among Puerto Ricans in New York.” His-
panic Journal of Behavioral Sciences 12 (4) (November): 366–379.———. 1991a. “The Effect of Race on Puerto Rican Wages.” In Hispanics in the
Labor Force: Issues and Policies, ed. Edwin Meléndez, Clara Rodríguez, andJanice Barry Figueroa. New York: Plenum Press.
——— 1991b. “Why Other Is Our Second Fastest Growing Racial Category.”Letter to the Editor, New York Times, April 4, p. A14.
———. 1991c. Puerto Ricans: Born in the USA. Boulder, CO: Westview Press———. 1992. “Race, Culture and Latino ‘Otherness’ in the 1980 Census.” Social
Science Quarterly 73 (4) (December): 930–937.———. 1994a. Challenging Racial Hegemony: Puerto Ricans in the United
States.” In Race, ed. R. Sanjek and S. Gregory. New Brunswick, NJ: RutgersUniversity Press.
———. 1994b. “An Overview of Puerto Rican Migration.” In Puerto RicanWomen and Children: Issues in Health, Growth and Development, ed. C. GarcíaColl and G. Lamberty. New York: Plenum Press.
———. 1996. “Racial Themes in the Literature on Puerto Ricans.” In Latinos inNew York: Communities in Transition, ed. Gabriel Haslip-Viera and SherrieBaver. South Bend, IN: University of Notre Dame Press.
Rodríguez, Clara, Aida Castro, Oscar García, and Analisa Torres. 1991. “Latino
REFERENCES 249
Racial Identity: In the Eye of the Beholder?” Latino Studies Journal 2 (3) (De-cember): 33–48.
Rodríguez, Clara, and Hector Cordero-Guzmán. 1992. “Placing Race in Con-text.” Ethnic and Racial Studies 15 (4): 523–542.
Rodríguez, Clara, and Almida López-Hernández. 1995. “Dictionary Definitionsof ‘Race’ and ‘Ethnic,’ 1898–1994.” Unpublished manuscript, FordhamUniversity.
Rodríguez, Nestor, and Jacqueline Hagan. 1991. Investigating Census Coverageand Content among the Undocumented: An Ethnographic Study of Latino Immi-grant Tenants in Houston. Ethnographic Evaluation of the 1990 Decennial Cen-sus Report 3. Prepared under Joint Statistical Agreement 89–34 with theUniversity of Houston, U.S. Bureau of the Census, Washington, DC.
Rodriguez, Richard. 1982. Hunger of Memory: An Autobiography. Boston: Godine.———. 1991. “Mixed Blood, Columbus’s Legacy: A World Made Mestizo.”
Harper’s, November, pp. 47–56.Rodríguez, Roberto. 1991. “The Columbus 1492–1992 Quincentennial Debate.”
Black Issues in Higher Education, September 26, pp. 20–29.Rolark, S., C. Bennett, and R. Harrison. 1994. “Tables on Multiracial Responses
and on Interracial and Interethnic Couples and Children.” Paper presentedat the Workshop on Race and Ethnicity Classification, Committee on Na-tional Statistics, National Academy of Sciences, Washington, DC, February17–18.
Romero, Mary. 1992. Ethnographic Evaluation of Behavioral Causes of Census Un-dercount of Undocumented Immigrants and Salvadorans in the Mission Districtof San Francisco, California. Ethnographic Evaluation of the 1990 Decennial Cen-sus Report 18. Prepared under Joint Statistical Agreement 89-41 with the SanFrancisco State University Foundation, U.S. Bureau of the Census, Wash-ington, DC.
Root, Maria P. P. 1992a. “Back to the Drawing Board: Methodological Issues inResearch on Multiracial People. “ In Racially Mixed People in America, ed.Maria P. P. Root. Newbury Park, CA: Sage.
———, ed. 1992b. Racially Mixed People in America. Newbury Park, CA: Sage.———. 1992c. “Within, Between, and Beyond Race.” In Racially Mixed People in
America, ed. Maria P. P. Root. Newbury Park, CA: Sage.———, ed. 1996. The Multiracial Experience: Racial Borders as the New Frontier.
Newbury Park, CA: Sage.Rose, Willie Lee. 1965. “‘Iconoclasm Has Had Its Day’: Abolitionists and Freed-
man in South Carolina.” In The Antislavery Vanguard: New Essays on the Abo-litionists, ed. Martin Duberman. Princeton, NJ: Princeton University Press.
Rosenbaum, Emily. 1996. “The Influence of Race on Hispanic Housing Choices,New York City, 1978–1987.” Urban Affairs Review 32 (2) (November):217–243.
250 REFERENCES

Rosenbaum, Emily, Samantha Friedman, Michael H. Schill, and Hielke Bud-delmeyer. 1999. “Nativity Differences in Neighborhood Quality amongNew York City Households, 1996.” Housing Policy Debate 10: 625–628.
Rosin, Hanna. 1994. “Boxed In: America’s New Racial Minority Place.” The NewRepublic, January 3, pp. 11–12.
Rout, Leslie B. Jr. 1976. The African Experience in Spanish America: 1502 to the Pre-sent Day. Cambridge: Cambridge University Press.
Russell, K., M. Wilson, and R. Hall. 1992. The Color Complex: The Politics of SkinColor among African Americans. New York: Harcourt Brace Jovanovich.
Samhan, Helen Hatab. 1994. “Emerging Ethnic Categories” Paper presented atthe Workshop on Race and Ethnicity Classification: An Assessment of theFederal Standard for Race and Ethnicity Classification, Committee on Na-tional Statistics, National Research Council, Washington, DC, February17–18.
Sandor, Gabrielle. 1994. “The Other Americans.” American Demographics 16 (6):36–42.
Sanjek, Roger. 1971. “Brazilian Racial Terms: Some Aspects of Meaning andLearning.” American Anthropologist 73 (5): 1126–1143.
———. 1994. “The Enduring Inequalities of Race.” In Race, ed. Steven Gregoryand Roger Sanjek. New Brunswick, NJ: Rutgers University Press.
Santiago, Roberto. 1995. “Black and Latino.” In Boricuas: Influential PuertoRican Writings, an Anthology, ed. Roberto Santiago. New York: BallantineBooks.
Santos, Richard, and Patricia Seitz. 2000. “Benefit Coverage for the LatinoWorker and His/Her Family.” In Strengthening Employment Opportunitiesfor Latino Workers: Ideas for Policy and Practice. Report on the State of HispanicAmerica 1999, ed. Sonia M. Pérez. Washington, DC: National Council of LaRaza.
Schafer, Daniel L. 1993. “‘A Class of People Neither Freeman Nor Slaves’: FromSpanish to American Race Relations in Florida, 1821–1861.” Journal of SocialHistory 26 (Spring): 587–609.
Schill, Michael H., Samantha Friedman, and Emily Rosenbaum 1998. “TheHousing Conditions of Immigrants in New York City.” Journal of HousingResearch 9 (2): 201–235.
Schlesinger, Arthur. 1992. The Disuniting of America. New York: Norton.The Sciences 1997. “The Puzzle of Race.” The Sciences 37 (2) (March–April):16–43.Scott, Rebecca J. 1995. “Dossier: Raza y Racismo.” Historia social 2 (22): 56–150.Secada, Walter G. 1998. No More Excuses: The Final Report of the Hispanic Dropout
Project. Report submitted to U.S. Secretary of Education Richard Riley bythe appointed members of the Hispanic Dropout Project, February.
Seltzer, William 1994. “Politics and Statistics: Independence, Dependence or In-teraction?” United Nations Working Paper Series, no. 6. New York: United
REFERENCES 251
Nations Department for Economic and Social Information and PolicyAnalysis.
Serreno, Renzo. 1945. “Cryptomelanism: A Study of Color Relations and Per-sonal Insecurity in Puerto Rico.” Psychiatry 10 (August): 261–269.
Shaheen, Jack 1984. The TV Arab. Bowling Green, KY: Bowling Green State Uni-versity Press.
Shohat, Ella, and Robert Stam. 1994. Unthinking Eurocentrism: Multiculturalismand the Media. New York: Routledge & Kegan Paul.
Shreeve, James. 1994. “Terms of Estrangement.” Discover, November, pp. 57–63.Sillitoe, K., and P. White. 1992. “Ethnic Group and the British Census: The
Search for a Question.” Journal of the Royal Statistical Society, ser. A, vol. 155:141–163.
Silva, N. do Valle, and Carlos Hasenbalg. 1992. Relações raciais no Brasil contem-poráno. Rio de Janeiro: Editora rio fundo.
Sinclair, April. 1994. Coffee Will Make You Black (A Novel). New York: Avon Books.Skerry, P. 1990. “Hispanic Job Discrimination.” Wall Street Journal, April 27, p.
A12.Skidmore, Thomas E. 1990. “The Idea of Race in Latin America, 1870–1940.” In
Racial Ideas and Social Policy in Brazil, 1870–1940, ed. Richard Graham.Austin: University of Texas Press.
Smith, Billy G., and Richard Wojtowicz. 1989. Blacks Who Stole Themselves: Ad-vertisements for Runaways in the Pennsylvania Gazette, 1728–1790. Philadel-phia: University of Pennsylvania Press.
Smith, David J. 1993. The Eugenic Assault on America: Scenes in Red, White andBlack. Fairfax, VA: George Mason University Press.
Smith, Rogers M. 1997. Civic Ideals: Conflicting Visions in U.S. History. NewHaven, CT: Yale University Press.
Snipp, Mathew C. 1989. American Indians: The First of the Land. The Populationof the United States in the 1980s: A Census Monograph Series. NationalCommittee for Research on the 1980 Census. New York: Russell Sage Foun-dation.
———. 1994. “Presentation and Comments on Indigenous People.” Paper pre-sented at the Workshop on Race and Ethnicity Classification, Committeeon National Statistics, National Academy of Sciences, Washington, DC,February 17–18.
Snowden, Frank M. Jr. 1983. Before Color Prejudice: The Ancient View of Blacks.Cambridge, MA: Harvard University Press.
Spickard, P. R. 1989. Mixed blood: Intermarriage and Ethnic Identity in TwentiethCentury America. Madison: University of Wisconsin Press.
———. 1992. “The Illogic of American Racial Categories.” In Racially Mixed Peo-ple in America, ed. Maria P. P. Root. Newbury Park, CA: Sage.
252 REFERENCES

Stanton, William. 1960. The Leopard’s Spots: Scientific Attitudes towards Race inAmerica, 1815–1859. Chicago: University of Chicago Press.
Starr, Paul. 1993. “Social Categories and Claims in the Liberal State.” Social Re-search 59 (2): 263–295.
Statistics Canada and U.S. Bureau of the Census. 1993. Challenges of Measuringan Ethnic World: Science, Politics and Reality. Washington, DC: U.S. Govern-ment Printing Office.
Steinberg, Steven. 1981. The Ethnic Myth: Race, Ethnicity, and Class in America.Boston: Beacon Press.
Stephan, Cookie White. 1992. “Mixed-Heritage Individuals: Ethnic Identity andTrait Characteristics.” In Racially Mixed People in America, ed. Maria P. P.Root. Newbury Park, CA: Sage.
Stephens, Thomas M. 1989. Dictionary of Latin American Racial and Ethnic Termi-nology. Gainesville: University of Florida Press.
Stolzenberg, R. 1982. “Occupational Differences between Hispanics and Non-Hispanics.” Report to the National Commission for Employment Policy.Washington, DC: National Commission for Employment Policy.
Straus, Terry Anne. 1991. The Bicentennial Census in a Mixed Neighborhood inChicago. Ethnographic Evaluation of the 1990 Decennial Census Report 2. Pre-pared under Joint Statistical Agreement 89-37 with the Native AmericanEducational Services College, U.S. Bureau of the Census, Washington, DC.
Strickland, Rennard. 1975. Fire and the Spirits: Cherokee Law from Clan to Court.Civilization of the American Indian Series. Norman: University of Okla-homa Press.
Subervi-Vélez, Federico, with Charles Ramírez Berg, Patricia Constantakis-Valdés, Chon Noriega, Diana I. Ríos, and Kenton T. Wilkinson. 1997. “His-panic Oriented Media.” In Latin Looks: Images of Latinas and Latinos in theU.S. Media., ed. Clara E. Rodríguez. Boulder, CO: Westview Press.
Sundiata, Ibrahim. 1987. “Late Twentieth Century Patterns of Race Relations inBrazil and the United States.” Phylon 48 (1): 62–76.
Takaki, Ronald. 1989. Strangers from a Different Shore: A History of Asian Ameri-cans. Boston: Little, Brown.
———. 1993. A Different Mirror: A History of Multicultural America. Boston: Lit-tle, Brown.
———. 1994. From Different Shores: Perspectives on Race and Ethnicity in America.2d ed. New York: Oxford University Press.
Taylor-Gibbs, Jewelle, and Alice M. Hines 1992. “Negotiating Ethnic Identity:Issues for Black-White Biracial Adolescents.” In Racially Mixed People inAmerica,. ed. Maria P. P. Root. Newbury Park, CA: Sage.
Tamayo Lott, Juanita. 1992. “Policy Purposes of Race and Ethnicity: A Re-assessment of Federal Racial and Ethnic Categories.” Paper presented at
REFERENCES 253

the Third Women’s Policy Research Conference, Institute for Women’s Pol-icy Research, Washington, DC, May 16.
Tamayo Lott, Juanita. 1997. Asian Americans: From Racial Category to MultipleIdentities. Walnut Creek, CA: Alta Mira Press.
Telles, Edward E. 1992. “Residential Segregation by Skin Color in Brazil.” Amer-ican Sociological Review 57: 187–197.
———. 1993. “Racial Distance and Region in Brazil: The Case of Marriageamong Color Groups.” Latin American Research Review 28: 141–62.
———. 1994. “Industrialization and Racial Inequality in Employment: TheBrazilian Example.” American Sociological Review 59 (February): 46–63.
Telles, Edward E., and Nelson Lim. 1998. “Does Who Classifies Race Matter?Self vs. Social Classification of Race and Racial Income Inequality inBrazil.” Demography 34:4:465–474.
Telles, Edward E., and Edward Murguía. 1990. “Phenotypic Discrimination andIncome Differences among Mexican Americans.” Social Science Quarterly71(4) (December): 683–696.
Thomas, Nicholas. 1989. “The Force of Ethnology: Origins and Significance ofthe Melanesia/Polynesia Division.” Current Anthropology 30: 27–41.
Thomas, Piri. 1967. Down These Mean Streets. New York: Knopf.Thompson, Lloyd A. 1989. Romans and Blacks. Norman: University of Oklahoma
Press.Thornton, Russell. 1987. American Indian Holocaust and Survival: A Population
History since 1492. Norman: University of Oklahoma Press.Tienda, M., and V. Ortiz. 1986. “‘Hispanicity’ and the 1980 Census.” Social Sci-
ence Quarterly 67 (March): 3–20.Tizard, Barbara, and Ann Phoenix. 1993. Black, White or Mixed Race: Race and
Racism in the Lives of Young People of Mixed Parentage. London: Routledge &Kegan Paul.
Torres, Andrés. 1992. “Nativity, Gender, and Earnings Discrimination.” HispanicJournal of Behavioral Sciences 14 (1) (February): 124–143.
———. 1995. Between Melting Pot and Mosaic. Philadelphia: Temple UniversityPress.
Torres, Andrés, and Clara E. Rodríguez. 1991. “Latino Research and Policy:The Puerto Rican Case.” In Hispanics in the Labor Force, ed. Edwin Melén-dez, Clara E. Rodríguez, and Janis Barry-Figueroa. New York: PlenumPress.
Torres, Arlene, and Norman E. Whitten Jr., eds. 1998. Blackness in Latin Americaand the Caribbean. Vol. 2. Bloomington: Indiana University Press.
Torres, Joseph. 1996. “Report Says Combining Race and Ethnicity in CensusLowers Latino Response. Hispanic Link Weekly Report, June 3, p. 4.
Torres-Saillant, Silvio. 1998. “The Tribulations of Blackness: States in DominicanRacial Identity.” Latin American Perspectives 25 (4) (May): 126–146. Issue 100
254 REFERENCES

entitled “Race and National Identity in the Americas” and edited by HelenSafa.
Treviño, F. M. 1987. “Standardized Terminology for Standardized Populations.”American Journal of Public Health 77: 69–72.
Tucker, Clyde, Ruth McKay, Brian Kojetin, Roderick Harrison, Manuel de laPuente, Linda Stinson, and Ed Robison. 1996. “Testing Methods of Collect-ing Racial and Ethnic Information: Results of the Current Population Sur-vey Supplement on Race and Ethnicity.” Statistical Note no. 40, StatisticalNote Series. Washington, DC: Bureau of Labor Statistics.
Tumin, Melvin, and Arnold Feldman. 1961. Social Class and Social Change inPuerto Rico. Princeton, NJ: Princeton University Press.
United Nations 1980. Principles and Recommendations for Population and HousingCensuses. New York: Department of International Economic and Social Af-fairs, Statistical Office, Statistical Papers, ser. M, no. 67.
———. 1985. Demographic Yearbook, 1983. 35th issue. New York: Department ofInternational Economic and Social Affairs.
———. 1989. Handbook of Population and Housing Censuses. New York: Depart-ment of International Economic and Social Affairs, Studies in Methods, ser.F, no. 49.
———. 1992. Handbook of Population and Housing Censuses, Part II: Demographicand Social Characteristics. New York: Department of International Economicand Social Affairs, Studies in Methods, ser. F, no. 54.
United Nations Educational, Scientific, and Cultural Organization (UNESCO).1952. The Race Concept: Results of an Inquiry. Paris: United Nations Educa-tional, Scientific, and Cultural Organization.
U.S. Bureau of the Census. 1932. Census of the Population: 1930, vol. 3, Population,part 1. Washington, DC: U.S. Government Printing Office.
———. 1943. Census of the Population: 1940, vol. 2, Population: Characteristics of thePopulation. Washington, DC: U.S. Government Printing Office.
———. 1953. Census of the Population: 1950. Population, vol. 2, Characteristics of thePopulation, part I. Washington, DC: U.S. Government Printing Office.
———. 1963. Census of the Population: 1960, vol. 1, Characteristics of the Population.Washington, DC: U.S. Government Printing Office.
———. 1967. A Century of Population Growth: From the First Census of the U.S. tothe Twelfth, 1790–1900. Baltimore: Genealogical Publishing.
———. 1972. 1970 Census of the Population, Subject Report Series, Persons ofSpanish Origin, PC(2)-1C. Washington, DC: U.S. Government PrintingOffice.
———. 1973. Census of the Population: 1970. Subject Reports. Final Report PC(2)-1A, National Origin and Language, appendix C: Definitions and Explana-tions of Subject Characteristics. Washington, DC: U.S. Government Print-ing Office.
REFERENCES 255
U.S. Bureau of the Census. 1978. Twenty Censuses: Population and Housing Ques-tions, 1790–1980. Washington, DC: Superintendent of Documents, U.S.Government Printing Office, October.
———. 1982. Persons of Spanish Origin by State: 1980 (Supplementary ReportPC80-S1-7, August). Washington, D.C.: U.S. Government Printing Office.
———. 1989. 200 Years of U.S. Census Taking: Population and Housing Questions,1790–1990. Washington, DC: U.S. Government Printing Office.
———. 1990. “Census of Population and Housing, Content Determination Re-ports, Race and Ethnic Origin, 1990.” CDR-1-13, Washington, DC: U.S.Government Printing Office.
———. 1991. “Census Bureau Releases 1990 Census Counts on Hispanic Popu-lation Groups.” Press release, June 12, Washington, DC.
———. 1992. Exploring Alternative Race-Ethnic Comparison Groups in Current Pop-ulation Surveys. Current Population Reports, P23-182. Washington, DC:U.S. Government Printing Office.
———. 1993a. 1990 Census of Population: Social and Economic Characteristics. 1990CP-2-1.
———. 1993b. Persons of Hispanic Origin in the United States, 1990. Census ofPopulation, CP-3-3. Washington, DC: U.S. Government Printing Office.
———. 1993c. We, the American . . . Hispanics. Ethnic and Hispanic StatisticsBranch, Population Division, November. Washington, DC: U.S. Govern-ment Printing Office.
———. 1996a. “Findings on Questions on Race and Hispanic Origin Tested inthe 1996 National Content Survey.” Staff of the Special Population Statis-tics, Population Division Working Paper no. 16. Washington, DC: Econom-ics and Statistics Administration.
———. 1996b. Population Projections on the United States by Age, Sex, Race, andHispanic Origin: 1995 to 2050. P25-1130, Current Population Reports.Washington, DC: U.S. Dept. of Commerce, Economics and StatisticsAdministration.
———. 1997. “Report to Congress—The Plan for Census 2000.” Washington,DC: U.S. Government Printing Office.
U.S. Census Office. 1901. Population, Part I, Census Reports, Volume I, Twelfth Cen-sus of the United States, Taken in the Year 1900. William R. Merriam, Director,prepared under the supervision of William C. Hunt, Chief Statistician forPopulation. Washington, DC: U.S. Census Office.
U.S. Department of Commerce. 1995. “1996 Race and Ethnic Targeted Test; No-tice.” Federal Register, 60:231:62010–62014. December 1. Washington, DC:U.S. Government Printing Office.
U.S. Department of Commerce, Bureau of the Census. 1921. Population, 1920,Volume III, Fourteenth Census of the United States, Taken in the Year 1920. Num-ber and Distribution of Inhabitants. Prepared under the supervision of
256 REFERENCES

William C. Hunt, Chief Statistician for Population. Washington, DC: U.S.Government Printing Office.
———. 1922. Population, 1920, Volume III, Fourteenth Census of the United States,Taken in the Year 1920 Composition and Characteristics of the Population byStates. Prepared under the supervision of William C. Hunt, Chief Statisti-cian for Population. Washington, DC: U.S. Government Printing Office.
———. 1993. We the American . . . Foreign Born. Ethnic and Hispanic StatisticsBranch, report no. 350-631. Washington, DC: U.S. Government PrintingOffice.
———. 1997. Report to Congress—The Plan for Census 2000. Originally issuedJuly, revised and reissued August. Washington, DC: U.S. GovernmentPrinting Office.
U.S. Department of Education, National Center for Education Statistics. 1996.Racial and Ethnic Classifications Used by Public Schools. NCES 96-092. Wash-ington, DC: U.S. Government Printing Office.
U.S. Department of Labor, Bureau of Labor Statistics. 1995. “A CPS Supple-ment for Testing Methods of Collecting Racial and Ethnic Information:May, 1995.” Bureau of Labor Statistics Statistical Working Papers series,November.
U.S. Department of State. 1832a. Abstract of the Fifth Census of the United States:1830. City of Washington: Printed at the Globe Office by F. P. Blair.
———. 1832b. Abstract of the Returns of the Fifth Census Showing the Number ofFree People, the Number of Slaves, the Federal or Representative Number and theAggregate of Each County of Each State of the United States. Prepared by theClerk of the House of Representatives, Washington, DC: Duff Green.
———. 1835. Statistical View of the Population of the United States: From 1790 to1830 Inclusive. Washington, DC: Duff Green.
———. 1842. Sixth Census Enumeration of the Inhabitants of the United States asCorrected at the Department of State in 1840 (Aggregate Amount of Each De-scription of Persons within the United States and Their Territories Accord-ing to the Census of 1840. As corrected at the Department of State, From theReturns of the Marshals of the Several Districts). No publisher given. Mi-crofilm available at the Science, Industry and Business Library, New YorkCity.
U.S. General Accounting Office (GAO). 1990. Immigration Reform, EmployerSanctions, and the Question of Discrimination. Washington, DC: U.S. Govern-ment Printing Office.
———. 1992. “Federal Data Collection: Agencies’ Use of Consistent Race andEthnic Definitions.” Report to the Chairman, Committee on GovernmentOperations, House of Representatives, December, GAO/GGD-93-25.
———. 1993. “Census Reform: Early Outreach and Decisions Needed on Raceand Ethnic Questions.” January, GAO/GGD-93-36.
REFERENCES 257
U.S. General Accounting Office (GAO). 1997. “Collection and Reporting of Raceand Ethnicity Data.” Statement of Bernard L. Ungar, Associate Director,Federal Management and Workforce Issues, General Government Divi-sion, April 23, GAO/T-GGD-97-92.
U.S. House Committee on Post Office and Civil Service. 1994a. Opening State-ment, April 14, 1993: Hearings of the Subcommittee on Census, Statistics andPostal Personnel, 103d Cong., 1st sess., April 14, 1993, ser. no. 103-7. Wash-ington, DC: U.S. Government Printing Office.
———. 1994b. Prepared Statement of Arthur A. Fletcher, Chairperson, U.S. Commis-sion on Civil Rights: Hearings before the Subcommittee on Census, Statistics andPostal Personnel, 103 Cong., 1st sess., November 3, 1993, ser. no. 103-7, pp.248–261. Washington, DC: U.S. Government Printing Office.
———. 1994c. Prepared Statement of Tony E. Gallegos, Chairman, U.S. Equal Em-ployment Opportunity Commission: Hearings before the Subcommittee on Cen-sus, Statistics and Postal Personnel, 103d Cong., 1st sess., November 3, 1993,ser. no. 103–7, pp. 285–286. Washington, DC: U.S. Government PrintingOffice.
———. 1994d. Statement of Billy J. Tidwell, Director of Research, National UrbanLeague: Hearings before the Subcommittee on Census, Statistics and Postal Per-sonnel, 103d Cong., 1st sess., July 29, 1993, ser. no. 103-7, pp. 229–237. Wash-ington, DC: U.S. Government Printing Office.
———. 1994e. Statement of Carlos Fernández, President of the Association of Multi-ethnic Americans: Hearings before the Subcommittee on Census, Statistics andPostal Personnel, 103d Cong., 1st sess., June 30, 1993, ser. no. 103–7, pp.127–157. Washington, DC: U.S. Government Printing Office.
———. 1994f. Statement of Harry A. Scarr, Acting Director, Bureau of the Census:Hearings before the Subcommittee on Census, Statistics and Postal Personnel,103d Cong., 1st sess., June 30, 1993, ser. no. 103-7, pp. 3–17. Washington,DC: U.S. Government Printing Office.
———. 1994g. Statement of Helen Hatab Samhan, Deputy Director, Arab AmericanInstitute: Hearings before the Subcommittee on Census, Statistics and Postal Per-sonnel, 103d Cong., 1st sess., July 29, 1993, ser. no. 103-7, pp. 185–196. Wash-ington, DC: U.S. Government Printing Office.
———. 1994h. Statement of Hon. Norman Y. Mineta, Representative in Congressfrom California: Hearings before the Subcommittee on Census, Statistics andPostal Personnel, 103d Cong., 1st sess., June 1993, ser. no. 103-7, pp. 208–231.Washington, DC: U.S. Government Printing Office.
———. 1994i. Statement of Leonard J. Biermann, Acting Director, Office of FederalContract Compliance Programs, Employment Standards Administration, U.S.Department of Labor: Hearings before the Subcommittee on Census, Statistics andPostal Personnel, 103d Cong., 1st sess., November 3, 1993, ser. no. 103–7, pp.282–285. Washington, DC: U.S. Government Printing Office.
258 REFERENCES
———. 1994j. Statement of Manning Feinlieb, Director of the National Center for Ed-ucation Statistics: Hearings before the Subcommittee on Census, Statistics andPostal Personnel, 103 Cong., 1st sess., April 14, 1993, ser. no. 103-7, pp. 70–83.Washington, DC: U.S. Government Printing Office.
———. 1994k. Statement from the Mexican American Legal Defense and EducationFund Representative: Hearings before the Subcommittee on Census, Statistics andPostal Personnel, on Review of Federal Measurements of Race and Ethnicity, 103dCong., 1st sess., June 30, 1993, ser. no. 103–7, pp. 178–182. Washington, DC:U.S. Government Printing Office.
———. 1994l. Statement of Rachel A. Joseph, Interim Executive Director, NationalCongress of American Indians: Hearings before the Subcommittee on Census, Sta-tistics and Postal Personnel, 103d Cong., 1st sess., July 29, 1993, ser. no. 103-7, pp. 237–245. Washington, DC: U.S. Government Printing Office.
———. 1994m. Statement of Reynolds Farley, Research Scientist, PopulationStudies Center, University of Michigan: Hearings before the Subcommittee onCensus, Statistics and Postal Personnel, 103 Cong., 1st sess., April 14, 1993,ser. no. 103-7, pp. 47–70. Washington, DC: U.S. Government PrintingOffice.
———. 1994n. Statement of Sally Katzen, Administrator, Office of Information andRegulatory Affairs, Office of Management and Budget: Hearings before the Sub-committee on Census, Statistics and Postal Personnel, 103d Cong., 1st sess., July29, 1993, ser. no. 103-7, pp. 213–220. Washington, DC: U.S. GovernmentPrinting Office.
———. 1994o. Statement of Senator Daniel K. Akaka, Senator in Congress from theState of Hawaii: Hearings before the Subcommittee on Census, Statistics andPostal Personnel, 103d Cong., 1st sess., July 29, 1993, ser. no. 103-7, pp.185–196. Washington, DC: U.S. Government Printing Office.
———. 1994p. Statement of Sonia Pérez, Senior Policy Analyst, National Council ofLa Raza: Hearings before the Subcommittee on Census, Statistics and Postal Per-sonnel, 103d Cong., 1st sess., June 30, 1993, ser. no. 103-7, pp. 171–178.Washington, DC: U.S. Government Printing Office.
———. 1994q. Statement of Susan Graham, Executive Director of Project RACE:Hearings before the Subcommittee on Census, Statistics and Postal Personnel, ofthe Committee on Post Office and Civil Service, House of Representatives,103d Cong., 1st sess., June 30, 1993, ser. no. 103-7, pp. 105–127. Washington,DC: U.S. Government Printing Office.
———. 1994r. Testimony and Prepared Statement of Henry Der of the National Coali-tion for an Accurate Count of Asians and Pacific Islanders: Hearings before theSubcommittee on Census, Statistics and Postal Personnel, 103d Cong., 1st sess.,June 30, 1993, ser. no. 103-7, pp. 92–105. Washington, DC: U.S. GovernmentPrinting Office.
U.S. House of Representatives. 1883. The Miscellaneous Documents of the House of
REFERENCES 259

Representatives for the Second Session of the Forty-Seventh Congress, 1882–‘83.Vol. 13. Washington, DC: U.S. Government Printing Office.
U.S. House of Representatives. 1895. The Miscellaneous Documents of the House ofRepresentatives for the First Session of the Fifty-Second Congress, (1895),1891–‘92. Vol. 50, part 8. Washington, DC: U.S. Government Printing Office.
———. 1994. Committee on Post Office and Civil Service, Subcommittee onCensus, Statistics and Postal Personnel. Hearings on the Review of FederalMeasurements of Race and Ethnicity, 103d Cong., 1st sess., April 14, June 30,July 29, and November 3, 1993, ser. no. 103-7. Washington, DC: U.S. Gov-ernment Printing Office.
U.S. Immigration Commission, 1907–1910. 1911. [Also known as the DillinghamCommission.] Washington, DC: U.S. Government Printing Office.
U.S. Office of Management and Budget (OMB). 1995. “Standards for the Classi-fication of Federal Data on Race and Ethnicity; Notice.” Federal Register,part 6, vol. 60, no. 166, pp. 44674–44693, August 28.
———. 1997a. “Recommendations from the Interagency Committee for the Re-view of the Racial and Ethnic Standards to the Office of Management andBudget Concerning Changes to the Standards for the Classification of Fed-eral Data on Race and Ethnicity; Notice.” Federal Register, 62: 131:36874–36946, July 9.
———. 1997b. “Revisions to the Standards for the Classification of FederalData on Race and Ethnicity; Notices.” Federal Register, 62:210:58782–58790,October 30.
———. 1999. “Provisional Guidance on the Implementation of the 1997Standards for the Collection of Federal Data on Race and Ethnicity.”Prepared by Tabulation Working Group, Interagency Committee for theReview of Standards for Data on Race and Ethnicity, Washington, DC,February 17.
U.S. Secretary of the Interior. 1852. History and Statistics of the State of Maryland:According to the Returns of the Seventh Census of the United States: 1850. Pre-pared by Jos. C. G. Kennedy, Superintendent of Census, Washington, DC:Printed by Gideon and Co.
———. 1853a. The Seventh Census of the United States: 1850 Embracing a Statisti-cal View of Each of the States and Territories Arranged by County, Towns, Etc. J.D. B. De Bow, Superintendent of the United States Census, Washington,DC: Robert Armstrong, Public Printer.
———. 1853b. The Seventh Census: Report of the Superintendent of the Census forDecember 1, 1852 (to Which Is Appended the Report for December 1, 1851).Printed by Order of the House of Representatives of the United States.Washington, DC: Robert Armstrong, Public Printer.
———. 1872a. A Compendium of the Ninth Census (June 1, 1870). Concurrent Res-olution of Congress and under the Direction of the Secretary of the Interior,
260 REFERENCES
Francis Walker, Superintendent of Census, Washington, DC: U.S. Govern-ment Printing Office.
———. 1872b. The Statistics of the Population of the United States Embracing the Ta-bles of Race, Nationality, Sex, Selected Ages, and Occupations, Ninth Census—Volume I., to Which Are Added the Statistics of School Attendance and Illiteracy,of Schools, Libraries, Newspapers and Periodicals, Churches, Pauperism andCrime, and of Areas, Families, and Dwellings. Compiled from the Original Re-turns of the Ninth Census (June 1, 1870) under the Direction of the Secre-tary of the Interior, Francis Walker, Superintendent of Census, Washington,DC: U.S. Government Printing Office.
U.S. Statutes at Large. 1856. U.S. Statutes at Large, 6th–12th Cong., 1799–1813.Vol. 2, ed. Richard Peters, Esq.. Boston: Little, Brown.
———. 1963. Vol. 3, ed. Richard Peters, Esq. Buffalo, NY: Dennis and Co.Valcarcel, Carmen Luz. 1994. “Growing up Black in Puerto Rico.” In Challenging
Racism and Sexism: Alternatives to Genetic Explanations, ed. Ethel Tobach andBetty Rosoff. New York: Feminist Press.
Valenzuela, Abel. 1991. “Hispanic Poverty: Is It an Immigrant Problem?” His-panic Journal of Social Policy 5: 59–82.
Valverde, Kieu-Linh Caroline. 1992. “From Dust to Gold: The Vietnamese Am-erasian Experience.” In Racially Mixed People in America, ed. Maria P. P.Root. Newbury Park, CA: Sage.
van den Berghe, Pierre L. 1960. “Hypergamy, Hypergenation, and Miscegena-tion.” Human Relations 13: 83–91.
———. 1981. The Ethnic Phenomenon. New York: Elsevier.Vobejda, Barbara. 1991. “Categorizing the Nation’s Millions of ‘Other Race.’”
Washington Post, April 29, p. A9.———. 1998. “Hispanic Youths Outnumber Blacks: Federal Report Reveals
Crest of Wave That Will Reshape U.S. Demographic Mosaic,” WashingtonPost, July 15, pp. A02-20.
Wacquant, Loic. 1994. “Review of F. James Davis, Who Is Black? One Nation’sDefinition.” In Theory and Society 23 (6) (December): 9-2-908.
Wade, Peter. 1985. “Race and Class: the Case of South American Blacks.” Ethnicand Racial Studies 8 (2): 233–249.
Wagley, Charles. 1965. “On the Concept of Social Race in the Americas.” In Con-temporary Cultures and Societies of Latin America: A Reader in the Social An-thropology of Middle and South America and the Caribbean, ed. Dwight B.Heath and Richard N. Adams. New York: Random House.
Wallman, Katherine. 1994. “Concluding Remarks by the Director of the Officeof Information and Regulatory Affairs, Office of Management and Bud-get.” Paper presented at the Workshop on Race and Ethnicity Classifica-tion, Committee on National Statistics, National Academy of Sciences,Washington, DC, February 17–18.
REFERENCES 261

Wallman, Katherine. 1999. “Draft Provisional Guidance on the Implementationof the 1997 Standards for the Collection of Federal Data on Race and Eth-nicity.” Washington, DC: Executive Office of the President, Office of Man-agement and Budget.
Washburn, S. L. 1963. “The Study of Race.” American Anthropologist 65: 521–531.Waters, Mary. 1990. Ethnic Options: Choosing Identities in America. Berkeley and
Los Angeles: University of California Press.———. 1993. “From Majority to Minority Status: Identity Development among
Caribbean Immigrants and Their Children in New York City.” Paper pre-sented at the American Studies Conferences, Boston, November 6.
Webster’s Collegiate Dictionary. 1898. 1910. 1916. 1931. 1936. 1959. 1963. 1973.1983. 1990. 1994. (1st–9th eds.). Springfield, MA: Merriam-Webster.
Weissman, Albert. 1990. “Race-Ethnicity: A Dubious Scientific Concept.” PublicHealth Reports 105 (1) (January/February): 102–103.
White, Philip H., and David L. Pearce. 1993. “Ethnic Group and the British Cen-sus.” In Challenges of Measuring an Ethnic World: Science, Politics and Reality,ed. Statistics Canada and U.S. Bureau of the Census. Washington, DC: U.S.Government Printing Office.
Williams, Eric. 1984. From Columbus to Castro: The History of the Caribbean,1492–1969. New York: Random House.
Williams, Teresa Kay. 1992. “Prism Lives: Identity of Binational Amerasians.” InRacially Mixed People in America, ed. Maria P. P. Root. Newbury Park, CA:Sage.
Williamson, J. 1984. New People: Miscegenation and Mulattoes in the United States.New York: New York University Press.
Wills, Christopher. 1994. “The Skin We’re In.” Discover, November, pp. 76–81.Wilson, Terry P. 1992. “Blood Quantum: Native American Mixed Bloods.” In
Racially Mixed People in America, ed. Maria P. P. Root. Newbury Park, CA:Sage.
Winant, Howard. 1992. “Rethinking Race in Brazil.” Journal of Latin AmericanStudies 24: 173–192.
Wingerd, Judith. 1995. “Cognitive Interviews with Foreign Born Blacks: CensusRace and Ancestry Questions.” Final Report submitted to the Statistical Re-search Division, Center for Survey Methods Research, Bureau of the Cen-sus. Washington, DC: U.S. Bureau of the Census.
Wood, Joe. 1994. “Fade to Black: Once upon a Time in Multiracial America.” Vil-lage Voice, December 6, pp. 25–34.
Woodrow-Lafield, Karen A. 1992. “A Consideration of the Effect of ImmigrationReform on the Number of Undocumented Residents in the United States.”Population and Policy Review 11: 117–144.
———. 1993. “Finding an Upper Limit on Recent Net Undocumented Migra-tion to the United States.” Revised version of a paper presented at the an-
262 REFERENCES

nual meeting of the American Sociological Association, August 13–17,Miami Beach.
Wright, Carroll D. 1956. History and Growth of the United States Census. NewYork: 1900 government report reprinted by the Johnson Reprint Co. Placeof publication not indicated.
Wright, Lawrence. 1994. “One Drop of Blood.” New Yorker, July 25, pp. 46–54.Wright, Winthrop R. 1990. Cafe Con Leche: Race, Class and National Image in
Venezuela. Austin: University of Texas Press.Yinger, John. 1995. Closed Doors, Opportunities Lost: The Continuing Cost of Hous-
ing Discrimination. New York: Russell Sage Foundation.Zack, Naomi, ed. 1995. American Mixed Race: The Culture of Microdiversity. Lan-
tham, MD: Rowan & Littlefield.
REFERENCES 263


About the Author
C L A R A E . RO D R Í G U E Z is a Professor of Sociology at Fordham Uni-versity’s College at Lincoln Center. She has been a Visiting Professor atColumbia Unitersity, MIT, and Yale University. She has also been a Se-nior Fellow at the Smithsonian Institution’s National Museum of Amer-ican History and a Visiting Scholar at the Russell Sage Foundation. Pre-viously, she was the Dean of Fordham University’s College of LiberalStudies. Her most recent book is Latin Looks: Images of Latinas and Lati-nos in the U.S. Media (Boulder, CO: Westview Press, 1997).
283