Claims Audit Benchmarking Survey · Claims Audit Benchmarking Survey Athenium Introduction This...
22
WHITE PAPER Claims Audit Benchmarking Survey An in-depth survey of current audit practices and procedures in insurance claims Athenium PERFORMANCE IMPROVEMENT SOLUTIONS An in-depth survey of current audit practices and procedures in insurance claims
Transcript of Claims Audit Benchmarking Survey · Claims Audit Benchmarking Survey Athenium Introduction This...
W H I T E P A P E R
Claims Audit Benchmarking Survey
An in-depth survey of current audit practices
and procedures in insurance claims
Athenium
PERfoRmAnCE ImPRovEmEnT SoluTIonS
An in-depth survey of current audit practices and procedures in insurance claims
Claims Audit Benchmarking Survey
Athenium
ConTEnTS
1: Executive Summary 3
2: Introduction 5
3: methodology 5
4: Where QA Stands Today 7
5: Key findings 8
Audit GoAls 8
EvAluAtion MEtrics 9
Audit tools 10
Audit stAffinG 12
Audit frEquEncy 13
rEportinG 13
rEsults 17
currEnt proGrAM 17
6: Conclusion 19
7: Appendix: 20
coMMEnts froM rEspondEnts on chAnGinG thE Audit procEss
2
Claims Audit Benchmarking Survey
Athenium
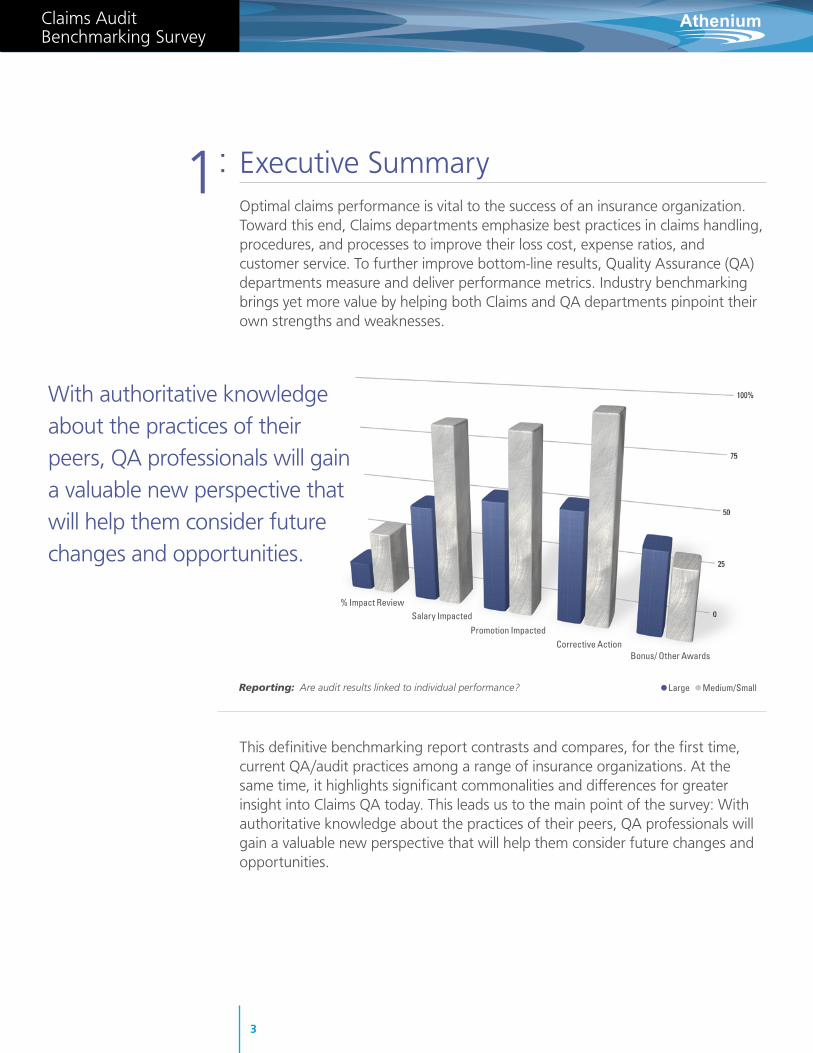
Executive Summaryoptimal claims performance is vital to the success of an insurance organization. Toward this end, Claims departments emphasize best practices in claims handling, procedures, and processes to improve their loss cost, expense ratios, and customer service. To further improve bottom-line results, Quality Assurance (QA) departments measure and deliver performance metrics. Industry benchmarking brings yet more value by helping both Claims and QA departments pinpoint their own strengths and weaknesses.
This definitive benchmarking report contrasts and compares, for the first time, current QA/audit practices among a range of insurance organizations. At the same time, it highlights significant commonalities and differences for greater insight into Claims QA today. This leads us to the main point of the survey: With authoritative knowledge about the practices of their peers, QA professionals will gain a valuable new perspective that will help them consider future changes and opportunities.
1:
Reporting: Are audit results linked to individual performance? • Large • Medium/Small
With authoritative knowledge about the practices of their peers, QA professionals will gain a valuable new perspective that will help them consider future changes and opportunities.
% Impact Review Salary Impacted
Promotion ImpactedCorrective Action
Bonus/ Other Awards
3
Claims Audit Benchmarking Survey
Athenium
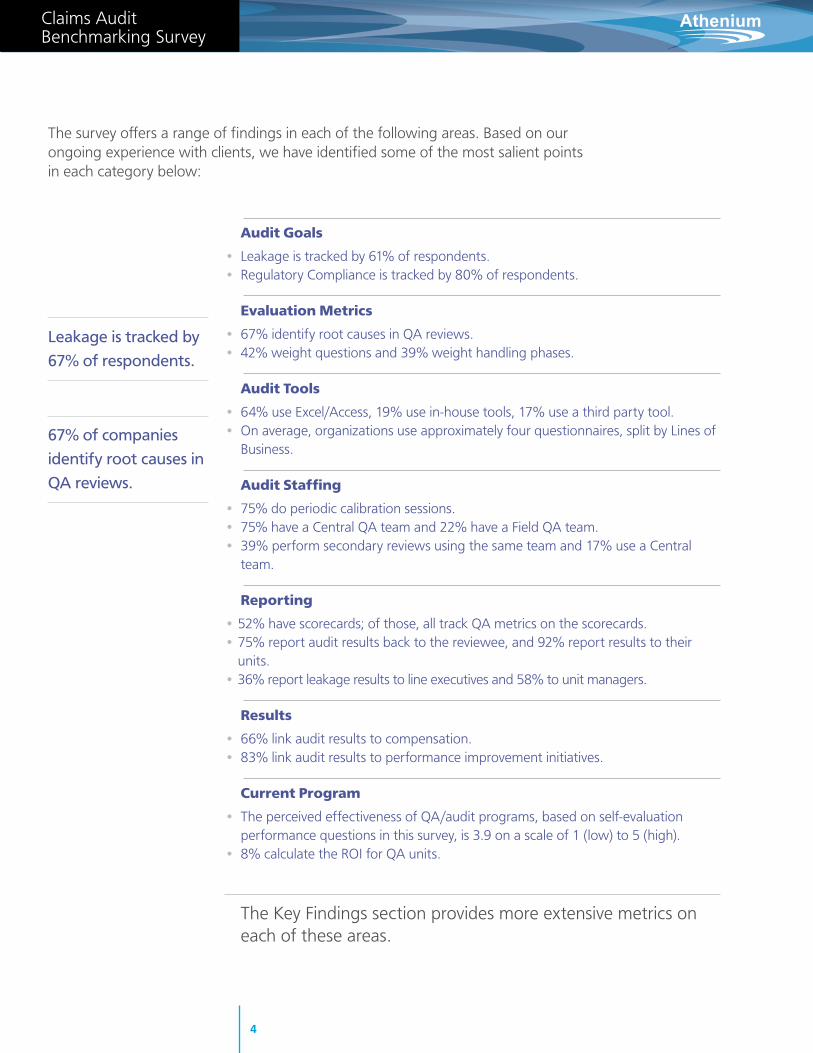
The survey offers a range of findings in each of the following areas. Based on our ongoing experience with clients, we have identified some of the most salient points in each category below:
Audit Goals
• leakage is tracked by 61% of respondents. • Regulatory Compliance is tracked by 80% of respondents.
Evaluation Metrics
• 67% identify root causes in QA reviews. • 42% weight questions and 39% weight handling phases.
Audit tools
• 64% use Excel/Access, 19% use in-house tools, 17% use a third party tool.• on average, organizations use approximately four questionnaires, split by lines of
Business.
Audit staffing
• 75% do periodic calibration sessions.• 75% have a Central QA team and 22% have a field QA team. • 39% perform secondary reviews using the same team and 17% use a Central
team.
reporting
• 52% have scorecards; of those, all track QA metrics on the scorecards.• 75% report audit results back to the reviewee, and 92% report results to their
units.• 36% report leakage results to line executives and 58% to unit managers.
results
• 66% link audit results to compensation.• 83% link audit results to performance improvement initiatives.
current program
• The perceived effectiveness of QA/audit programs, based on self-evaluation performance questions in this survey, is 3.9 on a scale of 1 (low) to 5 (high).
• 8% calculate the RoI for QA units.
The Key findings section provides more extensive metrics on each of these areas.
67% of companies identify root causes in QA reviews.
Leakage is tracked by 67% of respondents.
4
Claims Audit Benchmarking Survey
Athenium
IntroductionThis benchmarking report explores practices and procedures currently used in a variety of Claims Quality Assurance audit programs in the insurance industry. The result of an in-depth survey of industry executives, the results presented here offer a unique perspective on Claims QA programs.
The survey questionnaire focused on these critical issues:
• The goals and outcomes of QA programs for Claims
• Current industry practices and procedures for QA auditing
• Similarities and differences in QA programs
These findings offer a valuable snapshot of how QA executives view the current state of Claims QA today. further, this report can be a useful platform for ongoing discussions about how to strengthen the quality of QA programs in the future. Insurance companies of any size can compare the findings against their own practices to uncover potential opportunities for improvement.
methodologyThe survey questionnaire was created by Athenium account managers and an insurance consultant. The results were reviewed by the Athenium Benchmarking Survey Expert Team consisting of professionals with over 75 years of combined claims auditing and management experience in the Property & Casualty insurance industry.
procEss
Athenium contacted over 100 insurance companies in 2012 to request their participation in a survey about Claims QA programs. In order to encourage participation, companies were informed that respondents would receive a copy of the results as embodied in this white paper.
over a period of several months, executives and QA directors from 36 separate companies responded on behalf of their organizations. Athenium staff conducted the interviews either in person or by phone. The survey includes up to 54 questions and took up to one hour to complete.
2:
3:
5
Claims Audit Benchmarking Survey
Athenium
rEspondEnts
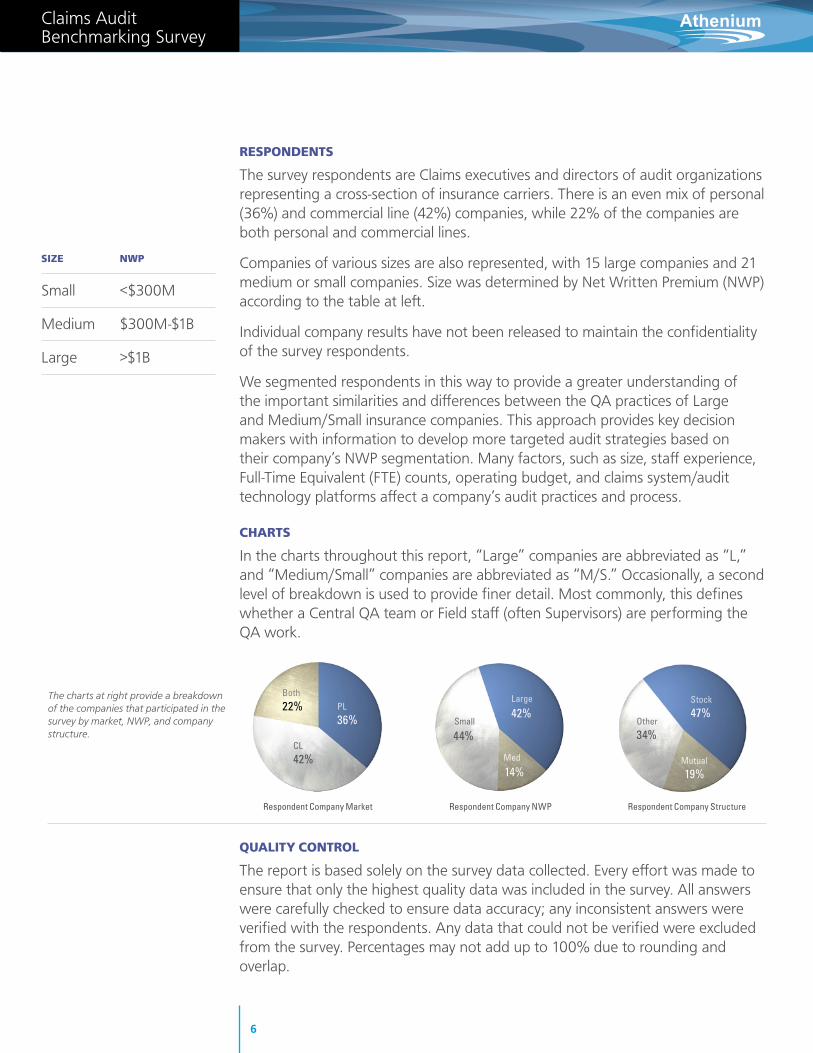
The survey respondents are Claims executives and directors of audit organizations representing a cross-section of insurance carriers. There is an even mix of personal (36%) and commercial line (42%) companies, while 22% of the companies are both personal and commercial lines.
Companies of various sizes are also represented, with 15 large companies and 21 medium or small companies. Size was determined by net Written Premium (nWP) according to the table at left.
Individual company results have not been released to maintain the confidentiality of the survey respondents.
We segmented respondents in this way to provide a greater understanding of the important similarities and differences between the QA practices of large and medium/Small insurance companies. This approach provides key decision makers with information to develop more targeted audit strategies based on their company’s nWP segmentation. many factors, such as size, staff experience, full-Time Equivalent (fTE) counts, operating budget, and claims system/audit technology platforms affect a company’s audit practices and process.
chArts
In the charts throughout this report, “large” companies are abbreviated as “l,” and “medium/Small” companies are abbreviated as “m/S.” occasionally, a second level of breakdown is used to provide finer detail. most commonly, this defines whether a Central QA team or field staff (often Supervisors) are performing the QA work.
quAlity control
The report is based solely on the survey data collected. Every effort was made to ensure that only the highest quality data was included in the survey. All answers were carefully checked to ensure data accuracy; any inconsistent answers were verified with the respondents. Any data that could not be verified were excluded from the survey. Percentages may not add up to 100% due to rounding and overlap.
sizE nWp
Small <$300m
medium $300m-$1B
large >$1B
The charts at right provide a breakdown of the companies that participated in the survey by market, NWP, and company structure.
Respondent Company Market
Both 22%
CL 42%
PL 36%
Respondent Company NWP
Small
44%
Med
14%
Large
42%
Respondent Company Structure
Other
34%
Mutual
19%
Stock 47%
6
Claims Audit Benchmarking Survey
Athenium
Where QA Stands Today Currently, most insurance carriers conduct their own internal audits. Historically,
audit practices and procedures are developed within a company, as well as being influenced by other practices brought in by staff as they moved from prior employers.
This survey report demonstrates that practices that have evolved in different companies are more remarkable for their differences in formats and protocols than for common characteristics.
Based on survey results, conversations with respondents and clients, and industry experience, we have found that differences are due to variations in:
• Book of business
• operating budgets
• Experiences based on prior audit findings conducted by outside CPA auditors and by state insurance departments
• Claims handling platforms and whether claims files are imaged or paper-based
• loss/expense ratio results that may drive the need for audits
• Company size, with larger companies tending to have more comprehensive and structured audits than smaller companies
• lack of any general industry standard for internal claims audits
• Experience level, fTE counts, competence, and credibility of personnel who conduct the audits
• Whether or not managers and supervisors perform the auditing function as part of their regular duties
• management’s philosophy and approach to identifying and addressing performance issues with work product, work flows, and unit size
• The rigor with which the company initiates and pursues post-audit action plans
4:
7
Claims Audit Benchmarking Survey
Athenium
Key findings
5.1 Audit GoAls
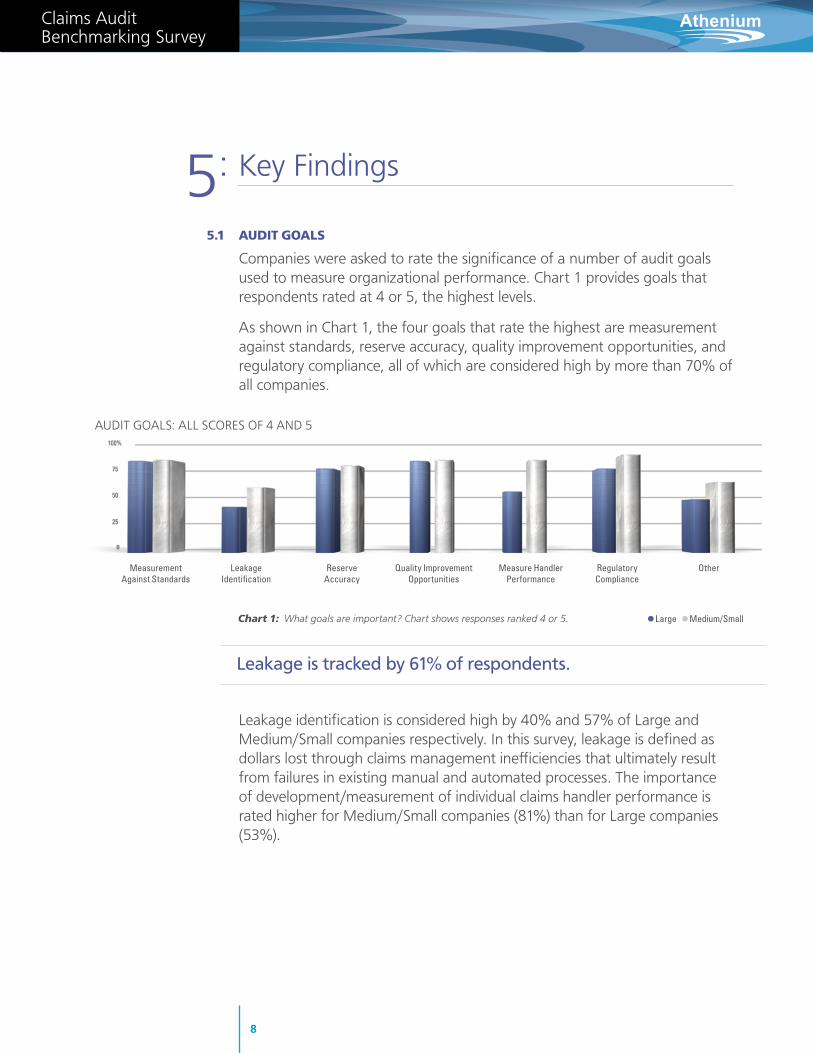
Companies were asked to rate the significance of a number of audit goals used to measure organizational performance. Chart 1 provides goals that respondents rated at 4 or 5, the highest levels.
As shown in Chart 1, the four goals that rate the highest are measurement against standards, reserve accuracy, quality improvement opportunities, and regulatory compliance, all of which are considered high by more than 70% of all companies.
leakage identification is considered high by 40% and 57% of large and medium/Small companies respectively. In this survey, leakage is defined as dollars lost through claims management inefficiencies that ultimately result from failures in existing manual and automated processes. The importance of development/measurement of individual claims handler performance is rated higher for medium/Small companies (81%) than for large companies (53%).
5:
Leakage is tracked by 61% of respondents.
Chart 1: What goals are important? Chart shows responses ranked 4 or 5. • Large • Medium/Small
AudIT GoAlS: All SCoRES of 4 And 5
Measurement Leakage Reserve Quality Improvement Measure Handler Regulatory Other Against Standards Identification Accuracy Opportunities Performance Compliance
8
Claims Audit Benchmarking Survey
Athenium
Central
LOB
Field
5.2 EvAluAtion MEtrics
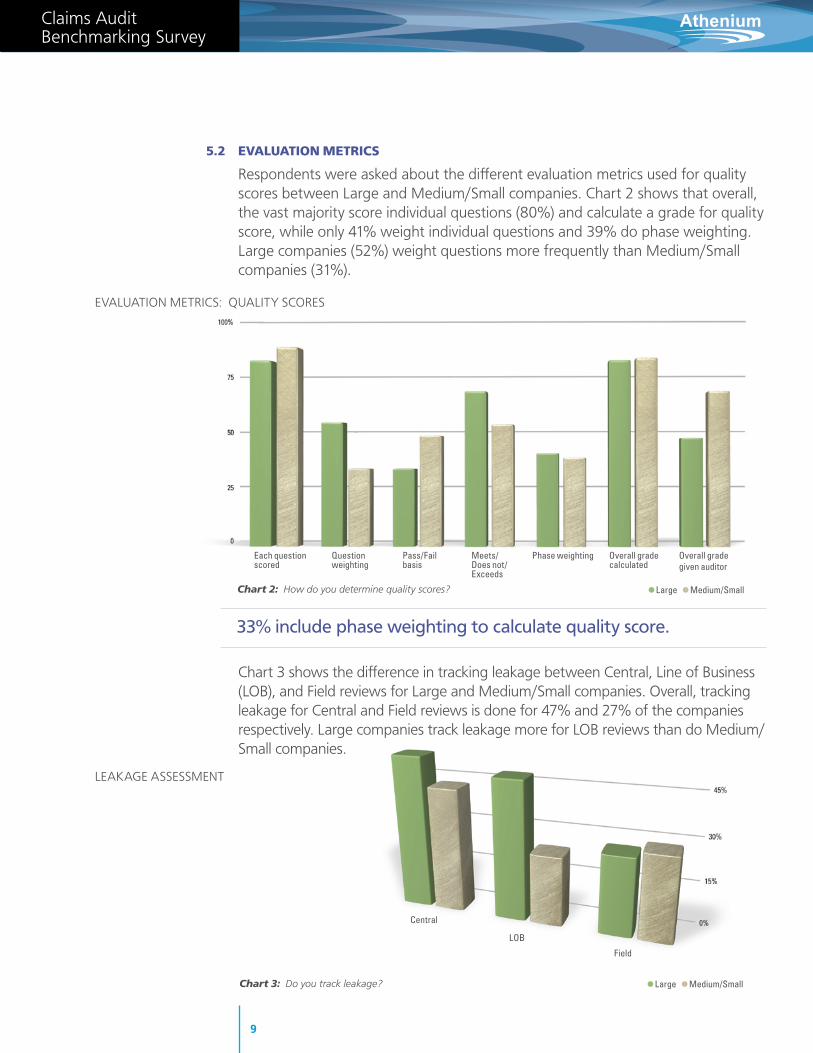
Respondents were asked about the different evaluation metrics used for quality scores between large and medium/Small companies. Chart 2 shows that overall, the vast majority score individual questions (80%) and calculate a grade for quality score, while only 41% weight individual questions and 39% do phase weighting. large companies (52%) weight questions more frequently than medium/Small companies (31%).
Chart 3 shows the difference in tracking leakage between Central, line of Business (loB), and field reviews for large and medium/Small companies. overall, tracking leakage for Central and field reviews is done for 47% and 27% of the companies respectively. large companies track leakage more for loB reviews than do medium/Small companies.
Chart 3: Do you track leakage? • Large • Medium/Small
• Large • Medium/SmallChart 2: How do you determine quality scores?
Each question scored
Question weighting
Pass/Fail basis
Meets/ Does not/Exceeds
Phase weighting Overall grade calculated
Overall grade given auditor
EvAluATIon mETRICS: QuAlITy SCoRES
lEAKAGE ASSESSmEnT
33% include phase weighting to calculate quality score.
9
Claims Audit Benchmarking Survey
Athenium
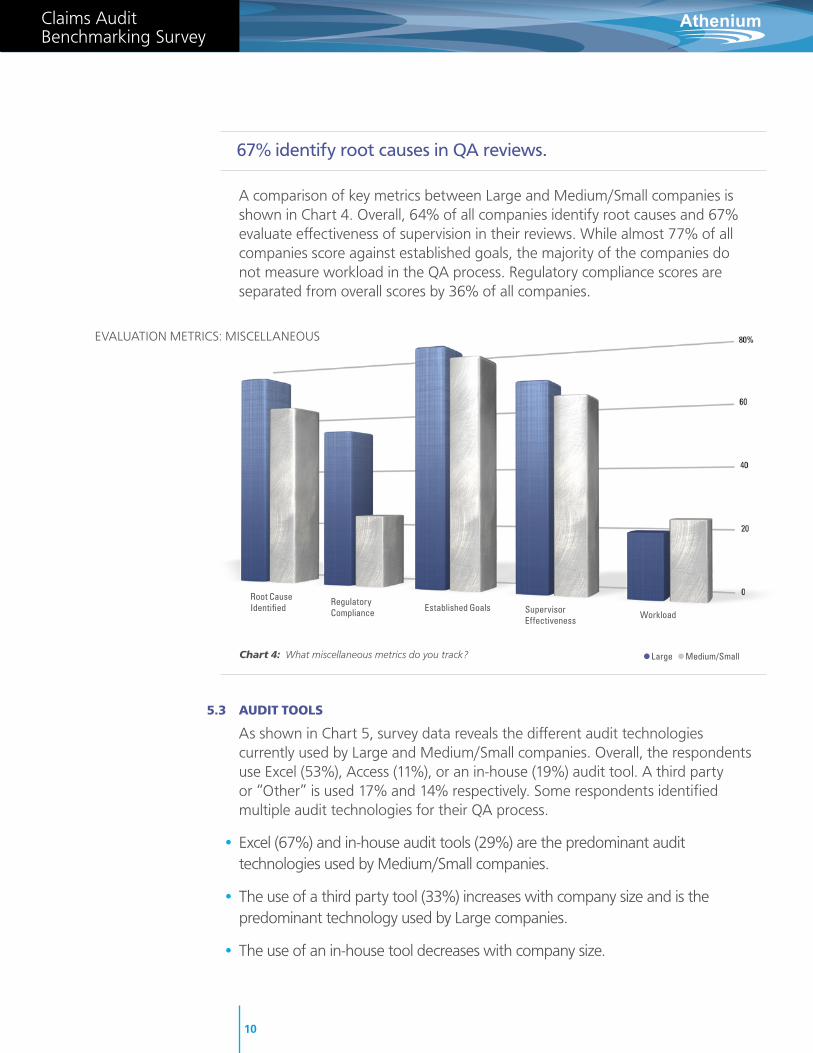
A comparison of key metrics between large and medium/Small companies is shown in Chart 4. overall, 64% of all companies identify root causes and 67% evaluate effectiveness of supervision in their reviews. While almost 77% of all companies score against established goals, the majority of the companies do not measure workload in the QA process. Regulatory compliance scores are separated from overall scores by 36% of all companies.
5.3 Audit tools
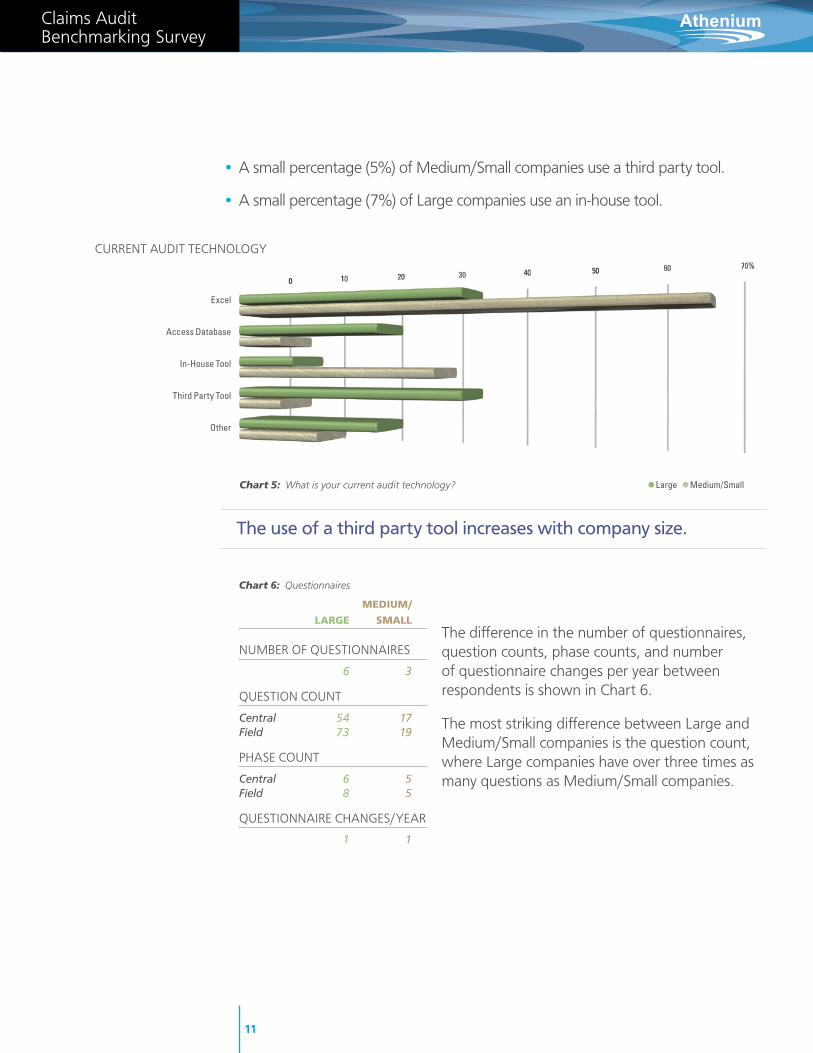
As shown in Chart 5, survey data reveals the different audit technologies currently used by large and medium/Small companies. overall, the respondents use Excel (53%), Access (11%), or an in-house (19%) audit tool. A third party or “other” is used 17% and 14% respectively. Some respondents identified multiple audit technologies for their QA process.
• Excel (67%) and in-house audit tools (29%) are the predominant audit technologies used by medium/Small companies.
• The use of a third party tool (33%) increases with company size and is the predominant technology used by large companies.
• The use of an in-house tool decreases with company size.
Chart 4: What miscellaneous metrics do you track? • Large • Medium/Small
Root Cause Identified
Regulatory Compliance Established Goals Supervisor
EffectivenessWorkload
EvAluATIon mETRICS: mISCEllAnEouS
67% identify root causes in QA reviews.
10
Claims Audit Benchmarking Survey
Athenium
The difference in the number of questionnaires, question counts, phase counts, and number of questionnaire changes per year between respondents is shown in Chart 6.
The most striking difference between large and medium/Small companies is the question count, where large companies have over three times as many questions as medium/Small companies.
Chart 6: Questionnaires MEdiuM/
lArGE sMAll
numBER of QuESTIonnAIRES
6 3
QuESTIon CounT
Central 54 17 Field 73 19
PHASE CounT
Central 6 5 Field 8 5
QuESTIonnAIRE CHAnGES/yEAR
1 1
Excel
Access Database
In-House Tool
Third Party Tool
Other
Chart 5: What is your current audit technology? • Large • Medium/Small
CuRREnT AudIT TECHnoloGy
The use of a third party tool increases with company size.
• A small percentage (5%) of medium/Small companies use a third party tool.
• A small percentage (7%) of large companies use an in-house tool.
11
Claims Audit Benchmarking Survey
Athenium
5.4 Audit stAffinG
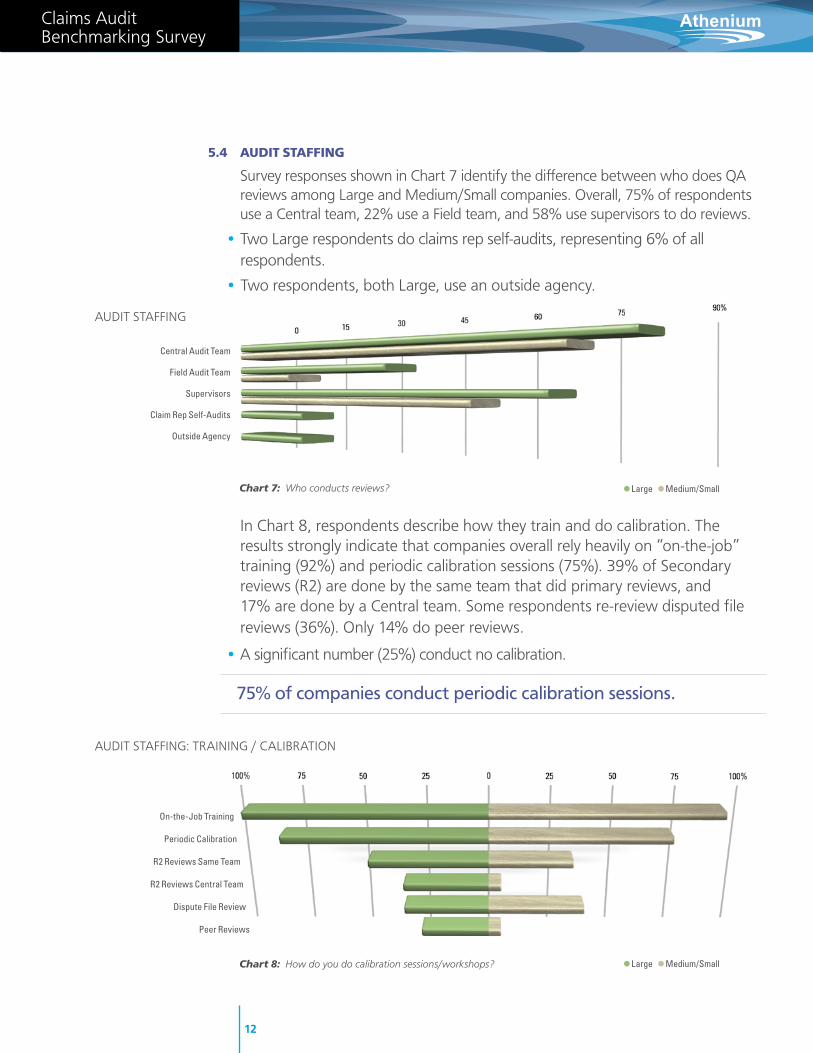
Survey responses shown in Chart 7 identify the difference between who does QA reviews among large and medium/Small companies. overall, 75% of respondents use a Central team, 22% use a field team, and 58% use supervisors to do reviews.
• Two large respondents do claims rep self-audits, representing 6% of all respondents.
• Two respondents, both large, use an outside agency.
In Chart 8, respondents describe how they train and do calibration. The results strongly indicate that companies overall rely heavily on “on-the-job” training (92%) and periodic calibration sessions (75%). 39% of Secondary reviews (R2) are done by the same team that did primary reviews, and 17% are done by a Central team. Some respondents re-review disputed file reviews (36%). only 14% do peer reviews.
• A significant number (25%) conduct no calibration.
AudIT STAffInG
75% of companies conduct periodic calibration sessions.
Chart 8: How do you do calibration sessions/workshops?
AudIT STAffInG: TRAInInG / CAlIBRATIon
On-the-Job Training
Periodic Calibration
R2 Reviews Same Team
R2 Reviews Central Team
Dispute File Review
Peer Reviews
Central Audit Team
Field Audit Team
Supervisors
Claim Rep Self-Audits
Outside Agency
Chart 7: Who conducts reviews?
12
• Large • Medium/Small
• Large • Medium/Small
Claims Audit Benchmarking Survey
Athenium
62% of all companies do monthly supervisory reviews.
Individual Unit LOB Company
Chart 10: Granularity of feedback reporting
13
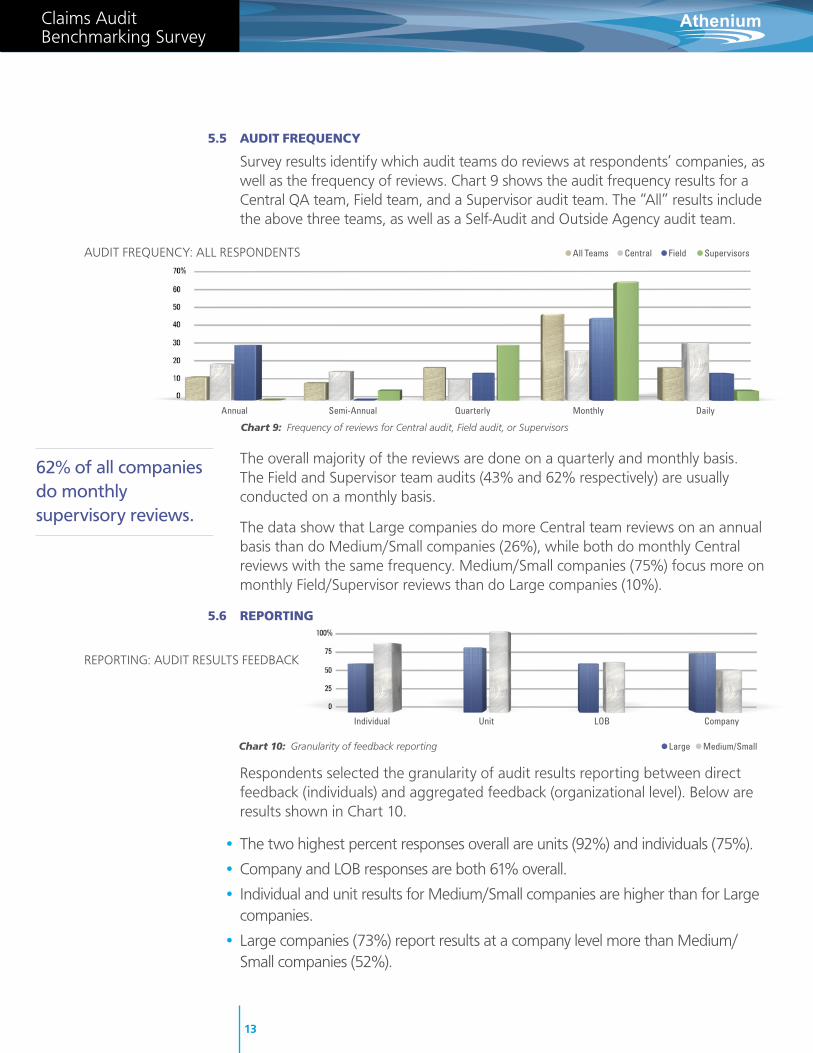
5.5 Audit frEquEncy
Survey results identify which audit teams do reviews at respondents’ companies, as well as the frequency of reviews. Chart 9 shows the audit frequency results for a Central QA team, field team, and a Supervisor audit team. The “All” results include the above three teams, as well as a Self-Audit and outside Agency audit team.
The overall majority of the reviews are done on a quarterly and monthly basis. The field and Supervisor team audits (43% and 62% respectively) are usually conducted on a monthly basis.
The data show that large companies do more Central team reviews on an annual basis than do medium/Small companies (26%), while both do monthly Central reviews with the same frequency. medium/Small companies (75%) focus more on monthly field/Supervisor reviews than do large companies (10%).
5.6 rEportinG
Respondents selected the granularity of audit results reporting between direct feedback (individuals) and aggregated feedback (organizational level). Below are results shown in Chart 10.
• The two highest percent responses overall are units (92%) and individuals (75%).
• Company and loB responses are both 61% overall.
• Individual and unit results for medium/Small companies are higher than for large companies.
• large companies (73%) report results at a company level more than medium/Small companies (52%).
Annual Semi-Annual Quarterly Monthly Daily
AudIT fREQuEnCy: All RESPondEnTS • All Teams • Central • Field • Supervisors
• Large • Medium/Small
REPoRTInG: AudIT RESulTS fEEdBACK
Chart 9: Frequency of reviews for Central audit, Field audit, or Supervisors
Claims Audit Benchmarking Survey
Athenium
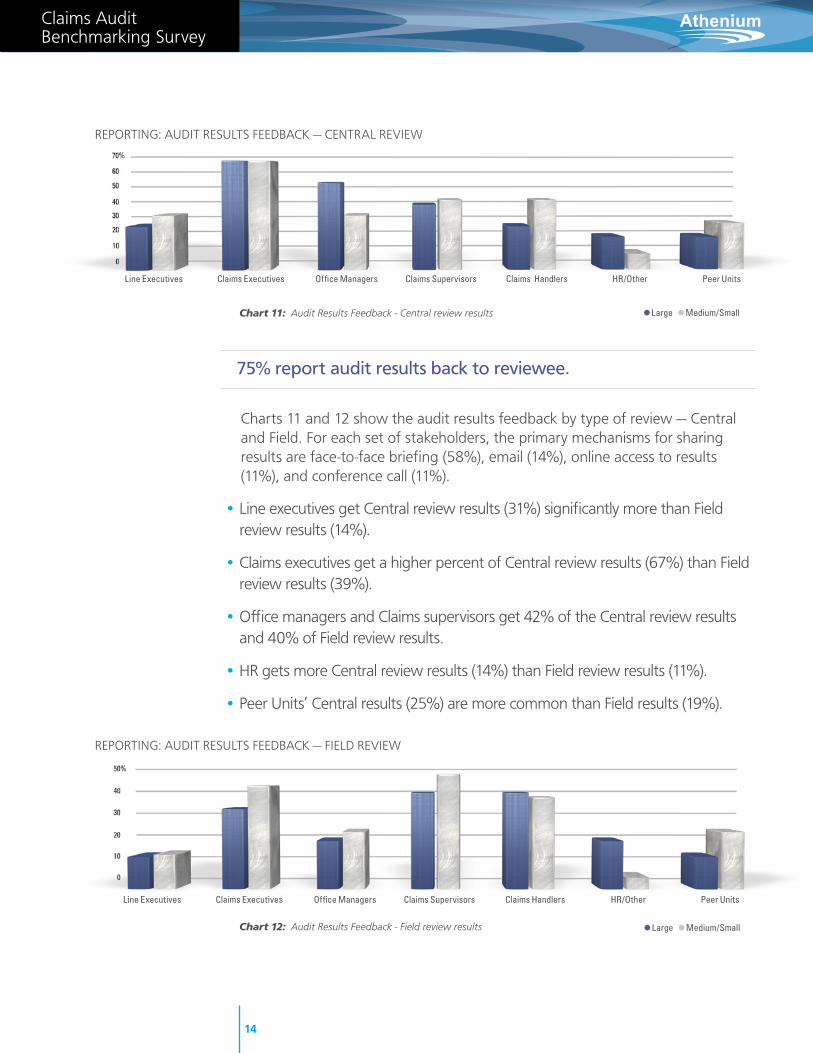
Charts 11 and 12 show the audit results feedback by type of review — Central and field. for each set of stakeholders, the primary mechanisms for sharing results are face-to-face briefing (58%), email (14%), online access to results (11%), and conference call (11%).
• line executives get Central review results (31%) significantly more than field review results (14%).
• Claims executives get a higher percent of Central review results (67%) than field review results (39%).
• office managers and Claims supervisors get 42% of the Central review results and 40% of field review results.
• HR gets more Central review results (14%) than field review results (11%).
• Peer units’ Central results (25%) are more common than field results (19%).
Line Executives Claims Executives Office Managers Claims Supervisors Claims Handlers HR/Other Peer Units
REPoRTInG: AudIT RESulTS fEEdBACK — CEnTRAl REvIEW
Chart 11: Audit Results Feedback - Central review results • Large • Medium/Small
Line Executives Claims Executives Office Managers Claims Supervisors Claims Handlers HR/Other Peer Units
REPoRTInG: AudIT RESulTS fEEdBACK — fIEld REvIEW
Chart 12: Audit Results Feedback - Field review results • Large • Medium/Small
75% report audit results back to reviewee.
14
Claims Audit Benchmarking Survey
Athenium
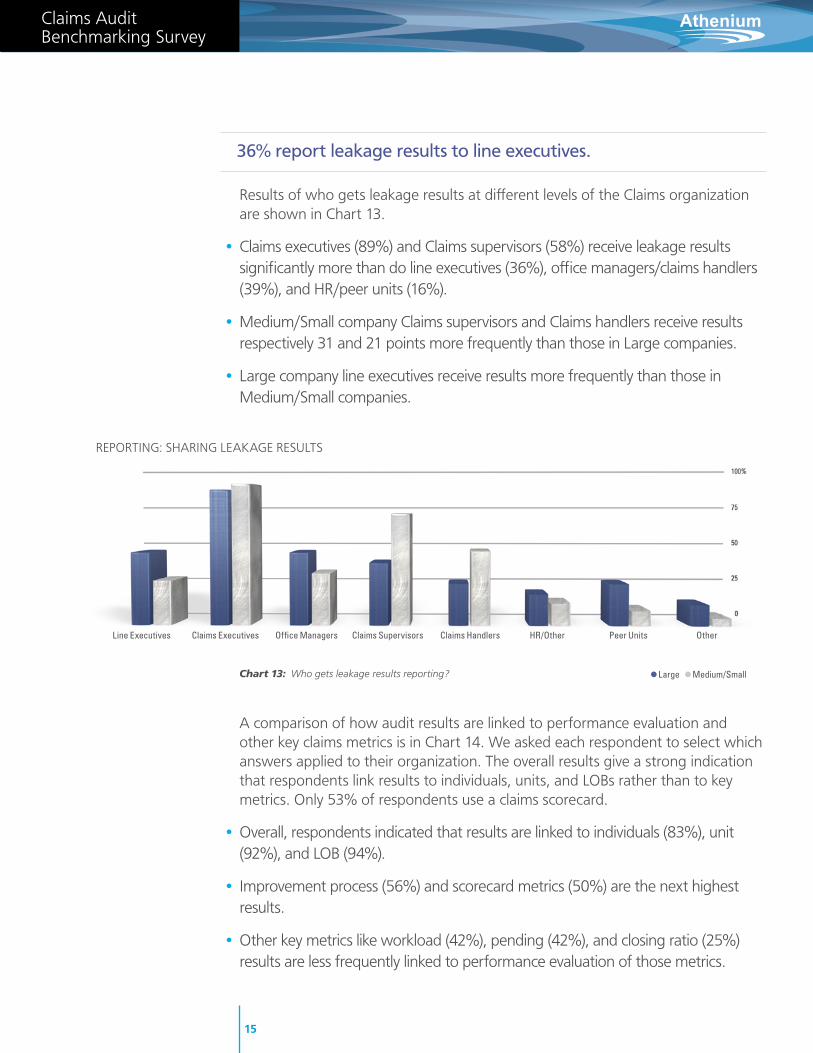
Results of who gets leakage results at different levels of the Claims organization are shown in Chart 13.
• Claims executives (89%) and Claims supervisors (58%) receive leakage results significantly more than do line executives (36%), office managers/claims handlers (39%), and HR/peer units (16%).
• medium/Small company Claims supervisors and Claims handlers receive results respectively 31 and 21 points more frequently than those in large companies.
• large company line executives receive results more frequently than those in medium/Small companies.
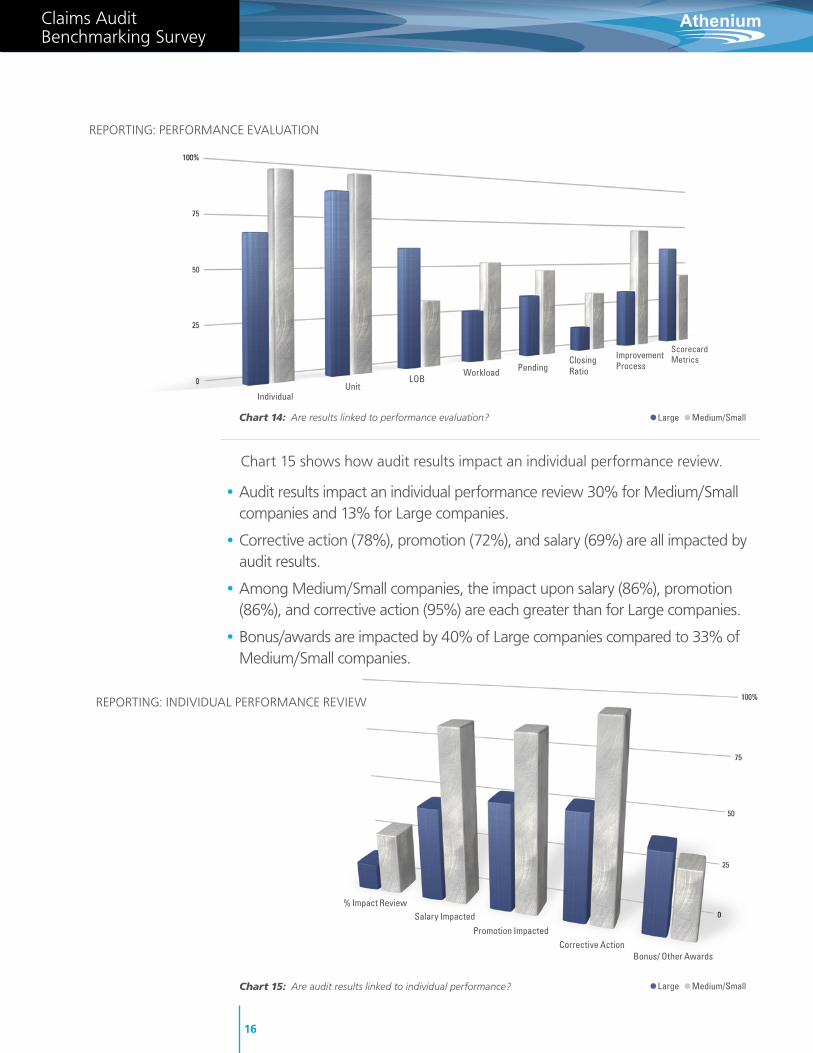
A comparison of how audit results are linked to performance evaluation and other key claims metrics is in Chart 14. We asked each respondent to select which answers applied to their organization. The overall results give a strong indication that respondents link results to individuals, units, and loBs rather than to key metrics. only 53% of respondents use a claims scorecard.
• overall, respondents indicated that results are linked to individuals (83%), unit (92%), and loB (94%).
• Improvement process (56%) and scorecard metrics (50%) are the next highest results.
• other key metrics like workload (42%), pending (42%), and closing ratio (25%) results are less frequently linked to performance evaluation of those metrics.
Line Executives Claims Executives Office Managers Claims Supervisors Claims Handlers HR/Other Peer Units Other
REPoRTInG: SHARInG lEAKAGE RESulTS
Chart 13: Who gets leakage results reporting? • Large • Medium/Small
36% report leakage results to line executives.
15
Claims Audit Benchmarking Survey
Athenium
Chart 15 shows how audit results impact an individual performance review.
• Audit results impact an individual performance review 30% for medium/Small companies and 13% for large companies.
• Corrective action (78%), promotion (72%), and salary (69%) are all impacted by audit results.
• Among medium/Small companies, the impact upon salary (86%), promotion (86%), and corrective action (95%) are each greater than for large companies.
• Bonus/awards are impacted by 40% of large companies compared to 33% of medium/Small companies.
% Impact Review Salary Impacted
Promotion ImpactedCorrective Action
Bonus/ Other Awards
Chart 15: Are audit results linked to individual performance? • Large • Medium/Small
Individual Unit
LOB Workload Pending
Closing Ratio
Improvement Process
Scorecard Metrics
REPoRTInG: PERfoRmAnCE EvAluATIon
Chart 14: Are results linked to performance evaluation? • Large • Medium/Small
REPoRTInG: IndIvIduAl PERfoRmAnCE REvIEW
16
Claims Audit Benchmarking Survey
Athenium
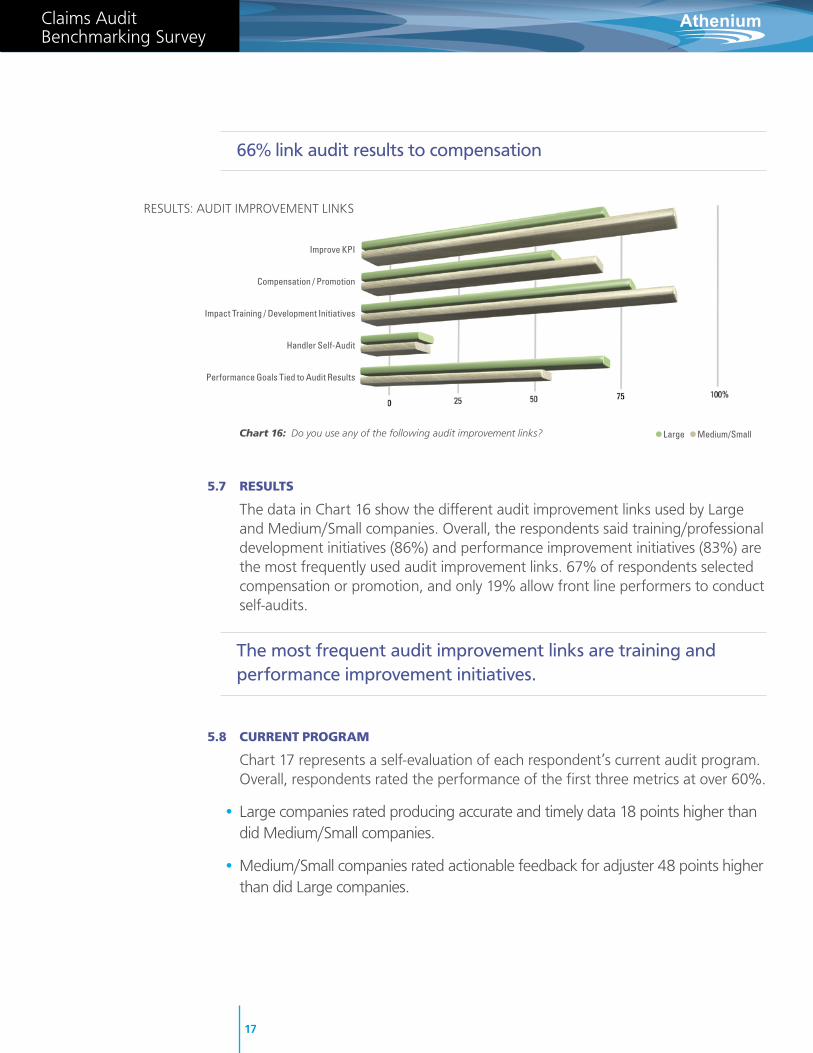
5.7 rEsults
The data in Chart 16 show the different audit improvement links used by large and medium/Small companies. overall, the respondents said training/professional development initiatives (86%) and performance improvement initiatives (83%) are the most frequently used audit improvement links. 67% of respondents selected compensation or promotion, and only 19% allow front line performers to conduct self-audits.
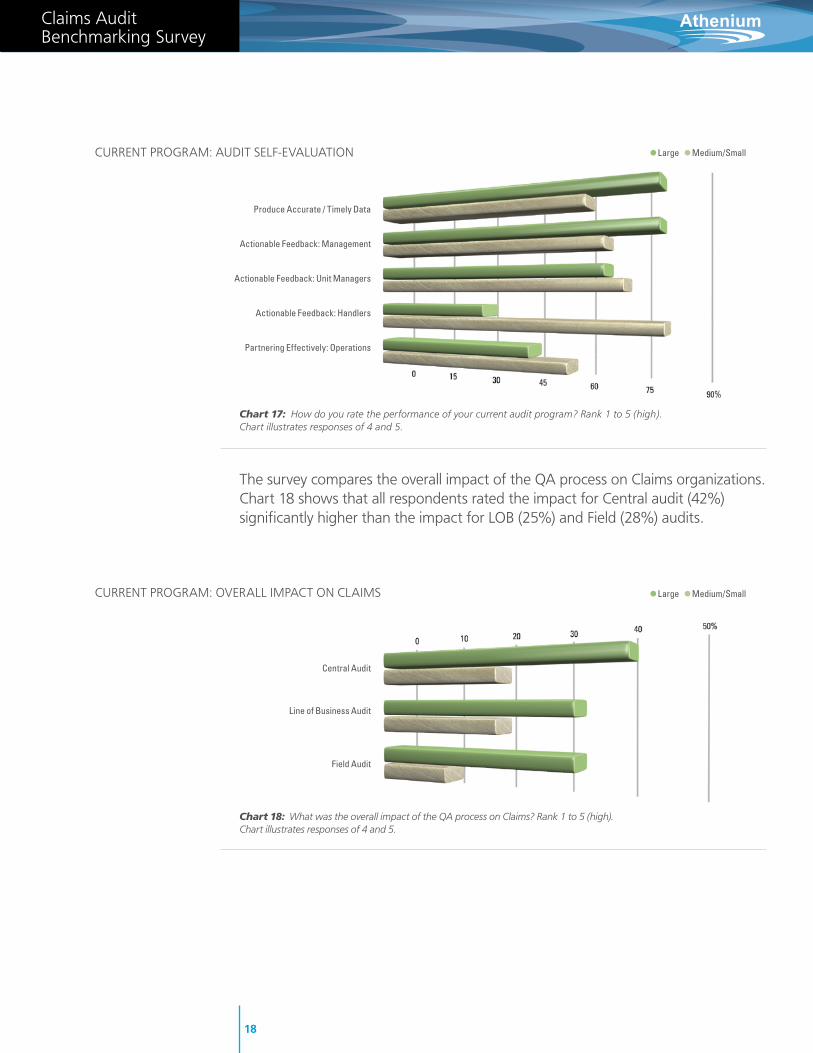
5.8 currEnt proGrAM
Chart 17 represents a self-evaluation of each respondent’s current audit program. overall, respondents rated the performance of the first three metrics at over 60%.
• large companies rated producing accurate and timely data 18 points higher than did medium/Small companies.
• medium/Small companies rated actionable feedback for adjuster 48 points higher than did large companies.
The most frequent audit improvement links are training and performance improvement initiatives.
Improve KPI
Compensation / Promotion
Impact Training / Development Initiatives
Handler Self-Audit
Performance Goals Tied to Audit Results
RESulTS: AudIT ImPRovEmEnT lInKS
66% link audit results to compensation
Chart 16: Do you use any of the following audit improvement links? • Large • Medium/Small
17
Claims Audit Benchmarking Survey
Athenium
The survey compares the overall impact of the QA process on Claims organizations. Chart 18 shows that all respondents rated the impact for Central audit (42%) significantly higher than the impact for loB (25%) and field (28%) audits.
Central Audit
Line of Business Audit
Field Audit
CuRREnT PRoGRAm: ovERAll ImPACT on ClAImS • Large • Medium/Small
Chart 18: What was the overall impact of the QA process on Claims? Rank 1 to 5 (high). Chart illustrates responses of 4 and 5.
Chart 17: How do you rate the performance of your current audit program? Rank 1 to 5 (high). Chart illustrates responses of 4 and 5.
Produce Accurate / Timely Data
Actionable Feedback: Management
Actionable Feedback: Unit Managers
Actionable Feedback: Handlers
Partnering Effectively: Operations
CuRREnT PRoGRAm: AudIT SElf-EvAluATIon • Large • Medium/Small
18
Claims Audit Benchmarking Survey
Athenium
Conclusion
This survey provides new and extensive information that delivers valuable insights into the goals, procedures, and outcomes of Quality Assurance audits in today’s Claims organizations.
overall, respondents perceived that the effectiveness of their QA programs is high. Both large and medium/Small companies share a number of commonalities, including the importance of tracking leakage, root causes, and compliance issues. In addition, there is general agreement as to what are the most important goals of Quality Assurance for Claims. However, there are also many areas of substantial difference between companies of different sizes, including audit technology, calibration, and the impact of audit results on individual performance reviews.
To benefit from the results of this survey, Claims executives may want to compare their own QA goals, processes, and outcomes against the companies represented in the survey. for example, among medium/Small companies, the impact upon salary (86%), promotion (86%), and corrective action (95%) are each greater than for large companies. As another example, a Claims executive of a small company might look at how they share leakage results internally, particularly if their own method is unlike those of peer companies.
Perhaps the overriding observation from these results is that there are many different perspectives on Quality Assurance for Claims. Since each organization is unique, there is no single answer as to which practices necessarily lead to the most positive outcomes. However, with greater industry knowledge about QA practices in the insurance industry, Claims and QA executives can shed light on their own goals, practices, and outcomes.
6:
19
Claims Audit Benchmarking Survey
Athenium
7:
coMMEnts froM rEspondEnts on chAnGinG thE Audit procEss
20
Appendix
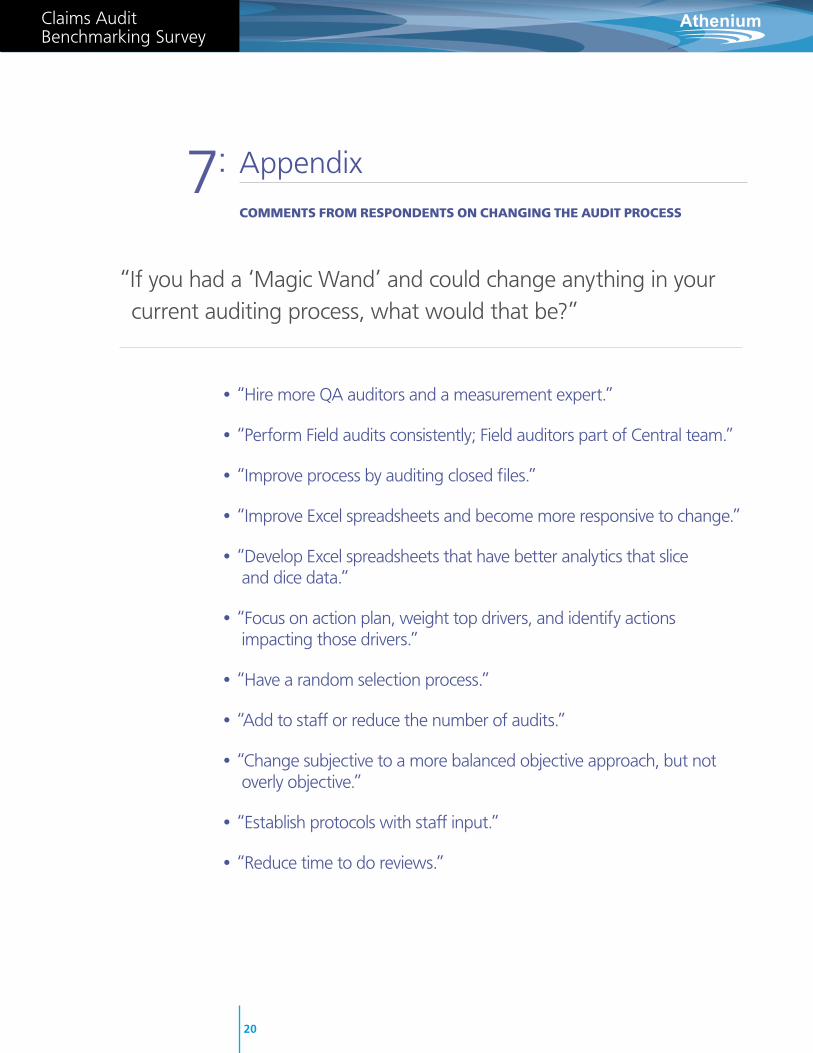
• “Hire more QA auditors and a measurement expert.”
• “Perform Field audits consistently; Field auditors part of Central team.”
• “Improve process by auditing closed files.”
• “Improve Excel spreadsheets and become more responsive to change.”
• “Develop Excel spreadsheets that have better analytics that slice and dice data.”
• “Focus on action plan, weight top drivers, and identify actions impacting those drivers.”
• “Have a random selection process.”
• “Add to staff or reduce the number of audits.”
• “Change subjective to a more balanced objective approach, but not overly objective.”
• “Establish protocols with staff input.”
• “Reduce time to do reviews.”
“If you had a ‘magic Wand’ and could change anything in your current auditing process, what would that be?”
Claims Audit Benchmarking Survey
Athenium
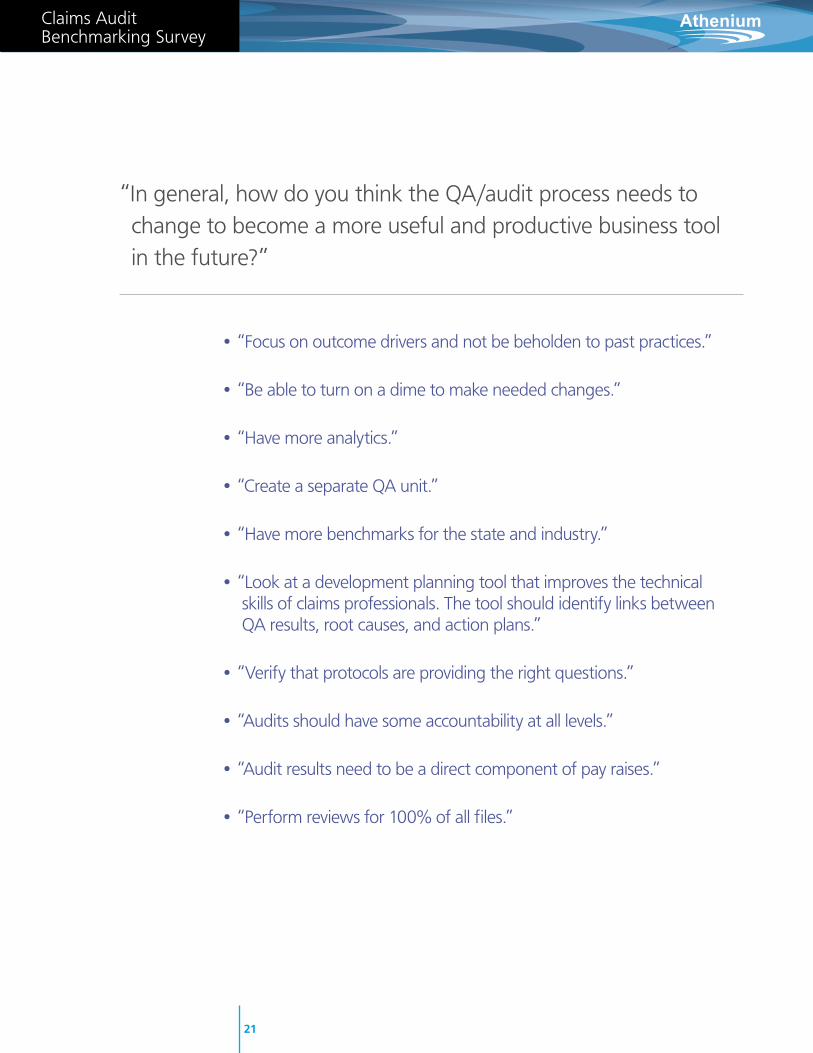
• “Focus on outcome drivers and not be beholden to past practices.”
• “Be able to turn on a dime to make needed changes.”
• “Have more analytics.”
• “Create a separate QA unit.”
• “Have more benchmarks for the state and industry.”
• “Look at a development planning tool that improves the technical skills of claims professionals. The tool should identify links between QA results, root causes, and action plans.”
• “Verify that protocols are providing the right questions.”
• “Audits should have some accountability at all levels.”
• “Audit results need to be a direct component of pay raises.”
• “Perform reviews for 100% of all files.”
“In general, how do you think the QA/audit process needs to change to become a more useful and productive business tool in the future?”
21
The survey questionnaire and the analysis of the results were prepared by Athenium, Inc. Survey interviews were conducted by Athenium. Athenium would like to thank Bob finlayson for his many contributions to this white paper. Bob was instrumental in formulating the survey as well as conducting many of the interviews.
Athenium delivers exceptional performance improvement solutions that optimize the QA process for insurers worldwide.
© Athenium, Inc. All rights reserved.
Athenium
PERfoRmAnCE ImPRovEmEnT SoluTIonS
Contact:
+1.877.250.1720
Athenium, Inc.
75 Third Avenue
Waltham, mA 02451
athenium.com


![Claims management system audit report template · Web viewThe review/audit examined the [employer name] ’s claims management system, processes and outcomes to validate that [employer](https://static.fdocuments.us/doc/165x107/613dd6e92809574f586e37c4/claims-management-system-audit-report-template-web-view-the-reviewaudit-examined.jpg)