cl D I I I I - centurypacific.com.ph Reporting/ANNEX... · Amper & Co. which is the external...
81
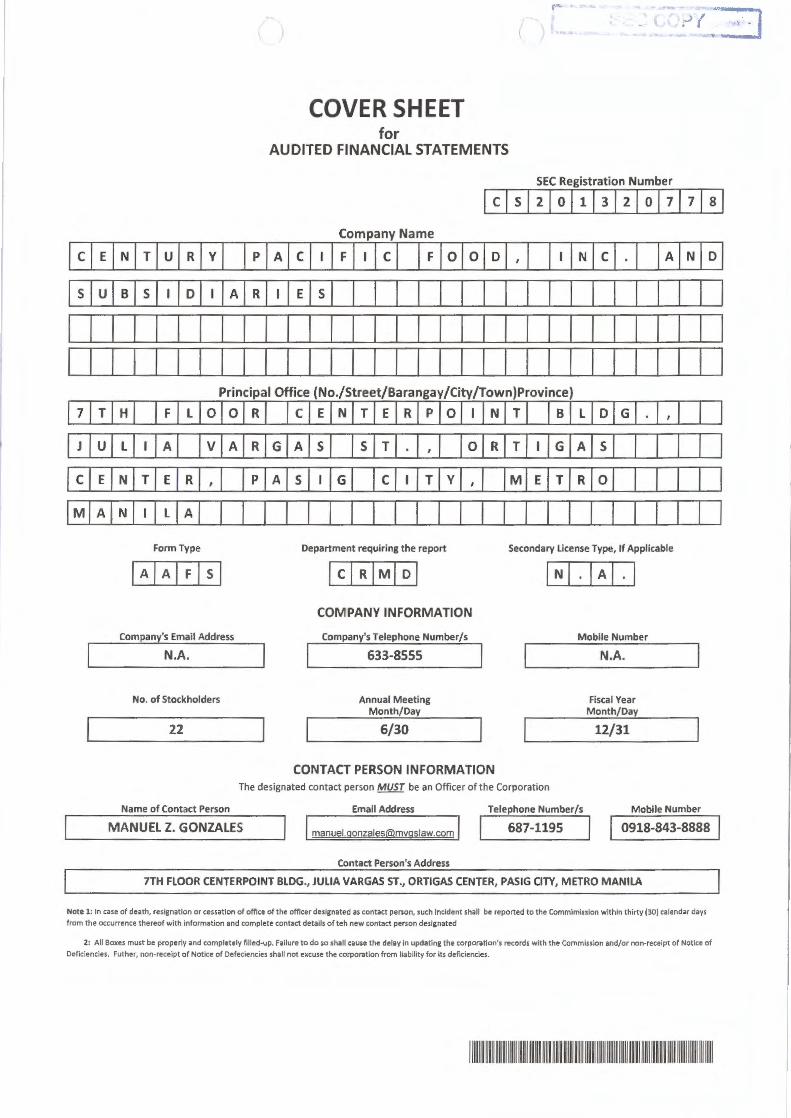
C s 7 J C M E NIT u R y p u ej s D A R I I Principa TjH F L olo R u IL A vi A R EIN T E R , I p AIN L A I Form Type I A I A IF Is I Company's Email Address N.A. No. of Stockholders 22 . l COVER SHEET for AUDITED FINANCIAL STATEMENTS SEC Registration Number Company Name A C F I C FI 0 0 D IN cl AIN E s I I I I I I I I I I I I Office (No./S reet/Barangay/C ty/Town)Province) le E NjT E R p 0 I GjA s s T 0 Al s GI C T y I I Department requiring the report COMPANY INFORMATION Company's Telephone Number/s 633-8555 Annual Meeting Month/Day 6/30 N R CONTACT PERSON INFORMATION Tl B L D GI I , Tl G A s I I Mj E T R 0 I I I I I Secondary license Type, If Applicable Mobile Number N.A. Fiscal Year Month/Day 12/31 The designated contact person MUST be an Officer of the Corporati on Name of Contact Person Email Address Telephone Number/ s Mobile Number D MANUEL Z. GONZALES I [email protected] I 687-1195 I 1 0918-843-8888 Contact Person's Address 7TH FLOOR CENTERPOINT BLDG., JULIA VARGAS ST., ORTIGAS CENTER, PASIG CITY, METRO MANILA Note l: In case of d .. th, resicnatlon or cessation of office of the officer designated as contact person, such Incident shall be reported to the Commimlssl on within thirty (30) calendar days from the occurrence thereof with Information and complete contm details of teh new contact person desl&nated 2: All Boxes must be properly and completely filled-up. Failure to do so shall cause the delay In updating the corporation's records with the Commission and/ or non-receipt of Notice of Deficiencies. Futher, non-receipt of Notice of Oefeclencl es shall not excwe the corporation from liability for Its deficiencies. 111~1 111111 1 1111 1 111 11 ~II ~ 11111 1 111~ 11111 !Ii 11111 I~ 11!11 I~ 1 111 11 1111 ~ Ill 11 111 11
Transcript of cl D I I I I - centurypacific.com.ph Reporting/ANNEX... · Amper & Co. which is the external...
C
s
7
J
C M
E NIT u R y p
u ej s D A R
I I
Principa TjH F L olo R
u IL A vi A R
EIN T E R , I p
AIN L A I Form Type
I A I A IF Is I
Company's Email Address
N.A.
No. of Stockholders
22
. l
COVER SHEET for
AUDITED FINANCIAL STATEMENTS
SEC Registration Number
Company Name A C F I C FI 0 0 D IN cl AIN
E s I I I I I I I I I I I I
Office (No./S reet/Barangay/C ty/Town)Province) le E NjT E R p 0 I
GjA s s T 0
Al s GI C T y
I I Department requiring the report
COMPANY INFORMATION
Company's Telephone Number/s
633-8555
Annual Meeting Month/Day
6/30
N
R
CONTACT PERSON INFORMATION
Tl B L D GI I , Tl G A s I I Mj E T R 0 I I
I I I Secondary license Type, If Applicable
Mobile Number
N.A.
Fiscal Year Month/Day
12/31
The designated contact person MUST be an Officer of the Corporation
Name of Contact Person Email Address Telephone Number/s Mobile Number
D
MANUEL Z. GONZALES I [email protected] I 687-1195 I 1 0918-843-8888
Contact Person's Address
7TH FLOOR CENTERPOINT BLDG., JULIA VARGAS ST., ORTIGAS CENTER, PASIG CITY, METRO MANILA
Note l : In case of d .. th, resicnatlon or cessation of office of the officer designated as contact person, such Incident shall be reported to the Commimlsslon within thirty (30) calendar days from the occurrence thereof with Information and complete contm details of teh new contact person desl&nated
2: All Boxes must be properly and completely filled-up. Failure to do so shall cause the delay In updating the corporation's records with the Commission and/or non-receipt of Notice of Deficiencies. Futher, non-receipt of Notice of Oefeclencles shall not excwe the corporation from liability for Its deficiencies.
111~1 ~I~ 11111111111111111 ~II ~111111111~ 11111 !Ii 11111 I~ 11!11 I~ 1111111111 ~Ill 1111111
( (
CENTURY PACIFIC FOOD INC.
Centerpoint Building Julia Vargas Ave.,
Ortigas Center Pasig City, Metro Manila
Philippines
Tel : {632} 633 8555
Fax : (632} 638 6336
website : www.centurypacific.com.ph
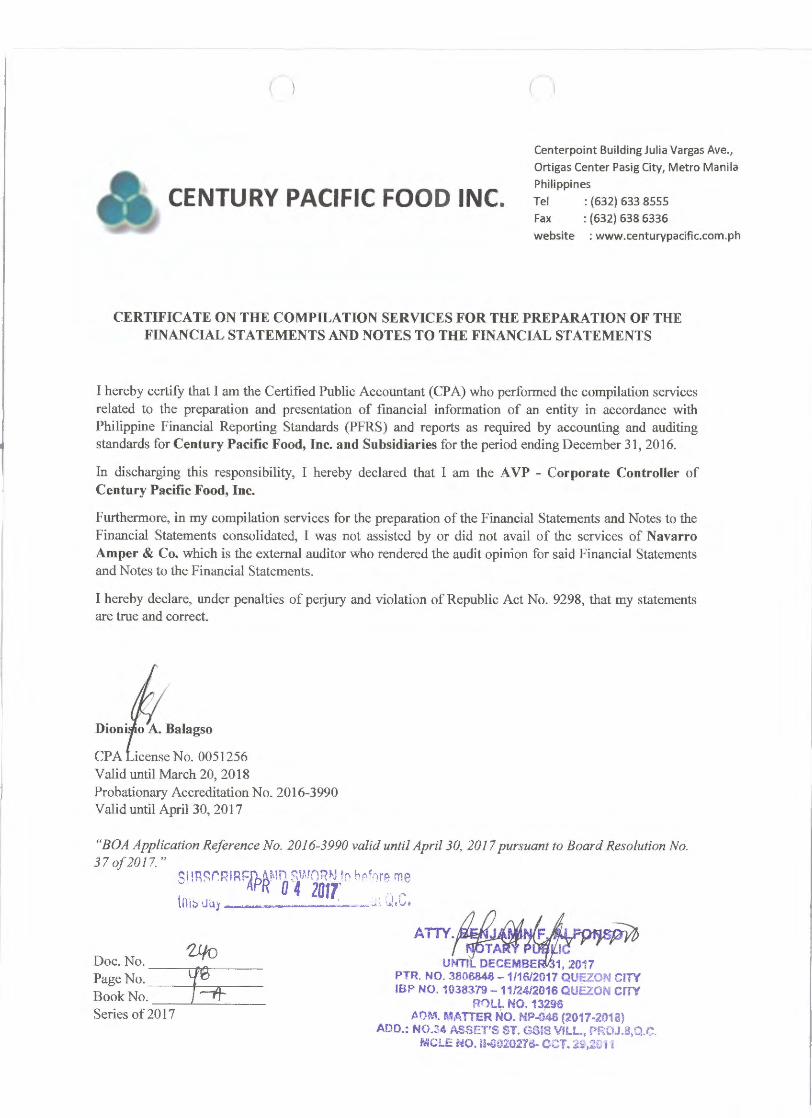
CERTIFICATE ON THE COMPILATION SERVICES FOR THE PREPARATION OF THE FINANCIAL STATEMENTS AND NOTES TO THE FINANCIAL STATEMENTS
I hereby certify that I am the Certified Public Accountant (CPA) who performed the compilation services related to the preparation and presentation of financial information of an entity in accordance with Philippine Financial Reporting Standards (PFRS) and reports as required by accounting and auditing standards for Century Pacific Food, Inc. and Subsidiaries for the period ending December 31, 2016.
In discharging this responsibility, I hereby declared that I am the A VP - Corporate Controller of Century Pacific Food, Inc.
Furthermore, in my compilation services for the preparation of the Financial Statements and Notes to the Financial Statements consolidated, I was not assisted by or did not avail of the services of Navarro Amper & Co. which is the external auditor who rendered the audit opinion for said Financial Statements and Notes to the Financial Statements.
I hereby declare, under penalties of perjury and violation of Republic Act No. 9298, that my statements are true and correct.
CPA icense No. 0051256 Valid until March 20, 2018 Probationary Accreditation No. 2016-3990 Valid until April 30, 201 7
"BOA Application Reference No. 2016-3990 valid until April 30, 2017 pursuant to Board Resolution No. 37 o/2017."
SI !R~r:R11:u:Af>R1 .. 1r, S'W)R"J '0 hr'."'rP. me 0 4 201T .
1 ,,
tni~ uu1 • --~' ..... ..,.
Via Doc. No.--~-----Page No. ---------+-----qe-_ BookNo. T=if __ _,__ ___ _ Series of 201 7
T y UNTIL OECEMBE 1, :Z017
PTR. NO. 3800846 - 1/16/2017 QUEZON CITY IBP NO. 1038371J-11/2412016 QUEZON CITY
RnLL N0.13296 J\OM. MATIER NO. NP-048 (2017-2018)
ADO.: N0.34 ASSET'S ST. GSIS 'i/lLL., f>ROJ.8,Q.C. MCLE N0.11~02027~-CCT. 29,2011
CENTURY PACIFIC FOOD INC.
(
Centerpoint Building Julia Vargas Ave., Ortigas Center Pasig City, Metro Manila Philippines Tel : (632) 633 8555 Fax : (632) 638 6336 website : www.centurypacific.com.ph
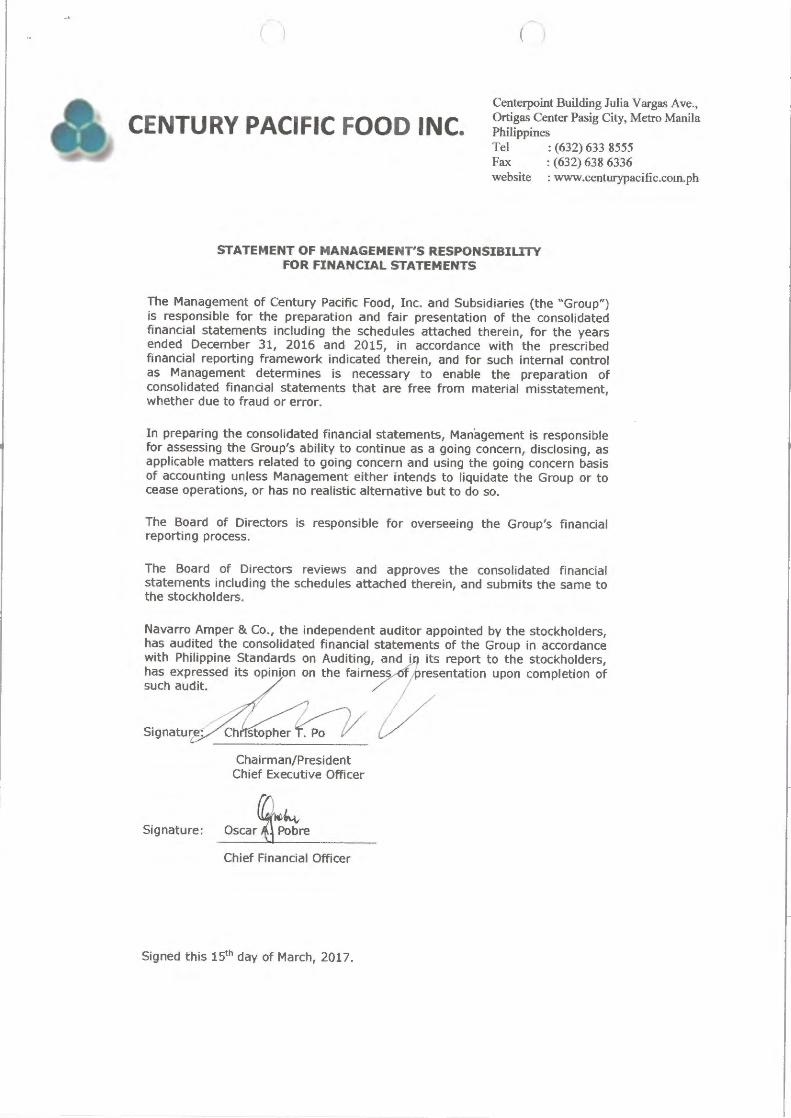
STATEMENT OF MANAGEMENT'S RESPONSIBILITY FOR FINANCIAL STATEMENTS
The Management of Century Pacific Food, Inc. and Subsidiaries (the "Group") is responsible for the preparation and fair presentation of the consolidated financial statements including the schedules attached therein, for the years ended December 31, 2016 and 2015, in accordance with the prescribed financial reporting framework indicated therein, and for such internal control as Management determines is necessary to enable the preparation of consolidated financial statements that are free from material misstatement, whether due to fraud or error.
In preparing the consolidated financial statements, Management is responsible for assessing the Group's ability to continue as a going concern, disclosing, as applicable matters related to going concern and using the going concern basis of accounting unless Management either intends to liquidate the Group or to cease operations, or has no realistic alternative but to do so.
The Board of Directors is responsible for overseeing the Group's financial reporting process.
The Board of Directors reviews and approves the consolidated financial statements including the schedules attached therein, and submits the same to the stockholders.
Navarro Amper & Co., the independent auditor appointed by the stockholders, has audited the consolidated financial statements of the Group in accordance with Philippine Standards on Auditing,nnd i its report to the stockholders, has expressed its opinion on the fairnes resentation upon completion of such audit.
Signatu, : stophec ~ / Chairman/President
Chief Executive Officer
Signature: Osca,~e
Chief Financial Officer
Signed this 15th day of March, 2017.
( ) ( \
SUBSCRIBED AND SWORN to before me this affiants exhibiting to me his/their Tax Identification Numbers, as follows:
NAMES Christopher T. Po
Oscar A. Pobre
Doc.No.: 2~ -----,~......,.._,/: -Page No.: ___ "-\_...,..~ .---
Book No.: ---Yf+-+--Series of 201 7
TAX IDENTIFICATION NUMBER 119-779-656 138-775-570
~ ·l ;~
.. t PUBLIC , . . · ,,. , r1t CJTY OF MANDALUYONG U1lli i D(:Cember 31, 2017 l COMMISSION NO. 458-16 · _ IIW !_i FETlMt NO, 0995268 / !F,UGAO. ~ PTI< NO. 692 52527, 1-3-17, Cainta, Rtzar Ri)t l. r,!(). 263(14 I
MCLE COM P. NO. V-0022171, 6-15-16 VALID UNTIL 04-14-2019 · .1 D22 -t. B GIJ\IENTV!LLE II , D.M. GUEVARA S.J MAuw.,w, M,\ Nf)Af_LJYONG CITY Tf:L 5'.Q->l~;H, S314n6~ en1d·il: joou1nua1o~ymail.com
NavarroAmper&Co.
SUPPLEMENTAL WRITIEN STATEMENT OF AUDITORS
To the Board of Directors and Shareholders CENTURY PACIFIC FOOD, INC (A Subsidiary of Century Pacific Group, Inc.) 7th Floor, Centerpoint Building, Julia Vargas St., Ortigas Center Pasig City, Metro Manila
Gentlemen:
Navarro Amper & Co. 19th Floor Net Lima Plaza 5th Avenue corner 26th Street Bonifacio Global City, Taguig 1634 Philippines
Tel: +63 (2) 581 9000 Fax: +63 (2) 869 3676 www.deloitte.com/ph
BONPRC Reg. No. 0004 SEC Accreditation No. 0001-FR-4
We have audited the consolidated financial statements of Century Pacific Food, Inc. and Subsidiaries for the year ended December 31, 2016 in accordance with Philippine Standards on Auditing, on which we have rendered the attached report dated March 17, 2017. In connection with our audit, we wish to state that the Company is listed with the Philippine Stock Exchange.
Navarro Amper & Co _ BOA Registration No. 0004, valid from December 4, 2015 to December 31, 2018 SEC Accreditation No. 0001-FR-4, issued on January 7, 2016; effective until January 6, 2019, Group A TIN 005299331
By :
-Bonifacio F. Lumacang, Jr. Partner CPA License No. 0098090 SEC A.N. 0526-AR-3, issued on April 21, 2016; effective until April 21, 2019, Group A TIN 170035681 BIR A.N. 08-002552- 18-2015, issued on February 6, 2015; effective until February 5, 2018 PTR No. A-3264646, issued on January 5, 2017, Taguig City
Taguig City, Philippines March 17, 2017
Deloitte. llllllllllll lllll llllllllllllllllllllllllllllll llllllllll 1111111111111111111111111111111111111111111111111111111111
t-
i

NavarroAmper&Co. Navarro Amper & Co. 19th Floor Net Lima Plaza 5th Avenue corner 26th Street Bonifacio Global City, Taguig 1634 Philippines
• INDEPENDENT AUDITORS' REPORT
To the Stockholders and the Board of Directors CENTURY PACIFIC FOOD, INC. (A Subsidiary of Century Pacific Group, Inc.) 7m Floor, Centerpoint Building, Julia Vargas St., Ortigas Center Pasig City, Metro Manila
Opinion
Tel: +63 (2) 581 9000 Fax: +63 (2) 869 36 76 www.delo1tte.com/ph
BONPRC Reg. No. 0004 SEC Accreditation No. 0001-FR-4
We have audited the consolidated financial statements of Century Pacific Food, Inc. and Subsidiaries (the "Group") which comprise the consolidated statements of financial position as at December 31, 2016 and 2015, and the consolidated statements of comprehensive income, consolidated statements of changes in equity and consolidated statements of cash flows for the years ended December 31, 2016, 2015 and 2014, and the notes to the consolidated financial statements, including a summary of significant accounting policies.
In our opinion, the accompanying consolidated financial statements present fairly, in all material respects, the financial position of the Group as at December 31, 2016 and 2015, and of its financial performance, and cash flows for the years ended December 31, 2016, 2015 and 2014, in accordance with Philippine Financial Reporting Standards (PFRSs).
Basis for Opinion
We conducted our audits in accordance with Philippines Standards on Auditing (PSAs). Our responsibilities under those standards are further described in the Auditor's Responsibilities for the Audit of the Consolidated Financial Statements section of our report. We are independent of the Group in accordance with the Code of Ethics for Professional Accountants in the Philippines (Code of Ethics), together with the ethical requirements that are relevant to our audit of the consolidated financial statements in the Philippines, and we have fulfilled our other ethical responsibilities in accordance with these requirements and the Code of Ethics. We believe that the audit evidence we have obtained is sufficient and appropriate to provide a basis for our opinion.
Deloitte. lllllll lllllllllllllll lll~IIIIIIIIII IIIIIIIIII IIIII IIIII IIIII IIIIIIIIII IIIII IIIIIIIIIIII IIIIIIIIIIIIIIII
Navarr0Am~2r<&Co.
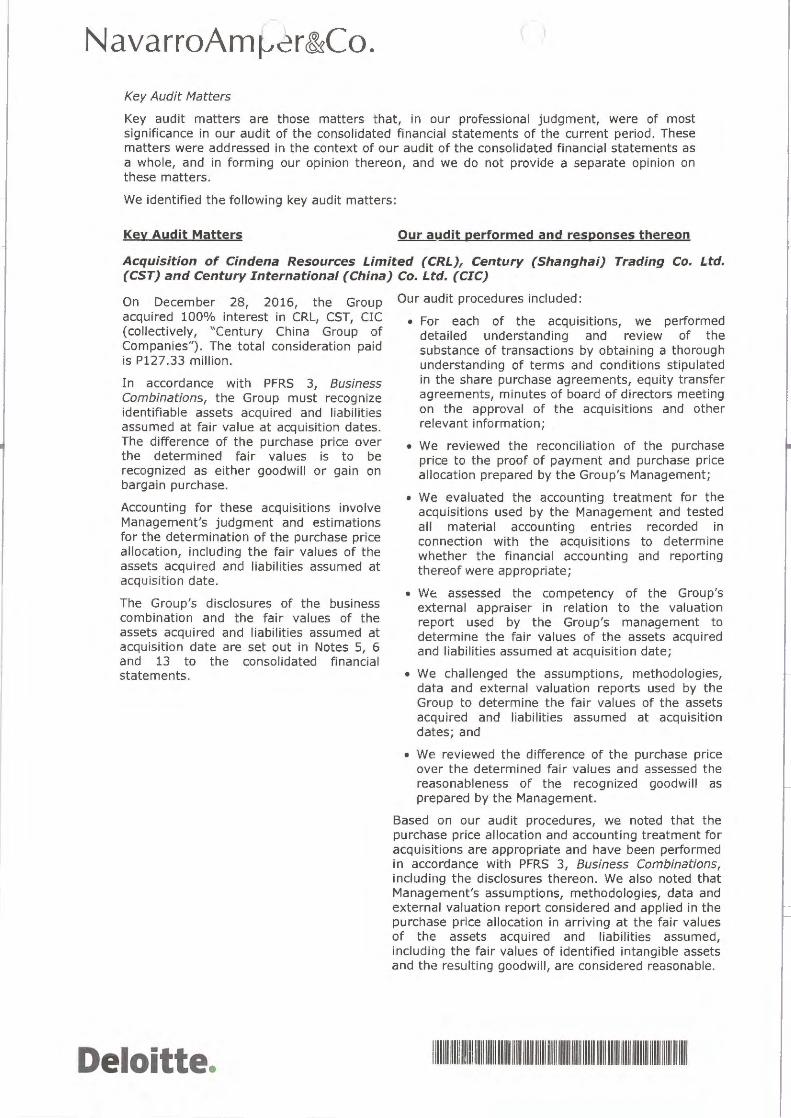
Key Audit Matters
Key audit matters are those matters that, in our professional judgment, were of most significance in our audit of the consolidated financial statements of the current period. These matters were addressed in the context of our audit of the consolidated financial statements as a whole, and in forming our opinion thereon, and we do not provide a separate opinion on these matters.
We identified the following key audit matters:
Key Audit Matters Our audit performed and responses thereon
Acquisition of Cindena Resources Limited (CRLJ, Century (Shanghai) Trading Co. Ltd. (CST) and Century International (China) Co. Ltd. (CIC)
On December 28, 2016, the Group acquired 100% interest in CRL, CST, CIC (collectively, "Century China Group of Companies"). The total consideration paid is P127.33 million.
In accordance with PFRS 3, Business Combinations, the Group must recognize identifiable assets acquired and liabilities assumed at fair value at acquisition dates. The difference of the purchase price over the determined fair values is to be recognized as either goodwill or gain on bargain purchase.
Accounting for these acquisitions involve Management's judgment and estimations for the determination of the purchase price allocation, including the fair values of the assets acquired and liabilities assumed at acquisition date.
The Group's disclosures of the business combination and the fair values of the assets acquired and liabilities assumed at acquisition date are set out in Notes 5, 6 and 13 to the consolidated financial statements.
Deloitte.
Our audit procedures included:
• For each of the acquisitions, we performed detailed understanding and review of the substance of transactions by obtaining a thorough understanding of terms and conditions stipulated in the share purchase agreements, equity transfer agreements, minutes of board of directors meeting on the approval of the acquisitions and other relevant information;
• We reviewed the reconciliation of the purchase price to the proof of payment and purchase price allocation prepared by the Group's Management;
• We evaluated the accounting treatment for the acquisitions used by the Management and tested all material accounting entries recorded in connection with the acquisitions to determine whether the financial accounting and reporting thereof were appropriate;
• We. assessed the competency of the Group's external appraiser in relation to the valuation report used by the Group's management to determine the fair values of the assets acquired and liabilities assumed at acquisition date;
• We challenged the assumptions, methodologies, data and external valuation reports used by the Group to determine the fair values of the assets acquired and liabilities assumed at acquisition dates; and
• We reviewed the difference of the purchase price over the determined fair values and assessed the reasonableness of the recognized goodwill as prepared by the Management.
Based on our audit procedures, we noted that the purchase price allocation and accounting treatment for acquisitions are appropriate and have been performed in accordance with PFRS 3, Business Combinations, including the disclosures thereon. We also noted that Management's assumptions, methodologies, data and external valuation report considered and applied in the purchase price allocation in arriving at the fair values of the assets acquired and liabilities assumed, including the fair values of identified intangible assets and the resulting goodwill, are considered reasonable.
illllllllllllllllllllllllll lllll lllll lllll lllllllllllllllllllllllll lllll llllllllllllllllllllll lllllllllll

Navarr0Am~2r&Co.
Key Audit Matters
Goodwill Impairment
Goodwill has been recognized in the consolidated statements of financial position resulting from acquisitions of the Group. Under PFRS, the Group is required to annually test the goodwill for impairment. This annual impairment test was significant to our audit because the aggregate balance of goodwill amounting to P2.95 billion is material to the consolidated financial statements and represents 14.81 % of the consolidated total assets of the Group as at December 31, 2016.
Under PFRS 3 and PAS 36, the Group is required to annually test the goodwill for impairment. Management conducts annual impairment test to assess the recoverability of the carrying values of goodwill. This annual impairment test involves a number of key sensitive judgments made in determining the inputs used in the assessment process.
The carrying values of goodwill as at December 31, 2016 are disclosed in Note 13 to the consolidated financial statements.
Deloitte.
Our audit performed and responses thereon
Our audit procedures were focused on performing a detailed understanding of the Management's assessment process and challenging the key sensitive judgments applied as follows:
• We reviewed the Group's position on the impairment of goodwill, including information about the Group's project plan, business outlook, revenue potential and market penetration assessment of the subsidiaries to which the goodwill relates to; and
• We assessed and challenged the reasonableness of the Group's position on the impairment of goodwill including consideration of various factors such as historical business performance, current year dev~lopments, current risk evaluations, business plans, outlook, revenue potential and other market considerations.
Based on our audit procedures, we have noted that the Group's assessment and the judgments used are reasonable .
IIIIIIIIIIIIIIIIIIIIIIIIIIIIIIIIIIIIIIIIIIIIIIIIIIIIIIIIIIIIIIIIIIIIIIIIIIIIIIIIIIIIIIIIIIIIIIIIIIIIIIIII
Navarr0Am~2r&Co.
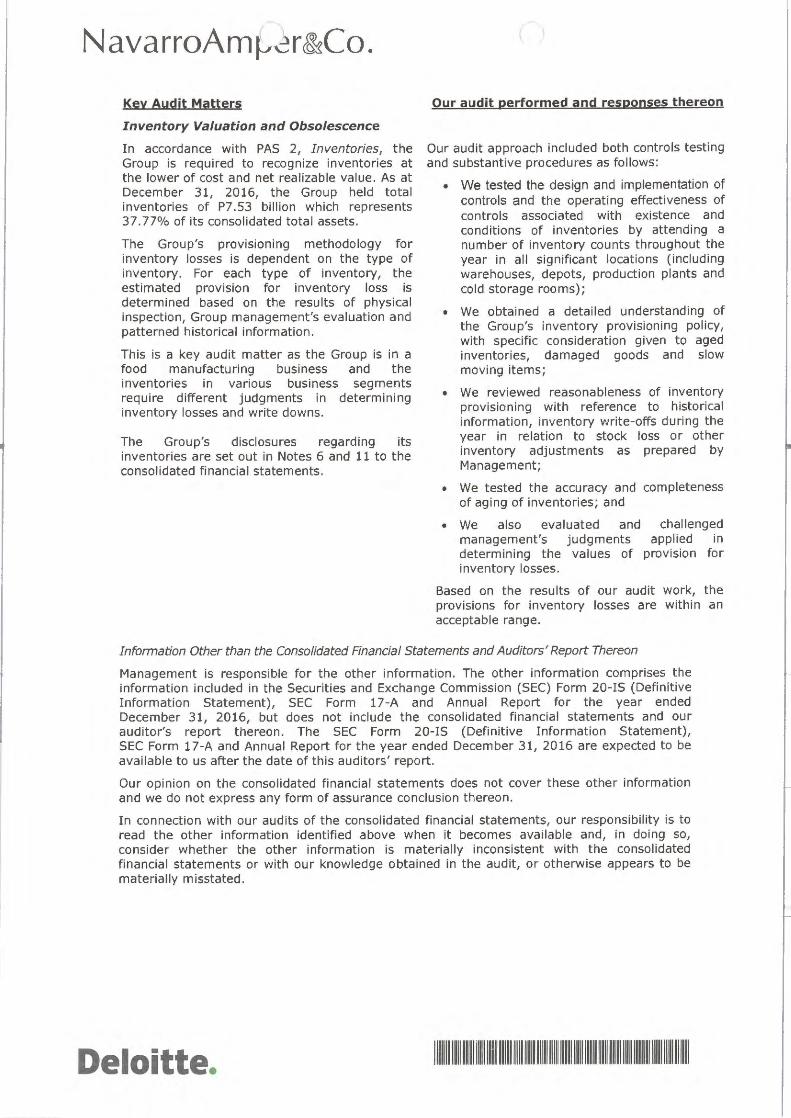
Key Audit Matters
Inventory Valuation and Obsolescence
In accordance with PAS 2, Inventories, the Group is required to recognize inventories at the lower of cost and net realizable value. As at December 31, 2016, the Group held total inventories of P7 .53 billion which represents 37. 77% of its consolidated total assets.
The Group's prov1s1oning methodology for inventory losses is dependent on the type of inventory. For each type of inventory, the estimated prov1s1on for inventory loss is determined based on the results of physical inspection, Group management's evaluation and patterned historical information.
This is a key audit matter as the Group is in a food manufacturing business and the inventories in various business segments require different judgments in determining inventory losses and write downs.
The Group's disclosures regarding its inventories are set out in Notes 6 and 11 to the consolidated financial statements.
Our audit performed and responses thereon
Our audit approach included both controls testing and substantive procedures as follows:
• We tested the design and implementation of controls and the operating effectiveness of controls associated with existence and conditions of inventories by attending a number of inventory counts throughout the year in all significant locations (including warehouses, depots, production plants and cold storage rooms);
• We obtained a detailed understanding of the Group's inventory provisioning policy, with specific consideration given to aged inventories, damaged goods and slow moving items;
• We reviewed reasonableness of inventory provisioning with reference to historical information, inventory write-offs during the year in relation to stock loss or other inventory adjustments as prepared by Management;
• We tested the accuracy and completeness of aging of inventories; and
• We also evaluated and challenged management's judgments applied in determining the values of provision for inventory losses.
Based on the results of our audit work, the provisions for inventory losses are within an acceptable range.
Information Other than the Consolidated Financial Statements and Auditors' Report Thereon
Management is responsible for the other information. The other information comprises the information included in the Securities and Exchange Commission (SEC) Form 20-IS (Definitive Information Statement), SEC Form 17-A and Annual Report for the year ended December 31, 2016, but does not include the consolidated financial statements and our auditor's report thereon. The SEC Form 20-IS (Definitive Information Statement), SEC Form 17-A and Annual Report for the year ended December 31, 2016 are expected to be available to us after the date of this auditors' report.
Our opinion on the consolidated financial statements does not cover these other information and we do not express any form of assurance conclusion thereon.
In connection with our audits of the consolidated financial statements, our responsibility is to read the other information identified above when it becomes available and, in doing so, consider whether the other information is materially inconsistent with the consolidated financial statements or with our knowledge obtained in the audit, or otherwise appears to be materially misstated.
Deloitte. IIIIIIIIIIIIIIIIIIIIIIIIIIIIIIIIIIIIIIIIIIIIIIIIIIIIIIIIIIIIIIIIIIIIIIIIIIIIIIIIIIIIIIIIIIIIIIIIIIIIIIIII

NavarroAmr.,~r&Co.
Responsibilities of Management and Those Charged with Governance for the Consolidated Financial Statements
Management is responsible for the preparation and fair presentation of these consolidated financial statements in accordance with PFRSs, and for such internal control as Management determines is necessary to enable the preparation of consolidated financial statements that are free from material misstatement, whether due to fraud or error.
In preparing the consolidated financial statements, Management is responsible for assessing the Group's ability to continue as a going concern, disclosing, as applicable, matters related to going concern and using the going concern basis of accounting unless Management either intends to liquidate the Group or to cease operations, or has no realistic alternative but to do so.
Those charged with governance are responsible for overseeing the Group's financial reporting process.
Auditors' Responsibilities for the Audit of the Consolidated Financial Statements
Our objectives are to obtain reasonable assurance about whether the consolidated financial statements as a whole are free from material misstatement, whether due to fraud or error, and to issue an auditor's report that includes our opinion. Reasonable assurance is a high level of assurance, but is not a guarantee that an audit conducted in accordance with PSAs wi ll always detect a material misstatement when it exists. Misstatements can arise from fraud or error and are considered material if, individually or in the aggregate, they could reasonably be expected to influence the economic decisions of users taken on the basis of these consolidated financial statements.
As part of an audit in accordance with PSAs, we exercise professional judgment and maintain professional skepticism throughout the audit. We also:
• Identify and assess the risks of material misstatement of the consolidated financial statements, whether due to fraud or error, design and perform audit procedures responsive to those risks, and obtain audit evidence that is sufficient and appropriate to provide a basis for our opinion. The risk of not detecting a material misstatement resulting from fraud is higher than for one resulting from error, as fraud may involve collusion, forgery, intentional omissions, misrepresentations, or the override of internal control.
• Obtain an understanding of internal control relevant to the audit in order to design audit procedures that are appropriate in the circumstances, but not for the purpose of expressing an opinion on the effectiveness of the Group's internal control.
• Evaluate the appropriateness of accounting policies used and the reasonableness of accounting estimates and related disclosures made by Management.
• Conclude on the appropriateness of Management's use of the going concern basis of accounting and, based on the audit evidence obtained, whether a material uncertainty exists related to events or conditions that may cast significant doubt on the Group's ability to continue as a going concern. If we conclude that a material uncertainty exists, we are required to draw attention in our auditor's report to the related disclosures in the consolidated financial statements or, if such disclosures are inadequate, to modify our opinion. Our conclusions are based on the audit evidence obtained up to the date of our auditor's report. However, future events or conditions may cause the Group to cease to continue as a going concern.
• Evaluate the overall presentation, structure and content of the consolidated financial statements, including the disclosures, and whether the consolidated financial statements represent the underlying transactions and events in a manner that achieves fair presentation.
• Obtain sufficient appropriate audit evidence regarding the financial information of the entities or business activities within the Group to express an opinion on the consolidated financial statements. We are responsible for the direction, supervision and performance of the group audit. We remain solely responsible for our audit opinion.
We communicate with those charged with governance regarding, among other matters, the planned scope and timing of the audit and significant audit findings, including any significant deficiencies in internal control that we identify during our audit.
Deloitte. 111111111111111111111111111111111111111111111111111111111111111111111111111111111111111111111111111111111
Navarr0Am~2r&Co.
We also provide those charged with governance with a statement that we have complied with relevant ethical requirements regarding independence, and to communicate with them all relationships and other matters that may reasonably be thought to bear on our independence, and where applicable, related safeguards.
From the matters communicated with those charged with governance, we determine those matters that were of most significance in the audit of the consolidated financial statements of the current period and are therefore the key audit matters. We describe these matters in our auditor's report unless law or regulation precludes public disclosure about the matter or when, in extremely rare circumstances, we determine that a matter should not be communicated in our report because the adverse consequences of doing so would reasonably be expected to outweigh the public interest benefits of such communication.
The engagement partner on the audit resulting in this independent auditor's report is Mr. Bonifacio F. Lumacang, Jr.
Navarro Amper & Co. BOA Registration No. 0004, valid from December 4, 2015 to December 31, 2018 SEC Accreditation No. 0001-FR-4, issued on January 7, 2016; effective until January 6, 2019, Group A TIN 005299331
By:
Bonifacio F. Lumacang, Jr. Partner CPA License No. 0098090 SEC A.N. 0526-AR-3, issued on April 21, 2016; effective until April 21, 2019, Group A TIN 170035681 BIR A.N. 08-002552-18-2015, issued on February 6, 2015; effective until February 5, 2018 PTR No. A-3264646, issued on January 5, 2017, Taguig City
Taguig City, Philippines March 17, 2017
Deloitte. IIIIIIIIIIIIIIIIIIIIIIIIIIIIIIIIIIIIIIIIIIIIIIIIIIIIIIIIIIIIIIIIIIIIIIIIIIIIIIIIIIIIIIIIIIIIIIIIIIIIIIIII
(
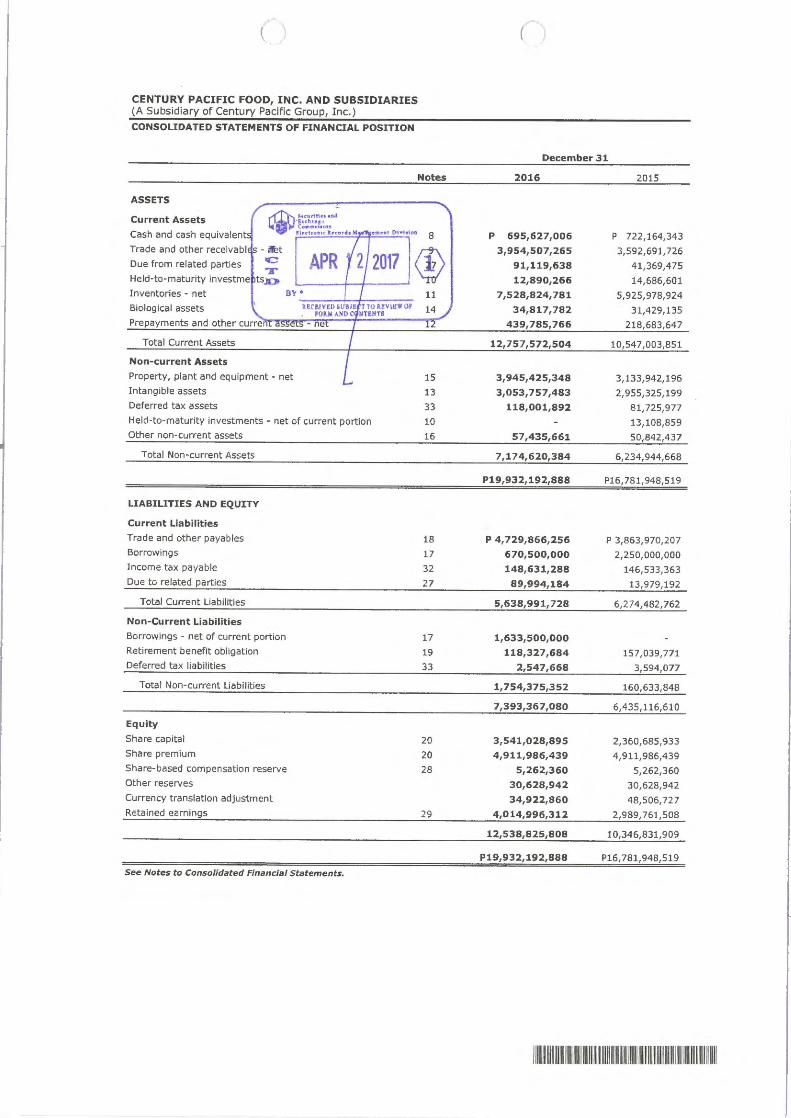
CENTURY PACIFIC FOOD, INC. AND SUBSIDIARIES (A Subsidiary of Century Pacific Group, Inc.)
CONSOLIDATED STATEMENTS OF FINANCIAL POSITION
Notes
ASSETS
Current Assets
Cash and cash equivalent
Trade and other recelvabl
Due from related parties
Held-to-maturity investme
Inventories • net
Biological assets
-Suur1Hn,M
· luhu•" c.-n•1os
Jl,ctte111c leur41 M • • nt EH.-1rin 8
11
14 Prepayments and other curr~e::,i,.."!'l"l~~ ~ r,;,.;,,.r,;,,;,;,,,,;,;,.. __ ___,r'l""""
Total Current Assets
Non-current Assets
Property, plant and equipment • net
Intangible assets
Deferred tax assets
Held-to-maturity investments • net of current portion
Other non-current assets
Total Non-current Assets
LIABILITIES AND EQUITY
Current Liabilities
Trade and other payables
Borrowings
Income tax payable
Due to related parties
Total Current Liabilities
Non-Current Liabilities
Borrowings • net of current portion
Retirement benefit obligation
Deferred tax liabilit ies
Total Non-current Liabilities
Equity
Share capital
Share premium
Share-based compensation reserve
Other reserves
Currency translat ion adjustment
Retained earnings
See Notes to Consolidated Financial Statements.
15
13
33
10
16
18
17
32
27
17
19
33
20
20
28
29
( )
December 31
2016 2015
p 695,627,006 p 722,164,343
3,954,507,265 3,592,691 ,726
91,119,638 41 ,369,475
12,890,266 14,686,601
7,528,824,781 5, 925,978,924
34,817,782 31,429,135
439,785,766 218, 683,647
12,757,572,504 10,547,003,851
3,945,425,348 3,133,942,196 3,053,757,483 2,955,325,199
118,001,892 81,725,977
13,108,859
57,435,661 50,842,437
7,174,620,384 6,234,944,668
P19,932,192,888 P16,781,948,519
P 4,729,866,256 P 3,863,970,207
670,500,000 2,250,000,000
148,631,288 146, 533, 363
89,994,184 13,979,192
5,638,991,728 6,274,482,762
1,633,500,000 118,327,684 157,039,771
2,547,668 3,594, 077
1,754,375,352 160,633,848
7, 393, 367,080 6,435,116,610
3,541,028,895 2,360,685,933 4 ,911,986,439 4,911,986,439
5 ,262,360 5,262,360 30,628,942 30,628,942
34,922,860 48,506,727
4,014,996,312 2,989,761,508
12,538,825,808 10,34 6,831,909
P19,932,192,88S P16,781,948,519
1111~~11 11111111111111 11~~1111111 m11111111111~111111~11111111 11m11111

CENTURY PACIFIC FOOD, INC, AND SUBSIDIARIES (A Subsidiary of Century Pacific Group, Inc.) CONSOUDATED STATEMENTS OF COMPREHENSIVE INCOME
Net Revenue, Cost of Goods Sold
Gro11 Profit Other Income
Operiitlng Expen1e1
Other Expenses
Finance Costs
Profit Before Tax
Income Tax Exeense
Profit for the Year
Other Comprehen11ve Income (Lou ) Jtem that wfll be recla11lned subsequently t o profit or 1011
Currency translatlon adjustments Ite m that will not be reclantned subsequently to proflt or 1011
Remeasurement 2a1ns ~losses) on retirement benefit obligation· net of tax
Total Comprehensive Income
Basic and DIiuted Earnings Per Share
See Notes to ConsoJJd•ted FJn• ncJ•J Statements.
Notes
21 22
23
24
25 17
32
19
30
For the Years Ended December 31
2016 2015 2014
P28,287,7 88, 370 P23,324,528,579 P20,438,555,008
19!677!984,326 17,128, 162,072 15,063,993,046
8,609,804, 0 44 6, 196,366,507 5,374,561,962
272,039,674 100, 151,771 190,857,007
8,881,843,718 6,296,518,278 5,565,418,969
5,217,647,358 3,529,030,226 3,272,303,364
51,334,489 35,942, 100 39,579,720
7 7,4 27,&50 1,158,333 15,287,944
5,3 4 6,409 497 3,566, 130,659 3 ,327, 171,028
3,535,434,221 2,730,387,619 2,238,247,941
879,838, 159 796,712,841 646,657,589
2 ,655,596,062 1,933,674,778 1,591,590,352
(13,583,867 ) 29,029, 136 5, 169,350
22,118,8 97 (24,203,701) (64,363,876)
8,535,030 4,825,435 (59,194,526)
P 2,6154,131,092 P 1,938,500,213 P 1,532,395,826
P0.7500 P0.8664 P0.7600
111111111111111111111

CENTURY PACIFIC FOOD, INC. AND SUBSIDI ARIES (A Subsidia~ of Centu~ Pacific Groue, Inq CONSOUDATED STATEMENTS OF CHANGES IN EQUITY
For the Years Ended December 31, 2016 , 2015 and 2014
Share -based Currency Retained Share Share Com pensation Other Translation Earnings
Notes Caeltal Premium Reserve Reserves Adjustment (Deficit} Total
Ba lance, January 1, 2014 20 Pl,500,000,000 p p P30,628,942 P14,308,241 (P 731,724} Pl,544,205,459
Profit for the year 1,591,590,352 1,591,590,352
Other comprehensive income (loss) : Currency translation adjustment 5,169,350 5,169,350
Remeasurement of retirement benefit obligation - net of tax 19 (64,363,876l (64,363,876l
Total Com(!rehenslve Income 5,169,350 1,527,226,476 1,532,395,826
Transaction with owners: Iss uance of share capital 20 P729,654,404 2,751,905,610 3,481,560,014
Subscription of capital stock 20 Pl ,367,200 17,431,800 18,799,000
Egui!;y-settled share-based com(lensatlon - net of tax 28 3,376,984 3,376,984
Balance, December 31, 2014 2,231,021,604 2,769,337,410 3,376,984 30,628,942 19,477,591 1,526,494,752 6,580,337,283
Profit for the year 1,933,674,778 1,933,674,778
Other comprehensive income (loss): Currency translation adjustment 29,029,136 29,029,136
Remeasurement of retirement benefit obligation - net of tax 19 (24,203,701) (24,203,701)
Total Coml!rehenslve Income 29,029,136 1,909,471,077 1,938,500,213
Transaction with owners: Issuance of share capital 20 129,664,329 2,142,649,029 2,272,313,358
Cash dividends 29 (446,204,321) (446,204,321)
Egui~ ·settled share-based comeensation - net of tax 28 1,885,376 1,885,376
Balance, December 311 2015 2,360,685,933 4,911,986,439 5,262,360 30,628,942 48,506,727 2,989,761,508 10,346,831,909
Profit for the year 2,655,596,062 2,655,596,062
Other comprehensive income (loss): Currency translation adjustment (13,583,867) (13,583,867)
Remeasurement of retirement benefit obligation - net of tax 19 22,118,897 22,118,897
Total Com(!rehenslve Income (13,583,867l 2,677,714,959 2,664,131,092
Transaction with owners:
Stock dividends 20, 29 1,180,342,962 (1,180,342,962)
Cash dividends 29 (472,137,193) (472,137,193)
Balance, December 31, 2016 P3,5411028,895 P4,911,986,439 P5,262,360 P30,628,942 P34,922,86 0 P4,0141996,312 P12,538,825,S0 8
See Notes to Consolidated Financial State ments.
111111111111111111111
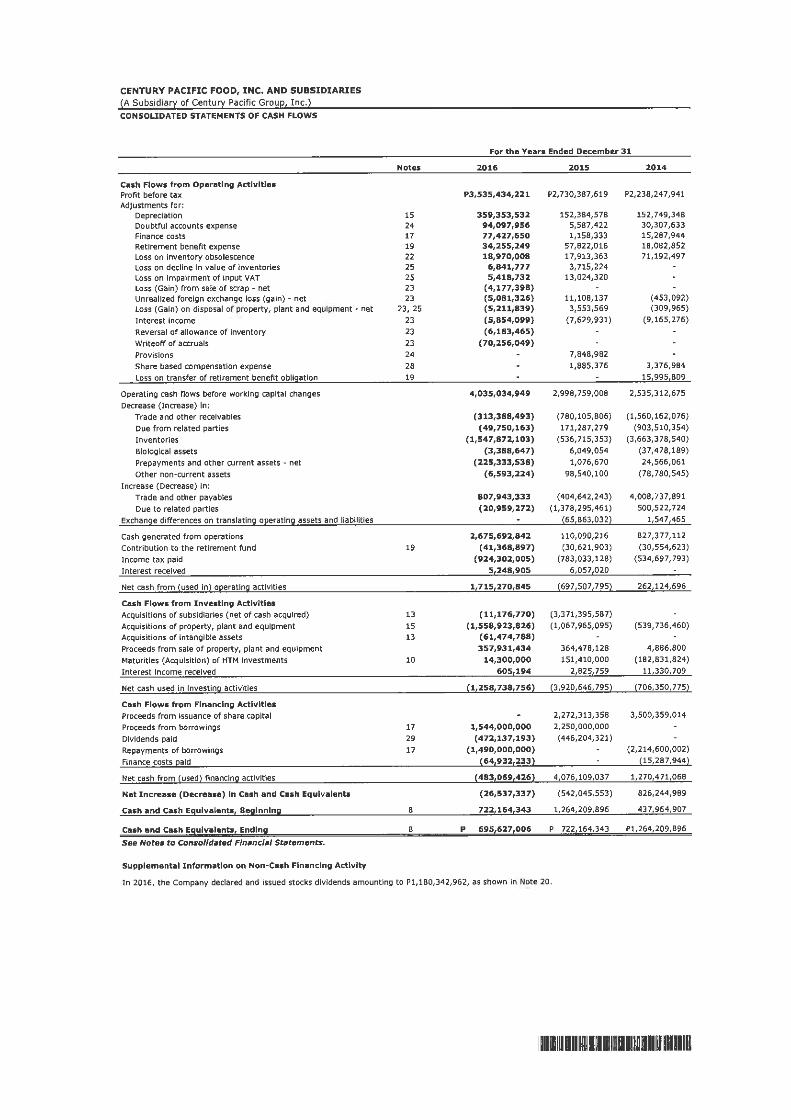
CENTURY PACIFIC FOOD, INC. AND SUBSIDIARIES (A Subsidiary of Century Pacific Group, Inc.) CONSOLIDATED STATEMENTS OF CASH FLOWS
Cash Flow• from Operating Activities Profit before tax Adjustments for:
Depreciation Doubtful accounts expense Finance costs Retirement benefit expense Loss on Inventory obsolescence Loss on decline In value of Inventories Loss on Impairment of Input VAT Loss (Gain) from sale of scrap - net Unrealized foreign exchange loss (gain) - net Loss (Gain) on disposal of property, plant and equipment - net
Interest Income Reversal of allowance of Inventory
Wrlteoff of accruals Provisions Share based compensation expense Loss on transfer of retirement benefit obligation
Operating cash flows before working capital changes Decrease (Increase) In:
Trade and other receivables Due from related parties Inventories Biological assets Prepayments and other current assets - net Other non-current assets
Increase (Decrease) In: Trade and other payables Due to related parties
Exchange differences on translating oeeratlng assets and llabilltles
Cash generated from operations Contribution to the retirement fund Income tax paid Interest received
Net cash from {used In) oeerat1n2 activities
Cash Flows from Inve.tlng Activities Acquisitions of subsidiaries (net of cash acquired) Acquisitions of property, plant and equipment Acquisitions of Intangible assets Proceeds from sale of property, plant and equipment Maturities (Acquisition) of HTM Investments Interest Income received
Net cash used In lnvest1n2 activities
Cash Flows from Financing Activities Proceeds from Issuance of share capital Proceeds from borrowings Dividends paid Repayments of borrowings
Finance costs eald
Net cash from (used) flnanc1n2 activities
Net Increase (Decrease) In Cash and Cash Equivalents
Cash and Cash Egulvalents, Be11Jnnln11
Cash and Cash E9ulvalents, Endln11
See Notes to Consolidated Financial Statements.
Supplemental Information on Non-Cash Financing Activity
Note•
15 24 17 19 22 25 25 23 23
23, 25 23 23 23 24 28 19
19
13 15 13
10
17 29 17
8
8
For the Years Ended December 31
2016 2015 2014
P3,535,434,221 P2, 730,387,619 P2,238,247,941
359,353,532 152,384,578 152,749,348 94,097,956 5,587,422 30,307,633 77,427,650 1,158,333 15,287,944 34,255,249 57,822,016 18,082,852 18,970,008 17,913,363 71,192,497
6,841,777 3,715,224 5,418,732 13,024,320
(4,177,398) (5,081,326) 11,108,137 (453,092) (5,211,839) 3,553,569 (309,965)
(5,854,099) (7,629,931) (9,165,276) (6,183,465)
(70,256,049) 7,848,982 1,885,376 3,376,984
15,995,809
4,035,034,949 2,998,759,008 2,535,312,675
(313,388,493) (780,105,806) (1,560,162,076) (49,750,163) 171,287,279 (903,510,354)
(1,547,872,103) (536,715,353) (3,663,378,540) (3,388,647) 6,049,054 (37,478,189)
(225,333,538) 1,076,670 24,566,061 (6,593,224) 98,540,100 (78,780,545)
807,943,333 (404,642,243) 4,008,737,891 (20,959,272) (1,378,295,461) 500,522,724
(65,863,032) 1,547,465
2,675,692,842 110,090,216 827,377,112 (41,368,897) (30,621,903) (30,554,623)
(924,302,005) (783,033,128) ( 534,697,793) 5 248 905 6,057,020
1,11s,210,s4s {697,507,795) 262,124,696
(11,176,770) (3,371,395,587) (1,558,923,826) (1,067,965,095) (539,736,460)
(61,474,788) 357,931,434 364,478,128 4,886,800
14,300,000 151,410,000 (182,831,824)
605,194 2,825,759 11,330,709
{1,258,738,756) {3,920,646,795) (706,350,775)
2,272,313,358 3,500,359,014
1,544,000,000 2,250,000,000
(472,137,193) (446,204,321) (1,490,000,000) (2,214,600,002)
{64,932,233) {15,287,944)
(483,069,426) 4,076,109,037 1,270,471,068
(26,537,337) (542,045,553) 826,244,989
722,164,343 1,264,209,896 437,964,907
p 695,627, 006 p 722,164,343 Pl,264,209,896
In 2016, the Company declared and Issued stocks dividends amounting to Pl,180,342,962, as shown In Note 20.
llmHHIUIIHHIIWIHIIIIIIU

CENTURY PACIFIC FOOD, INC. AND SUBSIDIARIES (A Subsidiary of Century Pacific Group, Inc.) NOTES TO CONSOLIDATED FINANCIAL STATEMENTS AS AT DECEMBER 31, 2016 AND 2015 AND FOR THE YEARS ENDED DECEMBER 31, 2016, 2015 AND 2014
1. CORPORATE INFORMATION
Century Pacific Food, Inc. (the "Parent Company") was incorporated and registered with the Philippine Securities and Exchange Commission (SEC) on October 25, 2013. The Parent Company is primarily engaged in the business of buying and selling, processing, canning and packaging and manufacturing all kinds of food and food products, such as but not limited to fish, seafood and other marine products, cattle, hog and other animals and animal products, fruits, vegetables and other agricultural crops and produce of land, including by-products thereof.
The Parent Company's shares of stocks were listed in the Philippines Stock Exchange (PSE) on May 6, 2014 through initial public offering (IPO) and listing of 229.65 million shares in the PSE at a total value of P3.3 billion, as discussed in Note 20.
The Parent Company is 68.68% as at December 31, 2016 and 73.72% as at December 31, 2015 owned subsidiary o9f Century Pacific Group, Inc. (CPGI), the ultimate parent, a corporation registered with the SEC and domiciled in the Philippines.
The Parent Company's registered office and principal place of business, is located at 7th floor, Centerpoint Building, Julia Vargas St., Ortigas Center, Pasig City.
2. FINANCIAL REPORTING FRAMEWORK AND BASIS OF PREPARATION AND PRESENTATION
Statement of Compliance
The consolidated financial statements of the Parent Company and its subsidiaries (the "Group") have been prepared in accordance with Philippine Financial Reporting Standards (PFRS), which includes all applicable PFRS, Philippine Accounting Standards (PAS), and interpretations issued by the International Financial Reporting Interpretations Committee (IFRIC), Philippine Interpretations Committee (PIC) and Standing Interpretations Committee (SIC) as approved by the Financial Reporting Standards Council (FRSC) and the Board of Accountancy (BOA), and adopted by the SEC.
Basis of Preparation and Presentation
The consolidated financial statements have been prepared on the historical cost basis, except for:
• certain financial instruments carried at amortized cost; • inventories carried at the lower of cost and net realizable value (NRV); and
• retirement benefit obligation recognized as the net of the present value of the obligation and fair value of plan assets.
Historical cost is generally based on the fair value of the consideration given in exchange for goods and services.
IIIIIIIIIIIIIIIIIIIIIIIIIIIIIIIIIIIIIIIIIIIIIIIIIIIIIIIIIIIIIIIIIIIIIIIIIIIIIIIIIIIIIIIIIIIIIIIIIIIIIIIIIIIIIIIIIII 1

Fair value is the price that will be received to sell an asset or paid to transfer a liability in an orderly transaction between market participants at the measurement date, regardless of whether that price is directly observable or estimated using another valuation technique. In estimating the fair value of an asset or a liability, the Group takes into account the characteristics of the asset or liabil ity if market participants would take those characteristics into account when pricing the asset or liability at the measurement date. Fair value for measurement and/or disclosure purposes in these consolidated financial statements is determined on such a basis, except for share-based payment transactions that are with in the scope of PFRS 2, Share-based Payment, leasing transactions that are within the scope of PAS 17, Leases, and measurements that have some similarities to fair value but are not fair value, such as net realizable value in PAS 2, Inventories or value in use in PAS 36, Impairment of Assets.
In addition, for financial reporting purposes, fair value measurements are categorized into Levels 1, 2 or 3 based on the degree to which the inputs to the fair value measurements are observable and the significance of the inputs to the fair value measurement in its entirety, which are described as follows:
• Level 1 inputs are quoted prices (unadjusted) in active markets for identical assets or liabilities that the entity can access at the measurement date;
• Level 2 inputs are inputs, other than quoted prices included within Level 1, that are observable for the asset or liability, either directly or indirectly; and
• Level 3 inputs are unobservable inputs for the asset or liability.
Functional and Presentation Currency
These consolidated financial statements are presented in Philippine peso, the currency of the primary economic environment in which the Group operates. All amounts are presented in the nearest peso, except when otherwise indicated .
Functional currency
The separate financial statements of General Tuna Corporation (GTC) are presented in United States (US) Dollar, the currency of the primary economic environment in which it operates. In addition, the separate financial statements of Century International (China) Co. Ltd. (CIC), Century (Shanghai) Trading Co. Ltd. (CST) and Cindena Resources Limited (CRL) are presented in Chinese Yuan, the currency of the primary economic environment in which these companies operate.
Presentation currency
The financial statements of GTC, CIC, CST and CRL are presented in Philippine peso as its presentation currency. GTC translated its financial position and results of operations from US Dollar to Philippine Peso, while CIC, CST and CRL translated its financial position from Chinese Yuan to Philippine peso using the following procedures:
• assets and liabilities, except those assets presented at historical costs, for each statement of financial position presented, are presented at the closing rate at the date of that statement of financial position;
• for each period presented, income and expenses recognized in the period by GTC are translated using the average exchange rate at that period; and
• all resulting exchange differences are recognized in other comprehensive income (OCI) as currency translation adjustment.
1111111111111111111111111111111111111111111111111111111111111111111111111111111111111111111111111111111111111111111 2

3. COMPOSITION OF THE GROUP
Details of the Parent Company's subsidiaries as at December 31, 2016 and 2015 are as follows:
Name of Subsidiary
General Tuna Corporation (GTC) Snow Mountain Dairy Corporation (SMDC) Allforward Warehousing Inc. (AWi) Century Pacific Agricultural Ventures, Inc. (CPAVI) Century Pacific Seacrest Inc. (CPSI) Centennial Global Corporation (CGC) Century Pacific Food Packaging Ventures, Inc. (CPFPVI) Century International (Ch ina) Co. Ltd. (CIC) Century (Shanghai) Trading Co. Ltd. (CST) Cindena Resources Limited (CRL)
Ownership Interest 2016 2015
100% 100% 100% 100% 100% 100% 100% 100% 100% 100%
100% 100% 100% 100% 100% 100%
The significant financial information on the financial statements of who lly-owned subsidiaries of the Parent Company are shown below. The summarized financial information represents amounts before intragroup eliminations.
~
GTC was incorporated in the Philippines and was registered with the SEC on March 10, 1997. GTC is presently engaged in manufacturing and exporting private label canned, pouched and frozen tuna products. Its processing plant is located at Purok Lansong, Brgy. Tambler, General Santos City.
The significant information on the audited financial statements of GTC as at December 31, 2016 and 2015 and the resu lts of its operations for the years ended December 31, 2016, 2015 and 2014, as translated to its presentation currency, are as fo llows:
Financial Position Current assets Non-current assets
Total Assets
Current liabilities Non-current liabilities
Total Liabilities
Equity
Results of Operations Revenue Cost and expenses
Profit for the year
~
2016
PS,833,301,439 5,706,345,043
p 126,956,396
2016 2015
P2,838,253,195 P2,657,391,874 790,862,175 798,459,762
3,629,115,370 3,455,851,636
1,932,505,748 2,378,726,302 8,366,279 15,056,760
1,940,872,027 2,393,783,062
Pl,688,243,343 Pl,062,068,574
2015 2014
P5,484,596,163 P5,384,279,468 5,336,462,276 5,225,446,450
p 148,133,887 p 158,833,018
SMDC was incorporated in the Philippines and was registered with the SEC on February 14, 2001. SMDC is engaged in producing, canning, freezing, preserving, refining, packing, buying and selling at wholesale and retail, food products including all kinds of milk and dairy products, fruits and vegetab le juices and other milk or dairy preparations and by-products. Its principal place of business is located at 32 Arturo Drive, Bagumbayan, Taguig City.
1111111111111111111111111111111111111111111111111111 111111111111111111111111111111111111111111111111111111111111111 3
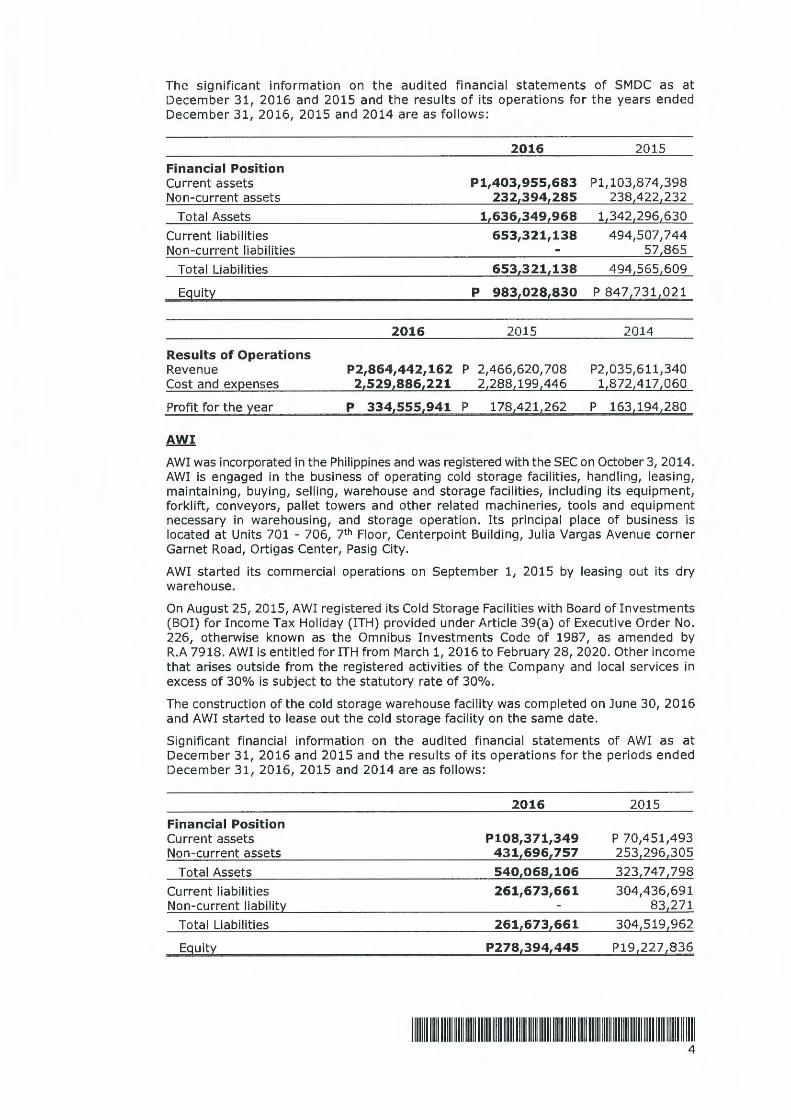
The significant information on the audited financial statements of SMDC as at December 31, 2016 and 2015 and the results of its operations for the years ended December 31, 2016, 2015 and 2014 are as fol lows:
2016 2015
Financial Position Current assets P1,403,955,683 Pl,103,874,398 Non-current assets 232L394L285 23814221232
Total Assets 1L636L349L968 1134212961630
Current liabilities 653,321,138 494,507,744 Non-current liabilities 57 865
Total Liabilities 653L321L138 49415651609
E9uity p 983,028,830 P 847?3 1,021
2016 2015 2014
Results of Operations Revenue P2,864,442,162 p 2,466,620,708 P2,035,611,340 Cost and ex12enses 2L529L886L221 2128811991446 1187214171060
Profit for the year p 334,555,941 p 178,421,262 p 163,194,280
AWi
AWi was incorporated in the Philippines and was registered with the SEC on October 3, 2014. AWi is engaged in the business of operating cold storage facilities, handling, leasing, maintaining, buying, selling, warehouse and storage faci l ities, including its equipment, forkl ift, conveyors, pallet towers and other related machineries, too ls and equipment necessary in warehousing, and storage operation. Its principal place of business is located at Units 701 - 706, 7th Floor, Centerpoint Building, Julia Vargas Avenue corner Garnet Road, Ortigas Center, Pasig City.
AWi started its commercial operations on September 1, 2015 by leasing out its dry warehouse.
On August 25, 2015, AWi registered its Cold Storage Facilities with Board of Investments (BOI) for Income Tax Holiday (ITH) provided under Art icle 39(a) of Executive Order No. 226, otherwise known as the Omnibus Investments Code of 1987, as amended by R.A 7918. AWi is entitled for ITH from March 1, 2016 to February 28, 2020. Other income that arises outside from the registered activities of the Company and local services in excess of 30% is subject to the statutory rate of 30%.
The construction of the cold storage warehouse facility was completed on June 30, 2016 and AWi started to lease out the cold storage faci lity on t he same date.
Significant financia l information on t he audited financial statements of AWi as at December 31, 2016 and 2015 and the results of its operations for the periods ended December 31, 2016, 2015 and 2014 are as follows:
2016 2015
Financial Position Current assets P108,371,349 P 70,451,493 Non-current assets 431L696L757 25312961305
Total Assets 540L068L106 32317471798
Current liabilit ies 261,673,661 304,436,691 Non-current liabilitt: 831271
Tota l Liabilities 261L673L661 30415191962
E9uity P278,394,445 P19,227 ,836
llllllllllllllllllllllllllllllllllllllllllllllllllllllllllllllllllllll~IIIIIIIIIIIIIIIIIIIIIIIIIIIIIIIIIIIIIIIIIII 4

Results of Operations Revenue Cost and expenses
Profit (Loss) for the year
CPAVI
2016 (Twelve Months)
P94,953,114 29,725,083
P65,228,031
2015 2014
(Twelve Months) (Three Months)
P?,311,541 p
5,547,315 764,055
Pl,764,226 (P764,055)
CPAVI was incorporated in the Philippines and was registered with the SEC on August 29, 2012. CPAVI is engaged in the business of manufacturing and distributing all kinds of food and beverage products and other foodstuffs derived from fruits and other agricultural products. Its principal place of business is located at 7th floor, Centerpoint Building, Julia Vargas St. corner Garnet Road, Ortigas, Pasig City.
On December 22, 2015, the Parent Company entered into a share purchase agreement with CPGI to acquire 100% equity interest in CPAVI for a total purchase price of P3,396,810,681. To facilitate the acquisition, the Parent Company availed of short term loans of P2,250,000,000 from certain financial institutions, as disclosed in Note 17. The agreement also provided for the Parent Company to advance to CPAVI a total amount of Pl,103,189,333 for the latter to settle its advances to CPGI. The sale was completed when CPGI and the Parent Company signed the deed of absolute sale covering the CPAVI shares on December 29, 2015. On August 10, 2016, the SEC approved the increase in CPAVI's share capital from P350,000,000 to Pl,500,000,000. On the same date, the advances of the Parent Company was converted to equity shares of stock.
Significant information on the audited financial statements of CPAVI as at and for the years ended December 31, 2016 and 2015 are as follows :
Financial Position Current assets Non-current assets
Total Assets
Current liabilities Non-current liabilities
Total Liabilities
Equity
Results of Operations Revenue Cost and expenses
Profit for the year
~
2016 2015
p 961,982,769 P 581,892,639 1,569,075,810 1,085,239,441
2,531,058,579 1,667,132,080
782,074,282 1,277,062,273 1,052,933 1,502,160
783,127,215 1,278,564,433
P1,747,931,364 P 388,567,647
P2,842,256,837 p 2,578,739,846
p 263,516,991 p
CPS! was incorporated in the Philippines and was registered with the SEC on November 13, 2015. CPS! is engaged in the business of developing and designing, acquinng, selling, transferring, exchanging, managing, licensing, franchising and generally in exercising all rights, powers and privileges of ownership or granting any right or privilege of ownership or any interest to label marks, devices, brands, trademark rights and all other forms of intellectual property, including the right to receive, collect and dispose of any and all payments, dividends, interests and income derived from. On December 28, 2015, CPS! entered into a Trademark Purchase Agreement to purchase certain trademarks owned by CGC for a total consideration of P50,000,000. The trademarks purchased include brands such as "Century Tuna", "Argentina", "555", "Wow Ulam", "Birch Tree", "Fresca", " Lucky 7" and "Angel Evaporada" among others. The purchase price of P50,000,000 remains outstanding as of December 31, 2016. Its principal place of business is located at 7 th Floor, Centerpoint Building, J. Vargas Avenue corner Garnet Road, Ortigas Center, Pasig City.
1111111 111111111111111111111111111111111111111111111111111111111111111111111111111111111111111111111111111111111111 5

CPSI started its commercial operations in 2016.
The significant information on the audited financial statements of CPSI as at December 31, 2016 and 2015 and for the periods ended December 31, 2016 and 2015 are as follows:
Financial Position Current assets Non-current assets
Total Assets
Total Liabilities
Equity
Results of Operations Revenue Cost and expenses
Profit (Loss) for the year
~
2016
P131,875,295 111,474,788 243,350,083 178,666,553
p 64,683,530
2016 (Twelve Months)
P776,737,104 142,507,320
P634,229,784
2015
P 50,000,761 50,113,012
100,113,773
50,376,357
P 49,737,416
2015
(Two Months)
p 1,111 263,695
(P262,584)
CGC was incorporated in the British Virgin Islands (BVI) on November 13, 2006. CGC is a company limited by shares. On February 25, 2015, the Parent Company acquired 100% interest in CGC for $100 or P4,438 from Shining Ray Limited, a who lly owned subsidiary of CPGI. CGC is the corporate vehicle that holds the various brands, trademarks, and related intellectual property of the Century Group of Companies. On December 28, 2015, CGC sold certain trademarks to CPSI for a total consideration of P50,000,000. CGC's registered office is at P.O. Box 957, Offshore Incorporations Centre, Road Town, Tortola, British Virgin Islands and its reg istered agent is Offshore Incorporations Limited.
The significant information on the financial statements of CGC as at December 31, 2016 and 2015 and the results of its operations for the years ended December 31, 2016 and 2015 are as follows:
2016 2015 (Unaudited) (Unaudited)
Financial Position Total Assets PS0,004,438 P50,004,438
Equity PS0,004,438 P50,004,438
Results of Operations Revenue p P50,000,000
Profit for the year p P50,000,000
IIIIIIIIIIIIIIIIIIIIIIIIIIIIIIIIIIIIIIIIIIIIIIIIIIIIIIIIIIIIIIIIIIIIIIIIIIIIIIIIIIIIIIIIIIIIIIIIIIIIIIIIIIIIIIIIIII 6
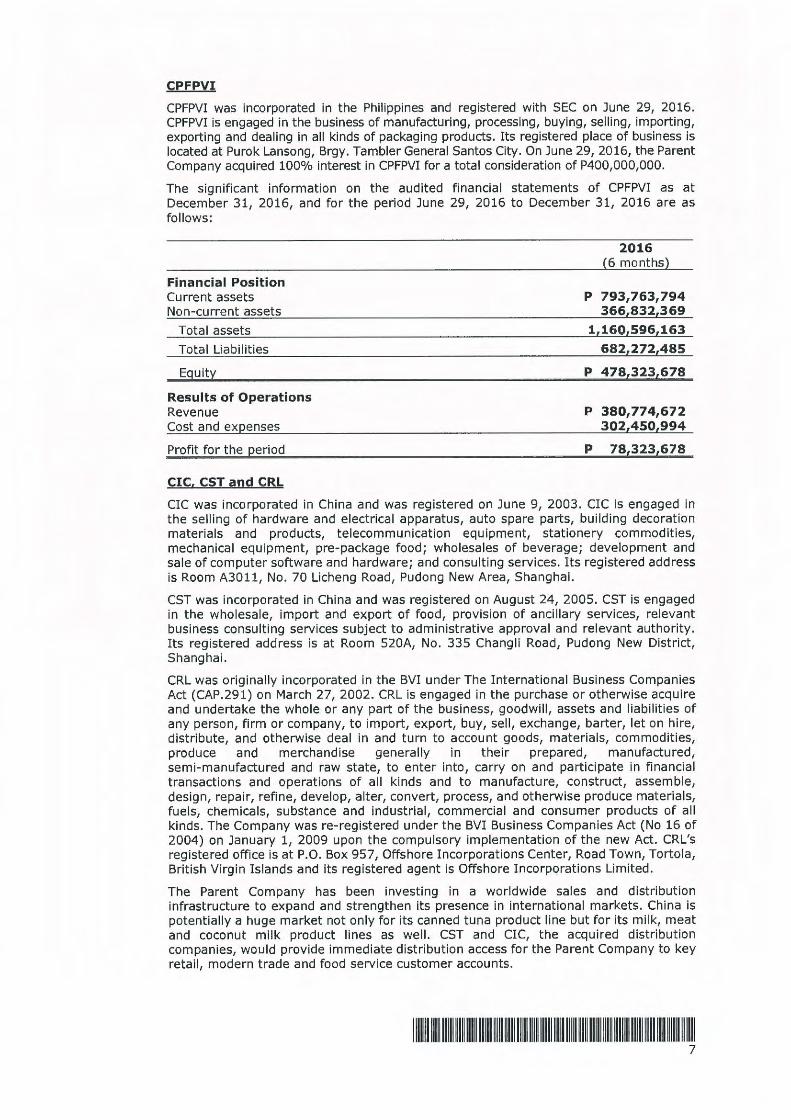
CPFPVI
CPFPVI was incorporated in the Philippines and registered with SEC on June 29, 2016. CPFPVI is engaged in the business of manufacturing, processing, buying, selling, importing, exporting and dealing in all kinds of packaging products. Its registered place of business is located at Purok Lansong, Brgy. Tambler General Santos City. On June 29, 2016, the Parent Company acquired 100% interest in CPFPVI for a total consideration of P400,000,000.
The significant information on the audited financial statements of CPFPVI as at December 31, 2016, and for the period June 29, 2016 to December 31, 2016 are as follows:
Financial Position Current assets Non-current assets
Total assets
Total Liabilities
Equity
Results of Operations Revenue Cost and expenses
Profit for the period
CIC. CST and CRL
2016 (6 months)
P 793,763,794 366,832,369
1,160,596,163 682,272,485
P 478,323,678
P 380,774,672 302,450,994
P 78,323,678
CIC was incorporated in China and was registered on June 9, 2003. CIC is engaged in the selling of hardware and electrical apparatus, auto spare parts, building decoration materials and products, telecommunication equipment, stationery commodities, mechanical equipment, pre-package food; wholesales of beverage; development and sale of computer software and hardware; and consulting services. Its registered address is Room A3011, No. 70 Licheng Road, Pudong New Area, Shanghai.
CST was incorporated in China and was registered on August 24, 2005. CST is engaged in the wholesale, import and export of food, provision of ancillary services, relevant business consulting services subject to administrative approval and relevant authority. Its registered address is at Room 520A, No. 335 Changli Road, Pudong New District, Shanghai.
CRL was originally incorporated in the BVI under The International Business Companies Act (CAP.291) on March 27, 2002. CRL is engaged in the purchase or otherwise acquire and undertake the whole or any part of the business, goodwill, assets and liabilities of any person, firm or company, to import, export, buy, sell, exchange, barter, let on hire, distribute, and otherwise deal in and turn to account goods, materials, commodities, produce and merchandise generally in their prepared, manufactured, semi-manufactured and raw state, to enter into, carry on and participate in financial transactions and operations of all kinds and to manufacture, construct, assemble, design, repair, refine, develop, alter, convert, process, and otherwise produce materials, fuels, chemicals, substance and industrial, commercial and consumer products of all kinds. The Company was re-registered under the BVI Business Companies Act (No 16 of 2004) on January 1, 2009 upon the compulsory implementation of the new Act. CRL's registered office is at P.O. Box 957, Offshore Incorporations Center, Road Town, Tortola, British Virgin Islands and its registered agent is Offshore Incorporations Limited.
The Parent Company has been investing in a worldwide sales and distribution infrastructure to expand and strengthen its presence in international markets. China is potentially a huge market not only for its canned tuna product line but for its milk, meat and coconut milk product lines as well. CST and CIC, the acquired distribution companies, would provide immediate distribution access for the Parent Company to key retail, modern trade and food service customer accounts.
1111111111111111111111111111111111111111111111111111111111111111111111111111111111111111111111111111111111111111111 7
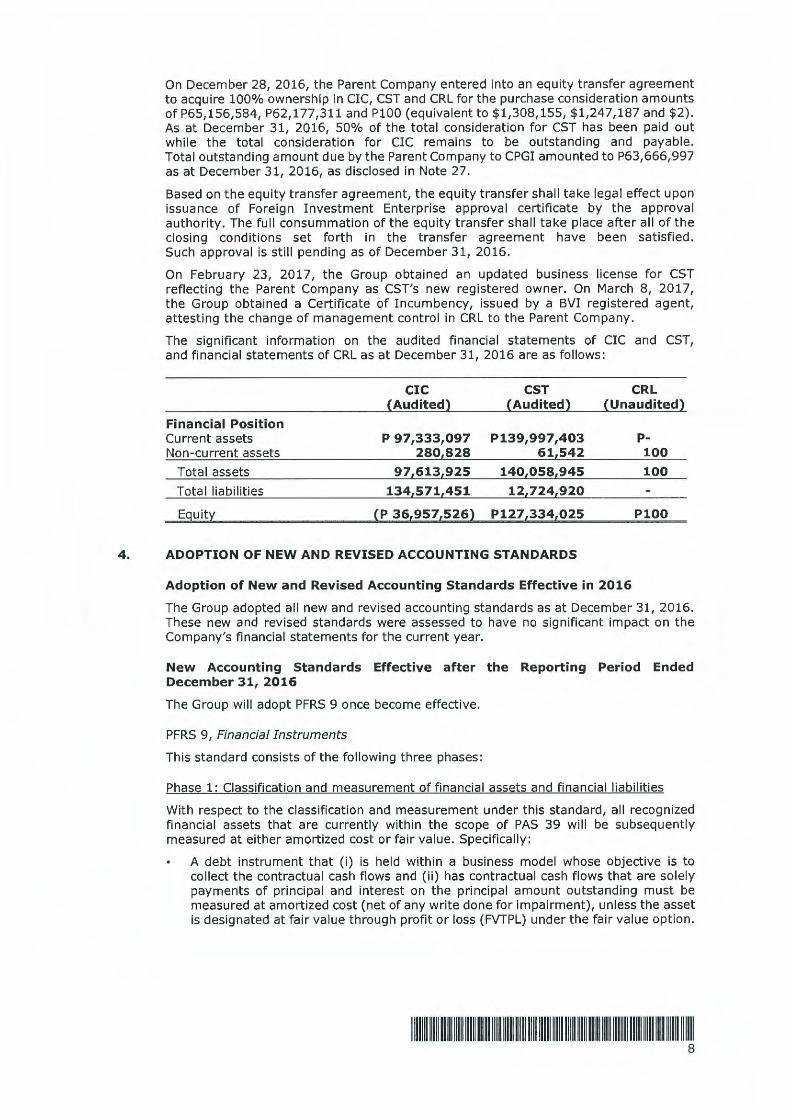
On December 28, 2016, the Parent Company entered into an equity transfer agreement to acquire 100% ownership in CIC, CST and CRL for the purchase consideration amounts of P65,156,584, P62,177,311 and P100 (equivalent to $1,308,155, $1,247,187 and $2) . As at December 31, 2016, 50% of the total consideration for CST has been paid out while the total consideration for CIC remains to be outstanding and payable. Total outstanding amount due by the Parent Company to CPGI amounted to P63,666,997 as at December 31, 2016, as disclosed in Note 27.
Based on the equity transfer agreement, the equity transfer shall take legal effect upon issuance of Foreign Investment Enterprise approval certificate by the approval authority. The full consummation of the equity transfer shall take place after all of the closing conditions set forth in the transfer agreement have been satisfied . Such approval is still pending as of December 31, 2016.
On February 23, 2017, the Group obtained an updated business license for CST reflecting the Parent Company as CST's new registered owner. On March 8, 2017, the Group obtained a Certificate of Incumbency, issued by a BVI registered agent, attesting the change of management contro l in CRL to the Parent Company.
The significant information on the audited financial statements of CIC and CST, and financial statements of CRL as at December 31, 2016 are as follows:
CIC CST CRL {Audited) {Audited) (Unaudited)
Financial Position Current assets P 97,333,097 P139,997,403 P-Non-current assets 280(828 61(542 100
Total assets 97(613(925 140l058l945 100
Total liabilities 134(571(451 12(724(920
E9uitl {P 36,957,526l P127,334,025 P100
4. ADOPTION OF NEW AND REVISED ACCOUNTING STANDARDS
Adoption of New and Revised Accounting Standards Effective in 2016
The Group adopted all new and revised accounting standards as at December 31, 2016. These new and revised standards were assessed to have no significant impact on the Company's financial statements for the current year.
New Accounting Standards Effective after the Reporting Period Ended December 31, 2016
The Group will adopt PFRS 9 once become effective.
PFRS 9, Financial Instruments
This standard consists of the following three phases:
Phase 1: Classification and measurement of financial assets and financial liabilities
With respect to the classification and measurement under this standard, all recognized financial assets that are currently within the scope of PAS 39 will be subsequently measured at either amortized cost or fair value. Specifically :
A debt instrument that (i) is held with in a business model whose objective is to collect the contractua l cash flows and (ii) has contractual cash flows that are so lely payments of principal and interest on the principal amount outstanding must be measured at amortized cost (net of any write done for impairment), unless the asset is designated at fair value through profit or loss (FVTPL) under the fair value option.
1111111 111111111111111111!1111111111111111111111111111111111111111111111111111111111111111111111111111111111111111 8
A debt instrument that (i) is held within a business model whose objective is achieved both by collecting contractual cash flows and selling financial assets and (ii) has contractual terms that give rise on specified dates to cash flows that are solely payments of principal and interest on the principal amount outstanding, must be measured at fair va lue through other comprehensive income (FVTOCI), unless the asset is designated at FVTPL under the fair value option.
All other debt instruments must be measured at FVTPL.
All equity investments are to be measured in the statement of financial position at fair value, with gains and losses recognized in profit or loss except that if an equity investment is not held for trading, an irrevocable election can be made at initial recognition to measure the investment at FVTOCI, with dividend income recognized in profit or loss.
This standard also contains requirements for the classification and measurement of financial liabilities and derecognition requirements. One major change from PAS 39 relates to the presentation of changes in the fair value of a financial liability designated as at FVTPL attributable to changes in the credit risk for the liability. Under this standard, such changes are presented in other comprehensive income, unless the presentation of the effect of the change in the liability credit risk in other comprehensive income would create or enlarge an accounting mismatch in profit or loss. Changes in fair va lue attributable to a financial liabil ity's credit risk are not subsequently reclassified to profit or loss. Under PAS 39, the entire amount of the change in the fair value of the financial liability designated as FVTPL is presented in profit or loss.
Based on the Group's assessment, the classification and measurement of the Group's financial assets at amortized cost and financial liabilities will be the same under both PFRS 9 and PAS 39.
Phase 2: Impairment methodology
The impairment model under this standard reflects expected credit losses, as opposed to incurred credit losses under PAS 39. Under the impairment approach of this standard, it is no longer necessary for a credit event to have occurred before credit losses are recognized. Instead, an entity always accounts for expected credit losses and changes in those expected credit losses. The amount of expected credit losses should be updated at each reporting date to reflect changes in credit risk since initial recognition.
The future adoption of the standard will result in initial measurement of financial assets at amortized cost, net of expected credit losses.
Phase 3: Hedge accounting
The general hedge accounting requirements for this standard retain the three types of hedge accounting mechanism in PAS 39. However, greater flexibility has been introduced to the types of transactions eligible for hedge accounting, specifically broadening the types of instruments that qualify as hedging instruments and the types of risk components of non-financial items that are eligible for hedge accounting. In addition, the effectiveness test has been overhauled and replaced with the principle of economic relationships. Retrospective assessment of hedge effectiveness is no longer required. Far more disclosure requirements about an entity's risk management activities have been introduced.
The standard is effective for annual reporting periods beginning on or after January 1, 2018. Earlier application is permitted.
The Group's initial assessment of PFRS 9's potential impact to its consolidated financial statements provides that it would change the classification of financial assets but it will not affect the measurement of its current types of financial assets. The Group wil l continue its assessment and will finalize the same upon the effective date of the new standard.
IIIIIIIIIIIIIIIIIIIIIIIIIIIIIIIIIIIIIIIIIIIIIIIIIIIIIIIIIIIIIIIIIIIIIIIIIIIIIIIIIIIIIIIIIIIIIIIIIIIIIIIIIIIIIIIIIII 9
PFRS 16, Leases
This standard specifies how a PFRS reporter will recognize, measure, present and disclose leases. It provides a single lessee accounting model, requiring lessees to recognize assets and liabilities for all leases unless the lease term is 12 months or less or the underlying asset has a low value. Lessors continue to classify leases as operating or finance, with PFRS 16's approach to lessor accounting substantially unchanged from its predecessor, PAS 17.
The standard is effective for annual reporting periods beginning on or after January 1, 2019. Earlier application is not permitted, until PFRS 15, Revenue from Contracts with Customers, is adopted.
Future adoption of this standard will result in recognition of right-of-use of asset and lease liability and additional disclosure in the Group's consolidated financial statements.
Amendment to PAS 7, Disclosure Initiative
The amendment clarify that entities shall provide disclosures that enable users of financial statements to evaluate changes in liabilities arising from financing activities.
The amendment is effective for annual reporting periods beginning on or after January 1, 2017. Earlier application is permitted.
Future adoption of this amendment will not have a significant impact on the Group's consolidated financial statements.
Amendments to PAS 12, Recognition of Deferred Tax Assets for Unrealized Losses
The amendments clarify the following aspects:
• Unrealized losses on debt instruments measured at fair value and measured at cost for tax purposes give rise to a deductible temporary difference regardless of whether the debt instrument's holder expects to recover the carrying amount of the debt instrument by sale or by use.
• The carrying amount of an asset does not limit the estimation of probable future taxable profits.
• Estimates for future taxable profits exclude tax deductions resulting from the reversal of deductible temporary differences.
• An entity assesses a deferred tax asset in combination with other deferred tax assets. Where tax law restricts the utilization of tax losses, an entity would assess a deferred tax asset in combination with other deferred tax assets of the same type.
The amendments are effective for annual reporting periods beginning on or after January 1, 2017. Earlier application is permitted.
Future adoption of these amendments will not have a significant impact on the Group's consolidated financia l statements.
Amendments to PFRS 2, Classification and Measurement of Share-based Payment Transactions
The amendments to PFRS 2 include:
a. Accounting for cash-settled share-based payment transactions that contain a performance condition. The amendment added guidance that introduces accounting requirements for cash-settled share-based payments that follows the same approach as used for equity-settled share-based payments.
b. Classification of share-based payment transactions with net settlement features. The amendment has introduced an exception into PFRS 2 so that a share-based payment where the entity settles the share-based payment arrangement net is classified as equity-settled in its entirety provided the share-based payment would have been classified as equity-settled had it not included the net settlement feature.
IIIIIIIIIIIIIIIIIIIIIIIIIIIIIIIIIIIIIIIIIIIIIIIIIIIIIIIIIIIIIIIIIIIIIIIIIIIIIIIIIIIIIIIIIIIIIIIIIIIIIIIIIIIIIIIIIII 10

c. Accounting for modifications of share-based payment transactions from cash-settled to equity-settled. The amendment has introduced the following clarifications:
• On modifications, the original liability recognized in respect of the cash-settled share-based payment is derecognized and the equity-settled share-based payment is recognized at the modification date fair value to the extent services have been rendered up to the modification date.
• Any difference between the carrying amount of the liability as at the modification date and the amount recognized in equity at the same date would be recognized in profit and loss immediately.
The amendments are effective for annual periods beginning on or after January 1, 2018 with earlier application permitted.
The Group's initial assessment of potential impact of adopting PFRS 2 to its consolidated financial statements in the future provides that its current classification and measurement of share-based payment transactions will not be significantly affected. The Group will continue its assessment and will finalize the same upon effective date of standard.
New Accounting Standards Effective After the Reporting Period Ended December 31, 2016 -Adopted by Financial Reporting Standards Council (FRSC) but pending publication in the Official Gazette by the Board of Accountancy
The Group will adopt the following once become effective.
Amendments to PFRS 4, Applying PFRS 9 'Financial Instruments' with PFRS 4 'Insurance Contracts'
The amendments provide two options for entities that issue insurance contracts within the scope of PFRS 4:
• an option that permits entities to reclassify, from profit or loss to other comprehensive income, some of the income or expenses arising from designated financial assets; this is the so-called overlay approach; and
• an optional temporary exemption from applying PFRS 9 for entities whose predominant activity is issuing contracts within the scope of PFRS 4; this is the so-called deferral approach.
The application of both approaches is optional and an entity is permitted to stop applying them before the new insurance contracts standard is applied. An entity applies the deferral approach for annual periods beginning on or after January 1, 2018.
Future adoption of the amendments will not have a significant impact on the Group's consolidated financial statements as the Group does not issue insurance contracts.
Annual Improvements to PFRSs 2014-2016 Cycle
The annual improvements address the following issues:
Amendments to PFRS 1, First- time Adoption of International Financial Reporting Standards
The amendments include the deletion of short-term exemptions stated in the appendix of PFRS 1, because they have now served their intended purpose. The amendments are effective for annual periods beginning on or after January 1, 2018 with earlier application permitted.
Future adoption of these amendments will not have an impact on the Group's consolidated financial statements as the Group is no longer a first time adopter of PFRS.
IIIIIIIIIIIIIIIIIIIIIIIIIIIIIIIIIIIIIIIIIIIIIIIIIIIIIIIIIIIIIIIIIIIIIIIIIIIIIIIIIIIIIIIIIIIIIIIIIIIIIIIIIIIIIIIIIII 11

Amendments to PFRS 12, Disclosure of Interests in Other Entities
The amendments clarify the scope of the standard by specifying that the disclosure requirements in the standard, except for those disclosures needed in the summarized financial for subsidiaries, joint ventures and associates, apply to an entity's interests that are classified as held for sale, as held for distribution or as discontinued operations in accordance with PFRS 5, Non-current Assets Held for Sale and Discontinued Operations.
The amendments are effective for annual periods beginning on or after January 1, 2017 with earl ier application permitted.
The Group will continue its assessment and will finalize the same upon the effective date of standard.
Amendments to PAS 28, Investments in Associates and Joint Ventures
The amendments clarify that the election to measure at FVTPL an investment in an associate or a joint venture that is held by an entity that is a venture capital organization, or other qualifying entity, is available for each investment in an associate or joint venture on an investment-by-investment basis, upon initial recognition.
The amendments are effective for annual periods beginning on or after January 1, 2018 with earlier application permitted.
Future adoption of the amendments will not have a significant impact on the Group's consolidated financial statements.
Amendments to PAS 40, Investment Property - Transfers of Investment Property
The amendments in Transfers of Investment Property (Amendments to IAS 40) are:
• Stating that an entity shall transfer a property to, or from, investment property when, and only when, there is evidence of a change in use. A change of use occurs if property meets, or ceases to meet, the definition of investment property. A change in management's intentions for the use of a property by itself does not constitute evidence of a change in use.
• The list of evidence in paragraph 57(a) - (d) was designated as non-exhaustive list of examples instead of the previous exhaustive list
The amendments are effective for periods beginning on or after January 1, 2018. Earlier application is permitted.
Future adoption of these amendments will not have a significant impact on the Group's consolidated financial statements as the Group does not have an investment property.
Philippine Interpretations IFRIC 22, Foreign Currency Transactions and Advance Consideration
The Interpretation covers foreign currency transactions when an entity recognizes a non-monetary asset or non-monetary liability arising from the payment or receipt of advance consideration before the entity recognizes the related asset, expense or income. It does not apply when an entity measures the related asset, expense or income on initial recognition at fair value or at the fair value of the consideration received or paid at a date other than the date of initial recognition of the non-monetary asset or non-monetary liability.
The interpretation is effective for periods beginning on or after January 1, 2018. Earlier application is permitted.
Future adoption of these interpretations will not have a significant impact on the Group's consolidated financial statements.
1111111111111111111111111111111111111111111111111111111111111111111111111111111111111111111111111111111111111111111 12

PFRS 15, Revenue from Contracts with Customers
The standard combines, enhances, and replaces specific guidance on recognizing revenue with a single standards. An entity will recognize revenue to depict the transfer of promised goods or services to customers in an amount that reflects the consideration to which the entity expects to be entitled in exchange for those goods or services.
It defines a new five-step model to recognize revenue from customer contracts.
• Identify the contract(s) with a customer;
• Identify the performance obligations in the contract;
• Determine the transaction price;
• Allocate the transaction price to the performance obligations in the contract; and
• Recognize revenue when (or as) the entity satisfies a performance obligation.
Application of this guidance will depend on the facts and circumstances present in a contract with a customer and will require the exercise of judgment.
The standard is mandatory for annual reporting periods beginning on or after January 1, 2018. Earlier application is permitted.
The Group's initial assessment of potential impact of adopting PFRS 15 to its consolidated financia l statements in the future provides that its current revenue recognition policy will not be significantly affected. The Group wi ll continue its assessment and will finalize the same upon the effective date of the new standard.
PIC Q&A No. 2016-04, Application of PFRS 15 "Revenue from Contracts with Customers" on Sale of Residential Properties under Pre-completion Contracts
This interpretation applies to the accounting for revenue from the sa le of a residential property unit under pre-completion stage (i.e., construction is on-going or has not yet commenced) by a real estate developer that enters into a Contract to Sel l (CTS) with a buyer, and the developer has determined that the contract is within the scope of PFRS 15 by satisfying all the criteria in paragraph 9 of PFRS 15.
This interpretation does not deal with the accounting for other aspects of real estate sales such as variable considerations, financing components, commissions and other contract costs, timing of sales of completed properties, etc.
Future adoption of this interpretation will not have an impact on the Group's conso lidated financial statements as the Group's revenues do not arise from sale of residential properties.
5. SIGNIFICANT ACCOUNTING POLICIES
Basis of Consolidation
The consolidated financial statements incorporate the financia l statements of the Parent Company and all subsidiaries it controls. Control is achieved when the Parent Company has power over the investee, is exposed, or has rights, to variable returns from its involvement with the investee; and has the ability to use its power to affect its returns.
The Parent Company reassesses whether or not it controls an investee if facts and circumstances indicate that there are changes to one or more of these three elements of control. When the Parent Company has less than a majority of the voting rights of an investee, it has power over the investee when the voting rights are sufficient to give it the practical ability to direct the relevant activities of the investee unilaterally.
The Parent Company considers all relevant facts and circumstances in assessing whether or not the Parent Company's voting rights in an investee are sufficient to give it power, including :
• the size of the Parent Company's holding of voting rights relative to the size and dispersion of holdings of the other vote holders;
• potential voting rights held by the Parent Company, other vote holders or other parties;
llllllllll~IIIIIIIIIIIIIIIIIIIIIIIIIIIIIIIIIIIIIIIIIIIIIIIIIIIIIIIIIIIIIIIIIIIIIIIIIIIIIIIIIIIIIIIIIIIIIIIIIIIIIII 13

• rights arising from other contractual arrangements; and
• any additional facts and circumstances that indicate that the Parent Company has, or does not have, the current ability to direct the relevant activities at the time that decisions need to be made, including voting patterns at previous shareholders' meetings.
Consolidation of a subsidiary begins when the Parent Company obtains control over the subsidiary and ceases when the Parent Company loses control of the subsidiary. The financial statements of the subsidiaries are prepared for the same reporting year as the Parent Company, using uniform accounting policies for like transactions and other events in similar circumstances. When necessary, adjustments are made to the financial statements of subsidiaries to bring their accounting policies in line with the Group's accounting policies. All intragroup assets and liabilities, equity, income, expenses and cash f lows relating to transactions between members of the Group are elim inated in full on consolidation. Unrealized gains and losses are eliminated.
Changes in the Group's ownership interests in subsidiaries that do not result in the Group losing control over the subsidiaries are accounted for as equity transactions. The carrying amounts of the Group's interests and the non-controlling interests are adjusted to reflect the changes in their relative interests in the subsidiaries. Any difference between the amount by which the non-controlling interests are adjusted and the fair value of the consideration paid or received is recognized directly in equity and attributed to owners of the Parent Company.
When the Group loses control of a subsidiary, a gain or loss is recognized in profit or loss and is calcu lated as the difference between (i) the aggregate of the fair value of the consideration received and the fair value of any retained interest and (ii) the previous carrying amount of the assets (including goodwill), and liabilities of the subsidiary and any non-controlling interests. All amounts previously recognized in other comprehensive income in relation to that subsidiary are accounted for as if the Group had directly disposed of the related assets or liabilities of the subsidiary (i.e. reclassified to profit or loss or transferred to another category of equity as specified/permitted by applicable PFRSs). The fair value of any investment retained in the former subsidiary at the date when control is lost is regarded as the fair value on initial recognition for subsequent accounting under PAS 39, when applicable, the cost on initial recognition of an investment in an associate or a joint venture.
Business Combination
Common control business combinations are excluded from the scope of PFRS 3, Business Combinations. However, there are no specific rules under existing PFRS which prescribe how such transactions shall be accounted for. In August 2011, the PIC issued Q&A No. 2011-02, PFRS 3.2, Common Control Business Combinations, to provide guidance in accounting for common control business combinations in order to minimize diversity in the current practices until further guidance is provided by the IASB.
The consensus in Q&A No. 2011-02 provides that common control business combinations shall be accounted for using either (a) the pooling of interests method, or (b) the acquisition method in accordance with PFRS 3. However, where the acquisition method of accounting is selected, the transaction must have commercial substance from the perspective of the reporting entity.
In accordance with PIC Q&A No. 2011-02, the Group's acquisitions of businesses under common control are accounted for using either the acquisition method or the pooling of interest method, depending on the specific circumstances of the acquisition.
1111111111111111111111111111111111111111111111111111111111111111111111111111111111111111111111111111111111111111111 14
Acquisition method
Acquisitions of businesses are accounted for using the acquisition method . The consideration transferred in a business combination is measured at fair value, which is calculated as the sum of the acquisition-date fair values of the assets transferred by the Group, liabilities incurred by the Group to the former owners of the acqu iree and the equity interest issued by the Group in exchange for control of the acquiree. Acquisition related costs are generally recognized in profit or loss as incurred.
At the acquisition date, the identifiable assets acquired and the liabilities assumed are recognized at their fair va lue, except that:
• deferred tax assets or l iabilities, and assets or liabil ities related to employee benefit arrangements are recognized and measured in accordance with PAS 12, Income Taxes and PAS 19, Employee Benefits, respect ively;
• liabi lit ies and equ ity instruments related to share-based payment arrangements of the acquiree or share-based payment arrangement of the Group entered into to replace share-based payment arrangements of the acquiree are measured in accordance with PFRS 2, Share-based Payment at the acquisition date; and
• assets (or disposal groups) that are classified as held for sale in accordance with PFRS 5, Non-current assets Held for Sale and Discontinued Operations are measured in accordance with that standard.
Goodwill is measured as the excess of the sum of the consideration transferred, the amount of any non-contro lling interest in the acquiree, and the fair value of the acqu irer's previously held equity interest in the acquiree (if any) over the net of the acquisition-date amounts of the identifiable assets acquired and the liabilities assumed. If, after reassessment, the net of the acqu isition date amounts of the identifiable assets acquired and liabil ities assumed exceeds the sum of the consideration transferred, the amount of any non-controlling interests in the acquiree and the fair value of the acquirer's previously held interest in the acquiree (if any) is recognized immediately in profit or loss as bargain purchase gain.
When the consideration transferred by the Group in a business combination includes assets or liabilities resulting from a contingent consideration arrangement, the contingent consideration is measured at its acquisition-date fair value and included as part of the consideration transferred in a business combination. Changes in the fair value of the contingent consideration that qualify as measurement period adjustments are adjusted retrospectively, with corresponding adjustments against goodwill. Measurement period adjustments are adjustments that arise from additional information obtained during the measurement period (which cannot exceed one year from acquisition date) about facts and circumstances that existed at the acquisition date.
The subsequent accounting for the changes in fair value of the contingent consideration that do not qualify as measurement period adjustments depends on how the contingent consideration is classified. Contingent consideration that is classified as equ ity is not measured at subsequent reporting dates and its subsequent settlement is accounted for within equity. Contingent consideration that is classified as an asset or a liability is remeasured at subsequent reporting dates in accordance with PAS 39, Financial Instruments: Recognition and Measurement, or PAS 37, Provisions, Contingent Liabilities and Contingent Assets, as appropriate, with the corresponding gain or loss being recognized in profit or loss.
1111111111111111111111111111111111111111111111111111111111111111111111111111111111 111111111111111111111111111111111 15

Pooling of interest method
Common control business combinations are accounted for using the "pooling of interests method".
The pooling of interests method is generally considered to involve the following:
• The assets and liabilities of the combining entities are reflected in the consolidated financial statements at their carrying amounts. No adjustments are made to reflect fair values, or recognize any new assets or liabilities, at the date of the combination that otherwise would have been done under the acquisition method. The only adjustments that are made are those adjustments to harmonize accounting policies;
• No 'new' goodwill is recognized as a result of the combination. The only goodwill that is recognized is any existing goodwill relating to either of the combining entities. Any difference between the consideration paid or transferred and the equity 'acquired' is reflected within equity;
• The consolidated income statement reflects the results of the combining entities for the full year, irrespective of when the combination took place; and
• Comparatives are presented as if the entities had always been combined.
The Group applied the pooling of interest method when it acquired GTC and SMDC as these companies remained to be wholly owned subsidiaries at the time of the acquisition. In 2016, the Group applied the same method in accounting for its acquisition of CRL as there is no commercial substance relating to the acquisition.
Goodwill
Goodwill acquired in a business combination is initially measured at cost being the excess of the cost of business combination over the interest in the net fair value of the acquirer's identifiable assets, liabilities and contingent liabilities. Subsequently, goodwill arising on an acquisition of a business is measured at cost less any accumulated impairment losses.
For purposes of impairment testing, goodwill is allocated to each of the Group's cash-generating units (CGU) that are expected to benefit from the synergies of the combination.
A CGU to which goodwill has been allocated is tested for impairment annually, or more frequently when there is indication that the unit may be impaired. If the recoverable amount of the cash-generating unit is less than its carrying amount, the impairment loss is allocated first to reduce the carrying amount of any goodwill allocated to the unit and then to the other assets of the unit pro rata based on the carrying amount of each asset in the unit. Any impairment loss for goodwill is recognized directly in profit or loss in the consolidated statements of comprehensive income. An impairment loss recognized for goodwill is not reversed in subsequent periods.
On disposal of the relevant CGU, the amount attributable to goodwill is included in the determination of the profit or loss on disposal.
Financial Assets
Initial recognition
Financial assets are recognized in the Group's consolidated financial statements when the Group becomes a party to the contractual provisions of the instrument. Financial assets are recognized initially at fair value. Transaction costs are included in the initial measurement of the Group's financial assets, except for investments classified at FVTPL.
Classification and subsequent measurement
Financial assets are classified into the following specified categories: financial assets at FVTPL, held-to-maturity (HTM) investments, available-for-sale (AFS) financial assets and loans and receivables. The classification depends on the nature and purpose of the financial assets and is determined at the time of initial recognition.
Currently, the Group's financial assets consist of HTM investments and loans and receivables.
IIIIIIIIIIIIIIIIIIIIIIIIIIIIIIIIIIIIIIIIIIIIIIIIIIIIIIIIIIIIIIIIIIIIIIIIIIIIIIIIIIIIIIIIIIIIIIIIIIIIIIIIIIIIIIIIIII 16
Loans and receivables
Loans and receivables are non-derivative financial assets with fixed or determinable payments that are not quoted in an active market. After initial recognition, loans and receivables are subsequently measured at amortized cost using the effective interest method, less any impairment and are included in current assets, except for maturities greater than 12 months after the end of the reporting period.
The effective interest method is a method of calculating the amortized cost of a debt instrument and of allocating interest income over the relevant period. The effective interest rate is the rate that exactly discounts estimated future cash receipts through the expected life of the debt instrument or, when appropriate, a shorter period, to the net carrying amount on initial recognition.
Interest income is recognized by applying the effective interest rate, except for short-term receivables when the recognition of interest would be immaterial.
The Group's loans and receivables consist of cash and cash equivalents, trade and other receivables (excluding advances to suppliers which are applied against future billings, advances to officers and employees which are subject to liquidation, and statutory receivables), due from related parties, refundable security deposits and deposit on utilities.
HTM investments
HTM investments are non-derivative financial assets with fixed or determinable payments and fixed maturity dates that the Group has the positive intent and ability to hold to maturity. Subsequent to initial recognition, HTM investments are measured at amortized cost using the effective interest method less any impairment, with revenue recognized on an effective yield basis.
HTM investments are classified in the consolidated statements of financial position as current when the investment is expected to mature within 12 months after the reporting date. Otherwise, HTM investments are classified as non-current.
Impairment of financia l assets
Financial assets are assessed for indicators of impairment at the end of each reporting period. Financial assets are considered to be impaired when there is objective evidence that, as a result of one or more events that occurred after the initial recognition of the financial asset, the estimated future cash flows of the investment have been affected.
Objective evidence of impairment
For all financial assets carried at amortized cost, objective evidence of impairment could include:
• significant financial difficulty of the issuer or counter party; • breach of contract, such as default or delinquency in interest or principal payments; • it has become probable that the borrower will enter bankruptcy or financial
re-organization;
• the disappearance of an active market for that financial asset because of financial difficulties;
• the lender, for economic or legal reasons relating to the borrower's financial difficulty, granting to the borrower a concession that the lender would not otherwise consider; or
• observable data indicating that there is a measurable decrease in the estimated future cash flows from a group of financial assets since the initial recognition of those assets, although the decrease cannot yet be identified with the individual financial assets in the Group.
IIIIIIIIIIIIIIIIIIIIIIIIIIIIIIIIIIIIIIIIIIIIIIIIIIIIIIIIIIIIIIIIIIIIIIIIIIIIIIIIIIIIIIIIIIIIIIIIIIIIIIIIIIIIIIIIIII 17

For certain categories of financial asset, such as trade receivables, assets that are assessed not to be impaired individually are, in addition, assessed for impairment on a collective basis. Objective evidence of impairment for a portfolio of receivables cou ld include the Group's past experience of collecting payments, an increase in the number of delayed payments in the portfolio past the average credit period as well as observable changes in national or local economic cond itions that correlate with default on receivables.
Financial assets carried at amortized cost
If there is objective evidence that an impairment loss on loans and receivables and HTM investments have been incurred, the amount of the loss is measured as the difference between the asset's carrying amount and the present value of estimated future cash flows, excluding future credit losses that have not been incurred, discounted at the financial asset's original effective interest rate, i.e., the effective interest rate computed at initial recognition .
The carrying amount of financial assets carried at amortized cost is reduced directly by the impairment loss with the exception of trade receivables, wherein the carrying amount is reduced through the use of an allowance account. When trade receivables are considered uncollectible, these are written off against the allowance account. Subsequent recoveries of amounts previously written off are credited against the allowance account. Changes in the carrying amount of the allowance account are recognized in profit or loss.
If, in a subsequent period, the amount of the impairment loss decreases and the decrease can be related objectively to an event occurring after the impairment was recognized, the previously recognized impairment loss shall be reversed. The reversal shall not result in a carrying amount of the financial asset that exceeds what the amortized cost would have been had the impairment not been recognized at the date the impairment is reversed. The amount of the reversal shall be recognized in profit or loss.
Derecoqnition of financial assets
The Group derecognizes financial assets only when the contractual rights to the cash flows from the asset expire; or when the Group transfers the financial asset and substantially all the risk and rewards of ownership of the asset to another party. The difference between the carrying amount of the financial asset and the consideration received or receivable is recognized in profit or loss.
If the Group neither transfers nor retains substantially all the risks and rewards of ownership and continues to control the transferred asset, the Group recognizes its retained interest in the asset and an associated liability for amounts it may have to pay. If the Group retains substantially all the risk and rewards of ownership of a transferred financial asset, the Group continues to recognize the financial asset and also recognizes a collateralized borrowing for the proceeds received.
Inventories
Inventories are initially measured at cost. Subsequently, inventories are stated at the lower of cost and net realizable value. The costs of inventories are calculated using the first-in, first-out method. Net realizable value represents the estimated selling price less all estimated costs of completion and costs necessary to make the sale. The costs of inventories are calculated as follows:
Raw materials Work-in-process Finished goods Finished goods (CPAVI)
Moving average Weighted average Weighted average Moving average
Net realizable value represents the estimated selling price less all estimated costs of completion and costs necessary to make the sale.
1111111111111111111111111111111111111 111111111111111111111111111111111111111111111111111111111 111111111111111 111111 18

When the net realizable value of the inventories is lower than the cost, the Group provides for an allowance for the decline in the value of the inventory and recognizes the write-down as an expense in profit or loss. The amount of any reversal of any write-down of inventories, arising from an increase in net realizable va lue, is recognized as a reduction in the amount of inventories recognized as an expense in the period in which the reversal occurs.
Provision for inventory losses is established for slow moving, obsolete, defective and damaged inventories based on physical inspection and management evaluation. Inventories and its related provision for impairment are written off when the Group has determined that the related inventory is already obsolete and damaged. Write-offs represent the release of previously recorded provision from the allowance account and credited to the related inventory account fol lowing the disposal of the inventories. Destruction of the obsolete and damaged inventories is made in the presence of regulatory agencies.
Reversals of previously recorded impairment provisions are credited in the consolidated statements of comprehensive income based on the result of Management's current statement, considering available facts and circumstances, including but not limited to net realizable value at the time of disposal.
When inventories are sold, the carrying amount of those inventories is recognized as an expense in the period in which the related revenue is recognized.
Spare parts with useful lives of one year or less are classified as inventories and recognized as expense as they are consumed.
Prepayments
Prepayments represent expenses not yet incurred but already paid in cash. Prepayments are initially recorded as assets and measured at the amount of cash paid. Subsequently, these are charged to profit or loss as they are consumed in operations or expire with the passage of time.
Prepayments are classified in the consol idated statements of financial position as current assets when the cost of goods or services related to the prepayments are expected to be incurred within one year or the Group's normal operating cycle, whichever is longer. Otherwise, prepayments are classified as non-current assets.
Biological Assets
Biological assets or agricultural produce are recognized only when the Group controls the assets as a result of past events, it is probable that future economic benefits associated with the assets will flow to the Group and the cost of the assets can be measured reliably.
Biological assets are required to be measured on initial recognition and at the end of each reporting period at fair value less costs to sell, unless fair value cannot be measured reliably. Accordingly, the Management shall exercise its judgment in determining the best estimate of fair value.
After exerting its best effort in determining the fair value of the Group's biological assets, Management believes that the fair value of its biological assets cannot be measured reliably since the market determined prices or values are not avai lable and other methods of reasonably estimating fair value are determined to be clearly unreliable. Thus, the Group measures biological assets at its cost less any accumulated impairment losses.
Biological assets of the Group are classified as consumable biological assets which include fish in farms. The Group manages the growth of fish which will subsequently be used in production upon harvest.
Biological assets are recognized as expense when consumed.
1111111111111111111111111111111111111111111111111111111111111111111111111111111111111111111111111111111111111111111 19

Property, Plant and Equipment
Property, plant and equipment are initially measured at cost. The cost of an item of property, plant and equipment comprises:
its purchase price, including import duties and non-refundable purchase taxes, after deducting trade discounts and rebates; and
any costs directly attributable to bringing the asset to the location and condition necessary for it to be capable of operating in the manner intended by Management.
The cost of self-constructed assets includes the cost of materials and direct labor, any other costs directly attributable to bringing the assets to a working condition for their intended use, the costs of dismantling and removing the items and restoring the site on which they are located.
Purchased software that is integral to the functionality of the related equipment is capitalized as part of that equipment.
At the end of each reporting period, item of property, plant and equipment measured are carried at cost less any subsequent accumulated depreciation and impairment losses. Cost includes expenditure that is directly attributable to the acquisition of the asset. The cost of self-constructed assets includes the cost of materials and direct labor, any other costs directly attributable to bringing the assets to a working condition for their intended use, the costs of dismantling and removing the items and restoring the site on which they are located, and borrowing costs on qualifying assets.
Subsequent expenditures relating to an item of property, plant and equipment that have already been recognized are added to the carrying amount of the asset when it is probable that future economic benefits, in excess of the originally assessed standard of performance of the existing asset, will flow to the Group. All other subsequent expenditures are recognized as expenses in the period in which those are incurred.
Major spare parts and stand-by equipment qualify as property, plant and equipment when the Group expects to use them for more than one year. Similarly, if the spare parts and servicing equipment can be used only in connection with an item of property, plant and equipment, they are accounted for as property, plant and equipment.
Depreciation is computed on the straight-line method, other than construction in progress, based on the estimated useful lives of the assets as follows:
Buildings Building improvements Plant, machinery and equipment Transportation and delivery equipment Office furniture, fixtures and equipment Laboratory tools and equipment Land improvements Computer equipment
15 - 35 years 5 - 15 years 2 - 40 years 5 - 9 years 2 - 5 years
1 - 15 years 5 - 15 years 2 - 5 years
Properties in the course of construction for production, rental, administrative purposes or for purposes not yet determined, are carried at cost less any recognized impairment loss. Cost includes professional fees and capitalized borrowing costs in the case of qualifying assets. Depreciation commences at the time the assets are ready for their intended use.
Leasehold improvements are depreciated over the improvements useful life of 5 years or when shorter, the term of the relevant lease.
Spare parts and properties in the course of construction for production or for purposes not yet determined are carried at cost, less any recognized impairment loss. Cost includes professional fees and for qualifying assets, borrowing costs capitalized in accordance with the Group's accounting policy. Depreciation of these assets, on the same basis as other property assets, commences at the time the assets are ready for their intended use.
1111111111111111111111111111111111111111111111111111111111111111111111111111111111111111111111111111111111111111111 20
An item of property, plant and equipment is derecognized upon disposal or when no future economic benefits are expected to arise from the continued use of the asset. Gain or loss arising on the disposal or retirement of an asset is determined as the difference between the sales proceeds and the carrying amount of the asset and is recognized in the profit or loss.
Intangible Assets
Intangible assets are initially measured at cost. Subsequent to initial recognition, intangible assets with finite useful lives that are acquired separately are carried at cost less accumulated amortization and accumulated impairment losses. Amortization is recognized on a straight-line basis over the estimated useful lives. The estimated useful life and the amortization method are reviewed at the end of each reporting period, with the effect of any changes in estimate being accounted for on a prospective basis .
Intangible assets, such as trademarks, with indefinite useful lives that are acquired separately are carried at cost less accumulated impairment losses.
Intangible assets acquired in a business combination and recognized separately from goodwill are initially recognized at their fair value at the acquisition date. Subsequent to initial recognition, intangible assets acquired in a business combination are reported at cost less accumulated amortization and accumulated impairment losses, on the same basis as intangible assets that are acquired separately.
An intangible asset is derecognized on disposal, or when no future economic benefits are expected from use or disposal. Gains or losses arising from derecognition of an intangible asset, measured as the difference between the net disposal proceeds and the carrying amount of the asset, and are recognized in profit or loss when the asset is derecognized.
Impairment of Tangible and Intangible Assets
At the end of the reporting period, the Group assesses whether there is any indication that any of its tangible assets may have suffered an impairment loss. If any such indication exists, the recoverable amount of the asset is estimated in order to determine the extent of the impairment loss, if any. When it is not possible to estimate the recoverable amount of an individual asset, the Group estimates the recoverable amount of the CGU to which the asset belongs. When reasonable and consistent basis of allocation can be identified, assets are also allocated to individual CGUs, or otherwise they are allocated to the smallest group of CGUs for which a reasonable and consistent allocation basis can be identified.
Intangible assets with indefinite useful lives, such as trademarks, and intangible assets not yet available for use are tested for impairment annually and whenever there is an indication that the asset may be impaired.
Recoverable amount is the higher of fair value less costs to sell and value-in-use. In assessing value-in-use, the estimated future cash flows are discounted to their present value using a pre-tax discount rate that reflects current market assessments of the time value of money and the risks specific to the asset for which the estimates of future cash flows have not been adjusted.
If the recoverable amount of an asset or CGU is estimated to be less than its carrying amount, the carrying amount of the asset or CGU is reduced to its recoverable amount. An impairment loss is recognized as an expense in profit or loss. Impairment losses recognized in respect of CGUs are allocated to the assets in the unit on a pro-rata basis.
Impairment losses recognized in prior periods are assessed at the end of each reporting period for any indications that the loss has decreased or no longer exists. An impairment loss is reversed if there has been a change in the estimates used to determine the recoverable amount. An impairment loss is reversed only to the extent that the asset's carrying amount does not exceed the carrying amount that would have been determined, net of depreciation or amortization, if no impairment loss had been recognized . A reversal of an impairment loss is recognized as income.
1111111111111111111111111111111111111111111111111111111111111111111111111111111111111111111111111111111111111111111 21
Financial Liabilities and Equity Instruments
Classification as debt or equity
Debt and equity instruments are classified as either financial liabilities or as equity in accordance with the substance of the contractual arrangements and the definitions of a financial liability and equity instrument.
Financial liabilities
Initial recognition
Financial liabil ities are recognized in the Group's consolidated financial statements when the Group becomes a party to the contractual provisions of the instrument. Financial liabilities are initially recognized at fair value. Transaction costs are included in the initial measurement of the Group's financial liabilities except for debt instruments classified at FVTPL.
The Group's financial liabilities measured at amortized cost consist mainly of trade and other payables, borrowings, due to related parties and other current liabilities.
Subsequent measurement
Financial liabilities are subsequently measured at amortized cost using the effective interest method, with interest expense recognized on an effective yield basis.
The effective interest method is a method of calculating the amortized cost of a financial liability and of allocating interest expense over the relevant period. The effective interest rate is the rate that exactly discounts estimated future cash payments including all fees and points paid or received that form an integral part of the effective interest rate, transaction costs and other premiums or discounts through the expected life of the financial liability or, when appropriate, a shorter period, to the net carrying amount on initial recognition.
Since the Group does not have financial liabilities classified at FVTPL, all financia l liabilities are subsequently measured at amortized cost using the effective interest method, with interest expense recognized on an effective yield basis.
Offsetting financial instruments
Financial assets and liabilities are offset and the net amount reported in the consolidated statements of financial position when there is a legally enforceable right to offset the recognized amounts and there is an intention to settle on a net basis or realize the asset and settle the liability simultaneously.
A right to offset must be available today rather than being contingent on a future event and must be exercisable by any of the counterparties, both in the normal course of business and in the event of default, insolvency or bankruptcy.
Derecognition
Financial liabilities are derecognized by the Group when the obligation under the liability is discharged, cancelled or expired . The difference between the carrying amount of the financial liabil ity derecognized and the consideration paid and payable is recognized in profit or loss.
Equity instruments
An equ ity instrument is any contract that evidences a residual interest in the assets of the Group after deducting all of its liabilities. Equity instruments issued by Group are recognized at the proceeds received, net of direct issue costs.
Share capital
Share capital are classified as equity. Incremental costs directly attributable to the issue of new shares are shown in equity as a deduction from the proceeds, net of tax.
IIIIIIIIIIIIIIIIIIIIIIIIIIIIIIIIIIIIIIIIIIIIIIIIIIIIIIIIIIIIIIIIIIIIIIIIIIIIIIIIIIIIIIIIIIIIIIIIIIIIIIIIIIIIIIIIIII 22
Share premium
Share premium represents the excess over the par-value received on subscriptions for the Group's shares which is represented in equity. When the shares are sold at a premium, the difference between the proceeds and the par value is credited to the share premium.
Direct costs incurred related to equity issuance are chargeable to share premium account. If additional paid-in capital is not sufficient, the excess is charged against retained earnings.
Currency translation adjustment
Currency translation adjustment represents the exchange differences resulting from translating the financial position and results of operations of GTC and financial position of CIC, CRL and CST, whose functional currencies differ from the functional currency of the Group.
Retained earnings
Retained earnings represent accumulated profits and losses attributable to equity holders of the Group after deducting dividends declared. Retained earnings may also include the effect of changes in accounting policy as may be required by the standard's transitional provisions.
Provisions
Provisions are recognized when the Group has a present obligation, either legal or constructive, as a result of a past event, and it is probable that the Group will be required to settle the obligation through an outflow of resources embodying economic benefits, and the amount of the obligation can be estimated reliably.
The amount of the provision recognized is the best estimate of the consideration required to settle the present obligation at the end of each reporting period, taking into account the risks and uncertainties surrounding the obligation. When a provision is measured using the cash flows estimated to settle the present obligation, its carrying amount is the present value of those cash flows.
When some or all of the economic benefits required to settle a provision are expected to be recovered from a third party, the receivable is recognized as an asset if it is virtually certain that reimbursement will be received and the amount of the receivable can be measured reliably.
Provisions are reviewed at the end of each reporting period and adjusted to reflect the current best estimate.
If it is no longer probable that a transfer of economic benefits will be required to settle the obligation, the provision shou ld be reversed.
Share-based Payments
Equity-settled share-based payments
Equity-settled share-based payments to employees and others providing similar services are measured at the fair value of the equity instruments at the grant date.
The fair value determined at the grant date of the equity-settled share-based payments to employees is recognized as expense on a straight-line basis over the vesting period, based on the Group's estimate of equ ity instruments that will eventually vest, with a corresponding increase in equity. At end of each reporting period, the Group revises its estimate of the number of equity instruments expected to vest. The impact of the revision of the original estimates, if any, is recognized in profit or loss such that the cumulative expense reflects the revised estimate, with a corresponding adjustment to the equity-settled employee benefits reserve.
lllllllllllllllllllllllllllllllllllllllllllllllllllllllllllllllllllllllllllllllllllllllllllllllllllllllllllllllllll 23

Equity-settled share-based payment transactions with other parties are measured at the fair value of the goods or services received, except when the fair value cannot be estimated reliably, in which case they are measured at the fair value of the equity instruments granted, measured at the date the entity obtains the goods or the counterparty renders the service.
Employee Benefits
Short-term benefits
The Group recognizes a liability net of amounts already paid and an expense for services rendered by employees during the accounting period that are expected to be settled wholly before 12 months after the end of the reporting period. A liability is also recognized for the amount expected to be paid under short-term cash bonus if the Group has a present legal or constructive obligation to pay this amount as a result of past service provided by the employee, and the obligation can be estimated reliably.
Short-term employee benefit obligations are measured on an undiscounted basis and are expensed as the related service is provided.
Post-employment benefits
The Group classifies its retirement benefit as defined benefit plans. Under the defined benefit plans, the cost of providing benefits is determined using the projected unit credit method, with actuarial valuations being carried out at the end of each annual reporting period. Remeasurement, comprising actuarial gains and losses, the effect of the changes to the asset ceiling (if applicable) and the return on plan assets (excluding interest), is reflected immediately in the consolidated statements of financial position with a charge or credit recognized in other comprehensive income in the period in which they occur. Remeasurement recognized in other comprehensive income is reflected immediately in retained earnings and will not be reclassified to profit or loss. Past service cost is recognized in profit or loss in the period of a plan amendment. Net interest is calculated by applying the discount rate at the beginning of the period to the net defined benefit liability or asset.
Retirement benefit costs are categorized as follows:
• Service cost (including current service cost, past service cost, as well as gains and losses on curtailments and settlements).
• Net interest expense or income.
• Remeasurement.
The Group presents the first two components of retirement benefit costs in profit or loss. Curtailment gains and losses are accounted for as past service costs.
The retirement benefit obligation recognized in the consolidated statements of financial position represents the actual deficit or surplus in the Group's defined benefit plans. Any surplus resulting from this calculation is limited to the present value of any economic benefits available in the form of refunds from the plans or reductions in future contributions to the plans. For defined benefit retirement plans, the cost of providing benefits is determined using the projected unit credit method, with actuarial valuations being carried out at the end of each annual reporting period.
Revenue Recognition
Revenue is recognized to the extent that it is probable that the economic benefits will flow to the Group and the revenue can be measured reliably. Revenue is measured at the fair value of the consideration received or receivable and represents amounts receivable for goods and services provided in the normal course of business.
IIIIIIIIIIIIIIIIIIIIIIIIIIIIIIIIIIIIIIIIIIIIIIIIIIIIIIIIIIIIIIIIIIIIIIIIIIIIIIIIIIIIIIIIIIIIIIIIIIIIIIIIIIIIIIIIIII 24
Sale of goods
Revenue from the sale of goods in the course of ordinary activities is measured at the fair value of the consideration received or receivable, net of returns, trade discounts and volume rebates . Revenue from sale of goods is recognized when the goods are delivered and titles have passed, at which all the following conditions are satisfied:
• the Group has transferred to the buyer the significant risks and rewards of ownership of the goods;
• the Group retains neither continuing managerial involvement to the degree usually associated with ownership nor effective control over the goods sold;
• the amount of revenue can be measured reliably; • it is probable that the economic benefits associated with the transaction will flow to
the Group; and • the costs incurred or to be incurred in respect of the transaction can be measured
reliably.
If it is probable that discounts will be granted and the amount can be measured reliably, then the discount is recognized as a reduction of revenue as the sales are recognized.
Service income
Service income is recognized in the accounting periods in which the services are rendered and when it is probable that the economic benefits wi ll flow to the Group and it can be measured reliably.
Royalty income
Royalty income is recognized on an accrual basis in accordance with the substance of the relevant agreement. Royalties determined on a time basis are recognized on a straight-line basis over the period of the agreement. Royalty arrangements that are based on production, sa les and other measures are recognized by reference to the underlying arrangement.
Rental income
Revenue recognition for rental income is disclosed in the Group's policy for leases.
Commission income
Commission income is recognized when earned, based on the terms of the agreement.
Interest income
Interest income is accrued on a time proportion basis, by reference to the principal outstanding and at the effective interest rate applicable, which is the rate that exactly discounts estimated future cash receipts through the expected life of the financial asset to that asset's net carrying amount.
Dividend income
Dividend income from investments is recognized when the shareholders' rights to receive payment have been established, provided that it is probable that the future economic benefits will flow to the Group and the amount of income can be measured reliably.
Other income
Other income is income generated outside the normal course of business and is recognized when it is probable that the economic benefits will flow to the Group and it can be measured reliably.
IIIIIIIIIIIIIIIIIIIIIIIIIIIIIIIIIIIIIIIIIIIIIIIIIIIIIIIIIIIIIIIIIIIIIIIIIIIIIIIIIIIIIIIIIIIIIIIIIIIIIIIIIIIIIIIIIII 25

Expense Recognition
Expenses are recognized in profit or loss when decrease in future economic benefit related to a decrease in an asset or an increase in a liability has arisen that can be measured reliably. Expenses are recognized in profit or loss: on the basis of a direct association between the costs incurred and the earning of specific items of income; on the basis of systematic and rational allocation procedures when economic benefits are expected to arise over several accounting periods and the association with income can only be broadly or indirectly determined; or immediately when an expenditure produces no future economic benefits or when, and to the extent that, future economic benefits do not qualify, or cease to qualify, for recognition in the consolidated statements of financial position as an asset.
Expenses in the consolidated statement of comprehensive income are presented using the function of expense method. Costs of sales are expenses incurred that are associated with the goods sold and includes raw materials used, direct labor and manufacturing overhead. Operating expenses are costs attributable to administrative, marketing, selling and other business activities of the Group.
Leases
Leases are classified as finance leases whenever the terms of the lease transfer substantially all the risks and rewards of ownership to the lessee. All other leases are classified as operating leases.
The Group as lessor
Rental income from operating leases is recognized as income on a straight-line basis over the term of the relevant lease. Benefits received and receivable as an incentive to enter into an operating lease are also spread on a straight-line basis over the lease term.
Initial direct costs incurred by the Group in negotiating and arranging an operating lease is added to the carrying amount of the leased asset and recognized as an expense over the lease term on the same basis as the lease income.
The Group as lessee
Operating lease payments are recognized as an expense on a straight-line basis over the lease term, except when another systematic basis is more representative of the time pattern in which economic benefits from the leased asset are consumed. Contingent rentals arising under operating leases are recognized as an expense in the period in which they are incurred.
In the event that lease incentives are received to enter into operating leases, such incentives are recognized as a liability. The aggregate benefit of incentives is recognized as a reduction of rental expense on a straight-line basis, except when another systematic basis is more representative of the time pattern in which economic benefits from the leased asset are consumed.
Foreign Currency
Foreign currency transactions
Transactions in currencies other than functional currency of the Group are recorded at the rates of exchange prevailing on the dates of the transactions. At the end of each reporting period, monetary assets and liabilities that are denominated in foreign currencies are retranslated at the rates prevailing at the end of the reporting period.
Non-monetary assets and liabilities carried at fair value that are denominated in foreign currencies are translated at the rates prevailing at the date the fair value was determined. Gains and losses arising on retranslation are included in profit or loss for the year, except for exchange differences arising on non-monetary assets and liabilities when the gains and losses of such non-monetary items are recognized directly in equity. Non-monetary assets and liabilities that are measured in terms of historical cost in a foreign currency are not retranslated.
IIIIIIIIIIIIIIIIIIIIIIIIIIIIIIIIIIIIIIIIIIIIIIIIIIIIIIIIIIIIIIIIIIIIIIIIIIIIIIIIIIIIIIIIIIIIIIIIIIIIIIIIIIIIIIIIIII 26

Exchange differences on monetary items are recognized in profit or loss in the period in which they arise except for:
• Exchange differences on foreign currency borrowings relating to assets under construction for future productive use, which are included in the cost of those assets when they are regarded as adjustments to interest costs on those foreign currency borrowings.
• Exchange differences on transactions entered into in order to hedge certain foreign currency risks.
• Exchange differences on monetary items receivable from or payable to a foreign operation for which settlement is neither planned nor likely to occur, which are recognized initially in other comprehensive income and reclassified from equity to profit or loss on repayment of the monetary items.
Foreign operations
For the purposes of presenting these consolidated financial statements, the assets and liabilities of the Group's foreign operations are translated into Philippine peso using exchange rates prevailing at the end of each reporting period . Income and expense items are translated at the average exchange rates for the period, unless exchange rates fluctuate significantly during that period, in which case the exchange rates at the dates of the transactions are used. Exchange differences arising, if any, are recognized in other comprehensive income and accumulated in equity (and attributed to non-controlling interests as appropriate).
On the disposal of a foreign operation (i.e. a disposal of the Group's entire interest in a foreign operation, or a disposal involving loss of control over a subsidiary that includes a foreign operation, or a partial disposal of an interest in a joint arrangement or an associate that includes a foreign operation of which the retained interest becomes a financial asset), all of the exchange differences accumulated in equity in respect of that operation attributable to the owners of the Group are reclassified to profit or loss.
In addition, in relation to a partial disposal of a subsidiary that includes a foreign operation that does not result in the Group losing control over the subsidiary, the proportionate share of accumulated exchange differences are re-attributed to non-controlling interests and are not recognized in profit or loss. For all other partial disposals (i.e. partial disposals of associates or joint arrangements that do not result in the Group losing significant influence or joint control), the proportionate share of the accumulated exchange differences is reclassified to profit or loss.
Goodwill and fair value adjustments to identifiable assets acquired and liabilities assumed through acquisition of a foreign operation are treated as assets and liabilities of the foreign operation and translated at the rate of exchange prevailing at the end of each reporting period. Exchange differences arising from that transaction are recognized in other comprehensive income.
Translation to foreign currency
The separate financial statements of GTC, CIC, CRL and CST whose functional currencies differ from the functional currency of the Group are translated to Philippine peso using the prevailing current exchange rate for the statements of the financial position accounts, except those which are translated at historical costs, and average rate during the period for the statements of comprehensive income accounts. Any resulting difference from the translation is charged to currency translation adjustments in OCI.
llllllllllllllllllllllllllllllllllllllllllllllllllllllllllllllllllllllilllllllllllllllllllllllllllllllllllllllllll 27
Borrowing Costs
Borrowing costs directly attributable to the acquisition, construction or production of qualifying assets, which are assets that necessarily take a substantial period of time to get ready for their intended use or sale, are added to the cost of those assets, until such time as the assets are substantially ready for their intended use or sale.
Investment income earned on the temporary investment of specific borrowings pending their expenditure on qualifying assets is deducted from the borrowing costs eligible for capitalization.
All other borrowing costs are recognized in profit or loss in the period in which they are incurred. Borrowing costs are expensed in full when the amounts are not material.
Related Party Transactions
A related party transaction is a transfer of resources, services or obligations between the Group and a related party, regardless of whether a price is charged.
Parties are considered related if one party has control, joint control, or significant influence over the other party in making financial and operating decisions. An entity that is a post-employment benefit plan for the employees of the Group and the key management personnel of the Group are also considered to be related parties .
Upon consolidation, significant intra-group balances are eliminated to reflect the Group's consolidated financial position and performance as a single entity.
Taxation
Income tax expense represents the sum of current tax expense and deferred tax .
Current tax
The current tax expense is based on taxable profit for the period. Taxable profit differs from net profit as reported in the consolidated statements of comprehensive income because it excludes items of income or expense that are taxable or deductible in other years and it further excludes items that are never taxable or deductible. The Group's current tax expense is calculated using 30% regular corporate income tax (RCIT) rate or 2% minimum corporate income tax (MCIT) rate, whichever is higher. CPSI and CPFPVI use Optional Standard Deduction (OSD), while other subsidiaries use itemized deductions in the computation of their respective taxable income. GTC's frozen tuna loins operation was granted an ITH for a period of three years beginning February 1, 2013. Furthermore, AWI's cold storage facilities which are registered with BOI were granted 100% exemption from corporate income tax for a period of four years beginning March 1, 2016.
Deferred tax
Deferred tax is recognized on temporary differences between the carrying amounts of assets and liabilities in the consolidated financial statements and the corresponding tax base used in the computation of taxable profit. Deferred tax l iabilities are generally recognized for all taxable temporary differences, while deferred tax assets are genera lly recognized for all deductible temporary differences to the extent that it is probable that taxable profits will be available against which those deductible temporary differences can be utilized.
Deferred tax liabilities are recognized for taxable temporary differences arising on investments in subsidiaries and associates, except when the Group is able to control the reversal of the temporary difference and it is probable that the temporary difference will not reverse in the foreseeable future. Deferred tax assets arising from deductible temporary differences associated with such investments and interests are only recognized to the extent that it is probable that there will be sufficient taxable profits against which to utilize the benefits of the temporary differences and they are expected to reverse in the foreseeable future.
The carrying amount of deferred tax assets is reviewed at the end of each reporting period and reduced to the extent that it is no longer probable that sufficient taxable profits will be available to allow all or part of the asset to be recovered.
IIIIIIIIIIIIIIIIIIIIIIIIIIIIIIIIIIIIIIIIIIIIIIIIIIIIIIIIIIIIIIIIIIIIIIIIIIIIIIIIIIIIIIIIIIIIIIIIIIIIIIIIIIIIIIIIIII 28
Deferred tax liabilities and assets are measured at the tax rates that are expected to apply in the period in which the liability is settled or the asset realized, based on tax rates and tax laws that have been enacted or substantively enacted by the end of the reporting period. The measurement of deferred tax liabilities and assets reflects the tax consequences that would follow from the manner in which the Group expects, at the end of the reporting period, to recover or settle the carrying amount of its assets and liabilities.
Current and deferred tax for the year
Current and deferred taxes are recognized as an expense or income in profit or loss, except when they relate to items that are recognized outside profit or loss, whether in other comprehensive income or directly in equity, in which case, the current and deferred tax are also recognized outside profit or loss. Where current tax or deferred tax arises from the initial accounting for a business combination, the tax effect is included in the accounting for the business combination.
Earnings per Share
The Group computes its basic earnings per share by dividing profit for the period attributable to ordinary equity holders of the Parent Company by the weighted average number of common shares outstanding during the period.
For the purpose of calculating diluted earnings per share, profit for the period attributable to ordinary equity holders of the Parent Company and the weighted average number of shares outstand ing are adjusted for the effects of dilutive potential ordinary shares.
Segment Reporting
An operating segment is a component of the Group that engages in business activities from which it may earn revenues and incur expenses, including revenues and expenses that relate to transactions with any of the Group's other components. All operating segments' operating results are reviewed regularly by the Group's Chief Operating Decision Maker (CODM) to make decisions about resources to be allocated to t he segment and assess its performance, and for wh ich discrete financial information is available.
The Group reports separately, information about an operating segment that meets any of the following quantitative thresholds:
• its reported revenue, including both sales to external customers and inter-segment sales or transfers, is 10% or more of the combined revenue, internal and external, of all operating segments, provided that;
• the absolute amount of its reported profit or loss is 10% or more of the greater, in absolute amount, of the combined reported profit of all operating segments that did not report a loss and the combined reported loss of all operating segments that reported a loss; and
• Its assets are 10% or more of the combined assets of all operating segments.
Operating segments that do not meet any of the quantitative thresholds may be considered reportable, and separately disclosed, if Management believes that information about the segment would be useful to users of the consolidated financial statements.
For Management purposes, the Group is currently organized into seven business segments namely: Canned and Processed fish, Canned Meat, Milk, Tuna Export, Coco Water, Packaging and Corporate. These divisions are the basis on which the Group reports its primary segment information.
Segment capital expenditure is the total cost incurred during the period to acquire property, plant and equipment, and intangible assets other than goodwill.
Financial information on segment reporting is presented in Note 7.
IIIIIIIIIIIIIIIIIIIIIIIIIIIIIIIIIIIIIIIIIIIIIIIIIIIIIIIIIIIIIIIIIIIIIIIIIIIIIIIIIIIIIIIIIIIIIIIIIIIIIIIIIIIIIIIIIII 29
Provisions, Contingent Liabilities and Contingent Assets
Provisions
Provisions are recognized when the Group has a present obligation, either legal or constructive, as a result of a past event, it is probable that the Group wil l be required to settle the obligation, and a reliable estimate can be made of the amount of the obligation.
The amount recognized is the best estimate of the consideration required to settle the present obligation at the end of each reporting period, taking into account the risks and uncertainties surrounding the obligation. When a provision is measured using the cash flows estimated to settle the present obligation; its carrying amount is the present value of those cash flows.
When some or all of the economic benefits required to settle a provision are expected to be recovered from a third party, the receivable is recognized as an asset if it is virtually certain that reimbursement will be received and the amount of the receivable can be measured reliably.
Provisions are reviewed at the end of each reporting period and adjusted to reflect the current best estimate.
If it is no longer probable that a transfer of economic benefits will be required to settle the obligation, the provision should be reversed.
Onerous contracts
Present obligations arising under onerous contracts are recognized and measured as provisions. An onerous contract is considered to exist when the Group has a contract under which the unavoidable costs of meeting the obligations under the contract exceed the economic benefits expected to be received from the contract.
Restructuring
A restructuring provision is recognized when the Group has developed a detailed forma l plan for the restructuring and has raised a valid expectation in those affected that it will carry out the restructuring by starting to implement the plan or announcing its main features to those affected by it. The measurement of a restructuring provision includes only the direct expenditures arising from the restructuring, which are those amounts that are both necessarily entailed by the restructuring and not associated with the ongoing activit ies of the entity.
Warranties
Provisions for warranty costs are recognized at the date of sale of the relevant products, at the management's best estimate of the expenditure required to settle the Group's obligation.
Asset retirement obligation
The net present value of legal obligations associated with the retirement of an item of property, plant and equ ipment that resulted from the acquisition, construction or development and the normal operation of property, plant and equipment is recognized in the period in which it is incurred. The retirement obligation is initially measured at the present value of the estimated future dismantlement or restoration cost using current market borrowing rates. Subsequently, the discount is amortized as interest expense.
IIIIIIIIIIIIIIIIIIIIIIIIIIIIIIIIIIIIIIIIIIIIIIIIIIIIIIIIIIIIIIIIIIIIIIIIIIIIIIIIIIIIIIIIIIIIIIIIIIIIIIIIIIIIIIIIIII 30
Contingent liabilities and assets
Contingent liabilities and assets are not recognized because their existence will be confirmed only by the occurrence or non-occurrence of one or more uncertain future events not wholly within the control of the entity.
Contingent liabilities are disclosed, unless the possibility of an outflow of resources embodying economic benefits is remote.
Contingent liabilities assumed in a business combination are only recognized when these are present obligation and can be measured reliably.
Contingent assets are not recognized, but are disclosed only when an inflow of economic benefits is probable. When the realization of income is virtually certain, asset shou ld be recognized.
Events after the Reporting Period
The Group identifies events after the end of each reporting period as those events, both favorable and unfavorable, that occur between the end of the reporting period and the date when the consolidated financial statements are authorized for issue. The consol idated financial statements of the Group are adjusted to reflect those events that provide evidence of conditions that existed at the end of the reporting period. Non-adjusting events after the end of the reporting period are disclosed in the notes to the consolidated financial statements when material.
6. CRITICAL ACCOUNTING JUDGMENTS AND KEY SOURCES OF ESTIMATION UNCERTAINTY
In the application of the Group's accounting policies, Management is required to make judgments, estimates and assumptions about the carrying amounts of assets and liabilities that are not readily apparent from other sources. The estimates and associated assumptions are based on the historical experience and other factors that are considered to be relevant. Actual results may differ from these estimates.
The estimates and underlying assumptions are reviewed on an ongoing basis. Revisions to accounting estimates are recognized in the period in which the estimate is revised if the revision affects only that period or in the period of the revision and future periods if the revision affects both current and future periods.
Critical Judgments in Applying Accounting Policies
The fo llowing are the critical judgments, apart from those involving estimations, that Management has made in the process of applying the Group's accounting policies and that have the most significant effect on the amounts recognized in the consol idated financial statements.
Determination of functional currency
The Group's consolidated financial statements are presented in Philippine peso, which is also the Group's functional currency. For each entity, the Group determines the functional currency and items included in the financial statements of each entity are measured using that functional currency.
The results of operations and financial position of GTC, which are measured using US Dollar, and financial position of CIC, CST and CRL, which are measured using Chinese Yuan, were translated into Philippine Peso using the accounting policies in Note 5.
Leases
The evaluation of whether an arrangement contains a lease is based on its substance. An arrangement is, or contains, a lease when the fu lfil lment of the arrangement depends on a specific asset or assets and the arrangement conveys the right to use the asset.
llllllllllllllllllllllllllllllll lllllllllllllllllllllllllllllllllllllllllllllllllllllllllllllllllllllllllllllll\111 31
Classification of lease as operating lease
Based on Management evaluation, the lease arrangements entered into by the Group as a lessor are accounted for as operating leases because the lease arrangement will not transfer the ownership of the leased assets upon termination of the lease and it does not provide an option to purchase the asset at a price that is sufficiently lower than the fair value at the date of the option.
HTM investments
Management reviewed the Group's HTM investments in the light of its capital maintenance and liquidity requirements and confirmed its positive intention and ability to hold those assets to maturity. The carrying amount of HTM investments as at December 31, 2016 and 2015 amounted to P12,890,266 and P27,795,460, respectively, as shown in Note 10.
Determination of useful lives of trademarks
Under the Intellectual Property Code of the Philippines, the legal life of trademark is 10 years and may be perpetually renewed thereafter for another 10 years. However, considering that the Management does not expect any circumstances or events which will cause it to decide not to renew its trademarks every 10 years, Management has taken the position that the useful lives of its trademarks are indefinite, hence, the related costs are not amortized but subjected to annual impairment testing. Changes in the assumption and circumstances in the future will substantially affect the consolidated financial statements of the Group, particularly the carrying values of these trademarks .
The carrying values of the Group's trademarks as at December 31, 2016 and 2015 are PlOl,474,888 and P40,000,000, respectively, as disclosed in Note 13.
Biological assets
Biological assets are required to be measured on initial recognition and at the end of each reporting period at fair value less costs to sell, unless fair value cannot be measured reliably. Accordingly, the Management shall exercise its judgment in determining the best estimate of fair value.
After exerting its best effort in determining the fair value of the Group's biological assets, the Management believes that the fair value of its biological assets cannot be measured reliably since the market determined prices or values are not avai lable and other methods of reasonably estimating fair value are determined to be clearly unreliable. Accordingly, the Group's biological assets are measured at cost less any accumulated depreciation and any accumulated impairment losses as at December 31, 2016 and 2015, amounted to P34,817,782 and P31,429,135, respectively, as disclosed in Note 14.
Determination of control and significant influence
Management exercises its judgment in determining whether the Parent Company has control or significant influence over another entity by evaluating the substance of relationship that indicates control or significant influence of the Parent Company over the entities.
The recognition and measurement of the Parent Company's investments over these entities will depend on the result of the judgment made.
As disclosed in Note 3, the Parent Company has a 100% ownership interest and voting rights in GTC, SMDC, AW!, CPAVI, CPS!, CGC, CPFPVI, CRL, CST, and CIC.
1111111111111111111111111111111111111111111111111111 111111111111111 111111111111111111111111111111111111111111111111 32

Acquisition of investment in subsidiaries
The Group adopted the acquisition method in acquiring its subsidiaries (except for GTC, SMDC and CRL which the Company used the pooling of interests method). In selecting the acquisition method, the Management considers the involvement of outside parties in the transaction, such as non-controlling interests or other third parties (public ownership in CPFI).The transaction price is likewise arm's length determined based on a third party valuation which provides commercial substance to the transaction. The Management believes that it is appropriate to account said transactions using the acquisition method.
Key Sources of Estimation Uncertainty
The following are the key assumptions concerning the future and other key sources of estimation uncertainty at the end of each reporting period that have a significant risk of causing a material adjustment to the carrying amounts of assets and liabilities within the next financial year.
Estimating useful lives of property, plant and equipment
The useful lives of the Group's assets with definite lives are estimated based on the period over which the assets are expected to be available for use. The estimated useful lives of property, plant and equipment are reviewed periodically and are updated if expectations differ from previous estimates due to physical wear and tear, technical or commercial obsolescence and legal or other limits on the use of the Group's assets. In addition, the estimation of the useful lives is based on the Group's collective assessment of industry practice, internal technical evaluation and experience with similar assets. It is possible, however, that future results of operations could be materially affected by changes in estimates brought about by changes in factors mentioned above. The amounts and timing of recorded expenses for any period would be affected by changes in these factors and circumstances. A reduction in the estimated useful lives of property, plant and equipment would increase the recognized operating expenses and decrease non-current assets.
As at December 31, 2016 and 2015, the carrying amounts of the Group's property, plant and equipment amounted to P3,945,425,348 and P3,133,942,196, respectively, as disclosed in Note 15. Total accumulated depreciation as at December 31, 2016 and 2015 amounted to Pl, 756,351,655 and Pl,448, 878,570, respectively, as disclosed in Note 15.
Estimating net realizable value of inventories
The net realizable value of inventories represents the estimated selling price for inventories less all estimated costs of completion and costs necessary to make the sale. The Group determines the estimated selling price based on the recent sale transactions of similar goods with adjustments to reflect any changes in economic conditions since the date the transactions occurred. The Group records provision for excess of cost over net realizable value of inventories. While the Group believes that the estimates are reasonable and appropriate, significant differences in the actual experience or significant changes in estimates may materially affect the profit or loss and equity.
Total inventories recognized in the Group's consolidated statements of financial position amounted to P7,528,824,781 and P5,925,978,924 as at December 31, 2016 and 2015, respectively, as shown in Note 11.
1111111111111111111111111111111111111111111111111111111111111111111111111111111111111111111111111111111111111111111 33
Asset impairment
The Group performs an impairment review when certain indicators are present.
Determining the recoverable amounts of property, plant and equipment and intangible assets requires the Group to make estimates and assumptions that can materially affect the consolidated financial statements. Any resulting impairment loss could have a material adverse impact on the Group's financial position and result of operations.
While the Group believes that its assumptions are appropriate and reasonable, significant changes in the assumptions may materially affect the assessment of recoverable values and may lead to future additional impairment charges .
Total carrying amounts of intangible assets and property, plant and equipment as at December 31, 2016 and 2015 are disclosed in Notes 13 and 15, respectively.
As at December 31, 2016 and 2015, Management believes that the recoverable amounts of the Group's property, plant and equipment and intangible assets exceed their carrying amounts, accordingly, no impairment loss was recognized in 2016, 2015 and 2014.
Determining the fair value of financial instruments
The Group carries some of its financial assets and financial liabilities at fair value, which requires extensive use of accounting estimates and judgment. In addition, certain liabilities acquired through debt exchange and restructuring are required to be carried at fair value at the time of the debt exchange and restructuring. While significant components of fair value measurement were determined using verifiable objective evidence, i.e., foreign exchange rates, interest rates, volatility rates, the amount of changes in fair value would differ if the Group utilized different valuation methodology. Any change in fair value of these financial assets and financial liabilities would affect profit or loss and equity.
As at December 31, 2016 and 2015, the fair values of the Group's financial assets amounted to P4,286,008,251 and P4,179,105,015, respectively, as disclosed in Note 34.
Total liabilities measured at fair value amounted to P6,255,609,799 and P5,960,180,843 as at December 31, 2016 and 2015, respectively, as disclosed in Note 34.
Estimating allowances for doubtful accounts
The Group estimates the allowance for doubtful accounts related to its receivables based on assessment of specific accounts when the Group has information that certain counterparties are unable to meet their financial obligations. In these cases, judgment used was based on the best available facts and circumstances including but not limited to, the length of relationship with the counterparty and the counterparty's current credit status based on credit reports and known market factors. The Group used judgment to record specific reserves for counterparties against amounts due to reduce the expected collectible amounts. These specific reserves are re-evaluated and adjusted as additional information received impacts the amounts estimated.
The amounts and timing of recorded expenses for any period would differ if different judgments were made or different estimates were utilized. An increase in the allowance for doubtful accounts would increase the recognized operating expenses and decrease current assets.
Total trade receivables recognized in the Group's consolidated statements of financial position amounted to P3,556,091,143 and P3,370,997,803 as at December 31, 2016 and 2015, respectively, which is net of the related allowance for doubtful accounts amounting to P122,248,827 and P28,619,597 as at those dates, as shown in Note 9.
IIIIIIIIIIIIIIIIIIIIIIIIIIIIIIIIIIIIIIIIIIIIIIIIIIIIIIIIIIIIIIIIIIIIIIIIIIIIIIIIIIIIIIIIIIIIIIIIIIIIIIIIIIIIIIIIIII 34
Retirement benefit and other post-employment benefits
The determination of the retirement benefit obligation and other post-employment benefits is dependent on the selection of certain assumptions used by actuaries in calculating such amounts. Those assumptions include among others, discount rates, mortality and rates of compensation increase. While the Group believes that the assumptions are reasonable and appropriate, significant differences in the actual experience or significant changes in the assumptions may materially affect the amount of retirement benefit obligation and other post-employment benefits recognized.
The total retirement benefit expense recognized in 2016, 2015 and 2014 amounted to P34,255,249, P57,822,016 and PlB,082,852, respectively, and retirement benefit obligation as at December 31, 2016 and 2015 amounted to PllB,327,684 and P157,039,771, respectively, as shown in Note 19.
Deferred tax assets
The Group reviews the carrying amounts at the end of each reporting period and reduces deferred tax assets to the extent that it is no longer probable that sufficient taxable profit will be available to allow all or part of the deferred tax assets to be utilized. However, there is no assurance that the Group will generate sufficient taxable profit to allow all or part of its deferred tax assets to be util ized.
Deferred tax assets recognized in the consolidated statements of financial position as at December 31, 2016 and 2015 amounted to PllB,001,892 and PSl,725,977, respectively, as disclosed in Note 33.
Provisions
The Group recognized provision for estimated losses relating to uncertainties that are associated with the nature of its business operations amounting to ni l and P7,848,982 as at December 31,2016 and 2015, respectively, as disclosed in Note 18.
Estimating allowance for VAT claims
In 2015, the Group recognized an impairment loss on the amount of input VAT applied with Bureau of Customs (BOC) amounting to P14,466,567, as disclosed in Note 25, of which amount, Pl,442,247 pertains to CPAVI. Impairment loss on input VAT amounting to P5,418,732 was recognized in 2016, as disclosed in Note 12. The amount pertains mainly to CPAVI.
7. SEGMENT INFORMATION
Business segments
For Management purposes, the Group is organized into seven major business segments : Canned and Processed fish, Canned Meat, Milk, Tuna Export, Coco Water, Packaging and Corporate.
11111111111111111111111111111111111111111111111111111111111111111111111111111~111111111111111111111111111111111111 35
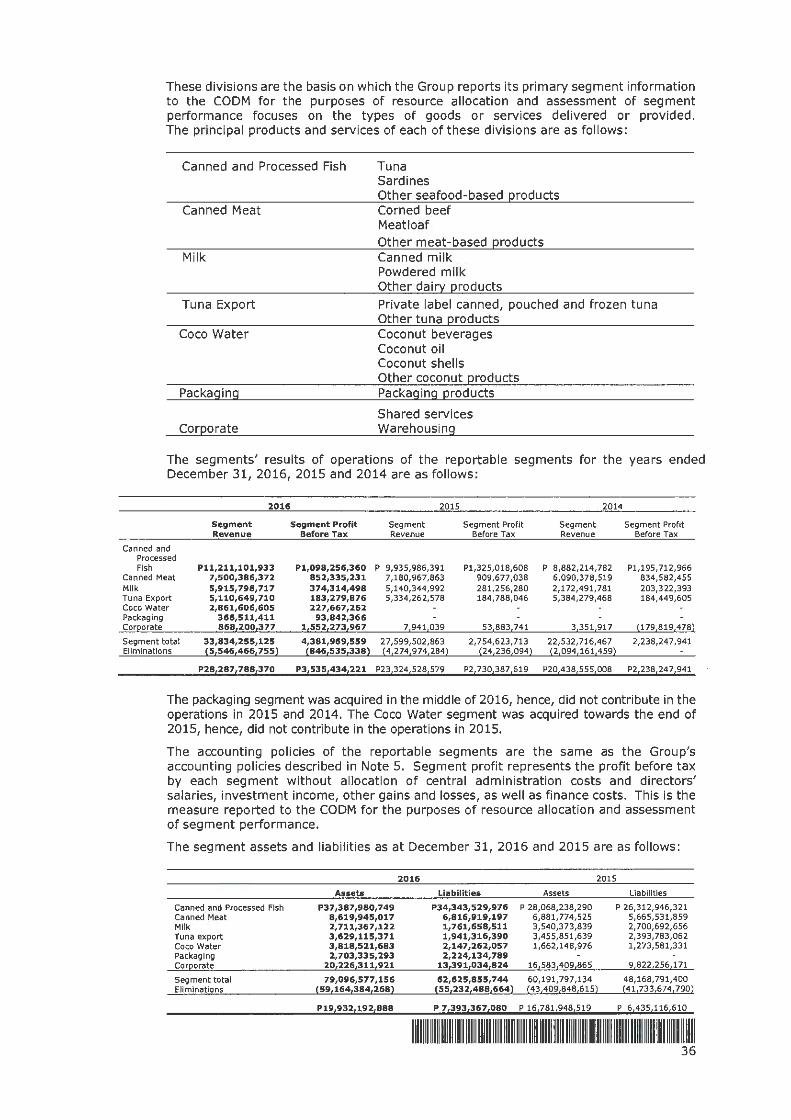
These divisions are the basis on which the Group reports its primary segment information to the CODM for the purposes of resource allocation and assessment of segment performance focuses on the types of goods or services delivered or provided. The principal products and services of each of these divisions are as follows:
Canned and Processed Fish
Canned Meat
Milk
Tuna Export
Coco Water
Packaging
Corporate
Tuna Sardines Other seafood-based products Corned beef Meatloaf Other meat-based products Canned milk Powdered milk Other dairy products Private label canned, pouched and frozen tuna Other tuna products Coconut beverages Coconut oil Coconut shells Other coconut products Packaging products
Shared services Warehousing
The segments' results of operations of the reportable segments for the years ended December 31, 2016, 2015 and 2014 are as follows:
201 6 2015 2014
Segment Segment Profit Segment Segment Profit Segment Segment Profit Revenue Be fore Tax Revenue Before Tax Revenue Before Tax
Canned and Processed Fish Pll,211,101,933 Pl,098,256,360 P 9,935,986,391 Pl,325,018,608 P 8,882,214,782 Pl,195,712,966
Canned Meat 7,500,386,372 852,335,231 7,180,967,863 909,677,038 6,090,378,519 834,582,455 Milk 5,915,798,717 374,314,498 5,140,344,992 281,256,280 2,172,491,781 203,322,393 Tuna Export 5,110,649,710 183,279,876 5,334,262,578 184,788,046 5,384,279,468 184,449,605 Coco Water 2,861,606,605 227,667,262 Packaging 366,511,411 93,842,366 Cor2orate 868,200,377 1,ss2,21J,967 7,941,039 53,883,741 3,351,917 (179,819,478)
Segment total 33,834,255,125 4,381,969,559 27,599,502,863 2,754,623,713 22,532,716,467 2,238,247,941 Eliminations {5,546,466,755) {846,535,338} (4,274,974,284} (24,236,094) (2,094,161,459)
P2s,2s1,1ss1J10 PJ1sJs14341221 P23132415281579 P2173013871619 P20143S15551ooa P2123S12471941
The packaging segment was acquired in the middle of 2016, hence, did not contribute in the operations in 2015 and 2014. The Coco Water segment was acquired towards the end of 2015, hence, did not contribute in the operations in 2015.
The accounting policies of the reportable segments are the same as the Group's accounting policies described in Note 5. Segment profit represents the profit before tax by each segment without allocation of central administration costs and directors' salaries, investment income, other gains and losses, as well as finance costs. This is the measure reported to the CODM for the purposes of resource allocation and assessment of segment performance.
The segment assets and liabilities as at December 31, 2016 and 2015 are as follows:
Canned and Processed Fish Canned Meat Milk Tuna export Coco Water Packaging Corporate
Segment total Eliminations
Assets
P37,387,980,749 8,619,945,017 2,711,367,122 3,629,115,371 3,818,521,683 2,703,335,293
20,226,311,921
79,096,577,156 (59,164,384,268}
p19,9321192,sss
2016 2015
Lia bilities
P34,343,529,976 6,816,919,197 1,761,658,511 1,941,316,390 2,147,262,057 2,224,134,789
13,391,034,824
62,625,855,744 (551232<4881664}
Assets
P 28,068,238,290 6,881,774,525 3,540,373,839 3,455,851,639 1,662,148,976
16,583,409,865
60,191,797,134 (43,409,848,615)
P 7,39313671080 P 16i7s1194S1519
Liabilities
P 26,312,946,321 5,665,531,859 2,700,692,656 2,393,783,062 1,273,581,331
9,822,256,171
48,168,791,400 (41J33,674J90)
P 6,43 5,116,610
1111111111111111111111111111111111111111111111111111111111111111111111111111111111111111111111111111111 111111111111 36

For the purposes of monitoring segment performance and allocating resources between segments:
• All assets are allocated to reportable segments, other than other financial assets, and current and deferred tax assets, which are booked under Corporate segment. Assets used jointly by reportable segments are allocated on the basis of the revenues earned by individual reportable segments.
• Al l liabilities are allocated to reportable segments, other than loans, other financial liabi lities, current and deferred tax liabi lit ies, wh ich are booked under Corporate segment. Liabilities for which reportable segments are jointly liable are allocated in proportion to segment assets.
• Eliminations include transactions among the segments of the Parent Company.
Other segment information as at and for the year ended December 31, 2016 are as fo llows:
Additions to Property, Plant, Interest and Egulement Deereclatlon Income Finance Costs
Canned and Processed Fish p 97,472,572 p 42,285,189 p p
Packaging 365,852,465 16,848,547 Canned Meat 221,462,245 40,563,916 45,923 Milk 15,171,635 17,378,880 132,737 Tuna Export 242,061,099 98,558,630 456,275 1,058,056 Coco Water 558,514,558 92,830,330 Corporate 59,294,107 50,888,040 5,219,164 76,369,594
P11ss91 s2s16s1 P35913S31532 Ps1ss41099 P7714271650
Other segment information as at and for the year ended December 31, 2015 are as fo llows:
Canned and Processed Fish Canned Meat Milk Tuna Export Coco Water Corporate
Add ltlons to Property, Plant, and Equipment
P 499,153,522 158,843,006
20,821,668 126,114,526
1,263,506,157 296,142,088
P2 364 580 967
Depreciation
P 34,494,935 18,008,047 18,551,085 47,490,686
33,839,825
P152 384 578
Interest Income
p
7,629,931
P7 629 931
Finance Costs
p
1,158,333
Pl 158 333
Other segment information as at and for the year ended December 31, 2014 are as fo llows:
Additions to Property, Plant, Interest and Equipment Depreciation Income Finance Costs
Canned and Processed Fish P273,837,617 P 13,573,091 p p
Canned Meat 44,190,597 9,177,730 MIik 56,041,767 21,414 Tuna Export 116,334,969 86,814,059 Corporate 49,331,510 43,163,054 9,165,276 15,287,944
P539 736 460 P152 749 348 P9 165 276 P15 287 944
Revenues and non-current assets are mainly based in the Philippines, which is the Group's country of domicile.
1111111111111111111111111111111111111111111111111111111111111111111111111111111111111111111111111111111111111111111 37
8. CASH AND CASH EQUIVALENTS
Cash and cash equivalents at the end of the reporting period, as shown in the consolidated statements of cash flows, can be reconciled to the related items in the consolidated statements of financia l position as follows:
Cash on hand Cash in banks Cash equiva lents
Cash on hand includes petty cash fund.
2016
P 1,324,863 549,723,347 144,578,796
P695,627 ,006
2015
P 1,153,054 599,011,289 122,000,000
P722,164,343
Cash in banks earned average interest rate ranging from 0.2% to 1.5% and from 0.5% to 1 % per annum in 2016 and 2015, respectively, and is unrestricted and immediately available for use in the current operations of the Group.
Cash equivalents represent short-term fund placements and investments in unit investment trust funds (UITFs) with loca l banks . Short-term fund placements mature in three months or less from the date of acquisit ion with annual interest rates ranging from 0.1 % to 1.6% in 2016 and 0. 7% to 1.83% in 2016 and 2015. These placements are from excess cash and can be withdrawn anytime for operations.
Interest income earned from bank deposits and placements amounted to P4,387 ,681, PS,484,577, and P7,547,753 in 2016, 2015, and 2014, respectively, as disclosed in Note 23.
9. TRADE AND OTHER RECEIVABLES - net
The Group's trade and other receivables consist of:
Trade receivables Al lowance for doubtful accounts
Advances to suppliers Advances to officers and employees Others
2016
P3,556,091,143 (122, 248,827)
3,433,842,316 486,210,630
24,040,813 10,413,506
P3,954,507,265
2015
P3,370,997,803 (28,619,597)
3,342,378,206 231,522,573
12,497,052 6,293,895
P3,592,691, 726
Trade receivables represent short-term, non-interest bearing receivables from various customers and generally have 30 days term or less. No interest is charged on trade receivables for more than 30 days from the date of invoice.
Advances to suppliers are non-interest bearing and generally have terms of 30 days to 45 days. These are generally applied against future billings within next year.
Advances to officers and employees are non- interest bearing and are liquidated within one month. Advances to officers include sa lary loans which earned average interest rate of 8% per annum. Interest income earned from salary loans amounted to P502,606 in 2016, P517,144 in 2015, and ni l in 2014 as disclosed in Note 23.
Other receivables, which consist mainly of receivables from various parties for transactions other than sale of goods and statutory receivables, are non- interest bearing and generally have terms of 30 to 45 days.
111111111111111111111111111111111111111111111111111111111111111111111111111111111111111111111111111111111111111 1111 38

Movements in the allowance for doubtful accounts as at December 31 are as follows :
Balance, January 1 Doubtful accounts expense Write off Translation adjustment
Balance, December 31
Note
24
2016
P 28,619,597 94,097,956
(468,726)
P122,248,827
2015
P36,958,537 5,587,422
(14,506,372) 580,010
P28,619,597
The Group recognized doubtful accounts expense for the years ended December 31, 2016, 2015 and 2014 amounting to P94,097,956, P5,587,422, and P30,307,633 respectively, as disclosed in Note 24. Furthermore, the Group also recognized an additional provision amounting to P2,570,981 from its acquisition of CIC on December 28, 2016, as disclosed in Note 3.
In determining the recoverability of trade receivables, the Group considers any change in the credit quality of the trade receivable from the date credit was initially granted up to the end of the reporting period. The concentration of credit risk is limited due to the customer base being large and unrelated. Accordingly, the Management believes that there is no further allowance for doubtful accounts required in excess of those that were already provided.
10. HELD-TO-MATURITY INVESTMENTS
HTM investments pertain to treasury bonds, which bear effective interest rates ranging from 2.84% to 3.62% per annum in 2016 and 2015, and maturities ranging from two to three years. The HTM investments were acquired at a premium of P643,495 and Pl ,243,895 in 2016 and 2015, respectively.
Movement in the Group's HTM investments for 2016 and 2015 are as follows:
Balance, January 1 Maturities Amortization of premium Balance, December 31 Less : Non-current portion
Current portion
2016
P27,795,460 (14,300,000)
(605,194} 12,890,266
P12,890,266
The carrying amounts of HTM Investments are as follows:
Face value Unamortized premium
2016
P12,800,000 90 266
P12,890,266
2015
P180,666,391 (151,410,000)
(1,460,931) 27,795,460 13,108,859
P 14,686,601
2015
P 27,100,000 695 460
P 27,795,460
Interest, net of amortization fo premium, earned from HTM investments amounted to P963,812, Pl,628,210 and Pl,617,523 in 2016, 2015 and 2014, respectively, as disclosed in Note 23.
IIIIIIIIIIIIIIIIIIIIIIIIIIIIIIIIIIIIIIIIIIIIIIIIIIIIIIIIIIIIIIIIIIIIIIIIIIIIIIIIIIIIIIIIIIIIIIIIIIIIIIIIIIIIIIIIIII 39
11. INVENTORIES - net
Details of the Group's inventories are as follows:
Finished goods Work in process Raw materials Spare parts and supplies
Allowance for decline in value Allowance for obsolescence
2016
P4,375,183,153 18,090,410
3,010,726,828 213,979,458
7,617,979,849
(89,155,068)
2015
P3,401,906,532 83,814,607
2,356,530,403 181,561,825
6,023,813,367 (28,307,695) (69,526,748)
P7,528,824,781 P5,925,978,924
Cost of inventories recognized as expense in 2016, 2015 and 2014 amounted to P19,677,984,326, P17,128,162,072 and P15,063,993,046, respectively, as disclosed in Note 22.
In 2015, the Group recognized loss on inventory write down due to the excess of cost over NRV amounting to P32,022,919. Of this amount, P3,715,224 was directly written off in finished goods inventory and recognized as part of operating expenses in Note 24. As at December 31, 2015, the remaining amount of P28,307,695 came from CPAVI which was provided as an allowance for decline in value of finished goods inventory. The balance in the allowance for the decline in value from CPAVI was already written-off in 2016.
Movement in the allowance for obsolescence of inventories are as follows :
Notes 2016 2015 2014 Balance, January 1 P 69,526,748 P71,192,497 P 4,462,318 Provision 22 18,970,008 17,913,363 71,192,497 Loss on write-down 25 6,841,777 Write off (19,579,112) (4,462,318) Reversal 23 (6,183,465)
Balance, December 31 P89,155,068 P69,526,748 P71,192,497
12. PREPAYMENTS AND OTHER CURRENT ASSETS - net
The details of the Group's prepayments and other current assets are shown below.
Input value-added tax (VAT) - net Prepaid taxes Prepaid insurance Prepaid rent Others
Allowance for VAT claims
Note
31
2016
P357,542,571 57,795,830 11,053,702
2,128,782 29,707,933
458,228,818 (18,443,052)
2015
P138,914,061 59,934,235 10,341,575
4,074,212 18,443,884
231,707,967 (13,024,320)
P439,785,766 P218,683,647
Input VAT as at December 31, 2016 and 2015 are presented net of output VAT of P475,889,379 and P556,243,538, respectively.
IIIIIIIIIIIIIIIIIIIIIIIIIIIIIIIIIIIIIIIIIIIIIIIIIIIIIIIIIIIIIIIIIIIIIIIIIIIIIIIIIIIIIIIIIIIIIIIIIIIIIIIIIIIIIIIIIII 40

Prepaid taxes include creditable withholding taxes withheld by the Group's customers and tax credit certificates (TCC) issued by the Bureau of Customs (BOC) to GTC. TCCs from BOC are granted to Board of Investment (BOI) registered companies and are given for taxes and duties paid on raw materials used for the manufacture of their export products. GTC can apply its TCC against tax liabilities other than withholding tax or can be refunded as cash.
In prior years, the Group filed an application with the BOC for the conversion of its input VAT to TCC. In 2015, the Group recognized an impairment loss on the amount of input VAT applied with BOC amounting to P13,024,320, as disclosed in Note 25.
Movement in the allowance for VAT claims are as follows:
Balance, January 1 Provision
Balance, December 31
13. INTANGIBLE ASSETS
Note
25
2016
P13,024,320 5,418,732
P18,443,052
2015 p
13,024,320
The details of the Group's intangible assets are as fo llows:
Goodwill Trademarks
Goodwill
2016
P2,952,282,595 101,474,888
P3,053, 757,483
2015
P2,915,325,199 40,000,000
The goodwill is associated with the excess of the investment cost over the fair value of the net assets of CPFPVI, CIC and CST at the time of acquisition. The businesses have continued and are expected to continue to operate on a satisfactory basis.
Goodwill recognized from the acquisitions of the businesses are as fo llows:
CPAVI CIC and CST
2016 2015
P2,915,325,199 P2,915,325,199 36,957,396
P2,952,282,595 P2,915,325,199
Investments in CIC and CST On December 28, 2016, the Parent Company entered into an equity transfer agreement to acquire 100% ownership in CIC and CST for the total purchase consideration amount of P127,333,895. Fair value of net assets acquired amounted to P90,376,499 which resulted in a net goodwill from acquisition amounting to P36,957,396.
The fair values of the identifiable assets and liabilities of CIC and CST as at the date of acquisition were as follows:
Cash in banks Trade and other receivables - net Inventories - net Prepayments and other noncurrent assets Property, plant and equipment - net Trade and other payables
Net assets acquired and liabilities assumed
Note 2016
15
P 19,911,885 141,629,216
74,602,074 1,187,325
342,370 (147,296,371)
P 90,376,499
111111111111111111111111111111111111111111111111111111111111111111111111111111111111111111111111111 1111111111111111 41
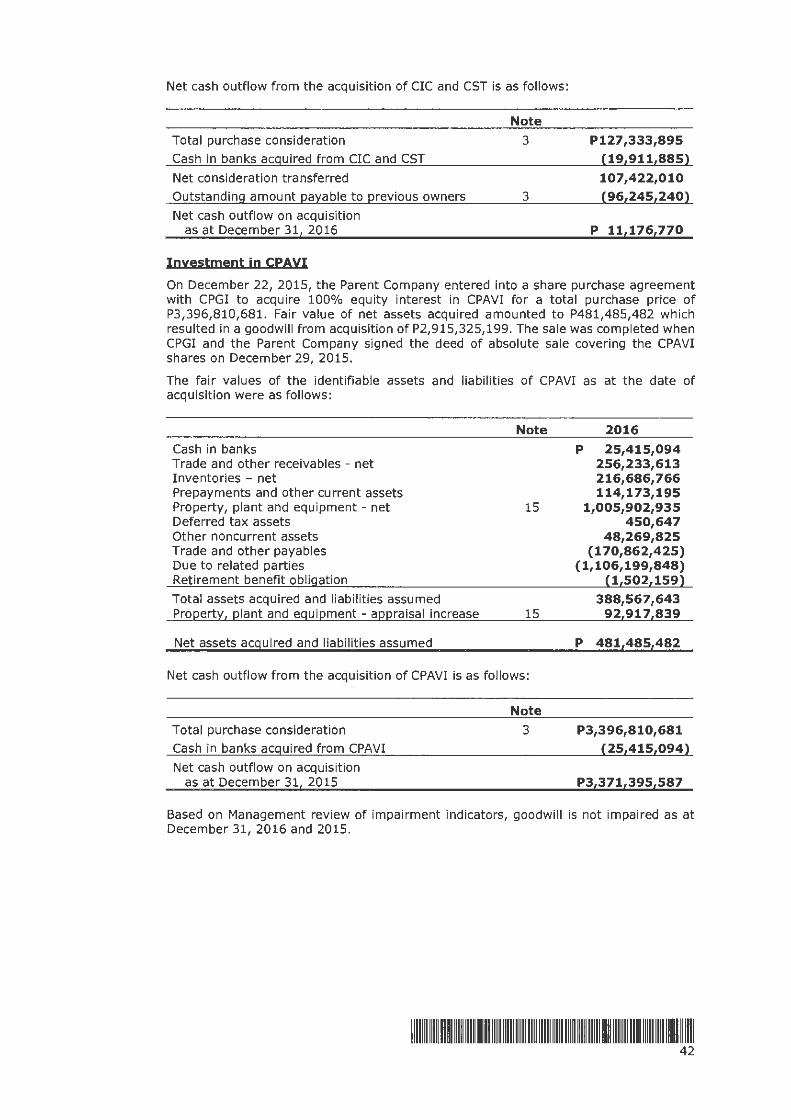
Net cash outflow from the acquisition of CIC and CST is as follows:
Total purchase consideration
Cash in banks acquired from CIC and CST
Net consideration transferred
Outstanding amount payable to previous owners
Net cash outflow on acquisition as at December 31, 2016
Investment in CPAVI
Note
3
3
P127,333,895 (19,911,885)
107,422,010 (96,245,240)
P 11,176,770
On December 22, 2015, the Parent Company entered into a share purchase agreement with CPGI to acquire 100% equity interest in CPAVI for a total purchase price of P3,396,810,681. Fair value of net assets acquired amounted to P481,485,482 which resulted in a goodwill from acquisition of P2,915,325,199. The sale was completed when CPGI and the Parent Company signed the deed of absolute sale covering the CPAVI shares on December 29, 2015.
The fair values of the identifiable assets and liabilities of CPAVI as at the date of acquisition were as follows:
Cash in banks Trade and other receivables - net Inventories - net Prepayments and other current assets Property, plant and equipment - net Deferred tax assets Other noncurrent assets Trade and other payables Due to related parties Retirement benefit obligation
Total assets acquired and liabilities assumed Property, plant and equ ipment - appra isal increase
Net assets acquired and liabilities assumed
Note 2016
15
15
P 25,415,094 256,233,613 216,686,766 114,173,195
1,005,902,935 450,647
48,269,825 (170,862,425)
(1,106,199,848) (1,502,159)
388,567,643 92,917,839
P 481,485,482
Net cash outflow from the acquisition of CPAVI is as follows:
Total purchase consideration
Cash in banks acquired from CPAVI
Net cash outflow on acquisition as at December 31, 2015
Note
3 P3,396,810,681 (25,415,094)
P3,371,395,587
Based on Management review of impairment indicators, goodwill is not impaired as at December 31, 2016 and 2015.
111111111111111111111111111111111111111111111111111111111111111111111111111111111111111111111111111 1111111111111111 42

Trademarks
In July 2008, the Group purchased Kaffe de Oro and Home Pride trademarks amounting to P40,000,000 from General Milling Corporation (GMC) owned and registered with the Intellectual Property Office.
In 2016, the Group acquired the "KAMAYAN" trademark from Concentrated Foodline Corporation for a total purchase price of USDl,307,700 or P61,474,788. The deed of assignment for the said trademark was dated August 17, 2016 and the purchase price was paid in full in the same year.
The Group has determined, based on annual impairment testing that the carrying amounts of intangible assets with indefinite useful life are not in excess of their net recoverable amounts. Thus, no impairment loss was recognized in 2016, 2015 and 2014.
14. BIOLOGICAL ASSETS
Biological assets of the Group comprised of fingerlings and mature milk fish with the following costs:
Balance, January 1 Purchased fingerlings Consumed feeds Direct labor Overhead
Total cost Decreases due to harvest
2016
P 31,429,135 20,528,017 83,376,100
4,212,230 5,841,438
145,386,920 (110,569,138}
2015
P 37,478,189 12,661,790 67,697,503
4,223,709 8,744,169
130,805,360 (99,376,225)
P 34,817,782 P 31,429,135
Fingerlings and mature milk fish are measured at cost since the fair market value cannot be measured reliably as they neither have appropriate market index nor individually effective measurement practices and they have short inventory period.
During the year, the Group capitalized depreciation expense amounted to P496,934 presented as part of the factory overhead, as disclosed in Note 22.
As at December 31, 2016 and 2015, Management believes that there is no objective evidence of impairment on its biological assets carried at cost. Accordingly, no impairment loss was recognized in both years.
IIIIIIIIIIIIIIIIIIIIIIIIIIIIIIIIIIIIIIIIIIIIIIIIIIIIIIIIIIIIIIIIIIIIIIIIIIIIIIIIIIIIIIIIIIIIIIIIIIIIIIIIIIIIIIIIIII 43

15. PROPERTY, PLANT AND EQUIPMENT - net
Movements in t he carrying amounts of the Group's property, plant and equipment are as fo llows :
Building Plant Machinery Office Furniture, Laboratory, Land and and Fixtures and Tools and Transportation and Const ruction in
Imerovements Building Imerovements Eguiement Eguiement Eguiement Delive!l'. Eguiement Progress Total
Cost Balance, January 1, 2015 PS0,111,448 p 514,548,977 Pl,444,216,096 Plll,OBS,964 P 44,176,045 P34,654,691 P 76,026,343 P 2,274,819,564 Acquisition through business combination 265,128,245 574,226,247 24,712,047 49,054,399 8,336,607 342,048,613 1,263,506,1 58 Additions 296,119,933 322,432,946 36,334,245 32,200,424 18 ,303,418 362,574,129 1,067,965,095 Diseosals (2,794,573) (12,508,012) (760,848) (2,195,456) (37,134) (5,174,028) (23,470,051 )
Balance, December 311 2015 50,111,448 1,073,002,582 2,328,367,278 171,371,407 123,235,412 61,257,582 775,475,057 4,582,820,766
Acquisition through business combination 904,855 904,855 Additions 465,373,106 825,793,739 35,720,467 35,628,620 37,067,668 159,340,226 1,558,923,826 Reclassifications 316,691,397 291,995,327 6,313,635 29,13 5,759 3 ,517,743 (647,653,861) Diseosa ls (124,638,325) (275,361,862) (780,046) (9,533,850) (4,208,488) (26,34 9,873) (440 ,872,444 ) Balance, December 311 2016 50,111,448 1,730,428,760 3,170,794,482 213,530,318 178,465,941 97,634,505 260,811,548 5,701,777,003 Accumulated Depreciation Balance, January 1, 2015 43,318,825 236,385,966 754,011,472 39,766,236 25,906,625 13,160,156 1,112,549,278 Acquisition t hrough business combination 40,221,482 103,848,009 3,838,441 15,250,130 1,527,322 164,685,384 Depreciation 860,675 26,636,879 117,743,183 25,793,343 9,504,025 10,880,470 152,384,578 Diseosal (2,781,211) (15,020,942) (469,575) (1,471,995) (30,944) (3,083,588 ) Balance, December 311 2015 44,179,500 300,463,116 960,581,721 68,928,445 49,188,785 25,537,003 1,448,878,570
Acquisition through business combination 562,485 562,485 Depreciation 8 58,146 68,330,252 220,595,815 32,288,316 21,911,533 14,806,985 358,791,047 Reclassifications (1,124,973) 1,124,973 Diseosal (8,009,274) (38,699,202) (406,7 38) (1,986,885) (2,778,346) (51,880,447)
Balance, December 311 2016 45,037,645 360,784 ,093 1,141,353,361 102,497,481 69,113,433 37,565,642 1,756,351,655
Carrying Amounts As at December 311 2016 P s,o73,S03 P1136916441667 P2102914411121 P11110321S37 P10913S2150S P60106S1863 P2601S11,S48 P319 4 5 14 2 5 13 48
Carrying Amounts As at December 311 2015 p 5,931,94 9 p 772,539,466 P 1,367,785,556 P 102,442,961 p 74,046,627 P 35,720,579 P 775,475,057 P 3,133,942,196
111111111111 1111 111111111111111 11111111111111111111111111111111111111 1111111111111111111111 11111111111111111111 44

Details of depreciation charged to profit or loss are disclosed below :
Notes 2016 2015 2014
Cost of goods sold 22 P313,171,313 P118,990,084 P121,679,500 012erating ex12enses 24 46l182l219 3313941494 3110691848
P359,353,S32 P152,3841578 P152,749,348
Construction in progress pertains to accumulated costs incurred on the ongoing construction of the Group's new production plant and administration building as part of the Group's expansion program.
The Group recognized gain on sale of certain equipment amounting to P5,211,839 in 2016, loss on sale of P3,553,569 in 2015 and gain on sale of P309,965 in 2014, as disclosed in Notes 23 and 25.
Management believes that there is no indication that an impairment loss has occurred on its property, plant and equipment.
16, OTHER NON-CURRENT ASSETS
The Group's other non-current assets consist of:
Security deposits Deposits on uti lities Returnable containers Others
Note
31
2016 P43,851,136
8,677,889 3,670,961 1l235l675
P57,435,661
2015
P32,837,594 12,559,937 4,857,681
5871225
P50,842A37
Security deposits pertain to deposits required under the terms of the lease agreements of the Group with certain lessors.
Returnable containers are assets used in the delivery of the Group's products. Products for delivery do not include the value of these containers .
Others include non-current portion of deferred input VAT.
17. BORROWINGS
In 2015, the Group entered into short-term financing fac ilities with certain financial institutions through the issuance of promissory notes for the acquisition of CPAVI totaling P2,250,000,000 due on March 22, 2016 with interest rate ranging from 2.25% to 2.50%. Repayments made in 2016 from these loans amounted to Pl,350,000,000. Of the remaining loans, P600,000,000 was extended with a new maturity date of Apri l 14, 2017 and interest rate of 2.25% and P300,000,000 was converted to long-term loan with a maturity date of April 20, 2021 and interest rate of 4.25% per annum.
In 2016, the Group entered into short-term and unsecured peso loans from local banks amounting to P394,000,000 with maturity date equal to or less than 12 months. Repayments from these loans amounted to P140,000,000. Remaining amount of P200,000,000 was converted to long-term loan with a maturity date of April 20, 2021 and interest rate of 4.25% per annum.
In addition, the Group entered into a long-term loan amounting to Pl,150,000,000 due in May 5, 2021 payable annua lly with interest rate of 4.30% per annum. Current portion of this loan amounted to P16,500,000 which wi ll be due in less than 12 months.
1111111111111111111111111111111111111111111111111111111111111111111111111111111111111111111111111111111111111 11 1111 45
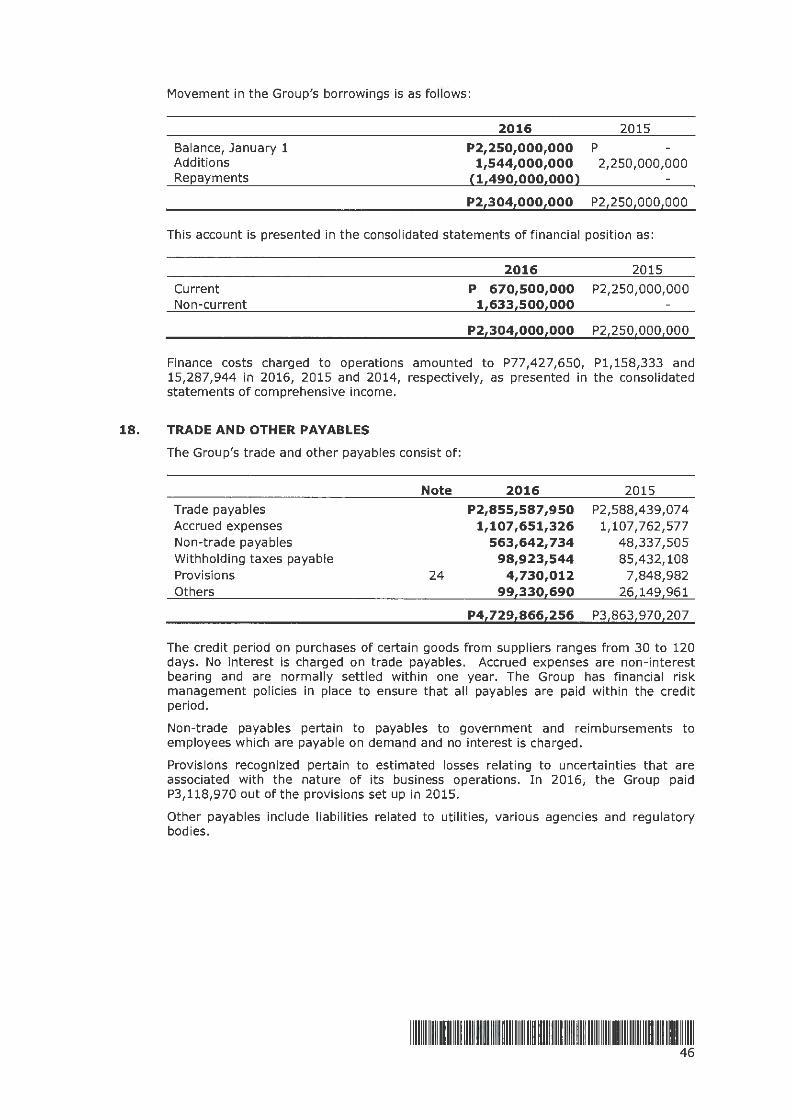
Movement in the Group's borrowings is as follows:
Balance, January 1 Additions Repayments
2016
P2,2SO,OOO,OOO 1,544,000,000
(1,490,000,000)
2015 p
2,250,000,000
P2,304,000,000 P2,250,000,000
This account is presented in the consolidated statements of financial position as:
Current Non-current
2016 2015
P 670,500,000 P2,250,000,000 1,633,500,000
P2,304,000,000 P21250,000,000
Finance costs charged to operations amounted to P77,427,650, Pl,158,333 and 15,287,944 in 2016, 2015 and 2014, respectively, as presented in the consolidated statements of comprehensive income.
18. TRADE AND OTHER PAYABLES
The Group's trade and other payables consist of:
Trade payables Accrued expenses Non-trade payables Withholding taxes payable Provisions Others
Note
24
2016
P2,855,587,950 1,107,651,326
563,642,734 98,923,544
4,730,012 99,330,690
2015
P2,588,439,074 1,107,762,577
48,337,505 85,432,108
7,848,982 26,149,961
P4,729,866,256 P3,8631970,207
The credit period on purchases of certain goods from suppliers ranges from 30 to 120 days. No interest is charged on trade payables. Accrued expenses are non-interest bearing and are normally settled within one year. The Group has financial risk management policies in place to ensure that all payables are paid within the credit period.
Non-trade payables pertain to payables to government and reimbursements to employees which are payable on demand and no interest is charged.
Provisions recognized pertain to estimated losses relating to uncertainties that are associated with the nature of its business operations. In 2016, the Group paid P3,118,970 out of the provisions set up in 2015.
Other payables include liabilities related to utilities, various agencies and regulatory bodies.
1111111111111111111111111111111111111111111111111111111111111111111111111111111111111111111111111111111111111111111 46
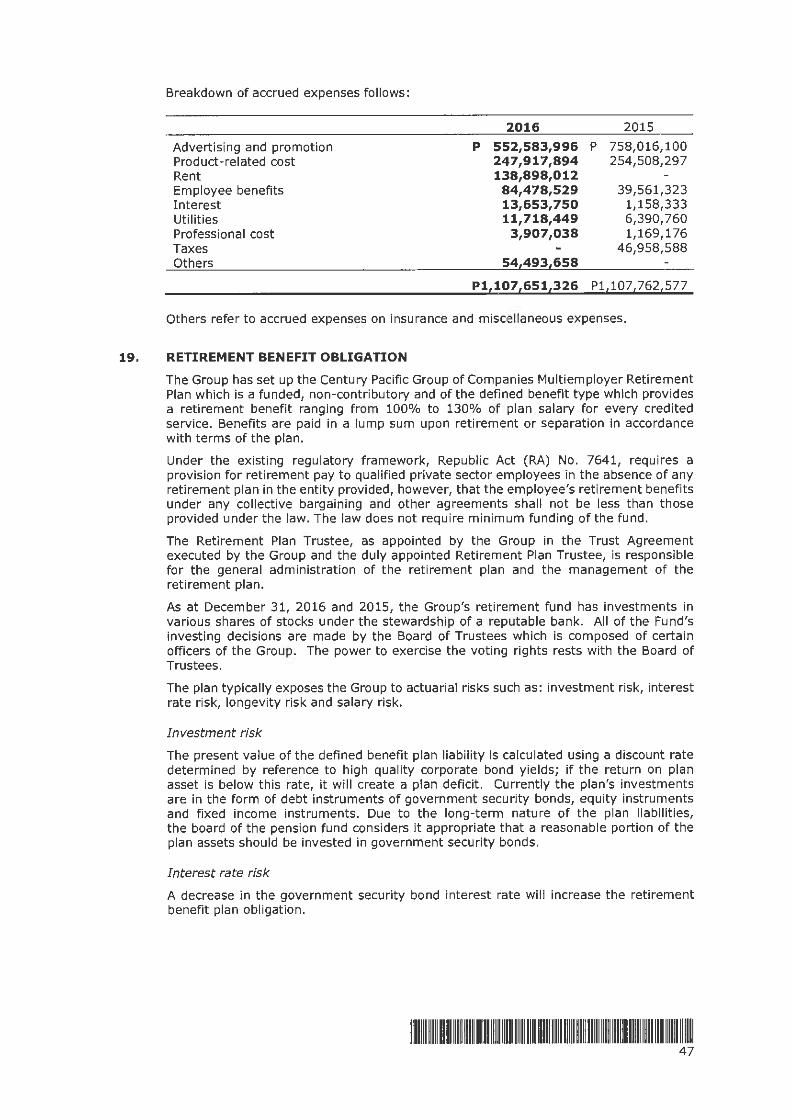
Breakdown of accrued expenses follows:
Advertising and promotion Product-related cost Rent Employee benefits Interest Utilities Professional cost Taxes Others
2016
P 552,583,996 247,917,894 138,898,012
84,478,529 13,653,750 11,718,449
3,907,038
54 493 658
2015
P 758,016,100 254,508,297
39,561,323 1,158,333 6,390,760 1,169,176
46,958,588
Pl,107,651,326 Pl,107,762,577
Others refer to accrued expenses on insurance and miscellaneous expenses.
19. RETIREMENT BENEFIT OBLIGATION
The Group has set up the Century Pacific Group of Companies Multiemployer Retirement Plan which is a funded, non-contributory and of the defined benefit type which provides a retirement benefit ranging from 100% to 130% of plan salary for every credited service. Benefits are paid in a lump sum upon retirement or separation in accordance with terms of the plan.
Under the existing regulatory framework, Republic Act (RA) No. 7641, requires a provision for retirement pay to qualified private sector employees in the absence of any retirement plan in the entity provided, however, that the employee's retirement benefits under any collective bargaining and other agreements shall not be less than those provided under the law. The law does not require minimum funding of the fund.
The Retirement Plan Trustee, as appointed by the Group in the Trust Agreement executed by the Group and the duly appointed Retirement Plan Trustee, is responsible for the general administration of the retirement plan and the management of the retirement plan.
As at December 31, 2016 and 2015, the Group's retirement fund has investments in various shares of stocks under the stewardship of a reputable bank. All of the Fund's investing decisions are made by the Board of Trustees which is composed of certain officers of the Group. The power to exercise the voting rights rests with the Board of Trustees.
The plan typically exposes the Group to actuarial risks such as: investment risk, interest rate risk, longevity risk and salary risk.
Investment risk
The present value of the defined benefit plan l iability is calculated using a discount rate determined by reference to high quality corporate bond yields; if the return on plan asset is below this rate, it will create a plan deficit. Currently the plan's investments are in the form of debt instruments of government security bonds, equity instruments and fixed income instruments. Due to the long-term nature of the plan liabilities, the board of the pension fund considers it appropriate that a reasonable portion of the plan assets should be invested in government security bonds.
Interest rate risk
A decrease in the government security bond interest rate will increase the retirement benefit plan obligation.
IIIIIIIIIIII IIIII IIIIIIIIIIIIIII IIIIIIIIII IIIII IIIII IIIIIIIIII IIIII IIIIIIIIII IIIII IIIIIIIIIIII IIIII IIII IIIIII II IIII 47

Longevity risk
The present value of the defined benefit plan liability is calculated by reference to the best estimate of the mortality of plan participants both during and after their employment. An increase in the life expectancy of the plan participants will increase the retirement benefit obligation.
Salary risk
The present value of the defined benefit plan obligation is calculated by reference to the future salaries of plan participants. As such, an increase in the salary of the plan participants will increase the retirement benefit obligation.
The most recent actuarial valuation of plan assets and the present va lue of the defined benefit obligation were carried out by an independent actuary for the year ended December 31, 2016. The present value of the defined benefit obligation and the related current service cost was measured using the Projected Unit Credit Method.
The principal assumptions used for the purpose of the actuarial valuation were as follows:
Valuation at 2016 Valuation at 2015 Valuation at 2014
Discount Expected Rate of Expected Rate of Discount Expected Rate of Rate Salary Increase Discount Rate Salary Increase Rate Salary Increase
CPFI 5,53% 4.00% 5.03% 4.00% 4.57% 4.00% GTC 5 .53% 4.00% 5.21% 4.00% 4.79% 4.00% SMDC 5,53% 4,00% 4.93% 4.00% 4.66% 4.00% CPAVI 5 ,96% 4.00% 4.24% 4.00%
Amounts recognized in the consolidated statements of comprehensive income in respect of this retirement benefit plan are as follows :
2016 2015 2014
Service costs: Current service cost P 27,048,668 P21,698,545 p 20,179,530 Past service cost 32,578,192 Net Interest ex11ense 7,206,581 3,545,279 (2,096,678)
Components of defined benefit costs recognized In Qroflt or loss 34,255,249 57,822,016 18,082,852
Remeasurement on the net defined benefit asset: Loss on plan assets (excluding amounts Included In net
Interest expense) 4,219,054 6,839,004 1,886,849 Effect of asset celling 86,702 (50,115) 16,648 Actuarial (gains) losses:
from changes In financial assumptions (14,153,577) (5,231,011) 5,763,174 from experience adjustments (21,750,602) 33,018,837 2,463,583 from changes In demograQhlcs 80,243,059
Components of defined benefit costs recognized In other com11rehenslve Income (31,598,423) 34,576<715 90,373,313
p 2 656 826 P92 398 731 PlOB 456 165
The amount included in the consolidated statements of financial position arising from the Group's retirement benefit plan is as fo llows:
Present value of retirement benefit obligation Fair value of plan assets Effect of the asset ceiling
Retirement benefit obligation
2016
P274,930,471 (156,689,488)
86,701
PUS,327,684
2015
P282,892, 172 (125,852,401)
P157,039,771
IIIIIIIIIIIIIIIIIIIIIIIIIIIIIIIIIIIIIIIIIIIIIIIIIIIIIIIIIIIIIIIIIIIIIIIIIIIIIIIIIIIIIIIIIIIIIIIIIIIIIIIIIIIIIII IIII 48
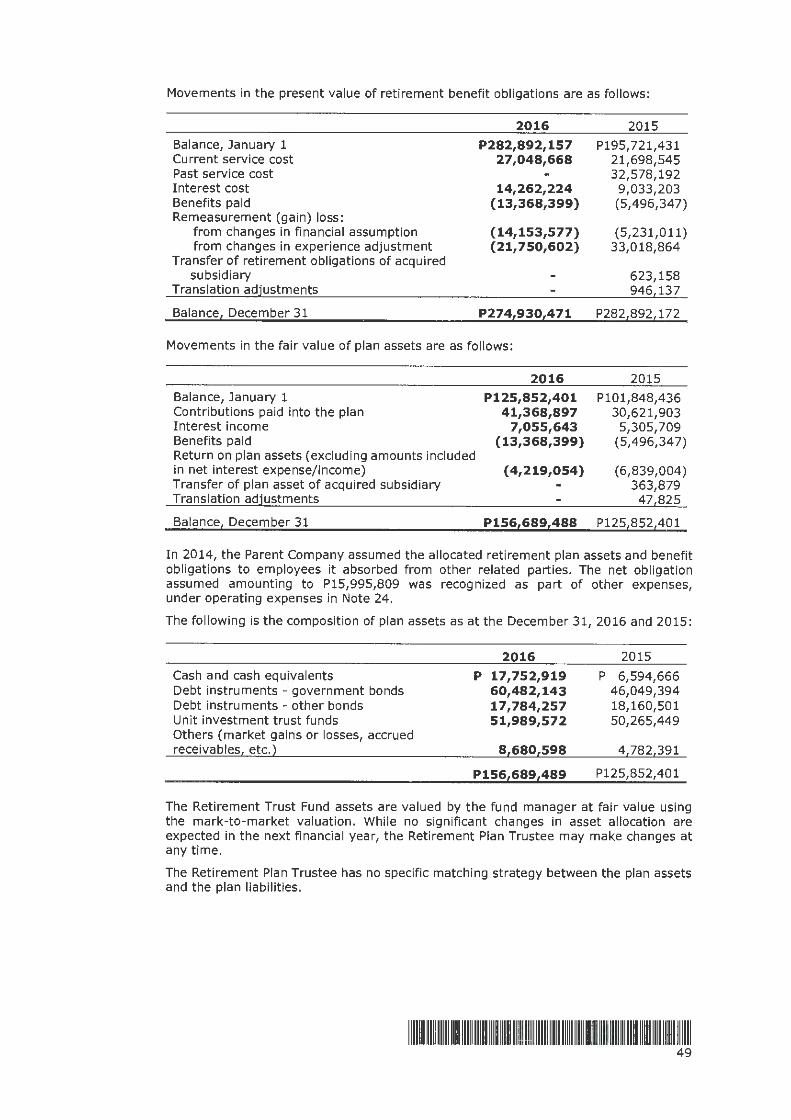
Movements in the present value of retirement benefit obligations are as follows:
Balance, January 1 Current service cost Past service cost Interest cost Benefits paid Remeasurement (gain) loss:
from changes in financial assumption from changes in experience adjustment
Transfer of retirement obligations of acquired subsidiary
Translation adjustments
Balance, December 31
2016
P282,892,157 27,048,668
14,262,224 {13,368,399)
{14,153,577) {21,750,602)
P274,930,471
Movements in the fair value of plan assets are as follows:
Balance, January 1 Contributions paid into the plan Interest income Benefits paid Return on plan assets (excluding amounts included in net interest expense/income) Transfer of plan asset of acquired subsidiary Trans lation adjustments
Balance, December 31
2016
P125,852,401 41,368,897
7,055,643 {13,368,399)
{4,219,054)
P156,689,488
2015
Pl 95,721,431 21,698,545 32,578,192
9,033,203 (5,496,347)
(5,231,011) 33,018,864
623,158 946,137
P282,892, 172
2015
PlOl,848,436 30,621,903
5,305,709 (5,496,347)
(6,839,004) 363,879
47,825
P125,852,401
In 2014, the Parent Company assumed the allocated retirement plan assets and benefit obligations to employees it absorbed from other related parties. The net obligation assumed amounting to P15,995,809 was recognized as part of other expenses, under operating expenses in Note 24.
The following is the composition of plan assets as at the December 31, 2016 and 2015:
Cash and cash equivalents Debt instruments - government bonds Debt instruments - other bonds Unit investment trust funds Others (market gains or losses, accrued receivables, etc.)
2016 p 17,752,919
60,482,143 17,784,257 51,989,572
8,680,598
P156,689,489
2015 p 6,594,666
46,049,394 18,160,501 50,265,449
4,782,391
P125,852,401
The Retirement Trust Fund assets are valued by the fund manager at fair va lue using the mark-to-market valuation. While no significant changes in asset allocation are expected in the next financia l year, the Retirement Plan Trustee may make changes at any time.
The Retirement Plan Trustee has no specific matching strategy between the plan assets and the plan liabilities.
1111111111111111111111111111111111111111111111111111111111111111111111111111111111111111111111111111111111111111111 49
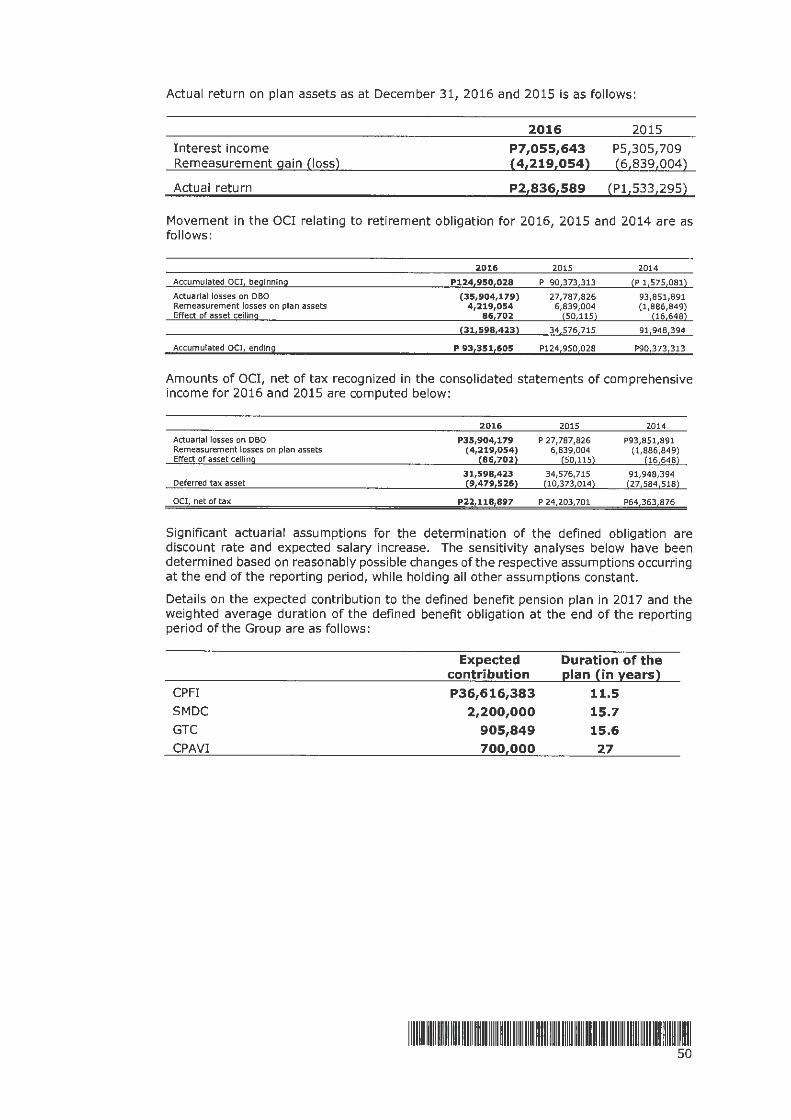
Actual return on plan assets as at December 31, 2016 and 2015 is as follows:
Interest income Remeasurement gain (loss)
Actual return
2016
P7,055,643 {4,219,054)
P2,836,589
2015
PS,305,709 (6,839,004)
(Pl,533,295)
Movement in the OCI relating to retirement obligation for 2016, 2015 and 2014 are as follows :
2016 2015 2014
Accumulated OCI, beginning P124,9S0,028 P 90,373,313 (P 1,575,081)
Actuarial losses on DBO (35,904,179) 27,787,826 93,851,891 Remeasurement losses on plan assets 4,219,054 6,839,004 (1,886,849) Effect of asset celling 86,702 (50,115) (16,648)
{31,598,423) 34,576/15 91,948,394
Accumulated oc1, endln!i P 93,351,605 P124,950,028 P90,373,313
Amounts of OCI, net of tax recognized in the consolidated statements of comprehensive income for 2016 and 2015 are computed below:
2016 2015 2014
Actuarial losses on DBO PJS,904,179 P 27,787,826 P93,851,891 Remeasurement losses on plan assets (4,219,054) 6,839,004 (1,886,849) Effect of asset celling (86,702) (50,115) (16,648)
31,598,423 34,576,715 91,948,394 Deferred tax asset {9,479,526) (10,373,014) (27,584,518)
OCI, net of tax P22,118,S97 P 24,203/01 P64,363,876
Significant actuarial assumptions for the determination of the defined obligation are discount rate and expected salary increase. The sensitivity analyses below have been determined based on reasonably possible changes of the respective assumptions occurring at the end of the reporting period, whi le holding all other assumptions constant.
Details on the expected contribution to the defined benefit pension plan in 2017 and the weighted average duration of the defined benefit obligation at the end of the reporting period of the Group are as follows:
Expected Duration of the contribution plan {in years)
CPFI P36,616,383 11.5 SMDC 2,200,000 15.7 GTC 905,849 15.6 CPAVI 700 000 27
1111111111111111111111111111111111111111111111111111111111111111111111111111111111 11111111111111111 1111111111111111 so
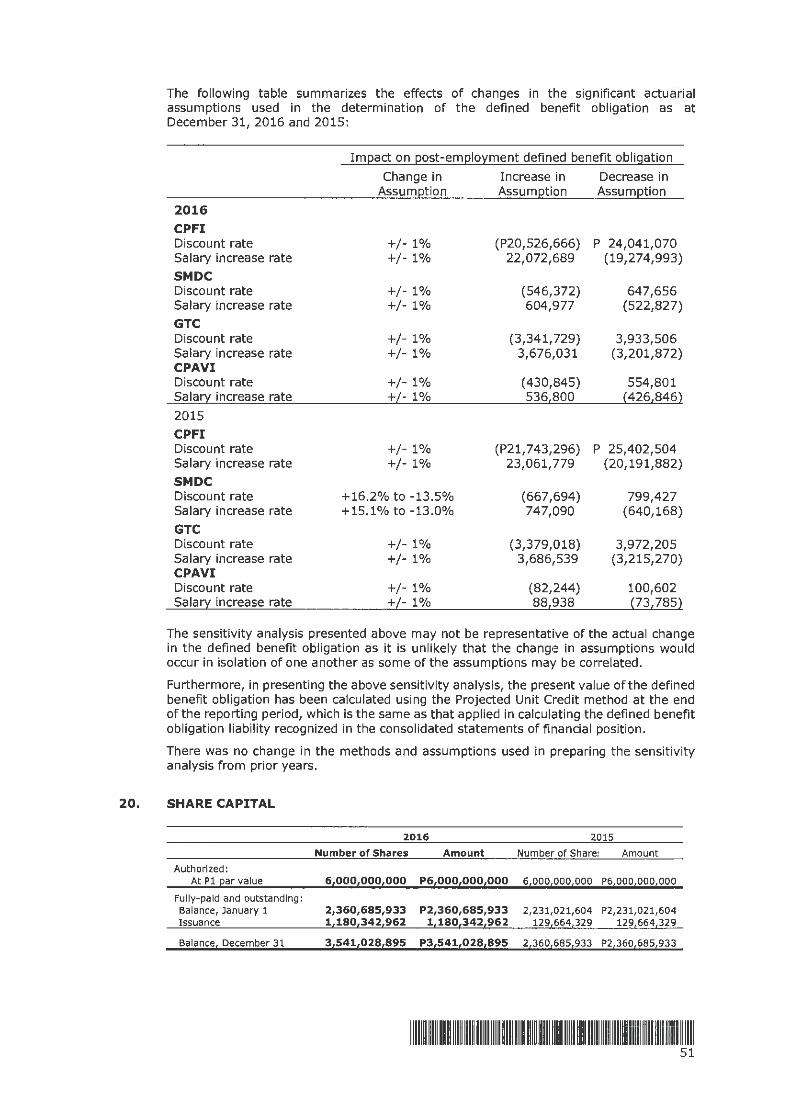
20.
The following table summarizes the effects of changes in the significant actuarial assumptions used in the determination of the defined benefit obligation as at December 31, 2016 and 2015:
Im12act on 12ost-em12lol'.ment defined benefit obligation
Change in Increase in Decrease in Assum12tion Assum12tion Assum12tion
2016 CPFI Discount rate +/- 1% (P20,526,666) P 24,041,070 Salary increase rate +/- 1% 22,072,689 (19,274,993)
SMDC Discount rate +/- 1% (546,372) 647,656 Salary increase rate +/- 1% 604,977 (522,827)
GTC Discount rate +/- 1% (3,341,729) 3,933,506 Salary increase rate +/- 1% 3,676,031 (3,201,872) CPAVI Discount rate +/- 1% (430,845) 554,801 Salary increase rate +L- 1% 5361800 (4261846}
2015
CPFI Discount rate +/- 1% (P21, 743,296) P 25,402,504 Salary increase rate +/- 1% 23,061,779 (20,191,882)
SMDC Discount rate +16.2% to -13.5% (667,694) 799,427 Salary increase rate +15.1% to -13.0% 747,090 (640,168)
GTC Discount rate +/- 1% (3,379,018) 3,972,205 Salary increase rate +/- 1% 3,686,539 (3,215,270) CPAVI Discount rate +/- 1% (82,244) 100,602 Salary increase rate +L- 1% 881938 (731785}
The sensitivity analysis presented above may not be representative of the actual change in the defined benefit obligation as it is unlikely that the change in assumptions would occur in isolation of one another as some of the assumptions may be correlated.
Furthermore, in presenting the above sensitivity analysis, the present value of the defined benefit obligation has been calculated using the Projected Unit Credit method at the end of the reporting period, which is the same as that applied in calculating the defined benefit obligation liability recognized in the consolidated statements of financial position.
There was no change in the methods and assumptions used in preparing the sensitivity analysis from prior years .
SHARE CAPITAL
2016 2015
Number of Shares Amount Number of Share: Amount
Authorized: At Pl ear value 6,000,000,000 P61ooo,ooo,ooo 6,000,000,000 P6100010001000
Fully-paid and outstanding: Balance, January 1 2,360,685,933 P2,360,6SS,933 2,231,021,604 P2,231,021,604 Issuance 1,1801342,962 1,180,342,962 129,664,329 129,664,329
Balance, December 31 3 1s41,02s,s9s P3,s41,02s,s9s 2,360,685,933 P21360168S,933
IIIIIIIIIIIIIIIIIIIIIIIIIIIIIIIIIIIIIIIIIIIIIIIIIIIIIIIIIIIIIIIIIIIIIIIIIIIIIIIIIIIIIIIIIIIIIIIIIIIIIIIIIIIIIIIIIII 51
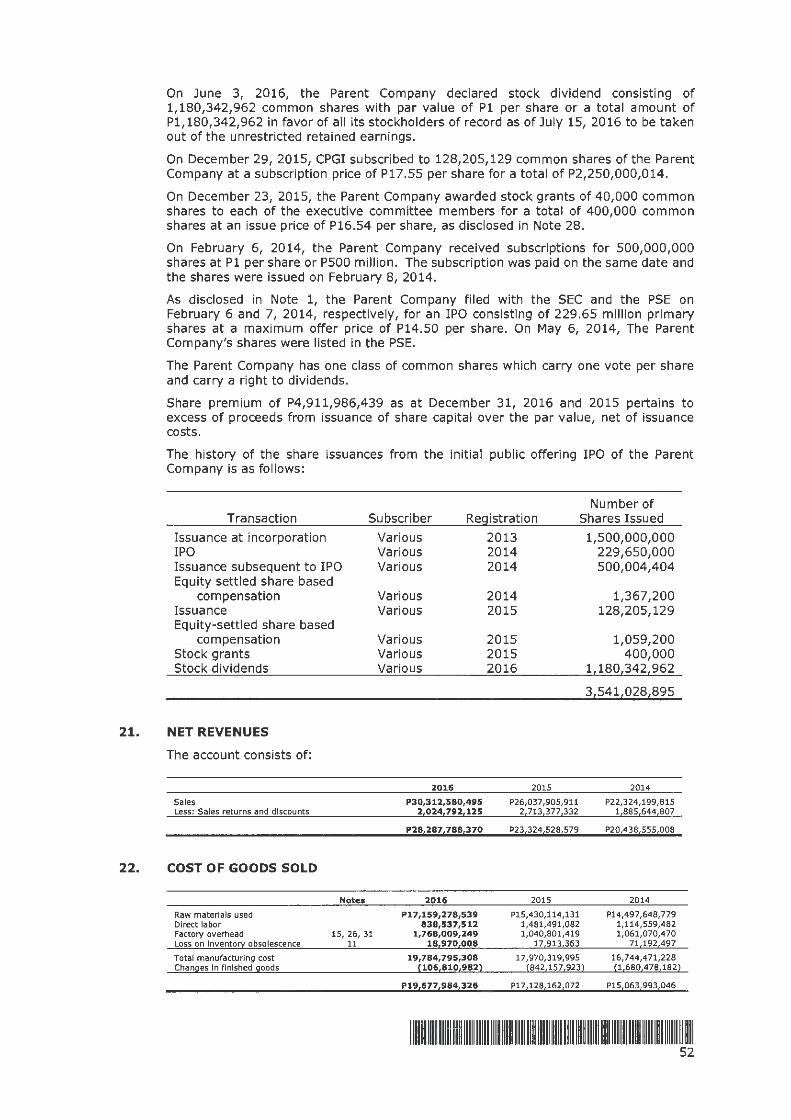
21.
22.
On June 3, 2016, the Parent Company declared stock dividend consisting of 1,180,342,962 common shares with par value of Pl per share or a total amount of Pl,180,342,962 in favor of all its stockholders of record as of July 15, 2016 to be taken out of the unrestricted retained earnings.
On December 29, 2015, CPGI subscribed to 128,205,129 common shares of the Parent Company at a subscription price of P17.55 per share for a total of P2,250,000,014.
On December 23, 2015, the Parent Company awarded stock grants of 40,000 common shares to each of the executive committee members for a total of 400,000 common shares at an issue price of P16.54 per share, as disclosed in Note 28.
On February 6, 2014, the Parent Company received subscriptions for 500,000,000 shares at Pl per share or P500 million. The subscription was paid on the same date and the shares were issued on February 8, 2014.
As disclosed in Note 1, the Parent Company filed with the SEC and the PSE on February 6 and 7, 2014, respectively, for an IPO consisting of 229.65 million primary shares at a maximum offer price of P14.50 per share. On May 6, 2014, The Parent Company's shares were listed in the PSE.
The Parent Company has one class of common shares which carry one vote per share and carry a right to dividends.
Share premium of P4,911,986,439 as at December 31, 2016 and 2015 pertains to excess of proceeds from issuance of share capital over the par value, net of issuance costs.
The history of the share issuances from the initial public offering IPO of the Parent Company is as follows :
Number of Transaction Subscriber Registration Shares Issued
Issuance at incorporation Various 2013 1,500,000,000 IPO Various 2014 229,650,000 Issuance subsequent to IPO Various 2014 500,004,404 Equity settled share based
compensation Various 2014 1,367,200 Issuance Various 2015 128,205,129 Equity-settled share based
compensation Various 2015 1,059,200 Stock grants Various 2015 400,000 Stock dividends Various 2016 1,180,342,962
3 541 028 895
NET REVENUES
The account consists of:
2016 2015 2014
Sales PJ0,312,580,495 P26,037,905,911 P22,324,199,815 Less: Sales returns and discounts 2,024,792,125 2,713,377,332 1 ,aa5,6441B07
P28,287,788,370 P23,324,528,579 P20,438,555,008
COST OF GOODS SOLD
Notes 2016 2015 2014
Raw materials used P17,159,278,539 P15,430,114,131 P14,497,648,779 Direct labor 838,537,512 1,481,491,082 1,114,559,482 Factory overhead 15, 26,31 1,768,009, 249 1,040,801,419 1,061,070,470 Loss on lnvento!Y obsolescence 11 18,970,008 17,913,363 71,192,497
Total manufacturing cost 19,784,795,308 17,970,319,995 16,744,471,228 Changes In finished goods {106,810,982) (842,157,923) (1,680,478,182)
P19,677,984,3 26 Pl 7,128,162,072 P15,063,993,046
1111111111111111111111111111111111111111111111111111111111111111111~1111111111111111111111111111111111111111 111111 52
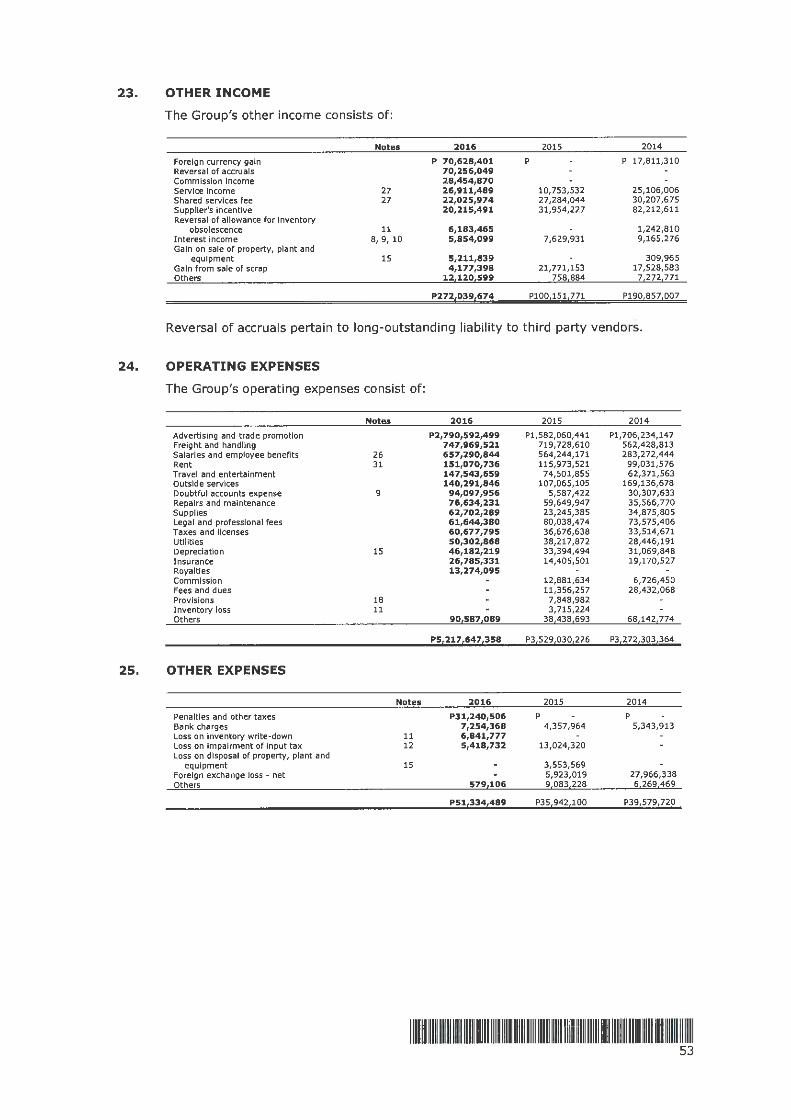
23. OTHER INCOME
24.
25.
The Group's other income consists of:
Foreign currency gain Reversal of accruals Commission Income Service Income Shared services fee Supplier's Incentive Reversal of allowance for Inventory
obsolescence Interest income Gain on sale of property, plant and
equipment Gain from sale of scrap Others
Notes
27 27
11 8,9, 10
15
2016
p 70,628,401 70,256,049 28,454,870 26,911,489 22,025,974 20,215,491
6,183,465 5,854,099
5,211,839 4,177,398
12 120 599
P272 039 674
2015 2014
p p 17,811,310
10,753,532 25,106,006 27,284,044 30,207,675 31,954,227 82,212,611
1,242,810 7,629,931 9,165,276
309,965 21,771,153 17,528,583
758 884 7 272 771
PlOO 151 771 P190 857 007
Reversal of accruals pertain to long-outstanding liability to third party vendors.
OPERATING EXPENSES
The Group's operating expenses consist of:
Notes 2016 2015 2014
Advertising and trade promotion P2,790,592,499 Pl,582,060,441 Pl,706,234,147 Freight and handling 747,969,521 719,728,610 562,428,813 Salaries and employee benefits 26 657,290,844 564,244,171 283,272,444 Rent 31 151,070,736 115,973,521 99,031,576 Travel and entertainment 147,543,659 74,501,855 62,371,563 Outside services 140,291,846 107,065,105 169,136,678 Doubtful accounts expense 9 94,097,956 5,587,422 30,307,633 Repairs and maintenance 76,634,231 59,649,947 35,566,770 Supplies 62,702,289 23,245,385 34,875,805 Legal and professional fees 61,644,380 80,038,474 73,575,406 Taxes and licenses 60,677,795 36,676,638 33,514,671 Utllltles 50,302,868 38,217,872 28,446,191 Depreciation 15 46,182,219 33,394,494 31,069,848 Insurance 26,785,331 14,405,501 19,170,527 Royalties 13,274,095 Commission 12,881,634 6,726,450 Fees and dues 11,356,257 28,432,068 Provisions 18 7,848,982 Inventory loss 11 3,715,224 Others 90 587 089 38 438 693 68 142 774
P5,217,647,358 P3,529,0301226 PJ,272,303,364
OTHER EXPENSES
Notes 2016 2015 2014
Penalties and other taxes P31,240,506 p p
Bank charges 7,254,368 4,357,964 5,343,913 Loss on inventory write-down 11 6,841,777 Loss on impairment of input tax 12 5,418,732 13,024,320 Loss on disposal of property, plant and
equipment 15 3,553,569 Foreign exchange loss - net 5,923,019 27,966,338 Others 579 106 9 083 228 6 269 469
P51 334 489 P35 942 100 P39 579 720
IIIIIIIIIIIIIIIIIIIIIIIIIIIIIIIIIIIIIIIIIIIIIIIIIIIIIIIIIIIIIIIIIIIIIIIIIIIIIIIIIIIIIIIIIIIIIIIIIIIIIIIIIIIIIIIIIII 53
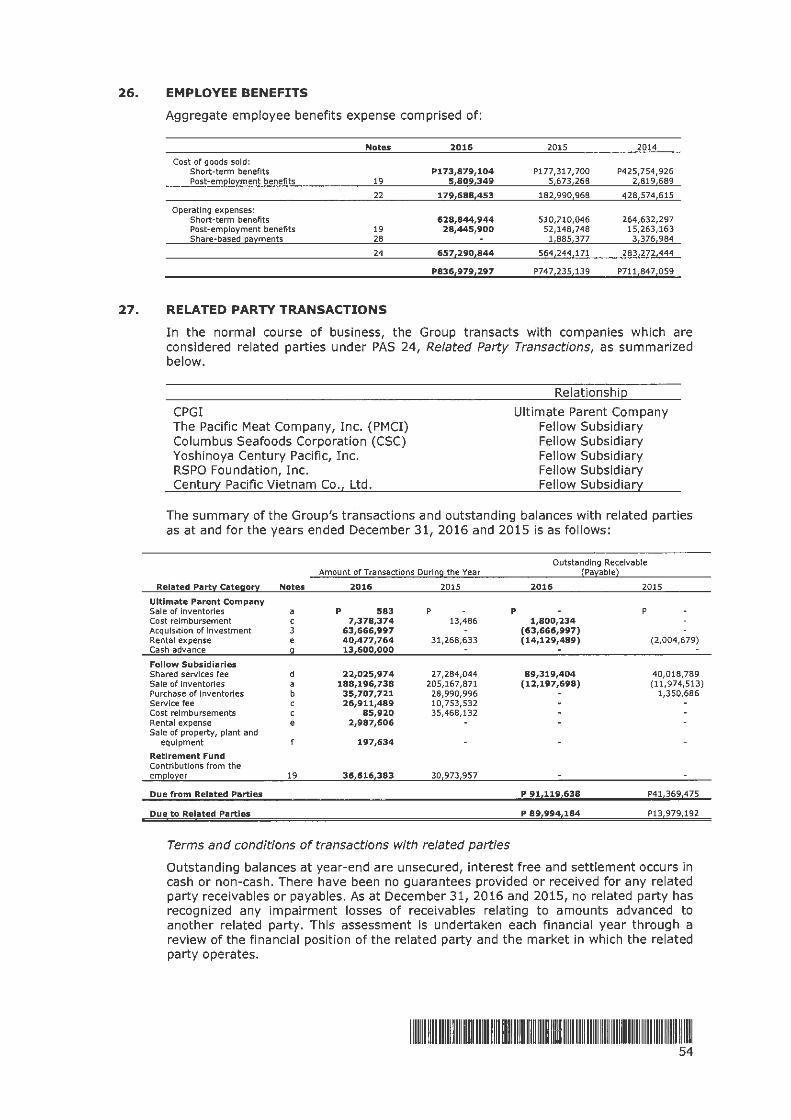
26. EMPLOYEE BENEFITS
Aggregate employee benefits expense comprised of:
Notes 2016 2015 2014
Cost of goods sold: Short-term benefits P173,879,104 Pl 77,317,700 P425,754,926 Post-emelo:i:ment benefits 19 5,809,349 5,673,268 2,819,689
22 179 688 453 182 990 968 428 574 615
Operating expenses: Short-term benefits 628,844,944 510,210,046 264,632,297 Post-employment benefits 19 28,445,900 52,148,748 15,263,163 Share-based ea:i:ments 28 1,885,377 3,376,984
24 657 290 844 564 244 171 283 272 444
P836 979 297 P747 235 139 P711 847 059
27. RELATED PARTY TRANSACTIONS
In the normal course of business, the Group transacts with companies which are considered related parties under PAS 24, Related Party Transactions, as summarized below.
CPGI The Pacific Meat Company, Inc. (PMCI) Columbus Seafoods Corporation (CSC) Yoshinoya Century Pacific, Inc. RSPO Foundation, Inc. Century Pacific Vietnam Co., Ltd.
Relationship
Ultimate Parent Company Fellow Subsidiary Fellow Subsidiary Fellow Subsidiary Fellow Subsidiary Fellow Subsidiary
The summary of the Group's transactions and outstanding balances with related parties as at and for the years ended December 31, 2016 and 2015 is as follows:
Outstanding Receivable Amount of Transactions During the Year (Pa:i:able)
Related Pa!:!}'. Cate!ilO!)'. Notes 2016 2015 2016 2015
Ultimate Parent Company Sale of Inventories a p 583 p p p Cost reimbursement C 7,378,374 13,486 1,800,234 Acquisition of Investment 3 63,666,997 (63,666,997) Rental expense e 40,477,764 31,268,633 (14,129,489) (2,004,679) Cash advance g 13,600,DDD
Fellow Subsidiaries Shared services fee d 22,025,974 27,284,044 89,319,404 40,018,789 Sale of Inventories a 188,196,738 205,167,871 (12,197,698) (11,974,513) Purchase of Inventories b 35,707,721 28,990,996 1,350,686 Service fee C 26,911,489 10,753,532 Cost reimbursements C 85,920 35,468,132 Rental expense e 2,987,606 Sale of property, plant and
equipment 197,634
Retirement Fund Contributions from the emelo:i:er 19 36,616,383 30,973,957
Due from Related Parties P 91,119,638 P4113691475
Due to Related Parties P 89,994,184 P1319791192
Terms and conditions of transactions with related parties
Outstanding balances at year-end are unsecured, interest free and settlement occurs in cash or non-cash. There have been no guarantees provided or received for any related party receivables or payables. As at December 31, 2016 and 2015, no related party has recognized any impairment losses of receivables relating to amounts advanced to another related party. This assessment is undertaken each financial year through a review of the financial position of the related party and the market in which the related party operates.
11111111111111111111111111111111111111111111111111~111111111111111111111111111111111111111111111111111111111111111 54
a. The Parent Company enters into sale transactions with its Ultimate Parent Company and fellow subsidiaries for the distribution of products to certain areas where Management deems it necessary to establish customers. Sales are considered pass through sales, hence, they were made without mark-up.
b. The Parent Company purchases goods from its related parties. These purchase transactions are pass through transactions, hence, they were made without mark-up.
c. The Parent Company shares cost with its related parties including repairs and maintenance, supplies, fees and dues, utilities and other operating expenses. Service income from related parties amounted to P26,911,489, Pl0,753,532, and P25,106,006 in 2016, 2015, and 2014 respectively, as shown in Note 23.
d. The Parent Company entered into a Master Service Agreement (MSA) with related parties to provide corporate office services. In accordance with the terms of the MSA, the Parent Company provides management service for manpower, training and development. For and in consideration thereof, the Parent Company shall charge the related parties their share of the costs on a monthly basis for the services rendered.
The MSA shall be in effect from date of execution and shall automatically renew on a month-to-month basis, unless terminated by either party through the issuance of a written advice to that effect at least 30 days prior to the intended date of termination.
Shared services fee amounted to P22,025,974, P27,284,044 and P30,207,675 in 2016, 2015 and 2014, respectively, which is included in other income account in the consolidated statements of comprehensive income shown in Note 23.
e. The Group, as a lessee, has a lease agreement with CPGI for the use of the latter's office space in Centerpoint, Ortigas. Total rental expense related on this lease agreement amounted to P40,477,764, P31,268,633 and P17,352,000 in 2016, 2015 and 2014, respectively, as disclosed in Note 31.
f. In 2016, the Group entered into sale of property, plant and equipment to PMCI for P197,634.
g. The Group, in the normal course of business, either provides to or borrow from its Ultimate Parent Company funds for working capital requirements. These advances are non-interest bearing and short-term in nature.
Remuneration of Key Management Personnel
The remuneration of the Directors and other members of key management personnel of the Group are set out below in aggregate for each of the categories specified in PAS 24, Related Party Disclosures :
Short-term employee benefits Post-employment benefit Share-based compensation
expense
2016
P359,520,349 10,139,167
2015 2014
P303,690,427 P211,068,659 9,937,444 7,541,952
1,885,376 2,452,275
P369,659,516 P315,513,247 P221,062,886
The short-term employee benefits of the key management personnel are included as part of compensation and other benefits in the consolidated statements of comprehensive income.
The Group has provided share-based payments to its key management employees for the years ended December 31, 2015 and 2014, as disclosed in Note 28.
1111111111111111111111111111111111111111111111111111111111111111111111111111111111111111111111111111111111111111111 55

28. SHARE-BASED PAYMENTS
Employee Stock Purchase Plan (ESPP)
The ESPP gives benefit-eligible employees an opportunity to purchase the common shares of the Parent Company at a price lower than the fair market va lue of the stock at grant date. The benefit-eligible employee must be a regular employee of the Group who possesses a strong performance record. The benefit-eligible employee shall be given the option to subscribe or purchase up to a specified number of shares at a specified option price set forth below. The eligible employee has the option to participate, or not. There are designated ESPP purchase periods and an employee may elect to contribute an allowable percentage of the base pay through salary deduction.
The plan took effect upon the shareholder's approval on September 26, 2014 and was approved by the SEC on December 19, 2014.
On June 3, 2015, the Parent Company's BOD authorized to amend the existing ESPP to increase the underlying shares from 3,269,245 shares to 8,269,245 shares and was approved by SEC on May 31, 2016.
The number of options granted is calculated in accordance with the performance-based formula approved by shareholders at the previous annual general meeting and is subject to approval by the remuneration committee.
As at December 31, 2016 and 2015, the aggregate number of shares that may be granted to any single individual during the term of the ESPP in the form of stock purchase plans shall be determined in the following capping of shares as follows:
Level
Vice-President or Board members Assistant Vice-Presidents Managers
Maximum Share Allocated
40,000 18,300 6,000
64 300
In 2015 and 2014, the purchase period schedules and option price are as follows:
Maximum Number of Purchase Period Available Shares
December 1 - 31, 2015 8,269,245
December 1 -10, 2014 3,269,245
Option Price
15% discount on the 3-mos average of Volume Weighted Average Price (VWAP) as of the date of approval by the Parent Company's stockholders or at a Floor Price of IPO price of P14.82
15% discount on the 3-mos average of VWAP as of the date of approva l by the Parent Company's stockholders or at a Floor Price of IPO price of P13. 75
Of the total shares available under the ESPP, employees subscribed to 1,059,200 shares at P14.82 per share and 1,367,200 shares at P13. 75 per share for a total of P15,697,344 and P18,779,000 in 2015 and 2014, respectively, shown as part of issued share capital in Note 20.
The share-based compensation expense recognized from the ESPP amounted to nil, Pl,885,376 and P3,376,984, in 2016, 2015 and 2014, respectively, included in employee benefits in Note 26 and shown under equity as share-based compensation reserve.
1111111111111111111111111111111111111111111111111111111111111111111111111111111111111111111111111111111111111111111 56

29. RETAINED EARNINGS
On June 3, 2016, the Board of Directors approved the declaration of stock dividends amounting to Pl, 180,342,962 with a par value of Pl per share to shareholders of record as at July 15, 2016 to be taken out of the Parent Company's unrestricted retained earnings as of December 31, 2015, as d isclosed in Note 20.
Furthermore, a cash dividend was declared by the Parent Company's Board of Directors on June 15, 2016 to stockholders of record as of Ju ly 15, 2016 for a total amount of P472,137,193 on all ordinary shares of issued and outstanding consisting of the fo llowing:
a) Regular cash dividend of P0.10 per share; and
b) Special cash dividend of P0.10 per share.
The Parent Company declared the fo llowing dividends to its equ ity shareholders :
2016
Date of Declaration Date of Record
Cash dividends June 15, 2016 July 15, 2016 Stock dividends June 3, 2016 July 15, 2016
Total dividends declared
2015 Total dividends declared
Dividends Per Share
P0.20
Total Dividends
P 472,137,193 1,180,342,962
Pl,652,480,155
P 446 204 321
The cash dividend declared in 2016 was paid on August 10, 2016.
30. EARNINGS PER SHARE
The calculation of the basic and diluted earnings per share is based on the fo llowing data:
2016 2015 2014
Profit for the period P2,655,596,062 Pl,933,674,778 Pl,591,590,352 Weighted average number of
common shares 3,541,028,895 2,231,782,198 2,094,316,379
Basic and diluted earnings eer share p 0.7500 p 0.8664 p 0.7600
As at December 31, 2016, 2015, and 2014, the Parent Company has no potential dilutive shares, accordingly, basic earnings per share of PO. 7500, P0.8664 and PO. 7600 in 2016, 2015, and 2014, respectively, are the same as diluted earnings per share.
IIIIIIIIIIIIIIIIIIIIIIIIIIIIIIIIIIIIIIIIIIIIIIIIIIIIIIIIIIIIIIIIIIIIIIIIIIIIIIIIII IIIIIIIIIIIIIIIIIIIIIIIIIIIIIIIII 57
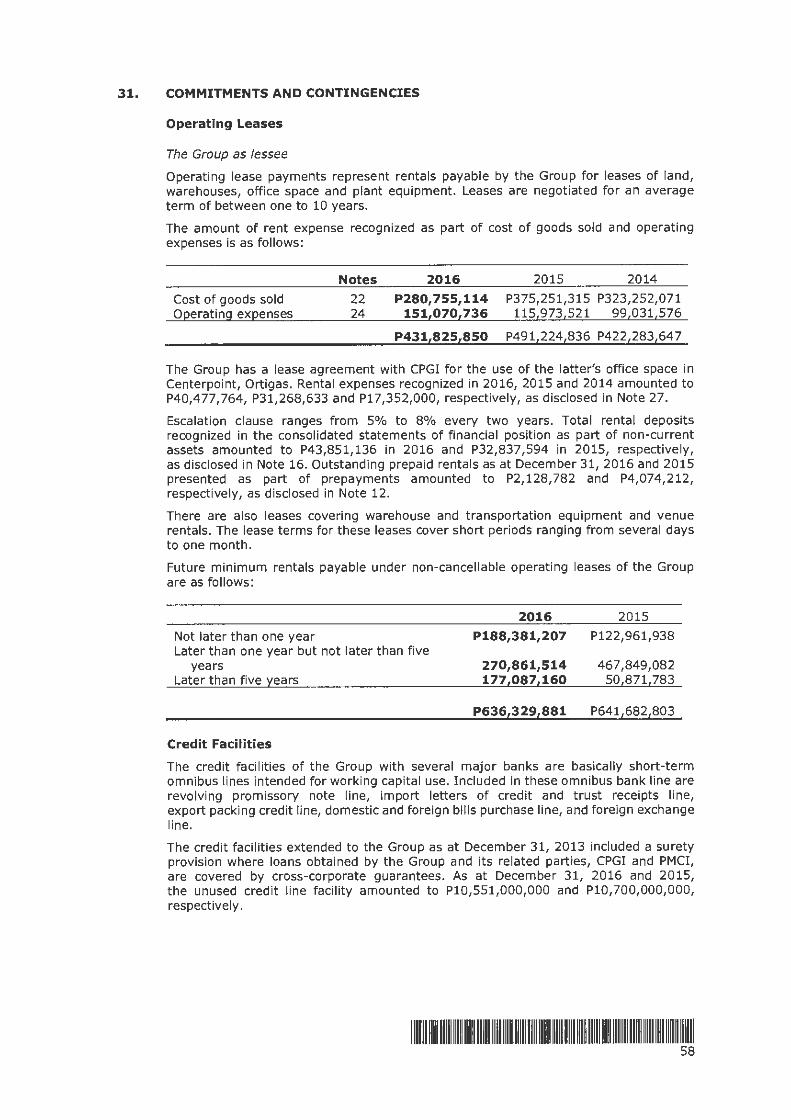
31. COMMITMENTS AND CONTINGENCIES
Operating Leases
The Group as lessee
Operating lease payments represent rentals payable by the Group for leases of land, warehouses, office space and plant equipment. Leases are negotiated for an average term of between one to 10 years.
The amount of rent expense recognized as part of cost of goods sold and operating expenses is as follows:
Cost of goods sold Operating expenses
Notes 2016 2015 2014
22 P280,755,114 P375,251,315 P323,252,071 24 151,070,736 115,973,521 99,031,576
P431,825,850 P491,224,836 P422,283,647
The Group has a lease agreement with CPGI for the use of the latter's office space in Centerpoint, Ortigas. Rental expenses recognized in 2016, 2015 and 2014 amounted to P40,477,764, P31,268,633 and P17,352,000, respectively, as disclosed in Note 27.
Escalation clause ranges from 5% to 8% every two years. Total rental deposits recognized in the consolidated statements of financial position as part of non-current assets amounted to P43,851,136 in 2016 and P32,837,594 in 2015, respectively, as disclosed in Note 16. Outstanding prepaid rentals as at December 31, 2016 and 2015 presented as part of prepayments amounted to P2,128,782 and P4,074,212, respectively, as disclosed in Note 12.
There are also leases covering warehouse and transportation equipment and venue rentals. The lease terms for these leases cover short periods ranging from several days to one month.
Future minimum rentals payable under non-cancellable operating leases of the Group are as fo llows:
Not later than one year Later than one year but not later than five
years Later than five years
Credit Facilities
2016
P188,381,207
270,861,514 177,087,160
P636,329,881
2015
P122,961,938
467,849,082 50,871,783
P641,682,803
The credit facilities of the Group with several major banks are basically short-term omnibus lines intended for working capital use. Included in these omnibus bank line are revolving promissory note line, import letters of credit and trust receipts line, export packing credit line, domestic and foreign bills purchase line, and foreign exchange line.
The credit facilities extended to the Group as at December 31, 2013 included a surety provision where loans obtained by the Group and its related parties, CPGI and PMCI, are covered by cross-corporate guarantees. As at December 31, 2016 and 2015, the unused credit line faci lity amounted to Pl0,551,000,000 and Pl0,700,000,000, respectively.
1111111111111111111111111111111111111111111111111111111111111111111111111111111111111111111111111111111111111111111 58
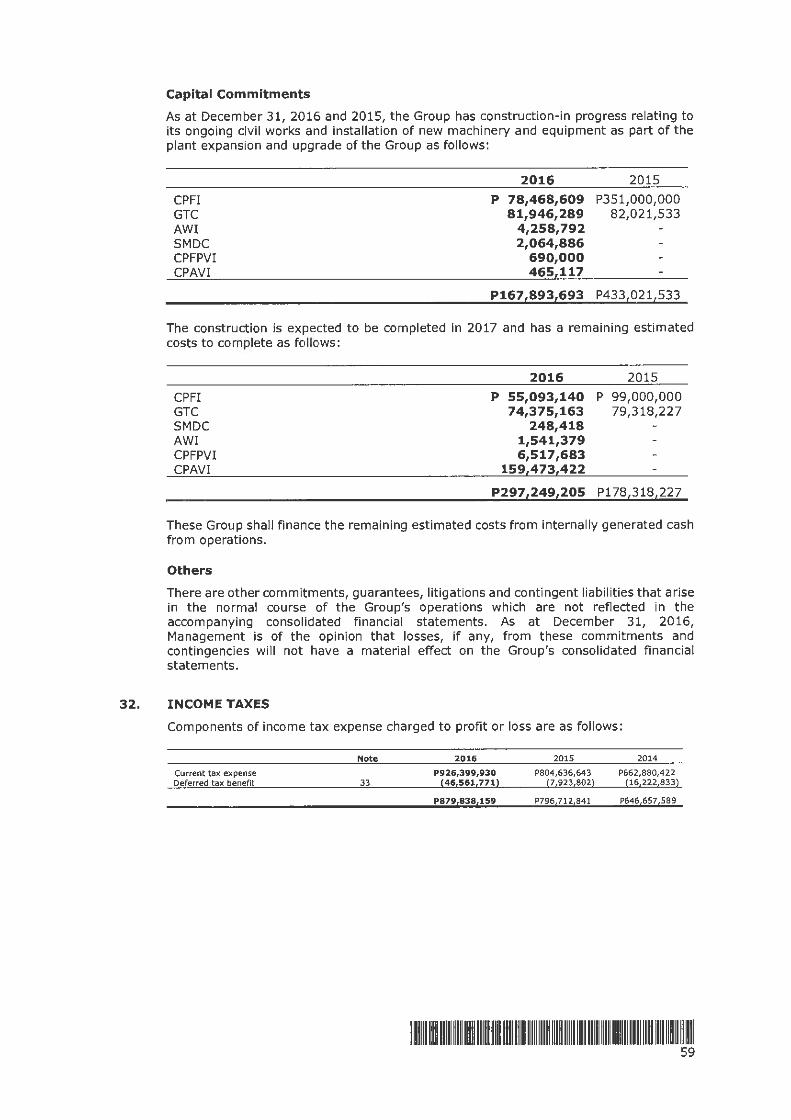
Capital Commitments
As at December 31, 2016 and 2015, the Group has construction-in progress relat ing to its ongoing civil works and installation of new machinery and equipment as part of the plant expansion and upgrade of the Group as follows :
2016 2015
CPFI p 78,468,609 P351,000,000 GTC 81,946,289 82,021,533 AWI 4,258,792 SMDC 2,064,886 CPFPVI 690,000 CPAVI 465 117
P167,893,693 P433,021,533
The construction is expected to be completed in 2017 and has a remaining estimated costs to complete as follows:
CPFI GTC SMDC AWI CPFPVI CPAVI
2016
P 55,093,140 74,375,163
248,418 1,541,379 6,517,683
159 473 422
2015
P 99,000,000 79,318,227
P297,249,205 Pl 78,318,227
These Group shall finance the remaining estimated costs from internally generated cash from operations.
Others
There are other commitments, guarantees, litigations and contingent liabilities that arise in the normal course of the Group's operations which are not reflected in the accompanying consolidated financial statements. As at December 31, 2016, Management is of the opinion that losses, if any, from these commitments and contingencies will not have a material effect on the Group's consolidated financial statements.
32. INCOME TAXES
Components of income tax expense charged to profit or loss are as follows:
Current t ax expense Deferred tax benefit
Note
33
2016
P926,399,930 (46,561,771)
P879 838 159
201 5
P804,636,643 (7,923,802)
P796 712 841
2014
P66 2,880,4 22 (16,222,833)
P646 6 57 589
1111111111111111111111111111111111111111111111111111111111111111111111111111111111111111111111111111111111111111111 59

A reconciliation of tax on pretax income computed at the applicable statutory rate to tax expense reported in the consolidated statements of comprehensive income is presented below.
2016 2015 2014
Accou ntl n~ erofit P3153514341221 P2173013871619 P2123812471941
Tax on pretax Income at 30% Pl,060,630,266 p 819,116,286 p 671,474,382 Adjustment for Income subjected to lower and higher
Income tax rate {14,709) (2,794,866) (2,379,511) Tax effects of:
Income exempted from Income tax (3,354,004) Interest Income subject to final tax (1,532,932) Effects of using OSD Instead of itemized
deductions (92,384,772) Initial public offering expenses charged to
equity) (14,963,436) Effects of previously unrecognized deferred tax
asset 31,797,950 149,165 Income under Income tax holiday (124,962,260) (25,963,866) (29,629,090) Non-deductible ex11enses 9,358,620 6,355,287 22,006,079
P 879 838 159 p 796 712 841 p 646 657 589
The detai ls of Group's net operating loss carry-over are as follows:
Year of Year of Incurrence Expiry
2013 2016
33. DEFERRED TAXES
Deferred Tax Assets
2015 Balance
P 17,294,411
Addition Application
p P17,294,411
2016 Balance
p
The Group recognized the deferred tax assets related to the following temporary differences as at December 31, 2016 and 2015:
Excess of Post-Allowance for Unrealized Allowance for contribution over employment write-down of foreign Doubtful retirement Benefit
lnvento!X curren~ loss Accounts ex11ense Obligation NOLCO Others
Deferred Tax Assets
Balance, January 1, 2015 P19,282,252 p P8,867,207 Pl,457,523 P26,543,298 p P 533,349 Charged to profit or loss for the
year 935,798 2,107,203 7,148,875 113,012 512,149 Charged to OCI 7,896,315 Translation adjustments 1,122,202 1,954,424 1,122,607 2,129,763
Balance, December 31, 2015 21,340,252 1,954,424 8,867,207 4,687,333 P43,718,251 113,012 1,045,498 Charged to profit or loss for the
year 5,439,268 (717,133) 30,057,441 3,788,209 1,291,325 (113,012) 6,009,343 Charged to OCI (9,479,527)
Balance,
Total
P56,683,629
10,817,037 7,896,315 6,328,996
81,725,977
45,755,442 (9,479,527)
December 311 2016 P2617791520 Pl12371291 P3819241648 P814751542 P3s1s30,049 p P710541841 P118,001,892
Deferred Tax Liabilities
The deferred tax liability recognized by the Group pertains to unrealized foreign exchange ga in detailed as follows:
Balance, January 1, 2015 Charged to profit or loss for the year Charged to OCI
Balance, December 31, 2015 Charged to profit or loss for the year Charged to OCI
Balance, December 31, 2016
Post-employment Benefit Obligation
p
p
240,080
240,080
(240,080)
Unrealized foreign exchange gain
P 460,022 2,893,975
3,353,997 (806,329)
P2,547,66S
Total
P 460,022 2,893,975
240,080
3,594,077 (806,329) (240,080)
P2,547,66S
1111111 111111111111111111111111111111111111111111111111111111111111111111111111111111111111111111111111111111111111 60
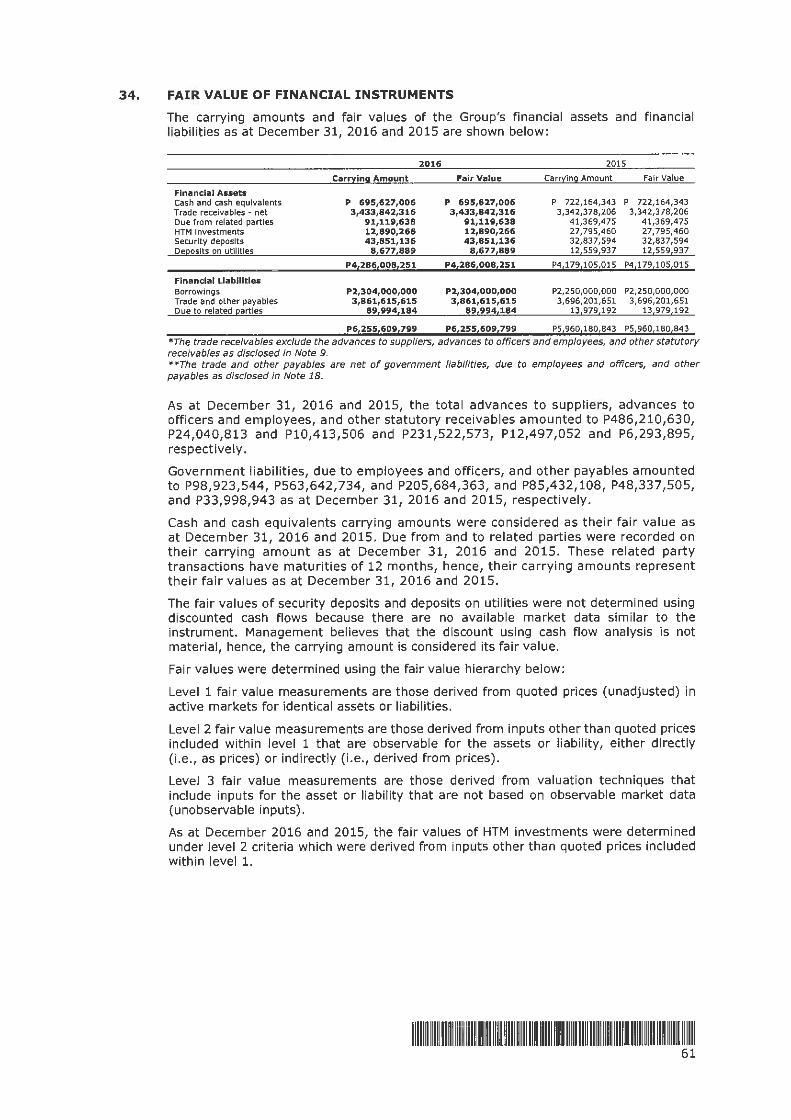
34, FAIR VALUE OF FINANCIAL INSTRUMENTS
The carrying amounts and fair values of the Group's financial assets and financial liabilities as at December 31, 2016 and 2015 are shown below:
2016 2015
Car!)'.lng Amount Fair Value Car!Ying Amount Fair Value
Financial Assets Cash and cash equivalents p 695,627,006 p 695,627,006 p 722,164,343 p 722,164,343 Trade recelva bles - net 3,433,842,316 3,433,842,316 3,342,378,206 3,342,378,206 Due from related parties 91,119,638 91,119,638 41,369,475 41,369,475 HTM Investments 12,890,266 12,890,266 27,795,460 27,795,460 Security deposits 43,851,136 43,851,136 32,837,594 32,837,594 Deeoslts on utilities 8,677,889 8,677,889 12,559,937 12,559,937
P412s6,oos,2s 1 P4,2861oos,2s1 P4117911os,01s P4117911os,01s
Financial Llabllltles Borrowings P2,304,000,000 P2,304,000,000 P2,250,000,000 P2,250,000,000 Trade and other payables 3,861,615,615 3,861,615,615 3,696,201,651 3,696,201,651 Due to related eartles 89,994,184 89,994,184 13,979,192 13,979,192
P&12ss,&091799 P612ss16o91799 PS196011so,s43 PS196011so,s43
*The trade receivables exclude the advances to suppliers, advances to officers and employees, and other statutory receivables as disclosed in Note 9. **The trade and other payables are net of government liabilities, due to employees and officers, and other payables as disclosed in Note 18.
As at December 31, 2016 and 2015, the total advances to suppliers, advances to officers and employees, and other statutory receivables amounted to P486,210,630, P24,040,813 and Pl0,413,506 and P231,522,573, P12,497,052 and P6,293,895, respectively .
Government liabilities, due to employees and officers, and other payables amounted to P98,923,544, P563,642,734, and P205,684,363, and P85,432,108, P48,337,505, and P33,998,943 as at December 31, 2016 and 2015, respectively.
Cash and cash equivalents carrying amounts were considered as their fair value as at December 31, 2016 and 2015. Due from and to related parties were recorded on their carrying amount as at December 31, 2016 and 2015. These related party transactions have maturities of 12 months, hence, their carrying amounts represent their fair values as at December 31, 2016 and 2015.
The fair values of security deposits and deposits on utilities were not determined using discounted cash f lows because there are no available market data similar to the instrument. Management believes that the discount using cash f low ana lysis is not material, hence, the carrying amount is considered its fair value.
Fair values were determined using the fair value hierarchy below:
Level 1 fair value measurements are those derived from quoted prices (unadjusted) in active markets for identical assets or liabilities.
Level 2 fair value measurements are those derived from inputs other than quoted prices included within level 1 that are observable for the assets or liability, either directly (i.e., as prices) or indirectly (i.e., derived from prices).
Level 3 fair value measurements are those derived from valuation techniques that include inputs for the asset or liability that are not based on observable market data (unobservable inputs).
As at December 2016 and 2015, the fair values of HTM investments were determined under level 2 criteria which were derived from inputs other than quoted prices included within level 1.
1111111111111111111111111111111111111111111111111111 111111111111111111111111111111111111111111111111111111111111111 61
35. FINANCIAL RISK MANAGEMENT
Financial Risk Management Objectives and Policies
The Group's activities expose it to a variety of financial risks: market risk (which include interest rates risk and foreign currency exchange risk), credit risk and liquidity risk. The Group's overall risk management program seeks to minimize potential adverse effects on the financial performance of the Group. The policies for managing specific risks are summarized below:
Market risk
Market risk happens when the changes in market prices, such as foreign exchange rates, Interest rates and equity prices will affect the Group's profit or the value of its holdings of financial instruments. The objective and management of this risk are discussed below.
Foreign currency exchange risk
Foreign currency exchange risk arises when an investment's value changes due to movements in currency exchange rate. Foreign exchange risk also arises from future commercial transactions and recognized assets and liabilities that are denominated in a currency that is not the Group's functional currency.
The Group undertakes certain transactions denominated in US Dollar (USD), hence, exposures to exchange rate fluctuations arise with respect to transactions denominated in such currency. Significant fluctuation in the exchange rates could significantly affect the Group's financial position.
The net carrying amounts of the Group's foreign currency (USD) denominated monetary assets and financial liabilities at the end of each reporting period are as follows:
Cash and cash equivalents Trade and other receivables Trade and other payables
2016
P 257,320,449 1,160,459,098 (614,823,448)
P 802,956,099
2015
P 153,614,590 1,290,251,175 (862,027,856)
P 581,837,909
The following table demonstrates the sensitivity to a reasonably possible change, based on prior year percentage change in exchange rates in Philippine peso (PHP) rate to US dollar with all other variables held constant, of the Group's income before income tax (due to changes in the fair value of financial assets and liabilities).
Change in Effect on currency income
December 31, 2016
Philippine Peso +/-5.85% P46,972,932
December 31, 2015 Philippine Peso +L-5.23% P30,4301 123
The following table details the Group's sensitivity to a 5.85% increase and decrease in the functional currency of the Group against the US Dollar. The sensitivity rate used in reporting foreign currency risk internally to key management personnel is 5.85% and it represents Management's assessment of the reasonably possible change in foreign exchange rate. The sensitivity analysis includes only outstanding foreign currency denominated monetary items and adjusts their translation at the end of the period for a 5.85% change in foreign currency rate. The sensitivity analysis includes all of the Group's foreign currency denominated monetary assets and liabilities. A positive number below indicates an increase in profit when the functional currency of the Group strengthens 5.85% against the relevant currency.
IIIIIIIIIIIIIIIIIIIIIIIIIIIIIIIIIIIIIIIIIIIIIIIIIIIIIIIIIIIIIIIIIIIIIIIIIIIIIIIIIIIIIIIIIIIIIIIIIIIIIIIIIIIIIIIIIII 62
For a 5.85% decline of the functional currency of the Group against the relevant cu rrency, there would be an equal and opposite impact on the profit as shown below:
Cash and cash equivalents Trade and other receivables Trade and other payables
Interest rate risk
2016
P15,053,246 67,886,857
(35,967,172)
P46,972,931
2015
P 8,034,043 67,480,136
(45,084,057)
P30 ,430, 122
Interest rate risk refers to the possibility that the value of a financial instrument will fluctuate due to change in the market interest rates.
The primary source of the Group's interest rate risk relates to cash and cash equivalents, advances to employees, HTM investments and borrowings. Interest rates are disclosed in Notes 8, 9, 10 and 17.
Cash equivalents are short-term in nature and with the current interest rate level, any variation in the interest will not have a material impact on the profit of the Group.
Borrowings are subject to specified interest rate referenced to the prevailing loan market interest rate. Any variation in the interest will not have a material impact on profit or loss of the Group. The current portion of the borrowings have short-term maturities and fixed interest rates, hence, any variation in the market interest will generally not have an impact on the profit or loss.
HTM investments are carried at amortized cost and bear fixed effective interest rates, hence, any variation in the market interest will generally not have an impact on the profit or loss of the Group.
The Group has no established policy is managing interest rate risk. Management believes that fluctuations on the interest rates wi ll not have significant effect on the Group's financial performance.
Credit risk
Credit risk refers to the possibility that a counterparty will default on its contractual obligations resulting in financial loss to the Group. The Group has adopted a policy of dealing only with creditworthy counterparties and obtaining sufficient collateral, when appropriate, as a means of mitigating the risk of financial loss from defaults.
The table below presents the Group's maximum exposure to credit risk without taking into account the value of any collatera l obtained:
Cash in banks and cash equivalents Trade receivables Due from related parties HTM investments Security deposits Deposits on utilities
2016 2015
P 694,302,143 P 721,011,289 3,556,091,143 3,370,997,803
91,119,638 41,369,475 12,890,266 27,795,460 43,851,136 32,837,594
8,677,889 12,559,937
P4,406,932,215 P4,206,571,558
lllllllllllllllllllllllllllllllllllll lllllllllllllllllllllllllllllllllllllllllllilllllllllllllllllllllllllllllllll 63

The aging analysis of the Group's financial assets as at December 31 is as follows:
2016 Cash In banks and cash
Neither Past Due nor
Impaired
Past Due Account but Not Impaired
1-30 Days Past 31-60 Days Past 61-90 Days Over 90 Days Impaired Due Due Past Due Past Due Financial Assets Total
equivalents P694,302,143 p p p p p P 694,302,143 Trade receivables 92,310,905 1,707,322,819 1,144,520,675 297,313,256 189,803,680 124,819,808 3,556,091,143 Due from related parties 91,119,638 91,119,638 HTM Investments 12,890,266 12,890,266 Security deposits 43,851,136 43,851,136 Deposits on utl lltles 8,677,889 8,677,889
P943,151,977 P1,7071322,819P1,144,520,675 P29713131256 >189,803,680 P124,819,808 P4,4061932,215
2015 Cash In banks and cash
p 721,011,289 p p p p p p 721,011,289 equivalents Trade receivables 2,494,075,186 521,209,051 152,866,252 59,076,643 86,531,477 28,619,597 3,342,378,206 Due from related parties HTM Investments Security deposits Deposits on utilities
41,369,475 27,795,460 32,837,594 12,559,937
41,369,475 27,795,460 32,837,594 12,559,937
P3132916481941 p 521,209,051 p 152,866,252 p 59,076,643 P 86,531,477 P 28,619,597 P 4,177,951,961
The amount of trade receivables presented is gross of collections received but not applied against individual customer balances pending identification of the col lections against specific customers amounting to P14,894,246 and P87,085,516 as at December 31, 2016 and 2015, respectively.
The following table details the credit quality of the Group's neither past due nor impaired financial assets:
Neither Past Due nor Imeaired
Satisfactory Acceptable High Grade Grade Grade Low Grade Total
2016 Cash In banks and cash equivalents P694,302,143 p p - p - P694,302,143 Trade receivables 92,310,905 92,310,905 Due from related parties 91,119,638 91,119,638 HTM Investments 12,890,266 12,890,266 Security deposits 43,851,136 43,851,136 Deposits on utilities 8,677,889 8,677,889
P7981312,047 P144,B391930 p - p - p943,1s1,977
2015 Cash In banks and cash equivalents P721,0ll,289 p p - p - p 721,011,289 Trade receivables 2,494,075,186 2,494,075,186 Due from related parties 41,369,475 41,369,475 HTM Investments 27,795,460 27,795,460 Security deposits 32,837,594 32,837,594 Deposits on ut ilities 12,559,937 12,559,937
P790 176 224 P2 539 472 717 p - p - P3 329 648 941
The Group uses internal ratings to determine the credit quality of its financial assets. These have been mapped to the summary rating below:
High Grade - applies to highly rated financial obligors and strong corporate counterparties.
Satisfactory Grade - applies to financial assets that are performing as expected, including loans and advances to small and medium sized entities and recently established businesses.
Acceptable Grade - applies to counterparties with risk profiles that are subject to closer monitoring and scrutiny with the objective of managing risk and moving accounts to improved rating category.
Low grade - applies to risk that are neither past due nor expected to result in loss but where the Group requires a workout of the relationship unless an early reduction in risk is achievable.
Trade and other receivables, security deposits and deposits on utilities were assessed by Management as standard grade as these are realized within the normal terms.
I IIIIII IIIII IIIII IIIII IIIII IIIIIIIIII IIIII IIIII IIIII IIIII IIIII IIIII IIIIIIIIIIIIIII IIIIIIIIIIII IIIII IIII IIIIII IIIIII 64
Liquidity risk
Liquidity risk is the risk that the Group will encounter difficulty in meeting the obligations associated with its financial liabilities that are settled by delivering cash or another financial asset. The Group's approach to managing liquidity is to ensure, as far as possible, that it will always have sufficient liquidity to meet its liabilities when due, under both normal and stressed conditions, without incurring unacceptable losses or risking damage to the Group's reputation.
The Group manages liquidity risk by continuously monitoring forecast and actual cash flows and matching the maturity profiles of financial assets and liabilities.
The following tables detail the Group's remaining contractual maturity for its financial liabilities. The tables have been drawn up based on the undiscounted cash flows, inclusive of principal and interest, of financial liabilities, based on the earliest date on which the Group can be required to pay.
2016 Trade and other payables Borrowings Due to related parties
2015 Trade and other payables Borrowings Due to related parties
Weighted Average Rate
3.330/o
2.38%
Less than One Year
P3,829,469,007 692,827,650
89,975,018
P4,612,271,675
P 3,696,201,651 2,303,437,500
13,979,192
P 6 013 618 343
More than One Year Total
p 32,146,608 P3,861,615,615 1,687,895,550 2,380,723,200
19,166 89,994,184
Pl,720,061,324 P6,332,332,999
p P 3,696,201,651 2,303,437,500
13,979,192
p P 6 013 618 343
The difference between the carrying amount of trade and other payables disclosed in the consolidated statements of financial position and the amount disclosed in this note pertains to government payables that are not considered financial liabilities.
36. CAPITAL RISK MANAGEMENT
The Group's objectives when managing capital are to increase the value of shareholder's investment and maintain high growth by applying free cash flows to selective investments that would further the Group's growth. The Group sets strategies with the objective of establishing a versatile and resourceful financial management and capital structure. The Group's overall strategy remains unchanged from 2015.
The BOD has overall responsibility for monitoring working capital in proportion to risk. Financial analytical reviews are made and reported in the Group's financial reports for the BOD's review on a regular basis. In case financial reviews indicate that the working capital sourced from the Group's own operations may not support future operations of projected capital investments, the Group obtains financial support from its related parties.
The Group's management aims to maintain certain financial ratios that it deems prudent such as debt-to-equity ratio (not to exceed 2.5:1) and current ratio (at least 1.0:1). The Group regularly reviews its financials to ensure the balance between equity and debt is monitored.
In addition, when the Group is able to meet its targeted capital ratios and has a healthy liquidity position, the Group aims to pay dividends to its shareholders of up to 30% of previous year's net income.
lllllll llllllllll llllllllll llllllllll lllll lllll llllllllllllllllllll llllllllll llllllllllllllllllllll 1111111111111111 65
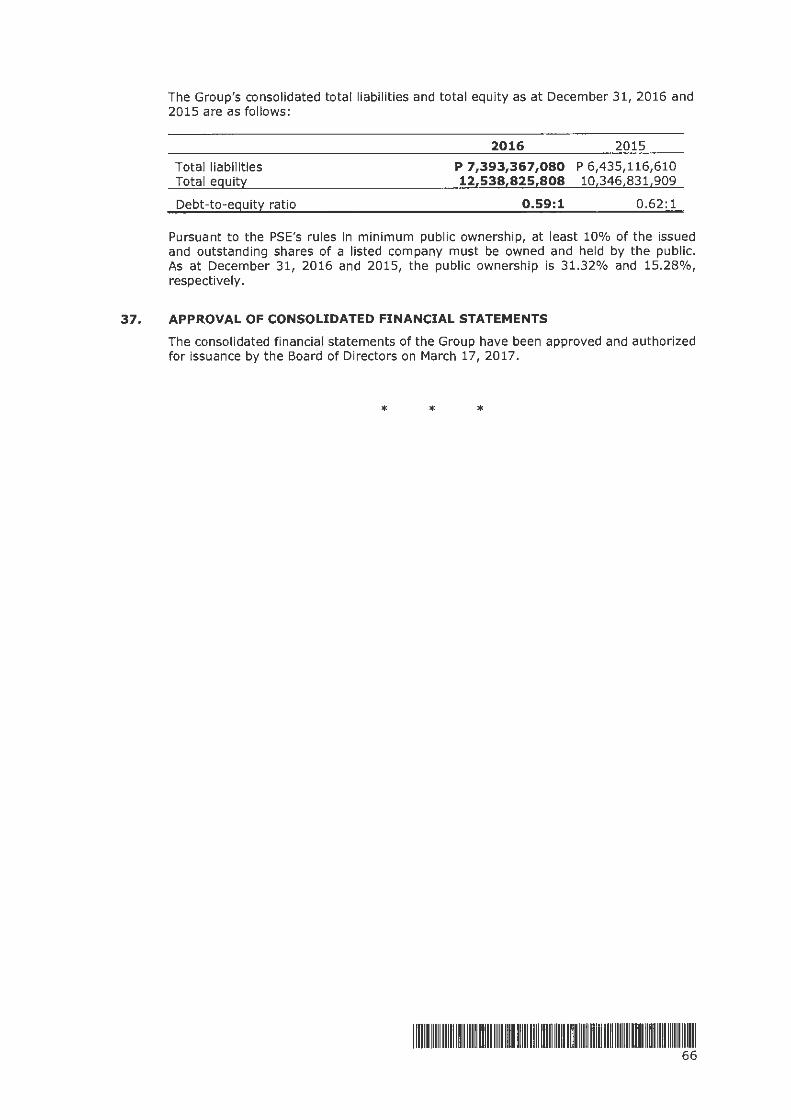
The Group's consolidated total liabilities and total equity as at December 31, 2016 and 2015 are as follows :
Total liabilities Total equity
Debt-to-equity ratio
2016 2015
P 7,393,367,080 P 6,435,116,610 12,538,825,808 10,346,831,909
0.59:1 0.62:1
Pursuant to the PSE's rules in minimum public ownership, at least 10% of the issued and outstanding shares of a listed company must be owned and held by the public. As at December 31, 2016 and 2015, the public ownership is 31.32% and 15.28%, respectively .
37. APPROVAL OF CONSOLIDATED FINANCIAL STATEMENTS
The consolidated financial statements of the Group have been approved and authorized for issuance by the Board of Directors on March 17, 2017.
* * *
IIIIIIIIIIIIIIIIIIIIIIIIIIIIIIIIIIIIIIIIIIIIIIIIIIIIIIIIIIIIIIIIIIIIIIIIIIIIIIIIIIIIIIIIIIIIIIIIIIIIIIIIIIIIIIIIIII 66