United States General Accounting Office Health, Education ...
Upload
truongminhCategory
view
216download
4
CJnited States General Accounting Office
Testimony
For Release on Delivery Expected at 10:00 a.m. ES% Thursday, February 18, 1988
Review of SBA's 8(a) Procurement Program
Statement of John H. Luke, Associate Director Resources, Community, and Economic
Development Division
Before the Committee or: Small Business United States Senate
c-,+4 \4\b GAO/T-RCED-88- 18 GAOPorm16O(12/27)

We appreciate the opportunity to assist your Committee in
considering some of the important issues surrounding the Small
Business Administration's (SBA) 8(a) program. As you know, we are currently conducting a review of this program at the request of
Chairman Jack Brooks, House Committee on Government Operations. MY remarks today represent preliminary observations on the results of
our review and their relevancy with respect to your current bill,
s. 1993. The bill discourages the overdependence of program
participants on 8(a) contracts by requiring a business mix that
reflects increasing percentages of non-8(a) contracts as a firm
approaches graduation and by fostering competition among program
participants for the award of 8(a) contracts over a given
threshold.
The objectives of our study are to evaluate three aspects of
the 8(a) program:l
-- contractor performance on 8(a) contracts,
-- administration and management of the program by
SBA, and
-- the impact of the program on non-8(a) small
businesses.
My remarks today focus primarily on the first two of these
objectives.
lTo accomplish these objectives, we have (1) conducted a detailed review of business develcpment and contract files on 142 8(a) firms at 6 of the larger SBA district offices in 3 SBA regions; (2) interviewed SBA district, regional, and headquarters officials; (3) interviewed procurement policy officials at selected Department of Defense and civil agencies and officials representing selected private interest groups; and (4) sent a mail survey to government contracting officers nationwide that were administering over 800 active and closed 8(a) contracts.

1 tl q~= II<! I- 3 1 , 01~ r wc)r k supper ts the intent CUE S. 1953,
~,~rti(:ularly the changes encouraging and assisting 8(a) firms to
develop their businesses as they progress through the program. The
current review is our first comprehensive look at the 8(a) program
since our April 8, 1981, report entitled The SBA 8(a) Procurement
Program: A Promise Unfulfilled (CED-81-55). In that report, we
stated that the program had done "too much" for "too few" for "too
long" and that only a few companies had graduated from the program
as self-sufficient businesses. The program has not really changed
except that many of the older firms have graduated--reached the end
of their fixed program participation term. (Exhibit A)
A large percentage of the 8(a) contract dollars continues to
go to a small number of firms and the program still is not doing a
good job in developing self-sufficient businesses--firms that do
not depend on 8(a) sales for a large part of their business. In my
testimony today, I will present a statistical overview of the
program, highlight some of the management weaknesses we observed,
and comment on areas of our work that are related to S. 1993. (I
should point out that we used SBA's financial information system
for the statistical overview, although that data, while the best
available, were not totally accurate.)
OVERVIEWOF PROGRAM
Our study revealed that less than 2 percent of the federal
government's procurement dollars were awarded to 8(a) firms. The
8(a) procurement program is available only to companies whose
owners have been certified by SBA as socially and economically
disadvantaged and eligible to receive federal contracts without
competition. SBA contracts for the work with the federal agencies
and then IIsubcontracts" with the 8(a) firms to fulfill the
contract. Much of the time, the firms have already been selected
by the federal agency, and SBA only fulfills the role of awarding
the contract to the 8(a) firm. According to information published
2

by the Federal Procurement Data Center, the federal government
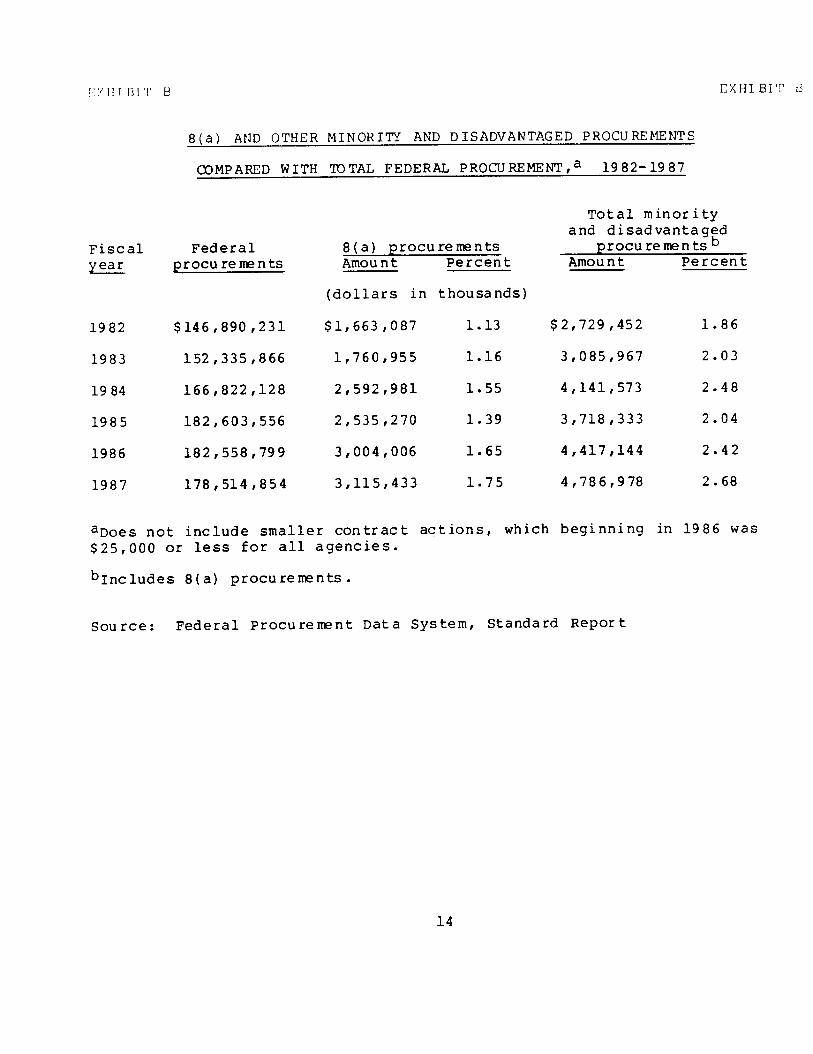
procured about 1.8 percent of its goods and services throuqh the 8(a) program --$3.1 billion of $178.5 billion--in fiscal year 1987. (Exhibit B)
Profile of 8(a) firms
In addition to determining the procurement dollars that went to 8(a) firms, we also developed a statistical profile that looked at the firms' graduation rates, minority mix, business cateqories, and location. SBA data show that since inception of the program in 1968 through fiscal year 1987, 1,287 firms have graduated from the program. Of these, 976, or about 76 percent, graduated during the last 3 fiscal years. This is a result of P.L. 96-481, enacted October 2, 1980, which requires SBA to establish a graduation date for each firm. Also, SBA's data reveal that, as of September 30, 198.7, 72 percent of the 2,938 active firms have been in the program 5 years or less.
As for the minority mix of program participants, we found that the number of firms in each minority category have increased over the period from 1982 to 1987. Bowever, the mix within active participants has changed. The most noticeable changes are an ll-
percent decrease in Black participation and an increase in all other minority groups, particularly for Asians--for which there has been approximately a 6-percent increase. (Exhibit C)
Similar to the minority mix change, the business classification of firms in the 8(a) program has also seen a increase in the number of firms in each classification except for
nonprofessional services. The most noticeable changes from 1982 to
1987 are an 8-percent increase in professional service firms and about a 7-percent decrease in nonprofessional service firms. (Exhibit D)
3
Geographically, the 2,938 active 8(a) firms as of September 30, 1987, were dispersed throughout all 10 SBA reqional offices-- ranging from a low of 108 firms in the Boston region to a hiqh of 681 firms in the Philadelphia region. The greatest concentration of firms was in the Washington, D.C., San Francisco, and Los Angeles metropolitan areas which combined had about 22 percent of the active firms and about 29 percent of the 8(a) contract dollars. (Exhibit F)
Performance of 8(a) firms
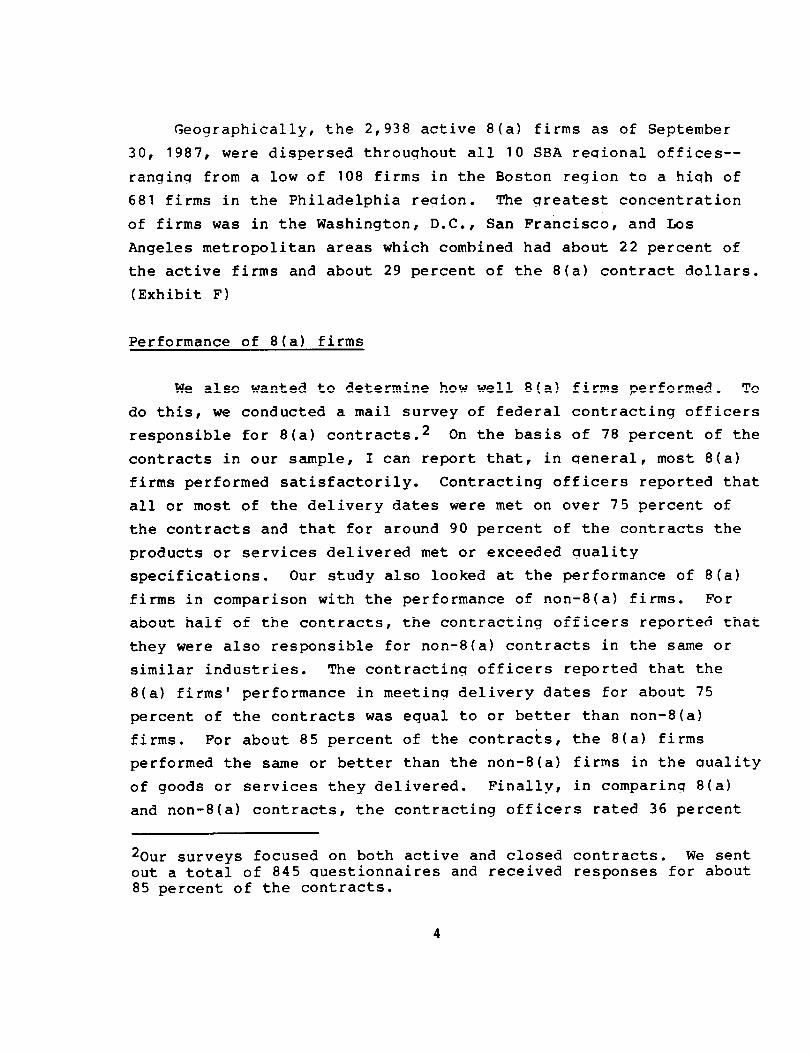
We also wanted to determine how well 8(a) firms performed. To do this, we conducted a mail survey of federal contracting officers responsible for 8(a) contracts.2 On the basis of 78 percent of the contracts in our sample, I can report that, in general, most 8(a) firms performed satisfactorily. Contracting officers reported that all or most of the delivery dates were met on over 75 percent of the contracts and that for around 90 percent of the contracts the products or services delivered met or exceeded quality
specifications. Our study also looked at the performance of 8(a) firms in comparison with the performance of non-8(a) firms. For about half of the contracts, the contracting officers reported that they were also responsible for non-8(a) contracts in the same or similar industries. The contracting officers reported that the 8(a) firms' performance in meeting delivery dates for about 75 percent of the contracts was equal to or better than non-8(a) firms. For about 85 percent of the contracts, the 8(a) firms performed the same or better than the non-8(a) firms in the quality of goods or services they delivered. Finally, in comparing 8(a) and non-8(a) contracts, the contracting officers rated 36 percent
20ur surveys focused on both active and closed contracts. We sent out a total of 845 questionnaires and received responses for about 85 percent of the contracts.
4

of the 8(a) contracts to be more costly to the sovernment, whereas they rated 9 percent of non-8(a) contracts to be more costly.
Respondents were also asked about the amount of performance- monitoring reauired by their aqencies for 8(a) firms compared with non-8(a) firms over the last 2 years. Responses on nearly half of the questionnaires indicated that 8(a) firms reuuired somewhat more or much more monitoring, about 40 percent indicated reauired about indicated that monitorinq.
the same monitorinq, and less than 5 8(a) firms required somewhat or much
FEW FIRMS STILL DO MOST OF 8(a) DOLLAR VOLUME
that 8(a) firms percent less
I would like to turn now to the issue of how much the proqram does for the participatinq firms. In our 1981 report, we reported that 50 firms had received about 31 percent of the total value .of the 8(a) contracts awarded. In f.iscal year 1987, the top 50 firms received about 35 percent of the 8(a) dollar volume of business. (Exhibit R) In contrast, 1,225 active firms did not do any 8(a) business in fiscal year 1987 and another 555 firms did $100,000 or less of 8(a) business.
8(a) FIRMS STILL NOT BEING DEVELOPED INTO SELF-SUFFICIENT BUSINESSES
We found a similar lack of proqress in the proqram's effectiveness in assistinq firms in becoming self-sufficient businesses. We concluded in our 1981 report, and it appears that we can report today, that the program is not doing a very qood job in developing self-sufficient businesses. Our reason for saying this is based on (1) the results of this Committee’s 1987 survey of 8(a) qraduates and (2) the analyses of our sample firms. Sales information in SBA's files was available for 35 firms that had been
5

in the program for 7 years or more to show their dependency on the
8(a) program. Althoush most of these firms either have graduated or will graduate from the program before the end of fiscal vear 1988, many have not developed their non-8(a) business. In contrast to the 75/25 non-8(a)/8(a) mix, proposed in S. 1993 for firms that have been in the program for 7 years, the 8(a) sales for 11 firms represented 90 percent or more of the total sales after 7 or more years in the program. The 8(a) sales for an additional 16 firms ranged between 38 percent and 87 percent of total sales. Only 8 of the 35 firms met or exceeded the bill's non-8(a)/8(a) mix of 75/25. As a group, however, these firms tended to be small when compared with the firms that were more dependent on 8(a) sales--sales of the
8 firms averaged $2.0 million and ranged between $107,000 and $13.1
million and sales of the other 27 firms averaged $9.6 million and ranged between $23,000 to $52.1 million. (Exhibit I)
Included in our sample were 10 of the 50 firms that had received the most 8(a) business in fiscal year 1987 and for which we had a 5-year history of 8(a) and non-8(a) sales information. In analyzing the sales growth of these firms, we found that their average total sales increased from $3.8 million to $20.8 million during the 5-year period. Over 75 percent of that growth, however, came through 8(a) sales. Collectively, the 10 firms' dependency on 8(a) sales decreased from an average of 82.6 percent to 81.3
percent during the S-year period. Further, individually six firms were more 8(a) dependent in their last year, while only four were less dependent. (Exhibit J)
The following examples show how two of the firms developed. The sales of one firm that had been in the program for about 9 years increased from $5.1 million in fiscal year 1983 to $52.1
million in fiscal year 1987. During the same period, the firm's 8(a) sales increased from about $4.8 million to $50.8 million: as of April 30, 1987, the 8(a) sales represented about 98 percent of the firm's total sales. This firm is scheduled to graduate from
6

the proqram in April 1988. The sales of another firm that had also been in the program about 9 years increased from $13.4 million in fiscal year 1983 to $47.3 million in fiscal year 1987. This firm's non-8(a) sales increased $19.1 million and 8(a) sales increased $14.8 million. In 1987 the firm's 8(a) sales were 53.8 percent of total sales. This firm is also scheduled to graduate in April 1988.
Mix of 8(a) awards
s. 1993 addresses a mix of 8(a) and non-8(a) patterns based on years of participation in the program and provides for competing 8(a) business to (1) guard aqainst political influence, favoritism, and outright fraud that has haunted the proqram through award of larger 8(a) contracts and (2) encouraqe business development. Competition would be basically required on all awards over $2 million. SBA data indicate that the $2.0 million threshold reauirement could significantly contribute to achieving the first objective but would have little impact on the second. Our analysis of 8(a) contracts3 awarded in fiscal years 1985 through 1987 showed that while between 49 and 60 percent of the 8(a) contract dollars were involved in contracts over the $2.0 million threshold, only about 6 percent of the number of contracts awarded in 1985 and 1986
and less than 5 percent in 1987 exceeded the threshold.
If the threshold were to be set at $1.0 million, the data show that between 9 and 12 percent of the contracts during fiscal years 1985 through 1987 would have been awarded competitivelv, thereby giving 8(a) firms more opportunity to compete. (See exhibit K for the number, value, and percent of awards made for the last 3 fiscal years at four different threshold levels--SSOO,OOO, $1.0 million, $2.0 million, and $5.0 million.)
3For the analysis, we used the basic contract award amount and assumed that later modifications could have been estimated at time of original award.
7
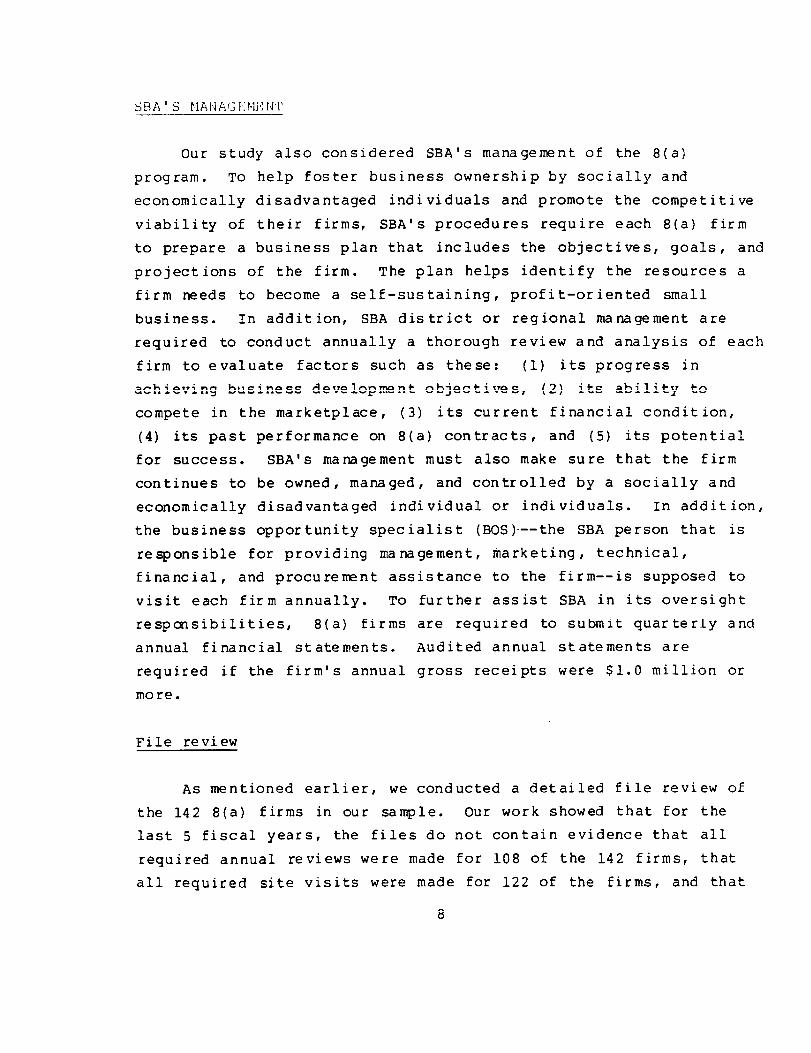
Our study also considered SBA's management of the 8(a)
program. To help foster business ownership by socially and
economically disadvantaged individuals and promote the competitive
viability of their firms, SBA's procedures require each 8(a) firm
to prepare a business plan that includes the objectives, goals, and
projections of the firm. The plan helps identify the resources a
firm needs to become a self-sustaining, profit-oriented small
business. In addition, SBA district or regional management are
required to conduct annually a thorough review and analysis of each
firm to evaluate factors such as these: (1) its progress in
achieving business development objectives, (2) its ability to
compete in the marketplace, (3) its current financial condition,
(4) its past performance on 8(a) contracts, and (5) its potential
for success. SBA's management must also make sure that the firm
continues to be owned, managed, and controlled by a socially and
economically disadvantaged individual or individuals. In addition,
the business opportunity specialist (BOS)--the SBA person that is
responsible for providing management, marketing, technical,
financial, and procurement assistance to the firm--is supposed to
visit each firm annually. To further assist SBA in its oversight
responsibilities, 8(a) firms are required to submit quarterly and
annual financial statements. Audited annual statements are
required if the firm's annual gross receipts were $1.0 million or
more.
File review
As mentioned earlier, we conducted a detailed file review of
the 142 8(a) firms in our sample. Our work showed that for the
last 5 fiscal years, the files do not contain evidence that all
required annual reviews were made for 108 of the 142 firms, that
all required site visits were made for 122 of the firms, and that
8

2.1 1 L~(IIII!-~I~ tintinci.31 statement:; wfzrr2 recei ved for 57 of tne
firms. WC also observed instances of SBA accepting financial
statements prepared by the owners rather than the required audited
financial statements.
SBA district and regional officials acknowledged that all
required annual reviews and site visits were not being made and
some financial information was missing, but commented that the
program had never been staffed adequately. In this regard, we
concluded in our 1981 report that SBA did not have the staff to
effectively manage the program. Since then, the number of 8(a)
firms per BOS has increased from 17:l ratio to a 26:l ratio. At
the district offices we visited, the ratio of 8(a) firms to BOSS
ranged from 2O:l to 38:l. While S. 1993 would set a 2O:l ratio
goal, SBA's Deputy Associate Administrator for Office of Minority
Small Business and Capital Ownership Development told us that SBA
would like to achieve a staffing ratio of 10 to 15 firms per BOS.
In addition, the National Association of Public Administration's
study stated that SBA has a need for better trained staff, as well
as more staff.
Economic disadvantage criteria
needs clarification
Our study also looked at the issue of economic disadvantage.
Public Law 95-507 limits the 8(a) program to firms owned and
controlled by individuals who are both socially and economically
disadvantaged. Although SBA's regulations define economically
disadvantaged individuals and provide general criteria, SBA has
basically considered anyone that is socially disadvantaged to be
economically disadvantaged also. However, in its standard
operating procedures, dated April 27, 1987, for the first time SBA
set a personal net-worth threshold for determining "economically
disadvantaged." These procedures state that "Generally,
individuals having a net worth of less than $750,000 will be
9

~‘I)Il:jld~:I’,ll to t,c-a t~~.r)ri~ilni~:dl ly dl sadvcinttgf2(3, absent a ~:lear shob;ina
tr-1 tt!F? C:IJli tr3Ly.” In commenting on H.R. 1807( a con!par.ion bill to
S. 1993) SRA's Associate Deputy Administrator for Managemnt and
Administration, on September 29, 1987, stated that SBA believes that the $750,000 figure should be lowered to $250,000 to $300,000,
with a provision to deal with situations where assets warrant
exception. SBA has not made a decision on this matter.
Our review showed that some owners of existing firms in our
sample reported personal net worth that exceeded the $750,000
threshold. None of these firms, however, was terminated.
Notwithstanding this, one of the district offices we visited had
recently considered two active 8(a) firms for termination because
the owners were believed to be no longer economically
disadvantaged. In one of the cases, the district director
recommended the firm be terminated because the owner earned
$357,000 in one year and concluded that the owner's stated net
worth of about $475,000 was "grossly understated." The district director later changed his position and recommended continuation of
this firm until the expiration of its fixed program participation
term. He said that he could find no objective criteria nor
precedent for determining "economic disadvantage" and believed that
a finding of economic disadvantage would not withstand challenge on
appeal by the 8(a) firm. The Deputy Associate Administrator for
the Office of Minority Small Business and Capital Ownership
Development said that no firms have been terminated because its
owner was no longer economically disadvantaged since the
establishment of fixed program participation terms in 1982.
Because the law requires that the program be directed to both
socially and economically disadvantaged individuals, the
uncertainty of what is meant by economically disadvantaged and what
actions SBA should take under the circumstances needs to be
clarified.
10

ptitct1ce c.,t r3war 11 nq con tl- 3~: ts w ith opt ions to
araduatinq firms needs clarification
Finally, on the basis of our study, we believe that SBA'S
practice of awarding contracts with options needs clarification.
SBA will award contracts with renewable options to an 8(a) firm up
to and including its last day in the program. This practice can
result in the removal of future contracts for goods or services
from the 8(a) program for several years if the government chooses
to exercise the contracting options, and could adversely impact the
developmental needs of other firms in the program with the same or
similar types of business. Of the 142 firms in our sample, 23
graduated between August 1986 and December 1987. Of these, six
firms received one or more contracts during the firms' last month
in the program. One nonprofessional service firm, for exanp?le, was
awarded 13 contracts during its last month in the program, of which
7 were dated on the firm's last day in the program. At least 12 of
the contracts included options ranging from 1 to 4 years. The
other contract may have had options, but SBA could not locate the
contract file. Including the value of the options, the aggregate
dollar amount of the 13 contracts is at least $4.3 million, which
was about equal to the value of all contracts and modifications
received by the firm during the period October 1981 to August 1987.
We recognize that many of the graduating firms are highly
dependent on 8(a) sales and if they were denied 8(a) business they
could have a more difficult time competing outside the protection
of the 8(a) program. However, if firms are encouraged to develop
their non-8(a) business as they move through the program as
proposed by S. 1993, then changing the policy so that contracts are
awarded without options to graduating firms may not be as
detrimental to their business.
11

In summary, the General Accounting Office is in agreement with
the changes proposed to strengthen the 8(a) program. Based on our
work to date for the House Committee on Government Operations, we
believe that the combined effect of the proposed legislative
changes encouraging 8(a) firms to develop their non-8(a) business
as they progress in the 8(a) program should result in a wider
distribution of the 8(a) business among the participants and better
prepare them to make the transition into the mainstream.
Mr. Chairman, this concludes my prepared statement. I will be
happy to respond to any questions.
12

CXMI BIT A
GAO REVIEWS OF SBA'S 8(a) PROGRAM
SHOWS THAT PROGRAM HAS NOT CHANGED MUCH
1981 Current
About 31 percent of 8(a) business About 35 percent of 8(a) business went to 50 firms went to 50 firms
very few firms were graduating Many older firms have graduated as a result of P.L. 96-481, enacted 10/2/80-- 72 percent of active firms have been in program 5 years or less
Did not develop self-sufficient businesses Same
13
I‘Y II 1 131 ‘I B EXHIBIT U
8(a) AND OTHER MINORITY AND DISADVANTAGED PROCUREMENTS
COMPARED WITH 'IOTAL FEDERAL PROCUREMENT,a 1982-1987
Fiscal year
Federal procurements
Total minority and disadvantaged
procurementsb Amount Percent
1982 $146,890,231
1983 152,335,866
1984 166,822,128
1985 182,603,556
1986 182,558,799
1987 178,514,854
8(a) procurements Amount Percent
(dollars in thousands)
$1,663,087 1.13
1,760,955 1.16
2,592,981 1.55
2,535,270 1.39
3,004,006 1.65
3,115,433 1.75
$2,729,452 1.86
3,085,967 2.03
4,141,573 2.48
31718,333 2.04
4,417,144 2.42
4,786,978 2.68
aDOeS not include smaller contract actions, which beginning in 1986 was $25,000 or less for all agencies.
bIncludes 8(a) procurements.
Source: Federal Procurement Data System, Standard Report
14

r:{fll BIT (I f’XH1 BIT C 1
OWNERSHIP OF 8 (a) FIRMS BY MINORITY'GROUP
1982 1987
Minority group Number Percent Number Percent
Black 1,426 61.6 1,498 51.0 Spanish American 480 20.7 671 22.8 Asian 179 7.7 396 13.5 American Indian 127 5.5 214 7.3 Puerto Rican 44 1.9 103 3.5 other 60 2.6 56 1.9
Total 2,316 100.0 2,938 100.0
Source: SBA Financial Information System
15

COMPARISON OF ACTIVE 8(a) FIRMS BY TYPE OF BUSINESS
1982
Number Percent Number Percent
Professional service 612 26.4 1,004 34.2 Construction 833 36.0 965 32.8 Nonprofessional service 548 23.7 501 17.1 Manufacturing 273 11.8 449 15.3 Concessions 50 2.2 19 0.6
Total 2,316 100.0
1987
2,938 100.0
Source: SBA Financial Information System
16

FXHIBIT E
A-
Es --
. . i%z mm . * YY m\D YV

rxffr f?!T F CXHIEI'P I?
ACTIVE 8(a) FIRMS AND VOLlJME OF CONTRACT ACTIVITY
BY SBA DISTRICT AND REGIONAL OFFICE
Region/District 09/30/87
Region I Boston Regional Office (RO) Hartford District Office (DO)
Total Region I 108 106.8
Number of active firms,
Region II New York DO Syracuse DO Puerto Rico and Virgin Island Buffalo DO Newark DO
Total Region II 278 181.7
Region III Philadelphia DO Richmond DO Washington DO Pittsburgh DO Baltimore DO Clarksburg DO
Total Region III 681 910.8
Region IV Atlanta RO Atlanta DO Miami DO Louisville DO Birmingham DO Charlotte DC Columbia DO Jackson DO Nashville DO Jacksonville DO
Total Region IV 376 337.6
Do
Contract activity
FY 1987
76 $ 86.6 32 20.2
89 32.1 36 23.5 56 13.0
9 .6 88 112.5
77 69.8 93 145.7
400 552..2 27 7.2 71 88.4 13 47.5
2 18.0 92 53.3 37 20.0 22 3.1 49 112.7 46 28.7 35 18.0 30 17.2 37 34.5 26 32.1
18

Region/District
Number of Contract active firms, activity
09/30/87 FY 1987
Region V Chicago DO Minneapolis DO Detroit DO Milwaukee DO Cleveland DO Indianapolis DO Columbus DO
80 129.6 30 .8 39 6.1 15 5.2 43 47.4 22 13.5 57 84 .l
Total Region V 286 286.7
Region VI Dallas DO Corpus Christi Branch Office BO Lower Rio Grande Valley DO Little Rock DO Houston DO El Paso DO Lubbock DO New Orleans DO Oklahoma City DO San Antonio DO Albuquerque DO
25 16 20 40 30 25
7 48 36 71 63
Total Region VI 381 312.4
Region VII Kansas City DO Cedar Rapids DO Des Moines DO Omaha DO Wichita DO St. Louis DO
46 2 6
11 23 39
Total Region VII 127 80.6
20.8 8.2
.4 20.7
8.8 24.1
,
44:; 36.7 86.3 61.8
51.8 2
2:7 4.5 9.5
11.9
19

Region/District
Region VIII Denver RO Denver DO Fargo DO Sioux Falls DO Salt Lake City DO Helena DO Casper DO
Total Region VIII 146 187.4
Region IX San Francisco DO Los Angeles DO Santa Ana BO Fresno DO Las Vegas DO Honolulu DO San Diego DO Phoenix DO
Total Region IX 394 515.8
Region X Seattle DO Anchorage DO Portland DO Boise DO Spokane DO
Total Region X 161 94.4
Grand total 2,938 $3,014.2
Number of Contract active firms, activity
09/30/87 FY 1987
1 .5 71 129.9
7 18.5 16 9.8 36 24.8 14 3.7
1 .2
121 100.8 113 211.8
18 45.9 20 10.5 15 9.2 24 10.1 44 70.9 39 56.6
78 31.6 13 15.9 47 25.2
5 3.2 18 18.5
Source: SBA Financial Information System
20
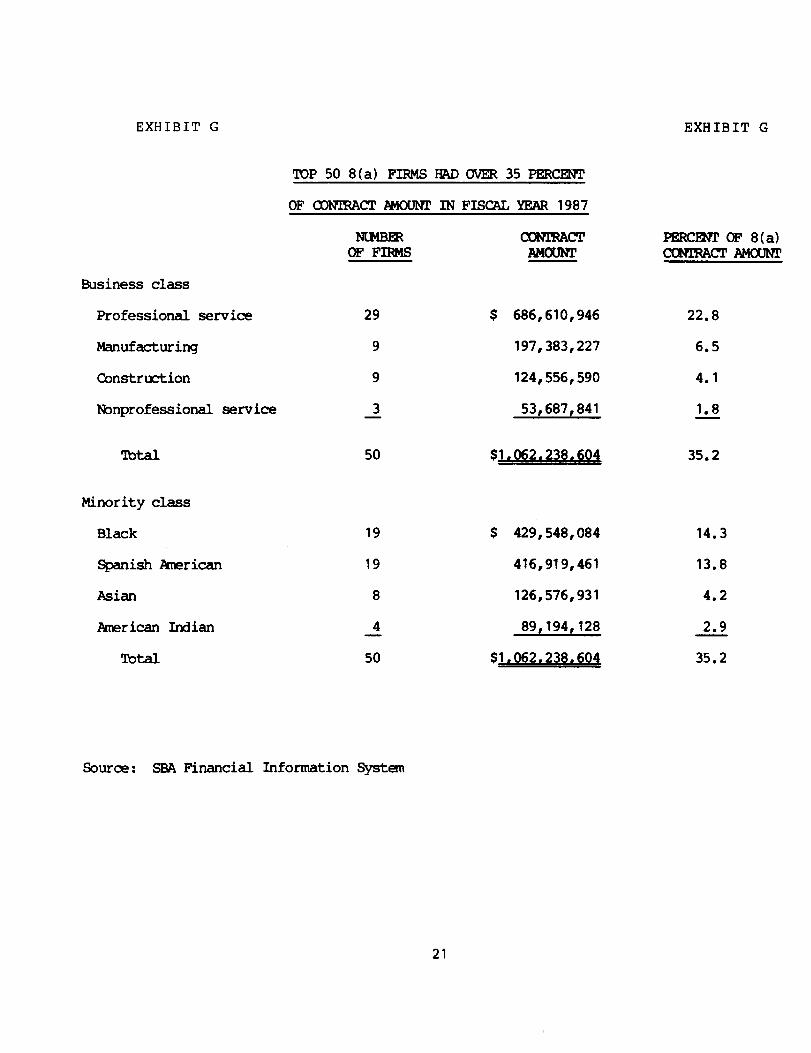
EXHIBIT G
'IDP 50 8(a) FIRMS HAD OVER 35 PERCENT
EXHIBIT G
Business class
Professional service
Manufacturing
Constrm-tion
Nonprofessional service
mtal
Minority class
Black
Spanish berican
Asian
American Indian
!tbtal
OF -CT l?MOUNT IN FISCAL YEAR 1987
29 $ 686,610,946 22.8
9 197,383,227 6.5
9 124,556,590 4.1
3 53,687,841 1.8
50 $1,062.238,60+
19 $ 429,548,084
19 416,919,461
8 126,576,931
4 89,194,128 -
50 $1.062.238.604
PEXEXC OF 8(a) CCNIRACTAM-
35.2
14.3
13.8
4.2
35.2
source: SE?I Financial Information system
21

:;XHlBl'l' H EXHIBlT H
TOP 50 FIRMS IN 8(a)
CONTRACT ACTIVITY IN FISCAL YEAR 1987
Amount of contract awards
$ ;;,g;,g1; 42'132'927 41:220;366 g,g,;g 36'590'057 31:261:920 27,182,251 27,177,446 26,376,895 25,649,784 24,419,549 23,253,829 23,229,314 22,285,308 21,043,631 20,519,137 19,921,117 18,856,467 18,772,149 18,196,358 16,564,811 16,448,971 16,324,936 15,592,348 15,539,478 15,504,492 ;;,;'j;,g 15'163'683 14'908'338 14'593'161 13'584'421 13'521'220 12:646:229 g,;;;,g 12'080'333 12'034'338 11'913'261 11'782'271 11'581'726 11'098'871 11'037'649 11'007'919 10'614'851 10'612'048 10'589'995 10;512;895
$1,062,238,604 PIOflillPIIPI
Business class manuracturing
B- Construction
E - Non rofessioual
P service
- Pro essional service
Minority class n1 K
- Am&an Indian i- Spanish American
- Asian
Source: SBA Financial Information System 22
&;mdzii= Denver Newark Clarlcsbur Philadelp ia ft Chicago Washington Los Angeles Los Angeles Phoenix Washington
khington 3
eles Nashvi le
k !slio Denver San Antonio Los Angeles Jacksonville Los Angeles
Exg!?:~ Columbus Chicago Baltimore Cleveland h;;;;gton
Washington $bi-;$on Los Angeles
Ekrd Portland San Diego New Orleans Hartford Los Angeles Los Angeles Washington Oklahoma City Cleveland Baltimore Little Rock ~e~;Qe;erwe Dallas

8(a) SALES EXPERIENCE OF FIRMS THAT HAVE BEEN IN PROGRAM
ATLEAST 7 YEARS
Firm
A
: 0 E
; H I J K L M
i P 0 R S T U V W X
r AA
FPPTa
date
Latest sales breakcut
Non+(a) 8( a) Total
----------------(dollas)-------------
4/21/M 4/21/88 4/21/09 4/19/89 10/21/87 3/22/88 4/15/89 10/S/87 3/24/89 10/21/88 3/24/07 3/24/87 4/8/88 10/14/88 10/24/88 4/2/89 4/21/M 4/14/M 10/21/87 4/2/80 4/21/M 10/21/86 4/21/09 4/16/87 4/7/88 4/21/M 4/16/89
L1,267,062 21,858,122 14,485,13U
8,319,663 605,922
58,709 749,298
1,316,120 170,023
1,233,658 81,042
2.382.33: -219;292 456.329
1,403,183 17,136
385,600 142,793 474,408 625.530 309;026 347.623
80;408 55,423 38,959
7,559
Average - 27 2,114,465
M 4/14/89 11.928.628 AC g/30/86 756;62'3 AD 4/15/89 479.146 AE 4/15/88 233;5U7 AF 4/14/80 280,528 AG 4/15/M 193,883 AH g/24/86 161,1U2 Al 9/30/06 84,341
Average - 8 1,764,720
OVERALL AVERAGE $2,034,523
Fixed program psticipation term
(percent)
550,854,047 152,121,109 25,438,108 47,2%,230 24.447.111) 38,932,24u
9,171,%2 17,491,a25 11,512,514 12,118,436
9,392,456 9,451,165 8.543.229 9,292,527 7,616,312 8,932,432 7.647.749 7,017,772 6,477,608 7,711,346 6.715.576 6,7%,618 5,797,205 5,707,205 3,175,108 5,557,527 5,105,022 5,324.314 4,556,751 5.013,080 2,579,379 3,982,562 3,555,475 3,572,611 2,623,05U 3,uO8,650 2,600.187 2,742,980 1,588,723 2,063,131
390,506 1,016,(136 543,156 852,182 256,023 603,646 339,906 420,314 188,087 243,510 196,975 235,934
15,465 23,024
97.6 53.8 62.8 52.4 95.0
RZ 85.3 97.8 84.0 98.8
100.0 57.1 95.9
ZZ 99.5 07.2 94.8 77.0 30.4 63.7 42.4 80.9 77.2 83.5 67.2
13
1: 11 10
8 13 10 16 14 12
7
7,453,254 9.567.719 79.2 10.6
l&)8,449 130,507
65,19: 17,016 25,527 32,433 22,185
13,537,077 887,135 479,146 298,703 297,544 219,410 193,535 106,526
11.9 14.7
2::: 5.7
11.6 16.8 2U.8
237,664 2,002,385
f5,803,976 f7,838,499
12.9
64.1
8 13 9
13 11 15 14 12
11.9
lU.9
Latest Number of
8(a) sales yeas in
dependency
23

EXIIBIT J EXHIBIT J
5aies en? ,i f years* -----------------------------------------
j:a.: Tot&i ScGenaencr ----------- ----------- _----_----- ---------iooiiarj!-------- iclerrtnt!
se ‘r:.c
53.a
77.9
86.9
s2. 4
61.1 65.7 99.4 96.6 45.9
77.9
‘?S i _*
.‘-.w;. - -. -
_----_--
;.
-
__ ! ., .
z
24

EXtiI3IT K EXHIBIT K
Awads
Total Awads
f 500,OUU and over
S1,WU,WU and over
f2,UUU,WU and over
S5,UW,WU mdover
SCHEDULE OF THRESHOLD LEVELS FOR CONTRACTS
AND RELATED FIODIFICATIONS AKARDED
By Number of Awards
1985
Number Percent --
5,225 lUU.U
972 18.6
555 lU.6
302 5.8
06 1.6
1986 1987
Number Percent Number Percent - - --
4,498 loo.0 4,227 1UU.O
893 19.9 696 16.5
526 11.7 369 8.7
280 6.2 107 4.4
93 2.1 32 .8
By Value of Awads
1985 1986 1987
Awsds Value Percent -- Value Percent
(dollars In thousands)
Total Awads S2,823,991 lUU.U
$ SUO,UUU and over 2,317,555 82.1
Sl,W,WU andover 2,020,522 71.6
S2,UUo,lXW and over 1,665,459 59.0
SS,WU,WU and over 1,032,137 36.6
52,623.992 lUU.U
2,200,666 83.9
1,935,570 73.8
1,581,772 60.3
995,333 37.9
Value Percent
51.773.772 loo.0
1,367,141 77.1
1.135.233 64.U
868,926 49.0
382,688 21.6
Source: SBA Finmcial Information System
(077064)
25