Civil Service Statistics 2000 stats 2000.pdf · CIVIL SERVICE STATISTICS 2000 3. THE CIVIL SERVICE...
73
CIVIL SERVICE STATISTICS 2000 a front-back cover 22/8/01, 10:35 am 3
Transcript of Civil Service Statistics 2000 stats 2000.pdf · CIVIL SERVICE STATISTICS 2000 3. THE CIVIL SERVICE...

CIVIL SERVICE STATISTICS 2000
a front-back cover 22/8/01, 10:35 am3

CIVIL SERVICE STATISTICS 2000
NATIONAL STATISTICSNational Statistics are produced to high professional standards set out in the
National Statistics Code of Practice. They undergo regular quality assurance
reviews to ensure that they meet customer needs. They are produced free
from any political interference.
Further statistics about Civil Service staff are available from the Cabinet
Office website: www.civil-service.gov.uk/statisticsand the National Statistics website: www.statistics.gov.uk
Enquiries about statistics in CIVIL SERVICE STATISTICS 2000 should be
made to:
Employment Conditions and Statistics Division, Personnel Statistics, Cabinet
Office, Admiralty Arch, The Mall, London SW1A 2WH
Telephone: 020 7276 1532 (General enquiries)
020 7276 1530 (Diversity)
020 7276 1542 (Senior Civil Service)
Fax: 020 7276 1679 (Faxback facility)
E-mail: [email protected]
Published August 2001

© Crown Copyright 2001
Applications for reproduction should be made to:
HMSO Copyright Unit, St Clements House, 2–16 Colegate, Norwich NR3 1BQ
ISBN 0 7115 0415 6
b prelims i-iv 22/8/01, 10:38 am2

CONTENTS
LIST OF TABLES AND CHARTS
1. INTRODUCTION 1
2. THE NUMBER OF CIVIL SERVANTS 2
3. THE CIVIL SERVICE 5
• THE WORK OF CIVIL SERVANTS
• DEPARTMENTS AND EXECUTIVE AGENCIES
4. A HISTORY OF STAFF NUMBERS 6
5. LOCATION 8
6. PAY AND GRADING 9
• DELEGATION OF PAY AND GRADING
• STAFF NUMBERS BY RESPONSIBILITY LEVEL
• PART-TIME STAFF
• SALARY LEVELS
7. ENTRANTS AND LEAVERS 11
• ENTRANTS
• LEAVERS
8. DIVERSITY 13
BIBLIOGRAPHY 16
STATISTICAL TABLES 19
ANNEX A. DIARY OF EVENTS – MACHINERY OF GOVERNMENT
CHANGES 1994 TO 2000 57
ANNEX B. DEFINITIONS AND SOURCES 65
b prelims i-iv 22/8/01, 10:38 am3

LIST OF TABLES AND CHARTS
STATISTICAL TABLESA: Staff Numbers in Each Department and Executive Agency at 1 April 2000B: Permanent Staff in Post for Each Department and Executive Agency by Gender at 1 April 2000C: Staff Numbers in Each Department and Executive Agency, 1994 to 2000D: Regional Distribution of Staff at 1 April 2000E: Staff Numbers by Responsibility Level and Gender, 1997 to 2000F: Staff Numbers by Gross Salary Band and Gender, 1999 and 2000G: Staff Numbers in Major Departments by Salary Band, 1999 and 2000H: Staff Numbers by Salary Band and Responsibility Level, 1999 and 2000I: Entrants and Leavers – Non-Industrial Staff, 1993-94 to 1999-2000J: Entrants by Responsibility Level, Age and Gender, 1995-96 to 1999-2000K: Resignations by Responsibility Level, Length of Service and Age, 1999-2000L: Resignations by Responsibility Level, 1994-95 to 1999-2000M: Estimated Historical Series, 1974 to 2000N: Ethnic Origin of Staff by Responsibility Level, 1999 and 2000O: Disabled Staff by Responsibility Level, 1999 and 2000P: Staff in Post by Age, 1999 and 2000
CHARTS1: Percentage of Staff Working Part-Time in the Civil Service, 1990 to 20002: Employment in the Public and Private Sector, UK Spring 20003: Civil Service Staffing by Department, 20004: Civil Service Staff in Executive Agencies, or Working on Next Steps Lines, 1990 to 20005: Staff Working in Executive Agencies, or on Next Steps Lines by Department, 20006: Civil Service Staff Numbers, 1990 to 20007: Civil Service Staff by Function, 20008: Changing Geography of Civil Servants, 1990 and 20009: Civil Servants by Government Office Region, 1990 and 200010: Non-Industrial Staff by Gross Salary Band, 200011: Entrants to Non-Industrial Grades by Gender, 1995-96 to 1999-200012: Causes of Leaving the Civil Service, 1999-200013: Resignation Rates by Age, 1999-200014: Resignation Rates by Length of Service, 1999-200015: Female Staff as a Percentage of All Non-Industrial Staff by Responsibility Level, 1990, 1999 and 200016: Proportion of Leavers by Cause and Ethnic Origin, 1999-200017: Staff in Post by Age, 1990 and 2000
b prelims i-iv 22/8/01, 10:38 am4

1
CIVIL SERVICE STATISTICS 2000
1. INTRODUCTION1.1 This 31st annual edition of CIVIL SERVICE STATISTICS presents facts and
figures on staffing in the Civil Service as at April 2000. It includes:
• a general commentary on trends and patterns in Civil Service employees –
page 2;
• a selected bibliography – page 16;
• a series of tables showing the numbers of civil servants, where they work and
how they are organised – page 19; and
• notes on definitions and sources – page 65.
1.2 Where not otherwise indicated, figures refer to staff numbers on a full-time
equivalent basis. However, many analyses count individuals on a headcount basis,
particularly in the expanded section on diversity. More detailed information on
aspects of Civil Service employment, including further staffing statistics, is available
on the Cabinet Office website:
www.civil-service.gov.uk/statistics
c main report 1-19 22/8/01, 10:40 am1

2
CIVIL SERVICE STATISTICS 2000
2. THE NUMBER OF CIVIL SERVANTS
STAFF IN POST (full-time equivalent)
NON-INDUSTRIAL INDUSTRIALPERMANENT PERMANENT CASUAL
STAFF STAFF TOTAL STAFF
1 April 19991 428,850 30,750 459,600 16,770
1 April 2000 445,980 29,440 475,420 11,300
Changes between
April 1999 and April 2000 17,130 –1,310 15,820 –5,470
2.1 On 1 April 2000 there were some 475,400 permanent civil servants (full-time
equivalent), of whom 446,000 were non-industrial staff and 29,400 industrial staff.
There were also 11,300 casual staff. Over the year to 1 April 2000 the number of
permanent staff increased by around 15,800 (or 3.4 per cent), a change from the
previous trend towards an overall reduction. However, the number of casual staff fell
by 5,500 (or 33 per cent).
2.2 The number of permanent civil servants counted on a headcount basis
increased by 9.7 per cent, from 480,700 to 497,600. The number of people working
full-time rose by 2.7 per cent (11,500) from 421,060 to 432,500, while the number of
part-time staff rose by 9.2 per cent (5,500) to 65,100. This continued the long-term
increase in part-time employment (see Figure 1). In the 10 years to April 2000 the
proportion of part-time staff has doubled to over 13 per cent of the total.
2.3 Increases in permanent staff over the year were accounted for in the main
by delivery of increased volumes of work and the provision of new services.
These included:
• The Employment Service: up 1,570 to implement enhancements to New Deal
programmes – the increase was partly offset by reductions in numbers
delivering Job Seekers’ Allowance as levels of unemployment fell;
• The Home Office: up 1,760 because staff were recruited to speed up
consideration of immigration and asylum cases;
• The Prison Service: up 1,840 due largely to growth in the prison population and
a new accommodation programme. There was a reduction (of around 200) in
the Scottish Prison Service;
• The Benefits Agency: growth of 980 in permanent staff was offset by continuing
and substantial reductions in casual staff numbers.
1 Revised figures for 1999.
FemaleMale
Percentage of staff who work part-time
Permanent non-industrial staff
FIGURE 1PERCENTAGE OF STAFF WORKING PART-TIME IN THECIVIL SERVICE, 1990 TO 2000
SOURCE: MANDATE AND DEPARTMENTAL RETURNS
1990 1992 1996 1998 2000
30
1994
5
15
20
25
10
c main report 1-19 22/8/01, 10:40 am2

3
CIVIL SERVICE STATISTICS 2000
• Growth in permanent staff in the Child Support Agency (by 810) due to
increased workloads to implement reforms in child support;
• The establishment of the Rent Service (a new Executive Agency of the
Department of the Environment, Transport and the Regions) in October 1999.
Initially set up with fewer than 100 staff but with an additional 800 staff
transferred in from local government in April 2000.
• The merger of the Office of Gas Supply and the Office of Electricity Regulation,
to form OFGEM;
• The closure of Government Property Lawyers;
• HM Customs and Excise staff numbers fell by some 610, which includes staff
transferred to the ICL under the Private Finance Initiative.
2.4 A number of other changes were made in the structure of government in the
year, notably those relating to devolution in Scotland and Wales on 1 July 1999.
Details are given in Section 5.
2.5 Other new departments and agencies established on 1 April 2000 included the
Food Standards Agency, the Office of Government Commerce and the NHS Purchasing
and Supply Agency.
COUNTING CIVIL SERVANTSReferences to the Civil Service relate to the Home Civil Service and Diplomatic
Service, but not to the Northern Ireland Civil Service (unless explicitly stated). The
Civil Service comprises all government departments and executive agencies in Great
Britain listed in Tables A, B and C.
Two methods of presenting and analysing numbers of civil servants are used –
headcount and full-time equivalent (FTE). Headcount, in which each civil servant is
counted as one whole person regardless of whether he or she works full-time or
part-time, is appropriate for summarising patterns of recruitment and departure and
for monitoring diversity. However, it is not an appropriate measure when one wishes
to relate numbers of staff to the Civil Service pay bill or to calculate the overall
staffing level required to carry out Civil Service functions. For these purposes,
part-time staff must be treated as such, and a full-time equivalent total is used.
The difference between these two measures has become more significant as the
proportion of part-time staff in the Civil Service has grown. In the 10 years to April
2000 it has doubled to over 13 per cent of the total. Most of the information on
staffing levels in the tables uses full-time equivalent figures, as this best indicates
staff resources.
c main report 1-19 22/8/01, 10:40 am3

4
CIVIL SERVICE STATISTICS 2000
From 1 April 1995, all part-time staff are included in the FTE total according to the
proportion of full-time hours they worked. This was a change from the previous
practice, which included only those staff working 10 or more hours per week, who
were counted as the equivalent of half a full-time member of staff. The current
method provides a more accurate estimate of overall resource. Full-time equivalent
figures for dates prior to 1995 have been re-estimated on the basis of the current
practice to enable comparisons over time to be maintained.
The information presented here is derived from data provided by departments and
executive agencies to the Cabinet Office.
Information is presented for 1 April in each year unless otherwise specified.
Further information on definitions, data sources and methodology is given in
Annex B.
c main report 1-19 22/8/01, 10:40 am4

5
CIVIL SERVICE STATISTICS 2000
3. THE CIVIL SERVICE3.1 Civil servants make up approximately 2 per cent of the workforce (29 million,
on a headcount basis, at Spring 2000). Around 18 per cent of those in employment
worked in the public sector. Over half of these were in local government, around 30
per cent in public corporations and 10 per cent in the Civil Service. The remainder
were employed in the Armed Forces, NHS and other central government
organisations. (See Figure 2).
3.2 The workforce as a whole grew by just over 90,000 between 1990 and 2000.
Employment in the private sector grew from around 22.9 million to 23.9 million, while
public sector employment fell from 6.1 million to 5.1 million. On a full-time equivalent
basis, the Civil Service accounted for around 12 per cent of public sector employment
in 2000.
THE WORK OF CIVIL SERVANTS3.3 Many civil servants are engaged in providing services to the general public,
such as helping them find work through Jobcentres, paying pensions and benefits,
issuing driving licences, etc. Others provide advice and information to Ministers in
support of the development and implementation of policy, including advice on legal,
statistical and economic issues. The majority of executive functions carried out by civil
servants are undertaken in executive agencies. A wide range of other functions, which
were formerly undertaken in-house, are provided through the private sector.
3.4 The distinction between industrial and non-industrial staff is similar to that
which exists in the private sector between white and blue-collar workers. The Ministry
of Defence is the largest employer of staff in industrial grades within the Civil Service,
employing around 85 per cent of the total. Since pay and grading was devolved to
individual departments in 1996, some departments have introduced their own
departmental grades, which have removed the distinction between industrial and
non-industrial posts. In these cases, staff are counted in the non-industrial group.
(See section 6).
DEPARTMENTS AND EXECUTIVE AGENCIES3.5 Tables A and B give the breakdown of staff in each government department on
a full-time equivalent and headcount basis. Departments vary greatly in size; for
example, the three smallest departments have fewer than 30 staff (full-time
equivalent) each, and the four largest departments together (including their agencies)
account for almost 64 per cent of all civil servants.
3.6 On 1 April 2000 there were 105 executive agencies in the Home Civil Service.
HM Customs and Excise, Crown Prosecution Service, Inland Revenue and Serious
Fraud Office also operate on Next Steps lines. 78 per cent of civil servants work in
these organisations.
EMPLOYMENT IN THE PUBLIC AND PRIVATE SECTOR,UK SPRING 2000
Employee jobs – headcount basis
FIGURE 2
SOURCE: MANDATE, DEPARTMENTAL RETURNS AND ECONOMIC TRENDS
Private Sector 83%
Civil Service 2%Public Corporation 5%
Local Government 9%
Rest of CentralGovernment 1%
CIVIL SERVICE STAFFING BY DEPARTMENT*, 2000
TOTAL NUMBER: 475,420
FIGURE 3
SOURCE: MANDATE AND DEPARTMENTAL RETURNS
Defence21%
Inland Revenue14%
Others 36%
Social Security18%
Home Office(inc. Prison Service)
11%
* Agencies are included with parent
CIVIL SERVICE STAFF IN EXECUTIVE AGENCIES, ORWORKING ON NEXT STEPS LINES, 1990 TO 2000
Percentage of civil servants (full-time equivalents)
FIGURE 4
SOURCE: MANDATE AND DEPARTMENTAL RETURNS
1990 1992 1996 1998 20001994
10
20
30
40
50
60
70
80
90
c main report 1-19 22/8/01, 10:40 am5

6
CIVIL SERVICE STATISTICS 2000
4. A HISTORY OF STAFF NUMBERS4.1 The highest number of civil servants recorded was in 1976, when (on a full-time
equivalent basis) there were 751,000 staff. Since then the number of permanent civil
servants has fallen by around 37 per cent, and it was 475,400 in April 2000. The
lowest level of 459,600 was reached in April 1999, and in the year to April 2000 the
numbers rose by 16,000, or 3.4 per cent.
4.2 On a headcount basis, numbers have fallen by 35 per cent in the period since
1976; the difference is accounted for by strong growth in numbers of part-time staff.
At the peak in 1976, 763,000 civil servants were employed, of whom 31,000 (4 per
cent) worked part-time (see table M). By April 1990, numbers had fallen to 582,000, of
whom 40,000 (or 6.9 per cent) worked part-time. In April 2000, the total number had
fallen further to 498,000, but part-time staff numbered around 65,000, or 13.1 per
cent of the total. The proportion of staff in all grade levels working part-time has
increased in recent years. By April 2000 there were over 64,000 non-industrial
part-time staff, 13.7 per cent of all non-industrial civil servants.
4.3 A number of other factors have influenced overall trends in Civil Service staff
numbers over the past 10 years. These include:
• Privatisation or contracting out, particularly in technical or production areas
(see Annex A: defence-related agencies, National Savings and ADAS are
recent examples);
• Changing work volumes in those sections of the service providing public
delivery; for example, staff numbers in the Benefits Agency and Employment
Service are closely related to the level of unemployment. Staff levels in the
Prison and Immigration Services have been affected over the years by rises in
the prison population and international travel, and of claims of asylum.
• Policy changes such as the establishment of the New Deal initiative and
the drive for more joined-up government through the strengthening of the
Cabinet Office.
4.4 Other policy changes have created new functions and otherwise affected the
boundaries between the Civil Service and other public sector functions. Devolution in
Scotland and Wales effected significant changes (see Section 5). Other recent
changes include the privatisation of National Savings (April 1999) and the launch of
the Rent Service in October 1999, with the subsequent transfer of staff (from within
the Civil Service/local government into this Agency).
STAFF WORKING IN EXECUTIVE AGENCIES, OR ON NEXTSTEPS LINES BY DEPARTMENT, 2000
FIGURE 5
SOURCE: MANDATE AND DEPARTMENTAL RETURNS
Home Office 12%
Social Security 23%
Others 17%
Customs &Excise 6%
Defence 17%
Education &Employment
8%
Inland Revenue 17%
FTEHeadcount
Permanent staff, thousands
FIGURE 6CIVIL SERVICE STAFF NUMBERS, 1990 TO 2000
SOURCE: MANDATE AND DEPARTMENTAL RETURNS
1990 1992 1996 1998 2000
600
1994
550
500
c main report 1-19 22/8/01, 10:40 am6

7
CIVIL SERVICE STATISTICS 2000
4.5 Figure 7 shows the overall pattern in departmental staffing by broad function
and how this has changed in the last 10 years. Social Security and Employment
combined now represent 27 per cent of Civil Service staff. In Defence the downward
trend has continued, and they now account for 20 per cent of civil servants. Revenue
collection has increased over the last 10 years, notably by the transfer of
Contributions Agency to the Inland Revenue in April 1999 (see Annex A).
CIVIL SERVICE STAFF BY FUNCTION, 2000FIGURE 7
SOURCE: MANDATE AND DEPARTMENTAL RETURNS
Social Security 19%
Law and Order 17%
Health 1%
Defence 20%
Employment 8%
Revenue 19%
Others 16%
c main report 1-19 22/8/01, 10:40 am7

8
CIVIL SERVICE STATISTICS 2000
5. LOCATION5.1 Figures 8 and 9 show the distribution of staff by Government Office Regions.
Details for the key departments (including the Government Office for the Regions)
are shown in Table D.
5.2 Fewer than one fifth of non-industrial civil servants work in London, and more
than two thirds outside London and the South East. The number of non-industrial
civil servants working in London and the South East has fallen by over 50,600 in the
10 years to April 2000.
5.3 Apart from the fall in numbers working in London, the regional distribution
of civil servants has not changed significantly over the 10-year period. The
greatest increase in share was in the Eastern Region, whose share rose from
2.7 to 6.0 per cent.
5.4 Over the last 10 years, the proportion of non-industrial civil servants in
Scotland has remained at around 9 per cent of the Civil Service, whilst total numbers
fell by 6,460 full-time equivalents, or 13.6 per cent. In Wales the share of Civil Service
staff remained at around 6 per cent.
5.5 Just under 3,800 non-industrial staff in the Home Civil Service work in Northern
Ireland. In addition there is a separate Northern Ireland Civil Service, numbering
some 28,570 permanent staff at 1 April 2000 (full-time equivalent), of whom 25,530
were non-industrial. Overall there was a fall of 10 per cent in the Northern Ireland
Civil Service over the previous 10 years.
5.6 The National Assembly for Wales and the small Office of the Secretary of State
for Wales took over functions from the Welsh Office on devolution on 1 July 1999. The
National Assembly also took on some functions previously carried out by Housing for
Wales, Health Promotion for Wales and Welsh Health Common Services Agency,
which were previously outside the Civil Service. Taken together with additional staff
recruited for the setting-up of the Assembly, these changes resulted in a gain of
around 260 staff in this period.
5.7 In Scotland, the new Scottish Executive absorbed the Scottish Courts
Administration and the Office of the Advocate General, and the Scotland Office was
also created from 1 July 1999. Overall these changes did not result in a significant
change in the number of civil servants in post in Scottish departments and agencies.
Staff recruited or seconded to the Scottish Parliament are excluded from these
figures as this is outside the Civil Service.
* Excludes the Northern Ireland Civil Service
CHANGING GEOGRAPHY OF CIVIL SERVANTS,1990 AND 2000
FIGURE 8
SOURCE: MANDATE AND MANUAL RETURNS
Percentages indicate share of staff in 2000
London19.4% London
18.7%
Increased sharesince 1990
No changesince 1990
Decreased sharesince 1990
WestMidlands
6.9%
South West10.5%
NorthWest8.8%
Wales6.2%
Scotland9.6%
NorthEast5.7%
Yorkshire &Humberside
7.2%
EastMidlands
4.2%
South East12.2%
Eastern6.1%
NorthernIreland1.1%*
Merseyside3.3%
CIVIL SERVANTS BY GOVERNMENT OFFICE REGION,1990 AND 2000
FIGURE 9
SOURCE: MANDATE AND DEPARTMENTAL RETURNS
Percentage of permanent non-industrial staff (FTE)
15.5
19.122.3
11.5
9.110.1
6.06.5
10.38.7
6.35.9
3.03.4
6.47.1
3.84.1
2.76.0
5.75.6
9.69.2
0.60.8
LONDON
South East
South West
West Midlands
North West
North East
Merseyside
Yorkshire &Humberside
East Midlands
Eastern
Wales
Scotland
NorthernIreland
1990 2000
c main report 1-19 22/8/01, 10:40 am8

9
CIVIL SERVICE STATISTICS 2000
6. PAY AND GRADINGDELEGATION OF PAY AND GRADING6.1 Since 1 April 1996 all departments and agencies have had delegated
responsibility for the pay and grading of their staff, except for those in the Senior Civil
Service (SCS). Departments and agencies have developed their own pay and grading
systems, and it has become increasingly difficult and less appropriate to present
statistics in terms of the previous service-wide grades.
6.2 Instead, the concept of broad ‘responsibility levels’ is used, in which
departmental grades have been assigned to levels broadly equivalent (in terms of pay
and job weight) to the former service-wide grades. As departmental practice on pay
and grading has diverged, it has become harder over the years to generalise,
resulting in the amalgamation of some of these broad levels.
6.3 For the purposes of this statistical summary, some staff not in the Senior Civil
Service but of broadly equivalent level are grouped with it. These include senior staff
in the Diplomatic Service and some in specialist grades. As Table H shows, pay at
senior levels often overlaps, reflecting factors such as experience and high
performance as well as job weight. Table E shows the numbers of staff in these
broad levels. This year there have been increases in numbers at all levels, with the
rate of increase being very slightly lower at senior levels than at more junior ones in
general terms.
PART-TIME STAFF6.4 By April 2000 68 per cent of part-time staff were employed at AO/AA level;
whilst part-time staff working at AA/AO level represented 17.5 per cent of staff
(compared with 15.5 per cent in 1997). The proportion remained significantly lower
than this in senior grades: 3.4 per cent of staff at SCS level were part-time (compared
with 2.7 per cent in 1997); and 5.8 per cent at grade 6/7 level (4.7 per cent in 1997).
SALARY LEVELS6.5 Figure 10 and Table F show numbers of staff at different salary levels.
At 1 April 2000 the average (median) gross salary (excluding overtime or one-off
bonuses) of non-industrial civil servants was £15,850. This compared with £15,550
in 1999 (an increase of 1.9 per cent over the year).
NON-INDUSTRIAL STAFF BY GROSS SALARY BAND, 2000FIGURE 10
SOURCE: MANDATE AND DEPARTMENTAL RETURNS
Percentage
0.4 0.2 0.1 0.1 0.10.30.8
0.0
6.1
36.8
23.2
6.9
3.4
1.91.4
£1–5,000
£75,001 and over
£55,001–60,000£50,001–55,000
£45,001–50,000£40,001–45,000
£35,001–40,000£30,001–35,000
£25,001–30,000£20,001–25,000
£15,001–20,000£10,001–15,000
£5,001–10,000
£60,001–65,000£65,001–70,000
£70,001–75,000
16.8
c main report 1-19 22/8/01, 10:40 am9

10
CIVIL SERVICE STATISTICS 2000
6.6 One quarter of staff earned £12,770 or less (on a full-time equivalent basis),
and one quarter earned £21,630 or more. The median gross salary of women was
£14,130, 71.8 per cent that of men, reflecting their respective positions in the grade
structure. The median salary of part-time staff – £13,840 on a full-time equivalent
basis – was also substantially lower than that of full-time staff (£16,990), again
reflecting the larger numbers of part-time staff in the lower grades.
6.7 The quality of information on pay has been affected by delegated pay and
grading, partly because of different arrangements for paying and reporting on certain
allowances and bonuses in different departments and agencies. Revisions to
departmental pay structures are implemented along with pay settlements and can
make short-term trends in salary levels difficult to interpret. Short-term comparisons
between departments (as in Table G) are also affected by reorganisations.
c main report 1-19 22/8/01, 10:40 am10

11
CIVIL SERVICE STATISTICS 2000
7. ENTRANTS AND LEAVERS7.1 More people entered the Civil Service in 1999–2000 than left it. The number
of leavers (28,050) was significantly down on earlier years; the number of people
entering the service was higher (43,430) than it had been for some years. Table I
presents estimates of the total numbers of people entering and leaving the non-
industrial Civil Service, together with their method of entry and leaving. Tables J, K
and L, which analyse patterns of entry and leaving in more detail, show only the
information reported to MANDATE.
ENTRANTS7.2 The number of entrants to non-industrial grades in 1999–2000 was around
43,430 (45 per cent) higher than in the previous year. The vast majority of entrants,
87 per cent or some 37,900, were recruited directly. In addition, some 800 former
civil servants were reinstated. The Benefits Agency, Prison Service, Employment
Service and Home Office all recruited significant numbers of permanent staff this
year. The creation of the Rent Service, the Food Standards Agency and the NHS
Purchasing and Supply Agency also added to the entry figures.
7.3 Women accounted for around 60 per cent of all entrants in 1999–2000
(Figure 11). At the junior (AO/AA) levels, female recruits have for many years out-
numbered male recruits. Of some 34,100 staff recruited at Administrative Officer or
Administrative Assistant level, 63 per cent were women (Table J). At all other grades,
women recruits were in a minority.
7.4 Table J also shows the age distribution of entrants to all grades by
responsibility level. The broad pattern was very similar to that of recent years;
37 per cent of entrants were under 25 and 53 per cent were under 30.
LEAVERS7.5 The number of people leaving the non-industrial Civil Service rose from 38,800
in 1993–94 to 47,900 in 1996–97; it has since fallen back sharply to 28,100 in 1999–
2000. The vast majority of departures were due to a regular turnover of retirements,
resignations, dismissals, etc (collectively known as ‘wastage’). In the year to April
2000 these numbered some 24,700, much in line with other figures for recent years.
(Table I).
ENTRANTS TO NON-INDUSTRIAL GRADES BY GENDER,1995–96 TO 1999–2000
FIGURE 11
SOURCE: MANDATE
Thousands MenWomen
1998–991997–981996–971995–96
10.6
1999–2000
Permanent staff
9.2
14.715.7
14.0
17.4
12.613.4
12.7 12.5
CAUSES OF LEAVING THE CIVIL SERVICE, 1999–2000Non-industrial staff
FIGURE 12
SOURCE: MANDATE AND DEPARTMENTAL RETURNS
Dismissals and discharges 2.6%
Ill health 3.0%
Death 1.2%
Unknown cause 2.2%
Early retirement 5.6%
Early severance 1.7%
Privatisation 0.5%
Outward loans and transfers 2.0%
Retirement at minimumage 8.7%
Retirement aboveminimum age 6.8%
Resignation 52.2%
End of fixed termappointment 13.5%
c main report 1-19 22/8/01, 10:40 am11

12
CIVIL SERVICE STATISTICS 2000
7.6 The number of staff taking early retirement or early severance has fallen from
a peak of 13,500 in 1995–96 to much lower levels in the last three years; some 2,000
in the year to April 2000. This category also includes redundancies, but not early
departures due to ill health, which are included under wastage.
7.7 Only 130 staff left the service as a result of reorganisations of work during the
year, a sharp fall from recent years when the figures had regularly been in the
thousands. This reflects changes in policy on privatisation, and changes in the nature
of public-private partnerships. Most of the significant moves of this type are listed in
the Diary of Events (Annex A). Other people transferring out of the Civil Service
included those on secondment to other public sector organisations.
7.8 Resignations accounted for 52 per cent of all non-industrial staff leaving the
service in 1999–2000. Retirements accounted for 15 per cent; 9 per cent at the
minimum age (60 for most civil servants) and 7 per cent above that.
7.9 The estimated resignation rate for all staff in 1999–2000 was 3.2 per cent.
Table L shows that the resignation rate across the non-industrial Civil Service rose
to a peak of 3.4 per cent in 1997–98 and has fallen to 3.2 per cent for the last two
years. There is generally a link between the movements in resignation rates and
economic indicators such as the GDP, unemployment and Jobcentre vacancies.
7.10 Resignation rates are associated with many factors, e.g. age, length of service,
responsibility level and location. Figure 13 shows the strong correlation between age
and resignation rates, with a rate of around 20 per cent among young people under
20. Table K shows the numbers of staff resigning in 1999–2000 by length of service
and age for each responsibility level and for industrials. 53 per cent of those who
resigned had been in the service for less than two years and 48 per cent were under
30. Resignation rates are highest in more junior responsibility levels (and in industrial
grades); the rate at AO/AA level being more than twice that at higher levels in
some cases.
RESIGNATION RATES BY AGE, 1999–2000FIGURE 13
SOURCE: MANDATE
Percentage
24.7
15.9
6.8
3.01.8
30–3925–2920–24<20 40+
Permanent staff
RESIGNATION RATES BY LENGTH OF SERVICE,1999–2000
FIGURE 14
SOURCE: MANDATE
Percentage
18.7
5.6 5.4
2.5
0.9
7.1
11.4
3–42–31–2<1 10+
Permanent staff
4–5 5–9
c main report 1-19 22/8/01, 10:40 am12

13
CIVIL SERVICE STATISTICS 2000
8. DIVERSITYGENDER8.1 Around half of all staff in post in the Civil Service are now women. The
proportion rose slightly to 49.8 per cent of permanent staff in post in April 2000, from
49.1 per cent a year earlier. Similar numbers of men and women left the service
during the year, but many more women were recruited than men during the year
(Table I and Figure 11). There was a particularly large increase (around 9 per cent)
in women working part-time.
8.2 Table E shows the gender composition by responsibility level and how part-time
staff fit into the picture. Women make up the majority of staff in the junior grades, but
the gender difference has been gradually declining in recent years. 62 per cent of
staff in administrative grades were women in 2000, compared with 65 per cent in
1990. Meanwhile, the proportion of women in the more senior grades has increased.
24 per cent of grades 6 and 7 staff are now women, as are 20 per cent of staff at
Senior Civil Service level. (This figure includes scientists and other specialists as well
as those in the Senior Civil Service itself.)
ETHNIC ORIGIN8.3 The proportion of staff who are from ethnic minority groups has risen, from
5.3 per cent in April 1999 to 5.8 per cent in April 2000. This compares with 5.5 per
cent of all people in employment and 6.0 per cent of the economically-active
population being in ethnic minority groups.
8.4 Table N shows the ethnicity of staff by responsibility level. Ethnic minorities
continue to be more highly represented in junior grades than senior ones.
Demography accounts for a part of this, as people in ethnic minority groups in the
population as a whole tend to be younger than white people. However, the last year
has seen some significant developments. In April 2000 7.5 per cent of staff in
administrative grades were from ethnic minorities (up from 7.1 per cent in 1999), and
the proportion of staff in the Executive Officer grade equivalents rose sharply, from
4.9 per cent to 5.7 per cent. At SEO/HEO level there was a rise from 2.8 per cent to
3.1 per cent. There was a slight decline at grade 6/7 level to 2.6 per cent, but an
increase at SCS level from 1.7 per cent to 2.2 per cent. These figures are all affected
by changes in data quality (see box) and in the grade structure (see section 6), and
therefore need to be interpreted with some caution.
8.5 The ethnicity of all civil servants will be surveyed by departments between April
2001 and April 2002, and it is planned that for periods from 2002, estimates will be
compiled using new categories, comparable to the 2001 Census of Population and
other government surveys. The main change will be the introduction of a new
category covering mixed ethnicity.
PROPORTION OF LEAVERS BY CAUSE AND ETHNICORIGIN, 1999–2000
FIGURE 16
SOURCE: MANDATE AND DEPARTMENTAL RETURNS
18.6
Other
Outward loansand transfers
Privatisation
Redundancy
Early retirement/severance
End of fixed termappointment
Resignation
Death
Ill health retirement
Normal retirement12.6
4.32.8
1.61.0
47.961.3
8.89.8
8.22.7
2.31.1
0.61.2
2.5
5.2
1.5
6.0
WhitePercentageEthnic minority
FEMALE STAFF AS A PERCENTAGE OF ALL NON-INDUSTRIAL STAFF BY RESPONSIBILITY LEVEL,1990, 1999 AND 2000
FIGURE 15
SOURCE: MANDATE AND DEPARTMENTAL RETURNS
9.6
17.219.6
10.7
22.924.3
19.5
28.130.6
40.9
49.650.4
65.862.5
62.4
SCSLEVEL
Permanent staff
1990
1999
2000
Percentage of staff whoare female
LEVEL 6/7 SEO/HEOLEVEL
EOLEVEL
AO/AALEVEL
c main report 1-19 22/8/01, 10:40 am13

14
CIVIL SERVICE STATISTICS 2000
DIVERSITY STATISTICS: NON-RESPONSE
These statistics on ethnic origin and disability should be interpreted with some caution,
particularly year on year changes. Information on ethnic origin and disability is collected
on voluntary, self-classification questionnaires and there is considerable non-response,
though efforts are being made to improve this. For example, in April 2000 the ethnic
origins of around 16 per cent of staff were not reported and the disability status of some
14 per cent of staff was not known. Non-response particularly affects those joining the
Civil Service or moving between departments.
Further details are available on the web at:
www.civil-service.gov.uk/statistics
DISABILITY8.6 The proportion of staff with a disability increased slightly over the year, from
3.6 per cent to 3.7 per cent of all staff. Table O indicates that the increase is broadly
spread across responsibility levels, though the changes are not necessarily all
significant (see box). Disabled staff continue to be more numerous in junior grades
(around four per cent in administrative and executive grades) than at senior levels;
2.4 per cent of grades 6/7 and 1.7 per cent of SCS level staff have a disability.
8.7 Around 12 per cent of the economically-active population and 11 per cent of
those in employment have a disability. Comparisons between the Civil Service and the
wider population are not straightforward, because the nature of the disability needs
to be taken into account. Differences in the methods of collecting information on
disability give rise to significant differences in the figures, as shown in the recent
survey on Civil Service attitudes (see Bibliography). Non-response is also a significant
factor (see box).
AGE8.8 The age structure of the Civil Service has changed significantly in the last
10 years. There has come to be a substantially greater concentration of staff in the
middle age bands (see Figure 17), though this has started to fall back a little recently.
In 2000 fewer than 7 per cent of staff were under 25, compared with 15 per cent
10 years before. Ten per cent of staff were 55 or over in 2000, compared with
9 per cent in 1999 and 12 per cent in 1990.
8.9 The changes in age structure result from a number of factors over the years.
The non-industrial Civil Service was recruiting in large numbers in the 1980s, primarily
among young people, and there was high staff turnover. The 1990s then saw large
numbers of early departures (see Table I), which reached a peak in 1995–96, when
31 per cent of leavers left on early retirement or severance terms. The cumulative
impact on the numbers of staff in or approaching their sixties was significant.
STAFF IN POST BY AGE, 1990 AND 2000FIGURE 17
SOURCE: MANDATE AND DEPARTMENTAL RETURNS
2.3
60–75
55–59
50–54
45–49
40–44
35–39
30–34
25–29
20–24
16–19 1.2
5.412.7
16.010.1
13.415.3
11.816.8
12.815.1
10.413.4
8.912.9
8.17.7
3.52.1
1990Percentage2000
c main report 1-19 22/8/01, 10:40 am14

15
CIVIL SERVICE STATISTICS 2000
OTHER8.10 A range of more detailed statistics about diversity in the Civil Service will be
published on the Cabinet Office website. Research into a number of wider aspects
of diversity in the Civil Service has recently been undertaken, including reports
on staff attitudes towards diversity issues and performance reporting
(see Bibliography).
c main report 1-19 22/8/01, 10:40 am15

16
CIVIL SERVICE STATISTICS 2000
BIBLIOGRAPHYSome publications relating to the Civil Service and its work. The latest issue at the
time of publication is given. Many recent publications and statistics are now available
on the internet.
Cabinet Office, www.cabinet-office.gov.uk/civilservice/index/statistics.htm
ONS, www.statistics.gov.uk
Northern Ireland Statistics and Research Agency, www.nisra.gov.uk
HM Treasury, www.hm-treasury.gov.uk
GENERAL
Modernising Government White Paper (Cm 4310), the Cabinet Office, 1999,
www.cabinet-office.gov.uk/moderngov/whtpaper/index.htm
Civil Service Reform – Report to the Prime Minister from Sir Richard Wilson,
Head of the Home Civil Service, the Cabinet Office, 1999,
www.cabinet-office.gov.uk/civilservice-reform/index.htm
Britain 2000: The official yearbook of the United Kingdom, Office for National
Statistics, the Stationery Office, 1999.
Civil Service Year Book 2000, the Cabinet Office, the Stationery Office, 2000.
The Civil Service: Taking Forward Continuity and Change (Cm 2748), the Cabinet
Office, the Stationery Office, 1995.
The Civil Service: Continuity and Change (Cm 2627), the Cabinet Office, the
Stationery Office, 1994.
THE LABOUR MARKET
Labour Force Survey Quarterly Bulletin, Office for National Statistics.
Labour Market Trends, Office for National Statistics (monthly).
Annual article on employment in the public and private sectors, Economic Trends,
Office for National Statistics, the Stationery Office, June 2001.
PUBLIC SECTOR
Public Bodies 2000, Cabinet Office, the Stationery Office, 2000.
Public Expenditure Survey: Departmental Reports Presenting the Government’s
Expenditure Plans 1999–2000 to 2001–2002 (Cm 4202–4221), the Stationery
Office, 1999.
c main report 1-19 22/8/01, 10:40 am16

17
CIVIL SERVICE STATISTICS 2000
Service First: The new Charter Programme, the Cabinet Office, 1998.
The Next Steps Report 1997 (Cm 4011), the Stationery Office, 1998.
The Next Steps Review: 1996 (Cm 3579), the Stationery Office, 1997.
Making the most of Next Steps: The Management of Ministers’ Departments and
their Executive Agencies, Report to the Prime Minister, the Stationery Office, 1991.
Competing for Quality: buying better public services (Cm 1730), HM Treasury, the
Stationery Office, 1991.
EQUAL OPPORTUNITIES
Biannual statistics on diversity of civil servants (gender, ethnicity and disability)
www.cabinet-office.gov.uk/civilservice/index/statistics.htm
Information on Civil Service Attitude Survey and Equality Proofing Report
www.cabinet-office.gov.uk/civilservice/diversity/oldsite/equalityproofing_systems.html
Equal Opportunities in the Civil Service: Data Summary 1999: Women, Race,
Disability and Age, the Cabinet Office, 2000.
Equal Opportunities Monitoring Guidance, the Cabinet Office, 1999.
Age Diversity in the Civil Service: Guidance for Departments and Agencies,
the Cabinet Office, 1999.
Equal Opportunities in the Civil Service 1995–97: A progress report, the Cabinet
Office, 1998.
Programme for Action to Achieve Equality of Opportunity in the Civil Service for
Women, People of Ethnic Minority Origin and Disabled People, the Cabinet Office,
1997.
Good Practice for Equal Opportunities Staff Complaints Procedures, the Cabinet
Office, 1996.
‘Monitoring Equal Opportunities in the Civil Service’, Statistical News, Number 113,
Autumn 1996.
Equal Opportunities in Promotion Procedures, the Cabinet Office, 1996.
Advisory Panel on Equal Opportunities in the Senior Civil Service, the Cabinet
Office, September 1995.
PERSONNEL WORK
Civil Service Management Code, Cabinet Office – revised periodically
www.cabinet-office.gov.uk/index/civilservice.htm
c main report 1-19 22/8/01, 10:40 am17

18
CIVIL SERVICE STATISTICS 2000
RECRUITMENT
Civil Service Commissioners’ Annual Report 1999–2000, Office of the Civil Service
Commissioners.
Civil Service Commissioners’ Recruitment Code, Fourth Edition, Office of the Civil
Service Commissioners, April 1999.
Civil Service Commissioners’ Guidance on Senior Recruitment, Third Edition, Office
of the Civil Service Commissioners, April 1999.
c main report 1-19 22/8/01, 10:40 am18

19
CIVIL SERVICE STATISTICS 2000
STATISTICAL TABLES
c main report 1-19 22/8/01, 10:40 am19

CIVIL SERVICE STATISTICS 2000
20
Total Total of whom:Total non- Total Total non- Non-industrial Industrial
Departments and their agencies(1) staff industrial industrial staff industrial Industrial full-time part-time full-time part-time
PERMANENT
FULL-TIME EQUIVALENT HEADCOUNT
TABLE A: STAFF NUMBERS IN EACH DEPARTMENT AND EXECUTIVE AGENCY AT 1 APRIL 2000
FULL-TIME EQUIVALENTS AND HEADCOUNT
TOTAL STAFF IN:
ALL DEPARTMENTS AND AGENCIES 475,420 445,980 29,440 497,640 467,770 29,870 403,710 64,060 28,820 1,050 11,300 10,650 65
Of whom:
EXECUTIVE AGENCIES~ 278,940 260,370 18,570 292,760 274,040 18,730 233,240 40,800 18,330 400 7,820 7,400 42
CUSTOMS AND EXCISE‡ 21,910 21,910 0 22,640 22,640 0 20,610 2,030 0 0 400 400
INLAND REVENUE‡ 62,460 62,460 0 66,870 66,870 0 54,040 12,830 0 0 580 580
CROWN PROSECUTION SERVICE‡ 5,450 5,450 0 5,760 5,760 0 4,870 890 0 0 230 230
SERIOUS FRAUD OFFICE‡ 170 170 0 170 170 0 170 0 0 0 20 20
TOTAL ON NEXT STEPS LINES 368,920 350,350 18,570 388,210 369,480 18,730 312,930 56,550 18,330 400 9,050 8,620 42
of which: TRADING FUNDS* 28,690 26,730 1,970 29,860 27,870 1,990 24,540 3,330 1,940 50 670 560 12
AGRICULTURE, FISHERIES AND FOOD
Ministry of Agriculture, Fisheries and Food (excl. agencies) 6,630 6,630 0 6,880 6,880 0 6,190 690 0 0 220 220
Centre for Environment, Fisheries and Aquaculture Science† 460 420 50 480 430 50 390 40 40 10 40 30 1
Central Science Laboratory† 570 570 0 580 580 0 550 30 0 0 40 40
Farming and Rural Conservation Agency^† 510 510 0 530 530 0 480 50 0 0 60 60
Pesticides Safety Directorate† 200 200 0 210 210 0 190 20 0 0 10 10
Veterinary Laboratories Agency† 1,090 1,090 0 1,140 1,140 0 1,000 140 0 0 30 30
Veterinary Medicines Directorate† 120 120 0 130 130 0 110 10 0 0 0 0
Ministry of Agriculture, Fisheries and Food TOTAL 9,590 9,540 50 9,950 9,900 50 8,910 990 40 10 400 390 1
Intervention Board† 1,230 1,230 0 1,270 1,270 0 1,150 120 0 0 120 120
ATTORNEY GENERAL
Crown Prosecution Service‡ 5,450 5,450 0 5,760 5,760 0 4,870 890 0 0 230 230
Legal Secretariat 30 30 0 30 30 0 30 0 0 0 0 0
Serious Fraud Office‡ 170 170 0 170 170 0 170 0 0 0 20 20
Treasury Solicitor’s Department† 420 420 0 430 430 0 410 30 0 0 20 20
CABINET OFFICE
Cabinet Office (excl. agency) 1,750 1,670 80 1,800 1,720 80 1,590 130 80 0 50 50
Government Car and Despatch Agency† 230 30 200 240 30 210 30 0 190 20 0 0
Cabinet Office TOTAL 1,980 1,710 280 2,040 1,750 290 1,620 130 270 20 50 50
Central Office of Information*† 360 360 0 370 370 0 350 20 0 0 0 0
Security and Intelligence Services 4,520 4,520 0 4,660 4,660 0 4,270 390 0 0 0 0
CHANCELLOR OF THE EXCHEQUER
Treasury 830 830 0 850 850 0 800 50 0 0 40 40
Office of Government Commerce 30 30 0 30 30 0 30 0 0 0 0 0
CCTA† 210 210 0 210 210 0 200 10 0 0 10 10
Property Advisers to the Civil Estate (PACE)† 170 170 0 180 180 0 170 10 0 0 0 0
The Buying Agency*† 120 120 0 120 120 0 110 10 0 0 10 10
Office of Government Commerce TOTAL 530 530 0 540 540 0 510 30 0 0 20 20
Customs and Excise‡ 21,910 21,910 0 22,640 22,640 0 20,610 2,030 0 0 400 400
Debt Management Office† 30 30 0 30 30 0 30 0 0 0 0 0
Government Actuary 100 100 0 100 100 0 100 0 0 0 0 0
Inland Revenue (excl. agency)‡ 62,460 62,460 0 66,870 66,870 0 54,040 12,830 0 0 580 580
Valuation Office† 3,880 3,880 0 4,050 4,050 0 3,570 490 0 0 20 20
Inland Revenue TOTAL 66,330 66,330 0 70,920 70,920 0 57,610 13,310 0 0 590 590
Department for National Savings† 110 110 0 120 120 0 110 0 0 0 10 10
National Investment and Loans Office 30 30 0 30 30 0 30 0 0 0 0 0
Office for National Statistics† 2,870 2,870 0 3,050 3,050 0 2,550 500 0 0 230 230
Registry of Friendly Societies 50 50 0 50 50 0 50 0 0 0 0 0
Royal Mint*† 1,030 370 670 1,050 380 670 360 20 670 0 90 10 8
CULTURE, MEDIA AND SPORT
Culture, Media and Sport (excl. agency) 400 400 0 410 410 0 390 20 0 0 0 0
Royal Parks Agency† 220 220 0 220 220 0 220 0 0 0 0 0
Culture, Media and Sport TOTAL 620 620 0 630 630 0 610 20 0 0 0 0
d maintables 20-56 22/8/01, 10:44 am20

CIVIL SERVICE STATISTICS 2000
21
FULL-TIME EQUIVALENTS AND HEADCOUNT
CASUAL
FULL-TIME EQUIVALENT HEADCOUNT
Total Total of whom:Total non- Total Total non- Total Non-industrial Industrial
staff industrial industrial staff industrial industrial full-time part-time full-time part-time Departments and their agencies(1)
TOTAL STAFF IN:
4,060 28,820 1,050 11,300 10,650 650 12,010 11,300 700 9,820 1,480 600 110 ALL DEPARTMENTS AND AGENCIES
Of whom:
0,800 18,330 400 7,820 7,400 420 8,320 7,890 440 6,760 1,130 400 40 EXECUTIVE AGENCIES~
2,030 0 0 400 400 0 410 410 0 390 20 0 0 CUSTOMS AND EXCISE‡
2,830 0 0 580 580 0 640 640 0 530 110 0 0 INLAND REVENUE‡
890 0 0 230 230 0 240 240 0 220 20 0 0 CROWN PROSECUTION SERVICE‡
0 0 0 20 20 0 20 20 0 20 0 0 0 SERIOUS FRAUD OFFICE‡
6,550 18,330 400 9,050 8,620 420 9,630 9,190 440 7,910 1,280 400 40 TOTAL ON NEXT STEPS LINES
3,330 1,940 50 670 560 120 770 640 120 470 180 110 10 of which: TRADING FUNDS*
AGRICULTURE, FISHERIES & FOOD
690 0 0 220 220 0 240 240 0 210 30 0 0 Ministry of Agriculture, Fisheries and Food (excl. agencies)
40 40 10 40 30 10 40 30 10 30 10 10 0 Centre for Environment, Fisheries and Aquaculture Science†
30 0 0 40 40 0 40 40 0 30 10 0 0 Central Science Laboratory†
50 0 0 60 60 0 70 70 0 60 10 0 0 Farming and Rural Conservation Agency^†
20 0 0 10 10 0 10 10 0 10 0 0 0 Pesticides Safety Directorate†
140 0 0 30 30 0 40 40 0 30 10 0 0 Veterinary Laboratories Agency†
10 0 0 0 0 0 0 0 0 0 0 0 0 Veterinary Medicines Directorate†
990 40 10 400 390 10 430 420 10 360 60 10 0 Ministry of Agriculture, Fisheries and Food TOTAL
120 0 0 120 120 0 120 120 0 120 0 0 0 Intervention Board†
ATTORNEY GENERAL
890 0 0 230 230 0 240 240 0 220 20 0 0 Crown Prosecution Service‡
0 0 0 0 0 0 0 0 0 0 0 0 0 Legal Secretariat
0 0 0 20 20 0 20 20 0 20 0 0 0 Serious Fraud Office‡
30 0 0 20 20 0 20 20 0 20 0 0 0 Treasury Solicitor’s Department†
CABINET OFFICE
130 80 0 50 50 0 50 50 0 40 0 0 0 Cabinet Office (excl. agency)
0 190 20 0 0 0 0 0 0 0 0 0 0 Government Car and Despatch Agency†
130 270 20 50 50 0 50 50 0 40 0 0 0 Cabinet Office TOTAL
20 0 0 0 0 0 10 10 0 0 0 0 0 Central Office of Information*†
390 0 0 0 0 0 0 0 0 0 0 0 0 Security and Intelligence Services
CHANCELLOR OF THE EXCHEQUER
50 0 0 40 40 0 40 40 0 40 0 0 0 Treasury
0 0 0 0 0 0 0 0 0 0 0 0 0§ Office of Government Commerce
10 0 0 10 10 0 10 10 0 10 0 0 0 CCTA†
10 0 0 0 0 0 0 0 0 0 0 0 0 Property Advisers to the Civil Estate (PACE)†
10 0 0 10 10 0 10 10 0 10 0 0 0 The Buying Agency*†
30 0 0 20 20 0 20 20 0 20 0 0 0 Office of Government Commerce TOTAL
2,030 0 0 400 400 0 410 410 0 390 20 0 0 Customs & Excise‡
0 0 0 0 0 0 0 0 0 0 0 0 0 Debt Management Office†
0 0 0 0 0 0 0 0 0 0 0 0 0 Government Actuary
2,830 0 0 580 580 0 640 640 0 530 110 0 0 Inland Revenue (excl. agency)‡
490 0 0 20 20 0 20 20 0 20 0 0 0 Valuation Office†
3,310 0 0 590 590 0 660 660 0 540 120 0 0 Inland Revenue TOTAL
0 0 0 10 10 0 10 10 0 10 0 0 0 Department for National Savings†
0 0 0 0 0 0 0 0 0 0 0 0 0 National Investment and Loans Office
500 0 0 230 230 0 240 240 0 230 10 0 0 Office for National Statistics†
0 0 0 0 0 0 0 0 0 0 0 0 0 Registry of Friendly Societies
20 670 0 90 10 80 90 10 80 10 0 80 0 Royal Mint*†
CULTURE, MEDIA AND SPORT
20 0 0 0 0 0 0 0 0 0 0 0 0 Culture, Media and Sport (excl. agency)
0 0 0 0 0 0 0 0 0 0 0 0 0 Royal Parks Agency†
20 0 0 0 0 0 0 0 0 0 0 0 0 Culture, Media and Sport TOTAL
TABLE A: STAFF NUMBERS IN EACH DEPARTMENT AND EXECUTIVE AGENCY AT 1 APRIL 2000
d maintables 20-56 22/8/01, 10:44 am21

CIVIL SERVICE STATISTICS 2000
22
FULL-TIME EQUIVALENTS AND HEADCOUNT
DEFENCEØ
Ministry of Defence (excl. agencies) 37,670 27,020 10,640 38,530 27,620 10,910 26,040 1,590 10,270 640 610 390 22
Armed Forces Personnel Administration Agency† 120 120 0 120 120 0 110 10 0 0 0 0
Army Base Repair Organisation† 2,500 550 1,950 2,510 550 1,960 540 20 1,940 20 50 10 4
Army Training and Recruiting Agency† 4,310 3,250 1,060 4,410 3,340 1,070 3,100 250 1,050 20 50 30 2
Army Personnel Centre† 1,190 1,190 0 1,220 1,220 0 1,160 60 0 0 10 10
Army Technical Support Agency† 0 0 0 0 0 0 0 0 0 0 0 0
Defence Analytical Services Agency† 120 120 0 120 120 0 110 10 0 0 20 20
Defence Aviation Repair Agency† 4,770 1,770 3,000 4,790 1,800 3,000 1,730 70 3,000 0 20 10
Defence Bills Agency† 600 600 0 640 630 0 550 80 0 0 0 0
Defence Clothing and Textile Agency† 480 450 30 490 460 40 440 20 30 0 10 10
Defence Communication Services Agency† 1,440 1,220 220 1,450 1,230 220 1,200 40 220 0 10 10
Defence Dental Agency† 170 170 0 180 180 10 150 30 0 0 10 10
Defence Estates Organisation† 1,210 1,080 120 1,230 1,100 130 1,050 50 120 10 10 10
Defence Evaluation and Research Agency*† 11,130 10,050 1,080 11,270 10,190 1,080 9,740 450 1,080 10 280 270 1
Defence Housing Executive† 940 850 90 970 870 100 830 40 90 10 20 10 1
Defence Intelligence and Security Centre† 140 120 20 140 130 20 110 10 20 0 0 0
Defence Medical Training Organisation† 160 130 30 170 140 30 120 20 30 10 0 0
Defence Postal & Courier Services Agency† 350 320 30 360 320 40 300 20 30 0 0 0
Defence Procurement Agency† 3,930 3,920 10 3,980 3,970 10 3,820 150 10 0 20 20
Defence Secondary Care Agency† 720 580 140 750 600 140 550 60 130 20 60 60 1
Defence Storage & Distribution Agency† 3,260 1,150 2,110 3,300 1,180 2,120 1,110 70 2,100 20 20 0 2
Defence Transport & Movement Executive† 200 170 30 210 170 30 170 10 30 0 0 0
Defence Vetting Agency† 360 360 0 360 360 0 340 20 0 0 10 10
Disposal Sales Agency† 80 80 0 80 80 0 70 0 0 0 0 0
Duke of York’s Royal Military School† 100 90 20 110 90 20 80 10 10 10 0 0
Hydrographer of the Navy*† 830 810 20 860 840 20 770 80 20 0 10 10
Joint Air Reconnaissance Intelligence Centre† 160 160 0 160 160 0 160 10 0 0 0 0
Logistic Information Systems Agency† 230 220 0 230 230 0 210 20 0 0 0 0
Medical Supplies Agency† 250 140 110 260 140 120 120 20 100 10 10 0 1
Meteorological Office*† 2,240 2,240 0 2,280 2,280 0 2,180 90 0 0 20 20
Military Survey† 680 650 30 700 670 40 610 60 30 10 0 0
Ministry of Defence Police† 3,450 3,430 30 3,480 3,450 30 3,390 60 20 10 0 0
Naval Bases and Supplies Agency† 7,620 4,020 3,600 7,730 4,110 3,620 3,880 230 3,580 40 110 50 7
Naval Manning Agency† 100 100 0 100 100 0 90 10 0 0 0 0
Naval Recruiting and Training Agency† 1,190 930 260 1,210 950 260 920 30 250 20 10 10
Pay and Personnel Agency† 630 630 0 660 660 0 560 100 0 0 0 0
Queen Victoria School† 70 60 10 70 60 10 50 0 10 10 0 0
RAF Logistics Support Services† 550 550 0 560 550 0 540 20 0 0 10 10
RAF Personnel Management Agency† 220 220 0 240 240 0 210 30 0 0 0 0
RAF Signals Engineering Establishment† 730 660 80 750 670 80 640 30 80 0 0 0
RAF Training Group Defence Agency† 2,070 1,750 320 2,130 1,790 340 1,700 100 290 50 20 20
Service Children’s Education† 710 710 0 710 710 0 710 0 0 0 140 140
Ship Support Agency† 2,650 2,600 60 2,710 2,650 60 2,500 150 60 0 30 30
Ministry of Defence TOTAL 100,330 75,220 25,110 102,210 76,730 25,490 72,650 4,070 24,580 910 1,610 1,190 42
EDUCATION & EMPLOYMENT
Department for Education and Employment (excl. agency)(2) 4,970 4,970 0 5,130 5,130 0 4,640 490 0 0 220 220
Employment Service† 31,090 31,090 0 33,730 33,730 0 25,680 8,050 0 0 1,530 1,530
Department for Education and Employment TOTAL 36,060 36,060 0 38,860 38,860 0 30,310 8,550 0 0 1,750 1,750
Office for Standards in Education 420 420 0 430 430 0 420 10 0 0 10 10
PERMANENT
FULL-TIME EQUIVALENT HEADCOUNT
Total Total of whom:Total non- Total Total non- Non-industrial Industrial
Departments and their agencies(1) staff industrial industrial staff industrial Industrial full-time part-time full-time part-time
TABLE A: STAFF NUMBERS IN EACH DEPARTMENT AND EXECUTIVE AGENCY AT 1 APRIL 2000
d maintables 20-56 22/8/01, 10:44 am22

CIVIL SERVICE STATISTICS 2000
23
FULL-TIME EQUIVALENTS AND HEADCOUNT
DEFENCEØ
1,590 10,270 640 610 390 220 680 420 260 350 70 190 70 Ministry of Defence (excl. agencies)
10 0 0 0 0 0 0 0 0 0 0 0 0 Armed Forces Personnel Administration Agency†
20 1,940 20 50 10 40 60 10 40 10 0 40 0 Army Base Repair Organisation†
250 1,050 20 50 30 20 60 30 30 20 10 20 0 Army Training and Recruiting Agency†
60 0 0 10 10 0 10 10 0 10 0 0 0 Army Personnel Centre†
0 0 0 0 0 0 0 0 0 0 0 0 0 Army Technical Support Agency†
10 0 0 20 20 0 20 20 0 20 0 0 0 Defence Analytical Services Agency†
70 3,000 0 20 10 0 20 10 0 10 0 0 0 Defence Aviation Repair Agency†
80 0 0 0 0 0 0 0 0 0 0 0 0 Defence Bills Agency†
20 30 0 10 10 0 10 10 0 10 0 0 0 Defence Clothing and Textile Agency†
40 220 0 10 10 0 10 10 0 10 0 0 0 Defence Communication Services Agency†
30 0 0 10 10 0 10 10 0 0 10 0 0 Defence Dental Agency†
50 120 10 10 10 0 10 10 0 10 0 0 0 Defence Estates Organisation†
450 1,080 10 280 270 10 330 320 10 230 90 10 0 Defence Evaluation and Research Agency*†
40 90 10 20 10 10 20 10 10 10 0 10 0 Defence Housing Executive†
10 20 0 0 0 0 0 0 0 0 0 0 0 Defence Intelligence and Security Centre†
20 30 10 0 0 0 0 0 0 0 0 0 0 Defence Medical Training Organisation†
20 30 0 0 0 0 0 0 0 0 0 0 0 Defence Postal & Courier Services Agency†
150 10 0 20 20 0 30 30 0 20 0 0 0 Defence Procurement Agency†
60 130 20 60 60 10 70 60 10 50 0 10 0 Defence Secondary Care Agency†
70 2,100 20 20 0 20 20 10 20 0 0 20 0 Defence Storage & Distribution Agency†
10 30 0 0 0 0 0 0 0 0 0 0 0 Defence Transport & Movement Executive†
20 0 0 10 10 0 10 10 0 10 0 0 0 Defence Vetting Agency†
0 0 0 0 0 0 0 0 0 0 0 0 0 Disposal Sales Agency†
10 10 10 0 0 0 0 0 0 0 0 0 0 Duke of York’s Royal Military School†
80 20 0 10 10 0 10 10 0 10 0 0 0 Hydrographer of the Navy*†
10 0 0 0 0 0 0 0 0 0 0 0 0 Joint Air Reconnaissance Intelligence Centre†
20 0 0 0 0 0 0 0 0 0 0 0 0 Logistic Information Systems Agency†
20 100 10 10 0 10 20 10 10 0 0 10 0 Medical Supplies Agency†
90 0 0 20 20 0 30 30 0 20 0 0 0 Meteorological Office*†
60 30 10 0 0 0 0 0 0 0 0 0 0 Military Survey†
60 20 10 0 0 0 10 0 0 0 0 0 0 Ministry of Defence Police†
230 3,580 40 110 50 70 120 50 70 40 10 60 0 Naval Bases and Supplies Agency†
10 0 0 0 0 0 0 0 0 0 0 0 0 Naval Manning Agency†
30 250 20 10 10 0 10 10 0 10 0 0 0 Naval Recruiting and Training Agency†
100 0 0 0 0 0 0 0 0 0 0 0 0 Pay and Personnel Agency†
0 10 10 0 0 0 0 0 0 0 0 0 0 Queen Victoria School†
20 0 0 10 10 0 10 10 0 10 0 0 0 RAF Logistics Support Services†
30 0 0 0 0 0 0 0 0 0 0 0 0 RAF Personnel Management Agency†
30 80 0 0 0 0 0 0 0 0 0 0 0 RAF Signals Engineering Establishment†
100 290 50 20 20 0 30 20 0 20 10 0 0 RAF Training Group Defence Agency†
0 0 0 140 140 0 170 170 0 120 50 0 0 Service Children’s Education†
150 60 0 30 30 0 30 30 0 20 0 0 0 Ship Support Agency†
4,070 24,580 910 1,610 1,190 420 1,780 1,320 460 1,050 270 380 90 Ministry of Defence TOTAL
EDUCATION & EMPLOYMENT
490 0 0 220 220 0 220 220 0 210 10 0 0 Department for Education and Employment (excl. agency)(2)
8,050 0 0 1,530 1,530 0 1,570 1,570 0 1,440 130 0 0 Employment Service†
8,550 0 0 1,750 1,750 0 1,790 1,790 0 1,660 140 0 0 Department for Education and Employment TOTAL
10 0 0 10 10 0 10 10 0 10 0 0 0 Office for Standards in Education
CASUAL
FULL-TIME EQUIVALENT HEADCOUNT
Total Total of whom:Total non- Total Total non- Total Non-industrial Industrial
staff industrial industrial staff industrial industrial full-time part-time full-time part-time Departments and their agencies(1)
TABLE A: STAFF NUMBERS IN EACH DEPARTMENT AND EXECUTIVE AGENCY AT 1 APRIL 2000
d maintables 20-56 22/8/01, 10:44 am23

CIVIL SERVICE STATISTICS 2000
24
FULL-TIME EQUIVALENTS AND HEADCOUNT
ENVIRONMENT, TRANSPORT AND THE REGIONS
Department of the Environment, Transport
and the Regions (excl. agencies)(3) 4,830 4,830 0 4,940 4,940 0 4,600 340 0 0 90 90
Driver and Vehicle Licensing Agency† 4,540 4,540 0 4,860 4,860 0 4,100 760 0 0 330 330
Driving Standards Agency† 1,650 1,650 0 1,830 1,830 0 1,550 280 0 0 90 90
Highways Agency† 1,640 1,640 0 1,680 1,680 0 1,570 110 0 0 50 50
Maritime and Coastguard Agency† 1,020 1,020 0 1,070 1,070 0 980 80 0 0 40 40
Planning Inspectorate^† 670 670 0 700 700 0 620 80 0 0 10 10
QEII Conference Centre† 50 50 0 50 50 0 50 0 0 0 0 0
The Rent Service† 880 880 0 880 880 0 810 80 0 0 10 10
Vehicle Certification Agency† 90 90 0 90 90 0 90 0 0 0 0 0
Vehicle Inspectorate*† 1,690 1,520 170 1,770 1,590 190 1,410 180 150 40 120 90 3
Department of the Environment, Transport and
Regions TOTAL 17,070 16,910 170 17,870 17,690 190 15,770 1,910 150 40 740 710 3
Health & Safety Executive/Commission 3,820 3,820 0 3,970 3,970 0 3,550 420 0 0 20 20
Shadow Strategic Rail Authority 180 180 0 180 180 0 180 0 0 0 0 0
Office of the Rail Regulator 150 150 0 150 150 0 140 0 0 0 10 10
Office of Water Services 200 200 0 210 210 0 190 20 0 0 0 0
Ordnance Survey† 1,820 1,820 0 1,860 1,860 0 1,750 110 0 0 10 10
FOREIGN AND COMMONWEALTH
Foreign and Commonwealth Office (excl. agency) 5,420 5,420 0 5,480 5,480 0 5,360 120 0 0 20 20
Wilton Park† 40 40 0 50 50 0 30 10 0 0 0 0
Foreign and Commonwealth Office TOTAL 5,470 5,470 0 5,520 5,520 0 5,390 130 0 0 20 20
HEALTH
Department of Health (excl. agencies) 3,570 3,560 10 3,670 3,660 10 3,360 300 10 0 70 70
Medical Devices Agency† 140 140 0 140 140 0 130 10 0 0 0 0
Medicines Control Agency*† 440 440 0 450 450 0 420 30 0 0 40 40
National Health Service Estates† 290 290 0 290 290 0 280 10 0 0 20 20
National Health Service Pensions Agency† 430 430 0 450 450 0 390 60 0 0 0 0
National Health Service Purchasing and Supply Agency† 280 280 0 290 290 0 280 10 0 0 0 0
Department of Health TOTAL 5,160 5,150 10 5,300 5,290 10 4,860 430 10 0 120 120
Food Standards Agency 410 410 0 410 410 0 400 20 0 0 10 10
Meat Hygiene Service† 1,420 1,420 0 1,430 1,430 0 1,420 10 0 0 30 30
Food Standards TOTAL 1,830 1,830 0 1,840 1,840 0 1,810 30 0 0 40 40
HOME
Home Office (Main) (excl. agencies) 9,270 9,230 40 9,640 9,600 40 8,560 1,040 30 10 250 250
Fire Service College*† 180 140 40 180 140 40 130 10 40 0 10 10
Forensic Science Service† 1,780 1,780 0 1,830 1,830 0 1,670 160 0 0 10 10
UK Passport Agency† 1,320 1,320 0 1,450 1,450 0 1,150 300 0 0 330 330
Home Office (Main) TOTAL 12,540 12,470 80 13,100 13,020 80 11,510 1,510 70 10 610 610
Charity Commission 510 510 0 530 530 0 470 70 0 0 30 30
HM Prison Service† 40,560 37,850 2,710 41,210 38,470 2,740 37,040 1,430 2,660 70 1,210 1,110 10
INTERNATIONAL DEVELOPMENT, Department for 1,210 1,210 0 1,250 1,250 0 1,170 80 0 0 10 10
LORD CHANCELLOR
Lord Chancellor’s Department (excl. agencies) 910 910 0 930 930 0 830 110 0 0 30 30
Court Service† 9,200 9,200 0 9,790 9,790 0 8,100 1,690 0 0 230 230
Public Trust Office† 530 530 0 540 540 0 500 40 0 0 0 0
Lord Chancellor’s Department TOTAL 10,640 10,640 0 11,260 11,260 0 9,430 1,830 0 0 270 270
HM Land Registry*† 7,750 7,750 0 8,390 8,390 0 6,470 1,920 0 0 20 20
Public Record Office† 430 430 0 460 460 0 390 70 0 0 10 10
PERMANENT
FULL-TIME EQUIVALENT HEADCOUNT
Total Total of whom:Total non- Total Total non- Non-industrial Industrial
Departments and their agencies(1) staff industrial industrial staff industrial Industrial full-time part-time full-time part-time
TABLE A: STAFF NUMBERS IN EACH DEPARTMENT AND EXECUTIVE AGENCY AT 1 APRIL 2000
d maintables 20-56 22/8/01, 10:44 am24

CIVIL SERVICE STATISTICS 2000
25
FULL-TIME EQUIVALENTS AND HEADCOUNT
ENVIRONMENT, TRANSPORT AND THE REGIONS
Department of the Environment, Transport
340 0 0 90 90 0 90 90 0 90 0 0 0 and the Regions (excl. agencies)(3)
760 0 0 330 330 0 350 350 0 290 70 0 0 Driver and Vehicle Licensing Agency†
280 0 0 90 90 0 110 110 0 70 40 0 0 Driving Standards Agency†
110 0 0 50 50 0 50 50 0 50 0 0 0 Highways Agency†
80 0 0 40 40 0 40 40 0 40 0 0 0 Maritime and Coastguard Agency†
80 0 0 10 10 0 10 10 0 10 0 0 0 Planning Inspectorate^†
0 0 0 0 0 0 0 0 0 0 0 0 0 QEII Conference Centre†
80 0 0 10 10 0 10 10 0 10 0 0 0 The Rent Service†
0 0 0 0 0 0 0 0 0 0 0 0 0 Vehicle Certification Agency†
180 150 40 120 90 30 140 110 30 70 40 20 10 Vehicle Inspectorate*†
Department of the Environment, Transport and
1,910 150 40 740 710 30 810 780 30 630 150 20 10 Regions TOTAL
420 0 0 20 20 0 20 20 0 20 0 0 0 Health & Safety Executive/Commission
0 0 0 0 0 0 0 0 0 0 0 0 0 Shadow Strategic Rail Authority
0 0 0 10 10 0 10 10 0 10 0 0 0 Office of the Rail Regulator
20 0 0 0 0 0 0 0 0 0 0 0 0 Office of Water Services
110 0 0 10 10 0 10 10 0 10 0 0 0 Ordnance Survey†
FOREIGN AND COMMONWEALTH
120 0 0 20 20 0 20 20 0 20 0 0 0 Foreign and Commonwealth Office (excl. agency)
10 0 0 0 0 0 0 0 0 0 0 0 0 Wilton Park†
130 0 0 20 20 0 30 30 0 20 0 0 0 Foreign and Commonwealth Office TOTAL
HEALTH
300 10 0 70 70 0 70 70 0 60 10 0 0 Department of Health (excl. agencies)
10 0 0 0 0 0 0 0 0 0 0 0 0 Medical Devices Agency†
30 0 0 40 40 0 40 40 0 40 0 0 0 Medicines Control Agency*†
10 0 0 20 20 0 20 20 0 10 0 0 0 National Health Service Estates†
60 0 0 0 0 0 0 0 0 0 0 0 0 National Health Service Pensions Agency†
10 0 0 0 0 0 0 0 0 0 0 0 0 National Health Service Purchasing and Supply Agency†
430 10 0 120 120 0 130 130 0 120 10 0 0 Department of Health TOTAL
20 0 0 10 10 0 10 10 0 10 0 0 0 Food Standards Agency
10 0 0 30 30 0 30 30 0 30 0 0 0 Meat Hygiene Service†
30 0 0 40 40 0 40 40 0 40 0 0 0 Food Standards TOTAL
HOME
1,040 30 10 250 250 0 260 260 0 240 30 0 0 Home Office (Main) (excl. agencies)
10 40 0 10 10 0 10 10 0 10 0 0 0 Fire Service College*†
160 0 0 10 10 0 20 20 0 10 0 0 0 Forensic Science Service†
300 0 0 330 330 0 390 390 0 280 110 0 0 UK Passport Agency†
1,510 70 10 610 610 0 680 680 0 540 140 0 0 Home Office (Main) TOTAL
70 0 0 30 30 0 30 30 0 20 10 0 0 Charity Commission
1,430 2,660 70 1,210 1,110 100 1,250 1,150 110 1,070 80 90 20 HM Prison Service†
80 0 0 10 10 0 20 20 0 10 0 0 0 INTERNATIONAL DEVELOPMENT, Department for
LORD CHANCELLOR
110 0 0 30 30 0 30 30 0 30 10 0 0 Lord Chancellor’s Department (excl. agencies)
1,690 0 0 230 230 0 250 250 0 200 50 0 0 Court Service†
40 0 0 0 0 0 0 0 0 0 0 0 0 Public Trust Office†
1,830 0 0 270 270 0 290 290 0 240 50 0 0 Lord Chancellor’s Department TOTAL
1,920 0 0 20 20 0 30 30 0 20 10 0 0 HM Land Registry*†
70 0 0 10 10 0 10 10 0 0 0 0 0 Public Record Office†
CASUAL
FULL-TIME EQUIVALENT HEADCOUNT
Total Total of whom:Total non- Total Total non- Total Non-industrial Industrial
staff industrial industrial staff industrial industrial full-time part-time full-time part-time Departments and their agencies(1)
TABLE A: STAFF NUMBERS IN EACH DEPARTMENT AND EXECUTIVE AGENCY AT 1 APRIL 2000
d maintables 20-56 22/8/01, 10:44 am25

CIVIL SERVICE STATISTICS 2000
26
FULL-TIME EQUIVALENTS AND HEADCOUNT
NORTHERN IRELAND OFFICE 190 190 0 200 200 0 170 30 0 0 0 0
PRIVY COUNCIL OFFICE 30 30 0 30 30 0 30 0 0 0 0 0
SCOTLAND
Scottish Executive (excl. agencies) 3,810 3,810 0 3,940 3,930 0 3,610 320 0 0 90 90
Fisheries Research Services† 250 250 0 260 260 0 250 10 0 0 10 10
Historic Scotland†(5) 690 470 220 710 490 220 450 50 220 0 90 90
Scottish Agricultural Science Agency† 130 120 10 130 130 10 110 10 10 0 10 10
Scottish Court Service† 800 800 0 850 850 0 720 130 0 0 70 70
Scottish Fisheries Protection Agency† 270 200 70 280 210 70 190 20 70 0 20 10 1
Scottish Public Pensions Agency† 160 160 0 160 160 0 150 10 0 0 30 30
Scottish Prison Service† 4,620 4,610 10 4,720 4,710 10 4,540 170 10 0 30 30
Student Awards Agency for Scotland† 120 120 0 130 130 0 120 10 0 0 0 0
Scottish Executive TOTAL 10,850 10,540 310 11,180 10,870 310 10,140 730 310 0 340 340 1
Crown Office and Procurator Fiscal 1,120 1,120 0 1,180 1,180 0 1,020 160 0 0 30 30
General Register Office – Scotland 230 230 0 240 240 0 220 20 0 0 10 10
National Archive for Scotland† 120 120 0 130 130 0 110 20 0 0 0 0
Registers of Scotland*† 1,280 1,280 0 1,350 1,350 0 1,170 180 0 0 0 0
SCOTLAND OFFICE 40 40 0 40 40 0 40 0 0 0 0 0
SOCIAL SECURITY
Department of Social Security (excl. agencies) 2,880 2,880 0 2,970 2,970 0 2,640 330 0 0 80 80
Benefits Agency† 69,230 69,230 0 74,680 74,680 0 57,020 17,660 0 0 1,260 1,260
Child Support Agency† 8,520 8,520 0 9,210 9,210 0 7,150 2,060 0 0 240 240
IT Services Agency† 1,970 1,970 0 2,020 2,020 0 1,860 160 0 0 40 40
War Pensions Agency† 930 930 0 990 990 0 780 210 0 0 40 30 1
Department of Social Security TOTAL 83,530 83,530 0 89,870 89,870 0 69,450 20,430 0 0 1,660 1,660 1
TRADE AND INDUSTRY
Department of Trade and Industry (excl. agencies)(4) 4,700 4,700 0 4,830 4,830 0 4,460 370 0 0 60 60
Companies House*† 810 810 0 920 920 0 650 270 0 0 60 60
Employment Tribunals Service† 580 580 0 610 610 0 540 70 0 0 100 100
Insolvency Service† 1,340 1,340 0 1,400 1,400 0 1,230 170 0 0 20 20
National Weights & Measures Laboratory† 50 50 0 60 60 0 50 10 0 0 0 0
Patent Office*† 830 830 0 850 850 0 790 60 0 0 0 0
Radiocommunications Agency† 520 520 0 530 530 0 500 20 0 0 10 10
Department of Trade and Industry TOTAL 8,840 8,840 0 9,180 9,180 0 8,200 980 0 0 250 250
Advisory Conciliation and Arbitration Service (ACAS) 740 740 0 770 770 0 690 80 0 0 10 10
Export Credit Guarantee Department 370 370 0 370 370 0 350 30 0 0 0 0
Office of Fair Trading 440 440 0 440 440 0 430 10 0 0 10 10
OFGEM 420 420 0 430 430 0 410 20 0 0 40 40
Office of Telecommunications 200 200 0 200 200 0 200 0 0 0 10 10
WALES
National Assembly for Wales (excl. agency) 2,380 2,370 0 2,450 2,450 0 2,240 210 0 0 200 200
Cadw (Welsh Historic Monuments)† 190 130 60 200 140 60 120 20 60 0 20 20
National Assembly for Wales TOTAL 2,570 2,510 60 2,650 2,590 60 2,360 230 60 0 210 210
Estyn (Office of the Chief Inspector of Schools in Wales) 70 70 0 70 70 0 70 0 0 0 0 0
Office of the Secretary of State for Wales 30 30 0 40 40 0 30 0 0 0 0 0
PERMANENT
FULL-TIME EQUIVALENT HEADCOUNT
NOTE: FTE = Full-Time Equivalents, with part-time staff counted as a proportion of full-time hours worked. ~ Excluding Executive Units of Customs and Excise, Executive Offices of the Inland Revenue, the Crown Prosecution Service and the Serious Fraud Office. * Trading Funds. † Executive Agencies Ø Defence figures do not include service personnel^ Joint responsibility with the Welsh Office.
Total Total of whom:Total non- Total Total non- Non-industrial Industrial
Departments and their agencies(1) staff industrial industrial staff industrial Industrial full-time part-time full-time part-time
TABLE A: STAFF NUMBERS IN EACH DEPARTMENT AND EXECUTIVE AGENCY AT 1 APRIL 2000
d maintables 20-56 22/8/01, 10:44 am26

CIVIL SERVICE STATISTICS 2000
27
FULL-TIME EQUIVALENTS AND HEADCOUNT
30 0 0 0 0 0 0 0 0 0 0 0 0 NORTHERN IRELAND OFFICE
0 0 0 0 0 0 0 0 0 0 0 0 0 PRIVY COUNCIL OFFICE
SCOTLAND
320 0 0 90 90 0 90 90 0 90 10 0 0 Scottish Executive (excl. agencies)
10 0 0 10 10 0 10 10 0 10 0 0 0 Fisheries Research Services†
50 220 0 90 90 0 110 110 0 50 60 0 0 Historic Scotland†(5)
10 10 0 10 10 0 10 10 0 10 0 0 0 Scottish Agricultural Science Agency†
130 0 0 70 70 0 80 80 0 60 20 0 0 Scottish Court Service†
20 70 0 20 10 10 20 10 10 10 10 10 0 Scottish Fisheries Protection Agency†
10 0 0 30 30 0 40 40 0 30 0 0 0 Scottish Public Pensions Agency†
170 10 0 30 30 0 30 30 0 30 0 0 0 Scottish Prison Service†
10 0 0 0 0 0 0 0 0 0 0 0 0 Student Awards Agency for Scotland†
730 310 0 340 340 10 380 380 10 280 100 10 0 Scottish Executive TOTAL
160 0 0 30 30 0 30 30 0 30 10 0 0 Crown Office and Procurator Fiscal
20 0 0 10 10 0 10 10 0 10 0 0 0 General Register Office – Scotland
20 0 0 0 0 0 10 10 0 0 0 0 0 National Archive for Scotland†
180 0 0 0 0 0 0 0 0 0 0 0 0 Registers of Scotland*†
0 0 0 0 0 0 0 0 0 0 0 0 0 SCOTLAND OFFICE
SOCIAL SECURITY
330 0 0 80 80 0 90 90 0 80 10 0 0 Department of Social Security (excl. agencies)
7,660 0 0 1,260 1,260 0 1,330 1,330 0 1,160 170 0 0 Benefits Agency†
2,060 0 0 240 240 0 260 260 0 230 30 0 0 Child Support Agency†
160 0 0 40 40 0 40 40 0 40 10 0 0 IT Services Agency†
210 0 0 40 30 10 40 30 10 30 0 10 0 War Pensions Agency†
0,430 0 0 1,660 1,660 10 1,750 1,750 10 1,530 220 10 0 Department of Social Security TOTAL
TRADE AND INDUSTRY
370 0 0 60 60 0 70 70 0 60 0 0 0 Department of Trade and Industry (excl. agencies)(4)
270 0 0 60 60 0 80 80 0 50 30 0 0 Companies House*†
70 0 0 100 100 0 100 100 0 100 0 0 0 Employment Tribunals Service†
170 0 0 20 20 0 20 20 0 20 0 0 0 Insolvency Service†
10 0 0 0 0 0 0 0 0 0 0 0 0 National Weights & Measures Laboratory†
60 0 0 0 0 0 0 0 0 0 0 0 0 Patent Office*†
20 0 0 10 10 0 10 10 0 10 0 0 0 Radiocommunications Agency†
980 0 0 250 250 0 270 270 0 230 40 0 0 Department of Trade and Industry TOTAL
80 0 0 10 10 0 10 10 0 10 0 0 0 Advisory Conciliation and Arbitration Service (ACAS)
30 0 0 0 0 0 0 0 0 0 0 0 0 Export Credit Guarantee Department
10 0 0 10 10 0 10 10 0 10 0 0 0 Office of Fair Trading
20 0 0 40 40 0 40 40 0 30 0 0 0 OFGEM
0 0 0 10 10 0 10 10 0 10 0 0 0 Office of Telecommunications
WALES
210 0 0 200 200 0 200 200 0 200 0 0 0 National Assembly for Wales (excl. agency)
20 60 0 20 20 0 30 30 0 10 20 0 0 Cadw (Welsh Historic Monuments)†
230 60 0 210 210 0 230 220 0 200 20 0 0 National Assembly for Wales TOTAL
0 0 0 0 0 0 0 0 0 0 0 0 0 Estyn (Office of the Chief Inspector of Schools in Wales
0 0 0 0 0 0 0 0 0 0 0 0 0 Office of the Secretary of State for Wales
CASUAL
FULL-TIME EQUIVALENT HEADCOUNT
‡ Departments operating fully on Next Steps lines. Inland Revenue figure excludes the Valuation Office, which is a free-standing agency.(1) Listed by Ministerial responsibility. Excludes Northern Ireland Civil Service and its agencies.(2) Includes Government Office staff – 666.6 (FTE) permanent non-industrial and 8.6 (FTE) casual non-industrial.(3) Includes Government Office staff – 942.8 (FTE) permanent non-industrial and 53.4 (FTE) casual non-industrial.(4) Includes Government Office staff – 656.3 (FTE) permanent non-industrial and 12.4 (FTE) casual non-industrial.(5) Historic Scotland were unable to supply 1st April 2000 figures. The figures are for 1st April 1999.CO/ECSD (PS 1)/Nov 2000 Source: Departmental Returns and MANDATE
Total Total of whom:Total non- Total Total non- Total Non-industrial Industrial
staff industrial industrial staff industrial industrial full-time part-time full-time part-time Departments and their agencies(1)
TABLE A: STAFF NUMBERS IN EACH DEPARTMENT AND EXECUTIVE AGENCY AT 1 APRIL 2000
d maintables 20-56 22/8/01, 10:44 am27

CIVIL SERVICE STATISTICS 2000
28
TABLE B: PERMANENT STAFF IN POST FOR EACH DEPARTMENT AND EXECUTIVE AGENCYBY GENDER AT 1 APRIL 2000
NON-INDUSTRIAL STAFF INDUSTRIAL STAFF
Full-time Part-time Full-time
DEPARTMENTS AND AGENCIES(1) Male Female Total Male Female Total Male Female Total
TOTAL STAFF IN ALL DEPARTMENTS AND AGENCIES 220,380 183,330 403,710 4,110 59,950 64,060 25,380 3,440 28,820 140 910 1,0
AGRICULTURE, FISHERIES AND FOOD
Ministry of Agriculture, Fisheries and Food (excl. agencies) 3,420 2,770 6,190 70 620 690 0 0 0 0 0
Centre for Environment, Fisheries and Aquaculture Science 260 140 390 0 40 40 40 0 40 0 0
Central Science Laboratory 330 220 550 0 30 30 0 0 0 0 0
Farming and Rural Conservation Agency 300 180 480 10 50 50 0 0 0 0 0
Pesticides Safety Directorate 110 80 190 0 20 20 0 0 0 0 0
Veterinary Laboratories Agency 490 510 1,000 10 130 140 0 0 0 0 0
Veterinary Medicines Directorate 60 60 110 0 10 10 0 0 0 0 0
Ministry of Agriculture, Fisheries and Food TOTAL 4,970 3,940 8,910 100 890 990 40 0 40 0 0
Intervention Board 580 570 1,150 10 110 120 0 0 0 0 0
ATTORNEY GENERAL
Crown Prosecution Service 2,070 2,810 4,870 40 850 890 0 0 0 0 0
Legal Secretariat 20 10 30 0 0 0 0 0 0 0 0
Serious Fraud Office 100 70 170 0 0 0 0 0 0 0 0
Treasury Solicitor’s Department (obsolete) 200 200 400 0 20 30 0 0 0 0 0
Government Property Lawyers (TSOL) 0 0 0 0 0 0 0 0 0 0 0
Treasury Solicitor’s Department TOTAL 200 210 410 0 20 30 0 0 0 0 0
CABINET OFFICE
Cabinet Office (excl. agencies) 680 580 1,260 10 80 90 0 0 0 0 0
Government Car and Despatch Agency 30 10 30 0 0 0 180 10 190 20 0
Cabinet Office TOTAL 890 720 1,620 10 130 130 260 20 270 20 0
Central Office of Information 190 160 350 0 20 20 0 0 0 0 0
Security and Intelligence Services 3,140 1,130 4,270 20 370 390 0 0 0 0 0
CHANCELLOR OF THE EXCHEQUER
Treasury 510 300 800 10 40 50 0 0 0 0 0
Office of Government Commerce 20 10 30 0 0 0 0 0 0 0 0
Government Centre for Information Systems (CCTA) 130 70 200 0 10 10 0 0 0 0 0
Property Advisers to the Civil Estate Agency (PACE) 110 60 170 0 10 10 0 0 0 0 0
The Buying Agency 70 40 110 0 10 10 0 0 0 0 0
Office of Government Commerce TOTAL 330 180 510 0 30 30 0 0 0 0 0
Customs and Excise 12,980 7,630 20,610 110 1,920 2,030 0 0 0 0 0
Debt Management Office 20 10 30 0 0 0 0 0 0 0 0
Government Actuary 70 20 100 0 0 0 0 0 0 0 0
Inland Revenue (excl. agency) 24,850 29,190 54,040 560 12,260 12,830 0 0 0 0 0
Valuation Office 2,260 1,300 3,570 30 450 490 0 0 0 0 0
Inland Revenue TOTAL 27,110 30,500 57,610 600 12,720 13,310 0 0 0 0 0
Department for National Savings 60 50 110 0 0 0 0 0 0 0 0
National Investment and Loans Office 20 10 30 0 0 0 0 0 0 0 0
Office for National Statistics 1,200 1,350 2,550 30 470 500 0 0 0 0 0
Registry of Friendly Societies 30 20 50 0 0 0 0 0 0 0 0
Royal Mint 230 130 360 0 20 20 640 30 670 0 0
CULTURE, MEDIA AND SPORT
Culture, Media and Sport (excl. agency) 220 170 390 10 20 20 0 0 0 0 0
Royal Parks Agency 150 70 220 0 0 0 0 0 0 0 0
Culture, Media and Sport TOTAL 370 240 610 10 20 20 0 0 0 0 0
d maintables 20-56 22/8/01, 10:44 am28

CIVIL SERVICE STATISTICS 2000
29
INDUSTRIAL STAFF NON-INDUSTRIAL FTE INDUSTRIAL FTE
Part-time
Male Female Total Male Female Total Male Female Total DEPARTMENTS AND AGENCIES(1)
380 3,440 28,820 140 910 1,050 223,150 222,820 445,970 25,470 3,970 29,440 TOTAL STAFF IN ALL DEPARTMENTS AND AGENCIES
AGRICULTURE, FISHERIES AND FOOD
0 0 0 0 0 0 3,470 3,160 6,630 0 0 0 Ministry of Agriculture, Fisheries and Food (excl. agencies)
40 0 40 0 0 10 260 160 420 40 0 50 Centre for Environment, Fisheries and Aquaculture Science
0 0 0 0 0 0 330 240 570 0 0 0 Central Science Laboratory
0 0 0 0 0 0 310 200 510 0 0 0 Farming and Rural Conservation Agency
0 0 0 0 0 0 110 90 200 0 0 0 Pesticides Safety Directorate
0 0 0 0 0 0 500 590 1,090 0 0 0 Veterinary Laboratories Agency
0 0 0 0 0 0 60 60 120 0 0 0 Veterinary Medicines Directorate
40 0 40 0 0 10 5,030 4,510 9,540 40 0 50 Ministry of Agriculture, Fisheries and Food TOTAL
0 0 0 0 0 0 590 640 1,230 0 0 0 Intervention Board
ATTORNEY GENERAL
0 0 0 0 0 0 2,090 3,350 5,450 0 0 0 Crown Prosecution Service
0 0 0 0 0 0 20 10 30 0 0 0 Legal Secretariat
0 0 0 0 0 0 100 70 170 0 0 0 Serious Fraud Office
0 0 0 0 0 0 200 220 420 0 0 0 Treasury Solicitor’s Department (obsolete)
0 0 0 0 0 0 0 0 0 0 0 0 Government Property Lawyers (TSOL)
0 0 0 0 0 0 200 220 420 0 0 0 Treasury Solicitor’s Department TOTAL
CABINET OFFICE
0 0 0 0 0 0 680 630 1,320 0 0 0 Cabinet Office (excl. agencies)
180 10 190 20 0 20 30 10 30 180 10 200 Government Car and Despatch Agency
260 20 270 20 0 20 900 810 1,710 260 20 280 Cabinet Office TOTAL
0 0 0 0 0 0 190 180 360 0 0 0 Central Office of Information
0 0 0 0 0 0 3,160 1,360 4,520 0 0 0 Security and Intelligence Services
CHANCELLOR OF THE EXCHEQUER
0 0 0 0 0 0 510 320 830 0 0 0 Treasury
0 0 0 0 0 0 20 10 30 0 0 0 Office of Government Commerce
0 0 0 0 0 0 130 70 210 0 0 0 Government Centre for Information Systems (CCTA)
0 0 0 0 0 0 110 60 170 0 0 0 Property Advisers to the Civil Estate Agency (PACE)
0 0 0 0 0 0 70 50 120 0 0 0 The Buying Agency
0 0 0 0 0 0 330 190 530 0 0 0 Office of Government Commerce TOTAL
0 0 0 0 0 0 13,060 8,850 21,910 0 0 0 Customs and Excise
0 0 0 0 0 0 20 10 30 0 0 0 Debt Management Office
0 0 0 0 0 0 70 20 100 0 0 0 Government Actuary
0 0 0 0 0 0 25,250 37,210 62,460 0 0 0 Inland Revenue (excl. agency)
0 0 0 0 0 0 2,280 1,590 3,880 0 0 0 Valuation Office
0 0 0 0 0 0 27,530 38,800 66,330 0 0 0 Inland Revenue TOTAL
0 0 0 0 0 0 60 50 110 0 0 0 Department for National Savings
0 0 0 0 0 0 20 10 30 0 0 0 National Investment and Loans Office
0 0 0 0 0 0 1,220 1,650 2,870 0 0 0 Office for National Statistics
0 0 0 0 0 0 30 20 50 0 0 0 Registry of Friendly Societies
640 30 670 0 0 0 230 140 370 640 30 670 Royal Mint
CULTURE, MEDIA AND SPORT
0 0 0 0 0 0 220 180 400 0 0 0 Culture, Media and Sport (excl. agency)
0 0 0 0 0 0 150 70 220 0 0 0 Royal Parks Agency
0 0 0 0 0 0 370 250 620 0 0 0 Culture, Media and Sport TOTAL
TABLE B: PERMANENT STAFF IN POST FOR EACH DEPARTMENT AND EXECUTIVE AGENCYBY GENDER AT 1 APRIL 2000
d maintables 20-56 22/8/01, 10:44 am29

CIVIL SERVICE STATISTICS 2000
30
DEFENCE
Ministry of Defence (excl. agencies) 15,580 10,460 26,040 90 1,500 1,590 8,610 1,660 10,270 50 580 6
Armed Forces Personnel Administration Agency 50 60 110 0 10 10 0 0 0 0 0
Army Base Repair Organisation 360 170 540 0 20 20 1,860 80 1,940 10 10
Army Training and Recruiting Agency 1,760 1,340 3,100 20 220 250 920 130 1,050 0 20
Army Personnel Centre 560 600 1,160 0 60 60 0 0 0 0 0
Army Technical Support Agency 0 0 0 0 0 0 0 0 0 0 0
Defence Analytical Services Agency 70 40 110 0 10 10 0 0 0 0 0
Defence Aviation Repair Agency 1,290 440 1,730 0 60 70 2,880 110 3,000 0 0
Defence Bills Agency 260 290 550 0 80 80 0 0 0 0 0
Defence Clothing and Textile Agency 220 220 440 0 20 20 20 10 30 0 0
Defence Communication Services Agency 880 310 1,200 0 40 40 210 10 220 0 0
Defence Dental Agency 20 130 150 0 20 30 0 0 0 0 0
Defence Estates Organisation 710 340 1,050 0 50 50 120 0 120 10 0
Defence Evaluation and Research Agency 7,770 1,970 9,740 150 300 450 990 80 1,080 0 10
Defence Housing Executive 480 350 830 0 30 40 80 10 90 0 10
Defence Intelligence and Security Centre 60 60 110 0 10 10 20 0 20 0 0
Defence Medical Training Organisation 50 70 120 0 10 20 20 0 30 0 0
Defence Postal & Courier Services Agency 190 120 300 10 20 20 30 0 30 0 0
Defence Procurement Agency 3,010 810 3,820 10 140 150 10 0 10 0 0
Defence Secondary Care Agency 200 350 550 0 50 60 80 50 130 0 20
Defence Storage & Distribution Agency 530 580 1,110 0 70 70 1,560 540 2,100 0 20
Defence Transport & Movement Executive 70 100 170 0 10 10 30 0 30 0 0
Defence Vetting Agency 210 140 340 0 20 20 0 0 0 0 0
Disposal Sales Agency 60 20 70 0 0 0 0 0 0 0 0
Duke of York’s Royal Military School 40 40 80 0 10 10 10 0 10 0 10
Hydrographer of the Navy 570 200 770 10 70 80 20 0 20 0 0
Joint Air Reconnaissance Intelligence Centre 120 40 160 0 10 10 0 0 0 0 0
Logistic Information Systems Agency 110 100 210 0 10 20 0 0 0 0 0
Medical Supplies Agency 40 80 120 0 20 20 50 50 100 0 10
Meteorological Office 1,750 440 2,180 10 90 90 0 0 0 0 0
Military Survey 420 190 610 0 60 60 20 10 30 0 10
Ministry of Defence Police 3,030 360 3,390 10 50 60 10 10 20 0 10
Naval Bases and Supplies Agency 2,740 1,140 3,880 10 220 230 3,230 350 3,580 0 40
Naval Manning Agency 40 60 90 0 10 10 0 0 0 0 0
Naval Recruiting and Training Agency 710 210 920 0 30 30 220 20 250 0 10
Pay and Personnel Agency 270 290 560 0 90 100 0 0 0 0 0
Queen Victoria School 30 20 50 0 0 0 10 0 10 0 10
RAF Logistics Support Services 320 210 540 0 20 20 0 0 0 0 0
RAF Personnel Management Agency 60 140 210 0 30 30 0 0 0 0 0
RAF Signals Engineering Establishment 510 130 640 10 30 30 70 10 80 0 0
RAF Training Group Defence Agency 1,060 630 1,700 10 90 100 240 50 290 10 40
Service Children’s Education 350 370 710 0 0 0 0 0 0 0 0
Ship Support Agency 1,820 680 2,500 10 140 150 50 10 60 0 0
Ministry of Defence TOTAL 48,350 24,300 72,650 380 3,700 4,070 21,380 3,200 24,580 100 810 9
EDUCATION & EMPLOYMENT
Department for Education and Employment (excl. agency)2 2,300 2,330 4,640 30 460 490 0 0 0 0 0
Employment Service 9,290 16,390 25,680 300 7,750 8,050 0 0 0 0 0
Department for Education and Employment TOTAL 11,590 18,720 30,310 330 8,210 8,550 0 0 0 0 0
Office for Standards in Education 260 160 420 0 10 10 0 0 0 0 0
NON-INDUSTRIAL STAFF INDUSTRIAL STAFF
Full-time Part-time Full-time
DEPARTMENTS AND AGENCIES(1) Male Female Total Male Female Total Male Female Total
TABLE B: PERMANENT STAFF IN POST FOR EACH DEPARTMENT AND EXECUTIVE AGENCYBY GENDER AT 1 APRIL 2000
d maintables 20-56 22/8/01, 10:44 am30

CIVIL SERVICE STATISTICS 2000
31
DEFENCE
610 1,660 10,270 50 580 640 15,630 11,400 27,020 8,640 2,000 10,640 Ministry of Defence (excl. agencies)
0 0 0 0 0 0 50 70 120 0 0 0 Armed Forces Personnel Administration Agency
860 80 1,940 10 10 20 360 180 550 1,870 90 1,950 Army Base Repair Organisation
920 130 1,050 0 20 20 1,770 1,480 3,250 920 140 1,060 Army Training and Recruiting Agency
0 0 0 0 0 0 560 630 1,190 0 0 0 Army Personnel Centre
0 0 0 0 0 0 0 0 0 0 0 0 Army Technical Support Agency
0 0 0 0 0 0 70 50 120 0 0 0 Defence Analytical Services Agency
880 110 3,000 0 0 0 1,290 480 1,770 2,890 110 3,000 Defence Aviation Repair Agency
0 0 0 0 0 0 260 340 600 0 0 0 Defence Bills Agency
20 10 30 0 0 0 220 230 450 20 10 30 Defence Clothing and Textile Agency
210 10 220 0 0 0 880 340 1,220 210 10 220 Defence Communication Services Agency
0 0 0 0 0 0 20 140 170 0 0 0 Defence Dental Agency
120 0 120 10 0 10 710 370 1,080 120 0 120 Defence Estates Organisation
990 80 1,080 0 10 10 7,880 2,170 10,050 1,000 80 1,080 Defence Evaluation and Research Agency
80 10 90 0 10 10 480 370 850 80 10 90 Defence Housing Executive
20 0 20 0 0 0 60 70 120 20 0 20 Defence Intelligence and Security Centre
20 0 30 0 0 10 50 80 130 30 10 30 Defence Medical Training Organisation
30 0 30 0 0 0 190 130 320 30 0 30 Defence Postal & Courier Services Agency
10 0 10 0 0 0 3,020 900 3,920 10 0 10 Defence Procurement Agency
80 50 130 0 20 20 200 380 580 80 60 140 Defence Secondary Care Agency
560 540 2,100 0 20 20 530 620 1,150 1,560 550 2,110 Defence Storage & Distribution Agency
30 0 30 0 0 0 70 100 170 30 0 30 Defence Transport & Movement Executive
0 0 0 0 0 0 210 150 360 0 0 0 Defence Vetting Agency
0 0 0 0 0 0 60 20 80 0 0 0 Disposal Sales Agency
10 0 10 0 10 10 40 40 90 10 10 20 Duke of York’s Royal Military School
20 0 20 0 0 0 570 240 810 20 0 20 Hydrographer of the Navy
0 0 0 0 0 0 120 40 160 0 0 0 Joint Air Reconnaissance Intelligence Centre
0 0 0 0 0 0 110 110 220 0 0 0 Logistic Information Systems Agency
50 50 100 0 10 10 40 90 140 50 60 110 Medical Supplies Agency
0 0 0 0 0 0 1,750 490 2,240 0 0 0 Meteorological Office
20 10 30 0 10 10 420 230 650 20 10 30 Military Survey
10 10 20 0 10 10 3,030 390 3,430 10 20 30 Ministry of Defence Police
230 350 3,580 0 40 40 2,750 1,270 4,020 3,230 370 3,600 Naval Bases and Supplies Agency
0 0 0 0 0 0 40 60 100 0 0 0 Naval Manning Agency
220 20 250 0 10 20 710 230 930 230 30 260 Naval Recruiting and Training Agency
0 0 0 0 0 0 270 350 630 0 0 0 Pay and Personnel Agency
10 0 10 0 10 10 30 20 60 10 10 10 Queen Victoria School
0 0 0 0 0 0 320 220 550 0 0 0 RAF Logistics Support Services
0 0 0 0 0 0 60 160 220 0 0 0 RAF Personnel Management Agency
70 10 80 0 0 0 510 150 660 70 10 80 RAF Signals Engineering Establishment
240 50 290 10 40 50 1,070 690 1,750 240 80 320 RAF Training Group Defence Agency
0 0 0 0 0 0 350 370 710 0 0 0 Service Children’s Education
50 10 60 0 0 0 1,820 780 2,600 50 10 60 Ship Support Agency
380 3,200 24,580 100 810 910 48,600 26,620 75,220 21,440 3,680 25,110 Ministry of Defence TOTAL
EDUCATION & EMPLOYMENT
0 0 0 0 0 0 2,330 2,650 4,970 0 0 0 Department for Education and Employment (excl. agency)2
0 0 0 0 0 0 9,510 21,570 31,090 0 0 0 Employment Service
0 0 0 0 0 0 11,840 24,220 36,060 0 0 0 Department for Education and Employment TOTAL
0 0 0 0 0 0 260 170 420 0 0 0 Office for Standards in Education
INDUSTRIAL STAFF NON-INDUSTRIAL FTE INDUSTRIAL FTE
Part-time
Male Female Total Male Female Total Male Female Total DEPARTMENTS AND AGENCIES(1)
TABLE B: PERMANENT STAFF IN POST FOR EACH DEPARTMENT AND EXECUTIVE AGENCYBY GENDER AT 1 APRIL 2000
d maintables 20-56 22/8/01, 10:44 am31

CIVIL SERVICE STATISTICS 2000
32
ENVIRONMENT, TRANSPORT AND THE REGIONS
Department of the Environment, Transport and the
Regions (excl. agencies)3 2,840 1,760 4,600 30 310 340 0 0 0 0 0
Driver and Vehicle Licensing Agency 1,510 2,590 4,100 70 690 760 0 0 0 0 0
Driving Standards Agency 1,240 310 1,550 20 260 280 0 0 0 0 0
Highways Agency 1,100 460 1,570 10 100 110 0 0 0 0 0
Maritime and Coastguard Agency 710 280 980 10 70 80 0 0 0 0 0
Planning Inspectorate 430 200 620 40 40 80 0 0 0 0 0
QEII Conference Centre 30 30 50 0 0 0 0 0 0 0 0
The Rent Service 380 430 810 0 70 80 0 0 0 0 0
Vehicle Certification Agency 70 20 90 0 0 0 0 0 0 0 0
Vehicle Inspectorate 1,070 340 1,410 10 170 180 140 10 150 20 20
Department of the Environment, Transport and
the Regions TOTAL 9,370 6,400 15,770 200 1,720 1,910 140 10 150 20 20
Health and Safety Executive/Commission 2,250 1,300 3,550 40 380 420 0 0 0 0 0
Shadow Strategic Rail Authority 110 70 180 0 0 0 0 0 0 0 0
Office of the Rail Regulator 90 60 140 0 0 0 0 0 0 0 0
Office of Water Services 80 100 190 0 20 20 0 0 0 0 0
Ordnance Survey 1,380 380 1,750 0 110 110 0 0 0 0 0
FOREIGN AND COMMONWEALTH
Foreign and Commonwealth Office (excl. agency) 3,420 1,940 5,360 20 100 120 0 0 0 0 0
Wilton Park† 20 20 30 0 10 10 0 0 0 0 0
Foreign and Commonwealth Office TOTAL 3,440 1,960 5,390 20 110 130 0 0 0 0 0
HEALTH
Department of Health (excl. agencies) 1,530 1,830 3,360 40 260 300 0 10 10 0 0
Medical Devices Agency 80 50 130 10 10 10 0 0 0 0 0
Medicines Control Agency 200 230 420 10 30 30 0 0 0 0 0
National Health Service Estates 170 110 280 0 10 10 0 0 0 0 0
National Health Service Pensions Agency 170 220 390 0 60 60 0 0 0 0 0
National Health Service Purchasing and Supply Agency 140 140 280 0 10 10 0 0 0 0 0
Department of Health TOTAL 2,290 2,570 4,860 50 380 430 0 10 10 0 0
Food Standards Agency 220 180 400 0 10 20 0 0 0 0 0
Meat Hygiene Service 1,240 180 1,420 10 10 10 0 0 0 0 0
Food Standards Agency TOTAL 1,460 360 1,810 10 20 30 0 0 0 0 0
HOME
Home Office (Main) (excl. agencies) 4,740 3,820 8,560 110 930 1,040 30 0 30 0 10
Fire Service College 80 50 130 0 10 10 40 0 40 0 0
Forensic Science Service 800 880 1,670 10 150 160 0 0 0 0 0
UK Passport Agency 470 680 1,150 40 270 300 0 0 0 0 0
Home Office (Main) TOTAL 6,080 5,430 11,510 150 1,360 1,510 70 0 70 0 10
Charity Commission 230 240 470 10 60 70 0 0 0 0 0
HM Prison Service 27,720 9,320 37,040 240 1,190 1,430 2,490 180 2,660 10 60
INTERNATIONAL DEVELOPMENT, Department for 680 490 1,170 0 80 80 0 0 0 0 0
LORD CHANCELLOR
Lord Chancellor’s Department (excl. agencies) 420 410 830 30 80 110 0 0 0 0 0
Court Service 3,260 4,840 8,100 160 1,530 1,690 0 0 0 0 0
Public Trust Office 260 240 500 10 30 40 0 0 0 0 0
Lord Chancellor’s Department TOTAL 3,940 5,490 9,430 190 1,640 1,830 0 0 0 0 0
HM Land Registry 2,980 3,490 6,470 100 1,820 1,920 0 0 0 0 0
Public Record Office 240 150 390 20 50 70 0 0 0 0 0
NON-INDUSTRIAL STAFF INDUSTRIAL STAFF
Full-time Part-time Full-time
DEPARTMENTS AND AGENCIES(1) Male Female Total Male Female Total Male Female Total
TABLE B: PERMANENT STAFF IN POST FOR EACH DEPARTMENT AND EXECUTIVE AGENCYBY GENDER AT 1 APRIL 2000
d maintables 20-56 22/8/01, 10:44 am32

CIVIL SERVICE STATISTICS 2000
33
ENVIRONMENT, TRANSPORT AND THE REGIONS
Department of the Environment, Transport and the
0 0 0 0 0 0 2,860 1,970 4,830 0 0 0 Regions (excl. agencies)3
0 0 0 0 0 0 1,560 2,990 4,540 0 0 0 Driver and Vehicle Licensing Agency
0 0 0 0 0 0 1,250 410 1,650 0 0 0 Driving Standards Agency
0 0 0 0 0 0 1,110 530 1,640 0 0 0 Highways Agency
0 0 0 0 0 0 710 310 1,020 0 0 0 Maritime and Coastguard Agency
0 0 0 0 0 0 450 220 670 0 0 0 Planning Inspectorate
0 0 0 0 0 0 30 30 50 0 0 0 QEII Conference Centre
0 0 0 0 0 0 380 510 880 0 0 0 The Rent Service
0 0 0 0 0 0 70 20 90 0 0 0 Vehicle Certification Agency
140 10 150 20 20 40 1,070 450 1,520 150 20 170 Vehicle Inspectorate
Department of the Environment, Transport and
140 10 150 20 20 40 9,490 7,410 16,910 150 20 170 the Regions TOTAL
0 0 0 0 0 0 2,280 1,540 3,820 0 0 0 Health and Safety Executive/Commission
0 0 0 0 0 0 110 80 180 0 0 0 Shadow Strategic Rail Authority
0 0 0 0 0 0 90 60 150 0 0 0 Office of the Rail Regulator
0 0 0 0 0 0 80 120 200 0 0 0 Office of Water Services
0 0 0 0 0 0 1,380 440 1,820 0 0 0 Ordnance Survey
FOREIGN AND COMMONWEALTH
0 0 0 0 0 0 3,430 1,990 5,420 0 0 0 Foreign and Commonwealth Office (excl. agency)
0 0 0 0 0 0 20 20 40 0 0 0 Wilton Park†
0 0 0 0 0 0 3,450 2,020 5,470 0 0 0 Foreign and Commonwealth Office TOTAL
HEALTH
0 10 10 0 0 0 1,550 2,010 3,560 0 10 10 Department of Health (excl. agencies)
0 0 0 0 0 0 90 50 140 0 0 0 Medical Devices Agency
0 0 0 0 0 0 200 240 440 0 0 0 Medicines Control Agency
0 0 0 0 0 0 180 120 290 0 0 0 National Health Service Estates
0 0 0 0 0 0 170 260 430 0 0 0 National Health Service Pensions Agency
0 0 0 0 0 0 140 150 280 0 0 0 National Health Service Purchasing and Supply Agency
0 10 10 0 0 0 2,320 2,830 5,150 0 10 10 Department of Health TOTAL
0 0 0 0 0 0 220 190 410 0 0 0 Food Standards Agency
0 0 0 0 0 0 1,240 180 1,420 0 0 0 Meat Hygiene Service
0 0 0 0 0 0 1,460 370 1,830 0 0 0 Food Standards Agency TOTAL
HOME
30 0 30 0 10 10 4,810 4,420 9,230 30 0 40 Home Office (Main) (excl. agencies)
40 0 40 0 0 0 80 60 140 40 0 40 Fire Service College
0 0 0 0 0 0 800 970 1,780 0 0 0 Forensic Science Service
0 0 0 0 0 0 480 840 1,320 0 0 0 UK Passport Agency
70 0 70 0 10 10 6,180 6,290 12,470 70 0 80 Home Office (Main) TOTAL
0 0 0 0 0 0 230 280 510 0 0 0 Charity Commission
490 180 2,660 10 60 70 27,820 10,030 37,850 2,490 220 2,710 HM Prison Service
0 0 0 0 0 0 680 530 1,210 0 0 0 INTERNATIONAL DEVELOPMENT, Department for
LORD CHANCELLOR
0 0 0 0 0 0 450 460 910 0 0 0 Lord Chancellor’s Department (excl. agencies)
0 0 0 0 0 0 3,370 5,830 9,200 0 0 0 Court Service
0 0 0 0 0 0 260 260 530 0 0 0 Public Trust Office
0 0 0 0 0 0 4,080 6,550 10,640 0 0 0 Lord Chancellor’s Department TOTAL
0 0 0 0 0 0 3,050 4,700 7,750 0 0 0 HM Land Registry
0 0 0 0 0 0 250 180 430 0 0 0 Public Record Office
INDUSTRIAL STAFF NON-INDUSTRIAL FTE INDUSTRIAL FTE
Part-time
Male Female Total Male Female Total Male Female Total DEPARTMENTS AND AGENCIES(1)
TABLE B: PERMANENT STAFF IN POST FOR EACH DEPARTMENT AND EXECUTIVE AGENCYBY GENDER AT 1 APRIL 2000
d maintables 20-56 22/8/01, 10:44 am33

CIVIL SERVICE STATISTICS 2000
34
NORTHERN IRELAND OFFICE 90 90 170 0 20 30 0 0 0 0 0
Privy Council Office 10 20 30 0 0 0 0 0 0 0 0
SCOTLAND
Scottish Executive 2,050 1,560 3,610 10 310 320 0 0 0 0 0
Fisheries Research Services 170 80 250 0 10 10 0 0 0 0 0
Historic Scotland 250 200 450 10 40 50 220 0 220 0 0
Scottish Agricultural Science Agency 60 60 110 0 10 10 10 0 10 0 0
Scottish Court Service 360 360 720 40 100 130 0 0 0 0 0
Scottish Fisheries Protection Agency 150 40 190 10 10 20 70 0 70 0 0
Scottish Public Pensions Agency 80 70 150 0 10 10 0 0 0 0 0
Scottish Prison Service 3,760 780 4,540 90 70 170 10 0 10 0 0
Student Awards Agency for Scotland 50 70 120 0 10 10 0 0 0 0 0
Scottish Executive TOTAL 6,940 3,210 10,140 170 560 730 310 0 310 0 0
Crown Office and Procurator Fiscal 380 640 1,020 0 160 160 0 0 0 0 0
General Register Office – Scotland 120 100 220 0 20 20 0 0 0 0 0
National Archive of Scotland 70 40 110 0 10 20 0 0 0 0 0
Registers of Scotland 670 500 1,170 10 170 180 0 0 0 0 0
Scotland Office 20 20 40 0 0 0 0 0 0 0 0
SOCIAL SECURITY
Department of Social Security (excl. agencies) 1,290 1,360 2,640 40 290 330 0 0 0 0 0
Benefits Agency 21,770 35,250 57,020 890 16,770 17,660 0 0 0 0 0
Child Support Agency 2,730 4,420 7,150 180 1,890 2,060 0 0 0 0 0
IT Services Agency 1,150 710 1,860 10 160 160 0 0 0 0 0
War Pensions Agency 270 500 780 10 200 210 0 0 0 0 0
Department of Social Security TOTAL 27,210 42,240 69,450 1,120 19,310 20,430 0 0 0 0 0
TRADE AND INDUSTRY
Department of Trade and Industry (excl. agencies)4 2,690 1,760 4,460 40 330 370 0 0 0 0 0
Companies House 320 320 650 30 240 270 0 0 0 0 0
Employment Tribunals Service 210 330 540 0 70 70 0 0 0 0 0
Insolvency Service 690 540 1,230 20 160 170 0 0 0 0 0
National Weights & Measures Laboratory 40 10 50 0 10 10 0 0 0 0 0
Patent Office 490 300 790 10 50 60 0 0 0 0 0
Radiocommunications Agency 410 100 500 0 20 20 0 0 0 0 0
Department of Trade and Industry TOTAL 4,840 3,360 8,200 110 880 980 0 0 0 0 0
Advisory Conciliation and Arbitration Service (ACAS) 360 330 690 0 80 80 0 0 0 0 0
Export Credit Guarantee Department 240 110 350 0 20 30 0 0 0 0 0
Office of Fair Trading 230 200 430 0 10 10 0 0 0 0 0
OFGEM 220 190 410 0 20 20 0 0 0 0 0
Office of Telecommunications 110 80 200 0 0 0 0 0 0 0 0
WALES
National Assembly for Wales 1,170 1,070 2,240 10 210 210 0 0 0 0 0
Cadw (Welsh Historic Monuments) (WO) 70 60 120 0 20 20 60 0 60 0 0
National Assembly for Wales TOTAL 1,240 1,120 2,360 10 220 230 60 0 60 0 0
Office of HM Chief Inspector of Schools in Wales (Estyn) 30 40 70 0 0 0 0 0 0 0 0
Office of the Secretary of State for Wales 10 20 30 0 0 0 0 0 0 0 0
NON-INDUSTRIAL STAFF INDUSTRIAL STAFF
Full-time Part-time Full-time
DEPARTMENTS AND AGENCIES(1) Male Female Total Male Female Total Male Female Total
TABLE B: PERMANENT STAFF IN POST FOR EACH DEPARTMENT AND EXECUTIVE AGENCYBY GENDER AT 1 APRIL 2000
d maintables 20-56 22/8/01, 10:44 am34

CIVIL SERVICE STATISTICS 2000
35
0 0 0 0 0 0 90 100 190 0 0 0 NORTHERN IRELAND OFFICE
0 0 0 0 0 0 10 20 30 0 0 0 Privy Council Office
SCOTLAND
0 0 0 0 0 0 2,060 1,750 3,810 0 0 0 Scottish Executive
0 0 0 0 0 0 170 80 250 0 0 0 Fisheries Research Services
220 0 220 0 0 0 250 220 470 220 0 220 Historic Scotland
10 0 10 0 0 0 60 70 120 10 0 10 Scottish Agricultural Science Agency
0 0 0 0 0 0 390 410 800 0 0 0 Scottish Court Service
70 0 70 0 0 0 160 50 200 70 0 70 Scottish Fisheries Protection Agency
0 0 0 0 0 0 80 80 160 0 0 0 Scottish Public Pensions Agency
10 0 10 0 0 0 3,790 820 4,610 10 0 10 Scottish Prison Service
0 0 0 0 0 0 50 70 120 0 0 0 Student Awards Agency for Scotland
310 0 310 0 0 0 7,010 3,530 10,540 310 0 310 Scottish Executive TOTAL
0 0 0 0 0 0 380 730 1,120 0 0 0 Crown Office and Procurator Fiscal
0 0 0 0 0 0 120 110 230 0 0 0 General Register Office – Scotland
0 0 0 0 0 0 70 50 120 0 0 0 National Archive of Scotland
0 0 0 0 0 0 680 610 1,280 0 0 0 Registers of Scotland
0 0 0 0 0 0 20 20 40 0 0 0 Scotland Office
SOCIAL SECURITY
0 0 0 0 0 0 1,320 1,560 2,880 0 0 0 Department of Social Security (excl. agencies)
0 0 0 0 0 0 22,440 46,790 69,230 0 0 0 Benefits Agency
0 0 0 0 0 0 2,850 5,670 8,520 0 0 0 Child Support Agency
0 0 0 0 0 0 1,150 820 1,970 0 0 0 IT Services Agency
0 0 0 0 0 0 280 650 930 0 0 0 War Pensions Agency
0 0 0 0 0 0 28,040 55,490 83,530 0 0 0 Department of Social Security TOTAL
TRADE AND INDUSTRY
0 0 0 0 0 0 2,720 1,980 4,700 0 0 0 Department of Trade and Industry (excl. agencies)4
0 0 0 0 0 0 340 470 810 0 0 0 Companies House
0 0 0 0 0 0 210 370 580 0 0 0 Employment Tribunals Service
0 0 0 0 0 0 700 640 1,340 0 0 0 Insolvency Service
0 0 0 0 0 0 40 20 50 0 0 0 National Weights & Measures Laboratory
0 0 0 0 0 0 500 330 830 0 0 0 Patent Office
0 0 0 0 0 0 410 110 520 0 0 0 Radiocommunications Agency
0 0 0 0 0 0 4,910 3,930 8,840 0 0 0 Department of Trade and Industry TOTAL
0 0 0 0 0 0 360 380 740 0 0 0 Advisory Conciliation and Arbitration Service (ACAS)
0 0 0 0 0 0 240 130 370 0 0 0 Export Credit Guarantee Department
0 0 0 0 0 0 230 210 440 0 0 0
0 0 0 0 0 0 220 200 420 0 0 0
0 0 0 0 0 0 110 90 200 0 0 0 Office of Telecommunications
WALES
0 0 0 0 0 0 1,180 1,200 2,370 0 0 0 National Assembly for Wales
60 0 60 0 0 0 70 60 130 60 0 60 Cadw (Welsh Historic Monuments) (WO)
60 0 60 0 0 0 1,240 1,260 2,510 60 0 60 National Assembly for Wales TOTAL
0 0 0 0 0 0 30 40 70 0 0 0 Office of HM Chief Inspector of Schools in Wales (Estyn)
0 0 0 0 0 0 10 20 30 0 0 0 Office of the Secretary of State for Wales
INDUSTRIAL STAFF NON-INDUSTRIAL FTE INDUSTRIAL FTE
Part-time
Male Female Total Male Female Total Male Female Total DEPARTMENTS AND AGENCIES(1)
TABLE B: PERMANENT STAFF IN POST FOR EACH DEPARTMENT AND EXECUTIVE AGENCYBY GENDER AT 1 APRIL 2000
d maintables 20-56 22/8/01, 10:44 am35

CIVIL SERVICE STATISTICS 2000
36
TABLE C: STAFF NUMBERS IN EACH DEPARTMENT AND EXECUTIVE AGENCY,1994 TO 2000(1)
AT 1 APRIL: FULL-TIME EQUIVALENTS(2)PERMANENT STAFF
DEPARTMENT/AGENCY(3) 1994 1995 1996 1997 1998 1999R 2000
TOTAL STAFF IN:ALL DEPARTMENTS AND AGENCIES 540,290 516,890 494,570 475,340 463,270 459,600 475,420Of whom:EXECUTIVE AGENCIES~ 255,660 266,650 275,210 285,530 277,480 270,620 278,940CUSTOMS AND EXCISE‡ 25,420 24,130 23,190 23,070 23,400 22,520 21,910INLAND REVENUE‡ 58,540 54,560 52,010 49,730 49,380 57,460 62,460CROWN PROSECUTION SERVICE‡ .. .. .. 5,670 5,490 5,350 5,450SERIOUS FRAUD OFFICE‡ .. .. .. 160 150 140 170TOTAL ON NEXT STEPS LINES 339,620 345,340 350,410 364,160 355,900 356,080 368,920
AGRICULTURE, FISHERIES AND FOODMinistry of Agriculture, Fisheries and Food (excl. agencies) 6,800 6,400 6,100 5,650 5,810 6,270 6,630
ADAS^ 2,200 1,850 1,590 .. .. .. ..Centre for Environment, Fisheries and Aquaculture Science† .. .. .. 410 410 430 460Central Science Laboratory† 430 610 560 520 550 540 570Central Veterinary Laboratory 640 630 .. .. .. .. ..Farming and Rural Conservation Agency^† .. .. .. 440 530 520 510Meat Hygiene Service4 .. 810 780 800 1,030 1,380 ..Pesticides Safety Directorate† 170 170 190 190 190 200 200Veterinary Laboratories Agency† .. .. 680 990 1,030 1,050 1,090Veterinary Medicines Directorate† 90 80 100 100 100 110 120
Ministry of Agriculture, Fisheries and Food TOTAL 10,330 10,570 9,990 9,090 9,660 10,490 9,590Intervention Board† 930 890 850 970 1,100 1,190 1,230
ATTORNEY GENERALCrown Prosecution Service‡ 6,490 6,440 6,220 5,670 5,490 5,350 5,450Legal Secretariat 30 30 30 20 30 30 30Serious Fraud Office‡ 140 130 160 160 150 140 170
Treasury Solicitor’s Department†4 390 370 380 380 370 370 ..Government Property Lawyers4 130 120 110 100 90 80 ..
Treasury Solicitor’s Department TOTAL 510 490 490 480 470 450 420
CABINET OFFICECabinet Office (excl. agencies)4 .. .. .. .. .. 1,560 1,750Cabinet Office (excl. Office of Public Service)4 400 640 600 600 650 .. ..Office of Public Service (excl. agencies)4 900 880 460 430 410 .. ..
Chessington Computer Centre 420 400 380 .. .. .. ..CCTA4 .. .. 260 180 170 190 ..Civil Service College4 260 260 250 230 220 220 ..Government Car and Despatch Agency† .. .. .. 220 220 230 230Occupational Health and Safety Agency 120 100 100 .. .. .. ..Property Advisers to the Civil Estate (PACE)4 .. .. 280 200 190 80 ..Recruitment & Assessment Services Agency 140 130 140 .. .. .. ..Security Facilities Executive (SAFE) .. .. 1,090 570 470 .. ..The Buying Agency4 .. .. 120 140 130 130 ..
Cabinet Office (inc. Office of Public Service) TOTAL 1,840 1,770 3,090 1,970 1,820 2,510 1,980Central Office of Information*† 510 510 440 370 310 340 360HM Stationery Office 3,010 2,910 2,710 .. .. .. ..Privy Council Office4 40 40 40 30 30 30 ..Security and Intelligence Services 6,530 5,900 5,420 4,900 4,810 4,690 4,520
CHANCELLOR OF THE EXCHEQUERTreasury 1,400 1,130 960 890 890 890 830Office of Government Commerce4 .. .. .. .. .. .. 30CCTA†4 .. .. .. .. .. .. 210Property Advisers to the Civil Estate (PACE)†4 .. .. .. .. .. .. 170The Buying Agency*†4 .. .. .. .. .. .. 120Office of Government Commerce TOTAL .. .. .. .. .. .. 530Central Statistical Office 1,280 1,270 .. .. .. .. ..Customs & Excise‡ 25,420 24,130 23,190 23,070 23,400 22,520 21,910
d maintables 20-56 22/8/01, 10:44 am36

CIVIL SERVICE STATISTICS 2000
37
TABLE C: STAFF NUMBERS IN EACH DEPARTMENT AND EXECUTIVE AGENCY,1994 TO 2000(1)
PERMANENT STAFF
DEPARTMENT/AGENCY(3) 1994 1995 1996 1997 1998 1999R 2000
AT 1 APRIL: FULL-TIME EQUIVALENTS(2)
Debt Management Office .. .. .. .. 20 20 30Government Actuary 80 80 80 80 80 90 100
Inland Revenue (excl. agency)‡ 58,540 54,560 52,010 49,730 49,380 57,460 62,460Valuation Office 4,980 4,530 4,460 4,300 4,030 3,890 3,880
Inland Revenue TOTAL 63,520 59,090 56,470 54,030 53,410 61,340 66,330Department for National Savings† 5,750 5,450 4,670 4,290 4,080 110 110National Investment and Loans Office 40 30 30 40 40 40 30Office for National Statistics .. .. 3,140 2,890 2,970 2,910 2,870Registry of Friendly Societies 180 170 160 170 150 50 50Royal Mint*† 960 970 1,000 990 960 990 1,040Paymaster 780 600 620 .. .. .. ..
CULTURE, MEDIA AND SPORTNational Heritage (excl. agencies) 320 370 340 340 .. .. ..
Historic Royal Palaces Agency 470 390 410 450 .. .. ..Royal Parks Agency 250 260 250 220 .. .. ..
National Heritage TOTAL 1,040 1,020 1,000 1,000 .. .. ..Office of the National Lottery 10 20 30 30 .. .. ..
Culture, Media and Sport (excl. agencies) .. .. .. .. 380 350 400Royal Parks Agency† .. .. .. .. 230 230 220
Culture, Media and Sport TOTAL .. .. .. .. 610 580 620Office of the National Lottery .. .. .. .. 20 .. ..
DEFENCEØ
Ministry of Defence (excl. agencies) 95,620 83,740 64,610 46,790 44,640 39,810 37,670Armed Forces Personnel Administration Agency† .. .. .. 850 110 100 120Army Base Repair Organisation† 3,460 3,260 3,140 2,950 2,720 2,490 2,500Army Base Storage & Distribution Agency .. .. 3,810 3,700 3,370 .. ..Army Individual Training Organisation .. .. 4,190 .. .. .. ..Army Technical Support Agency .. .. 810 .. .. .. ..Army Training and Recruiting Agency† .. .. .. 4,410 4,490 4,250 4,310Army Personnel Centre† .. .. .. 1,270 1,060 1,120 1,190Army Technical Support Agency4 .. .. .. 800 810 770 ..Chemical Biological Defence Est 620 .. .. .. .. .. ..Defence Accounts Agency 2,000 1,790 .. .. .. .. ..Defence Analytical Services Agency† 120 100 110 120 120 100 120Defence Animal Centre 40 40 50 60 60 .. ..Defence Operational Analysis Centre 160 .. .. .. .. .. ..Defence Aviation Repair Agency† .. .. .. .. .. 4,860 4,770Defence Bills Agency† .. .. 650 650 680 640 600Defence Clothing and Textile Agency† .. 490 490 530 510 510 480Defence Codification Agency† .. .. .. 150 120 .. ..Defence Communication Services Agency† .. .. .. .. 520 650 1,440Defence Dental Agency† .. .. 10 110 130 150 170Defence Estates Organisation† .. .. .. 1,170 1,110 1,190 1,210Defence Evaluation and Research Agency*† .. 11,250 11,020 12,220 10,670 10,330 11,130Defence Evaluation Postal & Courier Services .. 250 .. .. .. .. ..Defence Housing Executive†4 .. .. .. .. .. .. 950Defence Intelligence and Security Centre† .. .. .. 100 140 140 140Defence Medical Training Organisation† .. .. .. 80 100 160 160Defence Postal & Courier Services Agency† 270 .. 300 330 330 330 350Defence Procurement Agency† .. .. .. .. .. 4,940 3,930Defence Research Agency 8,770 .. .. .. .. .. ..Disposal Sales Agency .. 70 .. .. .. .. ..Defence Secondary Care Agency† .. .. .. 590 690 770 720Defence Storage & Distribution Agency† .. .. .. .. .. 3,070 3,620Defence Transport & Movement Executive† .. .. 140 140 150 170 210Defence Vetting Agency† .. .. .. 50 340 340 360Disposal Sales Agency† .. .. 60 60 60 60 80
d maintables 20-56 22/8/01, 10:44 am37

CIVIL SERVICE STATISTICS 2000
38
PERMANENT STAFF
DEPARTMENT/AGENCY(3) 1994 1995 1996 1997 1998 1999R 2000
TABLE C: STAFF NUMBERS IN EACH DEPARTMENT AND EXECUTIVE AGENCY,1994 TO 2000(1)
Duke of York’s Royal Military School† 100 90 100 100 100 100 100Flag Officer Naval Training/Reserves .. 1,470 .. .. .. .. ..Hydrographer of the Navy*†4 .. .. .. .. .. .. 830Joint Air Reconnaissance Intelligence Centre† .. .. .. 140 150 140 160Logistic Information Systems Agency† .. 310 200 160 190 200 230Maintenance Group Defence Agency .. 4,490 .. .. .. .. ..Medical Supplies Agency† .. .. 170 220 230 240 250Meteorological Office*† 2,410 2,190 2,180 2,090 2,140 2,000 2,240Military Survey† 800 770 770 710 690 690 680Ministry of Defence Police† .. .. 3,880 3,730 3,590 3,510 3,450Naval Aircraft Repair Organisation 1,530 1,530 1,520 1,540 1,520 .. ..Naval Bases and Supplies Agency† .. .. .. 9,170 7,820 7,780 7,620Naval Manning Agency† .. .. .. 80 100 90 100Naval Recruiting and Training Agency† .. .. 1,560 1,580 1,500 1,190 1,190Pay and Personnel Agency† .. .. 910 900 850 670 630Queen Victoria School† 70 70 60 70 70 70 70RAF Logistics Support Services† .. .. .. 440 370 500 550RAF Maintenance Group Defence Agency 4,560 .. 4,520 4,460 4,380 .. ..RAF Personnel Management Agency† .. .. .. 210 220 230 220RAF Signals Engineering Establishment† .. 720 660 570 580 580 730RAF Training Group Defence Agency† .. 2,080 2,420 2,130 2,160 2,090 2,070Service Children’s Education† 880 640 770 750 710 720 710Ship Support Agency† .. .. .. 2,300 2,290 2,330 2,650Specialist Procurement Services .. .. .. .. 820 .. ..UK Hydrographic Office*4 820 790 750 750 750 760 ..
Ministry of Defence TOTAL 122,240 116,140 109,860 109,210 104,160 100,830 100,330
EDUCATION AND EMPLOYMENTDepartment for Education (excl. agency) 1,610 1,630 .. .. .. .. ..
Teachers’ Pensions Agency 330 390 .. .. .. .. ..EDUCATION TOTAL 1,940 2,030 .. .. .. .. ..Office for Standards in Education 480 480 .. .. .. .. ..
Employment Department (excl. agency) 5,750 4,890 .. .. .. .. ..Employment Service Agency 43,740 39,850 .. .. .. .. ..
ACAS 630 600 .. .. .. .. ..Health & Safety Executive 4,400 4,230 .. .. .. .. ..EMPLOYMENT GROUP TOTAL 54,530 49,570 .. .. .. .. ..
Department for Education and Employment (excl. agency) .. .. 5,050 4,480 4,500 4,560 4,970Employment Service† .. .. 34,910 29,180 28,610 29,520 31,090
Teachers’ Pensions Agency .. .. 370 .. .. .. ..Department for Education and Employment (TOTAL) .. .. 40,330 33,660 33,120 34,090 36,060Office for Standards in Education .. .. 470 480 450 470 420
ENVIRONMENT, TRANSPORT AND REGIONSDepartment of the Environment (excl. agencies) 4,730 4,510 3,360 3,010 .. .. ..
Building Research Establishment† 690 670 660 .. .. .. ..Planning Inspectorate^ 600 580 590 630 .. .. ..QEII Conference Centre 70 60 70 50 .. .. ..Security Facilities Executive 1,060 1,120 .. .. .. .. ..The Buying Agency 100 110 .. .. .. .. ..
Department of the Environment TOTAL 7,240 7,050 4,680 3,690 .. .. ..Health & Safety Executive .. .. 4,020 3,970 .. .. ..Office of Water Services 160 160 180 170 .. .. ..Ordnance Survey 2,120 1,990 1,990 1,810 .. .. ..PSAS 550 210 .. .. .. .. ..
AT 1 APRIL: FULL-TIME EQUIVALENTS(2)
d maintables 20-56 22/8/01, 10:44 am38

CIVIL SERVICE STATISTICS 2000
39
PERMANENT STAFF AT 1 APRIL: FULL-TIME EQUIVALENTS(2)
DEPARTMENT/AGENCY(3) 1994 1995 1996 1997 1998 1999R 2000
TABLE C: STAFF NUMBERS IN EACH DEPARTMENT AND EXECUTIVE AGENCY,1994 TO 2000(1)
Department of Transport (excl. agencies) 2,420 2,300 1,970 1,660 .. .. ..Coastguard 550 540 540 650 .. .. ..Driver and Vehicle Licensing Agency 4,140 3,780 3,570 3,500 .. .. ..Driving Standards Agency 1,770 1,680 1,590 1,940 .. .. ..Highways Agency 2,320 2,130 1,520 1,550 .. .. ..Marine Safety Agency 380 390 340 310 .. .. ..Transport Research Laboratory 530 420 .. .. .. .. ..Vehicle Certification Agency 70 80 70 70 .. .. ..Vehicle Inspectorate 1,600 1,480 1,470 1,460 .. .. ..
Department of Transport TOTAL 13,790 12,790 11,070 11,150 .. .. ..Office of Passenger Rail Franchising 30 60 100 100 .. .. ..Office of the Rail Regulator 40 100 110 110 .. .. ..
Department of the Environment, Transport &Regions (excl. agencies) .. .. .. .. 4,760 4,540 4,830
Driver and Vehicle Licensing Agency† .. .. .. .. 3,930 4,140 4,540Driving Standards Agency† .. .. .. .. 1,760 1,710 1,660Highways Agency† .. .. .. .. 1,540 1,550 1,640Maritime and Coastguard Agency† .. .. .. .. 940 950 1,020Planning Inspectorate^† .. .. .. .. 640 630 670QEII Conference Centre† .. .. .. .. 60 50 50The Rent Service†4 .. .. .. .. .. .. 880Vehicle Certification Agency† .. .. .. .. 80 90 90Vehicle Inspectorate† .. .. .. .. 1,510 1,570 1,690
Department of the Environment, Transport and Regions TOTAL .. .. .. .. 15,220 15,230 17,070Health & Safety Executive .. .. .. .. 3,720 3,780 3,820Office of Passenger Rail Franchising .. .. .. .. 120 130 ..Office of the Rail Regulator .. .. .. .. 130 130 150Office of Water Services .. .. .. .. 170 190 200Ordnance Survey† .. .. .. .. 1,860 1,860 1,820Shadow Strategic Rail Authority .. .. .. .. .. .. 180
FOREIGN AND COMMONWEALTH Foreign and Commonwealth Office (excl. agency) 6,290 5,950 5,790 5,540 5,410 5,430 5,420 Wilton Park 30 30 30 40 40 40 40Foreign and Commonwealth Office TOTAL 6,320 5,980 5,810 5,570 5,450 5,470 5,470
HEALTHDepartment of Health (excl. agencies) 3,680 3,440 3,730 3,680 3,490 3,540 3,570Medical Devices Agency .. 160 140 120 130 140 140Medicines Control Agency*† 400 340 360 390 440 450 440National Health Service Estates† 100 100 140 140 130 250 290National Health Service Pensions Agency† 540 450 430 360 400 430 430National Health Service Purchasing and Supply Agency†4 .. .. .. .. .. .. 280
Department of Health TOTAL 4,720 4,500 4,800 4,700 4,600 4,810 5,160Food Standards Agency4 .. .. .. .. .. .. 410Meat Hygiene Service4 .. .. .. .. .. .. 1,420
Food Standards Total .. .. .. .. .. .. 1,830OPCS 1,880 1,740 .. .. .. .. ..
HOMEHome Office (Main) (excl. agencies) 10,250 9,570 9,450 9,360 8,070 7,710 9,270
Fire Service College*† 260 260 230 220 250 190 180Forensic Science Service 670 670 1,040 1,180 1,240 1,640 1,780UK Passport Agency† 1,370 1,460 1,510 1,410 1,280 1,250 1,320
Home Office (Main) TOTAL 12,550 11,950 12,220 12,170 10,840 10,780 12,540Charity Commission 580 510 520 530 510 500 510HM Prison Service† 38,070 38,940 38,010 37,700 39,360 38,720 40,560
d maintables 20-56 22/8/01, 10:44 am39

CIVIL SERVICE STATISTICS 2000
40
PERMANENT STAFF
DEPARTMENT/AGENCY(3) 1994 1995 1996 1997 1998 1999R 2000
TABLE C: STAFF NUMBERS IN EACH DEPARTMENT AND EXECUTIVE AGENCY,1994 TO 2000(1)
INTERNATIONAL DEVELOPMENTOverseas Development AdministrationOverseas Development Administration (excl. agency) 1,140 1,090 1,010 1,000 .. .. ..
Natural Resources Institute 410 380 300 .. .. .. ..Overseas Development Administration TOTAL 1,560 1,470 1,310 1,000 .. .. ..
International Development, Department for .. .. .. .. 1,050 1,160 1,210
LORD CHANCELLORLord Chancellor’s Department 11,730 1,220 850 880 830 810 910Court Service† .. 9,840 9,830 9,200 8,670 8,890 9,200Public Trust Office† .. 540 550 550 540 530 530
Lord Chancellor’s Department TOTAL 11,730 11,600 11,230 10,620 10,050 10,230 10,640HM Land Registry† 8,920 8,510 8,150 7,870 7,810 7,790 7,750Public Record Office† 460 440 450 430 420 430 430
NORTHERN IRELAND OFFICE 210 210 210 200 200 220 190
Privy Council Office4 .. .. .. .. .. .. 30
SCOTLANDScottish Office (excl. agencies)4 4,730 4,270 3,820 3,510 3,440 3,710 ..Scottish Executive (excl. agencies)4 .. .. .. .. .. .. 3,810
Fisheries Research Services† .. .. .. 200 230 260 260Historic Scotland 650 630 570 590 630 680 690Scottish Agricultural Science Agency† 140 140 130 120 120 110 130Scottish Court Service†4 .. .. .. .. .. .. 800Scottish Fisheries Protection Agency† 250 240 240 250 260 270 270Scottish Office Pensions Agency4 180 160 170 150 140 140 ..Scottish Prison Service†4 .. .. .. .. .. .. 4,620Scottish Public Pensions Agency†4 .. .. .. .. .. .. 160Student Awards Agency for Scotland† 140 140 120 120 130 130 120
Scottish Office TOTAL4 6,090 5,580 5,050 4,950 4,940 5,290 ..Scottish Executive Total4 .. .. .. .. .. .. 10,850Crown Office and Procurator Fiscal 1,100 1,070 1,080 1,100 1,110 1,080 1,120General Register Office – Scotland 250 230 210 210 200 210 230Lord Advocates Department 20 20 20 20 20 .. ..Registers of Scotland*† 1,200 1,080 1,070 1,060 1,060 1,130 1,280Scottish Courts Administration4 .. .. .. 120 130 130 ..Scottish Court Service4 980 830 830 820 830 830 ..Scottish Prison Service4 4,530 4,230 4,440 4,510 4,700 4,820 ..National Archive for Scotland† .. .. .. .. .. 110 120Scottish Record Office 120 120 120 120 110 .. ..
Scotland Office4 .. .. .. .. .. .. 40
SOCIAL SECURITYDepartment of Social Security (excl. agencies) 2,920 2,790 2,750 2,680 2,770 2,860 2,880
Benefits Agency† 67,850 66,650 71,590 72,000 66,300 68,250 69,230Child Support Agency† 4,860 5,980 6,530 7,860 7,910 7,710 8,520Contributions Agency 10,010 8,900 7,460 7,380 7,380 .. ..IT Services Agency† 4,030 3,540 1,950 1,930 1,910 1,940 1,970Resettlement Agency 280 90 .. .. .. .. ..War Pensions Agency† .. 1,300 1,230 1,200 950 840 930
Department of Social Security TOTAL 89,960 89,250 91,520 93,060 87,220 81,600 83,530
AT 1 APRIL: FULL-TIME EQUIVALENTS(2)
d maintables 20-56 22/8/01, 10:44 am40

CIVIL SERVICE STATISTICS 2000
41
TABLE C: STAFF NUMBERS IN EACH DEPARTMENT AND EXECUTIVE AGENCY,1994 TO 2000(1)
PERMANENT STAFF AT 1 APRIL: FULL-TIME EQUIVALENTS(2)
DEPARTMENT/AGENCY(3) 1994 1995 1996 1997 1998 1999R 2000
TRADE AND INDUSTRYDepartment of Trade and Industry (excl. agencies) 5,510 5,140 5,680 4,500 4,430 4,450 4,700
Accounts Services Agency 90 .. .. .. .. .. ..Companies House† 980 950 870 800 840 850 810Employment Tribunals Service† .. .. .. 550 570 560 580Insolvency Service† 1,620 1,500 1,330 1,290 1,350 1,310 1,340Lab. of the Government Chemist 300 270 .. .. .. .. ..National Engineering Laboratory 280 250 .. .. .. .. ..National Physical Laboratory 700 670 .. .. .. .. ..National Weights & Measures Laboratory† 50 50 50 50 50 50 50Patent Office† 950 880 790 710 750 800 830Radiocommunications Agency† 530 540 510 510 510 480 520
Department of Trade and Industry TOTAL 11,020 10,250 9,230 8,400 8,490 8,520 8,840Advisory Conciliation and Arbitration Service (ACAS) .. .. 610 590 640 660 740Export Credit Guarantee Department 530 470 430 410 380 390 370Office of Electricity Regulation4 220 210 230 230 240 250 ..Office of Fair Trading 410 400 390 400 410 410 440Office of Gas Supply4 40 60 100 110 120 130 ..OFGEM4 .. .. .. .. .. .. 420Office of Telecommunications 150 160 160 160 160 170 200
WALES Welsh Office (excl. agency) 2,040 1,920 1,860 1,940 1,880 2,030 ..
National Assembly for Wales .. .. .. .. .. .. 2,380 Cadw (Welsh Historic Monuments) 230 230 210 180 170 170 190Welsh Office TOTAL 2,270 2,150 2,070 2,120 2,050 2,210 2,570Office of HM’s Chief Inspector of Schools (Wales)4 70 70 60 60 60 60 ..ESTYN (Office of the Chief Inspector of Schools in Wales)4 .. .. .. .. .. .. 70
Office of the Secretary of State for Wales4 .. .. .. .. .. .. 40
OTHERSCrown Estate Office 40 30 30 .. .. .. ..
Notes:(1) All figures include industrial and non-industrial staff. Casual staff are excluded.(2) Part-time staff are recorded according to the proportion of full-time hours worked.(3) Listed by Ministerial responsibility. Excludes Northern Ireland Civil Service and its agencies.(4) Annex A lists changes in machinery of Government.~ Excluding Executive Units of Customs and Excise, Executive Offices of Inland Revenue, the Crown Prosecution Service and Serious Fraud Office.
Defence figures do not include service personnel.^ Joint responsibility with the Welsh Office.‡ Departments operating fully on Next Steps lines:
Customs and Excise started to work on Next Steps lines on 1 April 1991.Inland Revenue (excluding the Valuation Office) started to work on Next Steps lines on 1 April 1992. Inland Revenue figure excludes the Valuation Office, which is a free-standing agency.Crown Prosecution Service started to work on Next Steps lines on 20 March 1997.Serious Fraud Office started to work on Next Steps lines on 20 March 1997.
R Revised Figures for 1999.
SOURCE: MANDATE AND DEPARTMENTAL RETURNS
d maintables 20-56 22/8/01, 10:44 am41

CIVIL SERVICE STATISTICS 2000
42
Agriculture, Fisheries and Food 3,030 770 3,800 1,210 440 880 110 0 1,540 4Cabinet Office 1,520 270 1,800 0 0 0 0 0 0Crown Prosecution Service 1,300 520 1,820 330 530 620 320 200 600 3Customs and Excise 5,510 3,530 9,040 940 1,040 1,490 520 1,040 910 8Culture, Media and Sport 620 0 620 0 0 0 0 0 0Ministry of Defence 8,640 22,620 31,260 22,770 8,010 1,320 490 840 2,990 2,6Education and Employment 6,850 2,340 9,190 2,360 2,830 3,480 2,500 960 5,630 1,9Environment, Transport and the Regions 4,350 870 5,220 1,760 790 730 370 80 740 5Health and Safety Executive/Commission 660 140 810 70 160 150 70 1,290 450 2Foreign and Commonwealth Office 4,600 40 4,640 0 0 0 0 0 0Health 2,480 290 2,780 230 230 690 130 0 1,040HM Land Registry 780 510 1,300 1,500 630 470 660 500 430 8Home Office 6,990 1,180 8,170 250 740 400 80 960 400HM Prison Service 4,720 6,930 11,650 3,050 3,830 4,270 3,040 780 4,550 3,5Inland Revenue 8,370 6,370 14,750 4,000 4,080 7,920 7,640 3,840 5,240 4,0International Development 720 0 720 0 0 0 0 0 0Intervention Board 0 950 950 0 0 0 280 0 0Lord Chancellor’s Department 5,490 1,070 6,560 400 710 750 130 320 520 4Office for National Statistics 730 640 1,380 0 0 100 0 540 0Ordnance Survey 20 1,420 1,450 50 40 40 20 10 40Registers of Scotland 0 0 0 0 0 0 0 0 0Scottish Executive 10 0 10 0 0 0 0 0 0Social Security 9,100 5,780 14,890 5,060 6,840 15,660 9,780 3,810 7,590 3,5Trade and Industry 4,750 250 4,990 240 410 290 220 50 310 1Treasury 830 0 830 0 0 0 0 0 0National Assembly for Wales 0 0 0 0 0 0 0 0 0Royal Mint 20 0 20 0 0 0 0 0 0Other Departments 4,080 120 4,200 5,040 750 250 430 220 100 1
ALL PERMANENT STAFF 86,190 56,630 142,820 49,250 32,080 39,504 26,780 15,440 33,060 19,6
All casual staff 1,790 1,090 2,990 610 615 815 800 330 680 3
TABLE D: REGIONAL DISTRIBUTION OF STAFF AT 1 APRIL 2000
GOVERNMENT OFFICE REGION
LONDON AND SOUTH EAST
Total London South West North North
London South East and South East West Midlands West East Merseyside
Department (Including agencies)
d maintables 20-56 22/8/01, 10:44 am42

CIVIL SERVICE STATISTICS 2000
43
110 0 1,540 400 860 200 110 0 30 9,590 Agriculture, Fisheries and Food0 0 0 0 20 10 0 0 150 1,980 Cabinet Office
320 200 600 380 300 350 0 0 0 5,450 Crown Prosecution Service520 1,040 910 850 3,730 490 1,270 530 50 21,910 Customs and Excise
0 0 0 0 0 0 0 0 0 620 Culture, Media and Sport490 840 2,990 2,630 6,400 4,980 9,400 3,230 6,040 100,330 Ministry of Defence
2,500 960 5,630 1,920 1,940 1,890 3,360 0 0 36,060 Education and Employment370 80 740 550 840 3,690 390 0 1,930 17,070 Environment, Transport and the Regions70 1,290 450 270 180 110 280 0 0 3,820 Health and Safety Executive/Commission
0 0 0 0 820 0 0 0 0 5,470 Foreign and Commonwealth Office130 0 1,040 20 20 0 0 0 10 5,160 Health660 500 430 850 820 590 0 0 0 7,750 HM Land Registry80 960 400 40 610 460 240 130 50 12,550 Home Office
3,040 780 4,550 3,500 3,750 750 0 0 1,370 40,560 HM Prison Service7,640 3,840 5,240 4,010 3,510 3,870 6,090 1,400 10 66,330 Inland Revenue
0 0 0 0 0 0 430 0 50 1,210 International Development280 0 0 0 0 0 0 0 0 1,230 Intervention Board130 320 520 410 570 270 0 0 0 10,640 Lord Chancellor’s Department
0 540 0 0 0 850 0 0 0 2,870 Office for National Statistics20 10 40 40 50 30 50 0 0 1,820 Ordnance Survey
0 0 0 0 0 0 1,280 0 0 1,280 Registers of Scotland0 0 0 0 0 0 10,340 0 500 10,850 Scottish Executive
9,780 3,810 7,590 3,500 3,350 3,880 9,160 10 10 83,530 Social Security220 50 310 190 200 1,690 230 10 10 8,840 Trade and Industry
0 0 0 0 0 0 0 0 0 830 Treasury0 0 0 0 0 2,570 0 0 0 2,570 National Assembly for Wales0 0 0 0 0 1,020 0 0 0 1,030 Royal Mint
430 220 100 100 270 380 1,750 110 480 14,080 Other Departments
26,780 15,440 33,060 19,650 28,220 28,080 44,390 5,400 10,710 475,410 ALL PERMANENT STAFF
800 330 680 340 550 950 1,090 40 1,600 11,300 All casual staff
FULL-TIME EQUIVALENTS(1)
GOVERNMENT OFFICE REGION
Yorkshire & East Northern Unreported & All
Humberside Midlands Eastern Wales Scotland Ireland elsewhere areas Department (including agencies)
TABLE D: REGIONAL DISTRIBUTION OF STAFF AT 1 APRIL 2000
d maintables 20-56 22/8/01, 10:44 am43

CIVIL SERVICE STATISTICS 2000
44
TABLE E: STAFF NUMBERS BY RESPONSIBILITY LEVEL AND GENDER, 1997 TO 2000
ALL NON-INDUSTRIAL STAFF 214,880 176,360 391,230 3,510 55,070 58,580 217,160 212,140 429,300SCS level 2,940 540 3,480 40 80 120 2,970 600 3,5706 and 7 16,750 4,120 20,870 300 950 1,250 16,940 4,760 21,690Senior/Higher Executive Officer 52,780 17,960 70,740 550 2,920 3,470 53,080 19,930 73,010Executive Officer 53,490 41,010 94,500 660 12,310 12,970 53,920 49,180 103,110Administrative Officer/Assistant 88,730 112,560 201,290 1,960 38,780 40,740 90,050 137,480 227,540Unknown 190 170 360 0 30 30 190 190 380
ALL INDUSTRIAL STAFF 26,490 3,620 30,110 160 910 1,070 26,590 4,160 30,750ALL STAFF 241,370 179,980 421,350 3,670 55,980 59,650 243,750 216,300 460,050
1 APRIL 2000 HEADCOUNT HEADCOUNT FULL-TIME EQUIVALENTWHOLE-TIME STAFF PART-TIME STAFF ALL STAFF(2)
RESPONSIBILITY LEVEL MALE FEMALE TOTAL MALE FEMALE TOTAL MALE FEMALE TOTAL
1 APRIL 1999 HEADCOUNT HEADCOUNT FULL-TIME EQUIVALENTWHOLE-TIME STAFF PART-TIME STAFF ALL STAFF(2)
RESPONSIBILITY LEVEL MALE FEMALE TOTAL MALE FEMALE TOTAL MALE FEMALE TOTAL
1 APRIL 1998 HEADCOUNT HEADCOUNT FULL-TIME EQUIVALENTWHOLE-TIME STAFF PART-TIME STAFF ALL STAFF(2)
RESPONSIBILITY LEVEL MALE FEMALE TOTAL MALE FEMALE TOTAL MALE FEMALE TOTAL
1 APRIL 1997 HEADCOUNT HEADCOUNT FULL-TIME EQUIVALENTWHOLE-TIME STAFF PART-TIME STAFF ALL STAFF(2)
RESPONSIBILITY LEVEL MALE FEMALE TOTAL MALE FEMALE TOTAL MALE FEMALE TOTAL
SOURCE: MANDATE AND DEPARTMENTAL RETURNS(1) This table shows staff in their substantive responsibility level unless on temporary promotion, in which case staff are recorded at the higher responsibility level.(2) Part-time staff are recorded according to the proportion of full-time hours worked.
NON-INDUSTRIAL STAFF(1)
ALL NON-INDUSTRIAL STAFF 220,380 183,330 403,710 4,110 59,950 64,060 223,150 222,820 445,970SCS level 2,980 660 3,640 40 80 130 3,000 720 3,7206 and 7 16,900 4,530 21,430 320 990 1,320 17,110 5,210 22,320Senior/Higher Executive Officer 51,440 19,470 70,910 530 3,480 4,020 51,800 21,880 73,670Executive Officer 56,010 43,740 99,750 830 14,010 14,830 56,560 53,340 109,890Administrative Officer/Assistant 91,390 114,110 205,500 2,370 41,220 43,590 93,030 140,720 233,750Unknown 1,660 820 2,480 10 170 190 1,650 960 2,610
ALL INDUSTRIAL STAFF 25,380 3,440 28,820 140 910 1,050 25,470 3,970 29,440ALL STAFF 245,760 186,770 432,530 4,250 60,860 65,110 248,620 226,790 475,410
ALL NON-INDUSTRIAL STAFF 217,010 177,080 394,090 3,410 53,440 56,850 219,130 211,330 430,460SCS level 3,100 540 3,630 40 80 120 3,120 590 3,7206 and 7 16,490 3,930 20,420 290 850 1,150 16,630 4,500 21,130Senior/Higher Executive Officer 51,440 16,660 68,100 470 2,590 3,070 51,680 18,380 70,060Executive Officer 56,400 40,910 97,310 510 11,330 11,840 56,740 48,330 105,070Administrative Officer/Assistant 89,590 115,050 204,640 2,090 38,580 40,670 90,940 139,530 230,480
ALL INDUSTRIAL STAFF 28,220 3,890 32,120 160 990 1,150 28,320 4,490 32,800ALL STAFF 245,230 180,970 426,210 3,570 54,430 59,730 247,450 215,820 463,260
ALL NON-INDUSTRIAL STAFF 221,360 182,960 404,320 3,240 51,720 54,970 223,410 215,890 439,310SCS level 3,140 490 3,630 40 70 100 3,160 540 3,7006 and 7 15,890 3,250 19,130 290 660 940 16,060 3,680 19,740Senior/Higher Executive Officer 51,800 16,600 68,400 630 2,530 3,160 52,160 18,250 70,420Executive Officer 58,360 41,890 100,250 490 11,080 11,570 58,700 49,130 107,830Administrative Officer/Assistant 92,180 120,730 212,900 1,790 37,400 39,190 93,330 144,290 237,620
ALL INDUSTRIAL STAFF 30,790 4,460 35,260 150 1,140 1,290 30,890 5,140 36,030ALL STAFF 252,150 187,420 439,580 3,390 52,860 58,140 254,300 221,030 475,340
d maintables 20-56 22/8/01, 10:44 am44

CIVIL SERVICE STATISTICS 2000
45
TABLE F: STAFF NUMBERS BY GROSS SALARY BAND AND GENDER, 1999 AND 2000
1 APRIL 2000 HEADCOUNT HEADCOUNT FULL-TIME EQUIVALENTWHOLE-TIME STAFF PART-TIME STAFF ALL STAFF(2)
SALARY BAND(1) MALE FEMALE TOTAL MALE FEMALE TOTAL MALE FEMALE TOTAL
NON-INDUSTRIAL STAFF
STAFF IN POSTNON-INDUSTRIAL STAFF
1 APRIL 1999 HEADCOUNT HEADCOUNT FULL-TIME EQUIVALENTWHOLE-TIME STAFF PART-TIME STAFF ALL STAFF(2)
SALARY BAND(1) MALE FEMALE TOTAL(3) MALE FEMALE TOTAL(3) MALE FEMALE TOTAL
NON-INDUSTRIAL STAFF
£1–5,000 0 0 0 0 0 0 0 0 0£5,001–10,000 12,610 18,980 31,590 640 6,010 6,640 13,000 22,670 35,670£10,001–15,000 52,350 84,960 137,310 1,340 31,560 32,910 53,250 105,410 158,670£15,001–20,000 48,230 43,640 91,870 580 11,910 12,480 48,630 51,600 100,230£20,001–25,000 51,100 17,080 68,180 260 2,730 2,990 51,280 18,930 70,220£25,001–30,000 21,720 5,460 27,180 140 780 920 21,810 5,990 27,790£30,001–35,000 10,660 2,250 12,900 80 360 440 10,710 2,490 13,200£35,001–40,000 6,560 1,240 7,810 80 340 420 6,620 1,470 8,090£40,001–45,000 4,510 870 5,370 120 190 320 4,550 990 5,540£45,001–50,000 2,440 390 2,830 20 50 80 2,460 420 2,880£50,001–55,000 1,400 230 1,630 20 30 50 1,410 250 1,670£55,001–60,000 990 160 1,160 20 40 50 1,000 190 1,190£60,001–65,000 500 80 590 0 10 20 510 90 600£65,001–70,000 310 50 360 10 10 10 310 50 360£70,001–75,000 170 20 190 0 0 10 170 20 190£75,001+ 340 50 390 10 0 10 350 50 400Not reported 990 890 1,900 190 1,050 1,230 1,080 1,510 2,590
TOTAL 214,870 176,350 391,240 3,510 55,070 58,570 217,150 212,130 429,300
Lower quartile(4) £13,650 £11,820 £12,680 £10,570 £11,880 £11,810 £13,640 £11,840 £12,520Median(4) £19,430 £13,820 £16,460 £13,510 £13,390 £13,390 £19,370 £13,600 £15,550Upper quartile(4) £24,310 £17,870 £21,830 £19,600 £16,500 £16,670 £24,230 £17,590 £21,100
SOURCES: MANDATE AND DEPARTMENTAL RETURNS(1) Salary in this table is gross salary and rounded to the nearest 10. See Definitions and Sources, page 65.(2) Part–time staff are assigned to the salary band corresponding to their full–time equivalent salary.(3) Includes a few staff whose gender was not specified in 1999.(4) Pay quartiles calculated using new method (see Annex B).
£1–5,000 0 0 0 0 0 0 0 0 0£5,001–10,000 9,390 14,580 23,960 490 4,970 5,460 9,700 17,590 27,290£10,001–15,000 54,840 86,570 141,410 1,730 32,870 34,600 56,040 108,060 164,100£15,001–20,000 46,250 46,890 93,140 720 14,350 15,070 46,730 56,720 103,450£20,001–25,000 52,580 19,560 72,140 370 3,610 3,970 52,840 22,060 74,900£25,001–30,000 23,480 6,420 29,900 160 1,090 1,250 23,600 7,170 30,770£30,001–35,000 11,910 2,700 14,610 110 420 530 11,980 2,980 14,970£35,001–40,000 6,690 1,380 8,070 80 370 450 6,750 1,630 8,370£40,001–45,000 4,830 1,000 5,820 70 270 340 4,870 1,180 6,060£45,001–50,000 2,740 590 3,330 40 100 140 2,770 660 3,430£50,001–55,000 1,690 260 1,950 20 40 60 1,700 290 1,990£55,001–60,000 970 170 1,130 20 30 40 980 190 1,160£60,001–65,000 700 130 830 10 20 30 700 150 850£65,001–70,000 280 50 330 0 10 10 290 50 340£70,001–75,000 260 50 310 0 0 0 260 50 310£75,000+ 420 70 490 10 0 20 420 70 500Not reported 3,380 2,920 6,310 280 1,810 2,090 3,510 3,980 7,490
TOTAL 220,380 183,340 403,720 4,110 59,950 64,060 223,140 222,830 445,970
Lower quartile(4) £14,060 £12,030 £13,020 £10,450 £12,120 £11,940 £13,990 £12,060 £12,770Median(4) £19,970 £14,360 £16,990 £13,790 £13,840 £13,840 £19,680 £14,130 £15,850Upper quartile(4) £25,030 £18,560 £22,380 £17,770 £16,900 £17,060 £24,970 £18,130 £21,630
d maintables 20-56 22/8/01, 10:44 am45

CIVIL SERVICE STATISTICS 2000
46
TABLE G: STAFF NUMBERS IN MAJOR DEPARTMENTS BY SALARY BAND, 1999 AND 2000(1)
NON-INDUSTRIAL STAFFDEPARTMENT
MINISTRY OF FOR EDUCATION DEPARTMENT OFAGRICULTURE, AND EMPLOYMENT THE ENVIRONMENT, HOME OFFICE
FISHERIES CUSTOMS MINISTRY OF (inc. Employment TRANSPORT AND (inc. HM Prison
AND FOOD AND EXCISE DEFENCE Service) THE REGIONS Service)
1 APRIL 2000£5,001–10,000 800 1,170 5,320 370 1,430 700 6,840£10,001–15,000 4,270 4,750 22,090 19,150 4,800 11,110 25,040£15,001–20,000 2,230 5,460 15,140 11,770 3,970 9,660 15,180£20,001–25,000 1,340 4,730 14,710 2,900 2,260 20,190 9,420£25,001–30,000 800 3,290 7,560 820 1,000 3,630 5,300£30,001–35,000 440 1,510 4,050 420 760 1,310 1,300£35,001–40,000 310 550 1,840 270 510 750 1,050£40,001–45,000 260 210 1,070 160 440 390 900£45,001–50,000 130 100 520 50 180 260 490£50,001–55,000 50 30 280 40 90 120 460£55,001–60,000 30 30 110 30 80 100 190£60,001–65,000 30 10 90 30 60 80 70£65,001–70,000 10 10 30 10 30 10 40£70,001–75,000 10 10 20 10 30 10 20£75,000+ 10 10 30 20 30 30 20Not reported 30 50 2,370 0 1,260 1,970 10
TOTAL 10,770 21,910 75,220 36,060 16,910 50,320 66,330
Lower quartile(4) £11,730 £11,470 £13,190 £12,910 £12,770 £14,580 £12,030Median(4) £15,700 £19,380 £17,930 £14,800 £17,130 £20,910 £15,040Upper quartile(4) £22,840 £25,250 £24,030 £17,880 £22,910 £23,470 £20,280
1 APRIL 1999£5,001–10,000 1,610 1,400 7,090 3,120 1,900 770 6,130£10,001–15,000 3,230 5,010 22,100 17,700 4,590 9,590 24,000£15,001–20,000 2,530 6,040 15,630 9,240 4,020 9,100 14,840£20,001–25,000 1,160 4,820 15,160 2,380 2,000 19,800 8,030£25,001–30,000 690 3,140 7,010 690 870 3,090 4,530£30,001–35,000 430 1,240 3,850 350 720 1,180 810£35,001–40,000 330 470 1,690 260 490 650 1,160£40,001–45,000 210 180 1,070 140 390 360 800£45,001–50,000 100 80 400 50 140 200 600£50,001–55,000 50 40 250 40 80 150 230£55,001–60,000 40 20 140 30 90 80 100£60,001–65,000 20 10 50 20 50 50 60£65,001–70,000 10 10 20 10 30 10 30£70,001–75,000 10 0 10 10 10 10 10£75,001+ 10 10 20 20 20 20 10Not reported 20 50 0 30 90 1,740 0
TOTAL 10,450 22,520 74,490 34,090 15,490 46,800 61,340
Lower quartile(4) £11,470 £13,890 £12,690 £12,220 £12,660 £15,090 £12,370Median(4) £15,290 £18,590 £17,510 £14,030 £17,000 £21,050 £14,870Upper quartile(4) £22,630 £24,260 £23,320 £17,340 £22,260 £22,900 £19,890
SOURCES: MANDATE AND DEPARTMENTAL RETURNS(1) For machinery of government changes during the period see Section 2 and Annex A.(2) Salary in this table is gross salary and rounded to the nearest 10. See Definitions and Sources page.(3) Part-time staff are assigned to the salary band corresponding to their full-time equivalent salary.(4) Pay quartiles calculated using new method (see Annex B).
d maintables 20-56 22/8/01, 10:44 am46

CIVIL SERVICE STATISTICS 2000
47
FULL-TIME EQUIVALENTS
LORD CHANCELLOR’SDEPARTMENT (inc. DEPARTMENT ALL NON-
INLAND Land Registry and DEPARTMENT OF OF TRADE AND OTHER INDUSTRIALREVENUE Public Record Office) SOCIAL SECURITY INDUSTRY DEPARTMENTS STAFF SALARY BAND(2), (3)
TABLE G: STAFF NUMBERS IN MAJOR DEPARTMENTS BY SALARY BAND, 1999 AND 2000(1)
430 700 6,840 710 7,250 270 2,420 27,290 £5,001–10,000800 11,110 25,040 9,110 47,690 2,350 13,740 164,100 £10,001–15,000970 9,660 15,180 5,090 20,430 2,080 12,440 103,450 £15,001–20,000260 20,190 9,420 1,970 5,770 1,360 10,260 74,900 £20,001–25,000000 3,630 5,300 830 1,250 810 5,480 30,770 £25,001–30,000760 1,310 1,300 370 510 600 3,690 14,970 £30,001–35,000510 750 1,050 150 250 350 2,350 8,370 £35,001–40,000440 390 900 140 140 260 2,080 6,060 £40,001–45,000180 260 490 60 70 210 1,360 3,430 £45,001–50,00090 120 460 30 60 130 700 1,990 £50,001–55,00080 100 190 40 20 80 440 1,160 £55,001–60,00060 80 70 20 30 50 380 850 £60,001–65,00030 10 40 10 20 30 150 340 £65,001–70,00030 10 20 10 10 20 170 310 £70,001–75,00030 30 20 20 20 30 280 500 £75,001+
260 1,970 10 260 0 210 1,380 7,490 Not reported
910 50,320 66,330 18,820 83,530 8,840 57,270 445,970 TOTAL
770 £14,580 £12,030 £12,770 £11,130 £14,150 £13,920 £12,770130 £20,910 £15,040 £14,470 £13,810 £18,990 £19,560 £15,850910 £23,470 £20,280 £18,640 £17,070 £26,740 £27,120 £21,630
900 770 6,130 760 9,370 380 3,140 35,670 £5,001–10,000590 9,590 24,000 9,270 47,060 2,280 13,840 158,670 £10,001–15,000020 9,100 14,840 4,920 18,320 2,020 13,570 100,230 £15,001–20,000000 19,800 8,030 1,900 4,870 1,280 8,820 70,220 £20,001–25,000870 3,090 4,530 770 1,050 740 5,210 27,790 £25,001–30,000720 1,180 810 310 340 600 3,370 13,200 £30,001–35,000490 650 1,160 150 230 290 2,370 8,090 £35,001–40,000390 360 800 130 110 290 1,860 5,540 £40,001–45,000140 200 600 50 70 160 1,030 2,880 £45,001–50,00080 150 230 30 40 100 660 1,670 £50,001–55,00090 80 100 40 40 80 530 1,190 £55,001–60,00050 50 60 20 20 40 260 600 £60,001–65,00030 10 30 10 10 20 200 360 £65,001–70,00010 10 10 10 10 20 90 190 £70,001–75,00020 20 10 10 20 30 230 400 £75,001+90 1,740 0 70 20 190 390 2,600 Not reported
490 46,800 61,340 18,450 81,580 8,520 55,570 429,300 TOTAL
660 £15,090 £12,370 £12,680 £11,200 £13,650 £12,440 £12,520000 £21,050 £14,870 £14,410 £13,340 £18,450 £18,960 £15,550260 £22,900 £19,890 £18,460 £16,690 £25,910 £26,220 £21,100
d maintables 20-56 22/8/01, 10:44 am47

CIVIL SERVICE STATISTICS 2000
48
NON-INDUSTRIAL STAFF IN MANDATE DEPARTMENTS: 1 APRIL 2000
RESPONSIBILITY LEVELSALARY BAND(2) SCS LEVEL 6 AND 7 SEO/HEO EO AO/AA
£1–5,000 0 0 0 0 0£5,001–10,000 0 0 0 20 26,450£10,001–15,000 0 0 430 12,790 147,650£15,001–20,000 0 0 7,370 62,420 30,730£20,001–25,000 0 100 27,680 25,850 19,150£25,001–30,000 0 840 23,280 4,920 1,980£30,001–35,000 0 4,300 9,500 770 0£35,001–40,000 0 5,840 2,080 50 0£40,001–45,000 130 5,280 400 0 0£45,001–50,000 320 2,730 140 0 0£50,001–55,000 470 1,400 10 0 0£55,001–60,000 670 410 0 0 0£60,001–65,000 650 40 0 0 0£65,001–70,000 320 10 0 0 0£70,001–75,000 230 0 0 0 0£75,001+ 440 0 0 0 0Not reported 110 370 400 670 1,660
TOTAL 3,340 21,320 71,300 107,510 227,610
Lower quartile(3) £54,040 £35,000 £22,240 £16,550 £10,900Median(3) £60,220 £39,530 £24,980 £18,360 £13,100Upper quartile(3) £67,270 £44,130 £28,310 £20,400 £14,710
NON-INDUSTRIAL STAFF IN MANDATE DEPARTMENTS: 1 APRIL 1999
1 April 1999 RESPONSIBILITY LEVELSALARY BAND(2) SCS LEVEL 6 AND 7 SEO/HEO EO AO/AA
£1–5,000 0 0 0 0 0£5,001–10,000 0 0 0 0 35,010£10,001–15,000 0 0 560 14,100 141,730£15,001–20,000 0 0 7,800 62,750 25,960£20,001–25,000 0 0 29,460 21,220 19,250£25,001–30,000 0 1,310 20,530 4,280 790£30,001–35,000 0 4,420 7,610 510 0£35,001–40,000 10 6,200 1,440 20 0£40,001–45,000 120 4,690 310 0 0£45,001–50,000 320 2,330 110 0 0£50,001–55,000 560 950 0 0 0£55,001–60,000 810 200 0 0 0£60,001–65,000 500 30 0 0 0£65,001–70,000 270 0 0 0 0£70,001–75,000 160 0 0 0 0£75,001+ 350 0 0 0 0Not reported 80 390 340 580 990
TOTAL 3,180 20,530 68,150 103,450 223,740
Lower quartile(3) £53,144 £34,253 £21,938 £16,646 £10,859Median(3) £58,405 £38,623 £24,466 £18,061 £12,828Upper quartile(3) £65,000 £42,826 £27,707 £19,963 £14,335
SOURCE : MANDATE(1) Part-time staff are recorded according to the proportion of full-time hours worked.(2) Salary in this table is gross salary and rounded to the nearest 10. See Definitions and Sources page.(3) Pay quartiles calculated using new method (see Annex B).
TABLE H: STAFF NUMBERS BY SALARY BAND AND RESPONSIBILITY LEVEL, 1999 AND 2000
FULL-TIME EQUIVALENTS(1)1 APRIL 2000
d maintables 20-56 22/8/01, 10:44 am48

CIVIL SERVICE STATISTICS 2000
49
TABLE I: ENTRANTS AND LEAVERS – NON-INDUSTRIAL STAFF, 1993–94 TO 1999–2000
1993–94 1994–95 1995–96 1996–97 1997–98 1998–99 1999–2000
TOTAL ENTRANTS1 24,560 20,610 27,330 29,100 26,720 29,880 43,430of whom:
Male 12,080 9,610 12,640 13,370 12,720 12,480 17,580Female 12,490 11,000 14,700 15,730 14,000 17,400 25,850
by method of entry:Recruitment 23,370 18,810 25,120 27,910 25,970 29,230 37,900Reinstatement 650 590 640 1,090 670 540 800Inward loans and transfers 540 1,200 1,570 100 80 110 260
TOTAL LEAVERS2,3 38,800 38,820 43,680 47,900 35,070 31,440 28,050of whom:
Male 21,580 16,700 22,360 22,980 16,900 14,750 13,350Female 17,220 22,130 21,330 24,920 18,170 16,690 14,700
by cause of leaving:Early departure 7,440 9,430 13,480 11,870 4,060 1,620 2,000of whom:Early retirement 4,920 6,460 9,090 7,580 2,340 1,220 1,560Early severance 2,510 2,970 4,380 4,290 1,720 400 470
Transfers out of the service 6,660 1,750 4,490 7,210 4,930 6,970 700of whom:
Privatisation 4,000 1,560 3,990 7,040 3,790 6,640 130Outward loans and transfers 2,650 180 500 170 1,140 330 570Wastage 24,710 27,650 25,720 28,820 26,080 22,650 24,690of whom:Retirement at minimum age 3,370 3,510 3,570 3,550 2,500 2,440 2,430Retirement above minimum age 4,310 4,440 3,010 2,780 2,360 2,140 1,900Resignation 10,890 13,000 13,140 15,150 15,420 14,080 14,630End of fixed-term appointment 1,150 2,060 2,270 3,740 2,950 1,940 3,800Dismissals and discharges 1,000 880 750 870 650 590 740Ill health 3,260 3,090 2,480 2,270 1,790 1,060 850Death 740 670 490 460 400 400 340
SOURCE: MANDATE AND CABINET OFFICE ESTIMATES1 Includes 4,464 staff whose method of entry was unknown in 1999–2000.2 Includes 210 staff whose leaving cause was unknown in 1998–99.3 Includes 639 staff whose leaving cause was unknown in 1999–2000.
ESTIMATED TOTALS FOR ALL DEPARTMENTS HEADCOUNT
d maintables 20-56 22/8/01, 10:44 am49

CIVIL SERVICE STATISTICS 2000
50
AGE DISTRIBUTION OF WHOM:
50 AND TOTAL(1) MALE FEMALERESPONSIBILITY LEVEL YEAR 16–17 18–19 20–24 25–29 30–34 35–39 40–44 45–49 OVER
All non–industrial staff 1995–96 410 1,910 7,130 4,230 2,750 2,100 2,020 1,870 2,280 24,710 11,270 13,4401996–97 540 1,970 7,360 5,350 4,250 3,330 2,840 2,550 2,990 31,200 13,720 17,4801997–98 540 1,790 6,090 4,220 3,040 2,530 2,330 1,970 2,750 25,290 11,670 13,6201998–99 890 2,850 6,960 4,630 3,380 2,950 2,790 2,290 2,960 29,690 12,390 17,2901999–00 1,180 4,090 10,790 6,750 5,100 4,390 3,880 3,200 4,030 43,430 17,580 25,850
SCS level3 1995–96 0 0 0 0 0 10 10 10 20 40 40 101996–97 0 0 0 0 0 10 20 20 30 80 70 101997–98 0 0 0 0 10 10 20 20 30 90 70 201998–99 0 0 0 0 0 10 20 20 30 70 60 201999–00 0 0 0 10 10 30 40 40 50 180 120 60
Level 6 and 7 1995–96 0 0 0 30 70 80 80 100 90 440 300 1401996–97 0 0 0 30 60 60 60 60 80 360 240 1201997–98 0 0 0 50 60 70 70 60 70 380 230 1501998–99 0 0 10 50 100 90 100 100 90 540 340 2001999–00 0 0 0 90 160 140 140 150 140 830 500 330
Senior/Higher Executive Officer level 1995–96 0 0 100 270 180 150 110 160 290 1,270 930 3401996–97 0 0 140 270 220 190 170 200 330 1,530 1,100 4201997–98 10 10 160 320 270 200 180 190 380 1,710 1,140 5701998–99 0 10 140 350 290 200 190 160 330 1,670 1,040 6201999–00 0 0 230 570 450 350 280 210 350 2,430 1,500 930
Executive Officer level 1995–96 0 0 650 420 310 200 240 200 230 2,250 1,420 8401996–97 0 10 570 550 630 620 530 370 400 3,700 2,310 1,3901997–98 10 30 520 470 300 290 340 230 320 2,510 1,550 9601998–99 0 20 530 450 310 270 250 220 300 2,350 1,400 9601999–00 0 20 1,230 790 590 480 450 300 340 4,200 2,270 1,930
Administrative Officer/Assistant level 1995–96 400 1,910 6,320 3,450 2,160 1,640 1,560 1,390 1,640 20,470 8,440 12,0301996–97 500 1,810 6,250 4,240 3,120 2,290 1,870 1,740 1,960 23,810 9,130 14,6801997–98 520 1,730 5,270 3,250 2,320 1,890 1,660 1,420 1,890 19,970 8,330 11,6301998–99 880 2,810 6,270 3,770 2,670 2,380 2,220 1,790 2,200 25,000 9,540 15,4601999–00 1,140 3,920 8,870 5,040 3,700 3,230 2,820 2,380 3,000 34,110 12,610 21,510
SOURCE: MANDATE1 Includes Recruitment, Reinstatement and Inward loans and transfers.2 Totals include responsibility levels, genders and ages not reported to MANDATE.3 Includes level 1.
TABLE J: ENTRANTS BY RESPONSIBILITY LEVEL, AGE AND GENDER, 1995–96 TO 1999–2000
NON-INDUSTRIAL STAFF IN MANDATE DEPARTMENTS: 1995–96 TO 1999–2000 HEADCOUNT
d maintables 20-56 22/8/01, 10:44 am50

CIVIL SERVICE STATISTICS 2000
51
LENGTH OF SERVICE IN YEARS AGE
HEADCOUNT <1 1–<2 2–<3 3–<4 4–<5 5–<9 10+ <20 20–24 25–29 30–39 40+ TOTAL
SCS1 0 0 10 20 0 10 30 0 0 0 10 60 70Grades 6/7 20 40 20 20 10 50 90 0 0 10 120 120 250SEO/HEO 120 140 120 100 60 250 380 0 40 210 520 400 1,170EO 310 200 150 120 60 370 470 0 130 410 660 490 1,690AO/AA 5,140 1,930 920 660 420 1,390 970 960 2,990 2,470 2,680 2,320 11,430Industrial 410 270 210 160 80 240 180 70 220 230 450 570 1,540
TOTAL2 6,010 2,590 1,440 1,080 640 2,310 2,120 1,040 3,390 3,330 4,430 3,970 16,170
LENGTH OF SERVICE IN YEARS AGE
RESIGNATION RATES3 <1 1–<2 2–<3 3–<4 4–<5 5–<9 10+ <20 20–24 25–29 30–39 40+ TOTAL
SCS1 3.0% 3.3% 6.3% 9.8% 5.5% 3.7% 1.2% 0.0% 0.0% 0.0% 5.7% 1.9% 2.2%Grades 6/7 2.7% 7.1% 4.7% 3.3% 2.8% 1.6% 0.6% 0.0% 15.4% 3.7% 2.8% 0.7% 1.2%SEO/HEO 5.8% 7.2% 6.2% 5.0% 3.5% 2.8% 0.7% 0.0% 8.1% 5.5% 2.5% 0.9% 1.7%EO 10.2% 7.2% 4.9% 4.0% 3.5% 2.1% 0.6% 12.5% 6.9% 4.4% 1.6% 0.9% 1.6%AO/AA 19.6% 11.2% 6.4% 5.0% 5.3% 2.3% 1.0% 23.1% 15.8% 6.9% 3.3% 2.3% 4.8%Industrial 17.0% 12.0% 8.1% 8.6% 4.2% 4.2% 1.3% 8.5% 14.5% 10.0% 6.2% 3.0% 5.0%
TOTAL2 17.4% 10.4% 6.3% 5.1% 4.6% 2.4% 0.8% 20.6% 14.8% 6.5% 2.9% 1.7% 3.4%
SOURCE: MANDATE ONLY1 Includes level 1.2 Totals include responsibility levels and ages not reported to MANDATE.3 Resignations during the year as a percentage of the number of staff at that responsibility level at the start of the year.
TABLE K: RESIGNATIONS BY RESPONSIBILITY LEVEL, LENGTH OF SERVICE AND AGE,1999–2000NON-INDUSTRIAL AND INDUSTRIAL STAFF HEADCOUNT
d maintables 20-56 22/8/01, 10:44 am51

CIVIL SERVICE STATISTICS 2000
52
NUMBERSRESPONSIBILITY LEVEL 1994–95 1995–96 1996–97 1997–98 1998–99 1999–2000
SCS level1 50 40 60 50 50 70Level 6 and 7 190 200 200 310 300 250Senior/Higher Executive Officer level 1,040 930 920 1,180 1,310 1,170Executive Officer level 1,620 1,590 1,570 1,940 1,870 1,690Administrative Officer/Assistant level 9,160 9,020 9,770 11,310 10,420 11,430
ALL NON-INDUSTRIAL STAFF2 12,170 11,810 12,690 14,880 13,990 14,630
RESIGNATION RATES (PERCENTAGES)3
RESPONSIBILITY LEVEL 1994–95 1995–96 1996–97 1997–98 1998–99 1999–2000
SCS level1 1.3% 1.1% 2.0% 1.5% 1.6% 2.1%Level 6 and 7 0.9% 1.0% 1.0% 1.5% 1.4% 1.2%Senior/Higher Executive Officer level 1.3% 1.3% 1.3% 1.7% 1.9% 1.6%Executive Officer level 1.4% 1.4% 1.4% 1.8% 1.7% 1.5%Administrative Officer/Assistant level 3.3% 3.4% 3.8% 4.7% 4.4% 4.7%
ALL NON-INDUSTRIAL STAFF2 0.6% 2.5% 2.8% 3.4% 3.2% 3.2%
SOURCE : MANDATE1 Includes level 1.2 Totals include responsibility levels not reported to MANDATE.3 Resignations during the year as a percentage of the number of staff at that responsibility level at the start of the year.
TABLE L: RESIGNATIONS BY RESPONSIBILITY LEVEL, 1994–95 TO 1999–2000
NON-INDUSTRIAL STAFF IN MANDATE DEPARTMENTS HEADCOUNT
d maintables 20-56 22/8/01, 10:44 am52

CIVIL SERVICE STATISTICS 2000
53
THOUSANDS AT 1 APRIL EACH YEAR
FULL-TIME EQUIVALENT BASIS HEADCOUNT BASIS
PERMANENT STAFF CASUAL STAFF ALL STAFF
NON-YEAR INDUSTRIAL INDUSTRIAL TOTAL FULL-TIME PART-TIME ALL STAFF
TABLE M: ESTIMATED HISTORICAL SERIES, 1974 TO 2000
1974 514 181 695 17 712 678 28 7061975 526 178 705 17 721 686 30 7161976 571 180 751 11 762 732 31 7631977 573 176 749 7 756 730 31 7611978 569 170 739 6 745 721 30 7511979 568 168 735 8 743 717 30 7471980 549 159 708 6 714 691 29 7201981 542 151 693 6 699 676 27 7031982 530 139 669 7 676 654 25 6791983 520 131 651 9 660 638 22 6601984 506 120 626 7 634 613 21 6341985 500 102 601 11 612 588 22 6101986 500 96 596 11 607 582 25 6071987 510 91 601 12 613 584 28 6121988 510 73 583 10 593 564 31 5951989 503 70 573 11 584 552 35 5871990 499 67 567 13 580 543 40 5821991 495 64 559 14 572 532 43 5761992 509 61 571 17 588 542 46 5881993 509 52 560 18 579 529 50 5791994 494 46 540 21 561 507 52 5591995 475 42 517 18 535 483 54 5371996 459 36 495 20 515 460 55 5151997 439 36 475 19 495 440 56 4961998 431 33 463 18 481 426 58 4841999R 429 31 460 17 476 421 60 4812000 446 29 475 11 487 433 65 498
NOTES:
1. Changes in the scope of the Civil Service between 1970 and 1992 had the following effects on the numbers:
a. Staff of the Manpower Services Commission and its agencies (18,600 at 1 January 1985) were excluded from the manpower count up to 1975; following the Employment Protection Act of 1975they were counted as civil servants with effect from 1 January 1976.
b. 5,600 non-industrial and 13,400 industrial staff in Royal Ordnance Factories are excluded from 1985 onwards.c. Some 4,100 non-industrial and 12,500 industrial staff in the Devonport and Rosyth Dockyards are excluded from 1988.d. Some 3,300 non-industrial staff in the Department of Health Special Hospitals are excluded from 1990.e. Some 460 non-industrial staff in the Insurance Services Group of ECGD are excluded from 1991.
2. For changes after 1994 see Annex A (page 57).
NON-INDUSTRIAL AND INDUSTRIAL STAFF
d maintables 20-56 22/8/01, 10:44 am53
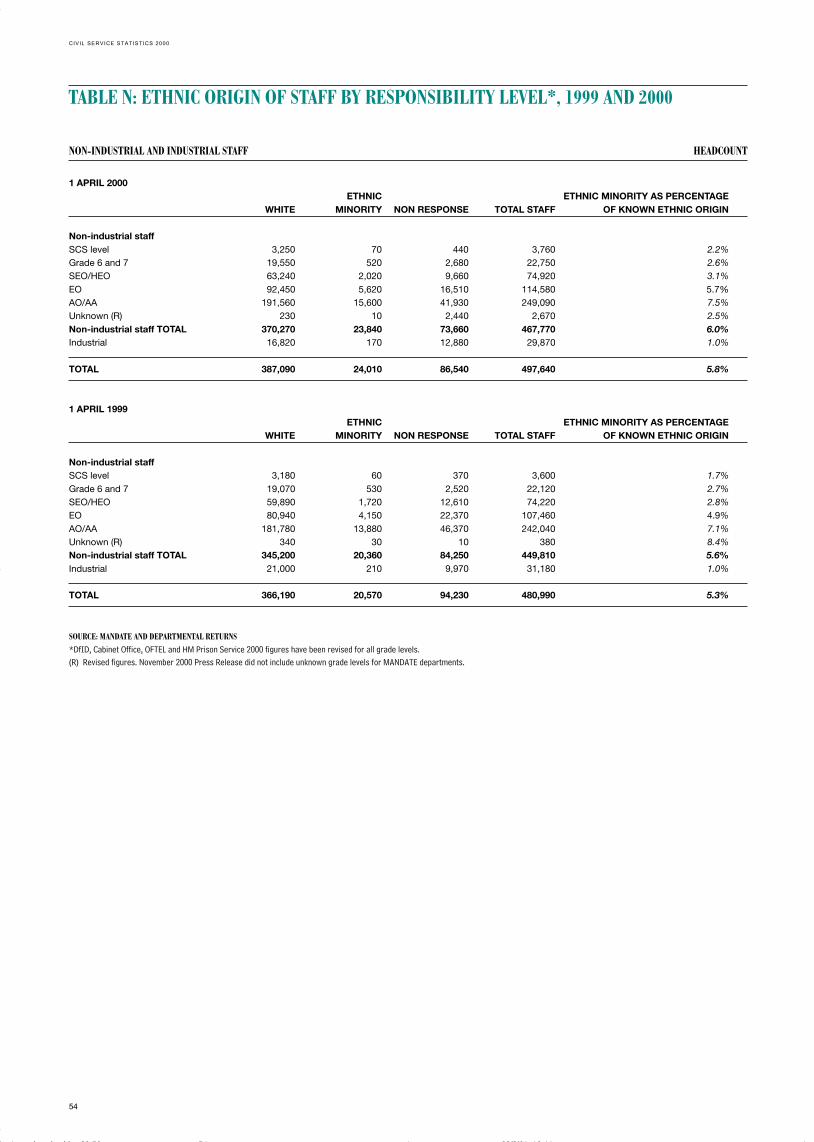
CIVIL SERVICE STATISTICS 2000
54
TABLE N: ETHNIC ORIGIN OF STAFF BY RESPONSIBILITY LEVEL*, 1999 AND 2000
NON-INDUSTRIAL AND INDUSTRIAL STAFF HEADCOUNT
1 APRIL 2000ETHNIC ETHNIC MINORITY AS PERCENTAGE
WHITE MINORITY NON RESPONSE TOTAL STAFF OF KNOWN ETHNIC ORIGIN
Non-industrial staffSCS level 3,250 70 440 3,760 2.2%Grade 6 and 7 19,550 520 2,680 22,750 2.6%SEO/HEO 63,240 2,020 9,660 74,920 3.1%EO 92,450 5,620 16,510 114,580 5.7%AO/AA 191,560 15,600 41,930 249,090 7.5%Unknown (R) 230 10 2,440 2,670 2.5%Non-industrial staff TOTAL 370,270 23,840 73,660 467,770 6.0%Industrial 16,820 170 12,880 29,870 1.0%
TOTAL 387,090 24,010 86,540 497,640 5.8%
1 APRIL 1999ETHNIC ETHNIC MINORITY AS PERCENTAGE
WHITE MINORITY NON RESPONSE TOTAL STAFF OF KNOWN ETHNIC ORIGIN
Non-industrial staffSCS level 3,180 60 370 3,600 1.7%Grade 6 and 7 19,070 530 2,520 22,120 2.7%SEO/HEO 59,890 1,720 12,610 74,220 2.8%EO 80,940 4,150 22,370 107,460 4.9%AO/AA 181,780 13,880 46,370 242,040 7.1%Unknown (R) 340 30 10 380 8.4%Non-industrial staff TOTAL 345,200 20,360 84,250 449,810 5.6%Industrial 21,000 210 9,970 31,180 1.0%
TOTAL 366,190 20,570 94,230 480,990 5.3%
SOURCE: MANDATE AND DEPARTMENTAL RETURNS*DfID, Cabinet Office, OFTEL and HM Prison Service 2000 figures have been revised for all grade levels.(R) Revised figures. November 2000 Press Release did not include unknown grade levels for MANDATE departments.
d maintables 20-56 22/8/01, 10:44 am54

CIVIL SERVICE STATISTICS 2000
55
TABLE O: DISABLED STAFF BY RESPONSIBILITY LEVEL*, 1999 AND 2000
NON-INDUSTRIAL AND INDUSTRIAL STAFF HEADCOUNT
1 APRIL 2000
DISABLED TOTAL STAFF DISABLED PERCENTAGE
Non-industrial staffSCS level 60 3,770 1.7%Grade 6 and 7 550 22,750 2.4%SEO/HEO 2,380 74,920 3.2%EO 4,610 114,580 4.0%AO/AA 10,140 249,090 4.1%Unknown (R) 20 2,670 0.6%Non-industrial staff TOTAL 17,750 467,780 3.8%Industrial 670 29,870 2.3%
TOTAL 18,420 497,650 3.7%
1 APRIL 1999
DISABLED TOTAL STAFF DISABLED PERCENTAGE
Non-industrial staff#
SCS level 60 3,600 1.6%Grade 6 and 7 500 22,120 2.3%SEO/HEO 2,190 74,220 2.9%EO 4,140 107,460 3.9%AO/AA 9,490 242,040 3.9%Non-industrial staff TOTAL 16,380 449,430 3.6%Industrial 840 31,180 2.7%
TOTAL 17,210 480,610 3.6%
SOURCE: MANDATE AND DEPARTMENTAL RETURNS*DfID and HM Prison Service figures have been revised for all grade levels.(R) Revised figures. November 2000 Press Release did not include unknown grade levels for MANDATE departments.#Excludes around 400 staff with unknown grade level.
d maintables 20-56 22/8/01, 10:44 am55

CIVIL SERVICE STATISTICS 2000
56
TABLE P: STAFF IN POST BY AGE, 1999 AND 2000
NON-INDUSTRIAL AND INDUSTRIAL STAFF HEADCOUNT
1 APRIL 2000HEADCOUNT PERCENTAGE OF STAFF GROUP
AGE NON-INDUSTRIAL INDUSTRIAL TOTAL NON-INDUSTRIAL INDUSTRIAL TOTAL
16–19 5,140 770 5,910 1.1 2.6 1.220–24 24,400 1,460 25,860 5.4 4.9 5.425–29 46,590 2,160 48,750 10.3 7.3 10.130–34 70,700 2,990 73,700 15.6 10.1 15.335–39 77,340 3,890 81,230 17.1 13.2 16.840–44 69,030 4,050 73,080 15.2 13.7 15.145–49 60,770 3,710 64,490 13.4 12.6 13.450–54 58,070 4,240 62,310 12.8 14.3 12.955–59 33,590 3,770 37,360 7.4 12.8 7.760–75 7,790 2,520 10,320 1.7 8.5 2.1
TOTAL 453,430 29,560 482,990 100.0 100.0 100.0
1 APRIL 1999HEADCOUNT PERCENTAGE OF STAFF GROUP
AGE NON-INDUSTRIAL INDUSTRIAL TOTAL NON-INDUSTRIAL INDUSTRIAL TOTAL
16–19 4,197 839 5,036 1.0 2.7 1.120–24 21,365 1,533 22,898 4.9 5.0 4.925–29 49,194 2,305 51,499 11.2 7.5 10.930–34 73,632 3,184 76,816 16.7 10.4 16.335–39 74,197 4,011 78,208 16.9 13.1 16.640–44 64,910 4,020 68,930 14.8 13.1 14.645–49 59,207 3,851 63,058 13.5 12.6 13.450–54 54,421 4,372 58,793 12.4 14.3 12.555–59 30,875 3,931 34,806 7.0 12.8 7.460–75 7,884 2,616 10,500 1.8 8.5 2.2
TOTAL 439,882 30,662 470,544 100.0 100.0 100.0
SOURCE: MANDATE ONLY
d maintables 20-56 22/8/01, 10:45 am56

57
CIVIL SERVICE STATISTICS 2000
2000
1 April 2000 Food Standards Agency launched.
1 April 2000 Office of Government Commerce launched.
1 April 2000 National Health Service Purchasing and Supply Agency set up.
1 April 2000 Staff transferred from local government to the Rent Service
(800 staff).
1999
1 October 1999 The Rent Service launched.
1 October 1999 Merger of OFGAS and OFFER to form OFGEM.
1 July 1999 Devolution in Scotland and Wales.
1 July 1999 Office of Advocate General and Scottish Courts Administration
absorbed by Scottish Executive.
1 July 1999 Scotland Office launched.
1 July 1999 National Assembly for Wales took over functions from Welsh
Office.
1 April 1999 Contributions Agency transferred from Department of Social
Security to Inland Revenue (7,580 staff).
1 April 1999 Ministry of Defence further privatisations/reorganisations
(around 1,200 staff overall).
1 April 1999 Defence Animal Centre merged with Army Training & Recruitment
Agency.
1 April 1999 Defence Codification Agency, subsumed by Ministry of Defence
Royal Air Force.
1 April 1999 Maintenance Group Defence Agency subsumed with Defence
Aviation Repair Agency.
1 April 1999 Office of the National Lottery became an NDPB outside the Civil
Service and was renamed The National Lottery Commission,
(33 non-industrial staff).
ANNEX A: DIARY OF EVENTS – MACHINERYOF GOVERNMENT CHANGES 1994 TO 2000
e annexes 57-67 22/8/01, 10:46 am57

58
CIVIL SERVICE STATISTICS 2000
1 April 1999 Much of National Savings privatised (around 4,000 non-industrial
staff).
1 April 1999 Lord Advocate’s Department subsumed in Scottish Office
(19 non-industrial staff).
18 January 1999 Scottish Records Office announced their new name –
The National Archives of Scotland.
1 January 1999 UK Anti-Drugs Co-ordination Unit was transferred from Privy
Council Office to the Cabinet Office.
1998
28 July 1998 The Women’s Unit transferred from the DSS to the Cabinet Office
(43 non-industrial staff).
28 July 1998 Office of Public Service no longer identified as a separate part of
the Cabinet Office.
1 July 1998 Security and Facilities Executive (SAFE) ceased to be an executive
agency. Services to be provided within the Cabinet Office.
1 April 1998 Marine Safety and Coastguard Agencies merged to form Maritime
and Coastguard Agency (941 staff).
1 April 1998 Historic Royal Palaces Agency (HRP) became an Executive NDPB1
outside the Civil Service (414 non-industrial and 41 industrial
staff).
1 April 1998 Defence Communication Services Agency (MoD) launched
(517 staff).
1 April 1998 Debt Management Office (HMT) established, including staff from
Bank of England (23 staff).
1 April 1998 National Criminal Intelligence Service (HO) became a Service
Authority (similar to a Police Authority), outside the Civil Service
(564 staff).
1 April 1998 Police Information & Technology Organisation became an
Executive NDPB1 outside the Civil Service (325 staff).
March 1998 Privatisation of Fleet Maintenance & Repair by FSL in Naval
Bases & Supplies Agency (MoD) (310 non-industrial and 820
industrial staff).
1 Executive Non-Departmental Public Bodies (NDPBs) – operate under statutory provisions, employ their own staffand have responsibility for their own budgets.
e annexes 57-67 22/8/01, 10:46 am58

59
CIVIL SERVICE STATISTICS 2000
1997
31 December 1997 Armed Forces Personnel Administration (an executive agency of
the MoD) contracted out some 650 permanent
non-industrial staff to EDS.
29 August 1997 Commander-in-Chief of Land Command (MoD)
contracted out 83 permanent non-industrial staff to Primary
Management Aldershot Ltd (PMAL).
16 June 1997 Following the General Election, the Departments of the
Environment and Transport merged under one Minister to form
the Department of the Environment, Transport and the Regions.
1 June 1997 A new agency of the Ministry of Defence was formed – Specialist
Procurement Services Agency (820 staff).
6 May 1997 Following the General Election, the Competitiveness Division
of the Office of Public Service (27 staff) transferred to the DTI.
3 May 1997 Following the General Election, the responsibility for voluntary
organisations and charities (18 staff) was transferred from the
Department for National Heritage to the Home Office.
3 May 1997 Following the General Election, the Overseas Development
Administration was renamed Department for International
Development and made independent of the Foreign and
Commonwealth Office.
24 April 1997 Ministry of Defence Support Services Division (DERA) sold to
Cinven (1,440 staff).
1 April 1997 A new agency of the DTI formed – Employment Tribunals Service
(550 permanent staff).
1 April 1997 A new agency of the MoD formed – Defence
Vetting Agency (50 permanent staff).
1 April 1997 A new agency of the MoD formed – Armed Forces
Personnel Administration Agency (850 permanent staff).
1 April 1997 A new agency of the MoD formed – Defence
Medical Training Organisation (80 permanent staff).
1 April 1997 A new agency of the MoD formed – Defence
Estates Organisation (1,170 permanent staff).
1 April 1997 Government Car and Despatch Agency became an executive
agency (220 permanent staff); formerly part of SAFE (Office of
Public Service).
e annexes 57-67 22/8/01, 10:46 am59

60
CIVIL SERVICE STATISTICS 2000
1 April 1997 Centre for Environment, Fisheries and Aquaculture Science
became an executive agency (410 permanent staff); formerly part
of the Ministry of Agriculture, Fisheries and Food.
1 April 1997 ADAS (an executive agency of MAFF) (1,190 staff) became ADAS
plc on moving to private sector.
1 April 1997 Farming and Rural Conservation Agency (440 permanent staff),
formerly part of ADAS (an executive agency of MAFF), formed to
take over functions that remain in the public sector.
1 April 1997 Fisheries Research Service became an executive agency (200
permanent staff); formerly part of the Scottish Office.
1 April 1997 Paymaster (an executive agency of HM Treasury) (560 staff) sold
to EDS.
1 April 1997 Department for Education and Employment Information Services
Division (150 permanent staff) transferred to F1 Group plc.
31 March 1997 Logistic Information Systems Agency (an executive agency of the
MoD) transferred 21 non-industrial staff to EDS.
31 March 1997 RAF Training Group Defence Agency (an executive agency of the
MoD) transferred 29 non-industrial and 137 industrial staff to
Brown & Root, and Marshall Aerospace; 22 non-industrial and 96
industrial staff to SERCO; 116 industrial staff to an in-house bid
alliance with SERCO and 12 non-industrial and 147 industrial staff
to Hunting Aviation Ltd.
20 March 1997 Crown Prosecution Service (565 permanent staff and 184 casual
staff) and Serious Fraud Office (165 permanent staff and 12
casual staff) now operating on Next Steps lines.
19 March 1997 Building Research Establishment (BRE) agency (630 staff)
(Department of the Environment) sold to the BRE Management
Bid team.
2 February 1997 A new agency of the MoD formed – RAF Personnel Management
Agency (475 permanent staff).
31 January 1997 RAF Signals Engineering Establishment (an executive agency
of the MoD) transferred 27 industrial staff to Granada and
37 non-industrial and 12 industrial staff to SERCO.
16 January 1997 Office of Public Service (OPS) IT support staff (6 permanent staff)
transferred to Digital.
e annexes 57-67 22/8/01, 10:46 am60

61
CIVIL SERVICE STATISTICS 2000
1996
11 December 1996 A new agency of the MoD formed – Naval Bases and Supplies
Agency (9,240 permanent staff).
11 December 1996 A new agency of the MoD formed – Ship Support Agency (2,230
permanent staff).
9 December 1996 A new agency of the MoD formed – RAF Logistics Support
Services (740 permanent staff).
2 December 1996 A new agency of the MoD formed – The Army Personnel Centre
(1,530 permanent staff).
1 October 1996 A new agency of the MoD formed – Defence Intelligence and
Security Agency (111 permanent staff).
1 October 1996 Employment Service transferred 3,450 non-industrial staff to
Benefits Agency (an executive agency of the DSS) due to the
introduction of the Job Seekers Allowance.
30 September 1996 HM Stationery Office (an executive agency of the OPS)
trading operations sold to National Publishing Group
(2,580 permanent staff).
30 September 1996 Occupational Health and Safety Agency (an executive agency of
the OPS) sold to BMI Health Services (100 permanent staff).
30 September 1996 Teachers Pension Agency (an executive agency of the Depart-
ment for Education and Employment) transferred to Capita
Managed Services Ltd (380 permanent staff).
5 September 1996 Recruitment and Assessment Services Agency (an executive
agency of the OPS) sold to Capita Group plc (140 permanent staff).
1 August 1996 Chessington Computer Centre (an executive agency of the OPS)
sold to a consortium made up of a management and employee
buyout team, Integris UK and Close Brothers (370 permanent staff).
1 July 1996 Companies House (an executive agency of DTI) transferred 47
permanent staff to Capita, a private sector company.
1 May 1996 Voluntary and Community Division staff transferred from Home
Office to Department of National Heritage (26 permanent staff).
1 May 1996 Natural Resources Institute (an executive agency of ODA)
transferred to University of Greenwich (303 permanent staff).
1 April 1996 OFGAS took on responsibility for the Gas and Oil Measurement
Branch of the Department of Trade and Industry.
e annexes 57-67 22/8/01, 10:46 am61

62
CIVIL SERVICE STATISTICS 2000
1 April 1996 Some 870 staff transferred from Regional Health Authorities to
the Department of Health.
1 April 1996 Property Advisors to the Civil Estate (PACE) Agency formed out of
Property Holdings (DOE). As a result 355 permanent staff
transferred from DOE to PACE, which became an agency of OPS.
1 April 1996 The CSO (1,376 permanent staff and 85 casual staff at 1 January
1996) and OPCS (1,772 permanent staff and 121 casual staff at
1 January 1996) merged to form the Office for National Statistics.
1 April 1996 PSA: remaining 43 permanent staff transferred to DOE.
1 April 1996 Service Children’s Schools (NW Europe) merged with Service
Children’s Education Authority to become Service Children’s
Education. Increase of 180 staff.
1 April 1996 Eight permanent staff dealing with Pay and Grading Delegation
transferred from HM Treasury to Cabinet Office (OPS).
1 April 1996 The Metropolitan Police Forensic Science Laboratory (361
permanent staff) merged with the Forensic Science Service
(an executive agency of the Home Office).
1 April 1996 HM Inspectorate of Pollution (DOE) (340 permanent staff)
transferred to the Environment Protection Agency (an NDPB).
31 March 1996 Laboratory of the Government Chemist privatised (268 permanent
staff and 11 casual staff at 1 January 1996).
31 March 1996 Transport Research Laboratory privatised (450 permanent staff
and 1 casual staff at 1 January 1996).
1 February 1996 Pay and Personnel Agency was formed (MoD) from remainder
of staff (1,048 permanent staff and 10 casual staff at
1 January 1996) in the Defence Accounts Agency. The Defence
Accounts Agency ceased to exist.
1 January 1996 Responsibility for the Security Facilities Agency (1,088 permanent
staff and 110 casual staff) and the Buying Agency (117 perma-
nent staff and 2 casual staff) transferred from DOE to OPS.
January 1996 Further 800 staff transferred from Inland Revenue IT Services to
EDS in the private sector.
e annexes 57-67 22/8/01, 10:46 am62

63
CIVIL SERVICE STATISTICS 2000
1995
1 November 1995 National Engineering Laboratory was privatised (217 staff
transferred to the private sector).
1 October 1995 The Central Veterinary Laboratory became the Veterinary
Laboratories Agency (400 staff transferred from MAFF’s
Veterinary Investigation Service).
October 1995 IT services at Health and Safety Executive (HSE) sold to Integris
(76 staff transferred to the private sector).
30 September 1995 National Physical Laboratory was privatised (533 staff
transferred to the private sector).
5 July 1995 Employment (ED) Group abolished:
• Employment (Main) (3,863 permanent and 399 casual staff)
and Employment Service Agency (38,495 permanent and 1,922
casual staff) merged with the Department for Education (DFE)
(2,027 permanent and 68 casual staff) to become the Department
for Education and Employment (DfEE) (44,246 permanent and
2,389 casual staff).
• Health and Safety Executive (HSE) went to Department of the
Environment (DOE) (4,127 permanent and 147 casual staff).
• Advisory Conciliation and Arbitration Service (ACAS) went to
DTI (602 staff).
• Labour Market Statistics Group went to CSO (192 permanent
staff).
• Industrial Relations Division of ED moved to DTI (746
permanent staff).
• Office of Science and Technology moved from OPSS (now
OPS) to DTI (96 permanent staff).
• Competitiveness Division and Deregulation Unit moved from
DTI to OPS (69 permanent staff).
• Office for Manpower Economics moved from Employment
(Main) to DTI.
3 April 1995 The Court Service was established (Lord Chancellor’s Department).
3 April 1995 The Scottish Court Service was established.
1 April 1995 Part-time staff (including those working less than 10 hours
per week) are recorded according to the proportion of full-time
hours worked.
e annexes 57-67 22/8/01, 10:46 am63

64
CIVIL SERVICE STATISTICS 2000
1 April 1995 Three divisions moved from HM Treasury to Cabinet Office (OPS):
Civil Service Pensions Division – 34 permanent staff; Personnel
Management & Conditions of Service Division – 77 permanent
staff; Senior Pay & Contracts Division – 14 permanent staff.
1 April 1995 The Meat Hygiene Service Executive Agency was formed (MAFF).
It was staffed by personnel transferred from local authorities
resulting in 813 permanent and 114 casual staff joining the Civil
Service.
1 April 1995 The Defence Evaluation and Research Agency was formed from
former Defence Research Agency, the Chemical and Biological
Defence Establishment and the Defence Operational Analysis
Centre, all three of which were formerly executive agencies; and
the Directorate General of Test and Evaluation; the Institute of
Aviation Medicine and small parts of the Army Personnel
Research Establishment.
1 April 1995 The Accounts Services Agency (DTI) was privatised (84 staff
transferred to the private sector).
1994
1 October 1994 Fuel Suppliers Branch moved from DOE (Main) to the Buying
Agency (14 permanent staff).
1 September 1994 The Public Trust Office was established (LCD).
July 1994 Some 1,000 staff of Inland Revenue IT Services transferred to
EDS.
1 April 1994 Security and Intelligence Services staff were placed under the
Cabinet Office. Previously they had been included in the MoD
(4,900 permanent staff) and FCO (1,630 permanent staff).
1993/94 The sale of the PSA Services Building Management businesses
during 1993–94 resulted in the transfer of some 8,500 staff to
the private sector.
Details of events between 1985 and 1993 can be found on our
website:
www.civil-service.gov.uk/statistics
e annexes 57-67 22/8/01, 10:46 am64

65
CIVIL SERVICE STATISTICS 2000
Note: The box Counting Civil Servants, in Section 2, summarises key definitions used
in this publication.
The DEFINITIONS used in the CIVIL SERVICE STATISTICS are as follows:
The CIVIL SERVICE comprises the Home Civil Service and Diplomatic Service but not
the Northern Ireland Civil Service, locally engaged staff overseas nor employees of
Non-Departmental Public Bodies – other than those in the HSE and ACAS.
A CIVIL SERVANT is a servant of the Crown working in a civil capacity who is not: the
holder of a political (or judicial) office; the holder of certain other office in respect of
whose tenure of office special provision has been made; a servant of the Crown in a
personal capacity paid from the Civil List.
The distinction between NON-INDUSTRIAL and INDUSTRIAL civil servants is, in
general, comparable to that in outside industry between white and blue-collar
workers, and is reflected in membership of different trade unions. This distinction is
gradually becoming less meaningful for many purposes, owing to the introduction of
departmental grades. If these do not make a distinction, staff are included in the non-
industrial category.
CASUAL STAFF, normally engaged for up to 12 months, but exceptionally up to two
years, are shown separately from permanent staff.
PART-TIME STAFF are those who work less than the normal weekly hours (usually 36
in London, 37 elsewhere).
FULL-TIME EQUIVALENTS staff in post figures include part-time staff according to the
proportion of full-time hours worked. Before 1995 part-time staff working 10 hours or
more per week were each counted as half a member of staff in arriving at a full-time
equivalent figure, and those working fewer than 10 hours per week were excluded.
Figures for earlier years in CIVIL SERVICE STATISTICS have been re-estimated on the
basis of the new methodology (see Table M, page 53).
HEADCOUNT staff in post figures give part-time staff equal weight with full-time staff.
PERIOD APPOINTMENTS are made where duration of the job is known to be limited or
where there are management reasons for appointing someone for only a limited
period to an ongoing post. They are included in permanent staff.
ANNEX B: DEFINITIONS AND SOURCES
e annexes 57-67 22/8/01, 10:46 am65

66
CIVIL SERVICE STATISTICS 2000
GROSS SALARY is the annual salary including basic pay, consolidated performance pay
and pay-related allowances such as regional allowances, skill allowances and
recruitment and retention allowances. It does not include non-consolidated bonuses,
overtime and reimbursement-type allowances. The salary information presented for
part-time staff is that which the employee would receive if working full time. This is
described as FULL-TIME EQUIVALENT SALARY.
RESPONSIBILITY LEVELS are an approximate assignment of personnel to a level of
seniority broadly equivalent to the former service-wide grades based on
considerations of salary and other job weight indicators. For the purposes of Civil
Service Statistics the description SENIOR CIVIL SERVICE LEVEL includes the Senior
Civil Service and also Permanent Secretaries, senior Diplomatic Service personnel and
a number of other staff at a similar level.
DATA SOURCESThere are two main data sources used in this publication; sources are listed at the
foot of each table and chart.
MANDATE is a central computer-based record of basic information supplied by
departments for almost all non-industrial civil servants in the Home Civil Service
(98 per cent). Individual level data are received from departmental staff records
showing each person’s gender, age, grade, location, etc. The following departments
and agencies did not report to MANDATE at 1 April 2000:
Foreign and Commonwealth Office
Wilton Park
Meat Hygiene Service
Car and Despatch Agency
Debt Management Office
Shadow Strategic Rail Authority
Office of Telecommunications
Office of the Rail Regulator
Property Advisers Civil Estate
Serious Fraud Office
The Buying Agency
The Rent Service
Food Standards Agency
e annexes 57-67 22/8/01, 10:46 am66

67
CIVIL SERVICE STATISTICS 2000
Office of Government Commerce
Security and Facilities Executive (SAFE)
National Health Service Purchasing and Supply Agency
MANUAL RETURNSFor these and some other departments and agencies, manual returns are provided
summarising the numbers and characteristics of their staff. In some cases, Mandate
information is not always fully consistent with the manual returns, for example
because of minor differences in timing. There may therefore be minor inconsistencies
between tables based on data from different sources.
ROUNDINGFigures are rounded as appropriate. Rounding may lead to inconsistencies between
the sum of individual cells and the totals in some tables, because totals are calculated
from the unrounded numbers. Figures in the reference tables are rounded to the
nearest ten. Caution should in all cases be used in interpreting small differences
or changes.
In all tables a dash (–) means nil or negligible and two dots (..) means not applicable
or not available.
SALARY DISTRIBUTIONSMedian salary is that which would be received by the person in the middle, if all staff
in the particular category were placed in a row according to the size of their salary.
The lower quartile is the salary of the person one quarter of the way along from the
lower end, and the upper quartile that of the person one quarter of the way along
from the upper end. Medians and quartiles have, as in past years, been calculated
from data aggregated into the salary bands (see tables F and G).
UPDATES POLICYWhile every effort is made to ensure the accuracy of information presented here,
occasionally new information is received which causes the figures to require revision.
When this happens, it will be announced in the next Civil Service Statistics press
notice, and revised figures will be posted on the Cabinet Office website.
J/N 01-7642/0108/D6.4
e annexes 57-67 22/8/01, 10:46 am67

CIVIL SERVICE STATISTICS 2000
CIVIL SERVICE STATISTICS has been merged withEQUAL OPPORTUNITIES IN THE CIVIL SERVICEData Summary, to present facts and figures on staffingin the Civil Service for the financial year 1999–2000.It highlights the key trends, covering staff numbers,diversity, entrants, leavers and resignations. CIVIL SERVICESTATISTICS also provides additional details of numbers bylocation, by responsibility level and by salary band.
CIVIL SERVICE STATISTICS 2000CABINET OFFICE
a front-back cover 22/8/01, 10:35 am2