Civil Service Fast Stream -...
76
Civil Service Fast Stream: Annual Report 2017 and 2018
Transcript of Civil Service Fast Stream -...

Civil Service Fast Stream: Annual Report 2017 and 2018

Civil Service Fast Stream: Annual Report 2017 and 2018 1
The Civil Service is a unique organisation, offering an almost unrivalled range of career opportunities.
One of the things that makes us unique is how we combine our collective skills and experience with our core values and sense of duty to make a real and positive difference to the lives of citizens.
The extent of that impact depends on teamwork and how we can bring a diversity of life experiences to bear on the issues that affect the people we serve. This means we need leaders who represent all of our communities; leaders who understand the needs of citizens and can build diverse, inclusive teams.
Our Fast Stream graduate development programme and Fast Track apprenticeships epitomise our ambition to be a champion of social mobility and support the aspirations of talented people, whoever they are.
We were among the first employers to open our flagship development programme to external scrutiny and publish the results. Responding to the 2016 report by the Bridge Group into socio-economic diversity in the Fast Stream, we have been able to demonstrate our determination to ensuring that the programme offers an inclusive route to leadership, whatever an individual’s background.
This annual report reflects the impact of the actions we have taken. The Fast Stream has seen a sharp increase in the number of applicants from lower socio-economic backgrounds. At the same time, candidates from ethnic minorities were more likely to apply for the Fast Stream in 2018 than in any previous year. Applications for our Early Diversity Internships have increased tenfold since 2016, and more than doubled for our Summer Diversity programme over the same period.
These developments have been recognised externally for how they support social mobility and diversity. In 2017, for example, the Fast Stream was Highly Commended in the UK Social Mobility Awards for Organisation of the Year, and was the highest-ranked public sector agency in the Social Mobility Employer Index.
On a broader measure, the Fast Stream held its position at No. 2 in The Times Top 100 Graduate Employers in 2018, and remained the Public Sector Graduate Employer of Choice.
This recognition reflects our commitment to making the Civil Service the UK’s most inclusive employer by 2020, and the importance of the Fast Stream to achieving that ambition. It also shows that we listened to voices like that of the Bridge Group and, for example, significantly increased our outreach work in universities with the most diverse student populations.
Foreword: Sir Mark Sedwill

Civil Service Fast Stream: Annual Report 2017 and 2018 2
We are rightly held to the highest standards in meeting the expectations of an increasingly diverse society. In May 2018, we were publicly held to account for our historic difficulty in recruiting people to the Fast Stream from black Caribbean backgrounds. We continue to attract candidates from minority ethnic communities, but the numbers joining our schemes are not as high as they should be. There will be no let-up in our work to increase diversity in the Fast Stream.
In July this year, we created the Diverse Leadership Task Force, which has agreed actions for 2018/19 and beyond. These include further expansion of diversity internships, and developing greater diversity among Fast Stream assessors. Our important collaboration with specialist partners in the private and third sectors, to help us recruit people from all backgrounds, will also continue.
These and other actions will help us to attract and develop the leaders of the future from every community in the UK, so that we can deliver better outcomes for all our citizens and merit the trust of the communities we serve.
Sir Mark Sedwill Cabinet Secretary and Head of the Civil Service
Foreword: Sir Mark Sedwill

Civil Service Fast Stream: Annual Report 2017 and 2018 3
1. Introduction
• Our role
• An overview of our schemes
• Our performance story
• Taking action on diversity
2. Schools Outreach
3. Marketing Attraction
4. How we assess
5. Fast Track Apprenticeship schemes
6. Our internship programmes
7. Fast Stream schemes
8. Success measures
9. Detailed analysis
4 45
11
13
15
18
21
24
28
37
39
Contents

Civil Service Fast Stream: Annual Report 2017 and 2018 4
To play our part in delivering a brilliant Civil Service by attracting talented people of all backgrounds to lead the future Civil Service. Our programmes will reflect modern Britain in respect of race, gender, sexuality, disability and socio-economic background.
The Schools and Colleges Outreach Programmes include our Discovery Events programme for 13 to 14 year olds, our Schools Mentoring Programme, and our Work Experience Programme.
These are targeted to young people aged 15 to 18 from a lower socio-economic background (lower SEB).
Our Fast Track Apprenticeship is a two-year Level 4 apprenticeship that is a rewarding alternative to university with a competitive starting salary.
The Fast Stream is the government’s flagship graduate programme to support and accelerate the development of talented people to become future leaders of the Civil Service.
As a precursor to our Fast Stream scheme, we also run two internships: the Early Diversity Internship programme (EDIP) and Summer Diversity Internship programme. These are intended to give a taste of life in the Civil Service as well as preparing future applicants for the Fast Stream scheme to give them the best chance of succeeding.
Our Role
An overview of our schemes

Civil Service Fast Stream: Annual Report 2017 and 2018 5
The Civil Service works in areas that make a difference in people’s everyday lives in the UK.
To be capable of serving modern Britain, the Civil Service must be more like modern Britain. Fast Stream and Early Talent is determined to show leadership in ensuring equality of opportunity for all.
At the end of 2015, Fast Stream and Early Talent asked for the Bridge Group report to help deliver our ambition to provide a diverse talent pipeline for the Senior Civil Service. This was the first of its kind published by any employer in the country. It showed there was more to do to make sure we matched our public statements with pragmatic approaches to change.
The research provided a springboard for an ambitious programme of work. We developed an action plan where we:
• created a completely new attraction website so candidates know exactly what to expect;
• increased our engagement with targeted academic departments to reach a diverse student body;
• engaged current Fast Streamers to advocate and communicate the value and openness of the Fast Stream and what the job involves;
• removed verbal and numerical online assessment, assessing cognitive ability at a later stage;
• invested in a new purpose-built assessment centre in Newcastle-upon-Tyne; and
• introduced Fast Pass to allow successful summer diversity interns to progress straight to the Fast Stream assessment centre.
This activity delivered much-improved results across a number of diversity categories.
External recognition
The Fast Stream received external acknowledgement and a number of awards for the work we do.
In 2017 we jumped from fourth to second place in the Times Top 100 Graduate Employers. This is based on independent research undertaken with undergraduates on campus. The 2017 UK Social Mobility Index (overseen by the Social Mobility Commission and Social Mobility Foundation) recognised us as the top public sector agency.
We also won many awards for our work around social mobility including:
• TargetJobs National Graduate Recruitment Awards 2018 – Best Diversity Strategy;
• FIRM Awards 2018 – Best Diversity & Inclusion Recruitment Strategy;
• National Undergraduate Employability Awards 2018 – Best Diversity Initiative in Work Experience; and
• Fast Stream was ‘Highly Commended’ in the 2017 UK Social Mobility Awards for Organisation of the Year.
Our performance story

Civil Service Fast Stream: Annual Report 2017 and 2018 6
Our performance story
Our headline figures at a glance
Fast Stream; Total Applications and Applicants Recommended for Appointment Since 2007
Fast Stream; Percentage of Applicants Recommended for Appointment by Diversity Groups Since 2013
Fast Stream; Percentage of Applications by Diversity Groups Since 2013
Fast Stream: Applications and Appointments by Diversity Group, 2018
Note: all figures and percentages in the charts and the summary exclude In-Service Fast Stream Competition. For diversity analysis, percentages are based on those candidates where the relevant diversity characteristic is known.
BAME abbreviation for black, Asian and minority ethnic; LGBO abbreviation for Lesbian, Gay, Bisexual and Other (data not available in 2013); SEB abbreviation for socio-economic background. Disability figure not included in 2016 report.

Civil Service Fast Stream: Annual Report 2017 and 2018 7
Total applications and appointments since 2007
At 40,570 the number of applications to the Fast Stream reached its highest ever total in 2017, equating to a 92% increase on 2015. The greater strategic marketing focus we first described in our 2016 annual report and developed as described below drove this sharp increase. And our continued marketing actions helped maintain application levels in 2018.
In addition, we have seen a steady increase in the number of applicants recommended for appointment. The number of applicants recommended for appointment has followed a general upward trend since 2011, reaching a high of 1,411 in 2018.
Our performance story
Summer Diversity Internship Programme; Percentage of Applications by Diversity Groups Since 2015
Fast Track; Percentage of Applications by Diversity Groups Since 2015
Early Diversity Internship Programme; Percentage of Applications by Diversity Groups Since 2015
Note: all figures and percentages in the charts and the summary exclude In-Service Fast Stream Competition. For diversity analysis, percentages are based on those candidates where the relevant diversity characteristic is known.
BAME abbreviation for black, Asian and minority ethnic; LGBO abbreviation for Lesbian, Gay, Bisexual and Other (data not available in 2013); SEB abbreviation for socio-economic background. Disability figure not included in 2016 report.

Civil Service Fast Stream: Annual Report 2017 and 2018 8
Our performance story
Fast Stream applications by diversity group since 2013
Specifically referring to the Bridge Group report’s recommendations on diversity we have made encouraging steps. We have seen a positive trend in the number of applicants across nearly all diversity groups.
Minority ethnic candidates were more likely to apply for the Fast Stream in 2018 than in any previous year. In 2018, 31.2% of applicants were minority ethnic (referenced as BAME in the charts above), representing an increase of more than 10 percentage points since 2015.
More than half of our applicants are female. Gender representation in senior positions is more important now than ever and we are proud that women feel the Civil Service is somewhere they can progress to that level.
Applicants who identify as Lesbian, Gay, Bisexual, Other (LGBO) have increased year on year since 2016. The proportion of applicants who identify as LGBO has increased from 6.3% of all applicants in 2014 to 9.3% of all applicants in 2018.
We have seen a sharp increase in the number of applicants from lower socio-economic backgrounds (SEB). There were around 5,100 lower SEB applicants in 2018, representing a 241% increase in the number that applied in 2015. This compares to an overall increase in applicants of 91%. Lower SEB applicants represented 16.3% of the total number of applicants this year. This is up from 7.9% in 2015.
Fast Stream applicants recommended for appointment by diversity group since 2013
Despite the large increase in the number of applicants generally, we have managed to maintain consistency in the percentages of applicants recommended for appointment. We have seen the proportion of female applicants recommended for appointment rise to a high of 53.8% in 2017 from 47.9% a year earlier with this level remaining at just below 53% in 2018. This improvement is mirrored for LGBO applicants; we reached our highest percentage in 2018 at 13.3%.
Minority ethnic candidates recommended for appointment reached a peak in 2017 at 18.3%. In 2018 it was disappointing in the sense that this figure dropped to 15.8% which is similar to the level in 2016. The proportion of disabled candidates recommended for appointment has remained reasonably constant throughout this period, with a spike in 2016 where 13.2% of those recommended for appointment were disabled. This figure was back at 9.9%, more typical for the period, in 2018. We aspire to a higher proportion of disabled candidates recommended for appointment so this is something that can’t be ignored.
We are working on our assessment processes to identify what measures can be put in place to ensure minority ethnic and disabled candidates are provided with every opportunity to progress through to the different schemes.
We have, however, achieved an encouraging increase year on year in the percentage of lower SEB applicants that have been recommended for appointment. Prior to

Civil Service Fast Stream: Annual Report 2017 and 2018 9
the Bridge Group report, the proportion of applicants recommended for appointment who are lower SEB remained fairly unchanged until 2017. The Bridge Group report was clear evidence of how we are actively engaged with the challenge of socio-economic diversity in the Fast Stream. Since implementing the report’s recommendations that proportion has gone up from 4.2% in 2016 to 8.3% in 2017 and then up to 9.1% in 2018. We recognise we still have more to do and are fully committed to maintaining our efforts.
Fast Stream applications and appointments by diversity group, 2018
A direct comparison can be made here between the percentage of applicants which fall into each diversity group and the percentage of people recommended for appointment. The aim would be to have the proportion at application level reflect a similar proportion at appointment level for each diversity group. There is a positive comparison from application to appointments for female, disabled and LGBO candidates. However, we need to improve on the conversion of minority ethnic and lower SEB candidates from application to appointment.
Internships
Our internship programmes are an important part of how we look to increase the diversity of applicants and appointments to the Fast Stream.
Applications to the Early Diversity Internship Programme (EDIP) have increased more than tenfold since its launch in 2015. Of the
1,112 applicants in 2018, 63% were female, an increase of around 7 percentage points since 2016. The proportion of minority ethnic applicants has remained high; the figure stood at 86.4% in 2018.
While numbers are relatively small and should, therefore, be treated with caution, the proportion of applicants recommended for appointment who were disabled increased to over 13% in 2018. We are concerned the proportion who were lower SEB fell from 32.7% to 23.1%. We are reviewing the reasons behind this in order to implement targeted action for our next recruitment round.
Of those recommended for appointment, the proportion who were female or minority ethnic remained similar in 2018 to the previous year at over 65% and over 85% respectively.
The Summer Diversity Internship Programme (SDIP) achieved a similar boost. There were 13% more applications in 2018 than in 2017, taking the total to around 3,040; applications had more than doubled between 2016 and 2017.
More than 60% of the applicants recommended for appointment were female; this has been the case for the last two years. Between 2016 and 2018 more than three-quarters of applicants were minority ethnic. And we have seen a steady increase in the proportion of lower SEB candidates recommended for appointment from 25.1% to 28.2% between 2016 and 2018.
Our performance story

Civil Service Fast Stream: Annual Report 2017 and 2018 10
Fast Track Apprenticeship
Diversity group representation among those recommended for appointment increased across the board from 2017 to 2018. LGBO candidates represented 10.7% of those recommended for appointment (up from 7.5% in 2016) while disabled candidates represented 9.7% (up from 7.4% over the same period).
Despite an increase in 2018, the proportion of candidates recommended for appointment who are minority ethnic remains below the 2016 level at 14.2% (17.4% in 2016).
Although this can partially be explained by the larger number of applicants versus available postings, we are working on our assessment processes to make sure we are providing the right opportunities for applicants to progress.
Our performance story

Civil Service Fast Stream: Annual Report 2017 and 2018 11
Fast Stream and Early Talent is committed to removing barriers to the success of diverse talent at entry stage and beyond.
The programmes are crucial pipelines for leadership roles, and our aim is to expand representation to match the relevant eligible populations and ensure we deliver on making Civil Service leadership reflective of the society it serves.
Our approach emphasises connecting the Fast Stream graduate programme, Fast Track apprenticeship programme, diversity internships and work experience programmes with the best candidates, including under-represented groups
Principal diversity interventions
• Rolling-out the two-year action plan arising from the 2016 Bridge Group report on removing barriers to those from diverse socio-economic backgrounds
• Introducing a new methodology for measuring socio-economic background
• Introducing a diversity-focused attraction website with clearer messaging, as well as more blogs, video content and profiles of diverse groups – supported by extensive social media activity
• Using our data to focus marketing and attraction efforts on specific communities, utilising relevant channels, messages and updated branding
• Introducing enhanced data insights for dynamic monitoring of progress
• Delivering curriculum-based interactions with targeted universities and engaging with widening participation teams, incorporating enhanced support for students – including piloting a new positive action package for universities
• Mobilising existing Fast Streamers, Fast Trackers and senior civil servants to be role models for the programmes on campus and at events
• Developing our early talent pipeline, encompassing EDIP and SDIP, piloting a new Autism Internship Programme, Schools Outreach Work Experience Programme and Year 9 Discovery events
Taking action on diversity

Civil Service Fast Stream: Annual Report 2017 and 2018 12
• Working with diversity partners, such as Rare Recruitment, MyKindaFuture and Elevation Networks – who provide insights into our diverse groups, and assist in identifying potential applicants, and help extend the reach of our marketing
• Providing support for diversity interns through more performance management and selection skills/ self-confidence coaching
• Using the “Fast Pass” approach for fast tracking summer interns to the Fast Stream assessment centre stage to help increase conversion
• Enhancing the Fast Stream assessment process by removing cognitive tests for most schemes, streamlining our e-Tray testing format, utilising a strengths-based video interview methodology and introducing a shorter, more engaging assessment centre format
• Fully updating our approach to Fast Track apprenticeship recruitment, making it more digital and a more positive candidate experience
• Bringing in a regional assessment centre – the first outside London – to engage better with candidates across the country
• Accelerating time to offer, to support engagement of under-represented and other groups.
• Developing a new talent definition that captures critical dimensions of more inclusive methods of identifying success.
Taking action on diversity

Civil Service Fast Stream: Annual Report 2017 and 2018 13
The Schools and Colleges Programmes outreach teamwork to support high potential students from a lower socio-economic background, raising aspirations, inspiring and informing about the work of civil servants and our entry routes.
We identify and actively engage schools that have a higher than the national average percentage of pupils eligible for free school meals.
Core programmes
Over the last two years, our Work Experience Programme has provided over 300 target students aged between 15 and 18 with opportunities to see what it is like to work in government. We have also supported other departments to deliver their own placements. This activity is on course to deliver about a further 150 work experience places.
We have mentored over 130 students. We started with only a small mentoring pilot of 22 schools. We are now planning to reach 200 schools by 2020.
We are very proud that we have already exceeded our 2020 target of 2,000 attendees to our Year 9 Discovery Events. We achieved 3,250 participants by Spring 2018.
As a result of taking part in our work experience programme, students find it informative. The majority would consider a future career in the Civil Service. 92% of students who attended our Discovery Events last year reported that they now understand much more about the work of civil servants.
A big thank you to you all for supporting our students with their work experience. The students have all shared that the experience was fantastic and one that they will take with them through their adult lives. The majority of our students who took part said they are interested in the Civil Service Apprenticeship Programme.
School Careers Adviser
I will 100% recommend this placement to every student no matter what their career path is because the Civil Service is so broad and interconnected. During this placement, you learn valuable skills that you will never learn in school. The managers are great people who give you a boost into the world of work in which institutions such as schools cannot deliver. It is a once in a lifetime opportunity and I cannot express in words how amazing this experience will be.
Student
Schools Outreach

Civil Service Fast Stream: Annual Report 2017 and 2018 14
In addition, we work to support impromptu requests that meet our social mobility criteria, typically to attend a careers fair. This has seen us respond to about 75 extra events out of approximately 200 requests.
We have started to create a Civil Service Schools Outreach Network (CSSON). We are bringing together colleagues across government so that we can improve our offer to students, schools and colleges in a more collaborative, efficient and streamlined way.
And we have worked with a leading industry partner, All About School Leavers (AASL), to create a new Diversity and Inclusion Award for the School Leaver industry market to increase activity in this area across the sector. AASL work to give school leavers career advice and help them find jobs.
Schools Outreach

Civil Service Fast Stream: Annual Report 2017 and 2018 15
Marketing attraction
Fast Track
We time our Fast Track recruitment campaigns to coincide with National Apprenticeship Week usually in the first week of March.
The number of Fast Track applications almost tripled from 7,215 in 2016 to 21,561 in 2017. In 2018 we experienced another increase to 24,477.
The Earn, Learn, Succeed programme slogan and our existing ‘Five Doors’ video content, continued to resonate with our main audiences. The core message was that Fast Track provides a genuine alternative to university. We built Fast Track brand awareness through increased engagements on social media. This included Twitter, up 118%, and on Facebook, up 59% on the previous year’s campaign. We increased our use of LinkedIn and Instagram. Our posts and adverts were seen at least 16 million times during the campaign window. In 2018, we introduced a new campaign slogan: ‘Where Brilliant Begins’. This highlighted the route for apprentices completing the Fast Track programme to apply to join the Fast Stream without a degree, directly contributing to social mobility.
The sharp increase in applications was attributable to a range of factors. We started our organic posting (that is unpaid social media promotion) earlier in the year to build a larger number of pre-registered prospective applicants. This enabled us to alert over 6,500 people that they could now apply as the campaign window opened.
We included each of our schemes as vacancies on Civil Service Jobs and promoted the roles
via local job centres. We piloted new social channels, aggregators and job boards. We targeted the geographic locations where we had traditionally attracted fewer applications. We used profiling to share our content with each of our target audiences. We paid particular attention to developing messaging to support each of our campaign pillars: ‘Earn, Learn, and Succeed’.
In 2018, the Fast Track apprenticeship expanded to include a new scheme, Policy. Marketing focused strongly on promoting this scheme, through new print, digital and video content. The campaign again used strong geographic and demographic targeting through a mix of paid digital advertising and job board advertising. Complementing this was a range of work undertaken by Cabinet Office press office to promote roles through a range of local and regional media.
New in 2018, were stronger alliances built with partners, including the National Apprenticeship Service. This saw role profiles actively promoted and postcode-specific direct mails issued to prospective apprentices registered with the service.
Fast Track ambassadors supported the campaign with a range of blogs, case studies and tips. We posted six short video clips on social media, featuring ambassadors talking about the three words they would use to describe their experiences and development on the Fast Track Apprenticeship programme. These all helped amplify the campaign significantly. The social and paid media posts drove around 100,000 clicks through to the Fast Track website on GOV.UK.

Civil Service Fast Stream: Annual Report 2017 and 2018 16
Marketing attraction
Fast Stream
2017 campaign
The campaign ran through a nine-week application window from 29 September to 2 December 2016. The marketing strategy was guided by the Bridge Group recommendations about how to diversify the Fast Stream. In particular, to increase the number of successful candidates from a lower socio-economic background. We introduced significant changes to attract the best candidates from a broad, diverse applicant pool. These included:
• focusing our campus outreach work on those universities with the most diverse student populations;
• mobilising the existing Fast Stream workforce to be ambassadors for the programme and deliver outreach activity;
• recruiting and allocating 14 deputy directors to work on campus to build sustainable relationships with faculty at the target universities. Wherever possible we assigned them to the institutions they had themselves attended and to curriculum subjects they had studied;
• introducing enhanced data insights for dynamic tracking of our process;
• increasing the availability and visibility of core messages to support lower socio-economic applications, including an updated micro-site; and
• promoting the innovative ‘Fast Pass’ route for successful interns on the Summer Diversity Internship Programme to progress straight to final stage assessment centres.
We trained campus outreach teams taking a curriculum focused approach for engagement with faculties. In response, campus teams reported a positive impact in increasing engagement with students from lower socio-economic backgrounds. Teams also reported attending a wider range of events at universities, including Q&A panels, presentations, networking events, drop-in sessions and skills and insight sessions.
Campus teams also continued their work with universities’ online platforms and social media. The programme of engagement included more than 300 events at 45 universities. We also attended off-campus events including national and regional jobs fairs and graduate careers events. As a result, of the 2016/17 campaign, including this new outreach approach, the number of applications rose to 40,570 (excluding in-service candidates).
Civil Service Fast Stream: Annual Report 2017 and 2018 17
Marketing attraction
2018 campaign
The 2017/2018 campaign saw continued focus a series of marketing actions to deliver an inclusive and engaging campaign. These actions saw us:
• run our campaign through a shortened application window from 14 September to 26 October 2017;
• market our two diversity internships, SDIP and EDIP, alongside Fast Stream as part of the core campaign;
• change our historic Fast Stream strapline ‘Where will you lead?’ to ‘Fast Stream: Where talented people do brilliant things’; and
• target diverse audiences through a range of audio, visual, and alternative media channels. These included Spotify, Mumsnet, Linkedin and Instagram; and
• train over 400 Fast Stream ambassadors to deliver campus activity, running 245 events, across 45 university and other venues.
The team produced a new, innovative brochure to promote Fast Stream, SDIP and EDIP together on campus. Our programme of regular organic social media posting helped drive unprecedented levels of social engagement.
The campaign achieved a 51% increase in web visits, Facebook impressions up 67%, Twitter by 72% and LinkedIn by 116%. 40,457 (excluding in-service candidates) people applied to the Civil Service Fast Stream. 3,037 to the Summer Diversity Internship Programme. And diversity representation continued to rise across the applicant pool.

Civil Service Fast Stream: Annual Report 2017 and 2018 18
How we assess
Our selection processes are fair, objective and efficient.
We recruit strictly on the basis of fair and open competition and selection on merit, in line with the Civil Service Commissioners’ Recruitment Principles.
We do everything possible to ensure that our assessment methods are scientifically robust, able to identify relevant attributes and are objective and capable of withstanding close scrutiny.
We use the latest selection technology and seek constantly to maximise its effectiveness – as well as ensure it is identifying the qualities we are seeking and is fair to all groups.
Fast Track Apprenticeship
The Fast Track selection process consisted of the following stages in 2017 and 2018:
• online application form;
• online tests; and
• assessment centre.
Up to date assessment methodologies are used for Fast Track at each assessment stage. This includes behavioural, situational and cognitive testing against criteria, as well as a bespoke assessment centre, along with detailed candidate feedback provision for the assessment centre stage.
Diversity Internships
The Early Diversity and Summer Diversity Internship Programmes (EDIP and SDIP) consist of the following stages:
• online tests (a situational judgement questionnaire and behavioural-based multiple choice questionnaire);
• online application form used to shortlist candidates (SDIP only); and
• telephone interview against competency and motivational areas.
Fast Stream
We aim to complete the selection process in the shortest possible time and to make job offers to the best candidates as quickly as we can, supporting candidate engagement.
When determining who has been successful we gradually finalise pass marks to ensure that we still have places remaining at the end of the recruitment year for high scoring candidates who we see late in the schedule. In addition, by ensuring that initial stages are online, we allow candidates to drive themselves through each stage of the process using a personalised applicant system.
The selection process in 2017 and 2018 consisted of the following stages:
• online tests (a situational judgement questionnaire and behavioural-based multiple choice questionnaire);

Civil Service Fast Stream: Annual Report 2017 and 2018 19
How we assess
• online in-tray exercise (the “e-Tray”);
• video interview;
• additional information stage for relevant schemes, along with a numerical test for Commercial and Finance schemes; and
• Fast Stream Assessment Centre (consisting of a leadership exercise, analysis exercise and group exercise).
Individuals entering any Fast Stream option have to pass the generic Fast Stream Assessment Centre. Some Fast Stream options apply a final selection procedure after the assessment centre before deciding who to recommend for appointment.
All candidates receive detailed feedback on their performance at the assessment centre in the form of an outcome report.
The Fast Stream runs a Direct Appointment Scheme for those who are narrowly unsuccessful at the Fast Stream Assessment Centre. This scheme offers candidates a mainstream post at either Executive Officer (EO) or Higher Executive Officer (HEO) grade if one becomes available. For the 2017 entry, 378 EO posts and 110 HEO posts were offered. In 2018, 587 EO posts and 539 HEO posts were offered through the scheme.
Achieving social mobility
An overwhelming priority of Fast Stream and Early Talent is social mobility, seeking to shift the horizons of individuals. We have measured applicant socio-economic status since 2011 (perhaps the first graduate recruiter to do so systematically). Our challenge was we had seen little shift in application or success rates.
As with our marketing attraction effort, we took actions on our recruitment process following the groundbreaking review by the Bridge Group. Principal activity included:
• introducing a new methodology for measuring and monitoring socio-economic background;
• introducing enhanced data insights for dynamic monitoring of progress in terms of application numbers and socio-economic background; and
• delivering a critical review of the way in which the Fast Stream defines and identifies ‘talent’, working towards more inclusive methods of identifying potential.

Civil Service Fast Stream: Annual Report 2017 and 2018 20
How we assess
Talent identification
Notable changes included a new selection approach that was specifically focused on diversity enhancement, social mobility and increasing engagement. This approach was reflected by the following:
• removal of the verbal and numerical online assessment to enhance diversity;
• new, updated digital testing relating to behavioural and situational judgement attributes;
• an online strengths-based video interview assessment, reducing the focus on candidate experience towards motivational/ potential elements;
• a half day, rather than one day, assessment centre
• a new regional assessment centre based in Newcastle to reach out to a more diverse population; and
• re-focusing assessment on fresh talent areas, such as leadership and learning agility.
• Our assessment centre actions meant we quadrupled the number of candidates that can be assessed in a day and therefore helped to deliver a shortened time to offer and better engagement.

Civil Service Fast Stream: Annual Report 2017 and 2018 21
Fast Track Apprenticeship schemes
Fast Track continues to attract and develop the best public servants who represent modern Britain in all its diversity.
Across 2017 and 2018 the programme onboarded 976 Fast Track apprentices providing them with the opportunity to kick-start their career in the Civil Service, offering stretching and developmental roles across a range of departments and professions. Our apprentices are supported to complete a Level 4 qualification over a two year period, in one of the following professions:
• Business Administration
• Commercial
• Finance
• Digital, data and Technology
• Policy
• Project Delivery
Fast Track Policy is a new scheme introduced in 2018 and has been a real success. Over 2,803 applications were received for the profession in its first year, a real achievement.
In terms of geographical footprint, in 2017 we placed Fast Track apprentices across 33 locations and 26 departments. In 2018 we achieved placements across 31 locations and 24 departments.
The number of opportunities offered across a range of locations attracts high calibre applicants from all backgrounds and this has continued to strengthen the diversity profile of the Fast Track apprenticeship.
Since the Fast Track was launched in 2013, over 2,000 apprentices have joined the programme and kick-started their Civil Service career. However, our ambition is to ensure the Fast Track continues to improve.
This year we have been working to identify opportunities to evolve and enhance the delivery of the scheme. Our ambition is to deliver a consistent quality of experience for apprentices across all departments, professions and locations through:
• improving delivery by identifying opportunities to continuously improve the experiences of apprentices from recruitment to graduation;
• increasing the quality of learning provision by ensuring consistency across all schemes and locations; and
• creating a greater sense of community by giving our apprentices the opportunity to form strong networks, supporting individuals to come together, to share ideas, raise awareness of challenges and provide support to each other.
We are already taking steps to address these three areas and this is something we will continue to focus upon in the upcoming 2019 Fast Track campaign.

Civil Service Fast Stream: Annual Report 2017 and 2018 22
Fast Track Apprenticeship schemes
Case Study:
Daniella Randall
When I finished my Fast Track Apprenticeship I knew that to support my development I needed to try something completely new and take myself out of my comfort zone. I was offered the opportunity to move across to the Department for Exiting the EU (DExEU). So I took the decision to take the leap and leave my current team in Civil Service HR.
I joined DExEU’s Flexible Resource Unit meaning I had the opportunity to work on many different areas. These included DExEU’s estate strategy, governance duties for their Executive Board and Operations Committee, the onboarding of Non-Executive Directors and supporting policy teams on various briefings. Most of these areas were completely new to me and it was a great experience working in the heart of government. The Fast Track scheme prepared me for this varied way of working. The network I had built up from my cohort meant that there were a few familiar faces across the department.
While at DExEU I was contacted by one of my previous Deputy Directors asking whether I was still interested in Project and Programme Management. This was something I had previously told her I was really keen to develop in. She let me know about a new Portfolio Management Office (PMO) being set up in CSHR that she felt would be a great opportunity for me. I was instantly interested in joining this new team. Although I enjoyed my
time at DExEU was also grateful to be returning to familiar terrain!
I worked alongside some really talented Project Delivery professionals within the PMO. They gave me many opportunities to learn and grow within this area. Knowing this was something I wanted to take forward, I have recently secured my promotion to SEO. I took on the role of Resources and Programme Manager within the Learning Delivery Team in CSHR. I am now managing a small team working to support key priorities across the learning and leadership space. I know this role will stretch and develop my skills in this area further.
Since the end of the scheme, I have taken every opportunity that has come my way to support my development journey. Whether that’s been formal learning opportunities (e.g. training to become a Mental Health First Aider); regularly meeting with my mentors; seeking out shadowing opportunities; or taking time to attend internally held learning sessions. There are so many great opportunities across the Civil Service to continue your learning and development journey after the end of the apprenticeship scheme that has provided me with the support and stretch to continue growing my career.

Civil Service Fast Stream: Annual Report 2017 and 2018 23
Fast Track Apprenticeship schemes
Case Study:
Hannah Turner
My career began in HMRC, gaining invaluable experience in HR and Talent Management while completing a Foundation Degree in Business and Administration.
Upon completing my apprenticeship, I was keen to progress my career while experiencing new areas of Government. I joined the Department for Education leading on Academy Policy for Doncaster. I spent time interacting with Local Authorities, Trust CEOs and headteachers on a daily basis.
In 2017, I moved to the Home Office to head up the Digital Internship and Junior Development Programme. This was recently named ‘Technology Development Programme of the Year’. My apprenticeship helped me gain the confidence to speak at government and industry-wide events. It has also enabled me to access further qualifications such as the Diploma in HR Management with CIPD I am currently working towards.
I am delighted that I recently won the Rising Star Award for the Yorkshire and Humber region!

Civil Service Fast Stream: Annual Report 2017 and 2018 24
Our internship programmes
Our Diversity Internship Programmes give people from diverse backgrounds the opportunity to see what a career in the Civil Service is like.
It puts talented undergraduates and graduates on a work placement in a government department. Our internships are aimed at the following groups: minority ethnic, lower SEB and people with a disability.
Interns can undertake Fast Pass, a quicker route to Fast Stream selection where interns who receive a positive appraisal are fast-tracked past the initial online selection stages. They also receive coaching support.
We offer two different internship programmes with the aim of fostering talent from a range of diversity groups and providing a platform for a potential career in the Civil Service.
Early Diversity Internship programme (EDIP)
The Early Diversity internship programme was introduced in 2015. The EDIP is a one week (five days) placement in a government department based in London, designed to give a better insight into a career in the Civil Service. It is available to first-year undergraduates who meet the diversity criteria and includes the following:
• a series of stimulating corporate networking and social events;
• an assessment survival workshop with all you need to know about applying for graduate vacancies;
• an allocated Fast Stream buddy; and
• an opening and closing reception attended by high-profile speakers, such as Civil Service diversity champions and inspirational external figures.
Applications to the EDIP have increased more than tenfold since its launch in 2015. Of the 1,112 applicants in 2018, over 60% were female; this figure was around 56% in 2016. The proportion of applicants who were minority ethnic has remained high; the figure stood at over 80% in 2018.
While numbers are relatively small and should, therefore, be treated with caution, the proportion of applicants recommended for appointment who were disabled increased to over 13% in 2018. The proportion who were lower SEB fell from 32.7% to 23.1%.
Of those recommended for appointment, the proportion who were female or minority ethnic remained above 60% and 80% respectively as in 2017.

Civil Service Fast Stream: Annual Report 2017 and 2018 25
Our internship programmes
Summer Diversity Internship Programme (SDIP)
Historically the Summer Diversity Internship programme has placed approximately 300 interns each year. In 2017, we increased the number of interns to 357 and then to 446 in 2018. In future years we will seek to increase the size of the programme significantly because the data shows that candidates are more likely to be successful in the Fast Stream selection process having gone through SDIP.
The SDIP programme is longer than the EDIP, covering six to nine weeks over the summer period. It is aimed at students in the final two years of their degree, currently achieving a 2:2 or higher in any degree subject. Again, applicants are required to meet the diversity requirements.
The SDIP is designed to be a more immersive and intensive Civil Service experience. Candidates carry out a variety of work ranging from conducting research to helping to draft policy documents.
We have worked hard to increase the number of participants in the last couple of years. This is even more of a priority following the introduction of Fast Pass in 2016. The Fast Pass enables SDIP interns to progress to the final stage of the Fast Stream selection process (the Fast Stream Assessment Centre) if they perform satisfactorily during the internship.
There were 13% more applications in 2018 than in 2017, taking the total to around 3,040; applications had more than doubled between 2016 and 2017. More than 60% of the applicants recommended for appointment were female; this has been the case for the last two years. Between 2016 and 2018 more than three-quarters of applicants were minority ethnic. we have seen a steady increase in the proportion of lower SEB candidates recommended for appointment from 25.1% to 28.2% between 2016 and 2018. both in terms of applications and recommendations for appointment.

Civil Service Fast Stream: Annual Report 2017 and 2018 26
Our internship programmes
Case Study:
Kasim Ali, Early Diversity Internship Programme
I first heard about the EDIP internship through a careers event held at my university. When I attended the talk, I still classed myself as a “fresher”, unknown to the concept of a graduate scheme. Listening to this talk held by the Fast Stream, it really inspired me to think about careers now in order to develop core skills which can be only be enhanced outside of academic studies. As soon I left that talk, I knew I was definitely going to apply. The EDIP seemed like the perfect opportunity to provide a springboard into the graduate world. This particular internship stood out for me amongst others due to nature of the sector you would be working in and the emphasis on diversity. I was also interested in seeing how a public organisation provides services for all citizens given the Civil Service does not have a focus on profit.
The internship was thoroughly interesting. I had the chance to experience a fast-paced environment where employees have to immerse themselves into projects. The EDIP also had great variation to it. I got the chance to participate in skills workshops, having the chance to effectively gauge what is expected of employees and learn about the intricacies of the Civil Service. I was also given many opportunities to network with so many talented Fast Streamers and learn about all the different pathways the Fast Stream has to offer. It was clear to me that everyone I met in the Civil Service was strongly passionate about their
work, which really inspired to get the most out of the EDIP as possible.
One highlight that particularly stood out for me, during my time on the EDIP, was attending an Energy and Climate Change meeting. It was fascinating to be a part of talks discussing environmental problems on a national scale. Through this meeting, I was also able to recognise the importance of diversity, with different people from different backgrounds all contributing different points of view which really stood out for me. This meeting allowed me to gain an appreciation of how diversity is an essential component of the Civil Service in order to reflect a diverse society. There was also a really beneficial application workshop during the EDIP, where I was able to get helpful guidance and tips on the Fast Stream application process.
I would strongly advise anyone who is thinking about internships to apply to the EDIP without hesitation! The feeling of starting a new chapter in your life at university coupled with the daunting fact that you will have to decide a career path in the next few years was very overwhelming for me. However, undertaking the EDIP strengthened my confidence for the graduate recruitment process. I am able to take away invaluable knowledge and newly developed skills, making me eager to apply for the Fast Stream.

Civil Service Fast Stream: Annual Report 2017 and 2018 27
Our internship programmes
Case Study:
Osama Qayyum, Summer Diversity Internship Programme
In summer 2018, I was selected to intern at the Cabinet Office as part of the Summer Diversity Internship Programme. I was with the Diversity and Inclusion Strategy Unit working on a number of exciting yet insightful projects. Luckily for me, there was also another intern working on the same project which made it all the more better.
Fortunately for us, we came in at just the right time when the team was working towards its big flagship event titled ‘National Inclusion Week’.
We planned to hold a number of practical workshops which aimed to equip participants with steps they could take in order to make their own working environments more inclusive. One of the workshops was based on leadership and would highlight the importance of Inclusive leadership and how someone can strive to become an inclusive leader.
I have learned a great deal. It has truly made me appreciate the importance of inclusion in the workplace. And it has also made me realise that diversity isn’t just important because we must represent our wider community, but that there is a business case for it too. Studies have frequently shown that a diverse workplace does a lot better when it comes to profitability and growth. I will certainly be taking these experiences on to my next endeavour.
One of the highlights of the internship was when I was invited to Number 10. This gave me a real insight into what goes on behind the scenes. I also had a tour of The Foreign and Commonwealth Office. One thing that was constant and really stood out throughout the internship was the sincere advice I was given by my seniors. Despite coming across interns for years, they shared the same passion and energy when talking about their work.
This internship has been a unique one for several reasons. But the one thing that has really stood out is the passion of the civil servants, the drive to make this country better day in day out. They are truly inspirational and in many ways, don’t always get the credit that they deserve.

Civil Service Fast Stream: Annual Report 2017 and 2018 28
Fast Stream schemes
We offered 15 different schemes to applicants.
These follow the two models for managing the Fast Stream, centrally managed and department or profession managed.
The following schemes are currently part of the centrally managed model: Generalist, Digital, Data and Technology, Government Communication Service, Science and Engineering, Finance, Commercial, Government Statistical Service and Project Delivery.
The following schemes are managed by a department or profession: Houses of Parliament, Diplomatic Service, Government Economic Service, Government Statistical Service, Government Social Research, Government Operational Research Service and Human Resources.
Changes to the schemes
In April 2018, the Civil Service Talent Board re-affirmed that the purpose of the Fast Stream. That is to attract, develop and retain a diverse and strategic pipeline to the Senior Civil Service. A number of changes have now been introduced for the Generalist Fast Stream and the 2018 cohort who joined us at basecamp this autumn. Fast Streamers already on the scheme also benefit from the transition towards the new model. These changes include:
• implementing a “cluster” based, or career interest areas, model for generalists. We have matched over 800 Fast Streamers into one of their top three preferred clusters;
• shortening the scheme to three years (which will also apply to the Commercial and Science and Engineering schemes). This means Fast Streamers have the opportunity to bring forward their readiness for successful graduation from the programme and to take the next exciting step in their careers;
• worked with more than 30 government departments and agencies to source 12-month postings. These will give Fast Streamers greater depth, focus and stability while they develop their leadership skills; and
• worked to improve the experience for all Fast Streamers through updates to our assessment and performance policy and processes. These include our rigorous End of Scheme Assessment, to incorporate the new “success profiles” approach which focuses on leadership, behaviours and strengths.
We are currently developing an approach to external secondments where they will be discretionary to support individual development rather than mandatory for everyone.
Alongside this, we have made significant improvements to our digital capability. We have rolled out Workday (a cloud-based HR platform) to almost 2,000 Fast Streamers across the centrally managed schemes, enabling them to manage their own profiles and improving access to data and information. Fast Streamers now have access to a new intranet platform that enables communication to be more efficient, engaging and accessible.

Civil Service Fast Stream: Annual Report 2017 and 2018 29
Fast Stream schemes
Our learning offer for Fast Stream candidates
Our learning offer continues to develop. We introduced Stepping into Leadership for the first time for third-year Fast Streamers across all centrally managed schemes.
The programme supports Fast Streamers to own their leadership learning. It uses a range of activities including workshops, online tools and peer support.
Fast Streamers provide very positive feedback. They report a good balance of theory and practice. The programme helps them think about their current style of leadership and what they would like to develop.
In addition, we have:
• introduced regional courses;
• improvements to the curriculum offer based on evaluation and feedback; and
• developed two new curriculum maps for the 3 and 4-year programmes.

Civil Service Fast Stream: Annual Report 2017 and 2018 30
Fast Stream schemes
Case Study:
Sajan Bhakoo, HR Fast Stream
When I left school, I chose to study history at university because I couldn’t decide what career I wanted to go into after. When I finished that, I stayed on for a masters, because even after three years of thinking, I still didn’t know. When I finished that, I joined the Fast Stream.
Sadly there had been no fourth year revelation, however the Fast Stream was perfect for that very reason. What attracted me above all else was the range of possibilities the Civil Service offered, along with the knowledge that the purpose of the graduate scheme was not tie you to a particular path, but to enable you to try different things and work out for yourself where you might want to end up.
And so, I headed off to my first posting at the Department for Transport with an entirely open mind. Straight away, I was amazed how much autonomy I was afforded by my managers, and also how much exposure my role gave me to senior leaders and politicians. More than anything, though, the role I was given was so broad that I was able to decide for myself what I wanted to prioritise, and the pieces of work I am most proud of ended up being the ones which I found myself and weren’t even in my job description when I started.
The ability to simultaneously experience work as a business partner, a cohort leader, a project manager and a transformation specialist gave me the type of breadth which I longed for. With
each project, I was able to slowly determine which types of work I enjoyed – and also which I did not. I was able to work out how I liked to work – and also how I did not. And, in learning more and more about how the wider Civil Service functioned, I was able to take an educated guess what future roles and departments I might find interesting – and, crucially, which I might not.
My second placement gave me everything my first placement had not. Joining the Foreign and Commonwealth Office, I moved from a large operational department, to a relatively small policy one. Thus, I was presented with a clean slate, and a whole range of completely new roles which I could use to continue my professional introspection.
Here too, the sheer range of experiences sets the Fast Stream apart from any other graduate scheme. Even just in the past few months, I have launched a new consular support policy, helped negotiate funding with HM Treasury, written a briefing for the Prime Minister from the Crisis Centre, presented numerous papers to our Executive Committee, and even met the Queen!
For me, what makes the Fast Stream so great is that even after all that, I still have no idea what I want to do when I finally graduate next year! But half the fun is taking all the opportunities which come your way and letting your career build around you, rather than the other way round.

Civil Service Fast Stream: Annual Report 2017 and 2018 31
Fast Stream schemes
Case Study:
James Yan, Generalist Fast Stream
I first heard about the Fast Stream when I was doing my A levels but didn’t really know what it was. After more research I thought it could be a really interesting career path to try and pursue. So I looked into how I could gain more insight into the sector and prepare for applying. I did the Summer Diversity Internship Programme (SDIP) and was placed in the Future of Europe strategy team at the FCO for six weeks. This gave me a good understanding of the how the Civil Service works. And it made me appreciate the efforts of the Civil Service to increase diversity in its people to reflect the society it serves. My ethnic background is Chinese and there aren’t many people like me in the Civil Service. So it was great to be able to add my perspective to the conversation. The SDIP made me decide I really wanted to apply for the Fast Stream. My next step was ensuring I put in the best application I could.
In my final year of studying International Management and French at University of Bath I dedicated a lot of time to practising online tests and going through my previous work experience (I worked at a startup for my year abroad) to see what competencies I could cover. The hard work paid off and I started the generalist Fast Stream in October 2015. My first posting was in UK Export Finance UKEF) doing product development. I appreciated the amount of responsibility and training I got from day one. This is something that I really value about my experience in the Fast Stream. There have
been plenty of opportunities in my various postings to develop my skills as a leader.
After UKEF I went on to be a devolution strategy policy adviser at Department for Communities and Local Government, a children and young people’s policy adviser for Barnet council during my secondment, a contracts manager at Department for Work and Pensions, a High Value Campaigns programme manager at Department for International Trade (DIT) and right now I am working on the Comprehensive and Progressive and Agreement for Trans Pacific Partnership also in DIT.
In my experience I have found the culture in the Civil Service to be supportive, positive and collaborative. In general, there is an unwavering commitment to honesty and integrity, values which I hold very dear and ones which are crucial for public service and in any walk of life. I have thoroughly enjoyed my time on the Fast Stream. And am still amazed at the variety of work you can get stuck into to help improve different aspects of society.
Civil Service Fast Stream: Annual Report 2017 and 2018 32
Fast Stream schemes
Testimonies from Fast Streamers currently working in DExEU
Case Study:
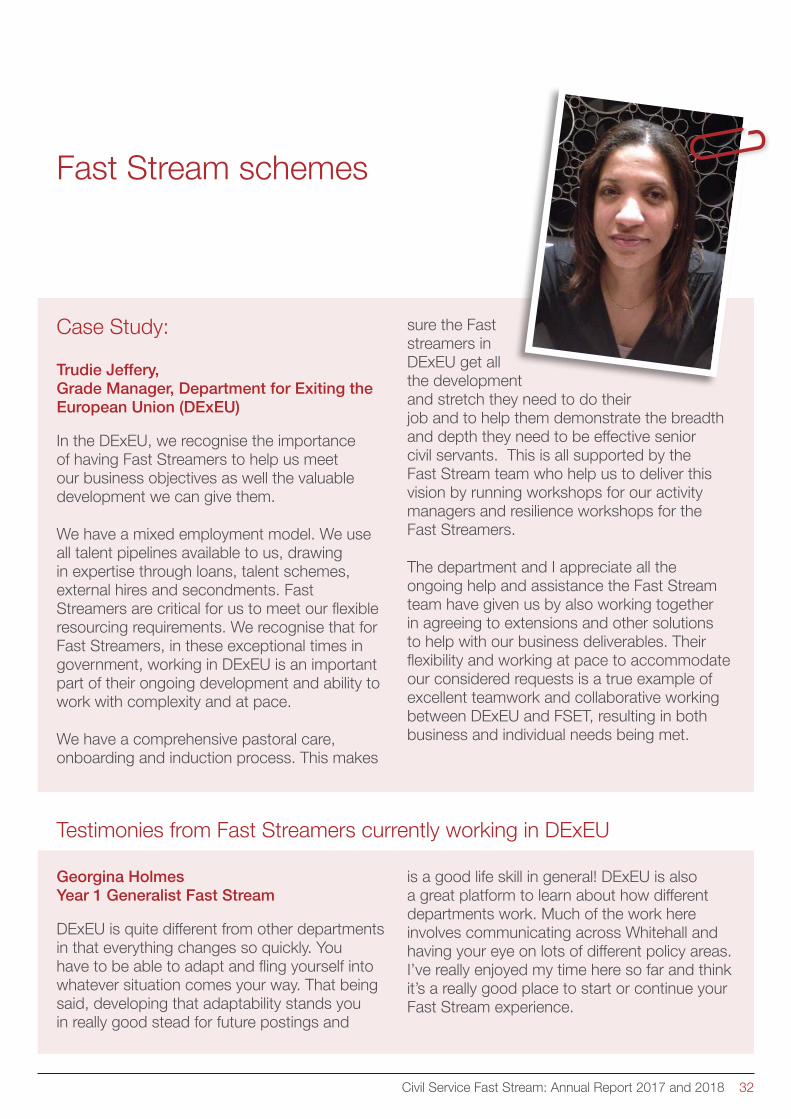
Trudie Jeffery, Grade Manager, Department for Exiting the European Union (DExEU)
In the DExEU, we recognise the importance of having Fast Streamers to help us meet our business objectives as well the valuable development we can give them.
We have a mixed employment model. We use all talent pipelines available to us, drawing in expertise through loans, talent schemes, external hires and secondments. Fast Streamers are critical for us to meet our flexible resourcing requirements. We recognise that for Fast Streamers, in these exceptional times in government, working in DExEU is an important part of their ongoing development and ability to work with complexity and at pace.
We have a comprehensive pastoral care, onboarding and induction process. This makes
sure the Fast streamers in DExEU get all the development and stretch they need to do their job and to help them demonstrate the breadth and depth they need to be effective senior civil servants. This is all supported by the Fast Stream team who help us to deliver this vision by running workshops for our activity managers and resilience workshops for the Fast Streamers.
The department and I appreciate all the ongoing help and assistance the Fast Stream team have given us by also working together in agreeing to extensions and other solutions to help with our business deliverables. Their flexibility and working at pace to accommodate our considered requests is a true example of excellent teamwork and collaborative working between DExEU and FSET, resulting in both business and individual needs being met.
Georgina Holmes Year 1 Generalist Fast Stream
DExEU is quite different from other departments in that everything changes so quickly. You have to be able to adapt and fling yourself into whatever situation comes your way. That being said, developing that adaptability stands you in really good stead for future postings and
is a good life skill in general! DExEU is also a great platform to learn about how different departments work. Much of the work here involves communicating across Whitehall and having your eye on lots of different policy areas. I’ve really enjoyed my time here so far and think it’s a really good place to start or continue your Fast Stream experience.

Civil Service Fast Stream: Annual Report 2017 and 2018 33
Fast Stream schemes
Testimonies from Fast Streamers currently working in DExEU
Nick Edmonds Year 2 Generalist Fast Stream
Working in DExEU as a Fast Streamer is a truly unique experience. It’s a chance to see, right from the middle of it all, how government is tackling one of the greatest programmes of change since the second world war. Wherever you are across the department, opportunities abound to play your part in delivering stimulating and high-level work. This ranges from supporting negotiations or planning for the future economic partnership, to ensuring that the United Kingdom is fully
prepared to adapt to whatever the outcome of Brexit may be. There is a big contingent of Fast Streamers around the department. I’ve struck up a number of good friendships here, and I’ve always been able to talk to my manager, or peers if I’ve ever needed support. DExEU recognises that it is a very different environment in which to operate. The department runs a comprehensive set of introductory and training sessions when you start, making sure you’re comfortable with the EU context and have the skills to contribute, develop yourself and enjoy your time here.
Chris Sidhu Year 2 Generalist Fast Stream
My time at DExEU has provided me with an environment in which I can develop my skills at an accelerated pace, even by Fast Stream standards. The constantly shifting context of Exit provides Fast Streamers with plenty of opportunities to be involved with and to have responsibility for significant and exciting pieces of work. This is a chance to shape the outcome of the most significant political issue of our time and to see it unfold from a ringside seat.
DExEU is a young and flexible department that isn’t stifled by unnecessary hierarchy or undue process. It’s really about who’s the right person to be in the room and do the job. Being a central department means that you interact with officials across Whitehall, across the country and internationally, allowing you to gain exposure to a range of policy areas and ways of working all while staying in a single role. I’ve had regular ministerial exposure, both to junior and senior ministers across Whitehall and have been to Brussels and various parts of the UK during my time here.

Civil Service Fast Stream: Annual Report 2017 and 2018 34
Fast Stream schemes
Testimonies from Fast Streamers currently working in DExEU
Dylan Bruce Year 2 Generalist Fast Stream
The fast-moving and varied work in DExEU is constantly providing me with new ways to stretch and develop, learning new skills and taking opportunities to be a bigger part of ‘bigger’ work. This is notwithstanding the fascinating experience of working on the frontline of one the UK’s most significant and complex policy problems in recent history. I’ve found myself leading cross Whitehall processes, organising diplomatic engagement and getting to grips with the intersection of international and domestic policy in a way I can’t imagine getting close to in another department.
Absent an entrenched hierarchical culture, the department is fresh and flexible. Rewarding capability and letting you make your mark on a department that’s work is being formed day by day, minute by minute, by Fast Streamers like me. The people in DExEU are usually driven, intelligent and have taken their role to rise to a new challenge. It is exactly the kind of attitude and culture that we are encouraged towards in the Fast Stream. The benefits are only multiplied when that is replicated across the whole department. On top of all this, there is an excellent support system and a real attentiveness to important issues like mental health. I’ve often felt challenged and stretched in DExEU, but very rarely have I felt stressed or unhappy.
Thomas Charles Year 4 Generalist Fast Stream
If you’re going to be a civil servant then working on the hottest political topics and the greatest delivery challenges of the day ought to what drives you. There’s no doubt that Brexit, and therefore working in DExEU, fulfil those aspirations.
The extraordinary complexity and challenging nature of the work has pushed me to expedite my development, gaining a breadth and depth of experience that might take far longer to gain in any other government department. That
stretch has also enabled me to perform a grade above my level and benefit from the experience of doing so.
The reactive and collaborative nature of the work means that there are endless opportunities to pick up new areas of work or push yourself further in areas where you recognise a development need or a requirement to fill a competency gap.
In spite of the challenges and pressures associated with working on such a complex task, the culture in DExEU is very collaborative, supportive and kind.

Civil Service Fast Stream: Annual Report 2017 and 2018 35
Fast Stream schemes
Testimonies from Fast Streamers currently working in DExEU
Joel Rosen Year 4 Generalist Fast Stream
I’ve worked in DExEU for a year and seven months now; first in the Market Access and Budget Directorate, and then after a short secondment in the International Agreements and Trade Directorate. I’m now the Senior Policy Adviser for Switzerland in the ‘Near Neighbours’ (EFTA and Turkey) Team. I’m responsible for transitioning our agreements with Switzerland. It’s a heady mix of policy, diplomacy, programme management, and law. And I wouldn’t give it up for the world!
I was drawn to DExEU for two main reasons. It’s arguably the greatest challenge the UK has faced since the Second World War. I couldn’t think of a better environment in which to develop myself as a leader than the complex and highly ambiguous one Brexit presented me with. Secondly, I knew early on that this department would draw in some of the best and brightest civil servants (and non-civil servants too). People from whom I could learn and gain new skills.
So far, my time here has exceeded my expectations. I’ve had the privilege of helping build a new department from scratch, and still see some of the things I put in place a year on. DExEU took in a lot of Fast Streamers from the
start. We’ve played a huge role in shaping it, and have taken on roles involving enormous amounts of responsibility – from heading up bill teams to negotiating new international agreements. But as much as I’ve shaped DExEU, it’s shaped me too. I feel I’ve become a better policy official with a wider range of skills. A leader who can flex his style to the situation and deliver collaboratively and inclusively under extreme pressure.
Yes, it can get hectic at times, but it’s exciting and no day’s the same. You learn to thrive in ambiguity and uncertainty and embrace your exceptional context. DExEU’s got a friendly, collaborative and inclusive culture. Your colleagues have always got your back, and no matter how tough it gets we all support each other. It’s no wonder we enjoy one of the highest people survey scores in Whitehall, and we attract some of the brightest and most highly skilled staff.
I’m keen to stay in this department for as long as I can. With the new challenges every day brings, the learning curve here has never flattened for me. I feel completely at home in this environment. While I don’t know exactly where my journey will take me, I do know it’s going to be absolutely thrilling and I think I’ll continue to enjoy every minute of it.

Civil Service Fast Stream: Annual Report 2017 and 2018 36
Fast Stream schemes
Case Study:
Kohinoor Meghji, Senior HR Business Partner, Government Communication Service (GCS)
The development of diverse confident, inspiring and empowering leaders is a priority for GCS. That’s why the Directors of Communication across the GCS collectively endorsed this specialist scheme. The GCS Fast Stream attracts passionate, talented individuals. They are keen to develop their skills while making an immediate impact in their teams. My team leads on defining the right experience and training to grow GCS Fast Streamers into leadership roles in some of our most high profile positions.
We give Fast Streamers the opportunity to demonstrate the full breadth of their skills working on communication projects across government. Communication is crucial in successful policy implementation. Whether it is raising awareness, influencing attitudes and behaviour, promoting effective operation of government services, supporting our citizens in times of crisis or helping them to understand decisions made. Fast Streamers in these roles learn the importance of balancing sound judgement and the ability to innovate with a different way of thinking. They add value by providing well-considered constructive challenge, sharing insights and best practice from their experience in other government departments and delivering impactful results.
We have been able to place GCS Fast Streamers into a range of roles across the main communications disciplines. Working on campaigns such as GREAT, people’s pensions, public service recruitment, Change4Life, modern slavery, and apprenticeships. From the Number 10 digital team to strategic communications in the Foreign Commonwealth Office, internal communications in the Ministry of Defence and Campaigns in the Cabinet Office.
This scheme is one of a number of early talent initiatives for the profession, with GCS Fast Streamers playing an important role in ensuring our profession continues to be one of the most renowned, both within and outside of government. We look forward to developing the next cohort of future communication leaders.

Civil Service Fast Stream: Annual Report 2017 and 2018 37
Success measures
The success of the Fast Stream and Fast Track Apprenticeship is measured against a considered set of key performance indicators.
These indicators measure our success against our strategic objectives and are monitored by the Research and Analysis team within Fast Stream and Early Talent.
Attraction and recruitment
• The percentage of individuals by diversity category who apply to Fast Stream and its comparison to diversity in eligible candidate pools as measured by external benchmarks provided by the Higher Education Statistics Agency (HESA);
• The percentage of individuals by diversity category who apply to Fast Track and its comparison to diversity in eligible candidate pools as measured by external benchmarks.;
• The diversity of individuals appointed and its comparison to diversity in eligible candidate pools as measured by external benchmarks; and
• The length of the Fast Stream recruitment process from application to offer (Time to Offer) for at least 51% of applicants.
For Fast Stream, we source data from the Higher Education Statistics Agency (HESA).
Finding appropriate benchmarks for the Fast Track is challenging because of the requirements for Fast Track: that applicants must have five A* to C GCSEs but no degree. Isolating that population is not possible. Consequently, we have selected benchmarks on the basis that it must be:
a. from government data, as recent as reasonably possible; and
b. subject to reasonable pragmatic adjustments when there is a clear argument to do so.
Data sources include the Census, the Family Resource Survey, the Labour Force Survey and ONS Experimental Statistics on Sexual Identity.
The 2016 Bridge Group report stated the average time between an applicant applying for a graduate position and receiving an offer is eleven weeks. On average the Public Sector had the longest time from application to offer (15.5 weeks) while the IT and Telecommunications sector had the shortest (6.8 weeks). The Fast Stream time from application to offer at the time ranged from 18 to 31 weeks.
Our time to offer in 2017 was 24.6 weeks (median). In 2018 we achieved our goal of 12.9 weeks (median).

Civil Service Fast Stream: Annual Report 2017 and 2018 38
Success measures
Following appointment
• The proportion of individuals passing End of Scheme Assessments (ESA).
It is through these indicators we will demonstrate our progress in attracting and retaining people of talent and experience from a range of sectors and all walks of life in our Fast Track Apprenticeships and Fast Stream schemes.

Civil Service Fast Stream: Annual Report 2017 and 2018 39
The detailed analysis section presents statistics on the registrations, applications and recommended for appointments to Fast Stream and Early Talent programmes for the 2017 and 2018 recruitment period.
Changes from previous editions
We are continuously looking to improve the way we present our statistics, provide better readership and ensuring statistics remain central to our purpose. With this aim, we have made the following changes from previous editions:
• condensed the headline statistics by diversity category for the Fast Stream into one central table, similar to those presented for Fast Track Apprenticeship (FT), Summer Diversity Internship (SDIP) and Early Diversity Internship programmes (EDIP);
• removed breakdown by Fast Stream scheme to provide a greater focus on the bigger picture of the Fast Stream programme;
• improved the readership of the university breakdown and degree subject tables by grouping universities into known comparison groups, degree subjects into higher categories and schemes into clusters;
• edited titles to make table meanings clearer, where needed;
• added footnotes to provide further details and clarity, where needed.
• degree class is no longer a mandatory required field by applicants, therefore we no longer report analysis by degree class;
• under sexual orientation, grouped ‘Other’ with Lesbian, Gay and Bisexual (LBG) to have a new grouping classification of ‘Lesbian, Bisexual, Gay and Other’ (LGBO); and
• socio-economic measures based on parental occupation and free school meals are now the preferred methods of attributing socio-economic status by a number of government departments including the Cabinet Office, therefore we no longer report analysis by school type for the Fast Stream. Given the eligibility of the Fast Track programme, analysis by school type is presented along with other key socio-economic measures at this level.
Statistical disclosure control
The introduction of the General Data Protection Regulation (GDPR) has meant a review of our data practices and collections to ensure they are fit for purpose and that we appropriately present publications based on ethical, practical or legal considerations. Furthermore, the Government Statistical Service (GSS) and Government Social Research Service (GSR) approved guidance requires us to take reasonable steps to ensure that our published or disseminated statistics protects the confidentiality of individuals on our programmes.
Detailed analysis

Civil Service Fast Stream: Annual Report 2017 and 2018 40
Disclosure control refers to the methods that reduce the risk that confidential information is published. These methods are applied if ethical, practical or legal considerations require the data to be protected. Disclosure control involves modifying presented data so that the risk of identifying individuals is reduced, but at the same time attempts to find a balance between improving confidentiality protection and maintaining an acceptable level of quality and transparency in the published data.
The following disclosure control methodologies have been applied to the tables in this publication:
• aggregation of tables into higher summaries;
• primary suppression – counts of individuals less than 5 are not disclosed. Where this action has been taken, the reported data value has been recorded with an asterisk (*);
• secondary suppression – further suppression on other reported categories may be required where a primary suppression has taken place. In these instances, the primary suppressed value can be calculated or deduced from other data presented in the table. Note – secondary suppressed values are not strictly defined to counts of individuals less than 5. Where this action has been taken, the reported data value has been recorded with an asterisk (**);
• percentages related to suppressed counts of individuals are not disclosed. Where this action has been taken, the reported data point has been recorded with a dash (-) in-line with all other non-calculable percentages; and
• in some cases, 0 values can be revealing when tabulated with primary and secondary suppressed values, totals and other data presented in the table. In these instances, 0 values will be suppressed.
It should be noted, that groups or categories may not tally to totals where suppression has taken place.
Data true as of records held at 1 October 2018.
Feedback
We will be completing a review of the way we present, disclose and communicate data for future reports. Any comments or suggestions on the structure, presentation or usability of statistics in this report are greatly appreciated and will be helpful in driving future changes.
Please contact us with your feedback at: [email protected].
Detailed analysis

Table 1: Headline Summary, Fast Stream Recruitment 2017
Vacancies Registrations Applications Recommended for appointment
Success rate (as % of
applicants)
Declined appointment
Grand Total 1,330 43,952 40,570 1,233 3.0% 193
Vacancies Applications (by first preference)
Recommended for appointment
Success rate Declined Appointment
Generalist 458 6,547 567 8.7% 98 Houses Of Parliament * 2,339 * * *Diplomatic Service 60 11,543 52 0.5% N/AScience and Engineering ** 1,714 ** ** **Total 540 22,143 645 2.9% 106
Vacancies Applications (by first preference)
Recommended for appointment
Success rate Declined Appointment
Government Economic Service 259 1,063 118 11.1% N/AGovernment Statistical Service 55 470 24 5.1% **Government Social Research 69 2,820 29 1.0% N/AGovernment Operational Research Service 55 509 33 6.5% N/ADigital and Technology 66 1,384 56 4.0% N/ACommercial 43 1,426 53 3.7% 13 Finance 71 1,984 69 3.5% 27 Human Resources 80 3,241 108 3.3% 40 Government Communication Service 25 1,935 25 1.3% N/AEuropean1 N/A 1,846 N/A N/A N/AProject Delivery 67 1,749 73 4.2% *Total 790 18,427 588 3.2% 87
Notes:1Applicants to the European Fast Stream scheme were transitioned to the Generalist scheme mid-way through the application process, following the decision to no longer offer a European scheme pathway after the EU referendum result.N/A - data is not available.* Primary suppression.** Secondary suppression.
All Fast Stream Schemes (excluding In-Service Fast Stream Competition)
Graduate Fast Stream
Other Fast Stream Schemes

Table 2: In-service Fast Stream Competition, Fast Stream Recruitment 2017
Total
Number % known Number % known Number % totalApplications 2,196 54.5% 1,832 45.5% 77 1.9% 4,105Recommended for appointment 46 51.7% 43 48.3% 0 0.0% 89
Number % known Number % known Number % totalApplications 2,712 69.6% 1,186 30.4% 207 5.0% 4,105Recommended for appointment 71 ** ** - * - 89
Number % known Number % known Number % totalApplications 3,551 89.6% 414 10.4% 140 3.4% 4,105Recommended for appointment 74 83.1% 15 16.9% 0 0.0% 89
Notes:N/A - data is not available.* Primary supression.** Secondary suppression.% of known refers to proportions calculated off responded or known categories only.
Other & don't know / prefer not to say / non-respondents
4,105 89 2.2% N/A
Non-disabled Disabled Prefer not to say / non-respondents
Disability
Total
Total
Gender
Ethnicity
Total
TotalWhite Ethnic Minority Non-respondents
Applications Recommended for appointment Overall success rate (as % of applicants)
Declined appointment
Male Female

Table 3: Breakdown by Diversity, Fast Stream Recruitment 2017
Number % known Success rate Number % known Success rate Number % total Success rate Number Success rateRegistrations 19,873 48.8% - 20,890 51.2% - 3,189 7.3% 43,952 -Applications 19,548 48.8% - 20,487 51.2% - 535 1.3% 40,570 -Recommended for appointment 562 46.2% 2.9% 654 53.8% 3.2% 17 1.4% 3.2% 1,233 3.0%
Number % known Success rate Number % known Success rate Number % total Success rate Number Success rateRegistrations 28,912 72.4% - 11,013 27.6% - 4,027 9.2% - 43,952 -Applications 28,476 72.6% - 10,733 27.4% - 1,361 3.4% - 40,570 -Recommended for appointment 985 81.7% 3.5% 221 18.3% 2.1% 27 2.2% 2.0% 1,233 3.0%
Number % known Success rate Number % known Success rate Number % total Success rate Number Success rateRegistrations 37,879 93.8% - 2,518 6.2% - 3,555 8.1% - 43,952 -Applications 37,121 93.8% - 2,472 6.2% - 977 2.4% - 40,570 -Recommended for appointment 1,094 91.0% 2.9% 108 9.0% 4.4% 31 2.5% 3.2% 1233 3.0%
Number % known Success rate Number % known Success rate Number % total Success rate Number Success rateRegistrations 35,840 91.3% - 3,432 8.7% - 4,680 10.6% - 43,952 -Applications 35,199 91.2% - 3,376 8.8% - 1,995 4.9% - 40,570 -Recommended for appointment 1,036 89.1% 2.9% 127 10.9% 3.8% 70 5.7% 3.5% 1,233 3.0%
Number % known Success rate Number % known Success rate Number % known Success rate Number % total Success rate Number Success rateRegistrations 24,771 69.4% - 6,057 17.0% - 4,883 13.7% - 8,241 18.8% - 43,952 -Applications 24,427 69.4% - 5,967 17.0% - 4,805 13.7% - 5,371 13.2% - 40,570 -Recommended for appointment 884 79.5% 3.6% 136 12.2% 2.3% 92 8.3% 1.9% 121 9.8% 2.3% 1,233 3.0%
Number % known Success rate Number % known Success rate Number % total Success rate Number Success rateRegistrations 25,812 82.1% - 5,616 17.9% - 12,524 28.5% - 43,952Applications 25,439 82.2% - 5,512 17.8% - 9,619 23.7% - 40,570 -Recommended for appointment 916 88.2% 3.6% 122 11.8% 2.2% 195 15.8% 2.0% 1,233 3.0%
Notes:1LGBO stands for Lesbian. Gay, Bisexual and Other. This is a new grouping classification that has been introduced in the 2017/18 report.% of known refers to proportions calculated off responded or known categories only.
Prefer not to say / non-respondents Total
Male Female
Free School Meals
Higher managerial, administrative and professional occupations
Intermediate occupations Routine & Manual occupations Non-respondents and non-working Total
Socio-economic Background
Lesbian/Gay/Bisexual/Other (LGBO)1Heterosexual Prefer not to say / non-respondents Total
White Ethnic Minority Non-respondents Total
TotalOther & don't know / prefer not to say / non-respondents
Excluding In-Service Fast Stream Competition
Gender
Ethnicity
Disability
Sexual Orientation
Not eligible for Free School Meals Eligible for Free School Meals Prefer not to say / non-respondents Total
Non-disabled Disabled

Table 4: Detailed Breakdown of Ethnicity, Fast Stream Recruitment 2017
Number % known % total Number % known % totalWhite - British 25,353 64.7% 887 73.5% 3.5%White - Irish 583 1.5% 20 1.7% 3.4%White - Gypsy or Irish Traveller 12 0.0% * - -White - Any Other White Background 2,528 6.4% 78 6.5% 3.1%Asian or Asian British - Bangladeshi 747 1.9% 12 1.0% 1.6%Asian or Asian British - Indian 1,913 4.9% 52 4.3% 2.7%Asian or Asian British - Pakistani 1,388 3.5% 17 1.4% 1.2%Asian or Asian British - Any other Asian background 675 1.7% 13 1.1% 1.9%Black or Black British - African 2,590 6.6% 21 1.7% 0.8%Black or Black British - Caribbean 510 1.3% 12 1.0% 2.4%Black or Black British - Any other Black background 145 0.4% * - -Chinese or other ethnic group - Chinese 436 1.1% 9 0.7% 2.1%Mixed - White and Asian 705 1.8% 32 2.7% 4.5%Mixed - White and Black African 218 0.6% 8 0.7% 3.7%Mixed - White and Black Caribbean 338 0.9% 11 0.9% 3.3%Mixed - Any other Mixed background 590 1.5% 26 2.2% 4.4%Any other ethnic background 478 1.2% ** - -Non-respondents 1,361 3.4% 27 2.2% 2.0%Total 40,570 1,233 3.0%
Notes:* Primary suppression.** Secondary suppression.
Applications Recommended for appointment
All Fast Stream Schemes (excluding In-Service Fast Stream Competition)
Success rate

Table 5: Analysis by University, Fast Stream Recruitment 2017Excluding In-Service Fast Stream Competition
Applications Recommended for appointment
Applications Recommended for appointment
Applications Recommended for appointment
Applications Recommended for appointment
Oxbridge 1,438 134 145 31 285 34 1,868 199 10.7%Russell Group excluding Oxbridge 9,697 352 1,832 111 4,362 207 15,891 670 4.2%Other 8,728 102 2,417 41 7,290 103 18,435 246 1.3%Non-respondents 2,280 57 468 21 1,628 40 4,376 118 2.7%Total 22,143 645 4,862 204 13,565 384 40,570 1,233 3.0%
Notes:Analytical schemes: Government Economic Service, Government Social Research Service, Government Operational Research Service, Government Statistical Service.Specialist schemes: Commercial, Digital & Technology, European, Finance, Government Communications, Human Resources, Project Delivery.
Graduate Fast Stream Analytical Schemes Specialist Schemes Total Total success rate

Table 6: Analysis by Degree Type, Fast Stream Recruitment 2017
Excluding In-Service Fast Stream Competition
Applications Recommended for appointment
Applications Recommended for appointment
Applications Recommended for appointment
Applications Recommended for appointment
Science subject areas 3,770 88 1,019 54 2,513 69 7,302 211 2.9%Non-science subject areas 17,850 548 3,774 149 10,621 303 32,245 1,000 3.1%Total1 21,620 636 4,793 203 13,134 372 39,547 1,211 3.1%
Notes:1Totals are a sum of Science and Non-Science subjects.Non-respondents are not reported due to statistical disclosure control.Analytical schemes: Government Economic Service, Government Social Research Service, Government Operational Research Service, Government Statistical Service.Specialist schemes: Commercial, Digital & Technology, European, Finance, Government Communications, Human Resources, Project Delivery.
Total success rate
Graduate Fast Stream Analytical Schemes Specialist Schemes Total1
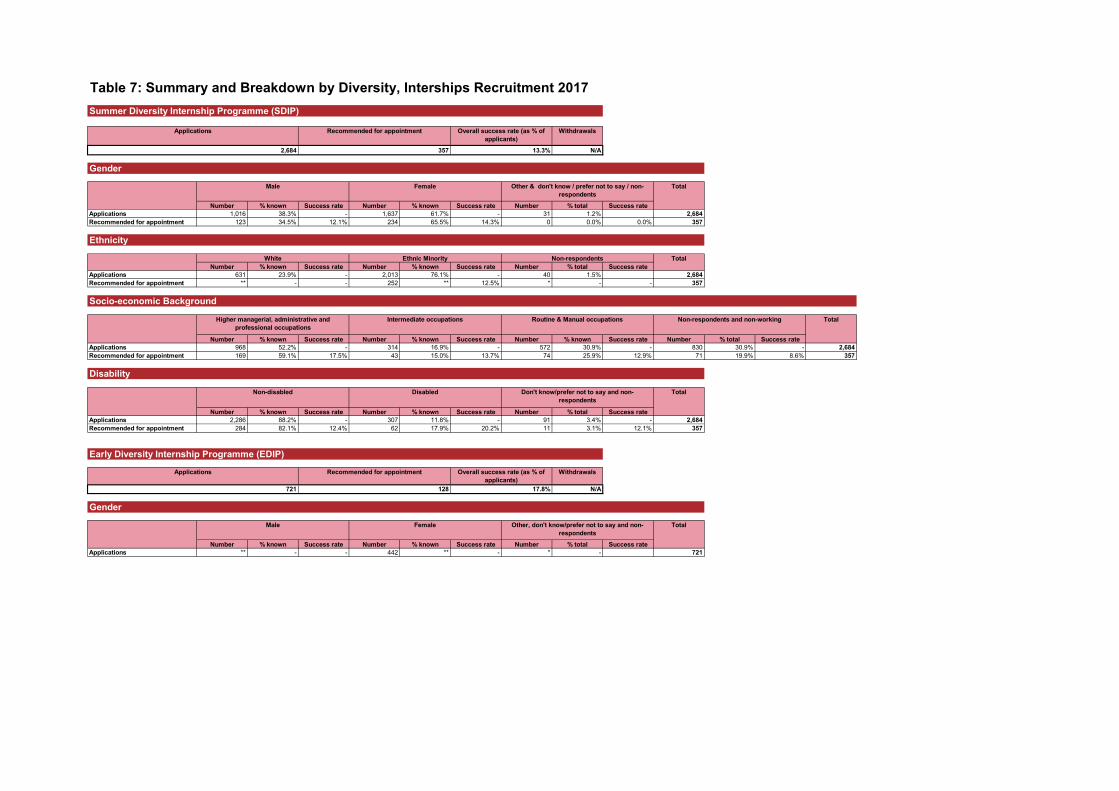
Table 7: Summary and Breakdown by Diversity, Interships Recruitment 2017
Withdrawals
N/A
Number % known Success rate Number % known Success rate Number % total Success rateApplications 1,016 38.3% - 1,637 61.7% - 31 1.2% 2,684Recommended for appointment 123 34.5% 12.1% 234 65.5% 14.3% 0 0.0% 0.0% 357
Number % known Success rate Number % known Success rate Number % total Success rateApplications 631 23.9% - 2,013 76.1% - 40 1.5% 2,684Recommended for appointment ** - - 252 ** 12.5% * - - 357
Number % known Success rate Number % known Success rate Number % known Success rate Number % total Success rateApplications 968 52.2% - 314 16.9% - 572 30.9% - 830 30.9% - 2,684Recommended for appointment 169 59.1% 17.5% 43 15.0% 13.7% 74 25.9% 12.9% 71 19.9% 8.6% 357
Number % known Success rate Number % known Success rate Number % total Success rateApplications 2,286 88.2% - 307 11.8% - 91 3.4% - 2,684Recommended for appointment 284 82.1% 12.4% 62 17.9% 20.2% 11 3.1% 12.1% 357
Withdrawals
N/A
Number % known Success rate Number % known Success rate Number % total Success rateApplications ** - - 442 ** - * - 721
Summer Diversity Internship Programme (SDIP)
Early Diversity Internship Programme (EDIP)
TotalMale Female Other, don't know/prefer not to say and non-respondents
Total
Ethnicity
Socio-economic Background
Male
Total
Total
Total
Disability
Female Other & don't know / prefer not to say / non-respondents
Non-disabled Don't know/prefer not to say and non-respondents
Disabled
Applications Recommended for appointment Overall success rate (as % of applicants)
2,684 357 13.3%
Gender
White Ethnic Minority Non-respondents
Higher managerial, administrative and professional occupations
Intermediate occupations Routine & Manual occupations Non-respondents and non-working
721 128 17.8%
Gender
Applications Recommended for appointment Overall success rate (as % of applicants)

Table 8: Summary and Breakdown by Diversity, Fast Track Recruitment 2017
Number % known Success rate Number % known Success rate Number % total Success rate Number Success rateRegistrations 12,081 54.6% 9,941 44.9% 1,695 7.1% 23,717Applications 11,800 54.7% 9,650 44.8% 111 0.5% 21,561Recommended for appointment 470 56.1% 4.0% 363 43.3% 3.8% 5 0.6% 4.5% 838 3.9%
Number % known Success rate Number % known Success rate Number % total Success rate Number Success rateRegistrations 17,078 77.2% 5,048 22.8% 1,591 6.7% 23,717Applications 16,656 77.3% 4,890 22.7% 15 0.1% 21,561Recommended for appointment 725 86.5% 4.4% 113 13.5% 2.3% 0 0.0% 0.0% 838 3.9%
Number % known Success rate Number % known Success rate Number % total Success rate Number Success rateRegistrations 20,678 94.8% 1,132 5.2% 1,907 8.0% 23,717Applications 20,031 94.8% 1,098 5.2% 432 2.0% 21,561Recommended for appointment 762 92.4% 3.8% 63 7.6% 5.7% 13 1.6% 3.0% 838 3.9%
Number % known Success rate Number % known Success rate Number % total Success rate Number Success rateRegistrations 20,464 92.5% 1,653 7.5% 1,600 6.7% 23,717Applications 19,923 92.5% 1,614 7.5% 24 0.1% 21,561Recommended for appointment 761 90.8% 3.8% 77 9.2% 4.8% 0 0.0% 0.0% 838 3.9%
Number % known Success rate Number % known Success rate Number % known Success rate Number % known Success rate Number % known Success rate Number % total Success rate Number Success rateRegistrations 5,095 22.1% 3,926 17.0% 3,106 13.5% 2,628 11.4% 8,288 36.0% 674 2.8% 23,717Applications 4,780 22.2% 3,676 17.0% 2,908 13.5% 2,482 11.5% 7,715 35.8% 0 0.0% 21,561Recommended for appointment 193 23.0% 4.0% 153 18.3% 4.2% 136 16.2% 4.7% 81 9.7% 3.3% 275 32.8% 3.6% 0 0.0% 0.0% 838 3.9%
Total
Disability
Sexual Orientation
Gender
Ethnicity
Overall success rate23,717 21,561 838 3.9%
Registrations Applications
Age
Non-disabled Disabled Non-respondents Total
Non-respondents Total
Recommended for appointment
Male Female Other & don't know / prefer not to say / non-respondents
Total
White Ethnic Minority Non-respondents Total
25 and over
Lesbian/Gay/Bisexual/Other (LGBO)1Heterosexual Non-respondents Total
16-18 19-20 21-22 23-24

Table 9: Detailed Breakdown of Ethnicity, Fast Track Recruitment 2017
Number % known % total Number % known % totalWhite - British 16,084 75.4% 717 85.9% 4.5%White - Irish 97 0.5% * - -White - Gypsy or Irish Traveller 10 0.0% * - -White - Any other White background 465 2.2% 5 0.6% 1.1%Asian or Asian British - Bangladeshi 514 2.4% 10 1.2% 1.9%Asian or Asian British - Indian 814 3.8% 28 3.4% 3.4%Asian or Asian British - Pakistani 882 4.1% 19 2.3% 2.2%Asian or Asian British - Any other Asian background 207 1.0% * - -Black or Black British - African 690 3.2% * - -Black or Black British - Caribbean 282 1.3% 7 0.8% 2.5%Black or Black British - Any other Black background 77 0.4% * - -Chinese or other ethnic group - Chinese 80 0.4% * - -Mixed - White and Asian 188 0.9% 6 0.7% 3.2%Mixed - White and Black African 101 0.5% * - -Mixed - White and Black Caribbean 270 1.3% 6 0.7% 2.2%Mixed - Any other Mixed Background 163 0.8% * - -Other ethnic group - Arab 46 0.2% * - -Any other ethnic background 576 2.7% 18 2.2% 3.1%Non-respondents 15 0.1% * - -Total 21,561 838 3.9%
Applications Recommended for appointment
Ethnicity
Success rate

Table 10: Analysis by Socio-economic Background, Fast Track Recruitment 2017
Number % known Success rate Number % known Success rate Number % known Success rate Number % known Success rate Number % total Success rate Number Success rateRegistrations 11,883 67.5% 5,015 28.5% 477 2.7% 227 1.3% 6,115 25.8% 23,717Applications 11,648 67.4% 4,939 28.6% 468 2.7% 220 1.3% 4,286 19.9% 21,561Recommended for appointment 516 67.9% 4.4% 202 26.6% 4.1% 27 3.6% 5.8% 15 2.0% 6.8% 78 9.3% 1.8% 838 3.9%
Number % known Success rate Number % known Success rate Number % total Success rate Number Success rateRegistrations 4,242 23.5% 13,842 76.5% 5,633 23.8% 23,717Applications 4,169 23.5% 13,556 76.5% 3,836 17.8% 21,561Recommended for appointment 123 16.7% 3.0% 613 83.3% 4.5% 102 12.2% 2.7% 838 3.9%
Number % known Success rate Number % known Success rate Number % total Success rate Number Success rateRegistrations 6,011 29.1% 14,643 70.9% 3,063 12.9% 23,717Applications 5,906 29.1% 14,396 70.9% 1,259 5.8% 21,561Recommended for appointment 291 36.5% 4.9% 506 63.5% 3.5% 41 4.9% 3.3% 838 3.9%
Number % known Success rate Number % known Success rate Number % known Success rate Number % total Success rate Number Success rateRegistrations 8,827 54.5% 3,274 20.2% 4,098 25.3% 7,518 31.7% 23,717Applications 8,673 54.4% 3,233 20.3% 4,026 25.3% 5,629 26.1% 21,561Recommended for appointment 406 60.2% 4.7% 136 20.2% 4.2% 132 19.6% 3.3% 164 19.6% 2.9% 838 3.9%
Notes:
Socio-economic Background
Higher managerial, administrative and professional occupations
Intermediate occupations Routine & manual occupations Non-respondents and non-working Total
Whether Parents Went To University
Parents went to university Parents did not go to university Non-respondents Total
Eligible for free school meals Not eligible for free school meals Non-respondents Total
School Type
Free School Meal Eligibility
TotalA state-run or state-funded school - Non-selective A state-run or state-funded school - Selective on academic, faith or other grounds
Independent or fee-paying school - No bursary Independent or fee-paying school - Bursary Non-respondents

Table 11: Headline Summary, Fast Stream Recruitment 2018
Vacancies Registrations Applications Recommended for appointment
Success rate (as % of
applicants)
Declined appointment
Grand Total 1,305 48,898 40,457 1,411 3.5% 181
Vacancies Applications (by first
preference)
Recommended for appointment
Success rate Declined Appointment
Generalist 368 5511 501 9.1% 51Houses Of Parliament * 2520 * * *Diplomatic Service 75 12266 71 0.6% *Science and Engineering ** 2011 ** ** *Total 462 22,308 594 2.7% 57
Vacancies Applications (by first
preference)
Recommended for appointment
Success rate Declined Appointment
Government Economic Service 291 1223 200 16.4% 16Government Statistical Service 70 450 76 16.9% 15Government Social Research Service 73 3044 100 3.3% *Government Operational Research Service 70 446 46 10.3% 9Digital and Technology 85 1663 77 4.6% 18
All Fast Stream Schemes (excluding In-Service Fast Stream Competition)
Graduate Fast Stream
Other Fast Stream Schemes

Commercial 28 1677 38 2.3% 13Finance 60 2314 89 3.8% 28Government Communication Service 15 1949 15 0.8% *Human Resources 69 3286 78 2.4% 10Project Delivery 82 2097 98 4.7% 10Total 843 18,149 817 4.5% 124
Notes:* Primary suppression.** Secondary suppression.

Table 12: In-service Fast Stream Competition, Fast Stream Recruitment 2018
Total
Number % known Number % known Number % totalApplications 2,428 55.7% 1,931 44.3% 110 2.5% 4,469Recommended for appointment 106 62.7% 63 37.3% 5 2.9% 174
Number % known Number % known Number % totalApplications 2,806 66.7% 1,403 33.3% 260 5.8% 4,469Recommended for appointment 135 81.8% 30 18.2% 9 5.2% 174
Number % known Number % known Number % totalApplications 3,848 89.4% 458 10.6% 163 3.6% 4,469Recommended for appointment 148 ** ** - * - 174
Notes:* Primary supression.** Secondary suppression.% of known refers to proportions calculated off responded or known categories only.
Total
Gender
Ethnicity
Disability
Applications Recommended for appointment Overall success rate (as % of applicants)
Declined appointment
Male Female Other & don't know / prefer not to say / non-respondents
4,469 174 3.9% 7
Total
Total
Total
Prefer not to say / non-respondents
White Ethnic Minority Non-respondents
Non-disabled Disabled

Table 13: Breakdown by Diversity, Fast Stream Recruitment 2018
Number % known Success rate Number % known Success rate Number % total Success rate Number Success rateRegistrations 20,076 47.5% 22,196 52.5% 6,626 13.6% 48,898 -Applications 18,997 47.8% 20,784 52.2% 676 1.7% 40,457 -Recommended for appointment 652 47.1% 3.4% 732 52.9% 3.5% 27 1.9% 4.0% 1,411 3.5%
Number % known Success rate Number % known Success rate Number % total Success rate Number Success rateRegistrations 28,428 68.8% 12,907 31.2% 7,563 15.5% 48,898 -Applications 26,779 68.8% 12,124 31.2% 1,554 3.8% 40,457 -Recommended for appointment 1,152 84.2% 4.3% 216 15.8% 1.8% 43 3.0% 2.8% 1,411 3.5%
Number % known Success rate Number % known Success rate Number % total Success rate Number Success rate Registrations 39,029 93.1% - 2,874 6.9% - 6,995 14.3% 48,898 -Applications 36,662 93.2% - 2,689 6.8% - 1,106 2.7% 40,457 -Recommended for appointment 1,234 90.1% 3.4% 135 9.9% 5.0% 42 3.0% 3.8% 1,411 3.5%
Number % known Success rate Number % known Success rate Number % total Success rate Number Success rateRegistrations 36,871 90.6% - 3,811 9.4% - 8,216 16.8% 48,898 -Applications 34,731 90.7% - 3,572 9.3% - 2,154 5.3% 40,457 -Recommended for appointment 1,137 86.7% 3.3% 174 13.3% 4.9% 100 7.1% 4.6% 1,411 3.5%
Number % known Success rate Number % known Success rate Number % known Success rate Number % total Success rate Number Success rateRegistrations 23,619 71.2% - 4,149 12.5% - 5,427 16.3% - 15,703 32.1% - 48,898 -Applications 22,364 71.3% - 3,909 12.5% - 5,111 16.3% - 9,073 22.4% - 40,457 -Recommended for appointment 964 81.8% 4.3% 107 9.1% 2.7% 107 9.1% 2.1% 233 16.5% 2.6% 1,411 3.5%
Number % known Success rate Number % known Success rate Number % total Success rate Number Success rateRegistrations 25,768 80.4% - 6,274 19.6% - 16,856 34.5% 48,898 -Applications 24,379 80.4% - 5,929 19.6% - 10,149 25.1% 40,457 -Recommended for appointment 1,046 89.5% 4.3% 123 10.5% 2.1% 242 17.2% 2.4% 1,411 3.5%
Notes:1LGBO stands for Lesbian. Gay, Bisexual and Other. This is a new grouping classification that has been introduced in the 2017/18 report.% of known refers to proportions calculated off responded or known categories only.
Excluding In-Service Fast Stream Competition
Gender
Ethnicity
Disability
Socio-economic Background
Sexual Orientation
Other & don't know / prefer not to say / non-respondents
Lesbian/Gay/Bisexual/Other (LGBO)1Heterosexual Prefer not to say / non-respondents Total
Non-disabled Disabled Prefer not to say / non-respondents Total
Male Female
White Ethnic Minority Non-respondents Total
Total
Total
Not eligible for Free School Meals Eligible for Free School Meals Prefer not to say / non-respondents Total
Higher managerial, administrative and professional occupations
Intermediate occupations Routine & Manual occupations Non-respondents and non-working
Free School Meals
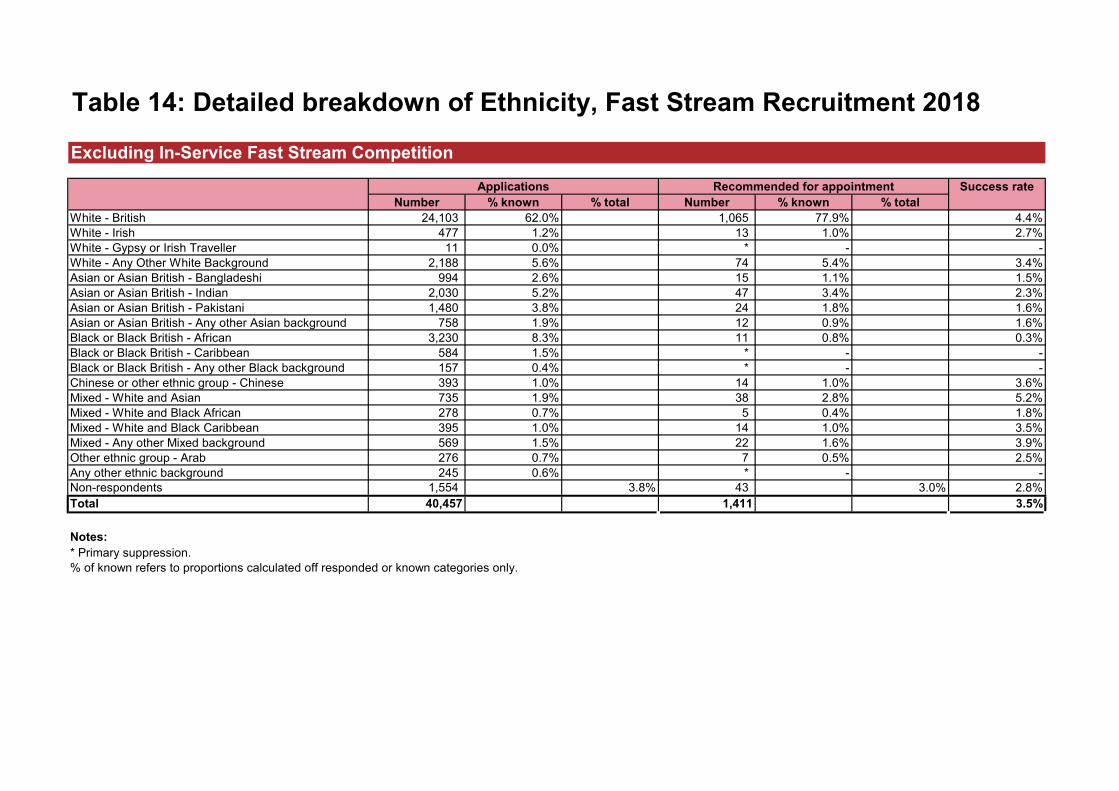
Table 14: Detailed breakdown of Ethnicity, Fast Stream Recruitment 2018
Number % known % total Number % known % totalWhite - British 24,103 62.0% 1,065 77.9% 4.4%White - Irish 477 1.2% 13 1.0% 2.7%White - Gypsy or Irish Traveller 11 0.0% * - -White - Any Other White Background 2,188 5.6% 74 5.4% 3.4%Asian or Asian British - Bangladeshi 994 2.6% 15 1.1% 1.5%Asian or Asian British - Indian 2,030 5.2% 47 3.4% 2.3%Asian or Asian British - Pakistani 1,480 3.8% 24 1.8% 1.6%Asian or Asian British - Any other Asian background 758 1.9% 12 0.9% 1.6%Black or Black British - African 3,230 8.3% 11 0.8% 0.3%Black or Black British - Caribbean 584 1.5% * - -Black or Black British - Any other Black background 157 0.4% * - -Chinese or other ethnic group - Chinese 393 1.0% 14 1.0% 3.6%Mixed - White and Asian 735 1.9% 38 2.8% 5.2%Mixed - White and Black African 278 0.7% 5 0.4% 1.8%Mixed - White and Black Caribbean 395 1.0% 14 1.0% 3.5%Mixed - Any other Mixed background 569 1.5% 22 1.6% 3.9%Other ethnic group - Arab 276 0.7% 7 0.5% 2.5%Any other ethnic background 245 0.6% * - -Non-respondents 1,554 3.8% 43 3.0% 2.8%Total 40,457 1,411 3.5%
Notes:* Primary suppression.% of known refers to proportions calculated off responded or known categories only.
Applications Recommended for appointment
Excluding In-Service Fast Stream Competition
Success rate

Table 15: Analysis by University, Fast Stream Recruitment 2018
Applications Recommended for appointment
Applications Recommended for appointment
Applications Recommended for appointment
Applications Recommended for appointment
Oxbridge 1,328 139 135 59 168 48 1,631 246 15.1%Russell Group excluding Oxbridge 9,708 317 1,929 199 3,656 217 15,293 733 4.8%Other 8,875 80 2,597 114 7,610 86 19,082 280 1.5%Non-respondents 2,397 58 502 50 1,552 44 4,451 152 3.4%Total 22,308 594 5,163 422 12,986 395 40,457 1,411 3.5%
Notes:Analytical schemes: Government Economic Service, Government Social Research Service, Government Operational Research Service, Government Statistical Service.Specialist schemes: Commercial, Digital & Technology, European, Finance, Government Communications, Human Resources, Project Delivery.
Excluding In-Service Fast Stream Competition
Graduate Fast Stream Analytical Schemes Specialist schemes Total Total success rate

Table 16: Analysis by Degree Type, Fast Stream Recruitment 2018
Applications Recommended for appointment
Applications Recommended for appointment
Applications Recommended for appointment
Applications Recommended for appointment
Science subject areas 3,998 86 960 112 2,662 74 7,620 272 3.6%Non-science subject areas 17,731 500 4,118 305 9,890 306 31,739 1,111 3.5%Total1 21,729 586 5,078 417 12,552 380 39,359 1,383 3.5%
Notes:1Totals are a sum of Science and Non-science subjects.Non-respondents are not reported due to statistical disclosure control.Analytical schemes: Government Economic Service, Government Social Research Service, Government Operational Research Service, Government Statistical Service.Specialist schemes: Commercial, Digital & Technology, European, Finance, Government Communications, Human Resources, Project Delivery.
Excluding In-Service Fast Stream Competition
Graduate Fast Stream Analytical Schemes Specialist Schemes Total1 Total success rate

Table 17: Summary and Breakdown by Diversity, Interships Recruitment 2018
Withdrawals
72
Number % known Success rate Number % known Success rate Number % total Success rateApplications 1,074 35.7% - 1,934 64.3% - 29 1.0% 3,037Recommended for appointment 164 37.3% 15.3% 276 62.7% 14.3% 6 1.3% 20.7% 446
Number % known Success rate Number % known Success rate Number % total Success rateApplications 633 21.2% 2,346 78.8% 58 1.9% 3,037Recommended for appointment 117 26.9% 18.5% 318 73.1% 13.6% 11 2.5% 19.0% 446
Number % known Success rate Number % known Success rate Number % known Success rate Number % total Success rateApplications 1,063 51.9% 351 17.1% 636 31.0% 987 32.5% 3,037Recommended for appointment 167 54.8% 15.7% 52 17.0% 14.8% 86 28.2% 13.5% 141 31.6% 14.3% 446
Number % known Success rate Number % known Success rate Number % total Success rateApplications 2,555 87.8% - 354 12.2% - 128 4.2% - 3,037Recommended for appointment 333 76.9% 13.0% 100 23.1% 28.2% 13 2.9% 10.2% 446
Withdrawals
0
Number % known Success rate Number % known Success rate Number % total Success rateApplications 407 37.0% - 694 63.0% - 11 - 1,112
14.7%
Disability
Male Female
Routine & Manual occupations
Non-respondents
Non-disabled Don't know/prefer not to say and non-respondents
Disabled
Male Female Other, don't know/prefer not to say and non-respondents
Applications Recommended for appointment Overall success rate (as % of applicants)
1,112 164
Gender
White Ethnic Minority
Higher managerial, administrative and professional occupations
Intermediate occupations Non-respondents and non-working
Other & don't know / prefer not to say / non-respondents
Ethnicity
Socio-economic Background
Total
Total
Total
Total
Total
Gender
Summer Diversity Internship Programme (SDIP)
Early Diversity Internship Programme (EDIP)
14.7%
Applications Recommended for appointment Overall success rate (as % of applicants)
3,037 446

Table 18: Summary and Breakdown by Diversity, Fast Track Recruitment 2018
Number % known Success rate Number % known Success rate Number % total Success rate Number Success rateRegistrations 13,485 54.3% 11,347 45.7% 4,141 14.3% 28,973Applications 13,178 54.5% 11,004 45.5% 295 1.2% 24,477Recommended for appointment 328 ** 2.5% ** - - * - - 616 2.5%
Number % known Success rate Number % known Success rate Number % total Success rate Number Success rateRegistrations 18,690 76.9% 5,602 23.1% 4,681 16.2% 28,973Applications 18,217 77.0% 5,446 23.0% 814 3.3% 24,477Recommended for appointment 518 85.8% 2.8% 86 14.2% 1.6% 12 1.9% 1.5% 616 2.5%
Number % known Success rate Number % known Success rate Number % total Success rate Number Success rateRegistrations 23,211 94.4% 1,388 5.6% 4,374 15.1% 28,973Applications 22,454 94.3% 1,346 5.7% 677 2.8% 24,477Recommended for appointment 543 90.3% 2.4% 58 9.7% 4.3% 15 2.4% 2.2% 616 2.5%
Number % known Success rate Number % known Success rate Number % total Success rate Number Success rateRegistrations 22,747 90.9% 2,281 9.1% 3,945 13.6% 28,973Applications 22,136 90.8% 2,238 9.2% 103 0.4% 24,477Recommended for appointment 550 89.3% 2.5% 66 10.7% 2.9% 0 0.0% 0.0% 616 2.5%
Number % known Success rate Number % known Success rate Number % known Success rate Number % known Success rate Number % known Success rate Number % total Success rate Number Success rateRegistrations 3,168 11.5% 4,688 17.1% 3,439 12.5% 3,351 12.2% 12,824 46.7% 1,503 5.2% 28,973Applications 2,861 11.7% 4,276 17.5% 3,073 12.6% 2,977 12.2% 11,272 46.1% 18 0.1% 24,477Recommended for appointment 89 14.4% 3.1% 142 23.1% 3.3% 90 14.6% 2.9% 72 11.7% 2.4% 223 36.2% 2.0% 0 0.0% 0.0% 616 2.5%
Disability
Sexual Orientation
Age
Ethnicity
Total
25 and over Non-respondents Total
Lesbian/Gay/Bisexual/Other (LGBO)1Heterosexual Non-respondents Total
16-18 19-20 21-22
Disabled Non-respondents Total
Male Female Other & don't know / prefer not to say / non-respondents
Total
White Ethnic Minority Non-respondents
Total
23-24
Registrations Applications Recommended for appointment Overall success rate28,973 24,477 616 2.5%
Gender
Non-disabled

Table 19: Detailed Breakdown of Ethnicity, Fast Track Recruitment 2018
Success rateNumber % known % total Number % known % total
White - British 17,479 73.9% 508 84.1% 2.9%White - Irish 95 0.4% * - -White - Gypsy or Irish Traveller 8 0.0% * - 0.0%White - Any other White background 635 2.7% 9 1.5% 1.4%Asian or Asian British - Bangladeshi 651 2.8% 9 1.5% 1.4%Asian or Asian British - Indian 884 3.7% 24 4.0% 2.7%Asian or Asian British - Pakistani 1,066 4.5% 18 3.0% 1.7%Asian or Asian British - Any other Asian background 248 1.0% 5 0.8% 2.0%Black or Black British - African 949 4.0% * - -Black or Black British - Caribbean 426 1.8% 5 0.8% 1.2%Black or Black British - Any other Black background 114 0.5% * - -Chinese or other ethnic group - Chinese 60 0.3% * - -Mixed - White and Asian 233 1.0% 6 1.0% 2.6%Mixed - White and Black African 110 0.5% * - -Mixed - White and Black Caribbean 328 1.4% * - -Mixed - Any other Mixed Background 236 1.0% 7 1.2% 3.0%Other ethnic group - Arab 71 0.3% * - -Any other ethnic background 70 0.3% * - -Non-respondents 814 3.3% 12 1.9% 1.5%Total 24,477 616 2.5%
Applications Recommended for appointment
Ethnicity

Table 20: Analysis by Socio-economic Background, Fast Track Recruitment 2018
Number % known Success rate Number % known Success rate Number % known Success rate Number % known Success rate Number % total Success rate Number Success rateRegistrations 13,250 67.2% 5,621 28.5% 264 1.3% 588 3.0% 9,250 31.9% 28,973Applications 12,996 67.2% 5,497 28.4% 262 1.4% 584 3.0% 5,138 21.0% 24,477Recommended for appointment 367 65.3% 2.8% 156 27.8% 2.8% 12 2.1% 4.6% 27 4.8% 4.6% 54 8.8% 1.1% 616 2.5%
Number % known Success rate Number % known Success rate Number % total Success rate Number Success rateRegistrations 5,189 26.2% 14,651 73.8% 9,133 31.5% 28,973Applications 5,100 26.2% 14,342 73.8% 5,035 20.6% 24,477Recommended for appointment 109 20.8% 2.1% 416 79.2% 2.9% 91 14.8% 1.8% 616 2.5%
Number % known Success rate Number % known Success rate Number % total Success rate Number Success rateRegistrations 6,861 29.6% 16,357 70.4% 5,755 19.9% 28,973Applications 6,761 29.6% 16,076 70.4% 1,640 6.7% 24,477Recommended for appointment 210 35.1% 3.1% 388 64.9% 2.4% 18 2.9% 1.1% 616 2.5%
Number % known Success rate Number % known Success rate Number % known Success rate Number % total Success rate Number Success rateRegistrations 9,553 53.4% 3,611 20.2% 4,741 26.5% 11,068 38.2% 28,973Applications 9,415 53.4% 3,558 20.2% 4,652 26.4% 6,852 28.0% 24,477Recommended for appointment 310 62.2% 3.3% 90 18.1% 2.5% 98 19.7% 2.1% 118 19.2% 1.7% 616 2.5%
Notes:
School Type
Socio-economic breakdown
Free School Meal Eligibility
Whether parents went to university
TotalA state-run or state-funded school - Non-selective A state-run or state-funded school - Selective on academic, faith or other grounds
Independent or fee-paying school - No bursary Independent or fee-paying school - Bursary Non-respondents
Eligible for free school meals Not eligible for free school meals Non-respondents Total
Parents went to university Parents did not go to university Non-respondents Total
Higher managerial, administrative and professional occupations
Intermediate occupations Routine & manual occupations Non-respondents and non-working Total

Applications Recommended for Appointment
Success rate Applications Recommended for Appointment
Success rate Applications Recommended for Appointment
Success rate Applications Recommended for Appointment
Success rate
2018 1,305 18,997 652 3.4% 20,784 732 3.5% 676 27 4.0% 40,457 1,411 3.5%2017 1,330 19,548 562 2.9% 20,487 654 3.2% 535 17 3.2% 40,570 1,233 3.0%2016 911 16,789 631 3.8% 15,244 581 3.8% 417 33 7.9% 32,450 1,245 3.8%2015 1,077 10,855 480 4.4% 10,055 472 4.7% 225 15 6.7% 21,135 967 4.6%2014 820 10,265 468 4.6% 9,600 432 4.5% 207 15 7.2% 20,072 915 4.6%2013 782 9,579 425 4.4% 8,227 427 5.2% 160 12 7.5% 17,966 864 4.8%2012 649 11,158 314 2.8% 10,177 334 3.3% 207 6 2.9% 21,542 654 3.0%2011 354 9,612 193 2.0% 8,622 197 2.3% 127 3 2.4% 18,361 393 2.1%2010 477 11,586 245 2.1% 10,020 215 2.1% 155 5 3.2% 21,761 465 2.1%2009 585 8,333 357 4.3% 6,489 269 4.1% 89 3 3.4% 14,911 629 4.2%2008 552 7,981 292 3.7% 6,444 275 4.3% 69 3 4.3% 14,494 570 3.9%2007 427 7,343 208 2.8% 6,229 171 2.7% 47 1 2.1% 13,619 380 2.8%2006 469 7,637 233 3.1% 6,246 240 3.8% 62 3 4.8% 13,945 476 3.4%2005 497 7,376 280 3.8% 5,508 220 4.0% 73 4 5.5% 12,957 504 3.9%
2004 * 507 5,255 273 5.2% 3,343 194 5.8% - - - 8,598 467 5.4%2003 546 10,676 256 2.4% 9,356 254 2.7% - - - 20,032 510 2.5%2002 509 7,181 197 2.7% 7,147 214 3.0% - - - 14,328 411 2.9%2001 512 6,175 204 3.3% 5,602 217 3.9% - - - 11,777 421 3.6%2000 560 7,487 223 3.0% 6,922 203 2.9% - - - 14,409 426 3.0%1999 445 5,220 153 2.9% 4,594 153 3.3% - - - 9,814 306 3.1%1998 367 4,931 144 2.9% 4,106 91 2.2% - - - 9,037 235 2.6%
Notes:* The temporary fall in 2004 reflects the introduction of online self-assessment (if relevant), intended to discourage unrealistic applications. Since then, an application is deemed to have been submitted only if the applicant has " - " represents information that is unknown or unavailable.
Table 21: Gender, Success Trend
Competition Vacancies Male Female Non-respondents/Prefer not to say/Other Total
Success Rate Trend

Number % of known Number % of
known Number % of total Number % of known Number % of
known Number % of total Number % of known Number % of
known Number % of total
2018 1,305 20,076 47.5% 22,196 52.5% 6,626 13.6% 48,898 18,997 47.8% 20,784 52.2% 676 1.7% 40,457 652 47.1% 732 52.9% 27 1.9% 1,4112017 1,330 19,873 48.8% 20,890 51.2% 3,189 7.3% 43,952 19,548 48.8% 20,487 51.2% 535 1.3% 40,570 562 46.2% 654 53.8% 17 1.4% 1,2332016 911 19,325 49.2% 19,926 50.8% 444 1.1% 39,695 16,789 52.4% 15,244 47.6% 417 1.3% 32,450 631 52.1% 581 47.9% 33 2.7% 1,2452015 1,077 18,343 48.5% 19,454 51.5% 378 1.0% 38,175 10,855 51.9% 10,055 48.1% 225 1.1% 21,135 480 50.4% 472 49.6% 15 1.6% 9672014 820 18,872 49.0% 19,677 51.0% 359 0.9% 38,908 10,265 51.7% 9,600 48.3% 207 1.0% 20,072 468 52.0% 432 48.0% 15 1.6% 9152013 782 17,327 50.5% 16,966 49.5% 257 0.7% 34,550 9,579 53.8% 8,227 46.2% 160 0.9% 17,966 425 49.9% 427 50.1% 12 1.4% 8642012 649 17,210 50.0% 17,230 50.0% 266 0.8% 34,706 11,158 52.3% 10,177 47.7% 207 1.0% 21,542 314 48.5% 334 51.5% 6 0.9% 6542011 354 13,366 50.4% 13,173 49.6% 163 0.6% 26,702 9,612 52.7% 8,622 47.3% 127 0.7% 18,361 193 49.5% 197 50.5% 3 0.8% 3932010 477 17,927 51.6% 16,808 48.4% 208 0.6% 34,943 11,586 53.6% 10,020 46.4% 155 0.7% 21,761 245 53.3% 215 46.7% 5 1.1% 4652009 585 15,618 52.4% 14,186 47.6% 171 0.6% 29,975 8,333 56.2% 6,489 43.8% 89 0.6% 14,911 357 57.0% 269 43.0% 3 0.5% 6292008 552 9,459 48.7% 9,956 51.3% 86 0.4% 19,501 7,981 55.3% 6,444 44.7% 69 0.5% 14,494 292 51.5% 275 48.5% 3 0.5% 5702007 427 11,309 52.2% 10,337 47.8% 99 0.5% 21,745 7,343 54.1% 6,229 45.9% 47 0.3% 13,619 208 54.9% 171 45.1% 1 0.3% 3802006 469 12,277 53.3% 10,740 46.7% 162 0.7% 23,179 7,637 55.0% 6,246 45.0% 62 0.4% 13,945 233 49.3% 240 50.7% 3 0.6% 4762005 497 - - - - - - - 7,376 57.2% 5,508 42.8% 73 0.6% 12,957 280 56.0% 220 44.0% 4 0.8% 504
2004 * 507 - - - - - - - 5,255 61.1% 3,343 38.9% - - 8,598 273 58.5% 194 41.5% - - 4672003 546 - - - - - - - 10,676 53.3% 9,356 46.7% - - 20,032 256 50.2% 254 49.8% - - 5102002 509 - - - - - - - 7,181 50.1% 7,147 49.9% - - 14,328 197 47.9% 214 52.1% - - 4112001 512 - - - - - - - 6,175 52.4% 5,602 47.6% - - 11,777 204 48.5% 217 51.5% - - 4212000 560 - - - - - - - 7,487 52.0% 6,922 48.0% - - 14,409 223 52.3% 203 47.7% - - 4261999 445 - - - - - - - 5,220 53.2% 4,594 46.8% - - 9,814 153 50.0% 153 50.0% - - 3061998 367 - - - - - - - 4,931 54.6% 4,106 45.4% - - 9,037 144 61.3% 91 38.7% - - 235
Notes:
Table 22: Gender, Trend
Registrations Total Applications Total Recommended for AppointmentMale Female Non-respondent /
Prefer not to say/ Female Non-respondent /
Prefer not to say/ O
Male Female Non-respondent / Prefer not to say/
Male
* The temporary fall in 2004 reflects the introduction of online self-assessment (if relevant), intended to discourage unrealistic applications. Since then, an application is deemed to have been submitted only if the applicant has completed the self-assessment and proceeds to take the online tests." - " represents information that is unknown or unavailable.
Trend
Competition Vacancies Total

Applications Recommended for Appointment
Success rate Applications Recommended for Appointment
Success rate Applications Recommended for Appointment
Success rate Applications Recommended for Appointment
Success rate
2018 1,305 26,779 1,152 4.3% 12,124 216 1.8% 1,554 43 2.8% 40,457 1,411 3.5%2017 1,330 28,476 985 3.5% 10,733 221 2.1% 1,361 27 2.0% 40,570 1,233 3.0%2016 911 23,628 1,008 4.3% 7,872 185 2.4% 950 52 5.5% 32,450 1,245 3.8%2015 1,077 16,374 803 4.9% 4,253 137 3.2% 508 27 5.3% 21,135 967 4.6%2014 820 15,794 766 4.8% 3,809 127 3.3% 469 22 4.7% 20,072 915 4.6%2013 782 14,415 724 5.0% 3,159 114 3.6% 392 26 6.6% 17,966 864 4.8%2012 649 17,485 557 3.2% 3,558 82 2.3% 499 15 3.0% 21,542 654 3.0%2011 354 14,768 335 2.3% 3,182 51 1.6% 411 7 1.7% 18,361 393 2.1%2010 477 16,650 397 2.4% 4,640 57 1.2% 471 11 2.3% 21,761 465 2.1%2009 585 11,932 550 4.6% 2,724 67 2.5% 255 12 4.7% 14,911 629 4.2%2008 552 12,092 505 4.2% 2,159 53 2.5% 243 12 4.9% 14,494 570 3.9%2007 427 11,625 339 2.9% 1,838 36 2.0% 156 5 3.2% 13,619 380 2.8%2006 469 11,849 416 3.5% 1,912 53 2.8% 184 7 3.8% 13,945 476 3.4%2005 497 10,857 461 4.2% 1,937 36 1.9% 163 7 4.3% 12,957 504 3.9%
2004 * 507 7,140 428 6.0% 1,259 25 2.0% 199 14 7.0% 8,598 467 5.4%2003 546 15,702 455 2.9% 3,275 40 1.2% 1,055 15 1.4% 20,032 510 2.5%2002 509 11,671 363 3.1% 2,432 40 1.6% 225 8 3.6% 14,328 411 2.9%2001 512 9,683 383 4.0% 1,941 32 1.6% 153 6 3.9% 11,777 421 3.6%2000 560 12,076 392 3.2% 2,154 29 1.3% 179 5 2.8% 14,409 426 3.0%1999 445 8,412 287 3.4% 1,296 18 1.4% 106 1 0.9% 9,814 306 3.1%1998 367 7,884 226 2.9% 1,098 8 0.7% 55 1 1.8% 9,037 235 2.6%
Notes:* The temporary fall in 2004 reflects the introduction of online self-assessment (if relevant), intended to discourage unrealistic applications. Since then, an application is deemed to have been submitted only if the applicant has completed the self-assessment and " - " represents information that is unknown or unavailable.
Table 23: Ethnicity, Success Rate Trend
Competition Vacancies White Ethnic Minority Non-respondents Total
Succes Rate Trend

Number % of known Number % of
known Number % of total Number % of known Number % of
known Number % of total Number % of known Number % of
known Number % of total
2018 1,305 28,428 68.8% 12,907 31.2% 7,563 15.5% 48,898 26,779 68.8% 12,124 31.2% 1,554 3.8% 40,457 1,152 84.2% 216 15.8% 43 3.0% 1,4112017 1,330 28,912 72.4% 11,013 27.6% 4,027 9.2% 43,952 28,476 72.6% 10,733 27.4% 1,361 3.4% 40,570 985 81.7% 221 18.3% 27 2.2% 1,2332016 911 26,995 69.7% 11,711 30.3% 989 2.5% 39,695 23,628 75.0% 7,872 25.0% 950 2.9% 32,450 1,008 84.5% 185 15.5% 52 4.2% 1,2452015 1,077 27,844 74.5% 9,531 25.5% 800 2.1% 38,175 16,374 79.4% 4,253 20.6% 508 2.4% 21,135 803 85.4% 137 14.6% 27 2.8% 9672014 820 28,546 74.8% 9,619 25.2% 743 1.9% 38,908 15,794 80.6% 3,809 19.4% 469 2.3% 20,072 766 85.8% 127 14.2% 22 2.4% 9152013 782 26,483 78.2% 7,396 21.8% 671 1.9% 34,550 14,415 82.0% 3,159 18.0% 392 2.2% 17,966 724 86.4% 114 13.6% 26 3.0% 8642012 649 27,371 80.4% 6,693 19.6% 642 1.8% 34,706 17,485 83.1% 3,558 16.9% 499 2.3% 21,542 557 87.2% 82 12.8% 15 2.3% 6542011 354 - - - - - - - 14,768 82.3% 3,182 17.7% 411 2.2% 18,361 335 86.8% 51 13.2% 7 1.8% 3932010 477 - - - - - - - 16,650 78.2% 4,640 21.8% 471 2.2% 21,761 397 87.4% 57 12.6% 11 2.4% 4652009 585 - - - - - - - 11,932 81.4% 2,724 18.6% 255 1.7% 14,911 550 89.1% 67 10.9% 12 1.9% 6292008 552 - - - - - - - 12,092 84.9% 2,159 15.1% 243 1.7% 14,494 505 90.5% 53 9.5% 12 2.1% 5702007 427 - - - - - - - 11,625 86.3% 1,838 13.7% 156 1.1% 13,619 339 90.4% 36 9.6% 5 1.3% 3802006 469 - - - - - - - 11,849 86.1% 1,912 13.9% 184 1.3% 13,945 416 88.7% 53 11.3% 7 1.5% 4762005 497 - - - - - - - 10,857 84.9% 1,937 15.1% 163 1.3% 12,957 461 92.8% 36 7.2% 7 1.4% 504
2004 * 507 - - - - - - - 7,140 85.0% 1,259 15.0% 199 2.3% 8,598 428 94.5% 25 5.5% 14 3.0% 4672003 546 - - - - - - - 15,702 82.7% 3,275 17.3% 1,055 5.3% 20,032 455 91.9% 40 8.1% 15 2.9% 5102002 509 - - - - - - - 11,671 82.8% 2,432 17.2% 225 1.6% 14,328 363 90.1% 40 9.9% 8 1.9% 4112001 512 - - - - - - - 9,683 83.3% 1,941 16.7% 153 1.3% 11,777 383 92.3% 32 7.7% 6 1.4% 4212000 560 - - - - - - - 12,076 84.9% 2,154 15.1% 179 1.2% 14,409 392 93.1% 29 6.9% 5 1.2% 4261999 445 - - - - - - - 8,412 86.7% 1,296 13.3% 106 1.1% 9,814 287 94.1% 18 5.9% 1 0.3% 3061998 367 - - - - - - - 7,884 87.8% 1,098 12.2% 55 0.6% 9,037 226 96.6% 8 3.4% 1 0.4% 235
Notes:
Competition Vacancies TotalTotal Total
* The temporary fall in 2004 reflects the introduction of online self-assessment (if relevant), intended to discourage unrealistic applications. Since then, an application is deemed to have been submitted only if the applicant has completed the self-assessment and proceeds to take the online tests." - " represents information that is unknown or unavailable.
Table 24: Ethnicity, Trend
Registrations Applications Recommended for AppointmentWhite Ethnic Minority Non-respondentWhite
Trend
Ethnic Minority Non-respondent White Ethnic Minority Non-respondent

Applications Recommended for Appointment
Success rate Applications Recommended for Appointment
Success rate Applications Recommended for Appointment
Success rate Applications Recommended for Appointment
Success rate
2018 1,305 36,662 1,234 3.4% 2,689 135 5.0% 1,106 42 3.8% 40,457 1411 3.5%2017 1,330 37,121 1,094 2.9% 2,472 108 4.4% 977 31 3.2% 40,570 1,233 3.0%2016 911 28,510 1,038 3.6% 3,021 158 5.2% 919 49 5.3% 32,450 1,245 3.8%2015 1,077 18,738 852 4.5% 1,949 90 4.6% 448 25 5.6% 21,135 967 4.6%2014 820 17,994 803 4.5% 1,661 87 5.2% 417 25 6.0% 20,072 915 4.6%2013 782 16,345 774 4.7% 1,330 74 5.6% 291 16 5.5% 17,966 864 4.8%2012 649 19,806 556 2.8% 1,414 88 6.2% 322 10 3.1% 21,542 654 3.0%2011 354 17,252 338 2.0% 918 52 5.7% 191 3 1.6% 18,361 393 2.1%2010 477 20,402 398 2.0% 1,136 63 5.5% 223 4 1.8% 21,761 465 2.1%2009 585 14,091 532 3.8% 697 92 13.2% 123 5 4.1% 14,911 629 4.2%2008 552 13,633 490 3.6% 738 72 9.8% 123 8 6.5% 14,494 570 3.9%2007 427 13,132 347 2.6% 486 33 6.8% 1 - - 13,619 380 2.8%2006 469 13,502 438 3.2% 356 35 9.8% 87 3 3.4% 13,945 476 3.4%2005 497 12,546 466 3.7% 323 34 10.5% 88 4 4.5% 12,957 504 3.9%
2004 * 507 8,324 433 5.2% 274 34 12.4% - - - 8,598 467 5.4%2003 546 19,550 492 2.5% 482 18 3.7% - - - 20,032 510 2.5%2002 509 14,061 395 2.8% 267 16 6.0% - - - 14,328 411 2.9%2001 512 11,510 409 3.6% 267 12 4.5% - - - 11,777 421 3.6%2000 560 14,210 418 2.9% 199 8 4.0% - - - 14,409 426 3.0%1999 445 9,627 299 3.1% 187 7 3.7% - - - 9,814 306 3.1%1998 367 8,875 223 2.5% 162 12 7.4% - - - 9,037 235 2.6%
Notes:* The temporary fall in 2004 reflects the introduction of online self-assessment (if relevant), intended to discourage unrealistic applications. Since then, an application is deemed to have been submitted only if the applicant has completed the self-assessment and proceeds to take the online tests." - " represents information that is unknown or unavailable..
Table 25: Disability, Success Rate Trend
Competition Vacancies Non-Disabled Disabled Non-respondents Total
Success Rate Trend

Number % of known Number % of
known Number % of total Number % of known Number % of
known Number % of total Number % of known Number % of
known Number % of total
2018 1,305 39,029 93.1% 2,874 6.9% 6,995 14.3% 48,898 36,662 93.2% 2,689 6.8% 1,106 2.7% 40,457 1,234 90.1% 135 9.9% 42 3.0% 14112017 1,330 37,879 93.8% 2,518 6.2% 3,555 8.1% 43,952 37,121 93.8% 2,472 6.2% 977 2.4% 40,570 1,094 91.0% 108 9.0% 31 2.5% 1,2332016 911 36,004 93.0% 2,708 7.0% 983 2.5% 39,695 28,510 90.4% 3,021 9.6% 919 2.8% 32,450 1,038 86.8% 158 13.2% 49 3.9% 1,2452015 1,077 34,594 92.5% 2,789 7.5% 792 2.1% 38,175 18,738 90.6% 1,949 9.4% 448 2.1% 21,135 852 90.4% 90 9.6% 25 2.6% 9672014 820 35,764 93.7% 2,386 6.3% 758 1.9% 38,908 17,994 91.5% 1,661 8.5% 417 2.1% 20,072 803 90.2% 87 9.8% 25 2.7% 9152013 782 32,061 94.3% 1,949 5.7% 540 1.6% 34,550 16,345 92.5% 1,330 7.5% 291 1.6% 17,966 774 91.3% 74 8.7% 16 1.9% 8642012 649 32,173 93.9% 2,091 6.1% 442 1.3% 34,706 19,806 93.3% 1,414 6.7% 322 1.5% 21,542 556 86.3% 88 13.7% 10 1.5% 6542011 354 25,102 95.0% 1,327 5.0% 273 1.0% 26,702 17,252 94.9% 918 5.1% 191 1.0% 18,361 338 86.7% 52 13.3% 3 0.8% 3932010 477 32,619 94.3% 1,971 5.7% 353 1.0% 34,943 20,402 94.7% 1,136 5.3% 223 1.0% 21,761 398 86.3% 63 13.7% 4 0.9% 4652009 585 28,328 95.4% 1,372 4.6% 275 0.9% 29,975 14,091 95.3% 697 4.7% 123 0.8% 14,911 532 85.3% 92 14.7% 5 0.8% 6292008 552 - - - - - - - 13,633 94.9% 738 5.1% 123 0.8% 14,494 490 87.2% 72 12.8% 8 1.4% 5702007 427 - - - - - - - 13,132 96.4% 486 3.6% 1 0.0% 13,619 347 91.3% 33 8.7% - - 3802006 469 - - - - - - - 13,502 97.4% 356 2.6% 87 0.6% 13,945 438 1 35 7.4% 3 0.6% 4762005 497 - - - - - - - 12,546 97.5% 323 2.5% 88 0.7% 12,957 466 93.2% 34 6.8% 4 0.8% 504
2004 * 507 - - - - - - - 8,324 96.8% 274 3.2% - - 8,598 433 92.7% 34 7.3% - - 4672003 546 - - - - - - - 19,550 97.6% 482 2.4% - - 20,032 492 96.5% 18 3.5% - - 5102002 509 - - - - - - - 14,061 98.1% 267 1.9% - - 14,328 395 96.1% 16 3.9% - - 4112001 512 - - - - - - - 11,510 97.7% 267 2.3% - - 11,777 409 97.1% 12 2.9% - - 4212000 560 - - - - - - - 14,210 98.6% 199 1.4% - - 14,409 418 98.1% 8 1.9% - - 4261999 445 - - - - - - - 9,627 98.1% 187 1.9% - - 9,814 299 97.7% 7 2.3% - - 3061998 367 - - - - - - - 8,875 98.2% 162 1.8% - - 9,037 223 94.9% 12 5.1% - - 235
Notes:* The temporary fall in 2004 reflects the introduction of online self-assessment (if relevant), intended to discourage unrealistic applications. Since then, an application is deemed to have been submitted only if the applicant has completed the self-assessment and proceeds to take the online tests." - " represents information that is unknown or unavailable.
Non-respondent/ Prefer not to say
Table 26: Disability, Trend
Trend
Registrations Applications Recommended for AppointmentCompetition VacanciesNon-Disabled Disabled Non-respondent/
Prefer not to say
TotalTotal TotalNon-Disabled Disabled Non-respondent/
Prefer not to sayNon-Disabled Disabled

Applications Recommended for Appointment
Success rate Applications Recommended for Appointment
Success rate Applications Recommended for Appointment
Success rate Applications Recommended for Appointment
Success rate
2018 1,305 3,572 174 4.9% 34,731 1,137 3.3% 2,154 100 4.6% 40,457 1,411 3.5%2017 1,330 3,376 127 3.8% 35,199 1,036 2.9% 1,995 70 3.5% 40,570 1,233 3.0%2016 911 2,694 116 4.3% 26,780 935 3.5% 2,976 194 6.5% 32,450 1,245 3.8%2015 1,077 1,400 71 5.1% 18,068 803 4.4% 1,667 93 5.6% 21,135 967 4.6%2014 820 1,161 74 6.4% 17,359 752 4.3% 1,552 89 5.7% 20,072 915 4.6%
Notes:1LGBO is a new grouping classification intoduced in 2017/18 report. Information from previous years has now been grouped under this classification due to statistical disclosure. If you want to view historical trends of 'other', please view our 2016 report.
Table 27: Sexual Orientation, Success Rate Trend
Competition Vacancies Lesbian/Gay/Bisexual/Other (LGBO)1 Heterosexual/Straight Non-respondents/Prefer not to say Total
Success Rate Trend

Number % of known Number % of known Number % of total Number % of known Number % of known Number % of total Number % of known Number % of known Number % of total
2018 1,305 3,811 9.4% 36,871 90.6% 8,216 16.8% 48,898 3,572 9.3% 34,731 90.7% 2,154 5.3% 40,457 174 13.3% 1,137 86.7% 100 7.1% 1,4112017 1,330 3,432 8.7% 35,840 91.3% 4,680 10.6% 43,952 3,376 8.8% 35,199 91.2% 1,995 4.9% 40,570 127 10.9% 1,036 89.1% 70 5.7% 1,2332016 911 2,948 8.1% 33,643 91.9% 3,104 7.8% 39,695 2,694 9.1% 26,780 90.9% 2,976 9.2% 32,450 116 11.0% 935 89.0% 194 15.6% 1,2452015 1,077 2,385 6.7% 33,170 93.3% 2,620 6.9% 38,175 1,400 7.2% 18,068 92.8% 1,667 7.9% 21,135 71 8.1% 803 91.9% 93 9.6% 9672014 820 2,102 5.8% 34,267 94.2% 2,539 6.5% 38,908 1,161 6.3% 17,359 93.7% 1,552 7.7% 20,072 74 9.0% 752 91.0% 89 9.7% 915
Notes:1LGBO is a new grouping classification intoduced in 2017/18 report. Information from previous years has now been grouped under this classification due to statistical disclosure. If you want to view historical trends of 'other', please view our 2016 report.
Heterosexual/Straight
Trend
Table 28: Sexual Orientation, Trend
Registrations Applications Recommended for Appointment TotalCompetition VacanciesNon-respondents/ Prefer not to say
Lesbian/Gay/Bisexual/Other (LGBO)1
Heterosexual/Straight Non-respondents/ Prefer not to say
Total TotalLesbian/Gay/Bisexual/O
ther (LGBO)1Heterosexual/Straight Non-respondents/
Prefer not to sayLesbian/Gay/Bisexual/O
ther (LGBO)1

Applications Recommended for Appointment
Success rate Applications Recommended for Appointment
Success rate Applications Recommended for
Appointment
Success rate Applications Recommended for
Appointment
Success rate Applications Recommended for
Appointment
Success rate
2018 1,305 22,364 964 4.3% 3,909 107 2.7% 5,111 107 2.1% 9,073 233 2.6% 40,457 1,411 3.5%2017 1,330 24,427 884 3.6% 5,967 136 2.3% 4,805 92 1.9% 5,371 121 2.3% 40,570 1,233 3.0%2016 911 22,249 944 4.2% 3,972 129 3.2% 2,486 47 1.9% 3,743 125 3.3% 32,450 1,245 3.8%2015 1,077 14,684 773 5.3% 2,757 98 3.6% 1,497 40 2.7% 2,197 56 2.5% 21,135 967 4.6%2014 820 14,052 711 5.1% 2,646 106 4.0% 1,464 38 2.6% 1,910 60 3.1% 20,072 915 4.6%2013 782 12,746 678 5.3% 2,284 100 4.4% 1,238 30 2.4% 1,698 56 3.3% 17,966 864 4.8%2012 649 15,202 531 3.5% 2,754 59 2.1% 1,522 25 1.6% 2,064 39 1.9% 21,542 654 3.0%2011 354 12,916 310 2.4% 2,294 35 1.5% 1,117 10 0.9% 2,034 38 1.9% 18,361 393 2.1%
Table 29: Socio-economic Background, Success Rate Trend
Success Rate Trend
Competition Vacancies Higher managerial, administrative and professional occupations
Intermediate Occupations Routine & Manual occupations Non-respondents and non-working Total

Number % of known
Number % of known
Number % of known
Number % of total Number % of known
Number % of known
Number % of known
Number % of total Number % of known
Number % of known
Number % of known
Number % of total
2018 1,305 23,619 71.2% 4,149 12.5% 5,427 16.3% 15,703 32.1% 48,898 22,364 71.3% 3,909 12.5% 5,111 16.3% 9,073 22.4% 40,457 964 81.8% 107 9.1% 107 9.1% 233 16.5% 1,4112017 1,330 24,771 69.4% 6,057 17.0% 4,883 13.7% 8,241 18.8% 43,952 24,427 69.4% 5,967 17.0% 4,805 13.7% 5,371 13.2% 40,570 884 79.5% 136 12.2% 92 8.3% 121 9.8% 1,2332016 911 25,269 73.5% 5,378 15.6% 3,725 10.8% 5,323 13.4% 39,695 22,249 77.5% 3,972 13.8% 2,486 8.7% 3,743 11.5% 32,450 944 84.3% 129 11.5% 47 4.2% 125 10.0% 1,245
2015 * 1,077 24,279 72.4% 5,664 16.9% 3,587 10.7% 4,663 12.2% 38,193 14,684 77.5% 2,757 14.6% 1,497 7.9% 2,197 10.4% 21,135 773 84.9% 98 10.8% 40 4.4% 56 5.8% 9672014 820 24,714 72.1% 5,757 16.8% 3,792 11.1% 4,645 11.9% 38,908 14,052 77.4% 2,646 14.6% 1,464 8.1% 1,910 9.5% 20,072 711 83.2% 106 12.4% 38 4.4% 60 6.6% 9152013 782 21,860 74.1% 4,735 16.0% 2,913 9.9% 5,042 14.6% 34,550 12,746 78.4% 2,284 14.0% 1,238 7.6% 1,698 9.5% 17,966 678 83.9% 100 12.4% 30 3.7% 56 6.5% 8642012 649 21,855 73.9% 4,740 16.0% 2,974 10.1% 5,137 14.8% 34,706 15,202 78.0% 2,754 14.1% 1,522 7.8% 2,064 9.6% 21,542 531 86.3% 59 9.6% 25 4.1% 39 6.0% 6542011 354 17,517 76.4% 3,528 15.4% 1,890 8.2% 3,767 14.1% 26,702 12,916 79.1% 2,294 14.1% 1,117 6.8% 2,034 11.1% 18,361 310 87.3% 35 9.9% 10 2.8% 38 9.7% 393
Notes:* 2015 registrations are slightly higher because some test candidates are included
Total Total Total
Table 30: Socio-economic Background, Trend
Trend
Competition Vacancies Registrations Applications Recommended for AppointmentNon-respondents and
non-workingHigher managerial, administrative and
professional occupations
Intermediate Occupations
Routine & Manual occupations
Non-respondents and non-working
Higher managerial, administrative and
professional occupations
Routine & Manual occupations
Intermediate Occupations
Routine & Manual occupations
Non-respondents and non-working
Higher managerial, administrative and
professional occupations
Intermediate Occupations

Applications Recommended for Appointment
Success rate Applications Recommended for Appointment
Success rate Applications Recommended for Appointment
Success rate Applications Recommended for Appointment
Success rate
2018 1,305 24,379 1,046 4.3% 5,929 123 2.1% 10,149 242 2.4% 40,457 1,411 3.5%2017 1,330 25,439 916 3.6% 5,512 122 2.2% 9,619 195 2.0% 40,570 1,233 3.0%2016 911 26,386 1,021 3.9% 3,543 82 2.3% 2,521 142 5.6% 32,450 1,245 3.8%2015 1,077 17,042 828 4.9% 2,612 78 3.0% 1,481 61 4.1% 21,135 967 4.6%
Table 31: Free School Meals, Success Rate Trend
Competition Vacancies Not Eligible for Free School Meals Eligible for Free School Meals Non-respondents Total
Success Rate Trend

Number % of known
Number % of known
Number % of total Number % of known
Number % of known
Number % of total Number % of known
Number % of known
Number % of total
2018 1,305 25,768 80.4% 6,274 19.6% 16,855 34.5% 48,898 24,379 80.4% 5,929 19.6% 10,149 25.1% 40,457 1,046 89.5% 123 10.5% 242 17.2% 1,4112017 1,330 25,812 82.1% 5,616 17.9% 12,524 28.5% 43,952 25,439 82.2% 5,512 17.8% 9,619 23.7% 40,570 916 88.2% 122 11.8% 195 15.8% 1,2332016 911 31,397 85.6% 5,288 14.4% 3,010 7.6% 39,695 26,386 88.2% 3,543 11.8% 2,521 7.8% 32,450 1,021 92.6% 82 7.4% 142 11.4% 1,2452015 1,077 29,389 82.6% 6,173 17.4% 2,613 6.8% 38,175 17,042 86.7% 2,612 13.3% 1,481 7.0% 21,135 828 91.4% 78 8.6% 61 6.3% 967
Table 32: Free School Meals, Trend
Trend
Registrations Applications Recommended for Appointment TotalCompetition VacanciesNon-respondent/ Prefer not to say
Total TotalNot Eligible for Free
School MealsEligible for Free
School MealsNon-respondent/ Prefer not to say
Not Eligible for Free School Meals
Eligible for Free School Meals
Non-respondent/ Prefer not to say
Not Eligible for Free School Meals
Eligible for Free School Meals

Applications Recommended for Appointment
Success rate Applications Recommended for
Appointment
Success rate Applications Recommended for Appointment
Success rate Applications Recommended for Appointment
Success rate Applications Recommended for Appointment
Success rate Applications Recommended for Appointment
Success rate
2018 1305 34,375 1,013 2.9% 15,293 733 4.8% 19,082 280 1.5% 1,631 246 15.1% 4,451 152 3.4% 40,457 1,411 3.5%2017 1,330 34,326 916 2.7% 15,891 670 4.2% 18,435 246 1.3% 1,868 199 10.7% 4,376 118 2.7% 40,570 1,233 3.0%2016 911 29,825 968 3.2% - - - - - - 2,625 277 10.6% - - - 32,450 1,245 3.8%2015 1,077 19,206 773 4.0% - - - - - - 1,929 194 10.1% - - - 21,135 967 4.6%2014 820 18,230 723 4.0% - - - - - - 1,842 192 10.4% - - - 20,072 915 4.6%2013 782 16,156 672 4.2% - - - - - - 1,810 192 10.6% - - - 17,966 864 4.8%2012 649 19,473 480 2.5% - - - - - - 2,069 174 8.4% - - - 21,542 654 3.0%2011 354 16,431 291 1.8% - - - - - - 1,930 102 5.3% - - - 18,361 393 2.1%2010 477 19,783 361 1.8% - - - - - - 1,978 104 5.3% - - - 21,761 465 2.1%2009 585 13,250 464 3.5% - - - - - - 1,661 165 9.9% - - - 14,911 629 4.2%2008 552 12,714 404 3.2% - - - - - - 1,780 166 9.3% - - - 14,494 570 3.9%2007 427 11,945 261 2.2% - - - - - - 1,674 119 7.1% - - - 13,619 380 2.8%2006 469 12,216 328 2.7% - - - - - - 1,729 148 8.6% - - - 13,945 476 3.4%2005 497 11,353 354 3.1% - - - - - - 1,604 150 9.4% - - - 12,957 504 3.9%
2004 * 507 7,216 300 4.2% - - - - - - 1,382 167 12.1% - - - 8,598 467 5.4%2003 546 18,214 328 1.8% - - - - - - 1,818 182 10.0% - - - 20,032 510 2.5%2002 509 13,122 298 2.3% - - - - - - 1,206 113 9.4% - - - 14,328 411 2.9%2001 512 10,846 303 2.8% - - - - - - 931 118 12.7% - - - 11,777 421 3.6%2000 560 13,289 289 2.2% - - - - - - 1,120 137 12.2% - - - 14,409 426 3.0%1999 445 8,880 214 2.4% - - - - - - 934 92 9.9% - - - 9,814 306 3.1%1998 367 8,142 154 1.9% - - - - - - 895 81 9.1% - - - 9,037 235 2.6%
Notes:
1Breakdown of Non-Oxbridge into Russell Group and other universities. This a is a new classification grouping that has been introduced in the 2017/18 report. Information for previous years is not available and has been noted with "-").
* The temporary fall in 2004 reflects the introduction of online self-assessment (if relevant), intended to discourage unrealistic applications. Since then, an application is deemed to have been submitted only if the applicant has completed the self-assessment and proceeds to take the online tests." - " represents information that is unavailable as declaring the University of First Degree was a mandatory field in the application process in prior years but not required until the onboarding stage in 2017 . Rusell Group excluding Oxbridge and other universities is a new grouping classification introduced in 2017/18.
Total
Table 33: University of First Degree, Success Rate Trend
Success Rate Trend
Competition Vacancies Non-OxbridgeTotal Of which: Russell Group excluding Oxbridge1 Of which: Other universities1
Non-respondentsOxbridge

Number % of known
Number % of Total Non-
Oxbridge
Number % of Total Non-
Oxbridge
Number % of known
Number % of total Number % of known
Number % of Total Non-
Oxbridge
Number % of Total Non-
Oxbridge
Number % of known
Number % of total
2018 1,305 34,375 95.5% 15,293 44.5% 19,082 55.5% 1,631 4.5% 4,451 11.0% 40,457 1,013 80.5% 733 72.4% 280 27.6% 246 19.5% 152 10.8% 1,4112017 1,330 34,326 94.8% 15,891 46.3% 18,435 53.7% 1,868 5.2% 4,376 10.8% 40,570 916 82.2% 670 73.1% 246 26.9% 199 17.8% 118 9.6% 1,2332016 911 29,825 91.9% - - - - 2,625 8.1% - - 32,450 968 77.8% - - - - 277 22.2% - - 1,2452015 1,077 19,206 90.9% - - - - 1,929 9.1% - - 21,135 773 79.9% - - - - 194 20.1% - - 9672014 820 18,230 90.8% - - - - 1,842 9.2% - - 20,072 723 79.0% - - - - 192 21.0% - - 9152013 782 16,156 89.9% - - - - 1,810 10.1% - - 17,966 672 77.8% - - - - 192 22.2% - - 8642012 649 19,473 90.4% - - - - 2,069 9.6% - - 21,542 480 73.4% - - - - 174 26.6% - - 6542011 354 16,431 89.5% - - - - 1,930 10.5% - - 18,361 291 74.0% - - - - 102 26.0% - - 3932010 477 19,783 90.9% - - - - 1,978 9.1% - - 21,761 361 77.6% - - - - 104 22.4% - - 4652009 585 13,250 88.9% - - - - 1,661 11.1% - - 14,911 464 73.8% - - - - 165 26.2% - - 6292008 552 12,714 87.7% - - - - 1,780 12.3% - - 14,494 404 70.9% - - - - 166 29.1% - - 5702007 427 11,945 87.7% - - - - 1,674 12.3% - - 13,619 261 68.7% - - - - 119 31.3% - - 3802006 469 12,216 87.6% - - - - 1,729 12.4% - - 13,945 328 68.9% - - - - 148 31.1% - - 4762005 497 11,353 87.6% - - - - 1,604 12.4% - - 12,957 354 70.2% - - - - 150 29.8% - - 504
2004 * 507 7,216 83.9% - - - - 1,382 16.1% - - 8,598 300 64.2% - - - - 167 35.8% - - 4672003 546 18,214 90.9% - - - - 1,818 9.1% - - 20,032 328 64.3% - - - - 182 35.7% - - 5102002 509 13,122 91.6% - - - - 1,206 8.4% - - 14,328 298 72.5% - - - - 113 27.5% - - 4112001 512 10,846 92.1% - - - - 931 7.9% - - 11,777 303 72.0% - - - - 118 28.0% - - 4212000 560 13,289 92.2% - - - - 1,120 7.8% - - 14,409 289 67.8% - - - - 137 32.2% - - 4261999 445 8,880 90.5% - - - - 934 9.5% - - 9,814 214 69.9% - - - - 92 30.1% - - 3061998 367 8,142 90.1% - - - - 895 9.9% - - 9,037 154 65.5% - - - - 81 34.5% - - 235
Notes:
1Breakdown of Non-Oxbridge into Russell Group and other universities. This a is a new classification grouping that has been introduced in the 2017/18 report. Information for previous years is not available and has been noted with "-").
Total
* The temporary fall in 2004 reflects the introduction of online self-assessment (if relevant), intended to discourage unrealistic applications. Since then, an application is deemed to have been submitted only if " - " represents information that is unavailable as declaring the University of First Degree was a mandatory field in the application process in prior years but not required until the onboarding stage in 2017 .
Table 34: University of First Degree, Trend
Trend
Applications Recommended for AppointmentNon-Oxbridge Oxbridge
Total Of which: Russell Group excluding
Oxbridge1
Of which: Other universities1
Total
Competition Vacancies
Of which: Russell Group excluding
Oxbridge1
Non-respondent Non-Oxbridge Oxbridge Non-respondentOf which: Other
universities1
Total