CITYLAND DEVELOPMENT CORPORATION AND SUBSIDIARIES Information Statement (2015).pdfRUDY GO...
110
COVER SHEET SEC Registration Number 8 6 1 8 8 Company Name C I T Y L A N D , I N C . Principal Office (No./Street/Barangay/City/Town/Province) 3 r d F l o o r , C i t y l a n d C o n d o m i n i u m 1 0 , T o w e r I 1 5 6 H . V . d e l a C o s t a S t r e e t M a k a t i C i t y Form Type Department requiring the report Secondary License Type, If Applicable 2 0 - I S C G F D Not Applicable COMPANY INFORMATION Company’s Email Address Company’s Telephone Number/s Mobile Number [email protected] 893-6060 N/A No. of Stockholders Annual Meeting Month/Day Calendar Year Month/Day 18 3 rd Tuesday of June 2014/12/31 CONTACT PERSON INFORMATION The designated contact person MUST be an Officer of the Corporation Name of Contact Person Email Address Telephone Number/s Mobile Number RUDY GO [email protected] 893-6060 N/A Contact Person’s Address 3 rd Floor Cityland Condominium 10, Tower 1, 156 H.V. dela Costa Street, Makati City Note: In case of death, resignation or cessation of office of the officer designated as contact person, such incident shall be reported to the Commission within thirty (30) calendar days from the occurrence thereof with information and complete contact details of the new contact person designated.
Transcript of CITYLAND DEVELOPMENT CORPORATION AND SUBSIDIARIES Information Statement (2015).pdfRUDY GO...

COVER SHEET
SEC Registration Number
8 6 1 8 8
Company Name
C I T Y L A N D , I N C .
Principal Office (No./Street/Barangay/City/Town/Province)
3 r d F l o o r , C i t y l a n d
C o n d o m i n i u m 1 0 , T o w e r I
1 5 6 H . V . d e l a C o s t a S t r e e t
M a k a t i C i t y
Form Type Department requiring the report Secondary License Type, If
Applicable
2 0 - I S C G F D Not Applicable
COMPANY INFORMATION
Company’s Email Address Company’s Telephone Number/s Mobile Number
[email protected] 893-6060 N/A
No. of Stockholders
Annual Meeting
Month/Day
Calendar Year
Month/Day
18 3rd Tuesday of June 2014/12/31
CONTACT PERSON INFORMATION The designated contact person MUST be an Officer of the Corporation
Name of Contact Person Email Address Telephone Number/s Mobile Number
RUDY GO [email protected] 893-6060 N/A
Contact Person’s Address
3rd Floor Cityland Condominium 10, Tower 1, 156 H.V. dela Costa Street, Makati City Note: In case of death, resignation or cessation of office of the officer designated as contact person, such incident shall be reported to the
Commission within thirty (30) calendar days from the occurrence thereof with information and complete contact details of the new contact
person designated.

CITYLAND
NOTICE OR ANNUAL STOCKHOLDERS' MOETING
NOTICE IS HEREBY GMN that the annual meeting of stockholders ofCITYLAND, INC., will be held at the 3F Cityland Condominium l0 Tower 2,154 H.V. Dela Costa Stree! Makati City, on June 16, 2015 at 4:00 pm with the following:
AGENDA
l. Call to Order
2. Approval of Minutes of previous meeting
3. President's Report
4. Election of Directors (including Independent Directors)
5. Appoinftnent of the Extemal Auditor
6. Confirmation of all acts of the Board of Directors for the period coveringJanuary l, 2014 through Decernber 31,2Ol4 adopted in the ordinary course ofbusiness, including but not limited to:
a. Approval of investonents;b. Treasury mattcrs relatcrl to opening of acoounts ard bar* transaotir.ms,c. Appoinbnent of signatories and amendments thereof; andd. Annual Report and related Financial Statements
7. Other matters which may be raised before the body
8. Adjoumment
For the purpose of the meeting, only stockholders ofrecord as of May 15, 2015 are entitledto attend and vote in the said meeting.
Copies ofthe minutes ofthe annual stockholders' meeting held on June 17, 2014 will beavailable upon request.
Matati City, May 4, 2015
FOR THE BOARD OF DIRECTORS
/;\
QryftYM/EM]WA GI JULARBA.Lcorporn{s"o"r*y[ f
2Fl3F CITYLAND CONDOMINIUM ,10 TOWERS 1 &2,1561154 H.V DELA COSTA ST, SALCEDO VILLAGE, MAKATI 1226
PO.BOX5000 IVIAKATI 1290,TEl.# 893{0-60 FAx#:892-8656 www cityland net
INCORPORATED
\,
7

1
SECURITIES AND EXCHANGE COMMISSION
SEC FORM 20-IS
INFORMATION STATEMENT PURSUANT TO SECTION 20
OF THE SECURITIES REGULATION CODE
1. Check the appropriate box:
[ X ] Preliminary Information Statement
[ ] Definitive Information Statement
2. Name of the registrant as specified in its charter Cityland, Inc.
3. Makati City, Philippines
Province, country or other jurisdiction of incorporation or organization
4. SEC Identification Number 86188
5. BIR Tax Identification Code 000-662-829
6. 3rd Floor Cityland Condominium 10 Tower 1, 156 H.V. Dela Costa Street,
Makati City 1226
Address of principal office Postal Code
7. Registrant’s telephone number, including area code (632) 893-6060
8. Date, time and place of the meeting of security holders
Date - June 16, 2015
Time - 4:00 pm
Place - 3rd Floor Cityland Condominium 10 Tower 2, 154 H.V. Dela Costa Street,
Makati City, Philippines
9. Approximate date on which the Information Statement is to be first sent or given to security holders
May 25, 2015
10. Securities registered pursuant to Sections 8 and 12 of the Code or Sections 4 and 8 of the RSA (information
on number of shares and amount of debt is applicable only to corporate registrants):
Title of Each Class Number of Shares Outstanding
Unclassified Common Shares 81,258,406
WE ARE NOT ASKING YOU FOR A PROXY AND YOU
ARE NOT REQUIRED TO SEND ONE
11. Are any or all of registrant’s securities listed on a stock exchange?
Yes [ ] No [ x ]

2
INFORMATION REQUIRED IN INFORMATION STATEMENT
GENERAL INFORMATION
I. Date, time and place of meeting of security holders
Date - June 16, 2015
Time - 4:00 pm
Place - 3rd Floor Cityland Condominium 10 Tower 2, 154 H.V. Dela Costa Street,
Makati City, Philippines
Principal Office - 3rd Floor Cityland Condominium 10 Tower 1, 156 H.V. Dela Costa Street,
Makati City, Philippines
Approximate date on which the Information Statement is to be first sent or given to security holders
May 25, 2015.
II. Dissenter’s Right of Appraisal
Under the Corporation Code, a dissenting stockholder who has voted against a proposed corporate
action, shall have the right of appraisal or the right to demand payment of the fair value of his shares
only in the following instances:
a. Any amendment to the Articles of Incorporation which has the effect of changing or restricting the
rights of any stockholder or class of shares, or of authorizing preferences in any respect superior to
those of the outstanding shares of any class, or of extending or shortening the term of corporate
existence;
b. Sale, lease, exchange, transfer, mortgage, pledge or other disposition of all or substantially all of
the corporate property and assets;
c. Merger or consolidation; and
d. Investment in another corporation, business or for any purpose other than the primary purpose for
which the corporation was organized.
There is no matter to be acted upon at the annual stockholders’ meeting of the Registrant which would
fall under any of the foregoing instances of appraisal.
III. Interest of Certain Persons in or Opposition to Matters to be Acted Upon
a. No person who has been a director or officer of the Registrant, nor a nominee for election
as a director of the Registrant, nor any of their associates have a substantial interest in any matter
to be acted upon at the annual stockholders’ meeting, other than the election of directors for the
fiscal year 2015.
b. No director has informed the Registrant in writing that he intends to oppose any action to be taken
at the annual stockholders’ meeting.
CONTROL AND COMPENSATION INFORMATION
IV. Voting Securities and Principal Holders Thereof
a. The Registrant has 81,258,406 unclassified common shares issued and outstanding as of
April 30, 2015. Each common share shall be entitled to one vote with respect to all matters to be
taken up during the annual stockholders’ meeting.
b. The record date for determining stockholders entitled to notice and to vote during the annual
stockholders meeting and also to this information statement is on May 15, 2015.
c. There are no any arrangements which resulted in a change in control of the Registrant.

3
d. In the election of directors, the number of votes to which each stockholder is entitled shall be equal
to the number of shares he owns multiplied by the number of directors to be elected. All
stockholders shall have cumulative voting rights. Each stockholder may vote such number of
shares for as many persons as there are directors to be elected or he may cumulate said shares and
give one candidate as many votes as the number of directors to be elected multiplied by the
number of his shares shall equal, or he may distribute them on the same principle among as many
candidates as he shall see fit.
e. Security Ownership of Record and Beneficial Owner owning more than 5% of the outstanding
capital stock of the Registrant as of April 30, 2015:
Title of Class Name, Address of Record Owner
& Relationship with Issuer
Beneficial Owner &
Relationship
Citizenship No. of
Shares Held
Percent
Unclassified
common shares
Stephen C. Roxas
1392 Campañilla St., Dasmariñas
Village, Makati
-Director / Chairman of the Board
-- Filipino 22,881,241 28.16
Unclassified
common shares
Grace C. Liuson
2072 Lumbang cor. Cypress
Dasmariñas Village, Makati
-Director / Deputy Vice Chairman of the Board
-- Filipino 11,947,588 14.70
Unclassified
common shares
Andrew I. Liuson
2072 Lumbang cor. Cypress
Dasmariñas Village, Makati -Director / Vice Chairman of the
Board
-- Filipino 11,028,565 13.57
Unclassified
common shares
Daniel Yen Chiong
2F Cityland Condo 10 Tower I, 156 H.V. Dela Costa St.,
Makati City
-Stockholder
-- Filipino 7,352,373 9.05
Unclassified
common shares
Lucy Fan
47 Cambridge Circle, North
Forbes Park, Makati City
-Stockholder
-- American 7,352,373 9.05
Unclassified common shares
Helen C. Roxas 1392 Campañilla St., Dasmariñas
Village, Makati
-Director
-- Filipino 7,352,373 9.05
Unclassified common shares
The Good Seed Sower Foundation Incorporated *
3F Cityland Condo 10 Tower I,
156 H.V. Dela Costa St.,
Ayala North, Makati City -Record Owner / Stockholder
-- Filipino 7,352,352 9.05
Unclassified
common shares
Alice C. Gohoc
24 Pili Avenue, Forbes Park
Makati City -Director
-- Filipino 5,865,662 7.23
* The person who will vote the shares of Good Seed Sower Foundation, Inc. is Winnie Go, the
treasurer and director of the foundation.

4
f. Security Ownership of Management as of April 30, 2015:
Title of Class
Name
Citizenship
Nature of
Ownership
No. of Shares
Held
Percentage
Directors:
Unclassified
common shares
Stephen C. Roxas
Chairman of the Board /
Director
Filipino Direct / Indirect 22,881,241 28.16
Unclassified
common shares
Andrew I. Liuson
Vice Chairman of the Board /
Director
Filipino Direct 11,028,565 13.57
Unclassified common shares
Grace C. Liuson Deputy Vice Chairman of the
Board / Director
Filipino Direct 11,947,588 14.70
Unclassified
common shares
Josef C. Gohoc
President / Director
Filipino Direct 3,888 --
Unclassified
common shares
Peter S. Dee
Independent Director
Filipino Direct 29 --
Unclassified
common shares
Paul Y. Ung
Independent Director
Filipino Direct 26 --
Unclassified
common shares
Alice C. Gohoc
Director
Filipino Direct 5,865,662 7.23
Unclassified
common shares
Helen C. Roxas
Director
Filipino Direct 7,352,373 9.05
Executive Officers:
Unclassified common shares
Emma A. Choa Executive Vice President /
Treasurer
Filipino -- -- --
Unclassified
common shares
Rudy Go
Senior Vice President
Filipino -- -- --
Unclassified
common shares
Emma G. Jularbal
Vice President – Legal Affairs
and Corporate Secretary
Filipino -- -- --
Unclassified common shares
Eden F. Go Vice President
Filipino -- -- --
Unclassified
common shares
Melita M. Revuelta
Vice President
Filipino -- -- --
Unclassified common shares
Romeo E. Ng Vice President
Filipino -- -- --
Unclassified
common shares
Melita L. Tan
Vice President
Filipino -- -- --
Security Ownership of all Directors and Officers 59,079,372 72.71%
g. The Corporation knows no person holding more than 5% of common shares under a voting
trust or similar agreement.

5
V. Directors and Executive Officers
a. Identify Directors, including Independent Directors, and Executive Officers (All are
incumbent)
Name
Citizenship
Position(s) currently
held with the registrant
Term of
Office
(Year*)
Period of Service
Age
Family
Relationship
Stephen C. Roxas
Filipino Chairman of the Board /
Director
1 07/01/97 to present 73 Husband of Helen
Roxas, brother of
Grace Liuson & Alice Gohoc
Andrew I. Liuson
Filipino Vice Chairman of the
Board / Director
1 01/16/08 to present 70 Husband of Grace
Liuson
Grace C. Liuson
Filipino Deputy Vice Chairman
of the Board / Director
1 02/01/11 to present 69 Wife of Andrew
Liuson, sister of
Stephen Roxas &
Alice Gohoc
Josef C. Gohoc
Filipino President / Director 1 02/01/11 to present 45 Nephew of Stephen Roxas &
Grace Liuson, son
of Alice Gohoc
Peter S. Dee
Filipino Independent Director 1 11/22/04 to present 73 --
Paul Y. Ung
Filipino Independent Director 1 11/18/08 to present 71 --
Alice C. Gohoc
Filipino Director 1 09/01/01 to present 72 Sister of Stephen
Roxas & Grace
Liuson, mother of Josef Gohoc
Helen C. Roxas
Filipino Director 1 1979 to present 65 Wife of Stephen
Roxas
Emma A. Choa
Filipino ExecutiveVice President / Treasurer
-- 02/01/11 to present 56 --
Rudy Go
Filipino Senior Vice President -- 08/16/07 to present 55 --
Emma G. Jularbal
Filipino Vice Pres. – Legal Affairs
and Corp. Secretary
-- 07/01/01 to present 58 --
Eden F. Go
Filipino Vice President -- 01/16/08 to present 62 --
Melita M. Revuelta
Filipino Vice President -- 01/16/08 to present 56 --
Romeo E. Ng
Filipino Vice President -- 01/10/05 to present 53 --
Melita L. Tan
Filipino Vice President -- 02/16/04 to present 54 --
* 1 Year subject to re-election
Business Experience for the Past Five Years
Name Name of Office Positions Date Assumed
STEPHEN C. ROXAS
City & Land Developers, Incorporated
Cityland Development Corporation
Cityplans, Incorporated
Director / Chairman of the Executive Committee
Director / Chairman of the
Executive Committee
Director / President
July 1997
July 1997
October 1988
ANDREW I. LIUSON
City & Land Developers, Incorporated
Cityland Development Corporation
Cityplans, Incorporated
Director / Vice Chairman of the
Board Director / Vice Chairman of the
Board
Director / Chairman of the Board
January 2008
January 2008
September 2006
GRACE C. LIUSON
City & Land Developers, Incorporated
Cityland Development Corporation
Cityplans, Incorporated
Director / Deputy Vice Chairman
of the Board
Director / Deputy Vice Chairman
of the Board Director / Exec. Vice President
February 2011
February 2011
September 2006

6
JOSEF C. GOHOC
City & Land Developers, Incorporated
Cityland Development Corporation
President / Director
President / Director
February 2011
February 2011
PETER S. DEE
Asean Finance Corporation, Ltd.
Alpolac, Inc.
China Banking Corporation CBC Forex Corporation
CBC Insurance Brokers, Inc.
CBC Properties & Computer Center Inc.
GDSK Development Corporation Hydee Mgt. & Resource Corp.
Kemwerke, Inc.
Silver Falcon Insurance Agency
Makati Curbs Holdings Corporation Great Expectations Holdings, Inc.
The Big D Holdings Corporation
Commonwealth Foods, Inc.
Cityplans, Incorporated Cityland Development Corporation
City & Land Developers, Incorporated
Director
Director
Director Director / Chairman of the Board
Chairman of the Board
Director / President
Director Director
Director
Director
Director Director/Chairman; President
Director/Chairman; President
Director
Independent Director Independent Director
Independent Director
1991 to present
1994 to present
1997 to present 1997 to present
1998 to present
1984 to present
1990 to present 1991 to present
1994 to present
1995 to present
2012 to present 2012 to present
2013 to present
2013 to present
1991 to present 1982 to present
2004 to present
PAUL Y. UNG
Security Bank Corporation Vice Chairman May 2001
ALICE C. GOHOC
City & Land Developers, Incorporated
Cityland Development Corporation
Director
Director
1991
September 1996
HELEN C. ROXAS
City & Land Developers, Incorporated
Cityland Development Corporation
Cityplans, Incorporated
Director
Director
Director
1989
1979
October 1988
EMMA A. CHOA
City & Land Developers, Incorporated
Cityland Development Corporation
Executive Vice President /
Treasurer
Executive Vice President / Treasurer
January 2015
January 2015
RUDY GO
City & Land Developers, Incorporated
Cityland Development Corporation
Senior Vice President
Senior Vice President
January 2015
January 2015
EMMA G. JULARBAL
City & Land Developers, Incorporated
Cityland Development Corporation
Corporate Secretary
Vice Pres. – Legal Affairs /
Corporate Secretary
January 2013
July 2001 /
July 1997
EDEN F. GO
City & Land Developers, Incorporated Cityland Development Corporation
Vice President Vice President
January 2008 January 2008
MELITA M. REVUELTA
City & Land Developers, Incorporated
Cityland Development Corporation
Vice President
Vice President
January 2008
January 2008
ROMEO E. NG
City & Land Developers, Incorporated
Cityland Development Corporation
Vice President
Vice President
January 2005
January 2005
MELITA L. TAN
City & Land Developers, Incorporated
Cityland Development Corporation
Vice President
Vice President
February 2004
February 2004
b. Identify Significant Employees
There is no identifiable significant employee because the Registrant expects each employee to do
his share in achieving the Corporation’s set goals.

7
c. Involvement in Certain Legal Proceedings of Any of the Directors and Executive Officers
During the Past Five Years Up to the Latest Date
During the past five years up to the latest date, there is no involvement in certain legal proceedings
of any of the directors and executive officers in any court or administrative agency of the
government.
a. None of them has been involved in any bankruptcy petition.
b. None of them has been convicted by final judgment in any criminal proceeding or
being subject to a pending criminal proceeding, both domestic and foreign.
c. None of them has been subjected to any order, judgment, or decree, not subsequently
reversed, suspended or vacated, of any court of competent jurisdiction, domestic or
foreign, permanently or temporarily enjoining, barring, suspending or otherwise
limiting their involvement in any type of business, securities, commodities or
banking activities.
d. None of them has been found by a domestic or foreign court of competent
jurisdiction (in a civil action), the Commission or comparable body, or a domestic or
foreign exchange or other organized trading market or self-regulatory organization,
to have violated a securities or commodities law or regulation.
d. Legal Proceedings to Which the Registrant or Any of Its Subsidiaries is a Party
A. Cityland, Inc.
1. Sps. Banson & Electra Cheng vs. Cityland, Inc.
HLURB Case No. RIV-032013-3777
Housing & Land Use Regulatory Board - Southern Tagalog Region (Region IV)
Date Instituted: March 20, 2013
Spouses Cheng filed a Complaint for Specific Performance with Damages praying that
Cityland comply and continue with the sale of condominium unit no 6017 and Parking Slot
No. B-104 and B-105 of Tagaytay Prime Residences. Cityland stated in its Answer that no
Deed of Absolute Sale or Contract to Sale was entered into by the parties. There was no
meeting of minds to consummate a contract because there was no consent made by the seller
(Cityland). Unfavorable decision was rendered by the HLURB-Region IV Office, and the
same was appealed to the Board of Commissioners which is now pending.
2. Petition for Cancellation of Adverse Claim Annotated at the Back of TCT No. 076-
2011002118 of the Registry of Deeds for Tagaytay – Cityland, Inc. , Petitioner LRC Case No. TG-13-1824
Tagaytay Regional Trial Court – Branch 18
Date Instituted: February 18, 2013
This is a petition to cancel an adverse claim annotated on the title covering a lot of Cityland in
Tagaytay City. Camilo Regis as homeowner and incumbent President of Tagaytay Executive
Village Homeowners' Assoc. (“TEVHOA” herein) caused the annotation of adverse claim on
the title of a property of Cityland covered by TCT No. 076-2011002118, alleging that certain
lots in their subdivision were excluded from their subdivision without their consent. Cityland
did not receive any notice from the Registry of Deeds as to the annotation of the Adverse
Claim on its title. The Company argued that there is absolutely no basis for such adverse
claim because the necessary permits, including the written consent of the TEVHOA were
procured by Cityland prior to the revision of the subdivision plan. The court ordered the
amendment of the petition to include certain defendants. Trial of the case is on-going.

8
3. Generoso, etal. vs. JDBEC Inc./Cityland Inc., etal.
Case No. 05-07218-13
National Labor Relations Commission
National Capital Region
Date Instituted: May 16, 2013
Wen Generoso, et al. filed a Complaint for underpayment/nonpayment of salary, holiday pay
service incentive leave, 13th month pay against their employer JDBEC Inc., a general
contractor of Cityland. The complainants impleaded Cityland being the principal of JDBEC
Inc.. Cityland in its Position Paper stated that the Complainants are not their employees but of
JDBEC Inc. Complaint against Cityland was dismissed by the Labor Arbiter and affirmed by
the Board of Commissioners.
4. Kelly Kit M. Cabrejas vs. Cityland Inc.
HLURB Case No. CON-LSG-030514-9159
HLURB – Expanded National Capital Region Field Office
Date Instituted: March 5, 2014
Kelly Kit Cabrejas filed a Complaint dated March 5, 2014 before the Housing and Land Use
Regulatory Board (HLURB), seeking an order for the return of all the amortizations he paid
for residential unit no. 2103 at The Manila Residences Tower II.
Cityland stated in its Answer that it cancelled the Contract to Sell in compliance with the
instructions of Spouses Cabrejas in their Cancellation Letter dated February 28, 2014
addressed to Cityland. They were informed that they are not entitled to any cash surrender
value under R.A. No. 6552 which requires a minimum payment of 24 monthly installments.
Cabrejas failed to attend all the set hearings. Thus, the case was dismissed, without prejudice.
5. Republic of the Philippines represented by the Department of Public
Works and Highways (DPWH) vs. Cityland Inc.
Civil Case No. SCA-1063
Pasig Regional Trial Court – Branch 71
Date Instituted: January 30, 2014
DPWH filed a Complaint for Expropriation for the 248 sqm. portion of the property owned by
Cityland, located along Shaw Blvd., Ortigas Center, Pasig City, which became a part of the
Shaw Blvd. Flyover. A Decision was issued on March 30, 1998 and just compansation have
been paid by DPWH. However, the portion of the legal interest remained unpaid, thus
Cityland filed a Motion to direct that an accounting be made of the unsatisfied amount. Trial
of the case is ongoing.
6. Tagaytay Executive Village Homeowners' Association, Inc. vs. Cityland, Inc.
Petition for the Revocation of the Certificate of Completion (COC) issued in favor of
CITYLAND, INC., owner and developer of TAGAYTAY EXEC. VILLAGE, Brgy. San
Jose, Tagaytay City
Case No. REM-A-11-01574
Housing and Land Use Regulatory Board - Board of Commissioners
Date Instituted: November 9, 2011
Tagaytay Executive Village Homeowners' Association, Inc. (TEVHAI) filed an Appeal
Memorandum dated November 9, 2011 with the HLURB Board of Commissioners. The case
involves a petition to revoke the certificate of completion (“COC”), dated March 10, 2010
issued by the Regional Office, HLURB, Southern Tagalog Region, in favor or Cityland, Inc.,
owner and developer of Tagaytay Executive Village located at Brgy. San Jose, Tagaytay City.
TEVHAI wants the Court to recall/cancel the COC and that Cityland be ordered to fully
complete the alleged deficiencies in the amenities. The appeal was dismissed by the HLURB
Board of Commissioners in a Decision dated February 2, 2012.
The TEVHAI appealed this case before the Office of the President which is now pending.

9
B. Cityland Development Corporation (Subsidiary)
1. Esmeraldo Balosa vs. CDC
Civil Case No. MC08-3563
Regional Trial Court Mandaluyong City, Branch 208
Date Instituted: April 11, 2008
Esmeraldo Balosa filed a case for Preliminary Mandatory Injunction with damages against
Cityland after the Business and License Department of Mandaluyong City closed his stalls due
to Balosa’s failure to secure the necessary permits. He alleged that he has not been paying the
lease because another entity is also claiming ownership of the leased property and that the
property cannot be used for his business. Balosa claims Cityland illegally ejected him. Trial
of the case is ongoing.
2. Arthur M. Litonjua vs. CDC
LRC Case No. R-7442
Regional Trial Court Pasig City, Branch 161
Date Instituted: October 29, 2010
Arthur M. Litonjua filed a Petition dated October 29, 2010 and received by Cityland,
last February 1, 2011, seeking an order to compel Cityland or any person in possession of the
owner's duplicate copy of TCT No. 38762, to surrender the same to the Register of Deeds of
Pasig City. In the alternative, Litonjua prayed for the annulment of said owner's duplicate
copy should the person holding the same refuse to surrender the same, and for the Register of
Deeds of Pasig City to issue a new certificate of title in the name of Litonjua and possession of
the subject property.
Cityland commented that it had previously sold the property to Roy L. Borbon way back in
March 28, 1995 but Borbon never claimed the title from Cityland to undertake the registration
of the same. On June 26, 2014, the court rendered an Order ordering Cityland to submit the
owner's copy of the title to the Registry of Deeds for Pasig or for the Register of Deeds to
issue a new one to Litonjua.
3. Cristy Katsui vs. CDC
Case No. NCR REM-062612-14812
HLURB – Expanded National Capital Region Field Office
Date Instituted: June 26, 2012
Cristy Katsui filed a Complaint dated June 20, 2012 before the Housing and Land Use
Regulatory Board (HLURB), seeking an order for the rescission of the Contract to Sell over a
commercial unit no. G-11 in Makati Executive Tower IV and for the return of all the
amortizations paid by her and her children in the total amount of P=1,634,000.00.
Cityland stated in its Answer that it cancelled the above-mentioned Contract to Sell in
compliance with the instruction of Katsui in her letter, in behalf of all the Buyers, dated June
21, 2011. She was informed that she is not entitled to any cash surrender value under R.A. No.
6552 that requires a minimum payment of 24 monthly installments. Katsui paid only 14
installments. Besides, the unit is a commercial unit which is not covered by the law which
seeks to protect buyers of residential units.
HLURB ruled in favor of Katsui so Cityland elevated the appeal to the Office of the President
which is now pending.
4. Cynthia E. Biscocho vs. CDC
HLURB Case No. CON-LSG-060214-9351
HLURB – Expanded National Capital Region Field Office
Date Instituted: June 2, 2014
Cynthia Biscocho, through her lawyer, submitted a letter requesting for conciliation/mediation
before the Housing and Land Use Regulatory Board (HLURB), relative to her residential unit
no. 561 in Cityland Wack Wack Royal Mansion.

10
Cityland stated in its Comment that the letter-complaint fails to state a cause of action against
Cityland as it clearly refers to a dispute with Cityland Wack Wack Royal Mansion Inc., which
has a personality separate and distinct from Cityland. The Arbiter recommended that the
conciliation proceedings be terminated and for Ms. Biscocho to file a formal complaint, but to
date no such complaint has been filed.
5. Petition for Cancellation of Condominium Certificate of Title No. 008-2011001010 of the
Registry of Deeds for Mandaluyong Under Sec. 108 of P.D. No. 1529 – CDC, Petitioner
LRC Case No. MC13-705
Regional Trial Court Mandaluyong City, Branch 208
Date Instituted: November 27, 2013
Cityland filed a Petition to cancel Condominium Certificate of Title No. 008-2011001010 of
the Registry of Deeds for Mandaluyong covering parking slot identified as PL-P012 of
Mandaluyong Executive Mansion III, Brgy. Vergara, Mandaluyong City, on the ground that
the site of the parking slot cannot accommodate a parked vehicle due to fixed obstructions
above. Case is now submitted for decision.
C. City & Land Developers, Incorporated (Subsidiary of CDC)
1. Sta. Ana Village Homeowners’ Assoc. Inc. (SAVHA) vs. City and Land Developers, Inc.
Civil Case No. 12-009
Parañaque Regional Trial Court – Branch 274
Date Instituted: January 16, 2012
SAVHA filed a complaint dated January 16, 2012 which was received by CLDI on March 3,
2012, to enjoin defendant and all persons allowed by said defendant CLDI from using
Benedictine Street in Sta. Ana Village, Barangay Sun Valley, Parañaque City; and to order the
defendant by way of a writ of mandatory injunction to open another outlet to the main road
without cost or liability to plaintiff. CLDI stated in its answer that plaintiff has not proven its
claim over Benedictine Street because the Deed of Donation used by the plaintiff is a falsified
and/or spurious document. Furthermore, there is a Right-of-Way Agreement for Benedictine
Street. Case was dismissed. However, SAVHA filed a Motion for Reconsideration which was
granted. Presentation of evidences is on going.
2. Republic of the Philippines represented by the Department of Public Works and
Highways (DPWH), through the Bureau of Design – Right of Way Office (BOD-ROWO)
versus City and Land Developers, Inc.
Civil Case No. 13-0209
Parañaque Regional Trial Court – Branch 274
Date Instituted: July 16, 2013
DPWH filed a Complaint for Expropriation of certain portions of the properties, including the
improvements therein, of CLDI located in Barangay Tambo, Parañaque City, which will be
part of the NAIA Expressway Project Phase II. CLDI, in its Answer prayed, among others,
that DPWH pay just compensation on the price of P89,700 per square meter for the lots which
is the prevailing market value of the properties in the area. The case is still pending with the
admission of the Amended Complaint of DPWH.
e. Nomination Committee and Nominees for Election as Members of the Board of Directors,
including the Independent Director.
The following have been nominated to the Board of Directors for the ensuing term / year:
Stephen C. Roxas Peter S. Dee (Independent Director)
Andrew I. Liuson Paul Y. Ung (Independent Director)
Grace C. Liuson Alice C. Gohoc
Josef C. Gohoc Helen C. Roxas
An independent director is a person other than an officer or employee of the corporation, its parent
or subsidiaries, or any other individual having a relationship with the corporation which would
interfere with the exercise of independent judgment in carrying out the responsibilities of a
director.

11
The final list of nominees for independent directors as nominated by respective stockholders of
Cityland, Inc. and endorsed by Nomination Committee are the following:
Independent Director Nominating Stockholder
Peter S. Dee Josef C. Gohoc
Paul Y. Ung Grace C. Liuson
The nominating stockholder is not related by consanguinity or affinity up to the fourth civil degree
to the nominated independent director.
There are no disagreements between a director and the Registrant on any matter relating to the
registrant’s operations, policies or practices that resulted to resignation or declination to stand for
re-election to the board of directors of a director.
The Nomination Committee is composed of:
Dr. Jesus U. Go (Chairman) Mr. Peter S. Dee
Mr. Stephen C. Roxas Dr. Andrew I. Liuson
f. Procedures for Nomination and Election of Independent Directors
1. Nomination of independent directors shall be conducted by the Nomination Committee prior
to a stockholders’ meeting. All recommendations shall be signed by the nominating
stockholders together with the acceptance and conformity by the would-be nominees.
The Committee shall pre-screen the qualifications and prepare a final list of all candidates
and put in place screening policies and parameters to enable it to effectively review the
qualifications of the nominees for independent director/s.
After the nomination, the Committee shall prepare a Final List of Candidates which shall
contain all the information about all the nominees for independent directors, as required
under Part IV (A) and (C) of SRC Rule 12, which list, shall be made available to the
Commission and to all stockholders through the filing and distribution of the Information
Statement, in accordance with SRC Rule 20, or in such other reports the company is required
to submit to the Commission. The name of the person or group of persons who
recommended the nomination of the independent directors shall be identified in such report
including any relationship with the nominee.
Only nominees whose names appear on the Final List of Candidates shall be eligible for
election as independent directors. No other nominations shall be entertained after the Final
List of Candidates shall have been prepared. No further nominations shall be entertained or
allowed on the floor during the actual annual stockholders’ meeting.
2. Subject to pertinent existing laws, rules and regulations, the conduct of the election of the
independent director shall be made in accordance with the standard election procedures of
this By-laws.
It shall be the responsibility of the Chairman of the meeting to inform all stockholders in
attendance of the mandatory requirement of electing independent directors. He shall ensure
that independent directors are elected during the stockholders’ meeting.
Specific slot for the independent directors shall not be filled-up by unqualified nominee.
In case of failure of election of independent directors, the Chairman of the meeting shall call a
separate election during the same meeting to fill up the vacancy.
At least forty-five (45) days before the scheduled annual stockholders’ meeting, the
stockholders shall submit their nomination/s to the Corporate Secretary who in turn shall
immediately forward the same to the Chairman of the Nominating Committee for proper
action.

12
g. Related Party Transactions
CDC, CI, CLDI and Cityplans, Incorporated (CPI) (the Group), in their regular conduct of
business, have entered into transactions with associates and related parties principally consisting of
advances, reimbursement of expenses, and purchase and sale of real estate properties. These
transactions to and from related parties are made on an arm’s length basis and at current market
prices at the time of the transaction.
CI also has an existing management contract with CDC, wherein CI provides management services
to CDC. The agreement is for a period of five years renewable automatically for another five
years unless either party notifies the other six months prior to expiration. The management fee is
based on a certain percentage of net income of CDC as mutually agreed upon by both parties. The
management fees for 2014 and 2013 were waived by CI. There are no conditions attached to the
waiver of these management fees.
There are no transactions (or series of similar transactions) with or involving the company or any
of its subsidiaries with a director, executive officer, any nominee for election as a director and any
security holder owning 10% or more of the company’s outstanding share.
VI. Executive Compensation
EXECUTIVE COMPENSATION SUMMARY TABLE
Name Position 2015 (estimate)
Josef C. Gohoc President x
Emma A. Choa Executive Vice
President/Treasurer
x
Eden F. Go Vice President x
Rudy Go Senior Vice President x
Ma. Riza Q. Sta Ana Manager x
Salaries P=5,142,838
Bonus 1,299,135
Others 110,400
Total (Top 5) P=6,552,373
Salaries P=7,346,021
Bonus 1,876,257
Others 312,000
All officers & directors as a group unnamed P=9,534,278
Name Position 2014
(actual)
Josef C. Gohoc President x
Emma A. Choa Executive Vice
President/Treasurer
x
Eden F. Go Vice President x
Melita M. Revuelta Vice President x
Rudy Go Senior Vice President x
Salaries P=4,489,097
Bonus 1,132,463
Others 10,566,685
Total (Top 5) P=16,188,245
Salaries P=6,665,196
Bonus 1,744,174
Others 5,907,171
All officers & directors as a group unnamed P=14,316,541

13
Name Position 2013
(actual)
Josef C. Gohoc President x
Emma A. Choa Executive Vice
President/Treasurer
x
Eden F. Go Vice President x
Melita M. Revuelta Vice President x
Rudy Go Senior Vice President x
Salaries P=4,042,676
Bonus 6,379,781
Others 3,611,181
Total (Top 5) P=14,033,638
Salaries P=5,852,157
Bonus 4,703,760
Others 2,804,690
All officers & directors as a group unnamed P=13,360,607
The Company has no standard arrangements with regards to the remuneration of its directors. In 2014
and 2013, the Board of Directors received a total of P=3,059,704 and P=1,733,800 respectively, including
a total per diem of P=14,400.00 per annum for each director for the board meetings attended, as part of
the compensation under all officers and directors as a group unnamed. Moreover, the Company has no
standard arrangement with regards to the remuneration of its existing officers aside from the
compensation received nor any other arrangement with employment contracts, compensatory plan and
stock warrants or options.
The Board of Directors who received director’s fee and per diem in 2014 and 2013 are:
Stephen C. Roxas Peter S. Dee
Andrew I. Liuson Paul Y. Ung
Grace C. Liuson Alice C. Gohoc
Josef C. Gohoc Helen C. Roxas
Members of the Compensation Committee are:
Peter S. Dee (Chairman)
Stephen C. Roxas
Andrew I. Liuson
VII. Independent Public Accountants
a. SyCip, Gorres, Velayo & Co. (SGV & Co.) is the Registrant's external auditor for the calendar
year 2014. The same accounting firm is being recommended for re-election at the scheduled
annual meeting.
b. Representatives of SGV & Co. are expected to be present at the annual stockholders’ meeting and
respond to appropriate questions. They also have the opportunity to make a statement if they
desire to do so.
c. Pursuant to SRC Rule 68 paragraph (3)(b)(ix) (Rotation of External Auditors), Ms. Aileen L.
Saringan, partner of SGV & Co., was assigned as signing partner for the Company’s financial
statements starting 2010 and shall be rotated after five years of engagement.
OTHER MATTERS
VIII. Action with Respect to Reports
The Minutes of the annual stockholders’ meeting held in June 17, 2014 will be read and submitted to
the stockholders for their approval. Said Minutes state that the following matters were approved by the
stockholders during the 2014 stockholders’ meeting:
1. Reading and approval of the minutes of the previous regular annual stockholders’ meeting.
2. Consideration and approval of the Annual Report and related financial statements for the year
2013.

lx.
14
3. Election of directors4. Appointment of the external auditor5. Confirmation of the Acts of Management and of the Board of Directors6. Other matters which maybe raised before the body
Voting Proredures
a. Vote required for Approval or Election
At least majority of the outstanding capital stock of the Registrant is required for the election ofdirectors and for the approval of the following matters.
1 Minutes of the previous Annual Stockholders' N,{eeting2. Appointmenr of external auditor3. Acts sf the management ancl of the Board of Directors relative to the Annuai report and
related llnancial statements.
b Method by which votes will be counted: plurality olvotes by viva voce
c. The "Ayes" and "Nayes" are requested to raise their hands during the stockholder's meeting wherethey are counted by the Corporate Secretary.
SIGNATURf
After reascnable inquiry and to the best of my knou'ledge and belief, I certify that the informaticn set fortl: inthis report is true, complete and correct. This report is signed in the City of Makati on gii:iig;
,

15
CITYLAND, INC.
THE PRESIDENT’S REPORT
The Philippine economy posted an impressive 6.1% growth rate, ranking the country as the second fastest
growing economy in Asia next to China, which posted a 7.3% growth. The Country’s growth rate showed
remarkable resilience and has rebounded quickly from the challenges brought by natural calamities. The
Country sustained its growth due to strong household consumption, rise in private investments, growth in
public spending and stable inflows from offshore remittances. The improving US and Japan economies and
lower oil prices have provided support for stable inflows.
The property sector on the other hand, is experiencing a period of growth driven by population growth and
the rapid expansion of the business process outsourcing industry. Other positives include, good governance
which improved business sentiments and encouraged local and foreign investors and stable monetary
policies which resulted to low interest and inflation rates. Furthermore, the growing number of tourists and
overseas workers have spurred investments in real estate properties. With the current business environment,
the Company believes that the property market in the Philippines will sustain its current performance.
For this year’s accomplishment, CI has completed the construction of Tagaytay Prime Residences. In
addition, in October 2014, CLDI has launched a new project - North Residences.
Also, to address the increasing demand for business process outsourcing (BPO) offices, CDC leased out a
new BPO hub, Citynet 1.
The Group is pre-selling the following on-going projects:
North Residences
Pines Peak Tower I
Grand Central Residences
The Manila Residences Tower II
Also, the Group is selling the remaining units of the following completed and operational projects:
Manila Residences Bocobo
Grand Emerald Tower
Makati Executive Tower IV
Makati Executive Tower III
Mandaluyong Executive Mansion III
Oxford Mansion (a joint project of CPI and CI)
Windsor Mansion (a joint project of CPI and CI)
The Group has also a number of prime lots reserved for future projects. Its land bank is situated in strategic
locations ideal for horizontal and vertical developments.
Internal sources come from sales of condominiums and real estate projects, collection of installment
receivables, maturing short-term investments and other sources such as rental income, interest income and
dividend income. External sources come from short-term commercial papers.
GENERAL NATURE OF BUSINESS
Brief Company History
Cityland, Inc. (the Parent Company or CI) is a domestic corporation which is duly organized and existing
under and by virtue of the laws of the Philippines since May 15, 1979 with the primary purpose of engaging
in real estate development.
Subsidiaries
The Parent Company has a majority owned subsidiary, namely, Cityland Development Corporation (CDC),
a publicly listed company, and two wholly owned subsidiaries, namely, Credit & Land Holding, Inc.
(CLHI) and Cityads Incorporated (CAI).
CDC has two majority owned subsidiaries, namely, City & Land Developers, Incorporated (CLDI), another
publicly listed company, and Cityplans, Incorporated (CPI). The primary purpose of the Parent Company
16
and its subsidiaries, which are all domiciled in the Philippines, is to acquire, develop, improve, subdivide,
cultivate, lease, sublease, sell, exchange, barter and/or dispose of agricultural, industrial, commercial,
residential and other real properties, as well as to construct, improve, lease, sublease, sell and/or dispose of
houses, buildings and other improvements thereon, and to manage and operate subdivisions and housing
projects or otherwise engage in the financing and trading of real estate. In addition, CPI is engaged in the
business of establishing, organizing, developing, maintaining, conducting, operating, marketing and selling
pension plans. The Group’s registered office and principal place of business is 2nd and 3rd Floors,
Cityland Condominium 10, Tower I, 156 H.V. de la Costa Street, Makati City.
CAI was incorporated on February 20, 1980 for the purpose of engaging in general advertising business. Its
principal office is at 2/F Cityland Condominium 10 Tower 1, 156 H.V. Dela Costa Street, Ayala North,
Makati City.
CLHI was incorporated on July 16, 1980 for the purpose of purchasing, selling or disposing of real and
personal property of any kind including shares of stocks and securities. Its registered office and principal
place of business is at 2/F Cityland Condominium 10 Tower 1, 156 H. V. Dela Costa Street, Ayala North,
Makati City.
Nature of Operation
Cityland, Inc.’s and its subsidiaries’ (the Group) primary purpose is to acquire and develop suitable land
sites for residential, office, commercial, institutional and industrial uses.
Its projects include medium to high-rise office, commercial, and residential condominiums located in
Makati City, Quezon City, Manila City, Mandaluyong City, Pasig City and residential subdivisions in
Tagaytay City, Cavite and Bulacan.
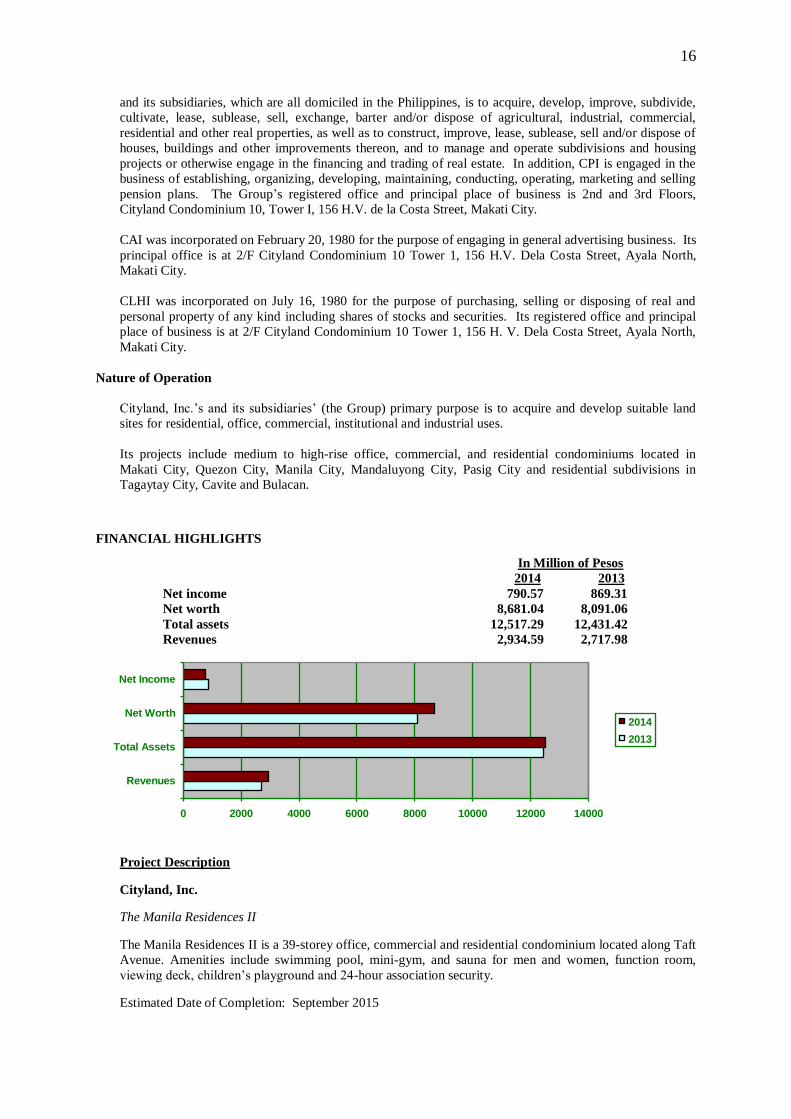
FINANCIAL HIGHLIGHTS
In Million of Pesos
2014 2013
Net income 790.57 869.31
Net worth 8,681.04 8,091.06
Total assets 12,517.29 12,431.42
Revenues 2,934.59 2,717.98
0 2000 4000 6000 8000 10000 12000 14000
Revenues
Total Assets
Net Worth
Net Income
2014
2013
Project Description
Cityland, Inc.
The Manila Residences II
The Manila Residences II is a 39-storey office, commercial and residential condominium located along Taft
Avenue. Amenities include swimming pool, mini-gym, and sauna for men and women, function room,
viewing deck, children’s playground and 24-hour association security.
Estimated Date of Completion: September 2015

17
Tagaytay Prime Residences
Tagaytay Prime Residences is a 21-storey commercial and residential condominium located at Tagaytay
Prime Rotunda, Brgy. San Jose, Tagaytay City. Amenities include common viewing balcony for residential
floors, swimming pool, multi-purpose area, viewing deck with jogging path and a 24-hour association
security.
The Manila Residences I
The Manila Residences is a 39- storey office, commercial and residential condominium located along Taft
Avenue. Amenities include swimming pool, mini-gym, sauna for men and women, function room, viewing
deck, children’s playground and 24-hour association security.
Brentwood Mansion
Brentwood Mansion is an 8-storey commercial and residential condominium located along Evangelista St.,
New Santolan, Pasig City. Amenities and facilities include 2 elevators, administrative office, visitor’s
lounge, provision for cable TV and telephone line, individual water submeter / Meralco meter and 24-hour
association security.
Tagaytay Country Homes 2-B
Tagaytay Country Homes 2-B is a residential subdivision located at Barangay Neogan, Tagaytay City.
Features include multi-purpose hall, swimming pool and 24-hour association security.
Tagaytay Country Homes 2-C
Tagaytay Country Homes 2-C is a residential subdivision located at Barangay Neogan, Tagaytay City.
Features include multi-purpose hall, swimming pool and 24-hour association security.
Tagaytay Country Homes 2-D
Tagaytay Country Homes 2-D is a residential subdivision located at Barangay Neogan, Tagaytay City.
Features include multi-purpose hall, swimming pool and 24-hour association security.
Windsor Mansion
Windsor Mansion is an 8-storey commercial and residential condominium located along Evangelista St.,
New Santolan, Pasig City. Amenities and facilities include 2 elevators, administrative office, visitor’s
lounge, provision for cable TV and telephone line, individual water submeter / Meralco meter and 24-hour
association security. This project is developed together with Cityplans, Inc.
Oxford Mansion
Oxford Mansion, an 8-storey commercial and residential condominium located along Evangelista St., New
Santolan, Pasig City is being developed together with Cityplans, Inc. Amenities and facilities include 2
elevators, administrative office, visitor’s lounge, provision for cable TV and telephone line, individual
water submeter / Meralco meter and 24-hour association security.
Naic Country Homes
Naic Country Homes is a completed residential subdivision located at Baranggay Malaenen, Luma, Cavite.
This subdivision has the following features: main entrance with guardhouse, concrete hollow block
perimeter fence, common shallow walls, concrete roads, Meralco supplied electricity, basketball / tennis
court and lined open canal.

18
Cityland Development Corporation
Pines Peak Tower I
Pines Peak Tower I is a 27-storey residential condominium located at Union corner Pines St., Barangka,
City of Mandaluyong. Its amenities include swimming pool, viewing deck, multi-purpose function room
with movable children play set, gym, and 24-hour association security.
Estimated Date of Completion: March 2016
Grand Central Residences I
Grand Central Residences I is a 40-storey office, commercial and residential condominium located at
EDSA corner Sultan St., (fronting MRT Shaw), Mandaluyong City. It is in close proximity to schools,
churches, malls, and hospitals. It is equipped with swimming pool, multi-purpose function room, gym,
multi-purpose deck, CCTV and 24-hour association security.
Estimated Date of Completion: June 2015
Makati Executive Tower IV
Makati Executive Tower IV is a 29-storey commercial and residential condominium located at Cityland
Square, Sen. Gil Puyat Ave., cor. P. Medina St., Makati City. It is in close proximity to schools, malls,
hypermarkets and hospitals. Its amenities include swimming pool, gym, playground, function room, roof
deck and 24-hour association security.
Mandaluyong Executive Mansion III
Mandaluyong Executive Mansion III is a 7-storey commercial and residential condominium located at G.
Enriquez St., Brgy. Vergara, Mandaluyong City. It is in close proximity to schools, malls, churches and
hospitals. Its amenities include playground, swimming pool, basketball court and 24-hour association
security.
Makati Executive Tower III
Makati Executive Tower III is a 37-storey commercial, office, and residential condominium located at
Cityland Square, Sen. Gil Puyat Avenue, Pio Del Pilar, Makati City. Its amenities include swimming pool,
sauna, viewing deck, jogging area, mini-gym, children’s playground, function room, and 24-hour
association security.
City & Land Developers, Incorporated
North Residences
The 29-storey commercial and residential condominium is located at Edsa (beside WalterMart) corner
Lanutan, Brgy. Veterans Village, Quezon City. It is conceptualized for the practical modern families to
enjoy suburban cityliving that is friendly on the budget.
Estimated Date of Completion: September 2018
Manila Residences Bocobo
Manila Residences Bocobo, a 34-storey commercial, office and residential condominium located along
Jorge Bocobo St., Ermita, Manila City. Its amenities and facilities include swimming pool, children’s play
area, gym, multi-purpose deck, function room and 24-hour association security. It is proximate to schools,
hospitals, restaurants, churches, government offices and other leisure establishments.
Grand Emerald Tower
Grand Emerald Tower, a 39-storey commercial, office and residential condominium located along Emerald
corner Ruby and Garnet Streets, Ortigas Center, Pasig City. Its amenities and facilities include swimming
pool, gymnasium, viewing deck, sauna, children’s playground, multi-purpose function room, and 24-hour

19
association security. It is proximate to schools, hospitals, shopping malls, banks, restaurants, hotels,
churches and other leisure and business establishments.
Pacific Regency
Pacific Regency is a 38-storey commercial, office, and residential condominium located at Pablo Ocampo
Sr. Ave. (formerly Vito Cruz Street) in front of Rizal Memorial Sports Complex in Manila. Amenities and
facilities include swimming pool, gymnasium, separate sauna for male and female, function room,
children’s playground, 24-hour association security, viewing area, and jogging areas at the roof deck.
Cityplans, Incorporated
Oxford Mansion
Oxford Mansion is an 8-storey commercial and residential condominium located along Evangelista St.,
New Santolan, Pasig City. Amenities and facilities include 2 elevators, administrative office, visitor’s
lounge, provision for cable TV and telephone line, individual water submeter / Meralco meter and 24-hour
association security.
Windsor Mansion
Windsor Mansion is an 8-storey commercial and residential condominium located along Evangelista St.,
New Santolan, Pasig City. Amenities and facilities include 2 elevators, administrative office, visitor’s
lounge, provision for cable TV and telephone line, individual water submeter / Meralco meter and 24-hour
association security. This project is developed together with Cityland, Inc.
PROPOSED PROJECTS
CI
Manila Grand Residences
This is a property located at Taft Ave., Malate, Manila, with lot area of more or less than 1,100 sqm.
wherein a 34-storey building will be constructed.
CDC
Pines Peak Tower II
Pines Peak Tower II is a 28-storey residential condominium situated in a 2,267 square meter property
located at Union corner Pines St., Barangka, City of Mandaluyong.
CLDI
One Taft Residences
One Taft Residences is a 40-storey commercial, office, residential condominium situated in a 2,038 square
meter property located along Taft Avenue.

20
MAJOR RISKS INVOLVED IN EACH OF THE BUSINESS OF THE COMPANY
The risks to which the Group is exposed include the internal risks such as refinancing risk, credit risk, interest
rate risk, market risk and liquidity risk; business risks and operational risks; and external ones arising from the
political and economic situation, real estate industry outlook, market competition and asset price bubble.
INTERNAL FACTORS
Refinancing The Group is primarily engaged in real estate development. Risk factor includes short-
term borrowings which increases the possibility of refinancing risks. This debt mix in
favor of short-term borrowings is a strategy which the Group adopted to take
advantage of lower cost of money for short-term loans versus long-term loans.
Because the Group has the flexibility to convert its short-term loans to a long-term
position by drawing down its credit lines with several banks or sell its receivables,
refinancing risk is greatly reduced.
The Group manages such refinancing risks by having a current and acid-test ratio of
2.10:1 and 1.15:1 as of December 31, 2014 from 1.91:1 and 1.02:1 as of December
31, 2013, respectively.
Credit Risk This is defined as the risk that one party to a financial instrument will cause a
financial loss for the other party by failing to discharge an obligation. The financial
instruments which may be the subject of credit risk are the installment contracts
receivables and other financial assets of the Group. The corresponding management
strategies for the aforementioned risks are as follows:
1. The credit risk on the installment contracts receivables may arise from the
buyers who may default on the payment of their amortizations. The Group
manages this risk by dealing only with recognized and credit worthy third
parties. Moreover, it is the Group’s policy to subject customers who buy on
financing to credit verification procedures. Also, receivable balances are
monitored on an on-going basis with the result that the Group’s exposure to bad
debts is insignificant.
2. The credit risk on the financial assets of the Group such as cash and cash
equivalents, short-term cash investments, financial assets at fair value through
profit or loss and available for sale investments may arise from default of the
counterparty. The Group manages such risks in accordance to its policy wherein
the Group shall enter into transactions with a diversity of creditworthy parties to
mitigate any significant concentration of credit risks. As such, there are no
significant concentrations of credit risks in the Group.
Interest Rate
Risk
This is the risk arising from uncertain future interest rates.
The Group’s financial instruments are:
a. The Group’s financial assets mainly consist of installment contract receivables,
cash and cash equivalents and short-term investments. Interest rates on these
assets are fixed at their inception and are therefore not subject to fluctuations in
interest rates.
b. For the financial liabilities, the Group only has short-term commercial papers
(STCP) which bear fixed interest rates. Thus, these are not exposed to
fluctuations in interest rates.
Market Risk This is the risk that the fair value or future cash flows of a financial instrument will
fluctuate because of changes in market prices. Financial instruments which their value
on market factors are subject to market risk.
The available-for-sale investments are exposed to market risk. There is a risk for a
decline in the value due to changes in the market. The exposure, however, is

21
negligible because the amount of the said investment is insignificant as compared to
the financial assets of the Group.
Liquidity Risk
This is the current and prospective risk to earnings or capital from a company’s
inability to meet its obligations when they come due without incurring unacceptable
losses. The Group’s treasury has a well-monitored funding and settlement
management plan. The following is the liquidity risk management framework
maintained by the Group:
a. Asset- Liability Management: Funding sources are substantially from short term
borrowings. Funding sources are abundant and provide a competitive cost
advantage. The Group also holds financial assets for which there is a liquid
market and are, therefore, readily saleable to meet liquidity needs.
b. Conservative/ Liability Structure: Funding is widely diversified. There is little
reliance on wholesale funding services or other credit sensitive fund providers.
The Group accesses funding across a diverse range of markets and counter
parties.
c. Excess Liquidity: The Group maintains considerable excess liquidity to meet a
broad range of potential cash outflows from business needs including financial
obligations.
d. Funding Flexibility: The Group has an objective to maintain a balance between
continuity of funding and flexibility through the use of STCPs. As such, the
Group addresses risk on liquidity by maintaining committed borrowing facilities
in the form of bank lines and established record in accessing these markets.
COMPANY’S BUSINESS AND OPERATIONS
Land Banking The Group’s land banking consists of lots for future development of its condominium
projects and lot/s intended for lease. Having enough and diversified land banking is
important to support the sustainability of the Group’s business. The Group may be
exposed to risks because of the possible changes in the value of these lots due to
market circumstances which may result in impairment or decline in rental rate levels.
The Group currently has prime lots for future development which are located in the
different areas of Metro Manila. The management also is in continuous study and
research on the possible land acquisition which will depend on the needs of the Group
and negotiations with prospective buyers. For the land value changes and decline, the
Company continues to be cautious in its property buying which includes studies of
appraisal and conditions of the property within the vicinity.
Property
development and
construction
Construction of a condominium project starts from the planning and securing of
permits, to the development or construction of the project and to the delivery or
turnover of the units to the buyers. The construction of a project involves an average
period of time to complete the building, usually from three to four years. During this
period of time, the Group may be exposed to the following risks:
delays or longer than expected time of securing necessary licenses, permits
and approvals from different government agencies or neighborhood;
possible rise in the cost of materials and labor which will impact pricing and
cost;
labor disputes among and with the contractors and sub-contractors; and
delay in the delivery of the project.
These risks are managed by the Group as follows:
well-planned and carefully-phased project development with a reasonable
timetable;
concrete sources of financing of the project;
accreditation and careful selection of general contractors and sub-contractors
to ensure fulfillment and quality of work; and
continuous and meticulous management of the Group’s project development
team to ensure that the project is progressing and being accomplished
according to planned.
22
ECONOMIC FACTORS
Economic The Group’s business consists mainly of providing office and housing units in
the Philippines and the results of the operations will be influenced by the general
conditions of the Philippine economy. Any economic instability or failure to
register improved economic performance in the future may adversely affect the
Group’s operations and eventually its financial performance.
Political The Group’s business like all other businesses may be influenced by the political
situation in the country. Any political instability in the future could have a
material adverse effect in the Group’s business.
Industry The industry is characterized by boom-bust cyclical pattern exhibited in the past
couple of decades where the industry normally goes through years of robust
growth following years of slowdown. The industry is still in the boom stage.
Competition
The demand for housing especially in the medium-cost category has moderately
stepped up. The situation has attracted both old and new players to develop
projects that cater to this rising demand. As a result of the foregoing,
competition in the area of medium-cost development is expected to intensify.
The Group believes that it is in a better position to cope with the competition
because of the affordability of the projects it offers in the market.
Asset Price
Bubble
Asset price bubble in real estate occurs when there is an identified rapid
increases in valuations of real property until they reach unsustainable levels and
then decline. Real estate bubbles had existed in the recent past and is still widely
believed to exist in many countries such in United States which had resulted in
the recent subprime mortgage crisis.
In the Philippines, records of low interest rates have raised concerns over
potential asset bubbles. However, the government, through the Finance
Secretary said that this risk is under control (www.cnbc.com). Increased scrutiny
and monitoring of this risk in the country comes after Hong Kong and Singapore
adopted measures to cool property prices (www.bloomberg.com). This asset
price bubble risk is intensely monitored by the government agencies,
Department of Finance and the Philippine Central Bank which are set to
introduce a residential property-price index. This risk will be continuously
mitigated by the appropriate actions and policies of regulators as well as the
banking sector. Also, since the Philippine economy showed a healthy and
sustainable growth, this reduces the risk of asset price bubble.
“According to BSP Deputy Governor, Diwa C. Guinigundo, property price
increases are also supported by strong economic foundations and favorable
market conditions. Comparatively, the Philippines still has the lowest real estate
rates in all of Asia. The country also has not experienced an artificial and
unsustainable peak of property prices. There is a robust demand in housing,
office space, and even hotels, and this demand, according to Guinigundo, is
supported by the lending sector, such as banks and various government
agencies.”(Source:http://www.lamudi.com.ph/journal/8-reasons-philippines-
avoided-real-estate-bubble/)
The Group’s projects belong to the medium-cost category which cater to the
middle income groups. This minimizes the Group’s exposure to asset price
bubbles risk as compared to the high-end players in the real estate industry.
23
The Group manages the above risks by conducting assessments of the economic and political
situations of the country as well as new developments in the industry. The procedures involve the
gathering of information of economic indicators and political events as well as being aware of the
new developments in the industry through media, business conferences, economic briefings and
other sources.
With this information, the Group is able to assess and manage the risks mentioned above.
MANAGEMENT’S DISCUSSION AND ANALYSIS
Financial Condition (2014 vs. 2013)
Total assets of the Group as of December 31, 2014 amounted to P=12.52B, higher than the previous year’s
level of P=12.43B. Increase in assets can be attributed to higher installment contracts receivable, real estate
properties for future development and investment properties. Cash were re-invested in shorter period
placements and were partially channeled to fund real estate projects. Funds were substantially used to
finance the condominium projects that are still under construction, namely, The Manila Residences Tower
II, Grand Central Residences, Pines Peak Tower I and North Residences. The Group also partially settled its
outstanding notes payable, income tax payable and other liabilities, thereby reducing its total liabilities by
11.61%. The healthy cash position cash allowed the purchase of two prime lots, and the launching of a new
condominium project by the subsidiary, CLDI.
Equity stood at P=8.68B as of December 31, 2014 from last year’s P=8.09B due to comprehensive income of
P=790.49M net of cash dividends declared amounting to P=205.71M.
As a result of the foregoing the liquidity position recovered with current ratio and acid ratio recorded at
2.10:1 and 1.15:1 in 2014 as compared to 1.91:1 and 1.02:1 in 2013. The decrease in total liabilities
however strengthened the company’s solvency position with debt-equity ratio improving from 0.56:1 to
0.48:1.
Financial Condition (2013 vs. 2012)
Total assets of the Group as of December 31, 2013 amounted to P=12.43B from P=12.16B, as of the previous
year. The Group’s resources were substantially utilized for condominium development which led to the
progressive increase in construction accomplishment of all the on-going projects and the early completion
of Makati Executive Tower IV, a project of the subsidiary, CDC. It can be noted that all projects of the
subsidiary, CLDI were all completed and almost fully sold, which led to the decrease in its real estate
properties for sale. However, CLDI’s inventory will eventually increase upon the launching of a new
project next year.
On the liabilities side, the healthy cash position allowed the Group to partially settle its notes payable,
accounts payable and accrued expenses and payable to stockholders. In addition, CLDI managed its
development costs prudently which resulted to the reversal of excess estimated development cost reducing
the “Accounts payable and accrued expenses” account. As a result of the foregoing, total liabilities
decreased by 8.61%. Excess funds were shifted from cash and cash equivalents account to short term cash
investments to increase interest income earnings.
Equity stood at P=8.091B as of December 31, 2013 as compared to P=7.41B due to net income of P=869.31M
less cash dividends of P=193.42M.
The Group’s acid-test ratio and current ratio were registered at 1.02:1 and 1.91:1 at the end of the year, as
compared with 2012 at 1.02:1 and1.78:1, respectively. Asset to equity ratio and asset to liability ratio were
computed at 2.47:1 and 2.86:1, as compared with the previous year of 2.66:1 and 2.56:1, respectively.
Financial Condition (2012 vs. 2011)
The Group’s balance sheet remained solid with total assets of P=12.16B in 2012 as compared to the previous
level of P=11.83B. The increase can be attributed to the increase in cash and cash equivalents and real estate
properties for sale and held for future development. Sales of real estate properties, collection of receivables,
issuance of promissory notes and the shift to shorter period placements of cash investments increased cash

24
and cash equivalents account by 46.28%. The healthy cash position enabled the subsidiary company, CDC
to reach a 98.36% completion rate of Makati Executive Tower IV and to launch a new project in 2012.
On the other hand, the subsidiary company, City and Land Developer’s, Inc. has completed Manila
Residences Bocobo and has purchased of a lot, increasing real estate properties for future development by
9.71%. Real estate properties for sale increased due to the high completion rate of all on-going projects. On
the liabilities side, total liabilities decreased by 3.21%, due to payment of accounts payable and accrued
expenses, payables to stockholders and decrease in deferred tax liabilities.
As a result of the foregoing, the group’s liquidity position remained stable with acid-test and current ratio of
1.02:1 and 1.78:1 for 2012, as compared with 2011 of 0.88:1 and 1.59:1, respectively. Asset to liability ratio
and asset to equity ratio were at 2.66:1 and 2.56:1, from previous year of 2.74:1 and 2.41:1, respectively.
Equity stood at P=7.41B, higher by 6.96% as compared with 2011 of P=6.93B.
The increase was due to net income of P=674.38M less cash dividends of P=212.99M.
Results of Operation (2014 vs. 2013)
Revenue from sales of real estate properties increased by 16.09% from P=2.03B in 2013 to P=2.35B in 2014.
Revenue growth was driven by sales and higher completion rate of the condominium projects. The parent
company’s projects, Tagaytay Prime Residences and The Manila Residences Tower II were in full blast
construction. This resulted to the completion of Tagaytay Prime Residences in June 2014, while The
Manila Residences II reached a high completion rate of 86.47%. These two projects made a substantial
revenue contribution accounting for 20.17% and 26.00%, respectively.
On the side of the subsidiary company, CDC, construction activities of Grand Central Residences and Pines
Peak Tower 1, were in full blast, leading to the 83.74% and 66.18% completion rates, respectively. Sales
contribution of Grand Central reached 19.69% and is expected to increase as it nears its completion date on
June 2015. While, Pines Peak Tower I and the completed condominiums, Makati Executive Tower III and
IV were continuously sold and provided stable cash flows, and accounted for 6.25%, 1.19% and 6.08% , of
total revenues on sale of real estate properties, respectively.
In addition, another subsidiary, CLDI sold a prime lot and the remaining units of the two completed
condominium projects, Grand Emerald Tower and Manila Residences Bocobo. With the launching of the
new condominium project, North Residences, sales are expected to increase next year.
Other sources of revenues are financial and rent income. Financial income which is primarily composed of
interest income from real estate properties accounted for 13.69% of total revenues. Decrease in this account
was due to lower level of receivables and lower interest rates. As for leasing operations, it is worthy to note
that the operations of the newly completed building Citynet 1 started in February 2014 which resulted to the
increase in rental income by 143.54%.
On the cost side, cost of real estate sales increased due to the sale of a prime lot, while operating expenses
decreased due to lower personnel expenses and professional fees. Lower interest rates and partial
settlement of notes and contracts payable eased interest payments resulting to the reduction of financial
expenses by 52.09%.
As a result of the foregoing, financial performance for the year resulted to a net income of P=790.57M from
the previous year’s P= 869.31M. This translated to an earnings per share and return on equity of
P=9.12 and 10.48% in 2014 as compared with P=9.34 and 11.64% in 2013.
Results of Operation (2013 vs. 2012)
Revenue from sales reached P=2.027B, higher over last year’s figure of P=1.905B. Although sales of the
subsidiary, CLDI decreased due to low inventory, sales and the high accomplishment rates of the parent
company and another subsidiary, CDC pushed total revenue on sales to increase. Cityland, Incorporated’s
on-going projects, Tagaytay Prime Residences and The Manila Residences II were in full blast construction
which resulted to a completion rate of 91.57% and 68.49% from 64.95% and 28.16%, respectively. On the
other hand, CDC’s Makati Executive Tower IV and Grand Central Residences were also in full blast
construction which led to their 100.00% and 60.11% completion from the previous years’ 98.36% and
29.25%, respectively. Pines Peak Tower I, the newest project of CDC, contributed modestly to total sales
as it reached a 24.88% completion in 2013. Meantime, the remaining units of the other completed projects
of the group like Grand Emerald Tower, Manila Residences Bocobo, Makati Executive Tower III,

25
Mandaluyong Executive Mansion III, The Manila Residences and Brentwood Mansion were continuously
sold and generated stable cash flows.
Other sources of revenues are financial income and rent income. Financial income is primarily composed
of interest income from sale of real estate properties accounting for 18.16% of total revenues. With respect
to lease operations, rent income for the year increased due to increase in units available for lease. Income
from lease operations is expected to increase next year due to the launching of CDC’s new BPO hub
(business process outsourcing office) in the fourth quarter of the year. Increase in other revenue was due to
the adjustment of excess estimated development cost over actual cost of a completed project of CLDI.
On the cost side, the Company was successful in managing costs resulting to decrease in cost estimate of a
project resulting to the decrease in cost of sales. On the other hand, higher sales increased operating
expenses and provision for income tax as this move in tandem with sales. In addition, accrual adjustments
were made to professional fees and personnel expenses. On the other hand, financial expenses dropped to
P=38.27M from P=82.89M, due to partial settlement of notes and contracts payable and due to lower interest
rates.
Altogether, net income after tax stood at P=869.31M as compared to the previous year of P=672.75M and
translated to earnings per share and return on equity of P=9.34 and 11.64% as compared with last years’
P=6.35 and 8.71%.
Results of Operation (2012 vs. 2011)
The Company posted a consolidated net income of P=672.75M from the previous year’s P=729.39M. Total
revenues reached P=2.580B from P=2.715B. The decrease can be attributed to lower inventory level of the
subsidiary, CLDI, since the two projects, Grand Emerald Tower and Manila Residences Bocobo were sold
at 86.50% and 72.52% at the beginning of the year. Nevertheless, sales of the remaining inventory resulted
to a sell out rate of Grand Emerald Tower and Manila Residences Bocobo at 95.22% and 90.85%,
respectively.
On the other hand, the parent company’s sales increased by 16.48%, due to increase in sales and percentage
of completion of its projects. The parent company’s completed project, The Manila Residences I
contributed 5.16% to annual sales and reach a 96.67% sell-out rate. While the other two projects which are
in full blast construction, The Manila Residences II and Tagaytay Prime Residences contributed a
significant 7.23% and 7.89%, to annual sales and reached a 28.16% and 64.95% rate of completion,
respectively.
Meantime, the completed projects of another subsidiary, CDC, Makati Executive Tower III and
Mandaluyong Executive Mansion III reached a sell out rate of 91.47% and 92.45%, respectively. Moreover,
its project Makati Executive Tower IV which was completed in 2013, was sold at 47.37%. Grand Central
Residences and Pines Peak Tower I are the two projects of CDC which are still at the initial stages of
construction.
On the cost side, lower revenues decreased cost of real estate sales. Operating expenses likewise decrease
due to lower donations and contributions, professional fees, taxes and licenses and insurance expenses.
Interest expense remained manageable at P=82.89M as compared to the previous year of P=105.46M.
Altogether, net income after tax stood at P=672.75M as compared to the previous year of P=729.39M and
translated to earnings per share and return on equity of P=6.35 and 8.71% as compared with last years’ P=8.48
and 9.86%.

26
Financial Ratios (2014 vs 2013 vs 2012)
Cityland, Inc. (Consolidated) 2014 2013 2012
Earnings per share P=9.12 P=9.34 P=6.35
Return on equity 10.48% 11.64% 8.71%
Solvency ratio 0.22 0.20 0.15
Interest rate coverage ratio 63.46 30.76 11.42
Asset to liability ratio 3.26 2.86 2.56
Asset to equity ratio 2.29 2.47 2.66
Debt – equity ratio 0.48 0.56 0.66
Current ratio 2.10 1.91 1.78
Acid – test ratio 1.15 1.02 1.02
Cityland Development Corporation (Consolidated)
Earnings per share P=0.10 P=0.12 P=0.11
Return on equity 6.69% 8.05% 8.14%
Solvency ratio 0.24 0.26 0.20
Interest rate coverage ratio 96.09 27.73 15.59
Asset to liability ratio 4.43 3.97 3.11
Asset to equity ratio 1.50 1.56 1.72
Debt – equity ratio 0.24 0.28 0.37
Current ratio 2.85 2.48 2.22
Acid – test ratio 1.74 1.68 1.52
City & Land Developers, Incorporated (Subsidiary)
Earnings per share P=0.09 P=0.18 P=0.24
Return on equity 5.44% 11.26% 16.02%
Solvency ratio 0.33 0.51 0.44
Interest rate coverage ratio 133.57 51.39 30.22
Asset to liability ratio 7.12 5.54 3.72
Asset to equity ratio 1.16 1.22 1.37
Debt – equity ratio 0.09 0.12 0.16
Current ratio 4.80 3.34 2.76
Acid – test ratio 3.64 3.07 2.32
Cityplans, Incorporated (Subsidiary)
Earnings per share P=0.01 P=0.02 P=0.06
Return on equity 0.60% 0.81% 2.60%
Solvency ratio 0.04 0.05 0.14
Asset to liability ratio 4.94 5.16 5.86
Asset to equity ratio 1.31 1.31 1.28
Current ratio 8.31 12.73 15.13
Acid – test ratio 7.24 11.46 14.15
Manner of Calculations:
Earnings per share = Net income after tax
Outstanding number of shares
Return on equity ratio = Net income after tax
Total Equity
Solvency ratio = Net income after tax + Depreciation expense
Total liabilities
Interest rate coverage ratio =
Income before income tax + Depreciation expense +
Interest expense
Interest expense
Asset-to-liability ratio = Total assets / Total liabilities
Asset-to-equity ratio = Total assets
Total equity (net of net changes in fair value of available-for-sale
financial assets and accumulated re-measurement on defined
benefit plan)
Debt-to-equity ratio = Notes and contracts payable
Total equity (net of net changes in fair value of available-for-sale
financial assets and accumulated re-measurement on defined
benefit plan)
Current ratio
=
Total current assets / Total current liabilities
Acid-test ratio
=
Cash and cash equivalents + Short-term cash investments +
Current portion of installment contracts receivable +
Current portion of other receivables
Total current liabilities
27
1. Any Known Trends, Events or Uncertainties (material impact on liquidity)
There has been no trends, events or uncertainties that has material impact on liquidity.
2. Internal and External Sources of Liquidity
Internal sources come from sales of condominiums and real estate projects, collection of installment
receivables, maturing short-term investments and other sources such as rental income, interest income and
dividend income. External sources come from commercial papers and promissory notes.
3. Any Material Commitments for Capital Expenditures and Expected Sources of Funds of such
Expenditures
The estimated development cost of P=470.50 million as of December 31, 2014 representing the cost to
complete the development of real estate projects sold and the contract payable amounting to P=119.27
million representing the liabilities from the contracts to purchase land held to future development will be
sourced through:
a) Sales of condominium and real estate projects
b) Collection of installment receivables
c) Maturing short-term investments
d) Issuance of commercial papers and promissory notes
e) Availment of bank lines
4. Any Known Trend or Events or Uncertainties (Material Impact on Net Sales or Revenues or Income)
There had been no trends, events or uncertainties that had material impact on net sales or revenues or
income.
5. Any Significant Elements of Income or Loss that did not arise from registrants continuing operations.
There was no significant elements of income or loss that did not arise from continuing operations.
6. Any Event that Will Trigger Direct or Contingent Financial Obligation that is Material to Company
There is no event that will trigger direct or contingent financial obligation that is material to the Company,
including any default or acceleration of an obligation.
7. Causes for any Material Changes from Period to Period in One or More Line of the Registrant's
Financial Statements
Financial Condition
a. Increase in Cash and Cash Equivalents was due to collection and shift of funds to shorter-term
investments.
b. Decrease in Short- Term Cash Investments was due to transfer of placements to shorter term
investments and cash usage to fund real estate projects.
c. Increase in Installment Contracts Receivable was due to sales.
d. Increase in Other Receivables was due to rent receivable arising from lease of BPO building.
e. Decrease in Real Estate Properties for Sale was due to sale.
f. Decrease in Investment in Trust Funds was due to maturity of plans.
g. Increase in Other Assets was due to collections on the sale of North Residences deposited in escrow
account and input VAT which arose from purchase of a lot.
h. Increase in Real Estate Properties Held for Future Development was due to purchase of prime lot by
CDC and CLDI.
i. Increase in Investment Properties was due to additional development costs.
j. Decrease in Property and Equipment was due to depreciation and asset disposal.
k. Decrease in Accounts Payable and Accrued Expenses was due to payment.
l. Decrease in Notes and Contracts Payable was due to partial payment of notes payable.
m. Decrease in Income Tax Payable was due to lower taxable income.
n. Increase in Pre-need and Other Reserves was due to decrease of return on investment of trust fund.

28
o. Decrease in Deferred Income Tax Liabilities - net was due to lower deferred income tax assets on
accrued expenses and realization of gain on real estate transactions.
p. Increase in Capital Stock was due to declaration and issuance of 25% stock dividends.
q. Increase in Stock Dividends Distributable was due to 30% stock dividends declared at the end of 2014.
r. Increase in Retained Earnings was due to net income.
s. Increase in Net Changes in fair value of AFS Investment was due to increase in value of available for
sale financial assets.
t. Decrease in Accumulated re-measurement on defined benefit plan was due to decrease in value of
retirement plan asset.
u. Increase in Non-Controlling Interests was due to net income of subsidiary.
Results of Operation
a. Increase in Sales of Real Estate Properties for Sale was due to sales and high construction
accomplishment of condominium projects.
b. Decrease in Financial Income was due to decrease in interest income from real estate properties as a
result of lower level of installment contracts receivables from real estate properties. In addition,
decrease was also due to lower interest income from cash equivalents and short-term cash investments
due to lower interest rates.
c. Increase in Rent Income was due to rental income from the new BPO building.
d. Decrease in Other Income was due to the adjustment of the excess of estimated development cost of a
completed project of CLDI in 2013.
e. Increase in Cost of Real Estate Sales was due to sales.
f. Decrease in Operating Expenses was due to lower personnel expenses, professional fees, membership
dues and other operating expenses.
g. Decrease in Financial Expenses was due to lower notes and contracts payable balances and lower
interest rates.
h. Increase in Other Expenses was due to higher reversal of realized gross profit due to adjustment of cost
of real estate properties due to forfeiture/cancellation of prior years’ sales.
i. Increase in Provision for Income Tax was due to lower deferred income tax liabilities.
j. Decrease in Net Income was due to lower financial and other income.
8. Information On Independent Accountant
External Audit Fee
2014 2013
Audit and Audit-Related Fees 470,000 450,000
Tax Fees – –
All Other Fees – –
Total 470,000 450,000
The members of the Audit Committee are:
Peter S. Dee (Chairman) Alice C. Gohoc
Grace C. Liuson
The Audit Committee’s approval policies and procedures consist of:
a. Discussion with the external auditors of the Audited Financial Statements.
b. Recommendation to the Board of Directors for the approval and release of the Audited Financial
Statements.

29
DIVIDENDS AND MARKET PRICE OF SHARES OF STOCK
1. Dividends Policy
Dividends declared by the Group on its shares of stocks are payable in cash or in additional shares of stock.
The payment of dividends in the future will depend upon the earnings, cash flow, and financial condition of
the Group and other factors.
Dividends declared on shares of stock are payable in cash or in additional shares of stock. Future dividend
payments, if any, will depend on the earnings, cash flow and financial condition of the Corporation and
other factors.
The Corporation Code prohibits stock corporations from retaining surplus profits in excess of 100% of their
paid-in capital stock, except when justified by definite corporate expansion projects or programs approved
by the Board of Directors, or when the corporation is prohibited under any loan agreement with any
financial institution or creditor from declaring dividends without its consent, and such consent has not yet
been secured, or when it can be clearly shown that such retention is necessary under special circumstances
obtaining in the corporation.
2. Dividends
The Parent Company declared dividends as follows:
2014 2013
Cash P=2.84 / share P=2.56 / share
Stock 55% –
Cash dividends on common shares were deducted from retained earnings upon declaration by the BOD. All
cash dividends due during the year were paid.
The Company declared 55% stock dividends in 2014. 25% of the total stock dividends declared were
distributed during the year while the remaining 30% is recorded under “Stock dividends distributable”
account and distributed to stockholders in January 2015. Stock dividends on common shares are measured
based on the total par value of declared stock dividend. Stock dividends are deducted from retained
earnings when the BOD’s declaration is ratified by the stockholders of the Company. Unissued stock
dividend are recorded as stock dividends distributable and credited to capital stock upon issuance.
Dividends for the year that are declared after the end of the reporting period but before the approval for
issuance of financial statements are dealt with as an event after the reporting period.
3. Trading Market
The Company is not a public corporation and is not listed with the Philippine Stocks Exchange.
4. Holders
a. The number of shareholders of record as of April 30, 2015 is 18.
b. Top Stockholders as of April 30, 2015:
Name No. of Shares Held %
1. Stephen C. Roxas 22,881,241 28.16
2. Grace C. Liuson 11,947,588 14.70
3. Andrew I. Liuson 11,028,565 13.57
4. Helen C. Roxas 7,352,373 9.05
5. Lucy Fan 7,352,373 9.05
6. Daniel Chiong Yen 7,352,373 9.05
7. The Good Seed Sower Foundation Inc. 7,352,352 9.05
8. Alice C. Gohoc 5,865,662 7.23
9. Lincoln C. Roxas 47,457 0.06
10. Jefferson C. Roxas 47,457 0.06
11. Aurora M. Pattugalan 14,697 0.02
12. Josef C. Gohoc 3,888 –
13. Joel C. Gohoc 3,082 –

30
14. Joanna C. Gohoc 3,081 –
15. Johann C. Gohoc 3,081 –
16. Josua C. Gohoc 3,081 –
17. Peter S. Dee 29 –
18. Paul Y. Ung 26 –
CHANGES IN AND DISAGREEMENTS WITH ACCOUNTANTS ON ACCOUNTING AND
FINANCIAL DISCLOSURE
There are no changes in and disagreements with the accountants on accounting and financial disclosure.
COMPLIANCE WITH LEADING PRACTICES ON CORPORATE GOVERNANCE
The evaluation system employed by the Corporation is thru a periodic self-rating system based on the criteria on
the leading practices and principles on good governance.
1. Measures being undertaken by the Company to fully comply with the adopted leading practices on good
corporate governance
We are implementing the periodic self-rating system on an annual basis.
2. Any Deviation from the Company’s Manual of Corporate Governance. (including a disclosure of the name
and position of the persons involved and sanctions imposed on said individual)
There were no major deviations that require sanctions.
3. Any plan to improve corporate governance of the company
Based on the outcome of the periodic self-rating, we will come up with necessary actions / procedures to
improve the corporate governance of the Company.
ACKNOWLEDGEMENT
In behalf of the Board of Directors, Consultants and Management of Cityland, I would like to express our
appreciation to all our stockholders for your trust and confidence.
May I also acknowledge the time and expertise shared to us by our consultants and directors and the
commitment and hard work of our managers and staff in the attainment of our corporate goals.
With God’s grace, we look forward to a better year in 2015 for Cityland and the real estate industry.
Upon written request, the Company undertakes to provide without charge a copy of the Annual Report
on SEC Form 17-A. Copies can be picked up from Ms. Michelle Marcelino, 2nd Floor, Cityland
Condominium 10 Tower 1, 156 H.V. Dela Costa Street, Makati City, Tel. 893-6060 local 152.

Cityland, Inc. and Subsidiaries
Consolidated Financial StatementsDecember 31, 2014 and 2013and Years Ended December 31, 2014, 2013 and 2012
and
Independent Auditors’ Report


*SGVFS008694*
INDEPENDENT AUDITORS’ REPORT
The Stockholders and the Board of DirectorsCityland, Inc.
We have audited the accompanying consolidated financial statements of Cityland, Inc. and itssubsidiaries, which comprise the consolidated balance sheets as at December 31, 2014 and 2013, andthe consolidated statements of income, consolidated statements of comprehensive income,consolidated statements of changes in equity and consolidated statements of cash flows for each of thethree years in the period ended December 31, 2014, and a summary of significant accounting policiesand other explanatory information.
Management’s Responsibility for the Consolidated Financial Statements
Management is responsible for the preparation and fair presentation of these consolidated financialstatements in accordance with Philippine Financial Reporting Standards, and for such internal controlas management determines is necessary to enable the preparation of consolidated financial statementsthat are free from material misstatement, whether due to fraud or error.
Auditors’ Responsibility
Our responsibility is to express an opinion on these consolidated financial statements based on ouraudits. We conducted our audits in accordance with Philippine Standards on Auditing. Thosestandards require that we comply with ethical requirements and plan and perform the audit to obtainreasonable assurance about whether the consolidated financial statements are free from materialmisstatement.
An audit involves performing procedures to obtain audit evidence about the amounts and disclosuresin the consolidated financial statements. The procedures selected depend on the auditor’s judgment,including the assessment of the risks of material misstatement of the consolidated financial statements,whether due to fraud or error. In making those risk assessments, the auditor considers internal controlrelevant to the entity’s preparation and fair presentation of the consolidated financial statements inorder to design audit procedures that are appropriate in the circumstances, but not for the purpose ofexpressing an opinion on the effectiveness of the entity’s internal control. An audit also includesevaluating the appropriateness of accounting policies used and the reasonableness of accountingestimates made by management, as well as evaluating the overall presentation of the consolidatedfinancial statements.
We believe that the audit evidence we have obtained is sufficient and appropriate to provide a basis forour audit opinion.
SyCip Gorres Velayo & Co.6760 Ayala Avenue1226 Makati CityPhilippines
Tel: (632) 891 0307Fax: (632) 819 0872ey.com/ph
BOA/PRC Reg. No. 0001, December 28, 2012, valid until December 31, 2015SEC Accreditation No. 0012-FR-3 (Group A), November 15, 2012, valid until November 16, 2015
A member firm of Ernst & Young Global Limited

*SGVFS008694*
- 2 -
Opinion
In our opinion, the consolidated financial statements present fairly, in all material respects, thefinancial position of Cityland, Inc. and its subsidiaries as at December 31, 2014 and 2013, and theirfinancial performance and their cash flows for each of the three years in the period endedDecember 31, 2014 in accordance with Philippine Financial Reporting Standards.
SYCIP GORRES VELAYO & CO.
Aileen L. SaringanPartnerCPA Certificate No. 72557SEC Accreditation No. 0096-AR-3 (Group A), January 18, 2013, valid until January 17, 2016Tax Identification No. 102-089-397BIR Accreditation No. 08-001998-58-2015, February 27, 2015, valid until February 26, 2018PTR No. 4751323, January 5, 2015, Makati City
March 18, 2015
A member firm of Ernst & Young Global Limited

*SGVFS008697*
CITYLAND, INC. AND SUBSIDIARIESCONSOLIDATED BALANCE SHEETS
December 312014 2013
ASSETS
Current AssetsCash and cash equivalents (Note 4) P=1,368,680,262 P=835,315,078Short-term cash investments (Note 4) 1,461,213,555 2,265,607,000Current portion of installment contracts receivable (Note 6) 651,003,124 446,368,210Current portion of other receivables (Note 7) 68,978,338 57,398,694Real estate properties for sale (Note 8) 2,875,006,497 3,121,463,065Current portion of investments in trust fund (Note 5) 1,686,723 2,061,040Other current assets (Note 12) 46,274,446 3,459,595Total Current Assets 6,472,842,945 6,731,672,682
Noncurrent AssetsInstallment contracts receivable – net of current portion (Note 6) 1,538,977,367 1,632,754,978Other receivables - net of current portion (Note 7) 10,861,948 11,999,398Investments in trust fund – net of current portion (Note 5) 36,418,627 34,451,443Real estate properties held for future development (Note 9) 1,385,749,817 1,250,014,900Investment properties (Note 10) 2,940,483,006 2,688,714,392Property and equipment (Note 11) 18,335,844 26,667,097Retirement plan assets (Note 23) 11,976,663 9,971,234Other noncurrent assets (Note 12) 101,640,479 45,177,136Total Noncurrent Assets 6,044,443,751 5,699,750,578
TOTAL ASSETS P=12,517,286,696 P=12,431,423,260
LIABILITIES AND EQUITY
Current LiabilitiesCurrent portion of accounts payable and
accrued expenses (Note 13) P=397,639,237 P=545,841,587Notes and contracts payable (Note 14) 2,636,072,386 2,804,472,361Income tax payable 51,925,429 174,379,763Current portion of pre-need and other reserves (Note 5) 1,686,723 2,061,040Total Current Liabilities 3,087,323,775 3,526,754,751
Noncurrent LiabilitiesAccounts payable and accrued expenses - net of current portion
(Note 13) 138,077,066 166,917,840Pre-need and other reserves – net of current portion (Note 5) 53,318,856 50,564,361Deferred income tax liabilities – net (Note 24) 557,522,668 596,125,130Total Noncurrent Liabilities 748,918,590 813,607,331
TOTAL LIABILITIES 3,836,242,365 4,340,362,082
(Forward)

-2-
*SGVFS008697*
December 312014 2013
EquityAttributable to Equity Holders of the Parent Company Capital stock - P=10 par value (Note 15)
Authorized - 100,000,000 shares in 2014 and53,000,000 shares in 2013
Issued - 62,506,473 shares in 2014 held by 18 equity holders, 50,005,183 shares in 2013 held by 18 equity holders P=625,064,730 P=500,051,830
Stock dividends distributable (Note 15) 187,519,330 –Appropriated retained earnings (Note 15) 200,000,000 200,000,000Unappropriated retained earnings (Note 15) 4,449,958,263 4,331,522,542Net changes in fair values of available-for-
sale financial assets (Note 12) 1,800,356 1,529,813Accumulated re-measurement on defined
benefit plan (21,303,519) (18,985,227)5,443,039,160 5,014,118,958
Non-controlling Interests (Note 16) 3,238,005,171 3,076,942,220Total Equity 8,681,044,331 8,091,061,178TOTAL LIABILITIES AND EQUITY P=12,517,286,696 P=12,431,423,260
See accompanying Notes to Consolidated Financial Statements.

*SGVFS008697*
CITYLAND, INC. AND SUBSIDIARIESCONSOLIDATED STATEMENTS OF INCOME
Years Ended December 312014 2013 2012
REVENUESales of real estate properties P=2,353,143,758 P=2,026,969,356 P=1,905,013,492Financial income (Note 20) 401,743,777 493,703,818 611,654,256Rent income (Note 10) 93,881,272 38,549,278 33,866,718Other income (Note 22) 85,822,438 158,755,588 29,873,403
2,934,591,245 2,717,978,040 2,580,407,869
EXPENSESCost of real estate sales (Note 8) 1,358,934,761 1,038,202,266 1,146,719,174Operating expenses (Note 17) 509,661,760 541,451,626 491,190,121Financial expenses (Note 21) 18,335,946 38,271,772 82,890,845Other expenses (Note 22) 41,161,300 30,165,200 35,237,039
1,928,093,767 1,648,090,864 1,756,037,179
INCOME BEFORE INCOME TAX 1,006,497,478 1,069,887,176 824,370,690
PROVISION FOR INCOME TAX (Note 24) 215,927,821 200,578,526 149,992,675
NET INCOME P=790,569,657 P=869,308,650 P=674,378,015
Attributable to:Equity holders of the parent P=570,361,026 P=583,502,525 P=397,116,645Non-controlling interests (Note 16) 220,208,631 285,806,125 277,261,370
P=790,569,657 P=869,308,650 P=674,378,015
BASIC/DILUTED EARNINGS PERSHARE (Note 28) P=9.12 P=9.34 P=6.35
See accompanying Notes to Consolidated Financial Statements.

*SGVFS008697*
CITYLAND, INC. AND SUBSIDIARIESCONSOLIDATED STATEMENTS OF COMPREHENSIVE INCOME
Years Ended December 312014 2013 2012
NET INCOME P=790,569,657 P=869,308,650 P=674,378,015
OTHER COMPREHENSIVE INCOME (LOSS)To be reclassified to profit or loss in subsequent periods: Changes in fair value of available-for sale financial assets (Note 12) 402,973 (120,341) 1,982,990Not to be reclassified to profit or loss in subsequent periods:
Re-measurement gain (loss) on defined benefit obligation (Note 23) (688,510) (8,138,104) 17,866,935
Income tax effect 206,553 2,441,431 (5,360,081)(78,984) (5,817,014) 14,489,844
TOTAL COMPREHENSIVE INCOME P=790,490,673 P=863,491,636 P=688,867,859
Attributable to:Equity holders of the parent P=568,313,277 P=579,123,961 P=405,230,011Non-controlling interests (Note 16) 222,177,396 284,367,675 283,637,848
P=790,490,673 P=863,491,636 P=688,867,859
See accompanying Notes to Consolidated Financial Statements.

*SGVFS008696*
CITYLAND, INC. AND SUBSIDIARIESCONSOLIDATED STATEMENTS OF CHANGES IN EQUITYFOR THE YEARS ENDED DECEMBER 31, 2014, 2013 AND 2012
Net Changes in AccumulatedStock Dividend Available-for-sale Re-measurement on
Capital Stock Distributable Retained Earnings (Note 15) Financial Assets Defined Benefit Non-controlling(Note 15) (Note 15) Appropriated Unappropriated (Note 12) Plan Total Interests Total
BALANCES AT DECEMBER 31, 2011 P=416,709,930 P=– P=200,000,000 P=3,703,120,224 P=816,623 (P=22,006,839) P=4,298,639,938 P=2,628,507,363 P=6,927,147,301Net income – – – 397,116,645 – – 397,116,645 277,261,370 674,378,015Other comprehensive income – – – – 1,239,964 6,873,402 8,113,366 6,376,478 14,489,844Transfer of deferred tax liability on deemed cost
adjustment of properties realized through sale – – – 6,825,482 – – 6,825,482 6,488,350 13,313,832Parent Company shares of stock held by CPI – – – – – – 1,233,179 1,233,179Additional shares purchased by CI to CDC – – – – – – – (419,393) (419,393)Appropriation – CPI – – – (4,065,402) – – (4,065,402) (3,997,672) (8,063,074)Stock dividends - 20% 83,341,900 – – (83,341,900) – – – – –Fractional shares – – – (86) – – (86) – (86)Cash dividends - P=3.59 per share – – – (149,598,865) – – (149,598,865) – (149,598,865)Cash dividends declared by subsidiaries – – – – – – – (63,390,826) (63,390,826)BALANCES AT DECEMBER 31, 2012 500,051,830 – 200,000,000 3,870,056,098 2,056,587 (15,133,437) 4,557,031,078 2,852,058,849 7,409,089,927Net income – – – 583,502,525 – – 583,502,525 285,806,125 869,308,650Other comprehensive income – – – – (526,774) (3,851,790) (4,378,564) (1,438,450) (5,817,014)Transfer of deferred tax liability on deemed cost
adjustment of property and equipment absorbedthrough depreciation – – – 1,447,821 – – 1,447,821 1,423,698 2,871,519
Transfer of deferred tax liability on deemed costadjustment of properties realized through sale – – – 4,529,367 – – 4,529,367 4,453,908 8,983,275
Parent Company shares of stock held by CPI – – – – – – – 42,148 42,148Cash dividends - P=2.56 per share – – – (128,013,269) – – (128,013,269) – (128,013,269)Cash dividends declared by subsidiaries – – – – – – – (65,404,058) (65,404,058)BALANCES AT DECEMBER 31, 2013 P=500,051,830 P=– P=200,000,000 P=4,331,522,542 P=1,529,813 (P=18,985,227) P=5,014,118,958 P=3,076,942,220 P=8,091,061,178
(Forward)

-2-
*SGVFS008696*
Net Changes in AccumulatedStock Dividend Available-for-sale Re-measurement on
Capital Stock Distributable Retained Earnings (Note 15) Financial Assets Defined Benefit Non-controlling(Note 15) (Note 15) Appropriated Unappropriated (Note 12) Plan Total Interests Total
BALANCES AT DECEMBER 31, 2013 P=500,051,830 P=– P=200,000,000 P=4,331,522,542 P=1,529,813 (P=18,985,227) P=5,014,118,958 P=3,076,942,220 P=8,091,061,178Net income – – – 570,361,026 – – 570,361,026 220,208,631 790,569,657Other comprehensive income – – – – 270,543 (2,318,292) (2,047,749) 1,968,765 (78,984)Transfer of deferred tax liability on deemed cost
adjustment of property and equipment absorbedthrough depreciation – – – 1,357,707 – – 1,357,707 1,335,088 2,692,795
Transfer of deferred tax liability on deemed costadjustment of properties realized through sale – – – 1,264,175 – – 1,264,175 1,243,113 2,507,288
Stock dividends – 25% 125,012,900 – – (125,012,900) – – – – –Cash dividends - P=2.84 per share – – – (142,014,720) – – (142,014,720) – (142,014,720)Stock dividends – 30% – 187,519,330 – (187,519,419) – – (89) – (89)Fractional shares of stock dividends – – – (148) – – (148) – (148)Cash dividends declared by subsidiaries – – – – – – – (63,692,646) (63,692,646)BALANCES AT DECEMBER 31, 2014 P=625,064,730 P=187,519,330 P=200,000,000 P=4,449,958,263 P=1,800,356 (P=21,303,519) P=5,443,039,160 P=3,238,005,171 P=8,681,044,331See accompanying Notes to Consolidated Financial Statements.
*SGVFS008696*
CITYLAND, INC. AND SUBSIDIARIESCONSOLIDATED STATEMENTS OF CASH FLOWS
Years Ended December 312014 2013 2012
CASH FLOWS FROM OPERATING ACTIVITIESIncome before income tax P=1,006,497,478 P=1,069,887,176 P=824,370,690Adjustments for:
Interest income (Note 20) (401,700,168) (493,644,045) (611,602,414)Depreciation (Notes 17 and 19) 40,844,170 16,930,715 20,159,259Interest expense - net of amounts capitalized
(Note 21) 16,769,421 36,516,951 81,035,434Retirement benefits costs (Note 23) 2,526,250 2,426,773 7,498,633Unrealized re-measurement gains in investment
property (1,864,020) – –Trust fund income (Note 22) (1,532,158) (1,780,146) (2,582,951)Decrease in pre-need and other reserves
(Note 5) 1,075,365 5,338,025 (5,318,839)Dividend income (Note 20) (43,609) (59,773) (51,842)Gain on sale of available-for-sale financial assets – (764,576) –Donation of real estate property – – 30,611,833Loss on demolition of investment properties – – 1,393,971
Operating income before working capital changes 662,572,729 634,851,100 345,513,774Decrease (increase) in:
Installment contracts receivable (110,857,303) 156,311,215 353,385,352Other receivables (13,939,474) 342,098 (3,176,075)Real estate properties for sale 386,450,592 (366,664,656) (81,059,458)Real estate properties held for future development (280,344,305) (27,560,538) (108,937,011)Other current assets (97,440,429) (8,687,914) 1,508,709
Decrease in accounts payable and accrued expenses (175,969,961) (57,868,077) (142,443,491)Net cash generated from operations 370,471,849 330,723,228 364,791,800Interest received 405,197,448 492,539,862 612,699,976Income taxes paid, including creditable and
final withholding taxes (371,577,981) (201,275,964) (159,880,122)Contribution to plan assets (Note 23) (5,220,189) (3,868,815) (3,868,815)Net cash flows from operating activities 398,871,127 618,118,311 813,742,839
CASH FLOWS FROM INVESTING ACTIVITIESProceeds from:
Matured (purchase of) short-term cash investments (Note 4) 804,393,445 (1,954,235,000) 400,060,000
Demolition of investment properties – – 2,812,899Disposal of property and equipment – 1,068,572 –Sale of available-for-sale financial assets
(Note 12) – 786,942 –Additions to:
Investment properties (Note 10) (162,561,703) (133,496,079) (5,152,096)Property and equipment (Note 11) (4,604,464) (1,893,372) (1,257,143)
Withdrawals from investments in trust funds 4,076,055 7,782,478 10,201,361Contributions to investments in trust funds (Note 5) (2,403,108) (1,218,183) (2,806,952)Dividends received 43,609 59,773 51,842Purchase of investment in shares of stock – – (419,392)Net cash flows from (used in) investing activities 638,943,834 (2,081,144,869) 403,490,519(Forward)

-2-
*SGVFS008696*
Years Ended December 312014 2013 2012
CASH FLOWS FROM FINANCING ACTIVITIESPayments of short-term notes and loans (P=12,444,900,552) (P=215,450,692) (P=11,020,390,161)Availments of short-term notes and loans 12,164,000,577 – 11,038,018,555Dividends paid (204,503,701) (192,972,053) (212,323,293)Interest paid (19,046,101) (45,133,432) (82,616,359)Settlement of payable to stockholders – (100,538,000) (31,896,750)Payments of contracts payable – (17,389,261) (24,036)Net cash flows used in financing activities (504,449,777) (571,483,438) (309,232,044)
NET INCREASE (DECREASE) IN CASHAND CASH EQUIVALENTS 533,365,184 (2,034,509,996) 908,001,314
CASH AND CASH EQUIVALENTS ATBEGINNING OF YEAR 835,315,078 2,869,825,074 1,961,823,760
CASH AND CASH EQUIVALENTS ATEND OF YEAR (Note 4) P=1,368,680,262 P=835,315,078 P=2,869,825,074
See accompanying Notes to Consolidated Financial Statements.
*SGVFS008696*
CITYLAND, INC. AND SUBSIDIARIESNOTES TO CONSOLIDATED FINANCIAL STATEMENTS
1. Corporate Information
Cityland, Inc. (the Parent Company) was incorporated in the Philippines on May 15, 1979. TheParent Company has a majority owned subsidiary, namely, Cityland Development Corporation(CDC), a publicly listed company, and two wholly owned subsidiaries, namely, Credit & LandHolding, Inc. (CLHI) and Cityads, Incorporated (CAI). CDC has two majority owned subsidiaries,namely, City & Land Developers, Incorporated (CLDI), another publicly listed company, andCityplans, Incorporated (CPI). The primary purpose of the Parent Company and its subsidiaries(the Group), which are all domiciled in the Philippines, is to acquire, develop, improve, subdivide,cultivate, lease, sublease, sell, exchange, barter and/or dispose of agricultural, industrial,commercial, residential and other real properties, as well as to construct, improve, lease, sublease,sell and/or dispose of houses, buildings and other improvements thereon, and to manage andoperate subdivisions and housing projects or otherwise engage in the financing and trading of realestate. In addition, CPI is engaged in the business of establishing, organizing, developing,maintaining, conducting, operating, marketing and selling pension plans.
The Parent Company’s and its subsidiaries, (the Group) registered office and principal place ofbusiness is 2nd and 3rd Floors, Cityland Condominium 10, Tower I, 156 H.V. de la Costa Street,Makati City.
The consolidated financial statements of Cityland, Inc. were authorized for issuance by the Boardof Directors (BOD) on March 18, 2015.
2. Summary of Significant Accounting and Financial Reporting Policies
Basis of PreparationThe consolidated financial statements of the Group have been prepared using the historical costbasis, except for financial assets at fair value through profit or loss and available-for-sale financialassets that have been measured at fair values and repossessed real estate properties for sale whichare carried at fair value less costs to sell. These consolidated financial statements are presented inPhilippine peso (Peso), which is the Group’s functional currency, and rounded to the nearest Pesoexcept when otherwise indicated.
Statement of ComplianceThe consolidated financial statements have been prepared in compliance with Philippine FinancialReporting Standards (PFRS).
Changes in Accounting PoliciesThe accounting policies adopted are consistent with those of the previous financial year except forthe following new and amended PFRS, Philippine Accounting Standards (PAS), and amendmentto existing Philippine Interpretation based on International Financial Reporting InterpretationCommittee (IFRIC) interpretations effective as of January 1, 2014:
· Investment Entities (Amendments to PFRS 10, Consolidated Financial Statements, PFRS 12,Disclosure of Interests in Other Entities, and PAS 27, Separate Financial Statements)These amendments provide an exception to the consolidation requirement for entities thatmeet the definition of an investment entity under PFRS 10. The exception to consolidation

- 2 -
*SGVFS008696*
requires investment entities to account for subsidiaries at fair value through profit or loss. Theamendments must be applied retrospectively, subject to certain transition relief. Theseamendments are not relevant to the Group.
· PAS 32, Financial Instruments: Presentation - Offsetting Financial Assets and FinancialLiabilities (Amendments)The amendments clarify the meaning of “currently has a legally enforceable right to offset”and the criterion for non-simultaneous settlement mechanisms of clearing houses to qualify foroffsetting and are applied retrospectively. The amendments have no significant impact on theGroup’s financial position or performance.
· PAS 36, Impairment of Assets - Recoverable Amount Disclosures for Non-Financial Assets(Amendments)These amendments remove the unintended consequences of PFRS 13 on the disclosuresrequired under PAS 36. In addition, these amendments require disclosure of the recoverableamounts for the assets or cash-generating units (CGUs) for which impairment loss has beenrecognized or reversed during the period. The application of these amendments has nomaterial impact on the disclosures in the consolidated financial statements.
· PAS 39, Financial Instruments: Recognition and Measurement-Novation of Derivatives andContinuation of Hedge Accounting (Amendments)These amendments provide relief from discontinuing hedge accounting when novation of aderivative designated as a hedging instrument meets certain criteria. The Group has noderivatives during the current and in prior periods; thus, these amendments have no impact onthe consolidated financial statements.
· Philippine Interpretation IFRIC 21, Levies (IFRIC 21)IFRIC 21 clarifies that an entity recognizes a liability for a levy when the activity that triggerspayment, as identified by the relevant legislation, occurs. For a levy that is triggered uponreaching a minimum threshold, the interpretation clarifies that no liability should beanticipated before the specified minimum threshold is reached. Retrospective application isrequired for IFRIC 21. This interpretation has no impact on the Group as it has applied therecognition principles under PAS 37, Provisions, Contingent Liabilities, and ContingentAssets, consistent with the requirements of IFRIC 21 in prior years.
· Annual Improvements to PFRSs (2010-2012 cycle)In the 2010-2012 annual improvements cycle, seven amendments to six standards were issued,which included an amendment to PFRS 13, Fair Value Measurement. The amendment toPFRS 13 is effective immediately and it clarifies that short-term receivables and payables withno stated interest rates can be measured at invoice amounts when the effect of discounting isimmaterial. This amendment has no significant impact on the Group.
· Annual Improvements to PFRSs (2011-2013 cycle)In the 2011-2013 annual improvements cycle, four amendments to four standards were issued,which included an amendment to PFRS 1, First-time Adoption of Philippine FinancialReporting Standards–First-time Adoption of PFRS. The amendment to PFRS 1 is effectiveimmediately. It clarifies that an entity may choose to apply either a current standard or a newstandard that is not yet mandatory, but permits early application, provided either standard isapplied consistently throughout the periods presented in the entity’s first PFRS financialstatements. This amendment has no impact on the Group as it is not a first-time PFRSadopter.

- 3 -
*SGVFS008696*
Basis of ConsolidationThe consolidated financial statements consist of the financial statements of the Parent Companyand its subsidiaries as of December 31 of each year. The financial statements of the subsidiariesare prepared for the same reporting year as the Parent Company using consistent accountingpolicies.
These subsidiaries, all incorporated and domiciled in the Philippines, and the percentage ofownership of the Parent Company in 2014 and 2013 are as follows:
Percentageof Ownership
Nature ofActivity
Direct:CAI 100.00 AdvertisingCLHI 100.00 HoldingCDC 50.42 Real estate
Indirect through CDC (including direct ownership ofthe Parent Company in CLDI of 29.54% andCPI of 9.18%):CLDI 54.61 Real EstateCPI 54.97 Pre-need pension
plans
A subsidiary is an entity that is controlled by the Parent Company. Control is achieved when theParent Company is exposed, or has rights, to variable returns from its involvement with theinvestee and has the ability to affect those returns through its power over the investee.Specifically, the Group controls an investee if, and only if, the Group has:
· Power over the investee (i.e., existing rights that give it the current ability to direct therelevant activities of the investee)
· Exposure, or rights, to variable returns from its involvement with the investeeThe ability to use its power over the investee to affect its returns
When the Parent Company has less than a majority of the voting or similar rights of an investee,the Group considers all relevant facts and circumstances in assessing whether it has power over aninvestee, including:
· The contractual arrangement with the other vote holders of the investee· Rights arising from other contractual arrangements· The Parent Company’s voting rights and potential voting rights
The Parent Company re-assesses whether or not it controls an investee if facts and circumstancesindicate that there are changes to one or more of the three elements of control.
Consolidation of a subsidiary begins when the Group obtains control over the subsidiary andceases when the Group loses control of the subsidiary. Assets, liabilities, income and expenses ofa subsidiary acquired or disposed of during the year are included in the consolidated financialstatements from the date the Group gains control until the date the Group ceases to control thesubsidiary.
Profit or loss and each component of other comprehensive income (OCI) are attributed to theequity holders of the parent of the Group and to the non-controlling interests, even if this results inthe non-controlling interests having a deficit balance. When necessary, adjustments are made to

- 4 -
*SGVFS008696*
the financial statements of subsidiaries to bring their accounting policies in line with the Group’saccounting policies. All intra-group assets and liabilities, equity, income, expenses and cash flowsrelating to transactions between members of the Group are eliminated in full on consolidation.
A change in the ownership interest of a subsidiary, without a loss of control, is accounted for as anequity transaction. In such circumstances, the carrying amounts of the controlling and non-controlling interests shall be adjusted to reflect the changes in their relative interests in thesubsidiary. Any difference between the amount by which the non-controlling interests is adjustedand the fair value of the consideration paid or received shall be recognized directly in equity andattributed to the owners of the parent.
If the Group loses control over a subsidiary, it derecognizes the related assets (including goodwill,if any), liabilities, non-controlling interest and other components of equity while any resultant gainor loss is recognized in profit or loss. Any investment retained is recognized at fair value.
Non-controlling InterestsNon-controlling interests represent the interests in the subsidiaries not held by the ParentCompany, and are presented separately in the consolidated statement of income, consolidatedstatement of comprehensive income and within the equity section of the consolidated balancesheets, separate from the Parent Company’s equity.
Current versus Noncurrent ClassificationThe Group presents assets and liabilities in balance sheet based on current/noncurrentclassification. An asset as current when it is:
· Expected to be realized or intended to sold or consumed in normal operating cycle· Held primarily for the purpose of trading· Expected to be realized within 12 months after the reporting period, or· Cash or cash equivalent unless restricted from being exchanged or used to settle a liability for
at least 12 months after the reporting period.
All other assets are classified as noncurrent.
A liability is current when:· It is expected to be settled in normal operating cycle· It is held primarily for the purpose of trading· It is due to be settled within 12 months after the reporting period, or· There is no unconditional right to defer the settlement of the liability for at least 12 months
after the reporting period.
The Group classifies all other liabilities as noncurrent.
Deferred tax assets and liabilities are classified as noncurrent assets and liabilities.
Cash and Cash EquivalentsCash includes cash on hand and in banks. Cash equivalents are short-term, highly liquidinvestments that are readily convertible to known amounts of cash with original maturities of threemonths or less from dates of acquisition, and are subject to an insignificant risk of change in value.

- 5 -
*SGVFS008696*
Short-term Cash InvestmentsShort-term cash investments are investments with maturities of more than three months but notexceeding one year from dates of acquisition.
Financial Assets and Financial LiabilitiesDate of recognitionThe Group recognizes a financial asset or a financial liability in the consolidated balance sheetwhen it becomes a party to the contractual provisions of the instrument. In the case of a regularway purchase or sale of financial assets, recognition and derecognition, as applicable, is doneusing settlement date accounting.
Initial recognition of financial instrumentsFinancial instruments are recognized initially at fair value, which is the fair value of theconsideration given (in case of an asset) or received (in case of a liability). The initialmeasurement of financial instruments, except for those designated at fair value through profit orloss, includes directly attributable transaction costs.
Classification of financial instrumentsSubsequent to initial recognition, the Group classifies its financial instruments in the followingcategories: financial assets and financial liabilities at fair value through profit or loss, loans andreceivables, held-to-maturity investments, available-for-sale financial assets and other financialliabilities. The classification depends on the purpose for which the instruments are acquired andwhether they are quoted in an active market. Management determines the classification at initialrecognition and, where allowed and appropriate, re-evaluates this classification at each end ofreporting period.
a. Financial Assets or Financial Liabilities at Fair Value Through Profit or Loss
A financial asset or financial liability is classified in this category if acquired principally forthe purpose of selling or repurchasing in the near term or upon initial recognition it isdesignated by the management as at fair value through profit or loss.
Financial assets or financial liabilities classified in this category are designated as at fair valuethrough profit or loss by management on initial recognition when the following criteria aremet:
· The designation eliminates or significantly reduces the inconsistent treatment that wouldotherwise arise from measuring the assets or liabilities or recognizing gains or losses onthem on a different basis; or
· The assets or liabilities are part of a group of financial assets or financial liabilities, orboth financial assets and financial liabilities, which are managed and their performance isevaluated on a fair value basis, in accordance with a documented risk management orinvestment strategy; or
· The financial instrument contains an embedded derivative, unless the embeddedderivative does not significantly modify the cash flows or it is clear, with little or noanalysis, that it would not be separately recorded.

- 6 -
*SGVFS008696*
Financial assets or financial liabilities classified under this category are carried at fair value inthe consolidated balance sheet. Changes in the fair value of such assets and liabilities arerecognized in the consolidated statement of income.
The Group designated its investments in trust funds as financial assets at fair value throughprofit or loss. The Group’s investments in trust funds directly relate to the Pre-need Reservesaccounts.
b. Loans and Receivables
Loans and receivables are non-derivative financial assets with fixed or determinable paymentsthat are not quoted in an active market. They arise when the Group provides money, goods orservices directly to a debtor with no intention of trading the receivables. Loans and receivablesare carried at amortized cost in the consolidated balance sheet. Amortization is determinedusing the effective interest rate method.
The Group’s loans and receivables consist of cash in banks, cash equivalents, short-term cashinvestments, installment contracts receivable and other receivables.
c. Held-to-maturity Investments
Held-to-maturity investments are non-derivative financial assets with fixed or determinablepayments and fixed maturities wherein the Group has the positive intention and ability to holdto maturity. Held-to-maturity investments are carried at amortized cost in the consolidatedbalance sheet. Amortization is determined using the effective interest rate method.
The Group has no held-to-maturity investments as of December 31, 2014 and 2013.
d. Available-for-sale Financial Assets
Available-for-sale financial assets are non-derivatives that are either designated in thiscategory or not classified in any of the other categories. Available-for-sale financial assets arecarried at fair value in the consolidated balance sheet. Changes in the fair value of such assetsare accounted in the consolidated statement of comprehensive income and in equity.
The Group’s available-for-sale financial assets consist of investments in quoted equitysecurities that are traded in liquid markets, held for the purpose of investing in liquid fundsand not generally intended to be retained on a long-term basis.
e. Other Financial Liabilities
Other financial liabilities are non-derivative financial liabilities with fixed or determinablepayments that are not quoted in an active market. They arise when the Group owes money,goods or services directly to a creditor with no intention of trading the payables. Otherfinancial liabilities are carried at cost or amortized cost in the consolidated balance sheet.Amortization is determined using the effective interest rate method.
The Group’s other financial liabilities consist of accounts payable and accrued expenses andnotes and contracts payable.
Cash dividend distributions to stockholders are recognized as financial liabilities when thedividends are approved by the BOD.

- 7 -
*SGVFS008696*
Offsetting of financial instrumentsFinancial assets and financial liabilities are offset and the net amount is reported in theconsolidated balance sheet if, and only if, there is a currently enforceable legal right to offset therecognized amounts and there is an intention to settle on a net basis, or to realize the asset andsettle the liability simultaneously.
Fair Value MeasurementDetermination of fair valueFair value is the price that would be received to sell an asset or paid to transfer a liability in anorderly transaction between market participants at the measurement date. The fair valuemeasurement is based on the presumption that the transaction to sell the asset or transfer theliability takes place either:
· In the principal market for the asset or liability, or· In the absence of a principal market, in the most advantageous market for the asset or liability
The principal or the most advantageous market must be accessible to by the Group.
The fair value of an asset or a liability is measured using the assumptions that market participantswould use when pricing the asset or liability, assuming that market participants act in theireconomic best interest.
A fair value measurement of a non-financial asset takes into account a market participant's abilityto generate economic benefits by using the asset in its highest and best use or by selling it toanother market participant that would use the asset in its highest and best use.
The Group uses valuation techniques that are appropriate in the circumstances and for whichsufficient data are available to measure fair value, maximizing the use of relevant observableinputs and minimizing the use of unobservable inputs.
All assets and liabilities for which fair value is measured or disclosed in the consolidated financialstatements are categorized within the fair value hierarchy, described as follows, based on thelowest level input that is significant to the fair value measurement as a whole:
· Level 1 - Quoted (unadjusted) market prices in active markets for identical assets or liabilities· Level 2 - Valuation techniques for which the lowest level input that is significant to the fair
value measurement is directly or indirectly observable· Level 3 - Valuation techniques for which the lowest level input that is significant to the fair
value measurement is unobservable
For assets and liabilities that are recognized in the financial statements on a recurring basis, theGroup determines whether transfers have occurred between Levels in the hierarchy by re-assessing categorization (based on the lowest level input that is significant to the fair valuemeasurement as a whole) at the end of each reporting period.
“Day 1” DifferenceWhere the transaction price in a non-active market is different from the fair value from otherobservable current market transactions in the same instrument or based on a valuation techniquewhose variables include only data from observable market, the Group recognizes the differencebetween the transaction price and fair value (a “Day 1” difference) in the consolidated statementof income unless it qualifies for recognition as some other type of asset. In cases where inputs are

- 8 -
*SGVFS008696*
made of data which are not observable, the difference between the transaction price and modelvalue is only recognized in the consolidated statement of income when the inputs becomeobservable or when the instrument is derecognized. For each transaction, the Group determinesthe appropriate method of recognizing the “Day 1” difference.
Derecognition of Financial Assets and Financial LiabilitiesFinancial assetsA financial asset (or, where applicable, a part of a financial asset or part of a group of similarfinancial assets) is derecognized when:
· the rights to receive cash flows from the asset have expired; or· the Group retains the right to receive cash flows from the asset, but has assumed an obligation
to pay them in full without material delay to a third party under a “pass-through” arrangement;or
· the Group has transferred its right to receive cash flows from the asset and either (a) hastransferred substantially all the risks and rewards of the asset, or (b) has neither transferred norretained substantially all the risks and rewards of the asset, but has transferred control of theasset.
When the Group has transferred its rights to receive cash flows from a financial asset and hasneither transferred nor retained substantially all the risks and rewards of the asset nor transferredcontrol of the asset, the asset is recognized to the extent of the Group’s continuing involvement inthe asset. Continuing involvement that takes the form of a guarantee over the transferred financialasset is measured at the lower of the original carrying amount of the asset and the maximumamount of consideration that the Group could be required to repay.
Financial liabilitiesA financial liability is derecognized when the obligation under the liability is discharged,cancelled or has expired.
Where an existing financial liability is replaced by another from the same lender on substantiallydifferent terms, or the terms of an existing liability are substantially modified, such an exchange ormodification is treated as a derecognition of the original liability and the recognition of a newliability, and the difference in the respective carrying amounts is recognized in the consolidatedstatement of income.
Impairment of Financial AssetsThe Group assesses at each reporting period whether a financial asset or a group of financial assetsis impaired.
Financial assets carried at amortized costThe Group first assesses whether objective evidence of impairment exists individually forfinancial assets that are individually significant, and individually or collectively for financialassets that are not individually significant. Objective evidence includes observable data thatcomes to the attention of the Group about loss events such as, but not limited to significantfinancial difficulty of the counterparty, a breach of contract, such as default or delinquency ininterest or principal payments, probability that the borrower will enter bankruptcy or otherfinancial reorganization. If it is determined that no objective evidence of impairment exists for anindividually assessed financial asset, whether significant or not, the asset is included in the groupof financial assets with similar credit risk and characteristics and that group of financial assets iscollectively assessed for impairment. Financial assets that are individually assessed for

- 9 -
*SGVFS008696*
impairment and for which an impairment loss is recognized are not included in a collectiveassessment of impairment.
The impairment assessment is performed at each end of reporting period. For the purpose ofcollective evaluation of impairment, financial assets are grouped on the basis of such credit riskcharacteristics such as customer type, payment history, past-due status and term.
If there is an objective evidence that an impairment loss on loans and receivables carried atamortized cost has been incurred, the amount of loss is measured as the difference between theasset’s carrying amount and the present value of estimated future cash flows (excluding futurecredit losses that have not been incurred) discounted at the financial asset’s original effectiveinterest rates (i.e., the effective interest rate computed at initial recognition). The carrying amountof the asset shall be reduced either directly or through the use of an allowance account. Theamount of loss, if any, is recognized in the consolidated statement of income.
If, in a subsequent period, the amount of the impairment loss decreases and the decrease can berelated objectively to an event occurring after the impairment was recognized, the previouslyrecognized impairment loss is reversed by adjusting the allowance account. The amount of thereversal is recognized in the consolidated statement of income. Interest income continues to beaccrued on the reduced carrying amount based on the original effective interest rate of the asset.Loans together with the associated allowance are written off when there is no realistic prospect offuture recovery and all collateral, if any, has been realized or has been transferred to the Group. Ifin a subsequent year, the amount of the estimated impairment loss increases or decreases becauseof an event occurring after the impairment was recognized, the previously recognized impairmentloss is increased or reduced by adjusting the allowance for impairment losses account. If a futurewrite off is later recovered, the recovery is recognized in the consolidated statement of incomeunder “Other income” account. Any subsequent reversal of an impairment loss is recognized inthe consolidated statement of income to the extent that the carrying value of the asset does notexceed its amortized cost at reversal date.
Assets carried at costIf there is an objective evidence that an impairment loss of an unquoted equity instrument that isnot carried at fair value because its fair value cannot be reliably measured, or a derivative assetthat is linked to and must be settled by delivery of such an unquoted equity instrument has beenincurred, the amount of loss is measured as the difference between the asset’s carrying amount andthe present value of estimated future cash flows discounted at the current market rate of return fora similar financial asset.
Available-for-sale financial assetsIn the case of debt instruments classified as available-for-sale financial assets, impairment isassessed based on the same criteria as financial assets carried at amortized cost. Future interestincome is based on the reduced carrying amount and is accrued based on the rate of interest usedto discount future cash flows for the purpose of measuring impairment loss. Such accrual isrecorded as part of “Financial income” in the consolidated statement of income. If, in subsequentyear, the fair value of a debt instrument increases and the increase can be objectively related to anevent occurring after the impairment loss was recognized in the consolidated statement of income,the impairment loss is reversed through the consolidated statement of income.
In case of equity investments classified as available-for-sale financial assets, this would include asignificant or prolonged decline in the fair value of the investments below its cost. Where there isevidence of impairment, the cumulative loss - measured as the difference between the acquisitioncost and the current fair value, less any impairment loss on that financial asset previously

- 10 -
*SGVFS008696*
recognized in the consolidated statement of income - is removed from equity and recognized in theconsolidated statement of income. Increases in fair value after impairment are recognized in theconsolidated statement of comprehensive income and directly in the consolidated statement ofchanges in equity.
Real Estate Properties for Sale and Real Estate Properties Held for Future DevelopmentProperty acquired or being constructed for sale in the ordinary course of business and held forfuture development, rather than to be held for rental or capital appreciation, is classified as realestate properties for sale and real estate properties held for future development and are measuredat the lower of cost and net realizable value (NRV).
Cost includes:· Land cost· Amounts paid to contractors for construction· Borrowing costs, planning and design costs, costs of site preparation, professional fees,
property transfer taxes, construction overheads and other related costs.
NRV is the estimated selling price in the ordinary course of the business, based on market pricesat the reporting date, less estimated costs to complete and the estimated costs necessary to makethe sale. The Group recognizes the effect of revisions in the total project cost estimates in the yearin which these changes become known.
Upon commencement of development, the real estate properties held for future development istransferred to real estate properties for sale.
Repossessed real estate properties for sale arising from sale cancelations and forfeitures aremeasured at fair value less estimated costs to make the sale. Any resulting gain or loss is creditedor charged to “Other income” or “Other expenses”, respectively, in the consolidated statement ofincome.
Investments in Trust FundsThe trust fund assets and liabilities are recognized in accordance with the provisions of theapplicable PAS and PFRS and their interpretations.
Investments in trust funds are restricted to cover the Group’s pre-need reserves. These areclassified as current assets to the extent of the currently maturing pre-need reserves. Theremaining portion is classified as noncurrent assets in the balance sheet.
Investment PropertiesInvestment properties which represent real estate properties for lease are measured initially at cost,including transaction costs. The carrying amount includes the cost of replacing part of existinginvestment properties at the time that cost is incurred if the recognition criteria are met, andexcludes the costs of day-to-day servicing of the property. The carrying values of revaluedproperties transferred to real estate properties for lease on January 1, 2004 were considered as theassets’ deemed cost as of said date.
Subsequent to initial measurement, investment properties, except land, are carried at cost lessaccumulated depreciation and amortization and any impairment in value. Land is carried at costless any impairment in value. Buildings for lease are depreciated over their useful life of 25 yearswhile machinery and equipment are depreciated over their useful life of 5 to 15 years using thestraight line method.
- 11 -
*SGVFS008696*
Investment properties are derecognized when either they have been disposed of or when theproperty is permanently withdrawn from use and no future economic benefit is expected from itsdisposal. Any gains or losses on the retirement or disposal of investment properties arerecognized in the consolidated statement of income in the year of retirement or disposal.
Transfers are made to investment properties when, and only when, there is a change in use,evidenced by ending of owner-occupation, commencement of an operating lease to another party,or ending of construction or development. Transfers are made from investment properties when,and only when, there is a change in use, evidenced by commencement of owner-occupation orcommencement of development with a view to sale.
Transfers between investment properties, owner-occupied property and inventories do not changethe carrying amount of the property transferred and they do not change the cost of that property formeasurement or disclosure purposes.
Construction in progress is stated at cost. This includes costs of construction and other direct costsrelated to the investment property being constructed. Construction in progress is not depreciateduntil such time when the relevant assets are complete and ready for use. When such constructionis completed and assets are ready for use, the cost of the said assets are transferred to specificclassification under “Investment property” account.
Property and EquipmentProperty and equipment, except for office premises, are stated at cost less accumulateddepreciation and any impairment in value. Office premises are stated at appraised values (asset’sdeemed cost) as determined by independent firms of appraisers at the date of transition to PFRS,less accumulated depreciation and any impairment in value. Subsequent additions to officepremises are stated at cost less accumulated depreciation and any impairment in value.
The initial cost of property and equipment consists of the purchase price and any directlyattributable cost of bringing the assets to their working condition and location for their intendeduse. Expenditures incurred after the property and equipment have been put into operations, such asrepairs and maintenance costs, are normally charged to the consolidated statement of income inthe period in which the costs are incurred. In situations where it can be clearly demonstrated thatthe expenditures have resulted in an increase in the future economic benefits expected to beobtained from the use of an item of property and equipment beyond its originally assessedstandard of performance, the expenditures are capitalized as an additional cost of property andequipment.
Depreciation of an item of property and equipment begins when the asset becomes available foruse, i.e., when it is in the location and condition necessary for it to be capable of operating in themanner intended by management. Depreciation ceases at the earlier of the date that the item isclassified as held for sale (or included in a disposal group that is classified as held for sale) inaccordance with PFRS 5, Noncurrent Assets Held for Sale and Discontinued Operations, and thedate the asset is derecognized.

- 12 -
*SGVFS008696*
Depreciation is computed using the straight-line method over the estimated useful lives of theproperties as follows:
YearsOffice premises 25Furniture, fixtures and office equipment 5-15Transportation and other equipment 5
The assets’ useful lives and depreciation method are reviewed periodically to ensure that these areconsistent with the expected pattern of economic benefits from items of property and equipment.
When property and equipment are sold or retired, the cost and related accumulated depreciationand any impairment in value are removed from the accounts, and any gains or losses from theirdisposal is included in the consolidated statement of income.
Impairment of Nonfinancial AssetsThe carrying values of real estate properties held for future development, investment propertiesand property and equipment are reviewed for impairment when events or changes incircumstances indicate that the carrying values may not be recoverable. If any such indicationexists and where the carrying value exceeds the estimated recoverable amount, the assets are eitherwritten down to their recoverable amount or provided with valuation allowance. An asset’srecoverable amount is the higher of an asset’s or cash-generating unit’s (CGU) fair value less costsof disposal and its value-in-use. Impairment losses, if any, are recognized in the consolidatedstatement of income.
In assessing value in use, the estimated future cash flows are discounted to their present valueusing a pre-tax discount rate that reflects current market assessments of the time value of moneyand the risks specific to the asset. In determining fair value less costs of disposal, recent markettransactions are taken into account.
The Group assesses at each reporting period whether there is an indication that previouslyrecognized impairment losses may no longer exist or may have decreased. The Group considersexternal and internal sources of information in its assessment of the reversal of previouslyrecognized impairment losses. A previously recognized impairment loss is reversed only if therehas been a change in the estimates used to determine the asset’s recoverable amount since the lastimpairment loss was recognized. If that is the case, the carrying amount of the asset is increasedto its recoverable amount. That increased amount cannot exceed the carrying amount that wouldhave been determined, net of depreciation, had no impairment loss been recognized for the asset inprior years. Such reversal is recognized in the consolidated statement of income. After such areversal, the depreciation is adjusted in future periods to allocate the asset’s revised carryingamount, less any residual value, on a systematic basis over its remaining useful life.
Value-added Tax (VAT)Revenue, expenses, assets and liabilities are recognized net of the amount of VAT, except wherethe VAT incurred on a purchase of assets or services is not recoverable from the taxationauthority, in which case the VAT is recognized as part of the cost of acquisition of the asset or aspart of the expense item as applicable.
The net amount of VAT recoverable from or payable to, the taxation authority is included as partof “Other current assets” or “Accounts payable and accrued expenses,” respectively, in theconsolidated balance sheet.

- 13 -
*SGVFS008696*
Pre-Need ReservesCPI’s pension plans are calculated on the basis of the methodology and assumptions set out in Pre-need Rule 31, as Amended, as follows:
· the amount of provision is the present value of the funding expected to be required to settle theobligation with due consideration of the different probabilities as follows:
On Currently-Being-Paid Plans
i. Provision for termination values applying the inactivity and surrender rate experience ofCPI.
ii. For the portion of currently-being-paid plans that will reach full payment, applying thefull payment experience of CPI, the liability is equivalent to the present value of futurematurity benefits reduced by the present value of future trust fund contributions requiredper Product Model discounted at the approved hurdle rate per Product Model of theGroup.
On Lapsed Plans within the Allowable Reinstatement Period
i. Provision for termination values applying the reinstatement experience of CPI. The trendof surrender rate experience is disclosed in the note to consolidated financial statements(see Note 3).
On Fully Paid Plans
i. For those due for payment within the next five years, the reserve is the present value offuture maturity benefits discounted at the attainable rate, as determined and certified bythe CPI’s trustee using industry best practices and principles which shall be indicated insuch certification;
ii. For those not yet due for payment within the next five years, the reserves is the presentvalue of future maturity benefits discounted at the approved hurdle rate per Product Modelof CPI.
· The rates of surrender, cancellation, reinstatement, utilization, and inflation considered theactual experience of CPI in the last three years.
· The computation of the foregoing assumptions has been validated by the internal qualifiedactuary of CPI.
· Based on the Group’s experience, the probability of pre-termination on surrender of fully paidplans is below 5% and therefore considered insignificant. As such, no pre-termination ratewas considered in determining the PNR of fully paid plans. The derecognition of liabilityshall be recorded at pre-termination date.
As of December 31, 2014 and 2013, the principal assumptions used in determining the pre-needreserves was based on the Insurance Commission (IC) Circular Letter No. 23-2012 datedNovember 28, 2012 (see Note 4). The transitory discount interest rate that shall be used in thevaluation of pre-need reserves shall not exceed the lower of the attainable rates as certified by theTrustee of 4.84% and the IC rate of 8% for 2014 and lower of the attainable rates as certified bythe Trustee of 5.81% and the IC rate of 8% for 2013.

- 14 -
*SGVFS008696*
Other reservesThe Group sets-up other provisions in accordance with PAS 37 to cover obligations such asinsurance premium reserve, pension bonus and trust fund deficiency.
Capital StockCapital stock is measured at par value for all shares issued and outstanding. When the ParentCompany issues more than one class of stock, a separate account is maintained for each class ofstock and the number of shares issued. Incremental costs incurred directly attributable to theissuance of new shares are shown in equity as a deduction from proceeds, net of tax.
When the shares are sold at premium, the difference between the proceeds and the par value iscredited to the “Additional paid-in capital” account. When shares are issued for a considerationother than cash, the proceeds are measured by the fair value of the consideration received. In casethe shares are issued to extinguish or settle the liability of the Company, the shares shall bemeasured either at the fair value of the shares issued or fair value of the liability settled, whicheveris more reliably determinable.
Retained EarningsRetained earnings represent the cumulative balance of net income or loss, dividend distributions,effects of the changes in accounting policy and other capital adjustments.
Unappropriated retained earnings represent that portion of retained earnings which is free and canbe declared as dividends to stockholders. Appropriated retained earnings represent that portion ofretained earnings which has been restricted and therefore is not available for any dividenddeclaration.
The retained earnings include deemed cost adjustments on real estate properties for sale,investment properties and property and equipment that arose when the Group transitioned to PFRSin 2005. The deemed cost adjustment will be realized through depreciation in profit or loss fordepreciable assets (property and equipment and investment properties) and through sale forinventories (classified under real estate properties for sale) and land (classified under investmentproperty). The deferred income tax liability on deemed cost adjustments on investment properties,property and equipment and inventories sold under Income Tax Holiday (ITH) projects istransferred to retained earnings upon realization while the deferred income tax liability on deemedcost adjustments on inventories sold under regular tax regime is transferred to consolidatedstatement of income upon sale.
Treasury StockTreasury stock is the Group’s own equity instruments that has been issued and then reacquired butnot yet cancelled. Treasury stock are recognized at cost and deducted from equity. No gain orloss is recognized in the consolidated statement of income on the purchase, sale, issue orcancellation of the Group’s own equity instruments. Any difference between the carrying amountand the consideration, if reissued, is recognized as additional paid-in capital.
Dividend DistributionsCash dividends on common shares are deducted from retained earnings upon declaration by theBOD.
Stock dividends on common shares are measured based on the total par value of declared stockdividend. Stock dividends are deducted from retained earnings when the BOD’s declaration isratified by the stockholders of the Group. Unissued stock dividend are recorded as stockdividends distributable and credited to capital stock upon issuance.

- 15 -
*SGVFS008696*
Dividends for the year that are declared after the end of the reporting period but before theapproval for issuance of consolidated financial statements are dealt with as an event after thereporting period.
Revenue and Costs RecognitionRevenue is recognized to the extent that it is probable that the economic benefits will flow to theGroup and the amount of revenue can be reliably measured. Revenue is measured at the fair valueof the consideration received or receivable excluding VAT. The Group assesses its revenuearrangements against specific criteria in order to determine if it is acting as principal or agent. TheGroup has concluded that it is acting as a principal in all of its revenue arrangements. Thefollowing specific recognition criteria must also be met before revenue is recognized:
Sales of real estate propertiesIn accordance with Philippine Interpretations Committee, Q&A 2006-01, the percentage-of-completion (POC) method is used to recognize income from sales of condominium units andresidential houses where the Group has material obligations under the sales contract to completethe project after the property is sold, the equitable interest has been transferred to the buyer,construction is beyond preliminary stage (i.e., engineering, design work, construction contractsexecution, site clearance and preparation, excavation and the building foundation are finished),and the costs incurred or to be incurred can be measured reliably. Under this method, revenue onsale is recognized as the related obligations are fulfilled, measured principally on the basis of theestimated completion of a physical proportion of the contract work.
Revenue from sale of completed residential lots and housing units, where a sufficient downpayment has been received, the collectability of the sales price is reasonably assured, the refundperiod has expired, the receivables are not subordinated and the seller is not obliged to completeimprovements, is accounted for under the full accrual method.
If the criteria of full accrual and POC method are not satisfied and when the license to sell andcertificate of registration for a project are not yet issued by the Housing and Land Use RegulatoryBoard (HLURB), any cash received by the Group is recognized as deposits and included under“Accounts payable and accrued expenses” in the consolidated balance sheet until all the conditionsfor recognizing the sale are met.
Costs of real estate salesCost of real estate sales is recognized consistent with the revenue recognition method applied.Cost of subdivision land and condominium units sold before the completion of the development isdetermined on the basis of the acquisition cost of the land plus estimated costs to complete thedevelopment of the property. The estimated expenditures for the development of sold real estateproperty, as determined by independent project engineers, are charged to “Cost of real estatesales” in the consolidated statement of income with a corresponding credit to accrued developmentcosts account presented under “Accounts payable and accrued expenses” in the consolidatedbalance sheet.
The cost of inventory recognized in profit or loss on disposal (cost of real estate sales) isdetermined with reference to the specific costs incurred on the property, allocated to saleable areabased on relative size and takes into account the POC used for revenue recognition purposes.
Any changes in estimated development costs used in the determination of the amount of revenueand expenses are recognized in consolidated statement of income in the period in which thechange is made and in subsequent periods.

- 16 -
*SGVFS008696*
Sale of undeveloped landRevenue from sale of undeveloped land is recognized using the full accrual method. Under the fullaccrual method, revenue is recognized when the risks and rewards of ownership on theundeveloped land have passed to the buyer and the amount of revenue can be measured reliably.
Sales of pre-need plansPremiums from sale of pre-need plans, included under “Other income” account in the consolidatedstatement of income are recognized as earned when collected.
Cost of sales of pre-need plansCost of contracts issued included under “Operating expenses” account in the consolidatedstatement of income, pertains to (a) the increase in pre-need reserves as at the current year ascompared to the provision for the same period of the previous year. If there is a decrease in thepre-need reserves as a result of new information or new developments, the amount shall bededucted from the cost of contracts issued of the current period. In case of material prior perioderrors, the requirements of PAS 8, Accounting Policies, Changes in Accounting Estimates andErrors, shall be complied with by the pre-need company; (b) amount of trust funds contributedduring the year; and (c) documentary stamp taxes and SEC registration fees.
Interest incomeInterest income from cash in banks, cash equivalents, short-term cash investments and installmentcontracts receivables is recognized as the interest accrues taking into account the effective yield oninterest.
Dividend incomeDividend income is recognized when the Group’s right to receive the payment is established.
Trust Fund IncomeTrust fund income mainly pertains to rental income on investment properties under the trust fundaccount, as well as, trading gains and losses from buying and selling and changes in fair value offinancial assets and financial liabilities categorized upon initial recognition as at fair value throughprofit or loss investments under the trust fund account.
Unrealized re-measurement gain on investment propertiesThis pertains to changes in fair value of investment properties under the trust fund account.
Operating leases – Group as a lessorOperating leases represent those leases under which substantially all the risks and rewards ofownership of the leased assets remain with the lessors. Rent income from operating leases isrecognized as income when earned on a straight-line basis over the term of the lease agreement.Initial direct costs incurred in negotiating and arranging an operating lease are added to thecarrying amount of the leased asset and recognized over the term on the same basis as rentalincome. Contingent rents are recognized as revenue in the period in which they are earned.
The determination of whether an arrangement is, or contains, a lease is based on the substance ofthe arrangement at inception date whether the fulfillment of the arrangement is dependent on theuse of a specific asset or assets or the arrangement conveys a right to use the asset. A reassessmentis made after inception of the lease only if one of the following applies:
(a) There is a change in contractual terms, other than a renewal or extension of the arrangement;

- 17 -
*SGVFS008696*
(b) A renewal option is exercised or extension granted, unless the term of the renewal orextension was initially included in the lease term;
(c) There is a change in the determination of whether fulfillment is dependent on a specifiedasset; or
(d) There is substantial change to the asset.
Where a reassessment is made, lease accounting shall commence or cease from the date when thechange in circumstances gave rise to the reassessment for scenarios (a), (c), or (d) and at the dateof renewal or extension period for scenario (b).
Operating expensesOperating expenses constitute costs of administering the business. These costs are expensed asincurred.
Financial expensesFinancial expenses consist of interest incurred on notes and contracts payable. Interest attributableto a qualifying asset is capitalized as part of the cost of the asset while others are expensed asincurred.
Interest costs are capitalized if they are directly attributable to the acquisition, development andconstruction of real estate projects as part of the cost of such projects. Capitalization of interestcost (1) commences when the activities to prepare the assets for their intended use are in progressand expenditures and interest costs are being incurred, (2) is suspended during extended periods inwhich active development is interrupted, and (3) ceases when substantially all the activitiesnecessary to prepare the assets for their intended use are complete. If the carrying amount of theasset exceeds its recoverable amount, an impairment loss is recorded.
Other income and other expensesOther income and other expenses pertain to the gain or loss, respectively, arising from forfeiture orcancellation of prior years’ real estate sales.
Retirement Benefits CostsThe net defined benefit liability or asset is the aggregate of the present value of the defined benefitobligation at the end of the reporting period reduced by the fair value of plan assets (if any),adjusted for any effect of limiting a net defined benefit asset to the asset ceiling. The asset ceilingis the present value of any economic benefits available in the form of refunds from the plan orreductions in future contributions to the plan.
The cost of providing benefits under the defined benefit plans is actuarially determined using theprojected unit credit method.
Defined benefit costs comprise the following:· Service cost· Net interest on the net defined benefit liability or asset· Re-measurements of net defined benefit liability or asset
Service costs which include current service costs, past service costs and gains or losses on non-routine settlements are recognized as expense in profit or loss. Past service costs are recognizedwhen plan amendment or curtailment occurs. These amounts are calculated periodically byindependent qualified actuary.

- 18 -
*SGVFS008696*
Net interest on the net defined benefit liability or asset is the change during the period in the netdefined benefit liability or asset that arises from the passage of time which is determined byapplying the discount rate based on government bonds to the net defined benefit liability or asset.
Net interest on the net defined benefit liability or asset is recognized as expense or income inconsolidated statement of income.
Re-measurements comprising actuarial gains and losses, return on plan assets and any change inthe effect of the asset ceiling (excluding net interest on defined benefit liability) are recognizedimmediately in consolidated statement of other comprehensive income in the period in which theyarise. Re-measurements are not reclassified to consolidated statement of income in subsequentperiods.
Plan assets are assets that are held by a long-term employee benefit fund or qualifying insurancepolicies. Plan assets are not available to the creditors of the Group, nor can they be paid directly tothe Group. Fair value of plan assets is based on market price information. When no market priceis available, the fair value of plan assets is estimated by discounting expected future cash flowsusing a discount rate that reflects both the risk associated with the plan assets and the maturity orexpected disposal date of those assets (or, if they have no maturity, the expected period until thesettlement of the related obligations). If the fair value of the plan assets is higher than the presentvalue of the defined benefit obligation, the measurement of the resulting defined benefit asset islimited to the present value of economic benefits available in the form of refunds from the plan orreductions in future contributions to the plan.
The Group’s right to be reimbursed of some or all of the expenditure required to settle a definedbenefit obligation is recognized as a separate asset at fair value when and only whenreimbursement is virtually certain.
Employee leave entitlementEmployee entitlements to annual leave are recognized as a liability when they are accrued to theemployees. The undiscounted liability for leave expected to be settled after the end of the reportingperiod is recognized for services rendered by employees up to the end of the reporting period.Accumulating leave credits which are not expected to be settled wholly before twelve months fromthe reporting date are classified as noncurrent liabilities at its discounted amount.
Provisions and ContingenciesProvisions are recognized when the Group has a present obligation (legal or constructive) as aresult of a past event, it is probable that an outflow of resources embodying economic benefits willbe required to settle the obligation and a reliable estimate can be made of the amount of theobligation. When the Group expects some or all of a provision to be reimbursed, for example,under an insurance contract, the reimbursement is recognized as a separate asset, but only whenthe reimbursement is virtually certain. The expense relating to a provision is presented in theconsolidated statement of income net of any reimbursement.
If the effect of the time value of money is material, provisions are determined by discounting theeffective future cash flows at a pre-tax rate that reflects current market assessmentof the time value of money and where appropriate, the risks specific to the liability. Wherediscounting is used, the increase in the provision due to the passage of time is recognized as aninterest expense.
Contingent liabilities are not recognized in the consolidated financial statements. They aredisclosed unless the possibility of an outflow of resources embodying economic benefits is

- 19 -
*SGVFS008696*
remote. A contingent asset is not recognized in the consolidated financial statements but disclosedwhen an inflow of economic benefits is probable.
Income TaxesCurrent income taxCurrent income tax assets and liabilities for the current and prior periods are measured at theamount expected to be recovered from or paid to the taxation authorities. The tax rates and the taxlaws used to compute the amount are those that are enacted or substantively enacted at the end ofreporting period.
Current income tax for current and prior periods shall, to the extent unpaid, be recognized as aliability under “Income tax payable” account in the consolidated balance sheet. If the amountalready paid in respect of current and prior periods exceeds the amount due for those periods, theexcess shall be recognized as an asset under “Other current assets” account in the consolidatedbalance sheet.
Deferred income taxDeferred income tax is recognized on all temporary differences at the end of reporting periodbetween the tax bases of assets and liabilities and their carrying amounts for financial reportingpurposes.
Deferred income tax liabilities are recognized for all taxable temporary differences, includingassets revaluations. Deferred income tax assets are recognized for all deductible temporarydifferences to the extent that it is probable that sufficient future taxable profits will be availableagainst which the deductible temporary differences can be utilized. Deferred income tax assetsand deferred income tax liabilities are not recognized when it arises from the initial recognition ofan asset or liability in a transaction that is not a business combination and, at the time of thetransaction, affects neither the accounting profit nor taxable profit or loss.
Deferred income tax liabilities are not provided on nontaxable temporary differences associatedwith investments in subsidiaries and affiliates.
The carrying amount of deferred income tax assets is reviewed at each end of reporting period andreduced to the extent that it is no longer probable that sufficient future taxable profits will beavailable to allow all or part of the deferred tax assets to be utilized. Unrecognized deferredincome tax assets are reassessed at each end of reporting period and are recognized to the extentthat it has become probable that sufficient future taxable profits will allow the deferred income taxasset to be recovered.
Deferred income tax assets and deferred income tax liabilities are measured at the tax rates that areexpected to apply to the period when the asset is realized or the liability is settled, based on taxrates and tax laws that have been enacted or substantively enacted at the end of reporting period.
Deferred income tax relating to items recognized directly in equity is recognized in equity andthose directly in comprehensive income such as re-measurement of defined benefit plan arerecognized in the consolidated statement of comprehensive income and not in the consolidatedstatement of income.
Deferred income tax assets and deferred income tax liabilities are offset, if a legally enforceableright exists to offset current tax assets against current income tax liabilities and the deferred taxesrelate to the same taxable entity and the same taxation authority.

- 20 -
*SGVFS008696*
Other Comprehensive IncomeOther comprehensive income comprises items of income and expense that are not recognized inthe consolidated statement of income in accordance with PFRS. Other comprehensive income ofthe Group includes gains and losses on fair value changes of available-for-sale financial assets,re-measurements comprising actuarial gains and losses, return on plan assets and any change inthe effect of the asset ceiling (excluding net interest on defined benefit liability).
Earnings Per ShareBasic earnings per share is computed by dividing the net income for the year attributable to equityholders of the Parent Company by the weighted average number of ordinary shares issued andoutstanding after considering the retroactive effect, if any, of stock dividends declared during theyear.
Diluted earnings per share is calculated by dividing the net income for the year attributable toequity holders of the Parent Company by the weighted average number of ordinary sharesoutstanding during the year, excluding treasury shares and adjusted for the effects of all dilutivepotential common shares, if any. In determining both the basic and diluted earnings per share, theeffect of stock dividends, if any, is accounted for retrospectively.
Segment ReportingThe Group’s operating businesses are organized and managed separately according to the natureof the products and services provided, with each segment representing a strategic business unitthat offers different products and serves different markets. Financial information on businesssegments is presented in Note 29 to the consolidated financial statements. The Group’s asset-producing revenues are located in the Philippines (i.e., one geographical location). Therefore,geographical segment information is no longer presented.
Events After the Reporting PeriodPost year-end events that provide additional information about the Group’s position at the end ofreporting period (adjusting events) are reflected in the consolidated financial statements. Postyear-end events that are not adjusting events are disclosed in the notes to the consolidatedfinancial statements when material.
Future Changes in Accounting PoliciesThe Group will adopt the standards and interpretations enumerated below when these becomeeffective. Except as otherwise indicated, the Group does not expect the adoption of these changesin PFRS to have a significant impact on the consolidated financial statements. The relevantdisclosures will be included in the notes to the consolidated financial statements when thesebecome effective.
Standards Issued but not yet Effective
· PFRS 9, Financial Instruments – Classification and Measurement (2010 version)PFRS 9 (2010 version) reflects the first phase on the replacement of PAS 39 and applies to theclassification and measurement of financial assets and liabilities as defined in PAS 39,Financial Instruments: Recognition and Measurement. PFRS 9 requires all financial assets tobe measured at fair value at initial recognition. A debt financial asset may, if the fair valueoption (FVO) is not invoked, be subsequently measured at amortized cost if it is held within abusiness model that has the objective to hold the assets to collect the contractual cash flowsand its contractual terms give rise, on specified dates, to cash flows that are solely payments of

- 21 -
*SGVFS008696*
principal and interest on the principal outstanding. All other debt instruments aresubsequently measured at fair value through profit or loss. All equity financial assets aremeasured at fair value either through other comprehensive income (OCI) or profit or loss.Equity financial assets held for trading must be measured at fair value through profit or loss.For FVO liabilities, the amount of change in the fair value of a liability that is attributable tochanges in credit risk must be presented in OCI. The remainder of the change in fair value ispresented in profit or loss, unless presentation of the fair value change in respect of theliability’s credit risk in OCI would create or enlarge an accounting mismatch in profit or loss.All other PAS 39 classification and measurement requirements for financial liabilities havebeen carried forward into PFRS 9, including the embedded derivative separation rules and thecriteria for using the FVO. The adoption of the first phase of PFRS 9 will have an effect onthe classification and measurement of the Group’s financial assets, but will potentially have noimpact on the classification and measurement of financial liabilities.
PFRS 9 (2010 version) is effective for annual periods beginning on or after January 1, 2015.This mandatory adoption date was moved to January 1, 2018 when the final version ofPFRS 9 was adopted by the Philippine Financial Reporting Standards Council (FRSC). Suchadoption, however, is still for approval by the Board of Accountancy (BOA).
· Philippine Interpretation IFRIC 15, Agreements for the Construction of Real EstateThis interpretation covers accounting for revenue and associated expenses by entities thatundertake the construction of real estate directly or through subcontractors. The interpretationrequires that revenue on construction of real estate be recognized only upon completion,except when such contract qualifies as construction contract to be accounted for under PAS 11or involves rendering of services in which case revenue is recognized based on stage ofcompletion. Contracts involving provision of services with the construction materials andwhere the risks and reward of ownership are transferred to the buyer on a continuous basiswill also be accounted for based on stage of completion. The SEC and the FRSC havedeferred the effectivity of this interpretation until the final Revenue standard is issued by theInternational Accounting Standards Board (IASB) and an evaluation of the requirements ofthe final Revenue standard against the practices of the Philippine real estate industry iscompleted.
Effective in 2015
· PAS 19, Employee Benefits - Defined Benefit Plans: Employee Contributions (Amendments)The amendments apply to contributions from employees or third parties to defined benefitplans. Contributions that are set out in the formal terms of the plan shall be accounted for asreductions to current service costs if they are linked to service or as part of theremeasurements of the net defined benefit asset or liability if they are not linked to service.Contributions that are discretionary shall be accounted for as reductions of current service costupon payment of these contributions to the plans. The amendments to PAS 19 are to beretrospectively applied for annual periods beginning on or after January 1, 2015. It is notexpected that this amendment would be relevant to the Group since it does not have definedbenefit plan with contributions from employees or third parties.
· Annual Improvements to PFRSs (2010-2012 cycle)The Annual Improvements to PFRSs (2010-2012 cycle) are effective for annual periodsbeginning on or after January 1, 2015 and are not expected to have material impact on theGroup. They include:

- 22 -
*SGVFS008696*
o PFRS 2, Share-based Payment – Definition of Vesting ConditionThis improvement is applied prospectively and clarifies various issues relating to thedefinitions of performance and service conditions which are vesting conditions, including:
· A performance condition must contain a service condition;· A performance target must be met while the counterparty is rendering service;· A performance target may relate to the operations or activities of an entity, or to
those of another entity in the same group;· A performance condition may be a market or non-market condition; and· If the counterparty, regardless of the reason, ceases to provide service during the
vesting period, the service condition is not satisfied.
o PFRS 3, Business Combinations – Accounting for Contingent Consideration in a BusinessCombinationThe amendment is applied prospectively for business combinations for which theacquisition date is on or after July 1, 2014. It clarifies that a contingent consideration thatis not classified as equity is subsequently measured at fair value through profit or losswhether or not it falls within the scope of PAS 39, Financial Instruments: Recognitionand Measurement (or PFRS 9, Financial Instruments, if early adopted). The Group shallconsider this amendment for future business combinations.
o PFRS 8, Operating Segments – Aggregation of Operating Segments and Reconciliation ofthe Total of the Reportable Segments’ Assets to the Entity’s AssetsThe amendments are applied retrospectively and clarify that:
· An entity must disclose the judgments made by management in applying theaggregation criteria in the standard, including a brief description of operatingsegments that have been aggregated and the economic characteristics (e.g., sales andgross margins) used to assess whether the segments are “similar.”
· The reconciliation of segment assets to total assets is only required to be disclosed ifthe reconciliation is reported to the chief operating decision maker, similar to therequired disclosure for segment liabilities.
o PAS 16, Property, Plant and Equipment, and PAS 38, Intangible Assets – RevaluationMethod – Proportionate Restatement of Accumulated Depreciation and AmortizationThe amendment is applied retrospectively and clarifies in PAS 16 and PAS 38 that theasset may be revalued by reference to the observable data on either the gross or the netcarrying amount. In addition, the accumulated depreciation or amortization is thedifference between the gross and carrying amounts of the asset.
o PAS 24, Related Party Disclosures – Key Management PersonnelThe amendment is applied retrospectively and clarifies that a management entity, which isan entity that provides key management personnel services, is a related party subject to therelated party disclosures. In addition, an entity that uses a management entity is requiredto disclose the expenses incurred for management services.

- 23 -
*SGVFS008696*
· Annual Improvements to PFRSs (2011-2013 cycle)The Annual Improvements to PFRSs (2011-2013 cycle) are effective for annual periodsbeginning on or after January 1, 2015 and are not expected to have a material impact on theGroup. They include:
o PFRS 3, Business Combinations – Scope Exceptions for Joint ArrangementsThe amendment is applied prospectively and clarifies the following regarding the scopeexceptions within PFRS 3:
· Joint arrangements, not just joint ventures, are outside the scope of PFRS 3;· This scope exception applies only to the accounting in the financial statements of the
joint arrangement itself.
o PFRS 13, Fair Value Measurement – Portfolio ExceptionThe amendment is applied prospectively and clarifies that the portfolio exception in PFRS13 can be applied not only to financial assets and financial liabilities, but also to othercontracts within the scope of PAS 39.
o PAS 40, Investment PropertyThe amendment is applied prospectively and clarifies that PFRS 3, and not the descriptionof ancillary services in PAS 40, is used to determine if the transaction is the purchase ofan asset or business combination. The description of ancillary services in PAS 40 onlydifferentiates between investment property and owner-occupied property.
Effective in 2016
· PAS 16, Property, Plant and Equipment, and PAS 38, Intangible Assets – Clarification ofAcceptable Methods of Depreciation and Amortization (Amendments)The amendments clarify the principle in PAS 16 and PAS 38 that revenue reflects a pattern ofeconomic benefits that are generated from operating a business (of which the asset is part)rather than the economic benefits that are consumed through use of the asset. As a result, arevenue-based method cannot be used to depreciate property, plant and equipment and mayonly be used in very limited circumstances to amortize intangible assets. The amendments areeffective prospectively for annual periods beginning on or after January 1, 2016, with earlyadoption permitted. These amendments are not expected to have any impact to the Groupgiven that the Group has not used a revenue-based method to depreciate its noncurrent assets.
· PAS 16, Property, Plant and Equipment, and PAS 41, Agriculture – Bearer Plants(Amendments)The amendments change the accounting requirements for biological assets that meet thedefinition of bearer plants. Under the amendments, biological assets that meet the definition ofbearer plants will no longer be within the scope of PAS 41. Instead, PAS 16 will apply. Afterinitial recognition, bearer plants will be measured under PAS 16 at accumulated cost (beforematurity) and using either the cost model or revaluation model (after maturity). Theamendments also require that produce that grows on bearer plants will remain in the scope ofPAS 41 measured at fair value less costs to sell. For government grants related to bearerplants, PAS 20, Accounting for Government Grants and Disclosure of Government Assistance,will apply. The amendments are retrospectively effective for annual periods beginning on orafter January 1, 2016, with early adoption permitted. These amendments are not expected tohave any impact to the Group as it does not have any bearer plants.

- 24 -
*SGVFS008696*
· PAS 27, Separate Financial Statements – Equity Method in Separate Financial Statements(Amendments)The amendments will allow entities to use the equity method to account for investments insubsidiaries, joint ventures, and associates in their separate financial statements. Entitiesalready applying PFRS and electing to change to the equity method in its separate financialstatements will have to apply that change retrospectively. For first-time adopters of PFRSelecting to use the equity method in its separate financial statements, they will be required toapply this method from the date of transition to PFRS. The amendments are effective forannual periods beginning on or after January 1, 2016, with early adoption permitted. Theseamendments will not have any impact on the consolidated financial statements.
· PFRS 10, Consolidated Financial Statements and PAS 28, Investments in Associates and JointVentures – Sale or Contribution of Assets between an Investor and its Associate or JointVentureThese amendments address an acknowledged inconsistency between the requirements inPFRS 10 and those in PAS 28 (2011) in dealing with the sale or contribution of assets betweenan investor and its associate or joint venture. The amendments require that a full gain or loss isrecognized when a transaction involves a business (whether it is housed in a subsidiary ornot). A partial gain or loss is recognized when a transaction involves assets that do notconstitute a business, even if these assets are housed in a subsidiary. These amendments areeffective from annual periods beginning on or after January 1, 2016. These amendments willnot have any impact on the consolidated financial statements.
· PFRS 11, Joint Arrangements – Accounting for Acquisitions of Interests in Joint Operations(Amendments)The amendments to PFRS 11 require that a joint operator accounting for the acquisition of aninterest in a joint operation, in which the activity of the joint operation constitutes a businessmust apply the relevant PFRS 3 principles for business combinations accounting. Theamendments also clarify that a previously held interest in a joint operation is not remeasuredon the acquisition of an additional interest in the same joint operation while joint control isretained. In addition, a scope exclusion has been added to PFRS 11 to specify that theamendments do not apply when the parties sharing joint control, including the reporting entity,are under common control of the same ultimate controlling party.
The amendments apply to both the acquisition of the initial interest in a joint operation and theacquisition of any additional interests in the same joint operation and are prospectivelyeffective for annual periods beginning on or after January 1, 2016, with early adoptionpermitted. These amendments are not expected to have any impact to the Group.
· PFRS 14, Regulatory Deferral AccountsPFRS 14 is an optional standard that allows an entity, whose activities are subject torate-regulation, to continue applying most of its existing accounting policies for regulatorydeferral account balances upon its first-time adoption of PFRS. Entities that adopt PFRS 14must present the regulatory deferral accounts as separate line items on the statement offinancial position and present movements in these account balances as separate line items inthe statement of profit or loss and other comprehensive income. The standard requiresdisclosures on the nature of, and risks associated with, the entity’s rate-regulation and theeffects of that rate-regulation on its financial statements. PFRS 14 is effective for annualperiods beginning on or after January 1, 2016. Since the Group is an existing PFRS preparer,this standard would not apply.

- 25 -
*SGVFS008696*
· Annual Improvements to PFRSs (2012-2014 cycle)The Annual Improvements to PFRSs (2012-2014 cycle) are effective for annual periodsbeginning on or after January 1, 2016 and are not expected to have a material impact on theGroup. They include:
o PFRS 5, Non-current Assets Held for Sale and Discontinued Operations – Changes inMethods of DisposalThe amendment is applied prospectively and clarifies that changing from a disposalthrough sale to a disposal through distribution to owners and vice-versa should not beconsidered to be a new plan of disposal, rather it is a continuation of the original plan.There is, therefore, no interruption of the application of the requirements in PFRS 5. Theamendment also clarifies that changing the disposal method does not change the date ofclassification.
o PFRS 7, Financial Instruments: Disclosures – Servicing ContractsPFRS 7 requires an entity to provide disclosures for any continuing involvement in atransferred asset that is derecognized in its entirety. The amendment clarifies that aservicing contract that includes a fee can constitute continuing involvement in a financialasset. An entity must assess the nature of the fee and arrangement against the guidance inPFRS 7 in order to assess whether the disclosures are required. The amendment is to beapplied such that the assessment of which servicing contracts constitute continuinginvolvement will need to be done retrospectively. However, comparative disclosures arenot required to be provided for any period beginning before the annual period in which theentity first applies the amendments.
o PFRS 7, Applicability of the Amendments to PFRS 7 to Condensed Interim FinancialStatementsThis amendment is applied retrospectively and clarifies that the disclosures on offsettingof financial assets and financial liabilities are not required in the condensed interimfinancial report unless they provide a significant update to the information reported in themost recent annual report.
o PAS 19, Employee Benefits – regional market issue regarding discount rateThis amendment is applied prospectively and clarifies that market depth of high qualitycorporate bonds is assessed based on the currency in which the obligation is denominated,rather than the country where the obligation is located. When there is no deep market forhigh quality corporate bonds in that currency, government bond rates must be used.
o PAS 34, Interim Financial Reporting – disclosure of information ‘elsewhere in the interimfinancial report’The amendment is applied retrospectively and clarifies that the required interimdisclosures must either be in the interim financial statements or incorporated by cross-reference between the interim financial statements and wherever they are included withinthe greater interim financial report (e.g., in the management commentary or risk report).
Effective in 2018
· PFRS 9, Financial Instruments – Hedge Accounting and amendments to PFRS 9, PFRS 7 andPAS 39 (2013 version)PFRS 9 (2013 version) already includes the third phase of the project to replace PAS 39 whichpertains to hedge accounting. This version of PFRS 9 replaces the rules-based hedgeaccounting model of PAS 39 with a more principles-based approach. Changes include

- 26 -
*SGVFS008696*
replacing the rules-based hedge effectiveness test with an objectives-based test that focuses onthe economic relationship between the hedged item and the hedging instrument, and the effectof credit risk on that economic relationship; allowing risk components to be designated as thehedged item, not only for financial items but also for non-financial items, provided that therisk component is separately identifiable and reliably measurable; and allowing the time valueof an option, the forward element of a forward contract and any foreign currency basis spreadto be excluded from the designation of a derivative instrument as the hedging instrument andaccounted for as costs of hedging. PFRS 9 also requires more extensive disclosures for hedgeaccounting.
PFRS 9 (2013 version) has no mandatory effective date. The mandatory effective date ofJanuary 1, 2018 was eventually set when the final version of PFRS 9 was adopted by theFRSC. The adoption of the final version of PFRS 9, however, is still for approval by the BOA.
Management is still assessing the impact of the adoption of PFRS 9 in the consolidatedfinancial statements.
· PFRS 9, Financial Instruments (2014 or final version)In July 2014, the final version of PFRS 9, Financial Instruments, was issued. PFRS 9 reflectsall phases of the financial instruments project and replaces PAS 39, Financial Instruments:Recognition and Measurement, and all previous versions of PFRS 9. The standard introducesnew requirements for classification and measurement, impairment, and hedge accounting.PFRS 9 is effective for annual periods beginning on or after January 1, 2018, with earlyapplication permitted. Retrospective application is required, but comparative information isnot compulsory. Early application of previous versions of PFRS 9 is permitted if the date ofinitial application is before February 1, 2015.
Management is still assessing the impact of the adoption of PFRS 9 in the consolidatedfinancial statements.
Issued by the IASB but not yet adopted by the FRSC
· IFRS 15 Revenue from Contracts with CustomersIFRS 15 was issued in May 2014 and establishes a new five-step model that will apply torevenue arising from contracts with customers. Under IFRS 15 revenue is recognized at anamount that reflects the consideration to which an entity expects to be entitled in exchange fortransferring goods or services to a customer. The principles in IFRS 15 provide a morestructured approach to measuring and recognizing revenue. The new revenue standard isapplicable to all entities and will supersede all current revenue recognition requirements underIFRS. Either a full or modified retrospective application is required for annual periodsbeginning on or after January 1, 2017 with early adoption permitted. The Grouop is currentlyassessing the impact of IFRS 15 and plans to adopt the new standard on the required effectivedate once adopted locally.
3. Significant Accounting Judgments, Estimates and Assumptions
The preparation of the consolidated financial statements requires management to make judgments,estimates and assumptions that affect the amounts reported in the consolidated financialstatements and accompanying notes.

- 27 -
*SGVFS008696*
In the opinion of management, these consolidated financial statements reflect all adjustmentsnecessary to present fairly the results for the periods presented. Actual results could differ fromsuch estimates.
JudgmentsIn the process of applying the Group’s accounting policies, management has made the followingjudgments, apart from those involving estimations, which has the most significant effect on theamounts recognized in the consolidated financial statements:
Determination of the Parent Company’s functional currencyThe Group, based on the relevant economic substance of the underlying circumstances, hasdetermined its functional currency to be Peso. It is the currency that influences the Group’s sale ofreal estate properties and the cost of selling the same.
Revenue recognitionSelecting the appropriate revenue recognition method for particular real estate transaction requirescertain judgments based on the following, among others:
· Collectability of sales priceCollectability of the sales price is demonstrated by the buyer’s commitment to pay, which inturn, is supported by substantial initial and continuing investments that gives the buyer a stakein the property sufficient that risk of loss through default motivates the buyer to honor hisobligation. Collectability is also assessed by considering factors such as the credit standing ofthe buyer, age, and location of the property.
For sale of real estate properties, in determining whether the sales prices are collectible, theGroup considers that initial and continuing investments by the buyer of about 10% woulddemonstrate the buyer’s commitment to pay.
· Stage of completion of the projectThe Group commences the recognition of revenue from sale of uncompleted projects wherethe POC method is used when the POC, as determined by independent project engineers,ranges from 5% to 10%. It is the period when the Group considers that the construction isbeyond preliminary stage (i.e., engineering, design work, construction contracts execution, siteclearance and preparation, excavation and the building foundation are finished).
Classification of financial instrumentsThe Group classifies a financial instrument, or its component parts, on initial recognition as afinancial asset, a financial liability or an equity instrument in accordance with the substance of thecontractual arrangement and the definitions of a financial asset, a financial liability or an equityinstrument. The substance of a financial instrument, rather than its legal form, governs itsclassification in the Group’s consolidated balance sheet (see Note 26).
The Group determines the classification at initial recognition and, where allowed and appropriate,and re-evaluates this designation at every reporting date.
Operating lease commitments – Group as lessorThe Group has entered into commercial property leases on its investment property portfolio. TheGroup has determined that it retains all significant risks and rewards of ownership of theproperties as the Group considered, among others, the length of the lease term as compared withthe estimated life of the assets.

- 28 -
*SGVFS008696*
A number of the Group’s operating lease contracts are accounted for as noncancellable operatingleases and the rest are cancellable. In determining whether a lease contract is cancellable or not,the Group considers among others, the significance of the penalty, including the economicconsequence to the lessee.
Distinction between investment properties and owner-occupied propertiesThe Group determines whether a property qualifies as investment property. In making itsjudgment, the Group considers whether the property generates cash flows largely independent ofthe other assets held by an entity. Owner-occupied properties generate cash flows that areattributable not only to property but also to the other assets used for administrative purposes.
Some properties comprise a portion that is held to earn rentals or for capital appreciation andanother portion that is held for use for administrative purposes. If these portions cannot be soldseparately at the reporting date, the property is accounted for as investment property only if aninsignificant portion is held for use for administrative purposes. Judgment is applied indetermining whether ancillary services are so significant that a property does not qualify asinvestment property. The Group considers each property separately in making its judgment.
Investment properties amounted to P=2,940.48 million as of December 31, 2014and P=2,688.71 million as of December 31, 2013 (see Note 10). Property and equipmentamounted to P=18.34 million as of December 31, 2014 and P=26.67 million as ofDecember 31, 2013 (see Note 11).
Distinction between real estate properties for sale and investment propertiesThe Group determines whether a property is classified as for sale, for lease and for capitalappreciation.
Real estate properties which the Group develops and intends to sell before or on completion ofconstruction are classified as real estate properties for sale. Real estate properties for saleamounted to P=2,875.01 million and P=3,121.46 million as of December 31, 2014and 2013, respectively (see Note 8). Real estate properties which are not occupied substantially foruse by, or in the operations of the Group, nor for sale in the ordinary course of business, but areheld primarily to earn rental income and capital appreciation are classified as investmentproperties. Investment properties amounted to P=2,940.48 million and P=2,688.71 million as ofDecember 31, 2014 and 2013, respectively (see Note 10).
Distinction between real estate properties for sale and held for future developmentThe Group determines whether a property will be classified as real estate properties for sale orheld for future development. In making this judgment, the Group considers whether the propertywill be sold in the normal operating cycle (real estate properties for sale) or whether it will beretained as part of the Group’s strategic landbanking activities for development or sale in themedium or long-term (real estate properties held for future development). Real estate propertiesfor sale amounted to P=2,875.01 million and P=3,121.46 as of December 31, 2014 and 2013,respectively (see Note 8). Real estate properties held for future development amountedto P=1,385.75 million and P=1,250.01 million as of December 31, 2014 and 2013, respectively(see Note 9).

- 29 -
*SGVFS008696*
EstimatesThe key assumptions concerning the future and other key sources of estimation uncertainty at theend of reporting period that have a significant risk of causing a material adjustment to the carryingamounts of assets and liabilities within the next financial year are discussed below:
Revenue and cost recognitionThe Group’s revenue recognition and cost policies require management to make use of estimatesand assumptions that may affect the reported amount of revenue and cost. The Group’s revenuefrom real estate properties based on the POC is measured principally on the basis of the estimatedcompletion of a physical proportion of the contract work.
Estimation of POC of projectsThe Group’s revenue recognition policies require management to make use of estimates andassumptions that may affect the reported amounts of revenue and cost. The Group estimates thepercentage of completion of ongoing projects for purposes of accounting for the estimated costs ofdevelopment as well as revenue to be recognized. Actual costs of development could differ fromthese estimates. Such estimates will be adjusted accordingly when the effects become reasonablydeterminable.
The POC is based on the technical evaluation of the independent project engineers as well asmanagement’s monitoring of the costs, progress and improvements of the projects. Gross profit onsales of real estate properties amounted to P=994.21 million, P=988.77 million and P=758.29 millionin 2014, 2013 and 2012, respectively. In 2013, the Group reversed the excess estimateddevelopment cost over actual costs of completed projects amounting to P=119.74 million whichwas recognized under “Other income” in the 2013 consolidated statement of income(see Note 22).
Determination of fair value of financial instrumentsFinancial assets and financial liabilities, on initial recognition, are accounted for at fair value. Thefair values of financial assets and financial liabilities, on initial recognition, are normally thetransaction prices. In the case of those financial assets and financial liabilities that have no activemarkets, fair values are determined using an appropriate valuation technique. The fair values offinancial instruments are disclosed in Note 26.
Estimation of allowance for impairment of receivablesThe level of this allowance is evaluated by management based on past collection history and otherfactors which include, but are not limited to the length of the Group’s relationship with thecustomer, the customer’s payment behavior and known market factors that affect the collectabilityof the accounts. As of December 31, 2014 and 2013, installment contracts receivable and otherreceivables aggregated to P=2,269.82 million and P=2,148.52 million, respectively. There was noimpairment of receivables in 2014, 2013 and 2012 (see Notes 6 and 7).
Impairment of available-for-sale financial assetsAn impairment issue arises when there is an objective evidence of impairment, which involvessignificant judgment. In making this judgment, the Group evaluates the financial health of theissuer, among others. The Group treats available-for-sale equity financial assets as impaired whenthere has been a significant or prolonged decline in the fair value below its cost or where otherobjective evidence of impairment exists. The Group treats ‘significant’ generally as 20% or moreof cost and ‘prolonged’ as greater than 12 months for quoted equity securities. In addition, theGroup evaluates other factors, including normal volatility in share price for quoted equities and thefuture cash flows and the discount factors for unquoted equities.

- 30 -
*SGVFS008696*
Available-for-sale financial assets amounted to P=2.52 million and P=2.21 million as ofDecember 31, 2014 and 2013, respectively (see Note 12).
Determination of net realizable value of real estate properties for sale and held for futuredevelopmentThe Group’s estimates of net realizable value of inventories are based on the most reliableevidence available at the time the estimates are made, or the amount that the inventories areexpected to be realized. These estimates consider the fluctuations of price or cost directly relatingto events occurring after the end of the reporting period to the extent that such events confirmconditions existing at the end of the period. A new assessment is made of net realizable value ineach subsequent period. When the circumstances that previously caused inventories to be writtendown below cost no longer exist or when there is a clear evidence of an increase in net realizablevalue because of changes in economic circumstances, the amount of the write-down is reversed sothat the new carrying amount is the lower of the cost and the revised net realizable value. TheGroup’s real estate properties for sale and held for future development as of December 31, 2014and 2013 amounted to P=4,260.76 million and P=4,371.48 million, respectively (see Notes 8 and 9).
Estimation of useful lives of investment properties and property and equipmentThe Group estimates the useful lives of investment properties and property and equipment basedon the internal technical evaluation and experience with similar assets. Estimated lives ofinvestment properties and property and equipment are reviewed periodically and updated ifexpectations differ from previous estimates due to wear and tear, technical and commercialobsolescence and other limits on the use of the assets. As of December 31, 2014 and 2013, netbook value of depreciable investment properties amounted to P=370.33 million andP=10.04 million, respectively (see Note 10). On the other hand, the carrying value of property andequipment amounted to P=18.34 million and P=26.67 million as of December 31, 2014 and 2013,respectively (see Note 11).
Determination of the fair value of investment propertiesThe Company discloses the fair values of its investment properties in accordance with PAS 40,Investment Properties, the Company engaged independent valuation specialist to assess fair valueas of December 31, 2014 and 2013. The Company’s investment properties consist of land andbuilding pertaining to commercial properties. These are valued by reference to sales of similar orsubstitute properties and other related market data had the investment properties been transacted inthe market. The significant unobservable inputs used in determining the fair value are the salesprice per square meter of similar or substitute property, location, size, shape of lot and the highestand best use. Another method used in determining the fair value of land properties is based on themarket data approach. The value of land is based on sales and listings of comparable propertyregistered within the vicinity. This requires adjustments of comparable property by reducingreasonable comparative sales and listings to a common denominator by adjusting the differencebetween the subject property and those actual sales and listings regarded as comparables. Thecomparison is premised on the factors of location; size and shape of the lot; time element andothers.

- 31 -
*SGVFS008696*
Impairment of investment properties and property and equipmentThe Group determines whether its investment properties and property and equipment are impairedwhen impairment indicators exist such as significant underperformance relative to expectedhistorical or projected future operating results and significant negative industry or economictrends. When an impairment indicator is noted, the Group makes an estimation of the value-in-useof the cash-generating units to which the assets belong. Estimating the value-in-use requires theGroup to make an estimate of the expected future cash flows from the cash-generating unit andalso to choose an appropriate discount rate in order to calculate the present value of those cashflows. Net book value of investment properties as of December 31, 2014 and 2013 amounted toP=2,940.48 million and P=2,688.71 million, respectively (see Note 10). On the other hand, the netbook value of property and equipment amounted to P=18.34 million and P=26.67 million as ofDecember 31, 2014 and 2013, respectively (see Note 11).
Estimation of retirement benefits costThe cost of the defined benefit plan and the present value of the defined benefit obligation aredetermined using actuarial valuations. An actuarial valuation involves making variousassumptions that may differ from actual developments in the future. These include thedetermination of the discount rate, future salary increases, mortality rates and future pensionincreases. Due to the complexities involved in the valuation and its long-term nature, a definedbenefit obligation is highly sensitive to changes in these assumptions. All assumptions arereviewed at each reporting date.
In determining the appropriate discount rate, management considers the PDEX PDST-R2 rates atvarious tenors, rates for intermediate durations were interpolated and the rates were then weightedby the expected benefits payments at those durations to arrive at the single weighted averagediscount rate.
The mortality rate is based on publicly available mortality table in the Philippines. Future salaryincreases are based on expected future inflation rates. Further details about assumptions used aregiven in Note 23.
Net retirement benefits costs amounted to P=2.53 million, P=2.43 million and P=7.50 million in 2014,2013 and 2012, respectively. Retirement plan assets amounted to P=11.98 million andP=9.97 million as of December 31, 2014 and 2013, respectively (see Note 23).
Estimation of pre-need and other reservesPre-need reserve is set-up for all pre-need benefits guaranteed and payable by CPI as defined inthe pre-need plan contracts. The determination of pre-need reserves is based on the actuarialformula, methods and assumptions allowed by applicable SEC and IC circulars.
As of December 31, 2014 and 2013, the principal assumptions used in determining the pre-needreserves were based on the IC Circular Letter No. 23-2012 dated November 28, 2012. Thetransitory discount interest rate used in the valuation of pre-need reserves should not exceed thelower of the attainable rates as certified by the Trustee of 4.84% and the IC rate of 8% in 2014 andlower of the attainable rates as certified by the Trustee of 5.81% and the IC rate of 8% in 2013.

- 32 -
*SGVFS008696*
The following are the assumptions used in the computation of pre-need reserves:
December 31, 2014:
a. Currently-Being-Paid Pension Plans - Actively Paying Plans
· Plans issued prior to 2006 and after - 4.84% discount rate (ROI rate) and nosurrender/lapse rates were used.
b. Currently-Being-Paid Pension Plans - Lapsed Plans
· Plans issued prior to 2006 and after - reserves equal the termination values (as originallycomputed) at the date of lapse and no reinstatement rate was assumed.
c. Fully paid plans - Availing and Not Yet Availing
· Plans with maturity dates in years 2012 and after - 4.84% discount rate (ROI rate) and nosurrender rates were assumed for fully paid plans.
December 31, 2013:
a. Currently-Being-Paid Pension Plans - Actively Paying Plans· Plans issued prior to 2006 and after - 5.81% discount rate (ROI rate) and no
surrender/lapse rates were used.
b. Currently-Being-Paid Pension Plans - Lapsed Plans
· Plans issued prior to 2006 and after - reserves equal the termination values (as originallycomputed) at the date of lapse and no reinstatement rate was assumed.
c. Fully paid plans - Availing and Not Yet Availing
· Plans with maturity dates in years 2012 and after - 5.81% discount rate (ROI rate) and nosurrender rates were assumed for fully paid plans.
December 31, 2012:
a. Currently-Being-Paid Pension Plans - Actively Paying Plans
· Plans issued prior to 2006 and after - 8% discount rate (IC rate) and no surrender/lapserates were used.
b. Currently-Being-Paid Pension Plans - Lapsed Plans
· Plans issued prior to 2006 and after - reserves equal the termination values (as originallycomputed) at the date of lapse and no reinstatement rate was assumed.
c. Fully paid plans - Availing and Not Yet Availing

- 33 -
*SGVFS008696*
· Plans with maturity dates in years 2012 and after - 8% discount rate (IC rate) and nosurrender rates were assumed for fully paid plans.
Management believes that the amount of pre-need reserves and other reserves recorded in thebooks closely reflect potential plan claims as of end of reporting period. As of December 31, 2014and 2013, pre-need reserve and other reserves amounted to P=55.01 million and P=52.63 million,respectively (see Note 5).
Recognition of deferred income tax assetsThe Group reviews the carrying amounts of deferred income tax assets at the end of each reportingperiod and reduces deferred income tax assets to the extent that it is no longer probable thatsufficient future taxable profits will be available to allow all or part of deferred income tax assetsto be utilized.
As of December 31, 2014 and 2013, deferred income tax assets amountedto P=13.56 million and P=19.74 million, respectively (see Note 24).
4. Cash and Cash Equivalents and Short-term Cash Investments
Cash and cash equivalents consist of:
2014 2013Cash on hand and in banks P=33,991,698 P=20,543,381Cash equivalents 1,334,688,564 814,771,697
P=1,368,680,262 P=835,315,078
Cash in banks earn interest at the respective bank deposit rates. Cash equivalents are made forvarying periods of up to three months depending on the immediate cash requirements of the Groupand earn interest at the respective short-term investment rates.
Short-term cash investments amounting to P=1,461.21 million and P=2,265.61 million as ofDecember 31, 2014 and 2013, respectively, are placements in banks with maturities of more thanthree months to one year from dates of acquisition and earn interest at the prevailing market rates.
Interest income earned from cash in banks, cash equivalents and short-term cash investmentsamounted to P=46.53 million, P=87.71 million and P=128.65 million in 2014, 2013 and 2012,respectively (Note 20).
5. Investments in Trust Funds and Pre-need and Other Reserves
Investments in trust funds Pursuant to the provisions of the SEC Memorandum Circular No. 6, Guidelines on the
Management of the Trust Fund of Pre-Need Corporation (SEC Circular No. 4), the SEC requires,among others, that companies engaged in the sale of pre-need plans and similar contracts toplanholders set up a trust fund to guarantee the delivery of property or performance of service inthe future. Withdrawals from these trust funds are limited to, among others, payments of pensionplan benefits, bank charges and investment expenses in the operation of the trust funds,

- 34 -
*SGVFS008696*
termination value payable to plan holders, contributions to the trust funds of cancelled plans andfinal taxes on investment income of the trust funds.
In accordance with the SEC requirements, CPI has funds deposited with two local trusteebanks with net assets aggregating to P=38.11 million and P=36.51 million as of December 31, 2014and 2013, respectively, which are recorded under “Investments in trust funds” account in theconsolidated balance sheets.
The details of investments in trust funds as of December 31 are as follows:
2014 2013AssetsCash and cash equivalents P=4,730,869 P=4,009,545Debt and listed equity securities 27,104,233 27,527,409Investment properties 6,162,000 4,458,781Others 400,895 739,450
38,397,997 36,735,185Liabilities (292,647) (222,702)
P=38,105,350 P=36,512,483Less noncurrent portion 36,418,627 34,451,443
P=1,686,723 P=2,061,040
Total contributions to the trust funds amounted to P=2.40 million and P=1.22 million in 2014 and2013, respectively.
Pre-need and other reservesDetails of pre-need and other reserves are as follows:
2014 2013Transitory pre-need reserves P=33,939,082 P=34,096,538Reserve for trust fund deficiency 19,756,197 17,083,018Pension bonus reserve 1,034,940 1,138,132Insurance premium reserve (Note 8) 275,360 307,713
55,005,579 52,625,401Less noncurrent portion 53,318,856 50,564,361
P=1,686,723 2,061,040
In the opinion of management and the independent actuary, the CPI’s net contractual liabilitiesamounting to P=53.70 million and P=51.18 million in 2014 and 2013, respectively, which is basedon the actuarial reports, closely reflect actual potential plan claims as of those dates.
In accordance with IC Circular Letter No. 23-2012 issued on November 28, 2012, the Groupcomputed for the transitory pre-need reserves which amounted to P=33.94 million andP=34.10 million as of December 31, 2014 and 2013, respectively. If the resulting pre-need reserveis greater than the actual trust fund balance at the end of the year, the transitory pre-need reservesshall be computed in accordance with the schedule provided in the IC Circular Letter.
Although not required, in 2014 and 2013, the BOD has deemed it prudent and opted to set-up thedifference in net contractual liabilities and transitory pre-need reserve amounting P=19.76 million

- 35 -
*SGVFS008696*
and P=17.08 million under “Other reserves” account as of December 31, 2014 and 2013,respectively, which is to be funded for the next seven years.
The trust fund deficiency amounting to P=2.82 million and P=2.14 million in 2014 and 2013,respectively, should be placed in the trust fund within 60 days from April 30 following thevaluation date. The trust fund deficiency for the year represents the difference of pre-need reserveand trust fund investment, net of investment in trust funds allocated to pension bonus andunrealized gains.
6. Installment Contracts Receivable
2014 2013Installment contracts receivable P=2,189,980,491 P=2,079,123,188Less noncurrent portion 1,538,977,367 1,632,754,978
P=651,003,124 P=446,368,210
Installment contracts receivable arise from sales of real estate properties and are collectible inmonthly installments for periods ranging from one to 10 years and bear monthly interest rates of0.67% to 2.00%, in 2014, 2013 and 2012 computed on the diminishing balance. Interest incomeearned from installment contracts receivable amounted to P=352.92 million, P=402.81 million andP=480.90 million in 2014, 2013 and 2012, respectively (see Note 20).
The Company, CLDI, and CDC entered into a contract of guaranty under Retail Guaranty Line inthe amount of P=1.00 billion in 2013 with Home Guaranty Corporation (HGC). The amount ofinstallment contracts receivable enrolled and renewed by the Group amounted to P=1,803.00million and P=2,062.63 million in 2014 and 2013, respectively. The Group paid a guaranteepremium of 1.00% based on the outstanding principal balance of the receivables enrolled in 2014and 2013.
7. Other Receivables
Other receivables consist of:
2014 2013Advances to:
Customers P=31,017,587 P=31,966,519Contractors 9,236,183 10,962,168
Rent receivable 13,221,900 –Accrued interest 6,616,270 10,113,550Retention 4,122,971 3,983,579Others (Note 25) 15,625,375 12,372,276
79,840,286 69,398,092Less noncurrent portion 10,861,948 11,999,398
P=68,978,338 P=57,398,694
Advances to customers are receivables of the Group for the real estate property taxes of sold unitswhile advances to contractors are advances made by the Group for the contractors’ supplyrequirements.

- 36 -
*SGVFS008696*
Rent receivable arose from the investment properties rented-out under non-cancellable long-termoperating lease contracts (see Note 10).
Other receivables include receivables from customers relating to registration of title and otherexpenses initially paid by the Group on behalf of the buyers and employees’ advances.
8. Real Estate Properties for Sale
Real estate properties for sale consist of costs incurred in the development of condominium unitsand residential houses for sale.
The movement of investment of real estate properties for sale follows:
2014 2013Balances at beginning of year P=3,121,463,065 P=2,751,022,614Disposals (cost of real estate sales) (1,358,934,761) (1,038,202,266)Construction/development costs incurred 946,241,885 1,339,417,052Transfer from real estate properties held for future
development (Note 9) 241,594,252 –Transfer from (to) investment properties (Note 10) (101,600,228) 28,046,100Borrowing costs capitalized (Notes 14 and 21) 9,249,122 18,099,605Transfer from property and equipment (Note 11) – 3,775,795Other adjustments 16,993,162 19,304,165Balances at end of year P=2,875,006,497 P=3,121,463,065
Real estate properties for sale account includes capitalized interest costs incurred during each yearin connection with the development of the. The average capitalization rates used to determine theamount of borrowing costs eligible for capitalization were 1.07%, 2.17% and 3.80% in 2014, 2013and 2012, respectively.
Real estate properties for sale includes deemed cost adjustment amounting to P=88.41 million andP=115.51 million as of December 31, 2014 and 2013, respectively (see Note 15). The deemed costadjustment arose when the Group transitioned to PFRS in 2005.
Other adjustments include realized deemed cost adjustment and the fair value less cost to sell ofrepossessed real estate properties for sale during the year.

- 37 -
*SGVFS008696*
9. Real Estate Properties Held for Future Development
Real estate properties held for future development includes land properties reserved by the Groupfor its future condominium projects.
Movements of real estate properties held for future development are follows:
2014 2013Balances at beginning of the year P=1,250,014,900 P=1,427,142,414Additions 392,844,305 27,560,538Transfer to real estate properties for sale (Note 8) (241,594,252) –Transfer to investment properties (Note 10) (15,515,136) (204,388,198)Disposal – (299,854)Balances at end of the year P=1,385,749,817 P=1,250,014,900
In 2014, CDC and CLDI acquired a parcel of land for future development amountingto P=158.34 million and P=229.82 million, respectively. Also, in 2013, CI acquired a parcel of landamounting to P=15.51 million held for future development.
10. Investment Properties
Investment properties consist of:
2014 2013Real estate properties for lease P=1,991,783,006 P=1,740,014,392Real estate properties held for capital appreciation 948,700,000 948,700,000
P=2,940,483,006 P=2,688,714,392
Movements of investment properties are as follows:
2014
Land BuildingMachinery and
EquipmentConstruction in
Progress TotalCostBalances at beginning of year P=2,504,565,040 P=75,662,921 P=– P=174,105,758 P=2,754,333,719Additions 765,873 39,623,733 6,926,964 113,058,019 160,374,589Capitalized interest – – – 2,187,114 2,187,114Transfer from real estate
properties for sale (Note 8) – 101,600,228 – – 101,600,228Transfer from real estate
properties held for futuredevelopment (Note 9) 15,515,136 – – – 15,515,136
Reclassification – 231,237,334 8,803,571 (240,040,905) –Balances at end of year 2,520,846,049 448,124,216 15,730,535 49,309,986 3,034,010,786Accumulated DepreciationBalances at beginning of year – 65,619,327 – – 65,619,327Depreciation for the year – 25,958,859 1,949,594 – 27,908,453Balances at end of year – 91,578,186 1,949,594 – 93,527,780Net Book Value P=2,520,846,049 P=356,546,030 13,780,941 P=49,309,986 P=2,940,483,006

- 38 -
*SGVFS008696*
2013
Land BuildingConstruction in
Progress TotalCostBalances at beginning of year P=2,327,303,398 P=75,662,921 P=9,299,783 P=2,412,266,102Additions 919,543 – 160,622,635 161,542,178Capitalized interest – – 4,183,340 4,183,340Transfer to real estate
properties for sale (Note 8) (28,046,099) – – (28,046,099)Transfer from real estate properties held
for future development (Note 9) 204,388,198 – – 204,388,198Balances at end of year 2,504,565,040 75,662,921 174,105,758 2,754,333,719Accumulated DepreciationBalances at beginning of year – 61,995,022 – 61,995,022Depreciation for the year – 3,624,305 – 3,624,305Balances at end of year – 65,619,327 – 65,619,327Net Book Value P=2,504,565,040 P=10,043,594 P=174,105,758 P=2,688,714,392
In 2013, CDC started construction of CityNet1 which was completed in 2014. CityNet1 wasregistered with the Philippine Economic Zone Authority (PEZA) on March 3, 2014 withRegistration No. EZ14-04. CDC leases out this property to a Business Process Outsourcing (BPO)company which is also a PEZA-registered entity. Also in 2014, CDC started the construction of anew building which is still uncompleted as of December 31, 2014. The net book values of landand building include deemed cost adjustment amounting to P=1,452.03 million as of December 31,2014 and 2013 (see Note 15). The deemed cost adjustment arose when the Group transitioned toPFRS in 2005.
Based on the appraisal reports by independent firms of appraisers using market data approach atvarious dates in 2014 and 2013, the appraised value of these investment properties amounted toP=4,854.20 million and P=4,387.35 million as of the dates of appraisal (see Note 26).
CDC entered into non-cancellable operating lease contracts with various third parties. One leasecontract with a fast food outlet started in November 2011 with a term of 10 years. In 2014, theCompany entered into lease contracts with a BPO company with a term of six years and with aconvenience store with a term of five years. These lease contracts include clauses to enableperiodic upward revision of the rental charge according to prevailing market conditions.
The future minimum lease payments for these lease agreements as of December 31 are as follows:
2014 2013Within one year P=55,522,413 P=4,474,308After one year but not more than five years 238,293,487 27,527,368Later than five years 12,526,704 12,934,023
P=306,342,604 P=44,935,699
Other lease agreements with third parties are generally for a one-year term renewable every year.
Rent income from investment properties amounted to P=93.88 million, P=38.55 million andP=33.87 million in 2014, 2013 and 2012, respectively.
Direct operating expenses on investment properties amounted to P=44.60 million, P=17.93 millionand P=21.08 million pertaining to real estate taxes, depreciation and other expenses in 2014, 2013and 2012, respectively.

- 39 -
*SGVFS008696*
11. Property and Equipment
Property and equipment consist of:
2014Furniture,
Fixtures and TransportationOffice Office and Other
Premises Equipment Equipment TotalAt CostBalances at beginning of year P=– P=30,863,753 P=5,734,531 P=36,598,284Additions – 3,973,214 631,250 4,604,464Disposal – – (376,000) (376,000)Balances at end of year – 34,836,967 5,989,781 40,826,748Accumulated DepreciationBalances at beginning of year – 29,027,044 5,173,124 34,200,168Depreciation for the year – 908,436 474,215 1,382,651Disposal – – (376,000) (376,000)Balances at end of year – 29,935,480 5,271,339 35,206,819Net Book Value – 4,901,487 718,442 5,619,929At Deemed CostBalances at beginning and end of year 253,365,628 – – 253,365,628Accumulated DepreciationBalances at beginning of year 229,096,647 – – 229,096,647Depreciation for the year 11,553,066 – – 11,553,066Balances at end of year 240,649,713 – – 240,649,713Net Deemed Cost 12,715,915 – – 12,715,915Total P=12,715,915 P=4,901,487 P=718,442 P=18,335,844
2013Furniture,
Fixtures and TransportationOffice Office and Other
Premises Equipment Equipment TotalAt CostBalances at beginning of year P=– P=28,970,381 P=6,991,674 P=35,962,055Additions – 1,893,372 – 1,893,372Disposal – – (1,257,143) (1,257,143)Balances at end of year – 30,863,753 5,734,531 36,598,284Accumulated DepreciationBalances at beginning of year – 28,770,099 4,950,532 33,720,631Depreciation for the year – 256,945 411,163 668,108Disposal – – (188,571) (188,571)Balances at end of year – 29,027,044 5,173,124 34,200,168Net Book Value – 1,836,709 561,407 2,398,116At Deemed CostBalances at beginning of year 259,448,852 – – 259,448,852Transfer to real estate properties for sale
(Note 8) (6,083,224) – – (6,083,224)Balance at end of year 253,365,628 – – 253,365,628Accumulated DepreciationBalances at beginning of year 218,765,774 – – 218,765,774Transfer to real estate properties for sale
(Note 8) (2,307,429) – – (P=2,307,429)Depreciation for the year 12,638,302 – – 12,638,302Balances at end of year 229,096,647 – – 229,096,647Net Deemed Cost 24,268,981 – – 24,268,981Total P=24,268,981 P=1,836,709 P=561,407 P=26,667,097

- 40 -
*SGVFS008696*
For the office premises, the Group elected to apply the optional exemption under PFRS 1, First-Time Adoption of PFRS, to use the revalued amount as deemed cost as at January 1, 2005, the dateof transition to PFRS. As at December 31, 2014 and 2013, the balances of the office premises atcost are as follows:
2014 2013Office premises P=55,775,746 P=55,775,746Less accumulated depreciation 53,074,862 50,497,783
P=2,700,884 P=5,277,963
Difference between the net deemed cost and the net pre-PFRS cost amounting to P=10.02 millionand P=18.99 million of December 31, 2014 and 2013, respectively, represents the remainingbalance of the deemed cost adjustment (see Note 15).
The cost of fully depreciated property and equipment still used in operations as ofDecember 31, 2014 and 2013 amounted to P=32.45 million.
12. Other Assets
Other current assets consist of:
2014 2013Escrow deposit P=43,801,433 P=–Deposits and others 2,473,013 3,459,595
P=46,274,446 P=3,459,595
In 2014, CLDI entered into an Escrow Agreement with the HLURB and a local bank as escrowbank for the temporary license to sell issued for the CLDI’s project, North Residences.Cash proceeds as of December 31, 2014 amounting to P=43.80 million were deposited to theescrow bank and recognized as deposits under “Accounts payable and accrued expenses” in the2014 consolidated balance sheet (see Note 13).
The escrow deposit was released to CLDI on January 14, 2015 upon written notice from theHLURB allowing such release in view of the Company’s compliance with all the requirements ofthe HLURB for the issuance of license to sell and certificate of registration for North Residences.
Other noncurrent assets consist of:
2014 2013Unused input VAT P=58,821,777 P=–Available-for-sale financial assets 2,520,571 2,208,456Deposits and others 40,298,131 42,968,680
P=101,640,479 P=45,177,136
Unused input VAT arose from the purchase of lots. The purchased lots were recorded as part of“Real estate properties held for future development” account (see Note 9).
Available-for-sale financial assets consist of investments in quoted equity securities. The fairvalues of available-for-sale financial assets were determined based on published prices in an activemarket.

- 41 -
*SGVFS008696*
The movement in “Net changes in fair values of available-for-sale financial assets” presented inthe equity section of the consolidated balance sheets, are as follows:
2014 2013Balances at beginning of year P=1,529,813 P=2,056,587Mark-to-market gain (loss) attributable to equity holders of the Parent Company 270,543 (526,774)Balances at end of year P=1,800,356 P=1,529,813
Mark-to-market gain (loss) on available-for-sale financial assets pertaining to the non-controllinginterests amounted to P=0.13 million and P=0.41 million in 2014 and 2013 respectively.
Dividend income from available-for-sale financial assets amounted to P=43,609, P=59,773 andP=51,842 in 2014, 2013 and 2012, respectively (see Note 20).
Deposits and others represent payments made by the Group to various utility companies for theinstallation of electric and water meters for condominium units still unsold.
13. Accounts Payable and Accrued Expenses
Accounts payable and accrued expenses consist of:
2014 2013Trade payables P=152,711,905 P=94,500,719Accrued expenses:
Development costs 217,128,954 488,163,915Sick leave (Note 23) 28,112,727 45,865,094Director’s fee 14,497,697 18,603,238Interest payable 3,068,652 5,345,332Taxes, premiums, others 5,091,151 3,623,514
Deposits (Note 12) 83,572,457 16,300,444Withholding taxes payable 9,726,378 8,460,909Dividends payable 8,618,051 7,414,534Output VAT payable 1,479,293 1,666,090Deferred rent income 2,771,526 –Others (Note 25) 8,937,512 22,815,638
535,716,303 712,759,427Less noncurrent portion 138,077,066 166,917,840
P=397,639,237 P=545,841,587
Trade payables consist of payables to contractors and other counterparties, whereas depositsconsist of rental deposits and collected deposits for water and electric meters of the sold units.Accrued development costs represent the corresponding accrued expenses for the sold real estateprojects of the Group. Other payables consist of payable to related parties and employees.

- 42 -
*SGVFS008696*
14. Notes and Contracts Payable
The details of notes and contracts payable are as follows:
2014 2013Notes payable:
Short-term commercial papers (STCP) withvarying maturities and annual interest ratesranging from 0.69% to 1.56% in 2014 and1.06% to 3.28% in 2013 P=2,516,800,000 P=2,438,750,000
Short-term promissory notes enrolled with HGCwith varying maturities and annual interestrates ranging from 0.85% to 1.15% in 2013 – 358,949,975
P=2,516,800,000 P=2,797,699,975Contracts payable 119,272,386 6,772,386
P=2,636,072,386 P=2,804,472,361
On various dates in 2014 and 2013, the SEC authorized the Group to issue P=2,300.00 millionworth of STCP registered with the SEC in accordance with the provision of the SecuritiesRegulation Code and its implementing rules and regulations, the Code of CorporateGovernance and other applicable laws and orders. Outstanding STCP issued by the Group as ofDecember 31, 2014 and 2013 aggregated to P=2,516.80 million and P=2,438.75 million,respectively.
In 2013, the CDC, CI and CLDI entered a contract of guaranty under a Revolving Cash GuarantyLine with HGC amounting to P=1,900.00 million. The guaranty covers the unpaid principal due onthe outstanding STCP and unpaid interest thereon of 10% per annum. The guaranty premium paidwas 0.90% per annum based on enrolled commercial papers in 2014 and 2013, respectively.Outstanding short-term promissory notes covered by the guaranty amounted to P=358.95 million asof December 31, 2013.
Interest expense related to short-term notes amounted to P=27.74 million, P=58.80 million andP=104.04 million in 2014, 2013 and 2012, respectively (see Note 21).
The Group has credit line with financial institutions aggregating to about P=2,800.00 million andP=2,515.00 million as of December 31, 2014 and 2013, respectively, which is available for drawingby any of the companies of the Group.
In addition, the Parent Company and CDC have specific credit lines as follows (amount inmillions):
2014 2013Parent Company P=350 P=350CDC 500 215
P=850 P=565

- 43 -
*SGVFS008696*
The carrying values of properties that will be used as collaterals as of December 31, 2014 and2013 follow (amounts in millions):
2014 2013Real estate properties for sale
Group P=0.74 P=0.74Company 0.74 0.74
Investment propertiesGroup 554.34 712.32Company 291.75 450.39
Property and equipmentGroup – 1.73Company – 1.73
TotalGroup P=555.08 P=714.79Company P=292.49 P=452.86
No loans were availed from credit line in 2014 and 2013.
Contracts payable represents liabilities arising from contracts entered into by the Group topurchase land for future development (see Note 9).
15. Equity
The following summarizes the reconciliation of the issued and outstanding shares of capital stockfor each of the following:
Shares Amount2014 2013 2014 2013
Issued, beginning 50,005,183 50,005,183 P=500,051,830 P=500,051,830Stock dividends 12,501,290 – 125,012,900 –Issued, ending 62,506,473 50,005,183 P=625,064,730 P=500,051,830
Dividends declared and issued/paid by the Parent Company in 2014, 2013, and 2012 are asfollows:
Dividends Date Approved Per ShareStockholders of
Record Date Date Issued/PaidCash July 31, 2014 P=2.84 August 11, 2014 September 9, 2014
June 14, 2013 2.56 July 12, 2013 August 7, 2013June 15, 2012 3.59 July 13, 2012 July 27, 2012
Stock December 17, 2014 30% December 29, 2014 January 16, 2015September 5, 2014 25% September 17, 2014 September 30, 2014
May 21, 2012 20% July 4, 2012 August 1, 2012
Fractional shares of stock dividends are paid in cash based on the par value.
On November 24, 2014, the BOD authorized the transfer of appropriated retained earnings for thedevelopment costs of Tagaytay Prime Residences which was 100% completed in 2014, toappropriated retained earnings in order to finance the development costs of The ManilaResidences Tower II in the same amount of P=100.00 million. As of December 31, 2014, the

- 44 -
*SGVFS008696*
completion rate of The Manila Residences Tower II is 86.47% and its estimated date ofcompletion is in September 2015.
On December 17, 2014, the BOD and stockholders approved the declaration of 30% stockdividend for stockholders as of December 29, 2014. This stock dividend is recorded as “Stockdividends distributable” in the consolidated balance sheet.
As of December 31, 2014 and 2013, the unappropriated retained earnings attributable to equityholders of the Parent Company and the non-controlling interest include the remaining balance ofdeemed cost adjustment which arose when the Group transitioned to PFRS in 2005.
The components of the deemed cost adjustment as of December 31 are as follows:
2014 2013Real estate properties for sale (Note 8) P=88,412,451 P=115,508,079Investment properties (Note 10) 1,452,034,609 1,452,034,609Property and equipment (Note 11) 10,015,032 18,991,017Deemed cost adjustment 1,550,462,092 1,586,533,705Deferred income tax liability (Note 24) (465,138,628) (475,960,112)Net deemed cost adjustment P=1,085,323,464 P=1,110,573,593
The deemed cost adjustment is allocated in the consolidated statements of changes in equity asfollows:
2014 2013Attributable to:
Equity holders of the Parent P= 974,007,760 P=975,374,782Non-controlling interest 111,315,704 135,198,811
P=1,085,323,464 P=1,110,573,593
The balance of retained earnings is restricted for the payment of dividends to the extent of thefollowing:
2014 2013Undistributed earnings of subsidiaries P=2,653,414,609 P=2,509,062,586Net deemed cost adjustment in properties 1,085,323,464 1,110,573,593Deferred income tax assets 13,562,558 19,744,226
P=3,752,300,631 P=3,639,380,405
16. Material Partly-owned Subsidiary
Below is the summarized financial information of the subsidiaries that has non-controlling interestbut is material to the Group. The amounts disclosed are based on those included in theconsolidated financial statements before intercompany eliminations.

- 45 -
*SGVFS008696*
Proportion of equity interest held by non-controlling interests as of December 31, 2014 and 2013follows:
Direct:CDC 49.58%
Indirect through CDC (including direct ownership ofthe Parent Company in CLDI of 29.54% andCPI of 9.18%):CLDI 45.39%CPI 45.03%
As of December 31, the summarized balance sheets of subsidiaries are as follows:
2014CLDI CPI CDC
Total assets P=2,003,111,259 P=318,831,739 P=6,174,987,521Total liabilities 281,395,579 64,576,888 1,534,780,972Equity 1,721,715,680 254,254,851 4,640,206,549Attributable to non-controlling interest 883,421,677 25,722,405 2,328,861,089
2013CLDI CPI CDC
Total assets P=2,072,864,057 P=317,053,973 P=6,005,902,715Total liabilities 374,256,840 61,461,331 1,631,892,268Equity 1,698,607,217 255,592,642 4,374,010,447Attributable to non-controlling interest 877,748,032 23,122,205 2,176,071,983
Summarized statements of income for the years ended December 31 are as follows:
2014
CLDI CPI CDCRevenue P=327,250,875 P=17,098,279 P=1,273,830,694Expenses 205,130,929 15,526,468 825,147,261Provision for income tax 28,496,982 55,393 91,623,788Net income 93,622,964 1,516,418 357,059,645Attributable to non-controlling interest 42,495,463 682,996 177,030,172
2013
CLDI CPI CDCRevenue P=429,041,905 P=17,287,115 P=1,330,828,656Expenses 177,787,330 15,769,628 856,888,915Provision for (benefit from) income tax 59,982,620 (546,893) 67,838,481Net income 191,271,955 2,064,380 406,101,260Attributable to non-controlling interest 86,818,340 929,797 198,057,988
Summarized statements of comprehensive income for the years ended December 31 are asfollows:
2014CLDI CPI CDC
Net income P=93,622,964 P=1,516,418 P=357,059,645Other comprehensive income (loss) (2,369,156) (2,854,209) 5,992,184Total comprehensive income (loss) 91,253,803 (1,337,791) 363,051,829Attributable to non-controlling interest 41,420,101 (602,407) 181,359,702

- 46 -
*SGVFS008696*
Summarized statements of cash flows for the years ended December 31 are as follows:
17. Operating Expenses
Operating expenses consist of:
2014 2013 2012Personnel (Note 18) P=226,440,633 P=280,839,259 P=232,687,085Taxes and licenses 68,302,420 67,474,221 71,027,401Depreciation (Note 19) 40,844,170 16,930,715 20,159,259Professional fees 32,020,073 39,757,505 25,945,954Insurance (Notes 6 and 14) 22,109,748 19,650,218 19,929,749Outside services 17,613,070 16,838,641 15,819,098Donations and contributions 16,200,000 5,820,000 34,376,256Advertising and promotions 13,945,053 13,751,233 10,247,006Brokers’ commission 12,659,100 6,703,910 8,802,064Membership dues 9,435,863 19,376,414 18,053,921Repairs and maintenance 9,353,838 8,682,834 4,290,305Light, power and water 5,174,664 5,016,904 4,393,204Postage, telephone and telegraph 3,300,630 3,181,686 3,243,766Stationery and office supplies 1,876,893 2,003,503 1,399,366Transportation and travel 1,327,797 1,427,502 1,298,775Loss on demolition of building – – 1,393,971Others 29,057,808 33,997,081 18,122,941
P=509,661,760 P=541,451,626 P=491,190,121
Other expenses include representation, rent and miscellaneous expenses.
2013CLDI CPI CDC
Net income P=191,271,955 P= 2,064,380 P=406,101,260Other comprehensive loss (1,429,517) (2,403,811) (2,852,328)Total comprehensive income (loss) 189,842,438 (339,431) 403,248,932Attributable to non-controlling interest 86,169,483 (152,880) 198,351,072
2014CLDI CPI CDC
Operating cash flows P=206,399,777 P=8,513,329 (P=4,133,268)Investing cash flows 252,326,314 18,668,634 469,684,642Financing cash flows (238,044,848) – (193,507,580)
2013CLDI CPI CDC
Operating cash flows P=354,143,204 P=8,340,159 P=348,879,394Investing cash flows (571,987,173) (20,165,371) (1,254,827,849)Financing cash flows (140,136,334) (12,500,000) (449,142,686)

- 47 -
*SGVFS008696*
18. Personnel Expenses
Personnel expenses consist of:
2014 2013 2012Salaries and wages P=101,571,978 P=151,754,573 P=91,789,638Commission 54,679,790 54,365,150 56,307,909Bonuses and other employee benefits 67,662,615 72,292,763 77,090,905Retirement benefits cost
(Note 23) 2,526,250 2,426,773 7,498,633P=226,440,633 P=280,839,259 P=232,687,085
19. Depreciation
Depreciation consists of:
2014 2013 2012Investment properties (Note 10) P=27,908,453 P=3,624,305 P=6,431,310Property and equipment (Note 11) 12,935,717 13,306,410 13,727,949
P=40,844,170 P=16,930,715 P=20,159,259
20. Financial Income
Financial income consists of:
2014 2013 2012Interest income from:
Installment contractsreceivable (Note 6) P=352,919,293 P=402,808,099 P=480,900,963
Cash equivalents and short-term cash investments(Note 4) 46,425,529 87,604,426 128,539,344
Cash in banks (Note 4) 101,380 103,444 109,112Others 2,253,966 3,128,076 2,052,995
Dividend income (Note 12) 43,609 59,773 51,842P=401,743,777 P=493,703,818 P=611,654,256

- 48 -
*SGVFS008696*
21. Financial Expenses
Financial expenses consist of:
2014 2013 2012Interest expense on:
STCP (Note 14) P=27,740,541 P=58,799,896 P=104,041,577Less: Capitalized interest
(Notes 8,10,14) (11,436,236) (22,282,945) (23,089,247)16,304,305 36,516,951 80,952,330
Others 465,116 – 83,104Finance charges 1,566,525 1,754,821 1,855,411
P=18,335,946 P=38,271,772 P=82,890,845
22. Other Income/Expenses
Other IncomeOther income amounting to P=85.82 million, P=158.76 million and P=29.87 million in 2014, 2013 and2012, respectively, pertains to trust fund income, penalties for customers’ late payments, sale ofscraps and forfeiture of reservations/downpayments received on sales which were notconsummated.
In 2014, this account includes unrealized re-measurement gains in investment properties of CPIamounting to P=1.86 million.
In 2013, CLDI reversed P=119.74 million excess of estimated development cost over the actual costof completed projects and was recognized as other income.
Other expensesOther expenses pertain to reversal of gross profit recognized in prior years due toforfeiture/cancellation of sales.
23. Employee Benefits
Retirement benefits costThe Group, jointly with affiliated companies, has funded, noncontributory defined benefitretirement plan, administered by trustee covering all of its permanent employees. This provides forpayment of benefits to covered employees upon retirement subject to certain condition which isbased on a certain percentage of employee’s final monthly salary and the number of years ofservice. The fund is administered by a trustee bank under the supervision of the RetirementCommittee of the plan. The committee is responsible for investment strategy of the plan.

- 49 -
*SGVFS008696*
The details of net retirement benefits cost, which is included in “Personnel expense” account, areas follows:
2014 2013 2012Current service cost P=2,963,076 P=3,307,793 P=3,771,318Interest cost (income) on benefit
obligation (447,120) (881,020) 3,727,315Effect of asset limit 10,294 − −Net retirement benefit cost P=2,526,250 P=2,426,773 P=7,498,633
The details of re-measurement loss (gain) recognized in the consolidated statements ofcomprehensive income are as follows:
2014 2013 2012Actuarial loss (gain) on defined benefit
obligation:Due to change in financial assumption (P=198,619) (P=5,267,103) (P=6,510,379)Due to experience adjustments 10,650,973 (407,044) (12,153,505)
Loss on plan assets excluding amountsincluded in net interest cost 2,173,085 2,381,647 796,949
Changes in effect of asset ceiling (11,936,929) 11,430,604 −Re-measurement loss (gain) P=688,510 P=8,138,104 (P=17,866,935)
Movements in the retirement plan assets during the years ended December 31 are as follows:
2014 2013Balances at beginning of year P=9,971,234 P=16,667,296Retirement benefits cost (2,526,250) (2,426,773)Contributions 5,220,189 3,868,815Re-measurement loss recognized in other comprehensive income (688,510) (8,138,104)Balances at end of year P=11,976,663 P=9,971,234
The details of the retirement plan assets are as follows:
2014 2013Fair value of plan assets P=72,866,301 P=71,131,707Defined benefit obligation (60,889,638) (49,729,869)Surplus 11,976,663 21,401,838Asset ceiling adjustment – (11,430,604)Retirement plan assets P=11,976,663 P=9,971,234
Changes in present value of defined benefit obligation are as follows:
2014 2013Defined benefit obligation, January 1 P=49,729,869 P=50,490,416Current service cost 2,963,076 3,307,793Interest cost on benefit obligation 2,245,149 2,669,460Benefits paid (4,500,810) (1,063,653)Actuarial loss (gain) on obligation 10,452,354 (5,674,147)Defined benefit obligation, December 31 P=60,889,638 P=49,729,869

- 50 -
*SGVFS008696*
Changes in fair value of plan assets are as follows:
2014 2013Fair value of plan assets, January 1 P=71,131,707 P=67,157,712Actual return including amount recognized in
net interest cost 1,015,215 1,168,833Contributions to the plan 5,220,189 3,868,815Benefits paid (4,500,810) (1,063,653)Fair value of plan assets, December 31 P=72,866,301 P=71,131,707
The major categories of plan assets of the Group with its affiliated companies as a percentage ofthe fair value of net plan assets are as follows:
2014 2013Cash and cash equivalents 40.50% 37.96%Investments in equity securities 9.14% 9.28%Investment properties 49.63% 50.88%Receivables 1.22% 2.38%Payables (0.49%) (0.50%)
100.00% 100.00%
Cash and cash equivalents consists of saving deposits and short-term time deposits with maturitiesof less than 3 months. Investments in equity securities consist of investment in shares of stock oflisted companies. Investments in equity securities have quoted market prices in an active market.Loans and receivables include loans to individuals and accrued interest income. Investmentproperties pertain to condominium units which will be used for lease (see Note 25).
The Group expects to contribute P=5.28 million to the retirement fund in 2015.
The Group does not currently employ any asset-liability matching.
The latest actuarial valuation report was as of December 31, 2014.The principal assumptions usedin determining retirement benefits costs for the Group’s plan as of January 1 are as follows:
2014 2013Discount rate per annum 4.86% 5.28%Future annual increase in salary 3.00% 4.50%Number of employees 308 311Mortality rate 1983 GAM 1983 GAMDisability rate 1952
Disability Study1952
Disability Study
The defined benefit obligation is subject to several key assumptions. The sensitivity analysis hasbeen determined based on reasonably possible changes of each significant assumption on thedefined benefit obligation as of December 31, 2014 and 2013, assuming if all other assumptionswere held constant.

- 51 -
*SGVFS008696*
Increase(decrease)in basis points
Increase (decrease) indefined benefit obligation
2014 2013Discount rate +0.50% (3,791,612) (P=722,018)
-0.50% 4,174,634 801,992
Salary increase rate +1.00% 8,580,668 1,669,652-1.00% (6,950,288) (1,378,189)
Shown below is the maturity analysis of the undiscounted benefit payments:
Plan year Number of retirees Total benefitsMore than one year to five years 4 P=7,120,838More than five years to 10 years 15 38,025,161More than 10 years to 15 years 28 66,078,544More than 15 years to 20 years 25 45,243,393More than 20 years 236 496,057,637
308 P=652,525,573
The average duration of the defined benefit obligation as of December 31, 2014 is 21 years.
Accrued sick leaveEmployees are entitled to paid sick leave of 15 days per year of service after issuance of regularappointment computed at 1.25 days per month of service, enjoyable only after one (1) year ofregular service. Unused sick leaves are cumulative and convertible to cash based on theemployee's salary at the time that the employee is leaving the Group. Accrued sick leave,presented under “Accounts payable and accrued expenses - net of current portion” account,amounted to P=28.11 million and P=45.87 million as of December 31, 2014 and 2013, respectively(see Note 13).
24. Income Taxes
a. Provision for income tax consists of:
2014 2013 2012Current P=239,824,116 P=293,141,866 P=172,255,242Deferred (33,195,826) (110,104,914) (48,691,024)
206,628,290 183,036,952 123,564,218Final tax on interest income 9,299,531 17,541,574 25,729,691
P=215,927,821 P=200,578,526 P=149,293,909

- 52 -
*SGVFS008696*
b. The components of the net deferred income tax liabilities are as follows:
2014 2013Deferred income tax assets on
accrued expenses and others P=13,562,558 P=19,744,226Deferred income tax liabilities:
Deemed cost adjustment in properties (Note 15) 465,138,628 475,960,112Unrealized gain on real estate transactions 88,888,353 127,228,613Capitalized interest 9,660,925 9,688,902Unearned rent revenue 3,966,570 –Retirement plan assets 3,430,750 2,991,729
571,085,226 615,869,356Net deferred income tax liabilities P=557,522,668 P=596,125,130
c. The reconciliation of income tax computed at statutory tax rates to the provision for incometax follows:
2014 2013 2012Income tax at statutory tax rate P=302,018,244 P=320,966,153 P=247,311,207Adjustments to income tax
resulting from:Tax-exempt interest income (42,975,095) (55,541,752) (46,538,113)Interest income subjected to
final tax (13,949,675) (26,295,027) (38,571,639)Income entitled to tax holiday
(Note 30) (51,430,597) (74,892,879) (57,478,423)Final tax on interest income 9,299,531 17,541,574 25,729,691Nondeductible interest
expense 3,397,802 7,777,263 12,198,400Trust fund income
subjected to final tax (459,647) (534,044) (774,885)Non-taxable dividend income 92,202 (17,932) (15,553)Others - net 9,935,056 11,575,170 8,131,990
Provision for income tax P=215,927,821 P=200,578,526 P=149,992,675
25. Related Party Transactions
Enterprises and individuals that directly, or indirectly through one or more intermediaries, controlor are controlled by or under common control with the Group, including holding companies,subsidiaries and fellow subsidiaries, are related parties of the Group. Associates and individualsowning, directly or indirectly, an interest in the voting power of the Group that gives themsignificant influence over the enterprise, key management personnel, including directors andofficers of the Group and close members of the family of these individuals, and companiesassociated with these individuals also constitute related parties. In considering each possiblerelated entity relationship, attention is directed to the substance of the relationship and not merelythe legal form.
The Group discloses the nature of the related party relationship and information about thetransactions and outstanding balances necessary for an understanding of the potential effect of therelationship on the consolidated financial statements, including, as a minimum, the amount of

- 53 -
*SGVFS008696*
outstanding balances and its terms and conditions including whether they are secured, and thenature of the consideration to be provided in settlement.
Refer to succeeding pages for the transactions and account balances with related parties.

- 54 -
*SGVFS008696*
The Group, in the normal course of business, has transactions and account balances with related parties consisting mainly of the following:
Outstanding balance
Terms and ConditionsAmount of Transactions Receivable Payable
2014 2013 2014 2013 2014 2013Subsidiaries
(CDC, CLDI and CPI)Sharing of expenses charged by (to) the
Company* (Note 25b) P=2,677,394 (P=10,555,661) P=– P=– P=3,017,953 P=6,008,08530-day, unsecured, non-interest
bearing; to be settled in cashSale of real estate properties to CPI
(Note 25c) 39,623,733 – 380,000 150,000 – – Received in cash
Various Stockholders
Advances granted (paid)** (Note 25d) – (100,538,000) – – – – Due and demandable; non-interestbearing; unsecured; to be
settled in cash
Retirement planContribution to the fund (Note 25e) 5,220,189 3,868,815 – – – – To be settled in cash
Key management personnelSalaries and other compensation(Note 25g) 36,687,996 37,507,268 – – – – To be settled in cash
Board of DirectorsShares of stock (Note 25f) 90,815,470 – – – – – Pertains to 9,081,547
common shares atP=10 par value in 2014
P=380,000 P=150,000 P=3,017,953 P=6,008,085* Outstanding balances are included under “Accounts payable and accrued expenses” account in the consolidated balance sheets (Note 13).** Outstanding balances are included under “Payable to stockholders” account in the consolidated balance sheets.
The transactions of the Parent Company with CDC, CLDI and CPI are eliminated in the consolidated balance sheets and consolidated statements of income.
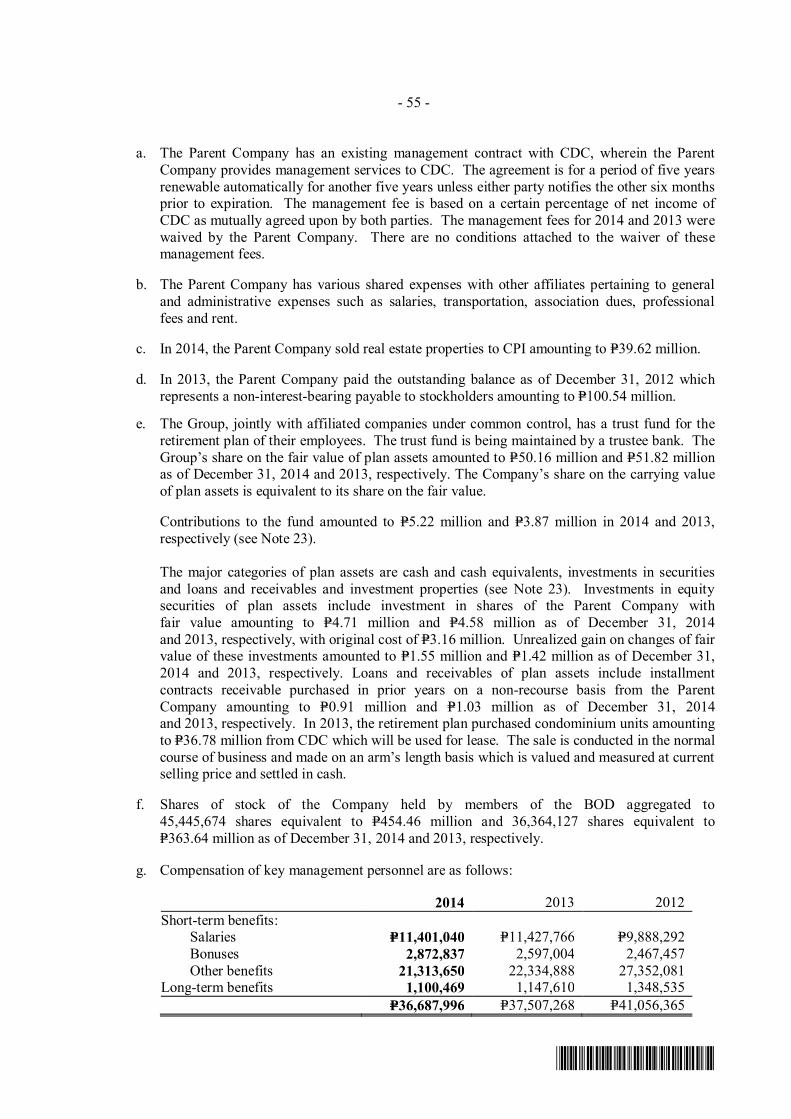
- 55 -
*SGVFS008696*
a. The Parent Company has an existing management contract with CDC, wherein the ParentCompany provides management services to CDC. The agreement is for a period of five yearsrenewable automatically for another five years unless either party notifies the other six monthsprior to expiration. The management fee is based on a certain percentage of net income ofCDC as mutually agreed upon by both parties. The management fees for 2014 and 2013 werewaived by the Parent Company. There are no conditions attached to the waiver of thesemanagement fees.
b. The Parent Company has various shared expenses with other affiliates pertaining to generaland administrative expenses such as salaries, transportation, association dues, professionalfees and rent.
c. In 2014, the Parent Company sold real estate properties to CPI amounting to P=39.62 million.
d. In 2013, the Parent Company paid the outstanding balance as of December 31, 2012 whichrepresents a non-interest-bearing payable to stockholders amounting to P=100.54 million.
e. The Group, jointly with affiliated companies under common control, has a trust fund for theretirement plan of their employees. The trust fund is being maintained by a trustee bank. TheGroup’s share on the fair value of plan assets amounted to P=50.16 million and P=51.82 millionas of December 31, 2014 and 2013, respectively. The Company’s share on the carrying valueof plan assets is equivalent to its share on the fair value.
Contributions to the fund amounted to P=5.22 million and P=3.87 million in 2014 and 2013,respectively (see Note 23).
The major categories of plan assets are cash and cash equivalents, investments in securitiesand loans and receivables and investment properties (see Note 23). Investments in equitysecurities of plan assets include investment in shares of the Parent Company withfair value amounting to P=4.71 million and P=4.58 million as of December 31, 2014and 2013, respectively, with original cost of P=3.16 million. Unrealized gain on changes of fairvalue of these investments amounted to P=1.55 million and P=1.42 million as of December 31,2014 and 2013, respectively. Loans and receivables of plan assets include installmentcontracts receivable purchased in prior years on a non-recourse basis from the ParentCompany amounting to P=0.91 million and P=1.03 million as of December 31, 2014and 2013, respectively. In 2013, the retirement plan purchased condominium units amountingto P=36.78 million from CDC which will be used for lease. The sale is conducted in the normalcourse of business and made on an arm’s length basis which is valued and measured at currentselling price and settled in cash.
f. Shares of stock of the Company held by members of the BOD aggregated to45,445,674 shares equivalent to P=454.46 million and 36,364,127 shares equivalent toP=363.64 million as of December 31, 2014 and 2013, respectively.
g. Compensation of key management personnel are as follows:
2014 2013 2012Short-term benefits:
Salaries P=11,401,040 P=11,427,766 P=9,888,292Bonuses 2,872,837 2,597,004 2,467,457Other benefits 21,313,650 22,334,888 27,352,081
Long-term benefits 1,100,469 1,147,610 1,348,535P=36,687,996 P=37,507,268 P=41,056,365

- 56 -
*SGVFS008696*
The Group has no standard arrangement with regards to the remuneration of its directors. In2014, 2013 and 2012, the BOD received a total of P=24.85 million, P=29.16 million andP=25.03 million, respectively. Moreover, the Group has no standard arrangement with regardsto the remuneration of its existing officers aside from the compensation received or any otherarrangements in the employment contracts and compensatory plan. The Group does not haveany arrangements for stock warrants or options offered to its employees.
26. Financial Instruments
Financial Risk Management Objectives and PoliciesThe Group’s principal financial instruments comprise cash and cash equivalents, short-term cashinvestments and notes and contracts payable. The main purpose of these financial instruments isto finance the Group’s operations. The Group’s other financial instruments consist of financialassets at fair value through profit or loss and available-for-sale financial assets, which are held forinvesting purposes. The Group has various other financial instruments such as installmentcontracts receivable, other receivables, accounts payable and accrued expenses and notes andcontracts payable, which arise directly from its operations.
It is, and has been throughout the year under review, the Group’s policy that no trading infinancial instruments shall be undertaken.
The main risks arising from the Group’s financial instruments are cash flow interest rate risk,credit risk, equity price risk and liquidity risk. The BOD reviews and approves policies formanaging these risks and they are summarized as follows:
Market riskCash flow interest rate riskCash flow interest rate risk is the risk that the fair value or future cash flows of a financialinstrument will fluctuate because of changes in market interest rates. The Group’s exposure to therisk for changes in market interest rates relates primarily to the Group’s short-term notes payable,all with repriced interest rates.
The Group’s policy in addressing volatility in interest rates includes maximizing the use ofoperating cash flows to be able to fulfill principal and interest obligations even in periods of risinginterest rates.
The following table demonstrates the sensitivity of the Group’s income before income tax to areasonably possible change in interest rates based on forecasted and average movements ofinterest rates (with all other variables held constant):
Change inBasis Points (bps)
Effect on Incomebefore Income Tax
December 31, 2014 -/+ 22 bps P=55,565,910December 31, 2013 -/+ 24 bps 68,839,273
There is no impact on the Group’s equity other than those already affecting income before incometax.

- 57 -
*SGVFS008696*
Equity price riskEquity price risk is the risk that the fair values of investments in equity securities will decrease asa result of changes in the market value of individual shares of stock. The Group is exposed toequity price risk because of investments held by the Group classified as available-for-salefinancial assets included under “Other assets” in the consolidated balance sheets. The Groupemploys the service of a third-party stockbroker to manage its investments in shares of stock.
The following table demonstrates the sensitivity analysis of the Group’s equity to a reasonablypossible change in equity price based on forecasted and average movements of the equity prices(with all other variables held constant):
Change in equity price Effect on equity2014 P=+/-0.05 P=126,0292013 +/-0.05 109,111
Credit riskThe Group trades only with recognized, creditworthy third parties. Credit risk arises when theGroup will incur a loss because its customers, clients or counterparties failed to discharge theirobligations. It is the Group’s policy that all customers who wish to trade on credit terms aresubject to credit verification procedures. In addition, receivable balances are monitored on anon-going basis with the objective that the Group’s exposure to bad debts is not significant. TheGroup’s policy is to enter into transactions with a diversity of creditworthy parties to mitigate anysignificant concentration of credit risk. There are no significant concentrations of credit riskwithin the Group.
The tables below show the Group’s exposure to credit risk for the components of the consolidatedbalance sheets. The exposure as of December 31, 2014 and 2013 is shown at gross, before takingthe effect of mitigation through the use of collateral agreements and credit enhancements, and atnet, after taking the effect of mitigation through the use of collateral agreements and creditenhancements.
December 31, 2014:
Fair value of Financial effectGross maximum collaterals/credit Net of collaterals/credit
exposure enhancements exposure EnhancementFinancial assets at fair value through profit or loss:
Investments in trust funds P=38,105,350 P=– P=38,105,350 P=–Loans and receivables:
Cash and cash equivalents, excludingcash on hand* 1,368,477,262 – 1,368,477,262 –
Short-term cash investments 1,461,213,555 – 1,461,213,555 –Installment contracts receivable 2,189,980,491 3,327,026,543 – 2,189,980,491Other receivables**:
Rent receivable 13,221,900 – 13,221,900 –Advances to customers 31,017,587 – 31,017,587 –Accrued interest 6,616,270 – 6,616,270 –Retention 4,122,971 – 4,122,971 –Others 15,625,375 – 15,625,375 –
Refundable deposits 39,267,581 – 39,267,581 –Escrow deposit 43,801,433 – 43,801,433 –
Available-for-sale financial assets 2,520,571 – 2,520,571 –Total credit risk exposure P=5,213,970,346 P=3,327,026,543 P=3,023,989,855 P=2,189,980,491*Excluding cash on hand amounting to P=203,000.**Excluding advances to contractors amounting to P=9,236,183.

- 58 -
*SGVFS008696*
December 31, 2013:
Fair value of Financial effectGross maximum collaterals/credit Net of collaterals/credit
exposure enhancements Exposure EnhancementFinancial assets at fair value through
profit or loss:Investments in trust funds P=36,512,483 P=– P=36,512,483 P=–
Loans and receivables:Cash and cash equivalents, excluding
cash on hand* 835,105,009 – 835,105,009 –Short-term cash investments 2,265,607,000 – 2,265,607,000 –Installment contracts receivable 2,079,123,188 5,777,543,149 – 2,079,123,188Other receivables**:
Advances to customers 31,966,519 – 31,966,519 –Accrued interest 10,113,550 – 10,113,550 –Retention 3,983,579 – 3,983,579 –Others 12,372,276 – 12,372,276 –
Available-for-sale financial assets 2,208,456 2,208,456Refundable deposits 28,870,885 – 28,870,885 –
Total credit risk exposure P=5,305,862,945 P=5,777,543,149 P=3,226,739,757 P=2,079,123,188*Excluding cash on hand amounting to P=210,069.**Excluding advances to contractors amounting to P=10,962,168.
The following tables summarize the aging analysis of receivables:
December 31, 2014:
Past Due But Not ImpairedOver 90
Current* > One year* < 30 days 31-60 days 61-90 days days TotalInstallment contracts
receivable P=621,922,614 P=1,538,977,367 P=11,135,277 P=4,412,610 P=1,937,941 P=11,594,682 P=2,189,980,491Refundable deposits – 39,267,581 – – – – 39,267,581Escrow deposit 43,801,433 – – – – – 43,801,433Other receivables**:
Rent receivable 13,221,900 – – – – – 13,221,900Accrued interest 6,616,270 – – – – – 6,616,270Advances to customers 21,135,538 – – 701,705 362,563 8,817,781 31,017,587Retention 3,949,671 171,208 2,092 – – – 4,122,971Others 13,891,302 1,454,557 279,516 – – – 15,625,375
P=724,538,728 P=1,579,870,713 P=11,416,885 P=5,114,315 P=2,300,504 P=20,412,463 P=2,343,653,608*classified as neither past due nor impaired.**Excluding advances to contractors amounting to P=9,236,183.
December 31, 2013:
Past Due But Not ImpairedOver 90
Current* > One year* < 30 days 31-60 days 61-90 days days TotalInstallment contracts
receivable P=287,628,315 P=1,632,754,978 P=12,597,709 P=2,261,224 P=1,869,832 P=10,151,533 P=1,947,263,591Refundable deposit – 28,870,885 – – – – 28,870,885Other receivables**:
Accrued interest 10,113,550 – – – – – 10,113,550Advances to customers 19,715,911 – – 790,002 601,846 10,858,760 31,966,519Retention 3,629,375 352,112 2,092 – – – 3,983,579Others 11,219,832 685,118 467,326 – – – 12,372,276
P=332,306,983 P=1,662,663,093 P=13,067,127 P=3,051,226 P=2,471,678 P=21,010,293 P=2,034,570,400*classified as neither past due nor impaired.**Excluding advances to contractors amounting to P=10,962,168.

- 59 -
*SGVFS008696*
The tables below show the credit quality by class of asset for loan-related balance sheet linesbased on the Group’s credit rating system:
December 31, 2014:Neither past due nor impaired Past due butHigh Grade* Medium Grade** not impaired Total
Financial Assets at Fair Valuethrough profit or loss
Investments in Trust Funds P=38,105,350 P=– P=– P=38,105,350Loans and receivables:
Cash and cash equivalents,excluding cash on hand*** 1,368,477,262 – – 1,368,477,262
Short-term cash investments 1,461,213,555 – – 1,461,213,555Escrow deposit 43,801,433 – – 43,801,433Refundable deposits 39,267,581 – – 39,267,581Installment contracts
receivable 2,160,899,981 – 29,080,510 2,189,980,491Other receivables****:
Rent receivable 13,221,900 – – 13,221,900Accrued interest 6,616,270 – – 6,616,270Advances to customers 21,135,538 – 9,882,049 31,017,587Retention 4,120,879 – 2,092 4,122,971Others 9,938,829 5,407,030 279,516 15,625,375
Available-for-sale financial assets 2,520,571 – – 2,520,571Total P=5,169,319,149 P=5,407,030 P=39,244,167 P=5,213,970,346* High Grade - financial assets with reputable counterparties and which management believes to be reasonably assured to be recoverable.** Medium Grade - financial assets for which there is low risk of default of counterparties.*** Excluding cash on hand amounting to P=203,000.**** Excluding advances to contractors amounting to P=9,236,183.
December 31, 2013:Neither past due nor impaired Past due butHigh Grade* Medium Grade** not impaired Total
Financial Assets at Fair Valuethrough profit or loss
Investments in Trust Funds P=36,512,483 P=– P=– P=36,512,483Loans and receivables:
Cash and cash equivalents,excluding cash on hand*** 835,105,009 – – 835,105,009
Short-term cash investments 2,265,607,000 – – 2,265,607,000Refundable deposits 28,870,885 – – 28,870,885Installment contracts
receivable 2,052,242,890 – 26,880,298 2,079,123,188Other receivables****: –
Accrued interest 10,113,550 – – 10,113,550Advances to customers 19,715,911 – 12,250,609 31,966,520Retention 3,981,487 – 2,092 3,983,579Others 7,010,014 4,894,936 467,326 12,372,276
Available-for-sale financial assets 2,208,456 – – 2,208,456Total P=5,261,367,685 P=4,894,936 P=39,600,325 P=5,305,862,946* High Grade - financial assets with reputable counterparties and which management believes to be reasonably assured to be recoverable.** Medium Grade - financial assets for which there is low risk of default of counterparties.*** Excluding cash on hand amounting to P=210,069.**** Excluding advances to contractors amounting to P=10,962,168.
The main considerations for impairment assessment include whether any payments are overdue orif there are any known difficulties in the cash flows of the counterparties. The Group assessesimpairment into two areas: individually assessed allowances and collectively assessed allowances.
The Group determines allowance for each significant receivable on an individual basis. Amongthe factors that the Group considers in assessing impairment is the inability to collect from thecounterparty based on the contractual terms of the receivables. The Group also considers the fair

- 60 -
*SGVFS008696*
value of the real estate collateralized in computing the impairment of the receivables. Receivablesincluded in the specific assessment are those receivables under the installment contracts receivableaccounts.
For collective assessment, allowances are assessed for receivables that are not individuallysignificant and for individually significant receivables where there is no objective evidence ofindividual impairment. Impairment losses are estimated by taking into consideration the age ofthe receivables, past collection experience and other factors that may affect collectability.
No impairment has been recognized because the Group holds the title to the real estate propertieswith outstanding installment contracts receivable balance, and the Group can repossess such realestate properties upon default of the customer in paying the outstanding balance.
Liquidity riskLiquidity risk is defined as the risk that the Group would not be able to settle or meet itsobligations on time or at a reasonable price.
The Group’s objective is to maintain a balance between continuity of funding and flexibilitythrough the use of STCPs (see Note 14).
The tables below summarize the maturity analysis of the Group’s financial assets held formanaging liquidity and financial liabilities based on contractual discounted payments:
December 31, 2014:
30 days 31 - 90 days 91 - 180 days 181 - 360 days Above 1 year TotalFinancial AssetsCash and cash equivalents P=824,600,818 P=544,079,444 P=– P=– P=– P=1,368,680,262Short-term cash investments 493,200,000 833,920,555 134,093,000 – – 1,461,213,555Installment contracts receivable 58,587,453 218,823,737 47,418,198 326,173,737 1,538,977,366 2,189,980,491Escrow deposit 43,801,433 – – – – 43,801,433Refundable deposits – – – – 39,267,581 39,267,581Other receivables* 42,644,194 2,622,133 4,475,942 19,236,069 1,625,765 70,604,103Financial assets at FVPL – – – – 38,105,350 38,105,350Available-for-sale financial assets – – – – 2,520,571 2,520,571
1,462,833,898 1,599,445,869 185,987,140 345,409,806 1,620,496,633 5,214,173,346Financial LiabilitiesAccounts payable and accrued
expenses** 177,331,521 25,233,248 102,426,760 75,601,859 138,077,066 518,670,454Notes payable*** 974,202,163 1,377,163,469 120,474,009 71,859,917 – 2,543,699,558Contracts payable 112,500,000 – – 6,772,386 – 119,272,386
1,264,033,684 1,402,396,717 222,900,769 154,234,162 138,077,066 3,181,642,398Liquidity Position P=198,800,214 P=197,049,152 (P=36,913,629) P=191,175,644 P=1,482,419,567 P=2,032,530,948* Excludes advances to contractors amounting to P=9,236,183.**Excludes statutory liabilities, interest payable and deferred rent income amounting to P=11,205,671, P=3,068,652 and P=2,771,526, respectively.*** Includes future interest expense amounting to P=26,899,558.

- 61 -
*SGVFS008696*
December 31, 2013:
30 days 31 - 90 days 91 - 180 days 181 - 360 days Above 1 year TotalFinancial AssetsCash and cash equivalents P=733,165,078 P=102,150,000 P=– P=– P=– P=835,315,078Short-term cash investments 745,460,000 1,102,450,000 416,400,000 1,297,000 – 2,265,607,000Installment contracts receivable 62,544,489 59,549,829 156,391,770 167,882,122 1,632,754,978 2,282,882,234Refundable deposits – – – 28,870,885 28,870,885Other receivables* 43,529,395 1,344,536 4,284,999 8,089,767 1,187,227 58,435,924Financial assets at FVPL – – – – 36,512,483 36,512,483Available-for-sale financial assets – – – – 2,208,456 2,208,456
1,584,698,962 1,265,494,365 577,076,769 177,268,889 1,701,534,029 5,306,073,014Financial LiabilitiesAccounts payable and accrued
expenses* P=171,933,206 P=49,775,814 P=120,951,737 P=187,709,299 P=166,917,840 P= 697,287,896Notes payable** 1,375,469,802 1,157,734,134 238,671,628 86,233,252 – 2,858,108,816Contracts payable – – – 6,772,386 – 6,772,386
1,547,403,008 1,207,509,948 359,623,365 280,714,937 166,917,840 3,562,169,098P=37,295,954 P=57,984,417 P=217,453,404 (P=103,446,048) P=1,534,616,189 P=1,743,903,916
*Excludes statutory liabilities and accrued interest amounting to P=10.126,999 and P=5,345,332, respectively.** Includes future interest expense amounting to P=60,408,841.
Fair ValuesThe fair values of the financial assets and financial liabilities and investment properties as ofDecember 31 are as follows:
Date of Valuation: December 31, 2014Fair value
Level 1 Level 2 Level 3Assets measured at fair value
Investment in trust fundFinancial assets at FVPL
Debt securities P=5,032,165 P=– P=–Available-for-sale financial assets
Debt securities 19,566,930 – –Equity securities – listed 2,155,138 – –
Investment properties – – 6,162,000Available-for-sale financial assets 2,520,571 – –Repossessed inventories – 98,619,664 –
Assets for which fair values are disclosedInvestment properties – – 4,854,203,070
Date of Valuation: December 31, 2013Fair value
Level 1 Level 2 Level 3Assets measured at fair value
Investment in trust fundFinancial assets at FVPL
Debt securities P=4,924,549 P=– P=–Available-for-sale financial assets
Debt securities 20,177,260 – –Equity securities – listed 2,075,600 – –
Investment properties – – 4,458,781Available-for-sale financial assets 2,208,456 – –
Assets for which fair values are disclosedInvestment properties – – 4,387,347,000

- 62 -
*SGVFS008696*
Cash and cash equivalents, short-term cash investments, installment contracts receivable, otherreceivables, accounts payable and accrued expenses and contracts payableDue to the short-term nature of the transactions, the fair values of cash and cash equivalents,short-term cash investments, other receivables and accounts payable and accrued expensesapproximate their carrying amounts. The fair value of installment contracts receivableapproximate its carrying amount as it carries interest rates that approximate the interest rate forcomparable instruments in the market.
Financial assets at FVPL and available-for-sale financial assetsFinancial assets at FVPL and available-for-sale financial assets are stated at fair value based onquoted market prices.
Repossessed real estate properties for saleThe fair value of repossessed real estate properties for sale is based on the Group’s current sellingprice per area/slot of the property.
Investment propertiesThe fair value of investment properties is determined using sales comparison and market dataapproach. Sales comparison approach considers the sales of similar or substitute properties andother related market data had the investment properties been transacted in the market. Whilemarket data approach considers the sales and listings and other market data of comparableproperties registered within the vicinity of the property being valued. The significant unobservableinputs used in determining the fair value are the sales price per square meter of similar orsubstitute property, location, size, shape of lot and the highest and best use. The fair value of theinvestment properties as of December 31, 2014 and 2013 approximates and represents the highestand best use of the said properties.
27. Capital Management
The primary objective of the Group’s capital management is to ensure that it maintains a strongcredit and healthy capital ratios in order to support its business and maximize shareholder value.
The Group manages its capital structure and makes adjustments to it, in the light of changes ineconomic conditions. It monitors capital using leverage ratios on both gross debt and net debtbasis. Debt consists of short-term debt. Net debt includes short-term debt less cash and cashequivalents and short-term cash investments. The Group considers as capital the equity holders ofthe parent company less net changes in fair values of available-for-sale financial assets asaccumulated re-measurement on defined benefit plan.
As of December 31, 2014 and 2013, the Group had the following ratios:
2014 2013Notes and contracts payable P=2,636,072,386 P=2,804,472,361
Total equity attributable to parent P=5,443,039,160 P=5,014,118,958Less (Add):Net changes in fair values of available-for-sale
financial assets 1,800,356 1,529,813Accumulated re-measurement on defined
benefit plan (21,303,519) (18,985,227)P=5,462,542,323 P=5,031,574,372
Debt to equity ratio 0.48:1 0.56:1

- 63 -
*SGVFS008696*
2014 2013Notes and loans payable P=2,636,072,386 P=2,804,472,361Less:
Cash and cash equivalents 1,368,680,262 835,315,078Short-term cash investments 1,461,213,555 2,265,607,000
(P=193,821,431) (P=296,449,717)
Total equity attributable to parent P=5,443,039,160 P=5,014,118,958Less (Add):Net changes in fair values of available-for-sale
financial assets 1,800,356 1,529,813Accumulated re-measurement on defined
benefit plan (21,303,519) (18,985,227)P=5,462,542,323 P=5,031,574,372
Net debt to equity ratio (0.04:1) (0.06:1)
As of December 31, 2014 and 2013, the Group has no externally imposed capital requirements.
28. Basic/Diluted Earnings Per Share
Basic/diluted earnings per share amounts were computed as follows:
2014 2013 2012Net income attributable to equity holders of
the parent P=570,361,026 P=583,502,525 P=397,116,645Weighted average number of shares 62,506,473 62,506,473* 62,506,473*Basic/diluted earnings per share P=9.12 P=9.34 P=6.35*After retroactive effect of 20% stock dividends in 2014.
The Group has no dilutive common shares as of December 31, 2014, 2013 and 2012. Thus, thebasic and diluted earnings per share are the same as of those dates.
29. Business Segments
The Group derives its revenues primarily from the sale and lease of real estate properties andmarketing of pension plans. The Group does not have any major customers and all sales and leasesof real estate properties and sales of pension plans are made to external customers.

- 64 -
*SGVFS008696*
Segment Revenue and Expenses
2014Sales of Real
Estate PropertiesLease of Real
Estate PropertiesPension Plan
Operations TotalRevenue: Sales of real estate P=2,353,143,758 P=– P=– P=2,353,143,758 Financial income 401,328,624 – 415,153 401,743,777
Rent income – 93,881,272 – 93,881,272Other income 81,762,966 – 4,059,472 85,822,438
Cost of real estate sales 1,351,359,698 – 7,575,063 1,358,934,761Operating expenses Personnel 224,192,504 – 2,248,129 226,440,633 Taxes and licenses 60,845,886 7,456,534 – 68,302,420 Professional fees 32,020,073 – – 32,020,073 Insurance 22,109,748 – – 22,109,748 Depreciation 12,935,717 27,908,453 – 40,844,170 Others 110,706,695 9,238,021 – 119,944,716Financial expenses 18,335,946 – – 18,335,946Other expenses 41,119,620 – 41,680 41,161,300Provision for (benefit from) income tax 202,761,556 14,783,479 (1,617,214) 215,927,821Net income P=759,847,905 P=34,494,785 (P=3,773,033) P=790,569,657
2013Sales of Real
Estate PropertiesLease of Real
Estate PropertiesPension Plan
Operations TotalRevenue: Sales of real estate P=2,026,969,356 P=– P=– P=2,026,969,356 Financial income 493,151,846 – 551,972 493,703,818
Rent income – 38,549,278 – 38,549,278Other income 155,643,336 – 3,112,252 158,755,588
Cost of real estate sales 1,033,654,388 – 4,547,878 1,038,202,266Operating expenses Personnel 365,378,600 – 2,095,167 367,473,767 Taxes and licenses 59,699,342 7,079,109 695,770 67,474,221 Professional fees 39,412,046 – 345,459 39,757,505 Insurance 19,649,357 – 861 19,650,218 Depreciation 13,306,410 2,465,909 1,158,396 16,930,715 Others 21,254,544 8,380,823 529,833 30,165,200Financial expenses 38,271,772 – – 38,271,772Other expenses 30,165,200 – – 30,165,200Provision for income tax 194,168,373 6,187,031 223,122 200,578,526Net income P=860,804,506 P=14,436,406 (P=5,932,262) P=869,308,650
2012Sales of Real
Estate PropertiesLease of Real
Estate PropertiesPension Plan
Operations TotalRevenue: Sales of real estate P=1,905,013,492 P=– P=– P=1,905,013,492 Financial income 610,207,708 – 1,446,548 611,654,256 Rent income – 33,866,718 – 33,866,718 Other income 25,906,268 – 3,967,135 29,873,403Cost of real estate sales 1,140,273,269 – 6,445,905 1,146,719,174
(Forward)

- 65 -
*SGVFS008696*
Sales of RealEstate Properties
Lease of RealEstate Properties
Pension PlanOperations Total
Operating expenses Personnel P=227,947,060 P=– P=2,410,804 P=230,357,864 Taxes and licenses 62,880,026 8,043,175 104,200 71,027,401 Professional fees 25,324,778 – 621,176 25,945,954 Insurance 19,928,833 – 916 19,929,749 Depreciation 13,727,949 6,431,310 – 20,159,259 Others 117,137,585 6,602,024 30,285 123,769,894Financial expenses 82,890,845 – – 82,890,845Other expenses 35,237,039 – – 35,237,039Provision for (benefit from)
income tax 147,802,999 3,837,063 (1,647,387) 149,992,675Net income P=666,346,630 P=8,953,146 (P=2,552,216) P=674,378,015
Segment Assets and Liabilities
December 31, 2014:
Sales of RealEstate Properties
Lease of RealEstate Properties
Pension PlanOperations Total
Total assets P=9,399,172,381 P=2,940,483,006 P=177,634,309 P=12,517,286,696Total liabilities 3,750,845,363 25,115,127 60,281,875 3,836,242,365
December 31, 2013:
Sales of RealEstate Properties
Lease of RealEstate Properties
Pension PlanOperations Total
Total assets P=9,561,248,304 P=2,688,714,392 P=181,460,564 P=12,431,423,260Total liabilities 4,304,292,025 8,701,762 27,368,295 4,340,362,082
30. Income Subject to Tax Holiday
Registration with the Board of Investments (BOI)The Group is entitled to ITH for a period of three to four years from various dates indicated in theregistration or actual start of commercial operations, whichever is earlier. The ITH is limited onlyto revenue generated from this registered project. Revenues from units with selling priceexceeding P=3.00 million shall not be covered by ITH.
The Group has registered the following New Developer of Low-Cost Mass Housing Projects withBOI under the Omnibus Investment Code of 1987 (Executive Order No. 226):
As of December 31, 2014 and 2013:
Name Registration No. Date RegisteredParent Company:
Tagaytay Prime Residences 2010-123 July 5, 2010The Manila Residences Tower II 2009-151 August 23, 2010
CDC:Pines Peak Tower I 2012-092 June 1, 2012Grand Central Residence I 2010-117 June 16, 2010
Makati Executive Tower IV 2009-016 February 12, 2009

- 66 -
*SGVFS008696*
31. Contingencies
The Group is contingently liable for certain lawsuits or claims filed by third parties which areeither pending decisions by the courts or are under negotiation, the outcomes of which are notpresently determinable. In the opinion of management and its legal counsel, the eventual liabilityunder these lawsuits or claims, if any, will not have a material effect on the consolidated financialstatements. Hence, no provision was recognized as of December 31, 2014 and 2013.