City Study and Automated Transport Systems Assessment in the ...
128
CITIES DEMONSTRATING AUTOMATED ROAD PASSANGER TRANSPORT European Research Program CityMobil2 D7.1 Brussels-Capital Region context and Automated Transport Systems Assessment SEVENTH FRAMEWORK PROGRAMME THEME SST.2012.3.1-4. AUTOMATED URBAN VEHICLES COLLABORATIVE PROJECT – GRANT AGREEMENT N°: 314190 Work Package WP.7 Deliverable number D7.1 Authors Louis Duvigneaud ; Pierre-Yves Ancion ; Jeoffrey Honoré Co-authors Pierre Schmitz ; Karl Determe Authors’ affiliation BruxellesMobilité ; Stratec ; GEA Status Final Dissemination level (PU/PP/RE/CO) Delivery date (planned): Mxx-31.10.2013 Delivery date (actual): Mxx-26.11.2013
Transcript of City Study and Automated Transport Systems Assessment in the ...
CITIES DEMONSTRATING AUTOMATED ROAD PASSANGER TRANSPORT
European Research Program CityMobil2
D7.1 Brussels-Capital Region context and Automated Transport Systems Assessment
SEVENTH FRAMEWORK PROGRAMME
THEME SST.2012.3.1-4.
AUTOMATED URBAN VEHICLES
COLLABORATIVE PROJECT – GRANT AGREEMENT N°: 314190
Work Package WP.7
Deliverable number D7.1
Authors Louis Duvigneaud ; Pierre-Yves Ancion ; Jeoffrey Honoré
Co-authors Pierre Schmitz ; Karl Determe
Authors’ affiliation BruxellesMobilité ; Stratec ; GEA
Status Final
Dissemination level (PU/PP/RE/CO)
Delivery date (planned): Mxx-31.10.2013
Delivery date (actual): Mxx-26.11.2013

Page | 2 D7.1 Brussels-Capital Region context and ATS Assessment, version 1
Document control sheet
Title boxtext
Creator
Editor
Brief Description
Publisher
Contributors
Type (Deliverable/Milestone)
Format
Creation date
Version number
Version date
Last modified by
Rights
Dissemination level
internal public restricted, access granted to: EU Commission
Action requested
to be revised by Partners involved in the preparation of the deliverable for approval of the WP Manager for approval of the Internal Reviewer (if required) for approval of the Project Co-ordinator
Deadline for approval
Version Date Modified by Comments
Boxtext

Page | 3 D7.1 Brussels-Capital Region context and ATS Assessment, version 1
Table of Contents
1. Introduction .................................................................................................................... 5
1.1 City study framework .............................................................................................. 5
1.2 City study goals and scope ..................................................................................... 5
1.3 City study methodology ........................................................................................... 5
2. Brussels city and local transport system description ...................................................... 6
2.1 Urban structure and topography .............................................................................. 6
2.2 Transport networks ................................................................................................. 9
2.2.1 Road network................................................................................................... 9
2.2.2 Public transports ............................................................................................ 11
2.3 Regional planning ................................................................................................. 13
3. Problems, Objectives and expected impacts ................................................................ 16
3.1 Problems .............................................................................................................. 16
3.2 Objectives ............................................................................................................. 16
3.3 Potential impacts .................................................................................................. 16
4. Identification of potential sites ...................................................................................... 17
4.1 European district ................................................................................................... 18
4.1.1 Presentation of the study area ....................................................................... 18
4.1.2 Demand estimation ........................................................................................ 26
4.1.3 System pre-design ......................................................................................... 37
4.1.4 Initial assessment .......................................................................................... 39
4.1.5 Initial practical feasibility analyses .................................................................. 40
4.2 The Heysel ........................................................................................................... 41
4.2.1 Presentation of the study area ....................................................................... 41
4.2.2 Demand estimation ........................................................................................ 47
4.2.3 System pre-design ......................................................................................... 53
4.2.4 Initial assessment .......................................................................................... 54
4.2.5 Initial practical feasibility analyses .................................................................. 55
4.3 Saint Luc Clinics ................................................................................................... 56
4.3.1 Presentation of the study area ....................................................................... 56
4.3.2 Demand estimation ........................................................................................ 62
4.3.3 System pre-design ......................................................................................... 68
4.3.4 Initial assessment .......................................................................................... 70
4.3.5 Initial practical feasibility analyses .................................................................. 70

Page | 4 D7.1 Brussels-Capital Region context and ATS Assessment, version 1
5. Intra city site selection .................................................................................................. 72
6. Initial evaluation ........................................................................................................... 74
7. System dimensioning ................................................................................................... 79
7.1 Demand analysis .................................................................................................. 79
7.1.1 Modeling tools ................................................................................................ 79
7.1.2 Modal Choice in Brussels model .................................................................... 80
7.1.3 Assignment .................................................................................................... 94
7.2 Supply dimensioning ............................................................................................. 95
7.3 Urban integration .................................................................................................. 97
7.3.1 Safety behaviour ............................................................................................ 97
7.3.2 Vehicle characteristics ................................................................................... 98
7.3.3 Stations .......................................................................................................... 98
7.3.4 Automated vehicles itinerary .......................................................................... 99
7.3.5 Accompanying measures ............................................................................. 109
7.4 Citizen awareness campaign plan ....................................................................... 112
7.4.1 Citizen awareness campaign context ........................................................... 112
7.4.2 Step 1 - campaign aims and objectives ........................................................ 115
7.4.3 Step 2 – Formative research: target population segmentation and baseline
evaluation .................................................................................................................. 116
7.4.4 Step 3 – Campaigning the campaign: stakeholders and political support ..... 118
7.4.5 Step 4 - social Marketing mix ....................................................................... 119
7.4.6 Step 5 - SWOT analysis ............................................................................... 122
8. Ex-ante evaluation ..................................................................................................... 123
9. Conclusion ................................................................................................................. 128

Page | 5 D7.1 Brussels-Capital Region context and ATS Assessment, version 1
1. Introduction
1.1 City study framework
Today‟s technologies allow vehicles to drive themselves autonomously on roads and bring
up a wide range of implementation opportunities. Although automated individual cars will not
be available on the short term due to legislative, safety and liability problems, automated
vehicles are currently becoming the basis of new forms of urban transportation.
However, several barriers are still hampering the deployment of automated vehicles for
public transport improvement including the legal framework that does not allow self-driving
vehicles on normal roads, the implementation of the system that can be relatively complex
and the economic benefit that are still uncertain.
1.2 City study goals and scope
Therefore, CityMobil2 project aim at supporting the development of automated transport
systems by implementing large-scale pilot platforms for technical and socioeconomic test in
urban environments.
Brussels-Mobility, Stratec and GEA are part of the consortium in charge of the project and
are leading the candidacy of Brussels-Capital Region for hosting a pilot automated transport
system demonstration.
1.3 City study methodology
In this report, we first present Brussels political and planning context. Public transport
organisation and local problems that could be solved by the introduction of innovative
transport systems are also investigated. Then, potential sites, where automated transport
system could be implemented, are identified and investigated. Finally, the most suitable
opportunity is further investigated regarding to the itinerary, the dimensioning of the demand
and the supply, the urban integration and the citizen awareness campaign.
Page | 6 D7.1 Brussels-Capital Region context and ATS Assessment, version 1
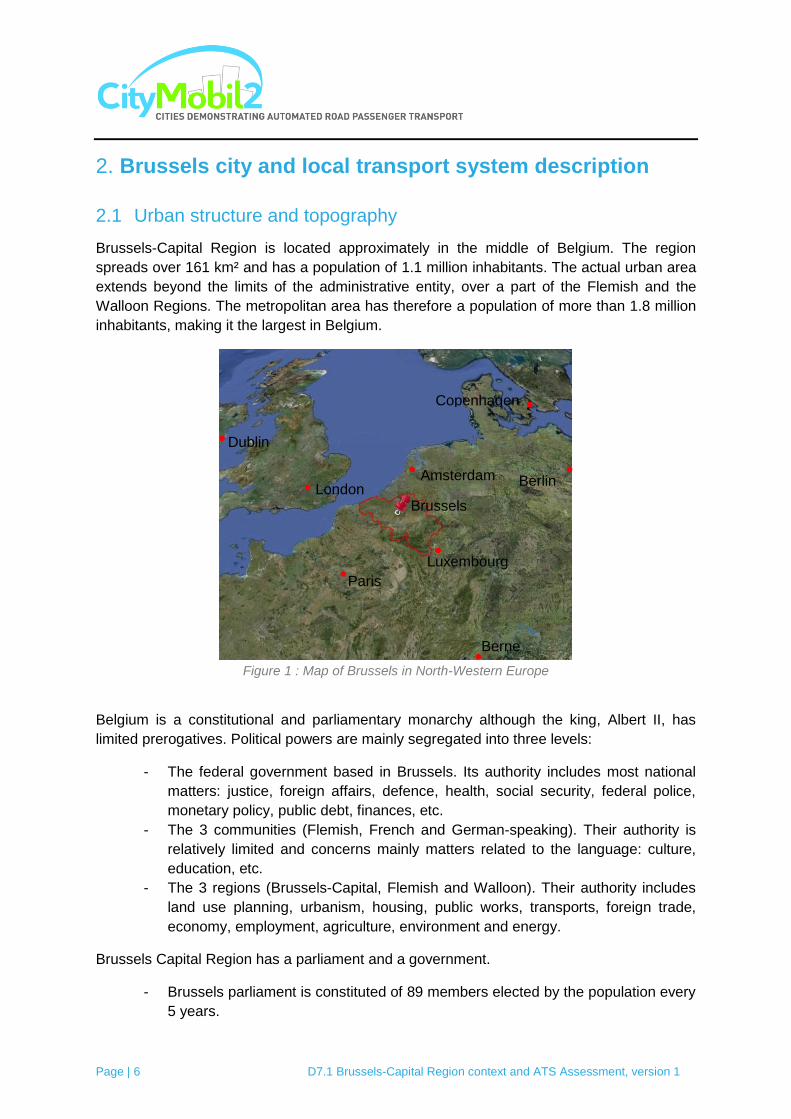
2. Brussels city and local transport system description
2.1 Urban structure and topography
Brussels-Capital Region is located approximately in the middle of Belgium. The region
spreads over 161 km² and has a population of 1.1 million inhabitants. The actual urban area
extends beyond the limits of the administrative entity, over a part of the Flemish and the
Walloon Regions. The metropolitan area has therefore a population of more than 1.8 million
inhabitants, making it the largest in Belgium.
Figure 1 : Map of Brussels in North-Western Europe
Belgium is a constitutional and parliamentary monarchy although the king, Albert II, has
limited prerogatives. Political powers are mainly segregated into three levels:
- The federal government based in Brussels. Its authority includes most national
matters: justice, foreign affairs, defence, health, social security, federal police,
monetary policy, public debt, finances, etc.
- The 3 communities (Flemish, French and German-speaking). Their authority is
relatively limited and concerns mainly matters related to the language: culture,
education, etc.
- The 3 regions (Brussels-Capital, Flemish and Walloon). Their authority includes
land use planning, urbanism, housing, public works, transports, foreign trade,
economy, employment, agriculture, environment and energy.
Brussels Capital Region has a parliament and a government.
- Brussels parliament is constituted of 89 members elected by the population every
5 years.
London
Dublin
Amsterdam
Luxembourg
Paris
Berlin
Copenhagen
Berne
Brussels
Page | 7 D7.1 Brussels-Capital Region context and ATS Assessment, version 1
- Brussels government is chosen by the parliament. It is headed by a Minister-
President (currently Charles Picqué), four ministers and three state secretaries.
The state secretary in charge of mobility matters is currently Bruno De Lille and the state
secretary in charge of the transports is Brigitte Grouwels. Their work is supported by the
administrations of the region.
“Brussels Mobility”, who is leading the candidacy of Brussels Capital Region in CityMobil2
project, is the administration of the region for equipment, infrastructure and mobility issues.
They develop mobility strategies, maintain and develop public spaces, roads and public
transport infrastructures.
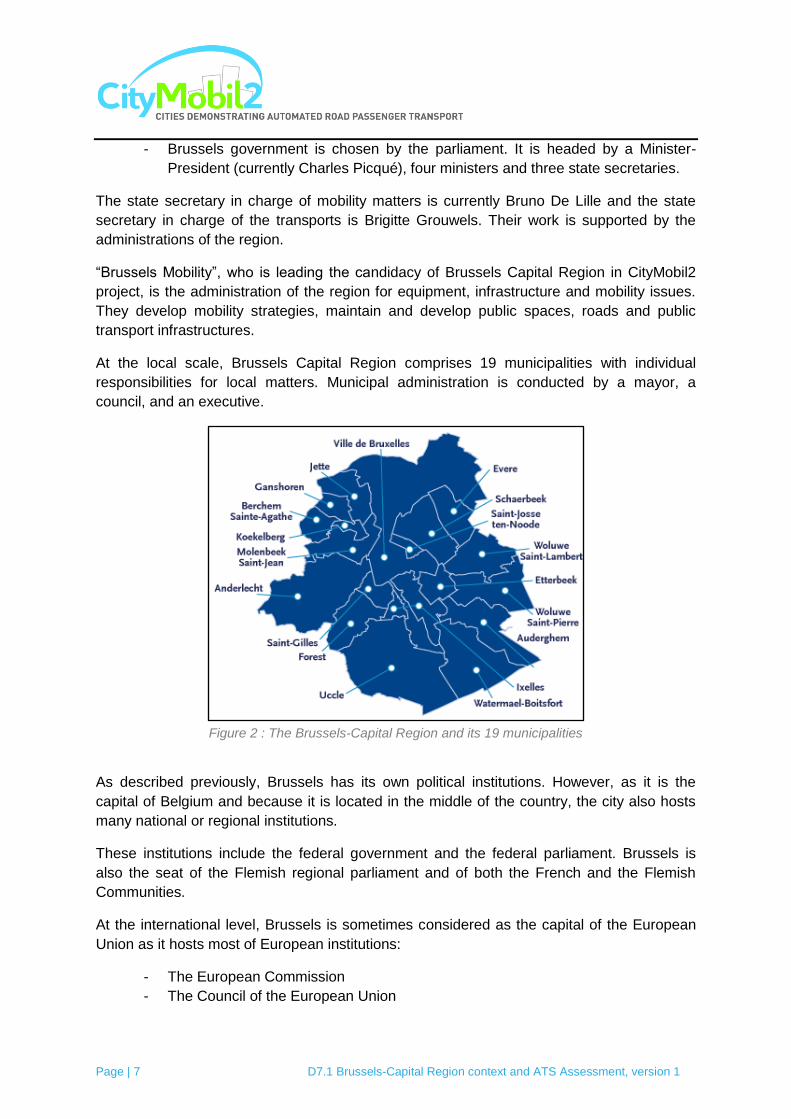
At the local scale, Brussels Capital Region comprises 19 municipalities with individual
responsibilities for local matters. Municipal administration is conducted by a mayor, a
council, and an executive.
Figure 2 : The Brussels-Capital Region and its 19 municipalities
As described previously, Brussels has its own political institutions. However, as it is the
capital of Belgium and because it is located in the middle of the country, the city also hosts
many national or regional institutions.
These institutions include the federal government and the federal parliament. Brussels is
also the seat of the Flemish regional parliament and of both the French and the Flemish
Communities.
At the international level, Brussels is sometimes considered as the capital of the European
Union as it hosts most of European institutions:
- The European Commission
- The Council of the European Union
Page | 8 D7.1 Brussels-Capital Region context and ATS Assessment, version 1
- Brussels hemicycle where a number of plenary sessions of the parliament take
place
- Several other institutions including the Committee of the Regions, the Economic
and Social Committee and the Council of European Municipalities and Regions.
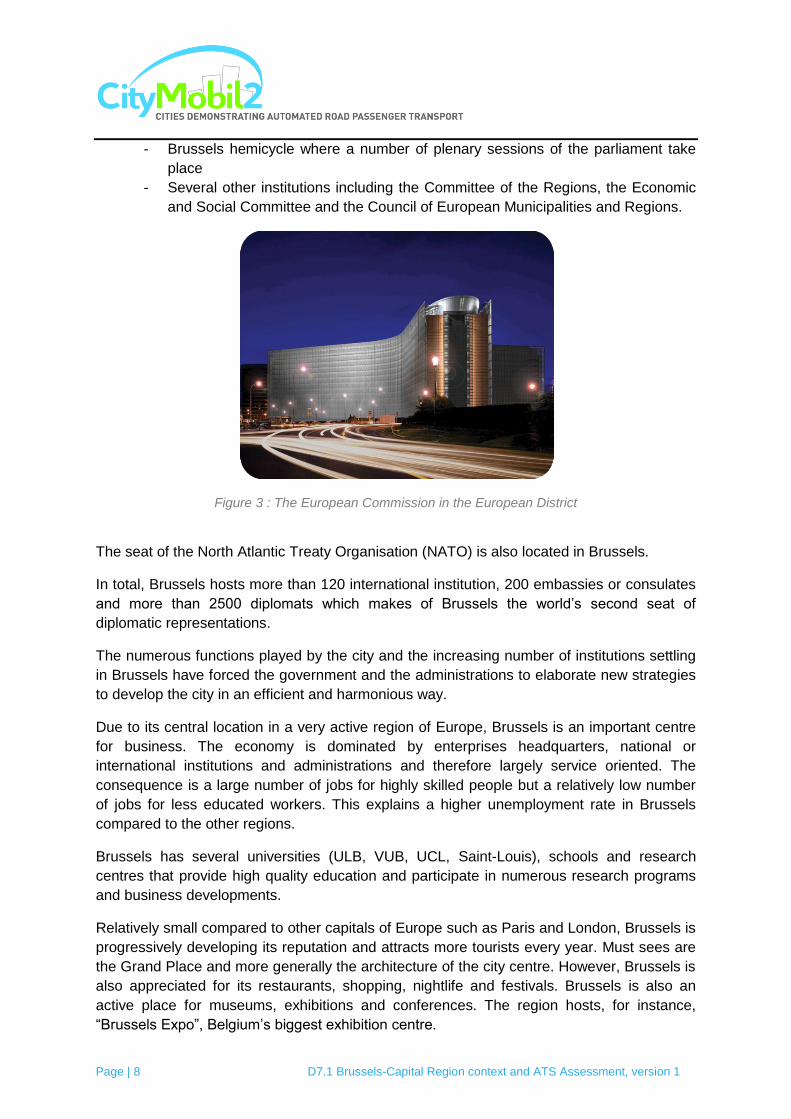
Figure 3 : The European Commission in the European District
The seat of the North Atlantic Treaty Organisation (NATO) is also located in Brussels.
In total, Brussels hosts more than 120 international institution, 200 embassies or consulates
and more than 2500 diplomats which makes of Brussels the world‟s second seat of
diplomatic representations.
The numerous functions played by the city and the increasing number of institutions settling
in Brussels have forced the government and the administrations to elaborate new strategies
to develop the city in an efficient and harmonious way.
Due to its central location in a very active region of Europe, Brussels is an important centre
for business. The economy is dominated by enterprises headquarters, national or
international institutions and administrations and therefore largely service oriented. The
consequence is a large number of jobs for highly skilled people but a relatively low number
of jobs for less educated workers. This explains a higher unemployment rate in Brussels
compared to the other regions.
Brussels has several universities (ULB, VUB, UCL, Saint-Louis), schools and research
centres that provide high quality education and participate in numerous research programs
and business developments.
Relatively small compared to other capitals of Europe such as Paris and London, Brussels is
progressively developing its reputation and attracts more tourists every year. Must sees are
the Grand Place and more generally the architecture of the city centre. However, Brussels is
also appreciated for its restaurants, shopping, nightlife and festivals. Brussels is also an
active place for museums, exhibitions and conferences. The region hosts, for instance,
“Brussels Expo”, Belgium‟s biggest exhibition centre.

Page | 9 D7.1 Brussels-Capital Region context and ATS Assessment, version 1
Figure 4: Grand Place of Brussels
2.2 Transport networks
2.2.1 Road network
Brussels has a central location in Belgium road network. Therefore, the city is connected to a
great number of motorways leading to most other surrounding cities (Antwerp, Ghent, Liège,
Namur, Charleroi, etc.).
These motorways are interconnected by a ring (R0) that surrounds Brussels Capital Region.
Inside the city, major axes lead the traffic towards the city centre and connect two other
rings: the greater ring (which is only half a ring on the East side of the city) and the inner
ring. These main axes (generally classified as “metropolitan” or “main” roads) are then
connected to secondary roads (generally classified as “Inter-suburb”, “collector” or “local”
roads). Most metropolitan and main roads are managed by the Region whereas inter-
suburb, collector and local roads are managed by the municipalities.

Page | 10 D7.1 Brussels-Capital Region context and ATS Assessment, version 1
Figure 5: Road network in Brussels Capital Region
Although the use of public transports is increasing every year, cars are still the first mean of
transport in Brussels Capital Region. For more than half a million trips occurring daily during
peak hours, about 60% are travelled by car.
Furthermore, Brussels economic activities provide a high number of jobs, not only for
Brussels inhabitants but also for many commuters living in the other regions. In 2008, for
686 500 jobs, 356 500 (51.9%) were held by commuters1.
1Eures, The European Job Mobility Portal, http://ec.europa.eu/eures/
Motorway
Metropolitan roads
Main roads
Inter-suburb roads
Collector road
Local road
Ring (R0)
Ring (R0)
E40
Brussels
Airport
E40
E19 E411
E19 A12
Mechelen
Antwerp
Leuven
Liège
Namur
Luxembourg Charleroi
Lille
Paris
Ghent Bruges
Antwerp
Inner Ring
Greater Ring
Page | 11 D7.1 Brussels-Capital Region context and ATS Assessment, version 1
These reasons explain partly that Brussels is currently one of the most congested cities in
Europe. In the last decade, a range of measures including parking pricing and several
improvements of the public transport network have been implemented to reduce the use of
cars. These measures have caused partly an important increase of public transport use
(+60%) but only a stabilization of car use.
Several measures will also be implemented in the next few years including perhaps a road
pricing and a reduction of parking capacity (- 25 000 parking spaces).All these measures
should induce a modal shift from cars to public transports and help Brussels-Capital Region
to reach its objective of reduction of GHG emissions (-20% in 2015 compared 1999).
2.2.2 Public transports
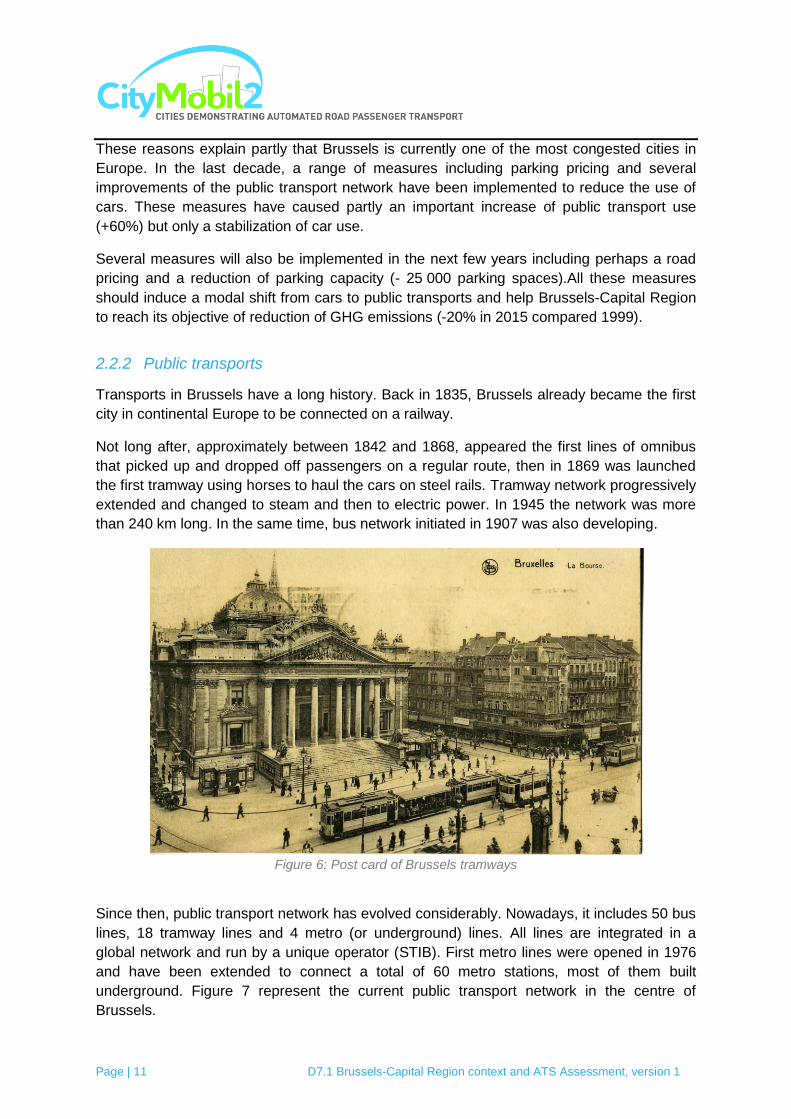
Transports in Brussels have a long history. Back in 1835, Brussels already became the first
city in continental Europe to be connected on a railway.
Not long after, approximately between 1842 and 1868, appeared the first lines of omnibus
that picked up and dropped off passengers on a regular route, then in 1869 was launched
the first tramway using horses to haul the cars on steel rails. Tramway network progressively
extended and changed to steam and then to electric power. In 1945 the network was more
than 240 km long. In the same time, bus network initiated in 1907 was also developing.
Figure 6: Post card of Brussels tramways
Since then, public transport network has evolved considerably. Nowadays, it includes 50 bus
lines, 18 tramway lines and 4 metro (or underground) lines. All lines are integrated in a
global network and run by a unique operator (STIB). First metro lines were opened in 1976
and have been extended to connect a total of 60 metro stations, most of them built
underground. Figure 7 represent the current public transport network in the centre of
Brussels.

Page | 12 D7.1 Brussels-Capital Region context and ATS Assessment, version 1
Figure 7: Extract of the map of public transports in Brussels
In 2011, the numbers of annual trips were estimated to 126 millions on metro lines, 112
millions on tramway lines and 92 millions on bus lines. These numbers are increasing every
year.
Bus, tramway and metro fleet is relatively modern although some of the tramways and
metros have to be renewed in the next few years. Some of the models run in Brussels are
presented in Figure 8.
Figure 8: left: bus in Brussels, middle: tramway in Brussels, right: metro in Brussels
In addition to the regional services, several bus lines operated by the Walloon (TEC) or the
Flemish (De Lijn) public transport companies also run in Brussels in order to connect
Brussels city centre with the Walloon and the Flemish Regions.
Brussels Capital Region has also an extensive rail network with 8 lines and 29 stations.
Railway management and operation is shared by 2 companies: Infrabel maintain and control
the network whereas SNCB run the trains and is in charge of the stations. All of the 29
Page | 13 D7.1 Brussels-Capital Region context and ATS Assessment, version 1
stations in Brussels Capital Region are connected with one or several bus, tramway or metro
lines.
In the future, rail network will be significantly upgraded with the Regional Express Network
(REN) that should be implemented between 2016 and 2025.REN is an express transit
system that offers fast connections and increased frequency within a 30 km radius of
Brussels.
Brussels (and more particularly Brussels-South station) is also a major component of the
European High Speed Train network.TGV, Thalys, Eurostar and ICE high speed trains start
or stop in Brussels and connect most European cities. London is at 1h 51min from Brussels,
Amsterdam 1h 53min, Köln 1h 47min and Paris 1h 22min.
2.3 Regional planning
As mentioned previously, “Brussels Mobility”, the administration in charge of the transports,
is investigating how to improve public transports and reduce road traffic congestion. It is
clear that sustainable mobility will only be reached by implementing integrated solutions
taking in consideration all transport modes. Therefore, various solutions are already
available in Brussels Capital Region:
- Cambio car sharing: This scheme allows subscribers to rent a car for short
periods of time. There are more than 90 different locations available in the region.
- ZenCars: This is also a car sharing scheme with the particularity of being 100%
electric. There are 16 different locations available in the region.
- Villo bike sharing: There are more than 200 stations where shared bikes are
available.
- Collecto: this is a collective taxi service. There are 200 stations where users can
get in specific taxis that collect and drop off other users on the road.
- Karzoo platform to organise carpooling

Page | 14 D7.1 Brussels-Capital Region context and ATS Assessment, version 1
Figure 9: Some of the alternative solutions available in Brussels: left to right and top to bottom: Cambio car-sharing, Zencar car-sharing, Villo bike-sharing and Collecto collective taxi service
The operator of public transports in Brussels Capital Region (STIB) is also working on a
project that will make current metro lines 1 and 5 fully automatic by 2016.
Figure 10: PULSAR automatic metro.
Globally the region aims at reducing road traffic by 20% within the next few years to reduce
traffic congestion and other related issues (e.g. atmospheric pollutant and greenhouse gas
emissions, noise).
To reach its objectives, Brussels Capital Region is investigating a set of measures that will
be implemented in the next few years. These measures include a road pricing system and
the increase of parking fees.
Page | 15 D7.1 Brussels-Capital Region context and ATS Assessment, version 1
First, to struggle against the road traffic increase, Brussels Capital Region has decided to set
up a road. The urban tolls creation in the region area should regulate the traffic and other
related nuisances.
These restrictive measures will be supported by the new Regional Express Network (REN)
and the development of cycling paths that will offer new alternatives to current road users.
Metros, tramways and buses are also continuously improved by extending lines, increasing
frequency and creating new connections between different public transport means.
Page | 16 D7.1 Brussels-Capital Region context and ATS Assessment, version 1
3. Problems, Objectives and expected impacts
3.1 Problems
Although Brussels has an extensive public transport network, city context analysis has
highlighted issues that remain unsolved, including road traffic congestion. At the local level,
accessibility by public transports is also not always optimal.
3.2 Objectives
To improve public transports and reduce road traffic congestion, one potential solution is the
deployment of automated vehicles.
3.3 Potential impacts
Based on the diagnostic, we first investigated all potential sites where automated vehicles
could be implemented. For all the sites we analysed issues that could be solved by the new
system and the suitability of the system (feasibility, urban integration, etc.). Three of these
sites stood out as particularly interesting and were further investigated. In the following
chapter, we explain how sites were selected and then for each site we describe the context,
the local issues and how automated vehicles could help resolving these issues.
Page | 17 D7.1 Brussels-Capital Region context and ATS Assessment, version 1
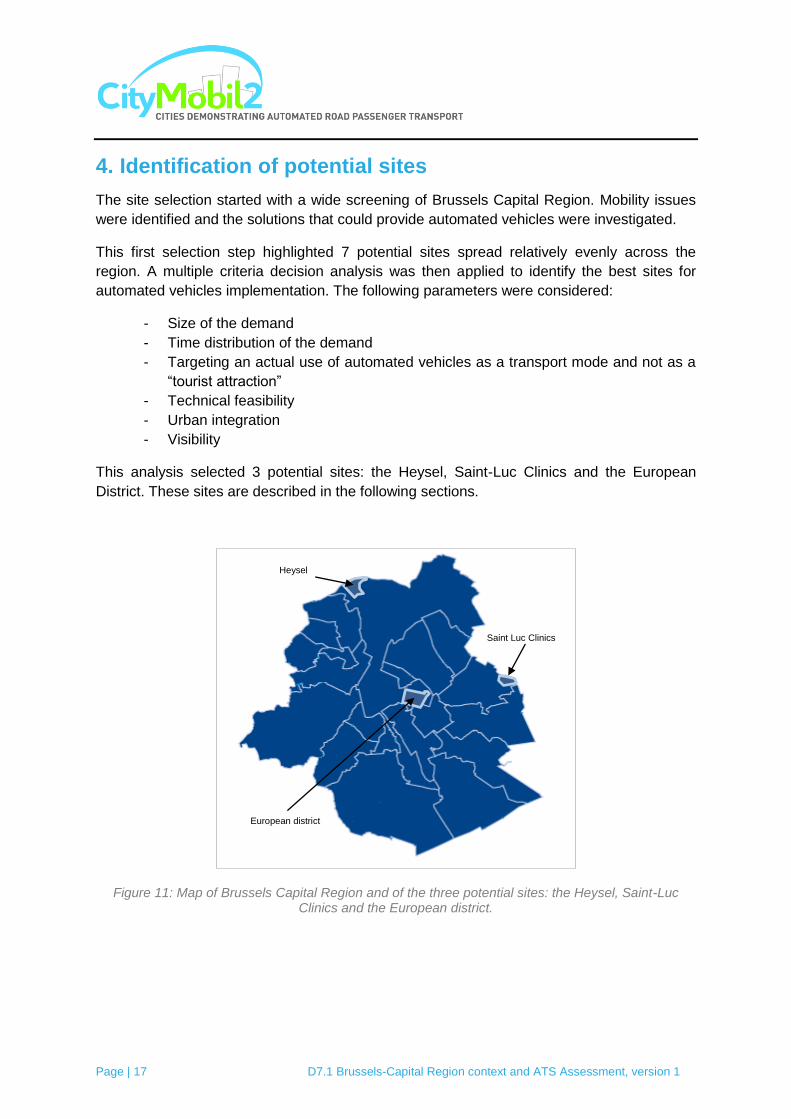
4. Identification of potential sites
The site selection started with a wide screening of Brussels Capital Region. Mobility issues
were identified and the solutions that could provide automated vehicles were investigated.
This first selection step highlighted 7 potential sites spread relatively evenly across the
region. A multiple criteria decision analysis was then applied to identify the best sites for
automated vehicles implementation. The following parameters were considered:
- Size of the demand
- Time distribution of the demand
- Targeting an actual use of automated vehicles as a transport mode and not as a
“tourist attraction”
- Technical feasibility
- Urban integration
- Visibility
This analysis selected 3 potential sites: the Heysel, Saint-Luc Clinics and the European
District. These sites are described in the following sections.
Figure 11: Map of Brussels Capital Region and of the three potential sites: the Heysel, Saint-Luc Clinics and the European district.
Heysel
Saint Luc Clinics
European district

Page | 18 D7.1 Brussels-Capital Region context and ATS Assessment, version 1
4.1 European district
4.1.1 Presentation of the study area
The European district, also called European quarter, corresponds approximately to the wide
area located between Brussels Park, Cinquantenaire Park and Leopold Park. The European
Commission and the European Council are located in the heart of this area close to
Schuman roundabout. The European Parliament is located further North next to Luxembourg
Square.
This area of Brussels, previously known as the Leopold Quarter, was initially residential but
changed progressively to an office oriented area even before the arrival of European
institutions. Historical buildings, although still present in some parts of the area, are now
often replaced by modern offices.
The fast development of the area did not always take place according to a high quality
master plan or to government initiatives, but often according to speculative private sector
projects. This led to a relative heterogeneity of architectural styles. However, more recently
large government investments in the quarter have been made and authorities point out that
previous unregulated development are now framed by a precise master plan.
The illustration bellow locates the different buildings and parks present in the European
quarter.

Page | 19 D7.1 Brussels-Capital Region context and ATS Assessment, version 1
Figure 12: Location of the buildings of the European Union
4.1.1.1 Commission buildings
The most iconic structure is the Berlaymont, the primary seat of the Commission. It was the
first building to be constructed for the Community, in the 1960‟s.
Charlemagne building, the second largest building of the Commission hosts the external
relations department.
Throughout the quarter, the Commission occupies 865 000m² in more than 60 buildings. The
Berlaymont and Charlemagne building are the only ones over 50 000m². Due to the
accession of 12 new members in 2004 and 2007, the staff has risen by 2 250, demanding an
extra 35 000m² of office space. Due to raising concerns that further buildings within the
district would create a "ghetto effect", the Commission has, since 2004, begun decentralizing
its institutions across the city (in areas such as “avenue de Beaulieu” and “rue de Genève” in
Evere municipality).
4.1.1.2 Other institutions
Justus Lipsius building is located on the other side of the street “Rue de la Loi” than the
Berlaymont. It hosts the Council of the European Union and the European Council. The
Council's secretariat was originally based in the city centre and is now in the Charlemagne
Commission
Parliament
Council
Other
Green space
Pedestrian area
Railway station
Metro station
Page | 20 D7.1 Brussels-Capital Region context and ATS Assessment, version 1
building but will move to the Residence Palace located next to Justus Lipsius building during
2013.
Buildings used by the Parliament are located a little further South between Leopold Park and
Luxembourg Square. The complex, called "Espace Léopold", is composed of two main
buildings: Paul-Henri Spaak and Altiero Spinelli which cover 372,000 m². These buildings
have recently been extended with 2 new extensions (D4 and D5 buildings completed in 2007
and 2008) and should provide enough space for the next 10 to 15 years. It has to be noted
that these buildings only hosts some of the Parliament sessions, as the Parliament work is
also split between Strasbourg (the official seat) and Luxembourg (the secretariat).
The European External Action Service is based in the Triangle building located on Schuman
roundabout opposite to the Council building and the Berlaymont.
The Economic and Social Committee and the Committee of the Regions together occupy
Delors building, located next to Leopold Park. These institutions also use Bertha von Suttner
building.
All these buildings of the European Quarter represent important job centres. For example,
the European Commission provide approximately 20 000 jobs, the European Parliament
more than 5000 jobs, the Council of the European Union 3500 jobs, the European Economic
and SocialCommittee800jobsand the Committee of the Regions of the European Union 600
jobs. These important activity centres are scattered across the whole area and can be
distant from a few 100 meters to several kilometres.
The illustration below locates the most important spots of the European quarter.

Page | 21 D7.1 Brussels-Capital Region context and ATS Assessment, version 1
Figure 13: European Quarter
Luxembourg square and European parliament
European commission buildings
located on « rue de La Loi »
Square de Meeûs
European Union Council
Berlaymont
European Economic and Social
Committee and Committee of the
Regions
European Union Council
Justus Lipsisus building

Page | 22 D7.1 Brussels-Capital Region context and ATS Assessment, version 1
4.1.1.3 Local transport network
Railway
The European quarter has two railway stations: Brussels-Schuman station and Luxembourg
station. Both are located on the same line (161), an important line connecting Brussels and
Namur. The frequency of services is 3 trains per hour to Brussels-Midi, 2 trains per hour to
Louvain-la-Neuve and 3 trains per hour to Liers, Binche and Luxembourg.
Metro
Two actual metro lines go through the European quarter. However, both of them combined
two different lines (or more exactly 2 different services) that run on the same railway in the
area but split further on the line.
From West to East:
- Line 1: Stockel - West Station and Line 5: Herrmann-Debroux – Erasmus. These two lines stop in 3 stations: Schuman, Maelbeek and Arts-Loi.
From North to South:
- Line 2: Simonis (Leopold II) - Simonis (Elisabeth) and Line 6: Roi Baudouin - Simonis (Elisabeth). These lines stop in two stations in the study area: Arts-Loi and Trône.
The connection between these 2 lines is therefore possible in their common station: Arts-Loi.
Buses
Eight bus lines run across the quarter:
- Bus 22:Montgomery - Luxembourg
- Bus 59:Bordet Station - Hôpital Etterbeek-Ixelles
- Bus 64:Machelen - Porte de Namur
- Bus 80: Maes - Porte de Namur
- Bus 21:Brussels Airport - Luxembourg
- Bus 12:Brussels Airport - Brussels City
- Bus 36:Schuman - Konkel
- Bus 60:Ambiorix - Uccle Calevoet
Only a few lines run on an exclusive way.
The illustration below locates public transport lines in the area.
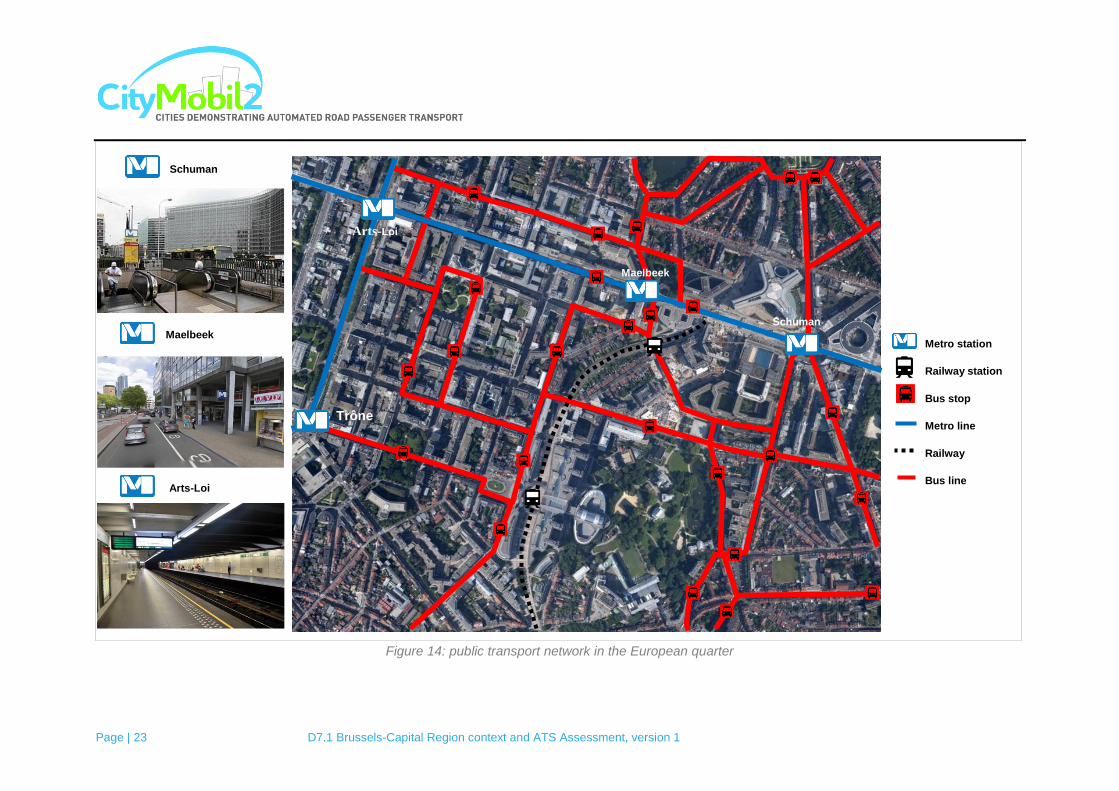
Page | 23 D7.1 Brussels-Capital Region context and ATS Assessment, version 1
Figure 14: public transport network in the European quarter
Arts-Loi
Schuman
Maelbeek
Schuman
Maelbeek
Arts-Loi
Trône
Metro station
Railway station
Bus stop
Metro line
Railway
Bus line
Page | 24 D7.1 Brussels-Capital Region context and ATS Assessment, version 1
4.1.1.4 Problems and objectives
Short trips between institutions
As described previously, European institutions were integrated in an existing urban area.
Therefore, available surfaces were not always located next to each other and institutions had
to be scattered across a relatively wide area.
In consequence, although the activities of the different institutions are strongly interlinked, the
distances between the buildings can be 1 or 2 kilometers long. Therefore, institution
employees and visitors frequently have to travel from one point to another one on distances
that can require a 15 to 20 minutes walk. Although traditional public transports are well
developed in the quarter, they are not efficient for this type of trips and employees or visitors
prefer to walk (which can be relatively time consuming), to use taxi services or even to use
their own cars.
In this context, the deployment of automated vehicles could facilitate and accelerate greatly
short trips between different institutions. Therefore, the first objective would be to reduce the
travel time between institutions and encourage contacts between them. A modal shift from
personal cars and taxis to a shared automated system could also improve air quality and
decrease traffic congestion.
Activity of residential areas
Although European institutions represent an important part of the buildings present in the
quarter, numerous streets remained dedicated to residential purposes. Furthermore, the
quarter master plan supports the development of residential buildings to keep a balance
between offices and habitat.
However, these residential areas are often surrounded by offices and include very few shops
restaurants or bars open in the evening. Most commercial surfaces are occupied by cafes or
restaurants dedicated to employees and open from early in the morning to mid-afternoon.
A continuous service of automated vehicles could improve significantly the connection
between residential areas and areas more active in the evening (such as Luxembourg square
or “rue du Trône”). An automated transport system could therefore help revitalizing residential
areas and improve their attractiveness.
Modal ratio of European institutions employees
Despite a relatively good service by public transport in the quarter, the ratio of commuters
travelling by car remains high. As road traffic congestion is a real issue in Brussels Capital
Region, it is important to reduce this ratio.
As described previously, one reason that can explain the high ratio of commuters travelling by
cars is the distance between institutions and the distance between the train or the metro
stations and the buildings. Automated vehicles could decrease the transit time between modes
Page | 25 D7.1 Brussels-Capital Region context and ATS Assessment, version 1
and connect more directly important centres of employment with public transport stations. This
should induce a modal shift from cars to public transports.
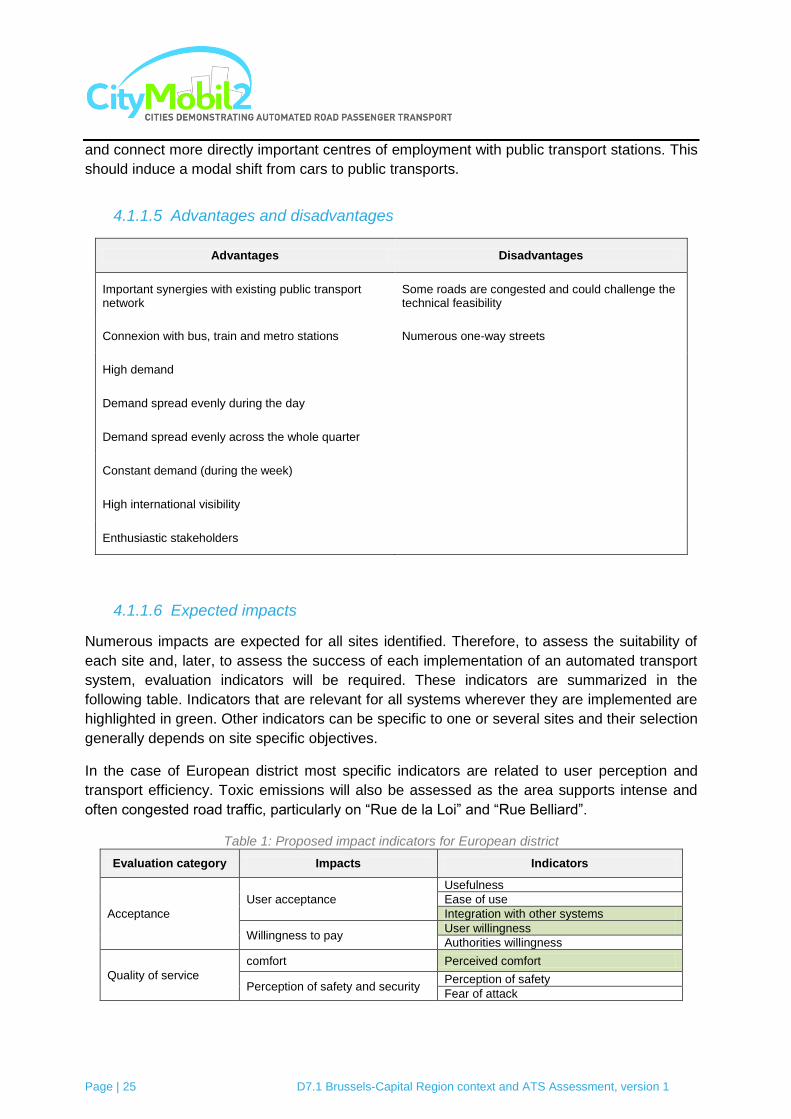
4.1.1.5 Advantages and disadvantages
Advantages Disadvantages
Important synergies with existing public transport network
Some roads are congested and could challenge the technical feasibility
Connexion with bus, train and metro stations Numerous one-way streets
High demand
Demand spread evenly during the day
Demand spread evenly across the whole quarter
Constant demand (during the week)
High international visibility
Enthusiastic stakeholders
4.1.1.6 Expected impacts
Numerous impacts are expected for all sites identified. Therefore, to assess the suitability of
each site and, later, to assess the success of each implementation of an automated transport
system, evaluation indicators will be required. These indicators are summarized in the
following table. Indicators that are relevant for all systems wherever they are implemented are
highlighted in green. Other indicators can be specific to one or several sites and their selection
generally depends on site specific objectives.
In the case of European district most specific indicators are related to user perception and
transport efficiency. Toxic emissions will also be assessed as the area supports intense and
often congested road traffic, particularly on “Rue de la Loi” and “Rue Belliard”.
Table 1: Proposed impact indicators for European district
Evaluation category Impacts Indicators
Acceptance
User acceptance
Usefulness
Ease of use
Integration with other systems
Willingness to pay User willingness
Authorities willingness
Quality of service
comfort Perceived comfort
Perception of safety and security Perception of safety
Fear of attack

Page | 26 D7.1 Brussels-Capital Region context and ATS Assessment, version 1
Evaluation category Impacts Indicators
Transport patterns
Modal change
Induced mode changes in the other segments of the journey
System modal share
System use
Total passenger.km travelled
Total number of trips
Vehicle occupancy
System performances
Average Journey time per OD pair
Average waiting time
Interchange time
System capacity Effective system capacity
Social impacts Spatial accessibility
Change in range of key activities within time thresholds
Distribution of accessibility changes by social groups
Service accessibility Access times for mobility impaired users
Environment
Energy Daily consumption
Energy efficiency
Land take Change in road space availability to other users
Financial impacts
Start up costs
Track construction and civil works
Vehicle acquisition/construction
Control systems and apparatus
Operating costs
Personnel
Vehicle maintenance
Track and civil infrastructures maintenance
Control system maintenance
Revenues Operating revenues
Economic impacts
Temporary job provided by installation and demonstration
Jobs provided at the demonstration site
Efficiency
Financial Net Present Value
Socio-economic Net Present Value
Internal Rate of Return
Benefit/Cost ratio
4.1.2 Demand estimation
4.1.2.1 General description of itineraries
Itinerary selection was based on several criteria. The main criterion was the connection with
public transport nodes and major centres of attraction or emissions. As described previously,
main centres of attraction or emissions in European district consist of European institutions
and private offices and some limited residential buildings and commercial areas.
Although these centres are numerous and relatively close to each other, the choice of
itineraries was constrained by several characteristics of the district. Due to the dense
urbanisation of the zone, local roads are often narrow and only allow single direction traffic.
Furthermore, larger roads generally support an important traffic and can be congested at peak
hours (especially on “rue Belliard” and “rue de la Loi”). Therefore, itinerary selection required
many field observations to take in consideration operational and technical aspects. Narrow
streets and crossings of congested roads have been avoided as much as possible. Sites
Page | 27 D7.1 Brussels-Capital Region context and ATS Assessment, version 1
requiring new constructions or adjustments to enable the automated transport implementation
have also been avoided.
As a result, two potential itineraries have been selected. Both of them connect important public
transport nodes, employment centres and commercial areas.
Itinerary 1 is 3.1 km long and goes from the Brussels-Luxembourg train station to the
Berlaymont before going back to the train station. It includes 11 stops (5 going North and 6
going South) and connects several important transport nodes (Schuman and Maalbeek metro
stations, Brussels-Luxembourg train station) and several important European institutions (the
European Union Council, the Comity of the European Union Regions, the European Social
and Economics Comity and the European Parliament).
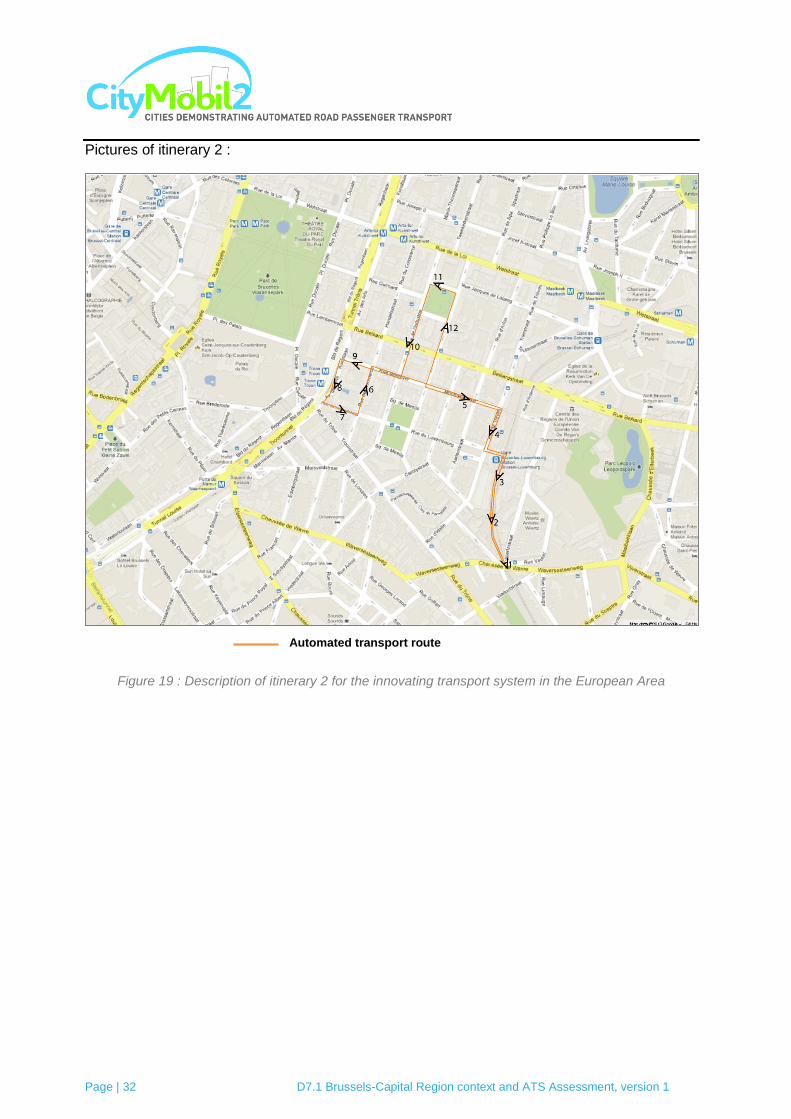
Itinerary 2, also 3.1 km long, connects the southern part of the European Parliament
esplanade and Trone metro station via Frère-Orban square, before going back to the
esplanade. It includes 12 stops: 5 going from the parliament to Trone metro station and 7
going from Trone to the parliament.
The following maps and figures present the two itineraries.

Page | 28 D7.1 Brussels-Capital Region context and ATS Assessment, version 1
Gare du
Luxembourg
ParcLéopold
Maelbeek
Livingstone
Berlaymont/Schuman
Comité des
Régions UE
Toulouse
Trèves
0 100 200m
Trône
Arts-Loi
Schuman
Maelbeek
Ambiorix
Metro station
Railway station
Bus stop
Automated transport:
Line
Stop
Figure 15 : Itinerary 1 for the innovating transport system in the European Area (Stratec)

Page | 29 D7.1 Brussels-Capital Region context and ATS Assessment, version 1
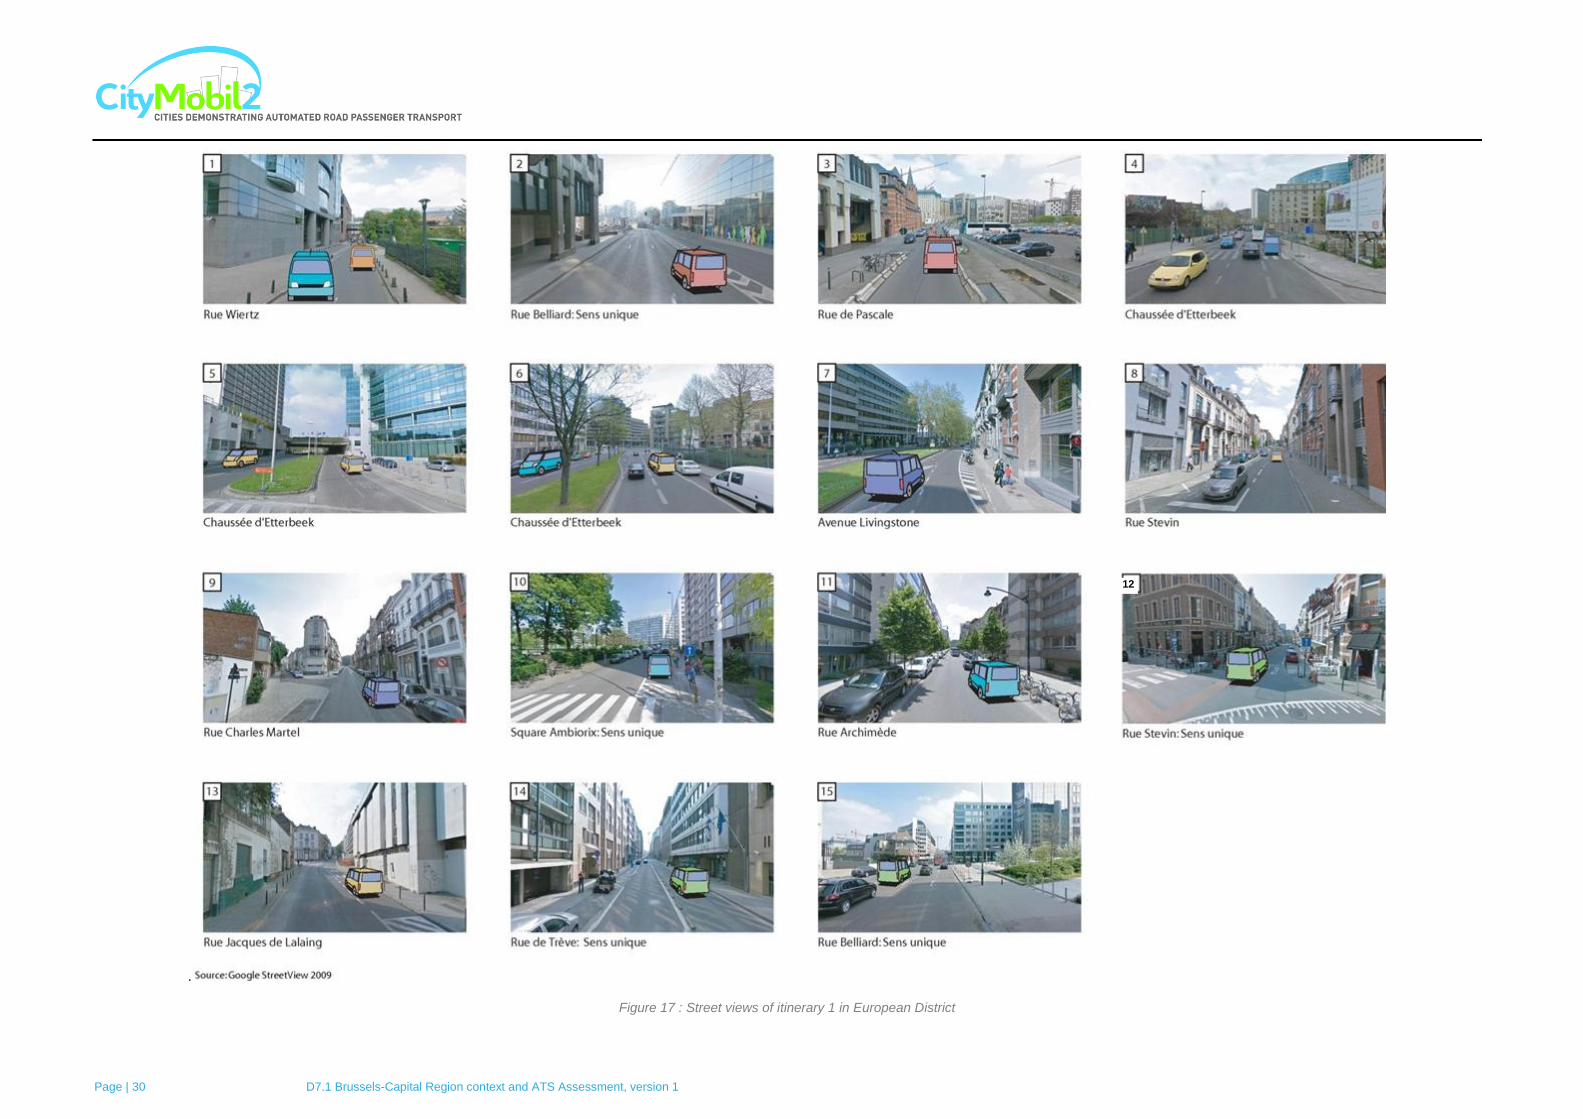
Pictures of itinerary 1:
Figure 16 : Description of the itinerary 1 for the innovating transport system in the European Area (Stratec)
Automated transport route
Page | 30 D7.1 Brussels-Capital Region context and ATS Assessment, version 1
.
Figure 17 : Street views of itinerary 1 in European District
12

Page | 31 D7.1 Brussels-Capital Region context and ATS Assessment, version 1
Arts-Loi
Metro station
Railway station
Bus stop
Automated transport:
Line
Stop
0 100 200m
Trône
Schuman
Maelbeek
Museum
Gare du
Luxembourg
Place du
Luxembourg
Marie de
Bourgogne
Béliard
Guimard
Montoyerint
erchange
Trône
Figure 18 : Itinerary 2 for the innovating transport system in the European Area (Stratec)
Page | 32 D7.1 Brussels-Capital Region context and ATS Assessment, version 1
Pictures of itinerary 2 :
Figure 19 : Description of itinerary 2 for the innovating transport system in the European Area
Automated transport route

Page | 33 D7.1 Brussels-Capital Region context and ATS Assessment, version 1
Figure 20 : Street views of itinerary 2in the European District
Page | 34 D7.1 Brussels-Capital Region context and ATS Assessment, version 1
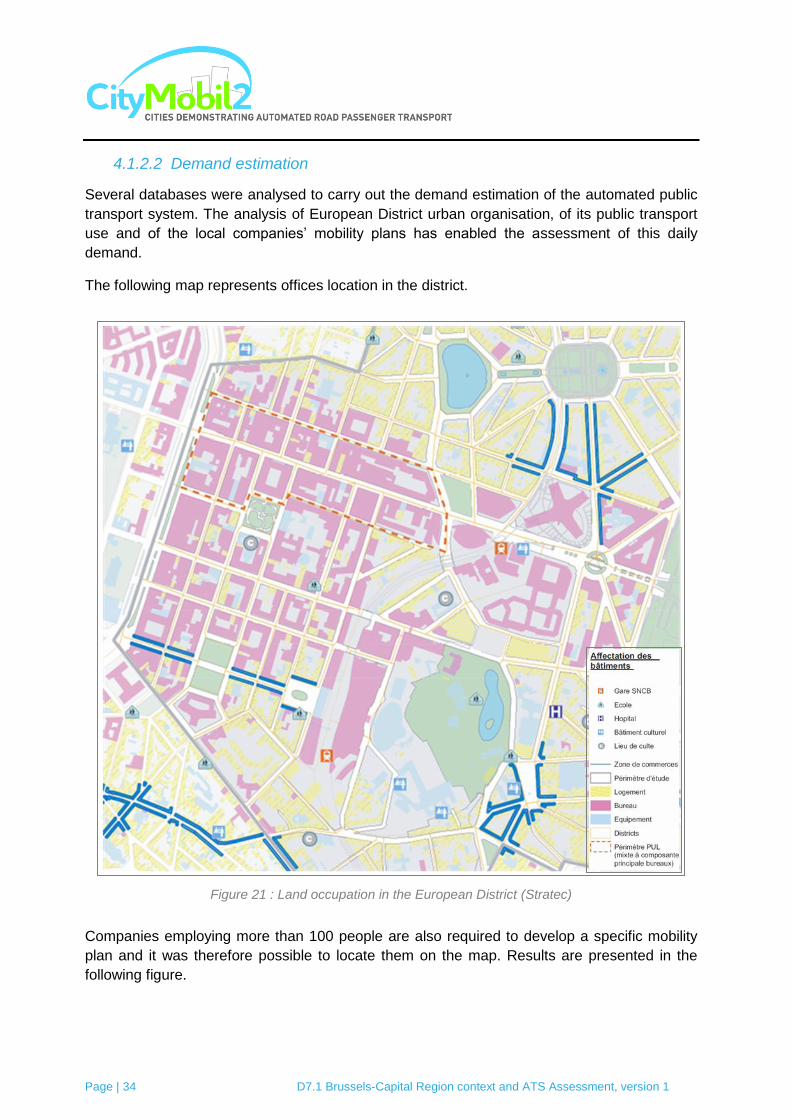
4.1.2.2 Demand estimation
Several databases were analysed to carry out the demand estimation of the automated public
transport system. The analysis of European District urban organisation, of its public transport
use and of the local companies‟ mobility plans has enabled the assessment of this daily
demand.
The following map represents offices location in the district.
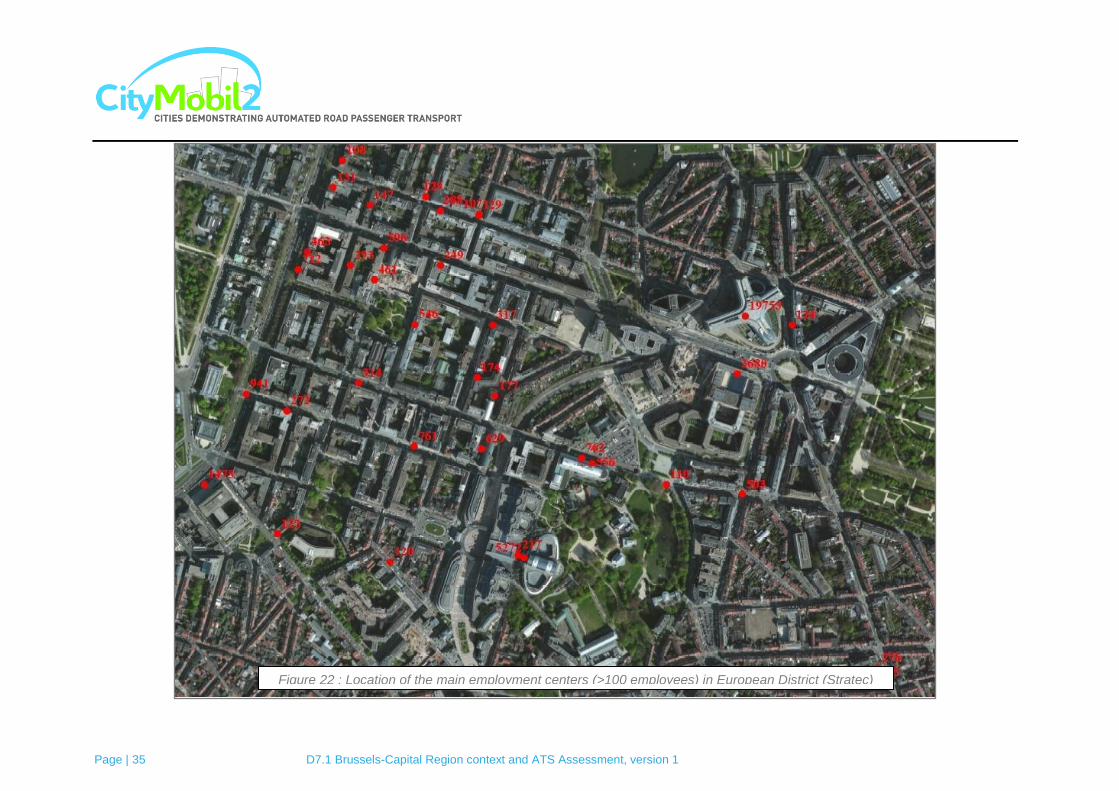
Companies employing more than 100 people are also required to develop a specific mobility
plan and it was therefore possible to locate them on the map. Results are presented in the
following figure.
Figure 21 : Land occupation in the European District (Stratec)
Page | 35 D7.1 Brussels-Capital Region context and ATS Assessment, version 1
Figure 22 : Location of the main employment centers (>100 employees) in European District (Stratec)
Page | 36 D7.1 Brussels-Capital Region context and ATS Assessment, version 1
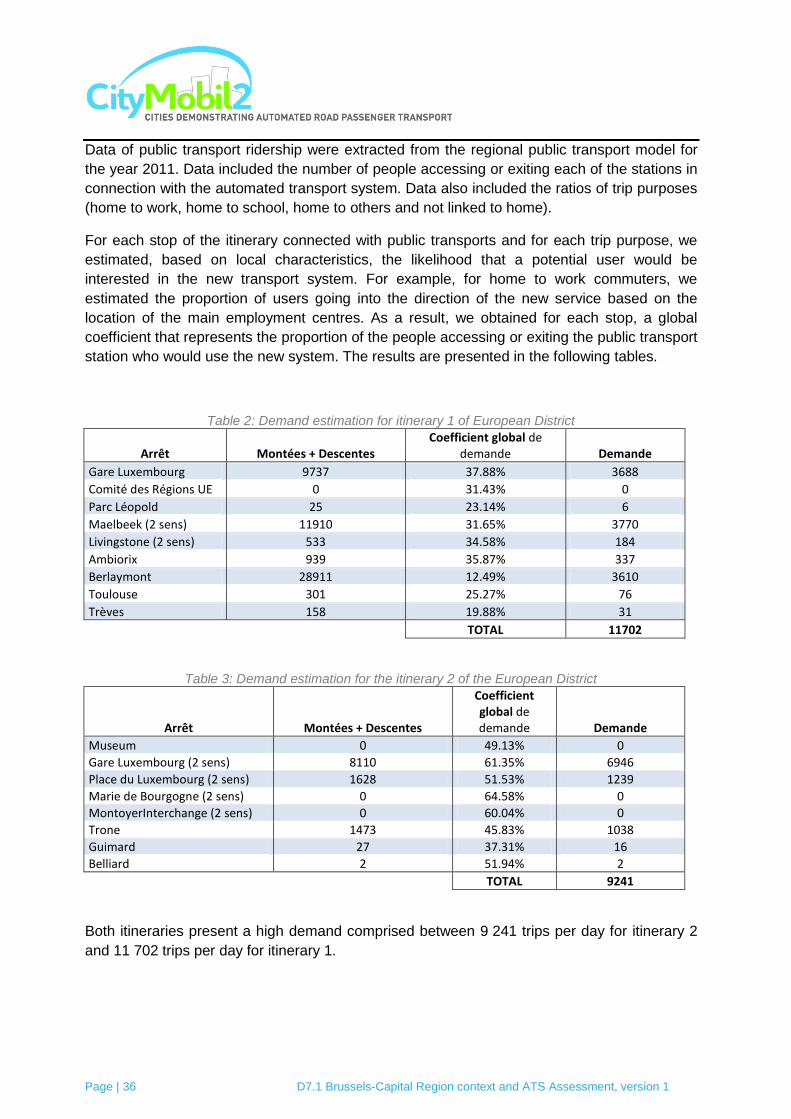
Data of public transport ridership were extracted from the regional public transport model for
the year 2011. Data included the number of people accessing or exiting each of the stations in
connection with the automated transport system. Data also included the ratios of trip purposes
(home to work, home to school, home to others and not linked to home).
For each stop of the itinerary connected with public transports and for each trip purpose, we
estimated, based on local characteristics, the likelihood that a potential user would be
interested in the new transport system. For example, for home to work commuters, we
estimated the proportion of users going into the direction of the new service based on the
location of the main employment centres. As a result, we obtained for each stop, a global
coefficient that represents the proportion of the people accessing or exiting the public transport
station who would use the new system. The results are presented in the following tables.
Table 2: Demand estimation for itinerary 1 of European District
Arrêt Montées + Descentes Coefficient global de
demande Demande
Gare Luxembourg 9737 37.88% 3688
Comité des Régions UE 0 31.43% 0
Parc Léopold 25 23.14% 6
Maelbeek (2 sens) 11910 31.65% 3770
Livingstone (2 sens) 533 34.58% 184
Ambiorix 939 35.87% 337
Berlaymont 28911 12.49% 3610
Toulouse 301 25.27% 76
Trèves 158 19.88% 31
TOTAL 11702
Table 3: Demand estimation for the itinerary 2 of the European District
Arrêt Montées + Descentes
Coefficient global de demande Demande
Museum 0 49.13% 0
Gare Luxembourg (2 sens) 8110 61.35% 6946
Place du Luxembourg (2 sens) 1628 51.53% 1239
Marie de Bourgogne (2 sens) 0 64.58% 0
MontoyerInterchange (2 sens) 0 60.04% 0
Trone 1473 45.83% 1038
Guimard 27 37.31% 16
Belliard 2 51.94% 2
TOTAL 9241
Both itineraries present a high demand comprised between 9 241 trips per day for itinerary 2
and 11 702 trips per day for itinerary 1.
Page | 37 D7.1 Brussels-Capital Region context and ATS Assessment, version 1
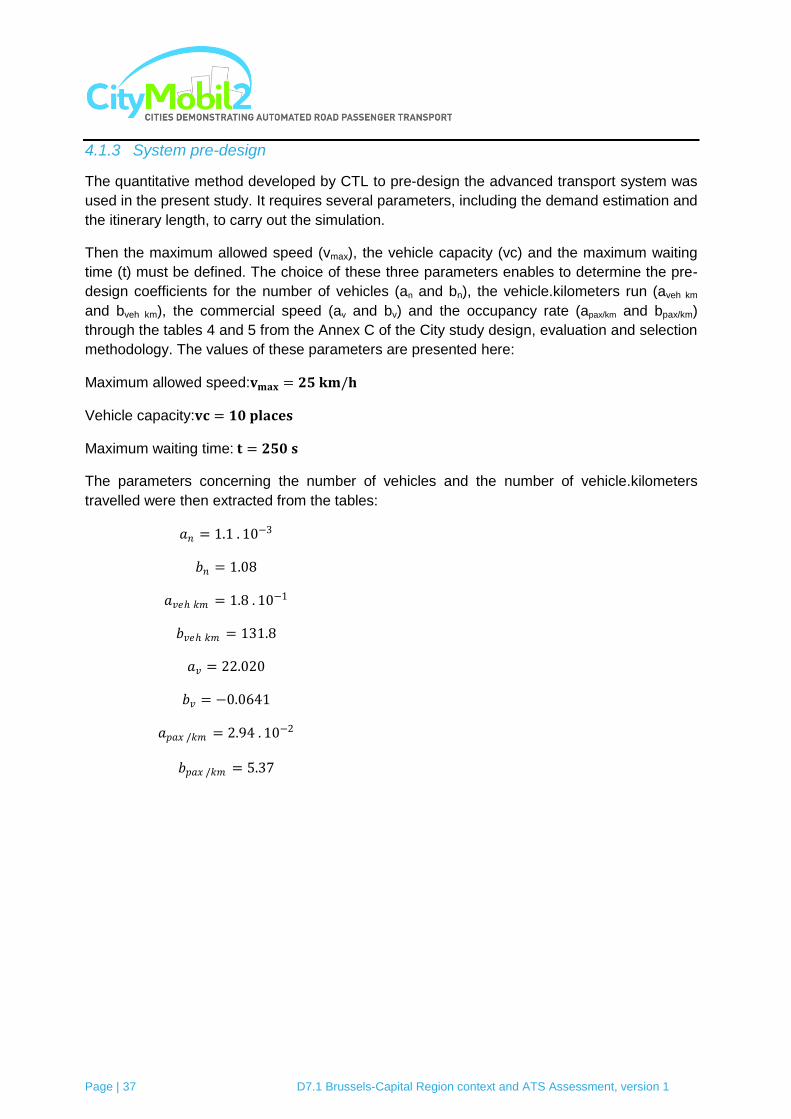
4.1.3 System pre-design
The quantitative method developed by CTL to pre-design the advanced transport system was
used in the present study. It requires several parameters, including the demand estimation and
the itinerary length, to carry out the simulation.
Then the maximum allowed speed (vmax), the vehicle capacity (vc) and the maximum waiting
time (t) must be defined. The choice of these three parameters enables to determine the pre-
design coefficients for the number of vehicles (an and bn), the vehicle.kilometers run (aveh km
and bveh km), the commercial speed (av and bv) and the occupancy rate (apax/km and bpax/km)
through the tables 4 and 5 from the Annex C of the City study design, evaluation and selection
methodology. The values of these parameters are presented here:
Maximum allowed speed:𝐯𝐦𝐚𝐱 = 𝟐𝟓 𝐤𝐦/𝐡
Vehicle capacity:𝐯𝐜 = 𝟏𝟎 𝐩𝐥𝐚𝐜𝐞𝐬
Maximum waiting time: 𝐭 = 𝟐𝟓𝟎 𝐬
The parameters concerning the number of vehicles and the number of vehicle.kilometers
travelled were then extracted from the tables:
𝑎𝑛 = 1.1 . 10−3
𝑏𝑛 = 1.08
𝑎𝑣𝑒 𝑘𝑚 = 1.8 . 10−1
𝑏𝑣𝑒 𝑘𝑚 = 131.8
𝑎𝑣 = 22.020
𝑏𝑣 = −0.0641
𝑎𝑝𝑎𝑥 /𝑘𝑚 = 2.94 . 10−2
𝑏𝑝𝑎𝑥 /𝑘𝑚 = 5.37

Page | 38 D7.1 Brussels-Capital Region context and ATS Assessment, version 1
These parameters were introduced in Annex C formulas to obtain four main outputs:
Itinerary 1 (Daily demand: 𝑫 = 𝟏𝟏 𝟕𝟎𝟐 and Itinerary length: 𝑳 = 𝟑.𝟏 𝒌𝒎)
Number of vehicles: 𝒏 = 𝑳 𝒂𝒏.𝑫
𝑳+ 𝒃𝒏 = 𝟏𝟔.𝟐𝟐
Total vehicle.kilometers run: 𝒗𝒆𝒉 𝒌𝒎 = 𝑳 𝒂𝒗𝒆𝒉 𝒌𝒎.𝑫
𝑳+ 𝒃𝒗𝒆𝒉 𝒌𝒎 = 𝟐 𝟓𝟏𝟒.𝟗𝟕
Average commercial speed of the vehicles: 𝒗 = 𝒂𝒗. 𝑫
𝑳 𝒃𝒗
= 𝟏𝟐.𝟗𝟗 𝒌𝒎/𝒉
Occupancy rate: 𝒑𝒂𝒙/𝒌𝒎 = 𝒂𝒑𝒂𝒙/𝒌𝒎.𝑫
𝒏+ 𝒃𝒑𝒂𝒙/𝒌𝒎 = 𝟐𝟔.𝟓𝟖 𝒑𝒂𝒔𝒔/𝒌𝒎
The results from the simulation for itinerary 1 reveal that 17 automatic vehicles would be
required to fully absorb the demand. In that case, the total number of vehicle.kilometers
travelled would be 2 515, the average commercial speed would be 13 km/h and the
occupancy rate of system would be close to 27 passenger/km.

Page | 39 D7.1 Brussels-Capital Region context and ATS Assessment, version 1
Itinerary 2 (Daily demand: 𝑫 = 𝟗 𝟐𝟒𝟏 and Itinerary length: 𝑳 = 𝟑.𝟏 𝒌𝒎)
Number of vehicles: 𝒏 = 𝑳 𝒂𝒏.𝑫
𝑳+ 𝒃𝒏 = 𝟏𝟑.𝟓𝟏
Total vehicle.kilometers run: 𝒗𝒆𝒉 𝒌𝒎 = 𝑳 𝒂𝒗𝒆𝒉 𝒌𝒎.𝑫
𝑳+ 𝒃𝒗𝒆𝒉 𝒌𝒎 = 𝟐 𝟎𝟕𝟏.𝟗𝟖
Average commercial speed of the vehicles: 𝒗 = 𝒂𝒗. 𝑫
𝑳 𝒃𝒗
= 𝟏𝟑.𝟏𝟗 𝒌𝒎/𝒉
Occupancy rate: 𝒑𝒂𝒙/𝒌𝒎 = 𝒂𝒑𝒂𝒙/𝒌𝒎.𝑫
𝒏+ 𝒃𝒑𝒂𝒙/𝒌𝒎 = 𝟐𝟓.𝟒𝟖 𝒑𝒂𝒔𝒔/𝒌𝒎
The calculations in this case reveal that itinerary 2 would require 14 automated vehicles to
fully absorb the demand. With 14 vehicles, the total of vehicle.kilometers travelled would be
2 072, average commercial speed would be 13.2 km/h and the occupancy rate would be
close to 26 passenger/km.
Finally, the average waiting time was extracted from table 6 of the City study design,
evaluation and selection methodology.
Minimum average waiting time: 𝑾𝑻𝒎𝒊𝒏 = 𝟓𝟓 𝒔
Maximum average waiting time:𝑾𝑻𝒎𝒂𝒙 = 𝟗𝟎 𝒔
This average time is the same for both of the two itineraries and is included between 55 and
90 seconds.
4.1.4 Initial assessment
The following initial conclusions concerning the innovating transport system can be drawn
from our analysis.
The European District is located in a central and urbanised part of the Brussels-Capital
Region and includes several European institutions and numerous private offices. Therefore,
the district has a very dense activity which implies an important demand of the new transport
system.
Activities are evenly spread across the whole district and remain relatively unchanged during
the week. Therefore, the demand is evenly spread along the itineraries and relatively steady
over time.
Main disadvantages of European District are related to the width of the streets, the presence
of several one way streets and road traffic that can be congested during peak hours.
Page | 40 D7.1 Brussels-Capital Region context and ATS Assessment, version 1
4.1.5 Initial practical feasibility analyses
4.1.5.1 Technical promptness
Both itineraries are totally integrated in local traffic and include several crossroads with major
accesses to or exits from Brussels city centre. These roads support an important traffic and
their maximum capacity is frequently reach during peak hours (especially rue Belliard).
Therefore, itinerary roads cannot be adapted to provide lanes dedicated to automated
vehicles and priority cannot be given to automated vehicles at each crossroad.
A successful implementation of automated transport system on these itineraries would
therefore require the use of vehicles able to drive autonomously in real traffic and according
to local driving rules.
The activity in the streets can also be intense during working hours and circulation of
vehicles often requires coping with obstacles (taxis, delivery trucks, etc.). Automated
vehicles would therefore need to be able to resolve complex situations and avoid obstacles.
4.1.5.2 Legal promptness
Both itineraries are located on public roads where an automated transport system would be
subject to all general driving rules. As there is no specific regulation for automated vehicles,
the main question that would have to be resolved is who is responsible in case of accident.
Given the intense activity of the area during peak hours, the traffic and the high number of
pedestrians, the responsibility in case of accident takes a strategic dimension. It is therefore
likely that any demonstration in the area would require the presence of a driver in each
vehicle at all time.
4.1.5.3 Population promptness
An important part of the population in European district is related to European institutions
activities. People are therefore likely to be interested the implementation of a European
project in the area.
Furthermore, most people have to face frequent traffic congestion problems. Automated
transport system could therefore be well received as it offers a potential solution to improve
local mobility.
4.1.5.4 Political promptness
Both itineraries include roads managed by the Brussels-Capital Region and by the
municipality of Brussels city. Implementation of automated transport systems would
therefore require authorization of two different levels of governance.

Page | 41 D7.1 Brussels-Capital Region context and ATS Assessment, version 1
4.2 The Heysel
4.2.1 Presentation of the study area
The Heysel is located North of Brussels city centre. The site is composed of several activity
centres in terms of leisure, tourism and exhibitions (public and professional). In total, the
area attracts more than 10 million visitors per year. The most important infrastructures are:
- The Exhibition Park, a complex of buildings and warehouses where various
leisure and professional exhibitions are held. The total attendance exceeds two
million visitors a year with significant peaks of activity during the exhibitions;
- The Kinepolis cinema that attracts about 4.5 million visitors per year (mainly in
the evening and during the weekends);
- The Atomium, an iconic building constructed for 1958 universal exposition. It is
visited by approximately 650 000 tourists every year;
- The leisure site of Bruparck that combines Mini-Europe (attraction park
presenting reproductions of the most famous European monuments at a reduced
scale), a sub-tropical swimming pool and a village of shops and restaurants. The
site attracts about 600 000 visitors per year;
- King Baudouin Stadium with about 500 000 spectators per year.
The area also includes several smaller activity centres such as the Royal Primerose Tennis
Club and Brussels planetarium.
Visitors can access the site by public transports (network described in the next section) or by
car. Many parking lots are available in the area for car users (2,200 public
parkingspacesand12,000 private parking spaces).
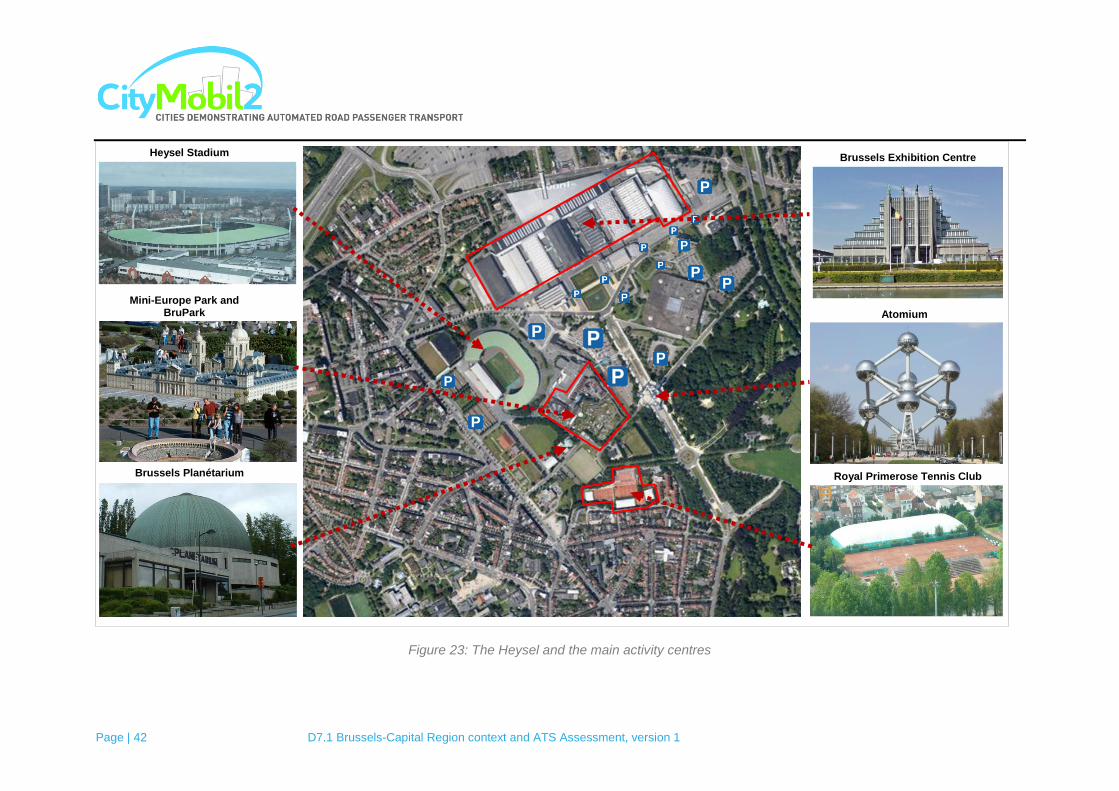
Page | 42 D7.1 Brussels-Capital Region context and ATS Assessment, version 1
Figure 23: The Heysel and the main activity centres
Brussels Exhibition Centre
Atomium
Royal Primerose Tennis Club
Heysel Stadium
Brussels Planétarium
Mini-Europe Park and BruPark
Page | 43 D7.1 Brussels-Capital Region context and ATS Assessment, version 1
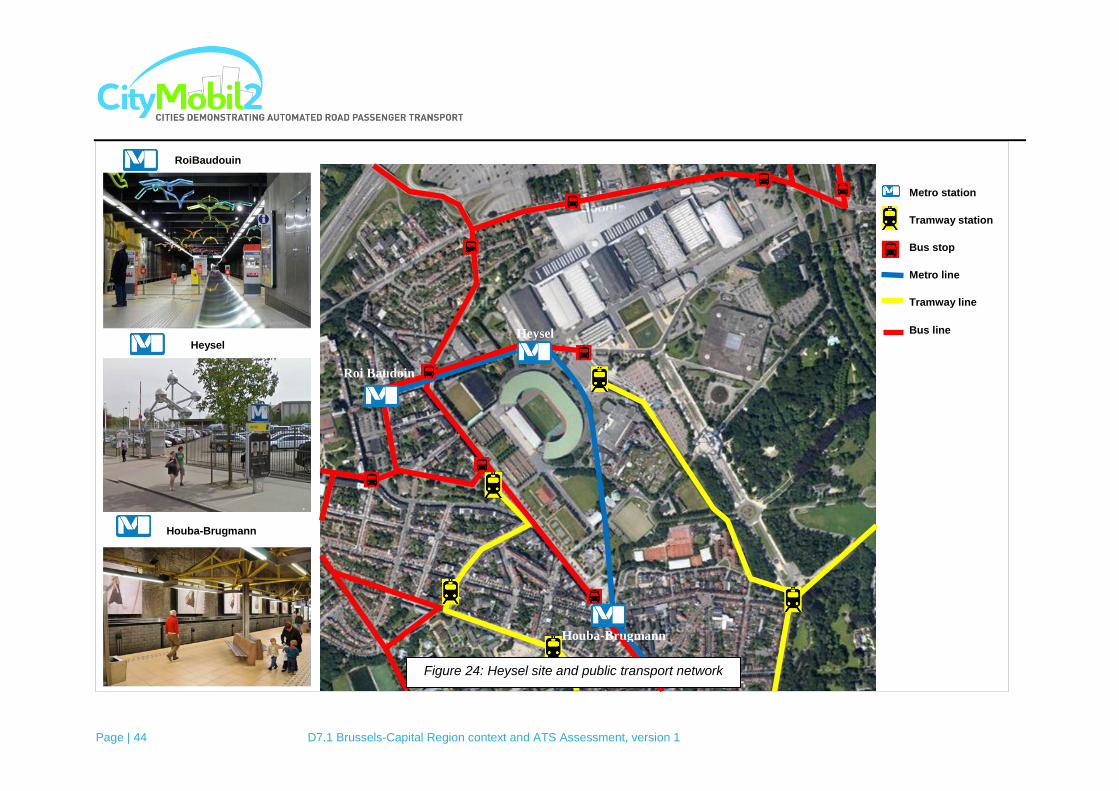
4.2.1.1 Local public transport network
Heysel area is easily accessible by metro and tramway.
Metro
The site is located at the North end of metro line 6 Roi Baudouin - Simonis (Elisabeth) which
goes through the city centre of Brussels.
There are 3 stops in the area: Houba-Brugman, Heysel and Roi Baudouin.
Tramways
Three tram lines pass through the area and stop in 5 different stations. These lines are:
- Line 7:Vanderkindere - Heysel
- Line 51:Van Haelen - Heysel
- Line 94: Stade - Musée du Tram
Lines 7 and 51 stops at Heysel and Centenaire whereas line 94 stops at Stade, Stiénon and
Kufferath.
Buses
Two STIB bus lines (Brussels Intercommunal Transport Company) pass through the area:
- Line 84: Heysel – Beekkant
- Line 88: Heysel - De Brouckère
The illustration below locates the public transport lines in the area.
Page | 44 D7.1 Brussels-Capital Region context and ATS Assessment, version 1
RoiBaudouin
Houba-Brugmann
Heysel
Metro station
Tramway station
Bus stop
Metro line
Tramway line
Bus line
Roi Baudoin
Heysel
Houba-Brugmann
Figure 24: Heysel site and public transport network
Page | 45 D7.1 Brussels-Capital Region context and ATS Assessment, version 1
4.2.1.2 Problems and objectives
Interconnection between activity centers
The main issue of the area is that it is composed of many activity centers that are not well
interconnected. Visitors often come for a specific objective (to see a movie, go to the
swimming pool, visit the atomium or an exhibition) and do not take the opportunity to combine
several activities.
This is partly due to the distance between the different sites that can be several 100m to a few
kilometers long. This distance is often perceived as too long to walk but too short to use
traditional public transports.
An automated transport system would create a strong link between the different sites present
in the area and encourage visitors to combine multiple activities.
Accessibility of the sites
The public transport service in the quarter is not so good. Indeed the ratio of visitors coming by
car remains high.
Automated vehicles could decrease the transit time between modes and connect more directly
important sites with public transport stations. This should induce a modal shift from cars to
public transports.
Safety to access the car parks
Another problem of the area is that the main car parks are not connected with the entire
activity centers. The installation of an automated transport system will improve this point and
allow the circulation of an important number of people between the different points of interest
in the area.
4.2.1.3 Advantages and disadvantages
Advantages Disadvantages
Important synergies with existing public transport network
Demand spread unevenly during the day and the year (peaks during exhibitions and public holidays)
Connexion with bus, tramway and metro stations Conflict of agenda between the current project (2014) and the Neo project (after 2020)
High demand
Demand evenly spread across the whole area
Multiple uses
Un-congested roads

Page | 46 D7.1 Brussels-Capital Region context and ATS Assessment, version 1
Good international visibility (Atomium)
Possibility of integration in the future Neo project
4.2.1.4 Expected impacts
Indicators to assess the suitability of the site and, later, to assess the success of automated
transport system implementation are presented in the following table. Indicators that are
relevant for all systems wherever they are implemented are highlighted in green. Other
indicators can be specific to one or several sites and their selection generally depends on site
specific objectives.
In the case of the Heysel most specific indicators are related to user perception and transport
efficiency.
Table 4: Proposed impact indicators for the Heysel
Evaluation category Impacts Indicators
Acceptance
User acceptance
Usefulness
Ease of use
Integration with other systems
Willingness to pay User willingness
Authorities willingness
Quality of service
comfort Perceived comfort
Perception of safety and security Perception of safety
Fear of attack
Transport patterns
Modal change
Induced mode changes in the other segments of the journey
System modal share
System use
Total passenger.km travelled
Total number of trips
Vehicle occupancy
System performances
Average Journey time per OD pair
Average waiting time
Interchange time
System capacity Effective system capacity
Social impacts Spatial accessibility
Change in range of key activities within time thresholds
Distribution of accessibility changes by social groups
Service accessibility Access times for mobility impaired users
Environment
Energy Daily consumption
Energy efficiency
Climate change CO2
Land take Change in road space availability to other users
Financial impacts
Start up costs
Track construction and civil works
Vehicle acquisition/construction
Control systems and apparatus
Operating costs
Personnel
Vehicle maintenance
Track and civil infrastructures maintenance
Control system maintenance
Revenues Operating revenues
Page | 47 D7.1 Brussels-Capital Region context and ATS Assessment, version 1
Economic impacts
Temporary job provided by installation and demonstration
Jobs provided at the demonstration site
Efficiency
Financial Net Present Value
Socio-economic Net Present Value
Internal Rate of Return
Benefit/Cost ratio
4.2.2 Demand estimation
4.2.2.1 Itinerary general description
The Heysel consists of several activity centres generally dedicated to exhibitions,
entertainment and tourism. As described previously, about 10 million of people visit the site
every year. Main criteria that were considered to select an itinerary were the location of metro,
tramway and bus stations and the location of activity centers. Roads and crossroads where
the new transport system could disturb road traffic were avoided as much as possible. Sites
where new constructions would have been required to enable the new system implementation
have also been avoided.
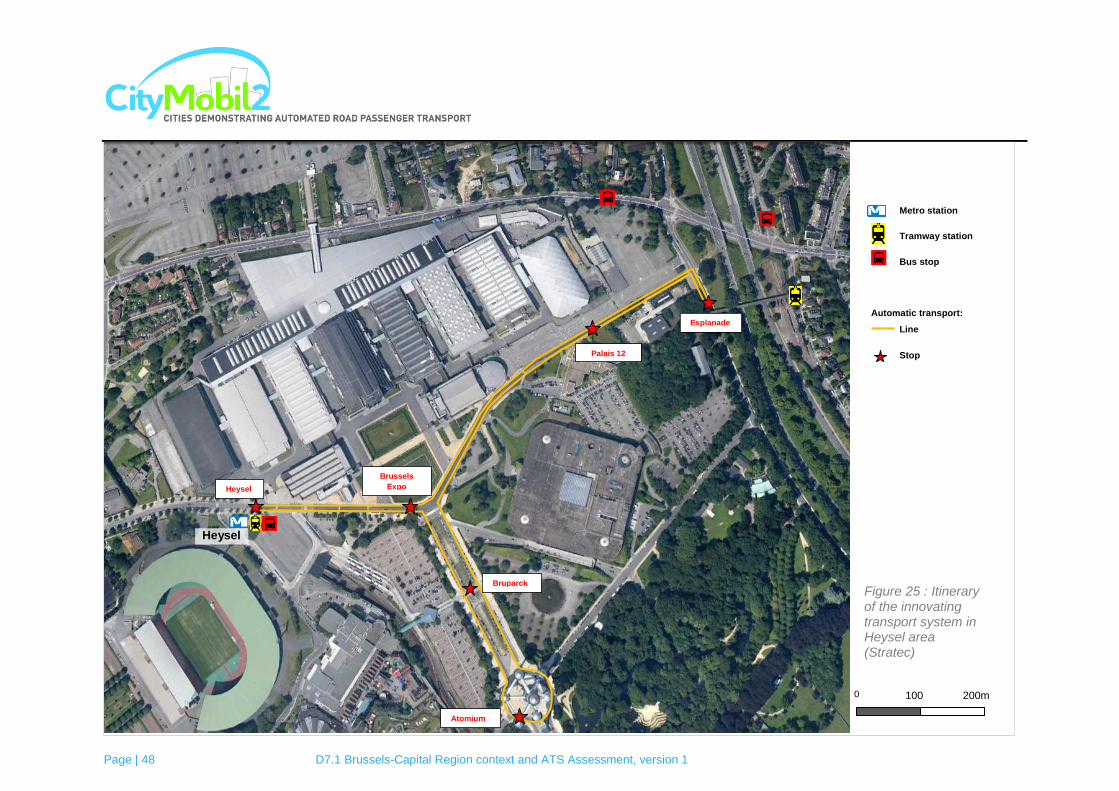
Only one itinerary was selected. It is 2.8 km long and goes from the Heysel station, serves
Bruparck, the Atomium, the 12th Hall, reaches the walkway going to Esplanade station and
finally comes back to the Heysel Station via the Exhibition Centre. The itinerary is presented in
the following maps in figures.
Page | 48 D7.1 Brussels-Capital Region context and ATS Assessment, version 1
Esplanade
Palais 12
Heysel
Brussels
Expo
Bruparck
Atomium
Metro station
Tramway station
Bus stop
Automatic transport:
Line
Stop
Heysel
0 100 200m
Figure 25 : Itinerary of the innovating transport system in Heysel area (Stratec)

Page | 49 D7.1 Brussels-Capital Region context and ATS Assessment, version 1
Itinerary pictures:
Figure 26 : Description of the itinerary for the innovating transport system in the Heysel area (Stratec)
Automated transport route

Page | 50 D7.1 Brussels-Capital Region context and ATS Assessment, version 1
Figure 27 : Street views of the itinerary in Heysel area (Stratec)
Page | 51 D7.1 Brussels-Capital Region context and ATS Assessment, version 1
4.2.2.2 Demand estimation
Two types of stops can be distinguished: stops connected with public transport stations
(Heysel and Esplanade) and stops connected with activity centres (Bruparck, Atomium, Hall
12 and Brussels Exhibition Centre).
Heysel and Esplanade stations
The demand for the innovating transport system in these two stations has been estimated
through the number of people accessing or exiting the station. Data were extracted from the
regional public transport model for the year 2011.
For both sites, we estimated the proportion of people going to or coming from one of the
activity centres served by the new transport system and the likelihood that these people used
the system (based on the distance between the station and the activity centre). As a result, we
obtained a global demand coefficient that represents the proportion of people accessing or
exiting the station who would use the new transport system. These coefficients are presented
in the following table.
Table 5: Demand estimation for Heysel and Esplanade stations
Station Number of people accessing or exiting the station per day
Global demand coefficient
Demand estimation (number of exits or
accesses)
Heysel 11330 35% 3966
Esplanade 2078 40% 831
TOTAL 4797
Bruparck, Atomium, Hall 12 and Exhibition Centre stops
For these 4 stops, the demand was estimated based on the number of visitors of the main
activity centres served by the stop. Again, a global coefficient representing the proportion of
visitors who would use the new transport system has been calculated based on the share of
visitors using public transports to access the site and the distance between the exit of the
activity centre and the closest public transport station. Results are presented in the following
table.

Page | 52 D7.1 Brussels-Capital Region context and ATS Assessment, version 1
Table 6: Demand estimation for the Bruparck, Atomium, Hall 12 and Exhibition Center stops
Station Main activity
centres Yearly visitors
Global demand coefficient
Daily visitors (weekdays)
Demand (number of exits
or accesses)
Bruparck Kinepolis 1 600 000
2 38% 175
668 Bruparck 860 000
3 40% 493
Atomium Atomium 550 0004 40% 93 93
Hall 12 Hall 12 15 000 5 (shows) 28% 0 0
Exhibition Centre (Big-scale Show) (720 000)
6 (37%) (11 700)
6 177 Mid-scale Show 560 000
7 36% 6177
TOTAL 6938
Global demand
The demands for all 6 stations were then summed and the global demand was estimated.
Results are presented in the following table.
Table 7: Demand estimation for the complete itinerary of Heysel site
Station Demand estimation Total demand estimation
Heysel 3966
5867
Bruparck 668
Atomium 93
Palais 12 0
Esplanade 831
Exhibition Centre 6177
TOTAL 11735
The daily demand is estimated to 5 867 trips per day.
2Source : Masterplan
3Source : Masterplan
4 Source : T. Meus
5 Source : articles de presse
6 Source : articles de presse
7 Source : articles de presse

Page | 53 D7.1 Brussels-Capital Region context and ATS Assessment, version 1
4.2.3 System pre-design
The quantitative method developed by CTL to pre-design the advanced transport system was
used in the present study. It requires several parameters, including the demand estimation and
the itinerary length, to carry out the simulation.
Then the maximum allowed speed (vmax), the vehicle capacity (vc) and the maximum waiting
time (t) must be defined. The choice of these three parameters enables to determine the pre-
design coefficients for the number of vehicles (an and bn), the vehicle.kilometers run (aveh km
and bveh km), the commercial speed (av and bv) and the occupancy rate (apax/km and bpax/km)
through the tables 4 and 5 from the Annex C of the City study design, evaluation and selection
methodology. The values of these parameters are presented here:
Maximum allowed speed:𝐯𝐦𝐚𝐱 = 𝟐𝟓 𝐤𝐦/𝐡
Vehicle capacity:𝐯𝐜 = 𝟏𝟎 𝐩𝐥𝐚𝐜𝐞𝐬
Maximum waiting time: 𝐭 = 𝟐𝟓𝟎 𝐬
The following parameters concerning the number of vehicles and the vehicle.kilometers run
are then determined through the tables:
𝑎𝑛 = 1.1 . 10−3
𝑏𝑛 = 1.08
𝑎𝑣𝑒 𝑘𝑚 = 1.8 . 10−1
𝑏𝑣𝑒 𝑘𝑚 = 131.8
𝑎𝑣 = 22.020
𝑏𝑣 = −0.0641
𝑎𝑝𝑎𝑥 /𝑘𝑚 = 2.94 . 10−2
𝑏𝑝𝑎𝑥 /𝑘𝑚 = 5.37
Page | 54 D7.1 Brussels-Capital Region context and ATS Assessment, version 1
These parameters are then used to obtain four outputs from the pre-design method through
formulas from the Annex C of the City study design, evaluation and selection methodology.
Considering the daily demand 𝐃 = 𝟓 𝟖𝟔𝟕 and the Itinerary length 𝐋 = 𝟐.𝟖 𝐤𝐦 of the itinerary:
Number of vehicles: 𝒏 = 𝑳 𝒂𝒏.𝑫
𝑳+ 𝒃𝒏 = 𝟗.𝟒𝟖
Total vehicle.kilometres run: 𝒗𝒆𝒉 𝒌𝒎 = 𝑳 𝒂𝒗𝒆𝒉 𝒌𝒎.𝑫
𝑳+ 𝒃𝒗𝒆𝒉 𝒌𝒎 = 𝟏 𝟒𝟐𝟓.𝟏𝟓
Average commercial speed of the vehicles: 𝒗 = 𝒂𝒗. 𝑫
𝑳 𝒃𝒗
= 𝟏𝟑.𝟒𝟗 𝒌𝒎/𝒉
Occupancy rate: 𝒑𝒂𝒙/𝒌𝒎 = 𝒂𝒑𝒂𝒙/𝒌𝒎.𝑫
𝒏+ 𝒃𝒑𝒂𝒙/𝒌𝒎 = 𝟐𝟑.𝟓𝟕 𝒑𝒂𝒔𝒔/𝒌𝒎
Results reveal that the itinerary would require 10 automatic vehicles to fully absorb the
demand. With 10 vehicles, the total number of vehicle.kilometres travelled would be 1 425,
the average commercial speed would be 13.50 km/h and the occupancy rate of the transport
system would be more than 23 passenger/km.
Finally, the average waiting time was determined based on Table 6 of the City study design,
evaluation and selection methodology.
Minimum average waiting time: 𝑾𝑻𝒎𝒊𝒏 = 𝟓𝟓 𝒔
Maximum average waiting time:𝑾𝑻𝒎𝒂𝒙 = 𝟗𝟎 𝒔
The average time is included between 55 and 90 seconds.
4.2.4 Initial assessment
Heysel site is located in the Northern part of the Brussels-Capital Region. Main activity
centres of the site (Bruparck, Kinepolis, the Atomium, the Exhibition Center and the next Hall
12) could be connected by the new transport system and therefore the potential demand is
relatively high (about 6000 trips per day).
Two main stations could be connected to the new system: Heysel station (metro, tramway
and bus) and Esplanade station (tramway station). Therefore, the new system would provide
some interesting synergies with existing public transport network.
The main disadvantage of Heysel site is due to the inconsistency of the demand. Most
events on the site are temporary (especially for the Exhibition centre and the Hall 12) and
other activity centres have a number of visitors that can vary in a very wide range between
week days and week-ends and during holidays. As a consequence, to be successful, the
service would have to be particularly flexible.

Page | 55 D7.1 Brussels-Capital Region context and ATS Assessment, version 1
4.2.5 Initial practical feasibility analyses
4.2.5.1 Technical promptness
The itinerary is totally integrated in local traffic and includes two U turns and a roundabout.
Although the traffic in the area is not dense and some adaptations of the roads could be
implemented, automated transport demonstration would still require vehicles able to drive in
real traffic and accordingly to local driving rules.
Touristic activities in the area and the presence of many pedestrians also imply increased
security measures to avoid any risk of collision between vehicles and pedestrians.
4.2.5.2 Legal promptness
The itinerary is located on public roads and an automated transport system would be subject
to all general driving rules. As there is no specific regulation for automated vehicles, the main
question that would have to be resolved is who is responsible in case of accident.
4.2.5.3 Population promptness
The number of inhabitants in the area surrounding the itinerary is very low and most people
present during working hours are either commuters or people coming to visit one of the
centers of activity.
Commuters targeted by the service are likely to be interested in trying a new solution to
shorten their journey. Commuters who are not concerned by the system should not be
impacted by the system.
People going to one of the centers of activity generally have more time and the use of
automated transport could be an additional interest of their trip and would ease their journey
between main activity points.
4.2.5.4 Political promptness
The itinerary only includes roads managed by the municipality of Laeken. However, given the
importance of activity centers in the area and particularly the exhibition centre, the
involvement of local authorities in the project would be crucial for a successful
implementation.

Page | 56 D7.1 Brussels-Capital Region context and ATS Assessment, version 1
4.3 Saint Luc Clinics
4.3.1 Presentation of the study area
This site is located at just 10 minutes from Brussels city centre in a relatively green and quiet
environment. Close by, we find the national airport and one of the biggest shopping centres
of the city (Woluwé Shopping Centre). The site is part Woluwé-Saint-Lambert municipality
and contains three major centres of activities: (1) the hospital "Saint-Luc", (2) high schools
and universities mainly in the field of health and (3) an important sport centre.
The universitary hospital "Saint-Luc" is associated with the Catholic University of Louvain. It
counts approximately one thousand beds and employs 5000 people. Every day, the number
of patients and visitors coming to the hospital is approximately 6500. Thanks to their highly
specialised teams and continuous investments in state of the art medical equipments, Saint
Luc hospital can treat the most complex pathologies.
High schools and universities are scattered over the whole site. Many schools in the field of
health are located close to the hospital. In the other parts of the site, the schools are more
diversified (economics, engineering, etc.). Each day, 20 000 students are present on the site.
The sports centre "La Woluwe" is located near the metro station “Kraainem” and proposes
more than 35 sports.
The site has a high parking capacity. The most important parking lots are public, located
North and used by patients and visitors. Parking lots located South are used by employees
who are accessing the hospital through the secondary entrance. Around 55% of the medical
staff commute by car and 28% by public transport. The rest walk or cycle.
The hospital put a lot of effort in ensuring a good mobility of its employees, visitors and
patients. For more than 10 years, the hospital has engaged an expert to improve the mobility
inside the site. His three main objectives are (i) solving parking problems, (ii) improving the
well-being of employees and (iii) contributing to the improvement of the environmental
quality. The hospital has implemented measures to encourage carpooling and supports the
travel by bike (financial incentives, showers, lockers, bikes parks, etc.). Visitors and patients
also receive a site plan, explaining how to access the hospital without a car. Among future
projects, shuttles could be implemented to connect directly the hospital to Brussels main train
stations.
The environment is a priority for the hospital. A working group composed of representatives
of management and unions work on different environmental problems: sorting and recycling,
green mobility, management of water and energy, noise, etc. In 2008, Saint-Luc hospital
obtained the label "Ecodynamic Company" from Brussels Environment. The same year,
photovoltaic panels were installed on the roof of the hospital. Each year, these panels
prevent the discharge of dozens of tons of CO2.
Page | 57 D7.1 Brussels-Capital Region context and ATS Assessment, version 1
Figure 28: Saint Luc clinics site and main activity centres
Sports Center "Woluwe"
Commercial
space "Carnoy"
School of Public Health
High School "Léonard
De Vinci"
High School
"Parnasse Deux Alice"
EPHEC
Commercial School
Saint-Luc hospital
University: teaching
and research
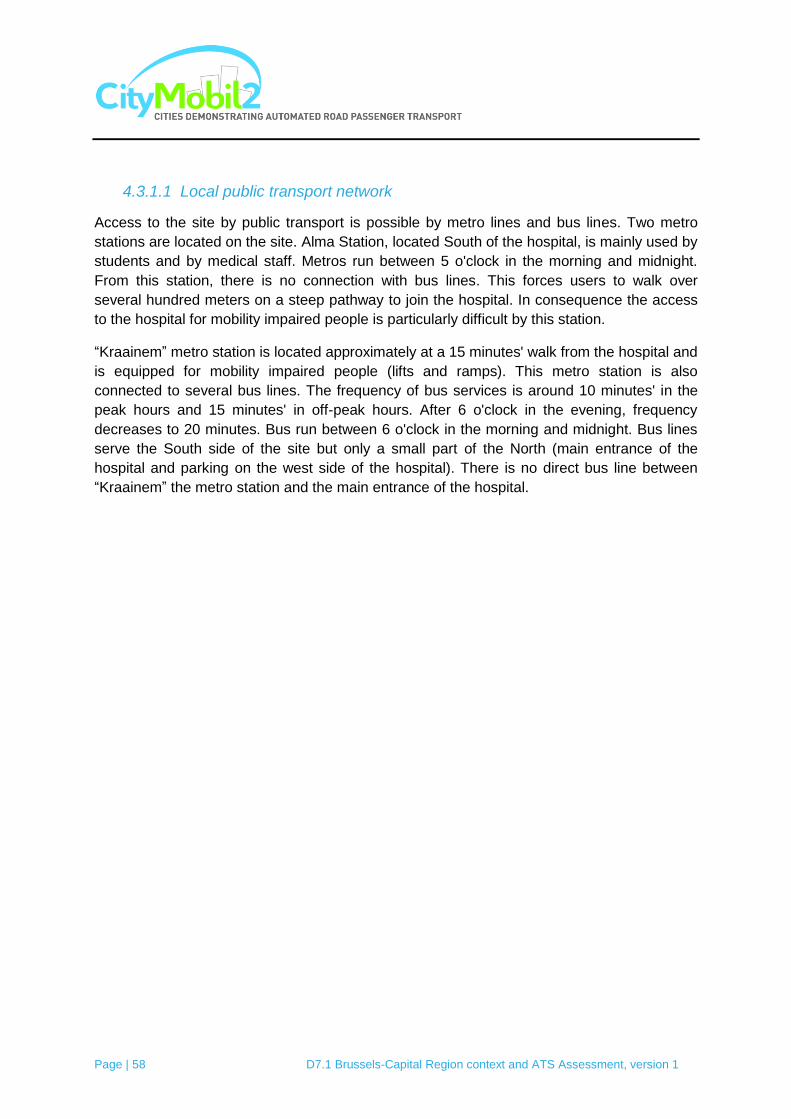
Page | 58 D7.1 Brussels-Capital Region context and ATS Assessment, version 1
4.3.1.1 Local public transport network
Access to the site by public transport is possible by metro lines and bus lines. Two metro
stations are located on the site. Alma Station, located South of the hospital, is mainly used by
students and by medical staff. Metros run between 5 o'clock in the morning and midnight.
From this station, there is no connection with bus lines. This forces users to walk over
several hundred meters on a steep pathway to join the hospital. In consequence the access
to the hospital for mobility impaired people is particularly difficult by this station.
“Kraainem” metro station is located approximately at a 15 minutes' walk from the hospital and
is equipped for mobility impaired people (lifts and ramps). This metro station is also
connected to several bus lines. The frequency of bus services is around 10 minutes' in the
peak hours and 15 minutes' in off-peak hours. After 6 o'clock in the evening, frequency
decreases to 20 minutes. Bus run between 6 o'clock in the morning and midnight. Bus lines
serve the South side of the site but only a small part of the North (main entrance of the
hospital and parking on the west side of the hospital). There is no direct bus line between
“Kraainem” the metro station and the main entrance of the hospital.
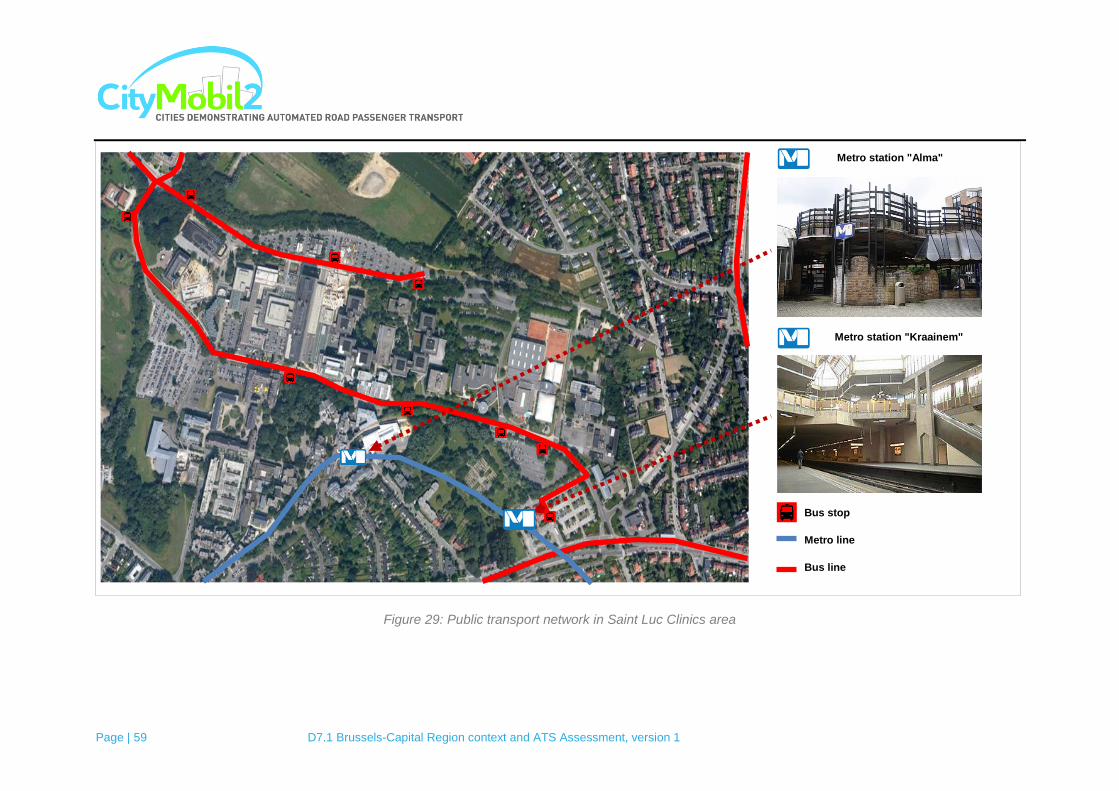
Page | 59 D7.1 Brussels-Capital Region context and ATS Assessment, version 1
Figure 29: Public transport network in Saint Luc Clinics area
Metro station "Alma"
Bus stop
Metro line
Bus line
Metro station "Kraainem"

Page | 60 D7.1 Brussels-Capital Region context and ATS Assessment, version 1
4.3.1.2 Problems and objectives
Access for mobility impaired people
Two metro stations can be used to access the site:
- (1) Alma station, located South of the hospital. This station does not offer any
connection with bus lines and, to reach the hospital, it is necessary to walk over
several hundred meters on a steep pathway. Therefore, it is particularly difficult
for mobility impaired people to access to the hospital by this station.
- (2) Kraainem station, located East of the hospital. This station is equipped for
mobility impaired people but is located at a 15 minutes' walk from the entrance
of the hospital. Moreover, there is no direct bus line between this metro station
and the main entrance of the hospital.
Accessibility to the hospital for mobility impaired people is therefore particularly difficult and
generally requires a car or the use of specific services.
Currently, some robotic electric vehicles are especially designed for people with reduced
mobility (for example, "Induct" manufacturer). The implementation of such a system could
therefore bring a real added value to the site by improving considerably the accessibility for
mobility impaired people. Automated vehicles could connect metro stations and car parks to
the hospital entrance.
Figure 30: Robotic electric vehicles specially designed for mobility impaired people ("Induct")
Internal mobility
Bus lines serve the South side of the site but only a small part of the North. Several parking
lots, schools and the sport centre are not well served by public transport. Automated transport
systems could complete the existing transport network and facilitate the connections between
the different sites. This would help various users: workers, students, patients and visitors.
Furthermore, this transport system with no driver allows a high flexibility of operation. Although
conventional public transports run only between specific hours (typically between 6 o‟clock in
the morning to midnight), Automated vehicles could serve the site day and night. This is
particularly interesting as medical activities do not stop at night.

Page | 61 D7.1 Brussels-Capital Region context and ATS Assessment, version 1
Safety feeling on the access to the car parks
Although most planned surgeries are scheduled during the day, shift work is still required to
take care of all the patients staying overnight and to continue to treat emergencies. Therefore,
hospital staff, in particular nurses and doctors, are often required to come or to leave the
hospital during the night. Most of them use their own vehicles that they park in one of the car
parks. Although the site is relatively safe, night access to the car park can bring up a feeling of
insecurity.
As automated vehicles could run 24 hours a day, the system could facilitate the access to the
car parks during the night and reduce the feeling of insecurity of night workers.
4.3.1.3 Advantages and disadvantages
Advantages Disadvantages
Important synergies with existing public transport network
Lower demand
Connexion with bus and metro stations Lower international visibility
Demand spread evenly during the day and the week
Demand spread evenly across the whole area
Social aspect: access for mobility impaired people
Un-congested roads
Enthusiastic stakeholders
4.3.1.4 Expected impacts
Indicators to assess the suitability of the site and, later, to assess the success of automated
transport system implementation are presented in the following table. Indicators that are
relevant for all systems wherever they are implemented are highlighted in green. Other
indicators can be specific to one or several sites and their selection generally depends on site
specific objectives.
In the case of Saint Luc Clinics most specific indicators are related to user perception and
transport efficiency. Access time for mobility impaired users has also been specifically
selected as it is one of the main objectives of the automated system implementation in this
site.
Page | 62 D7.1 Brussels-Capital Region context and ATS Assessment, version 1
Table 8: Proposed impact indicators for Saint Luc Clinics
Evaluation category Impacts Indicators
Acceptance
User acceptance
Usefulness
Ease of use
Integration with other systems
Willingness to pay User willingness
Authorities willingness
Quality of service
comfort Perceived comfort
Perception of safety and security Perception of safety
Fear of attack
Transport patterns
Modal change
Induced mode changes in the other segments of the journey
System modal share
System use
Total passenger.km travelled
Total number of trips
Vehicle occupancy
System performances
Average Journey time per OD pair
Average waiting time
Interchange time
System capacity Effective system capacity
Social impacts Spatial accessibility
Change in range of key activities within time thresholds
Distribution of accessibility changes by social groups
Service accessibility Access times for mobility impaired users
Environment
Energy Daily consumption
Energy efficiency
Climate change CO2
Land take Change in road space availability to other users
Financial impacts
Start up costs
Track construction and civil works
Vehicle acquisition/construction
Control systems and apparatus
Operating costs
Personnel
Vehicle maintenance
Track and civil infrastructures maintenance
Control system maintenance
Revenues Operating revenues
Economic impacts
Temporary job provided by installation and demonstration
Jobs provided at the demonstration site
Efficiency
Financial Net Present Value
Socio-economic Net Present Value
Internal Rate of Return
Benefit/Cost ratio
4.3.2 Demand estimation
4.3.2.1 Itinerary general description
As described previously, Saint-Luc site comprises different components including a hospital,
high schools and universities, student accommodations, a sport centre, several enterprises
and research centres related to medical activities. Each day, 20 000 students are present on
the site. The site has a high parking capacity and is mainly served by two metro stations (Alma
and Kraainem). A few bus stops are also present on the site.

Page | 63 D7.1 Brussels-Capital Region context and ATS Assessment, version 1
Based on the site analysis, an itinerary that would significantly improve the mobility inside the
site could be identified. The itinerary starts from main entrance of the Clinics, follows “avenue
Hippocrate”, passes in front of the sport the sport centre and reaches Kraainem metro station
before going back to the hospital by exactly the same way. The itinerary is 2 km long and
includes 10 stops, 5 on each way: UCL(Saint-Luc Clinics and UCL), Dunette, Fac Nord, Fac
Sud, Mounier and Kraainem (metro station).
The itinerary was selected to enable the connection with existing public transport lines
(Kraainem, Mounier and Dunette stops). Some stops were also identified along the way to
offer an alternative solution to private vehicle drivers using Eastern parking lots (Fac Sud
station, near the entrance of the 201 places UCL parking lot, facing the Woluwe sport centre;
Fac Nord, UCL and Parking Esplanade stations, near the entrance of parking lots and near the
Clinics and University attractor poles).
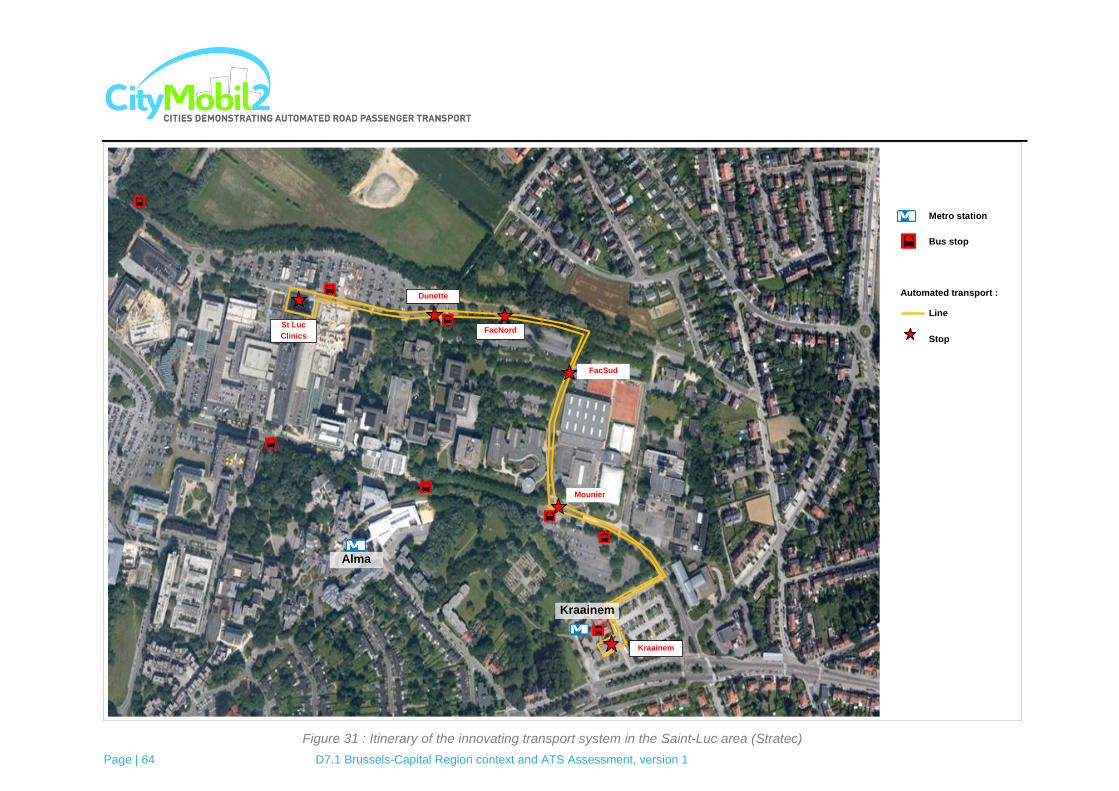
Page | 64 D7.1 Brussels-Capital Region context and ATS Assessment, version 1
Mounier
Kraainem
FacSud
FacNord
Dunette
St Luc
Clinics
Alma
Kraainem
Metro station
Bus stop
Automated transport :
Line
Stop
Figure 31 : Itinerary of the innovating transport system in the Saint-Luc area (Stratec)

Page | 65 D7.1 Brussels-Capital Region context and ATS Assessment, version 1
Itinerary pictures:
Figure 32 : Description of the itinerary for the innovating transport system in the Saint-Luc Clinics area (Stratec)
Automated transport route

Page | 66 D7.1 Brussels-Capital Region context and ATS Assessment, version 1
Figure 33 : Street views of the itinerary in Saint-Luc Clinics area (Stratec)
Page | 67 D7.1 Brussels-Capital Region context and ATS Assessment, version 1
4.3.2.2 Demand estimation
The demand estimation for the public transport system has been carried out for the Saint-Luc
area. Considering the 6 stations intended to be created, two types of stops have been
identified to estimate the demand: one stop connected to the main metro line serving the site
(Kraainem) and the other stops connected to bus stops and/or parking lots (UCL, Dunette, Fac
Nord, Fac Sud and Mounier).
Kraainem station
The demand for this station was estimated based on the number of people accessing or
exiting Kraainem metro and bus station. Data was extracted from the regional public transport
model for year 2011.Furthermore, a part of people accessing and exiting Alma metro station
(which is ten times more used than Kraainem metro station) was taken into account, as current
public transport users of this station may potentially decide to use Kraainem metro station
instead, if a new transport system would be implemented.
Data extracted from the model also included the ratios of trip purposes (home to work, home
to school, home to others and not linked to home). Based on these trip purposes and the
distances between stops and activity centres, we estimated a global coefficient that represents
the proportion of the people accessing or exiting the public transport station who would use the
new system. Unlike what was found for the other potential sites, coefficients are in this case
relatively small. This is largely due to the presence of another metro station closer to most
activity centres. As explained previously, the main purpose of the system in this case is not to
improve general travelling time but to offer a service accessible to mobility impaired people. As
such, it was expected that the ratio of people interested would be relatively small.
Results are presented in the following table.
Saint-Luc Clinics, Dunette, Fac Nord, Fac Sud and Mounier stations
These five stations are connected to bus stops and/or to important parking lots. The demand
was estimated based on the number of people going on or getting off the buses at these stops
as well as the capacity of the parking lots.
Again, based on trip purposes ratios, the location of parking lots and of activity centres
coefficients representing the proportion of people that would use the new public transport
system have been calculated. Results are presented in the following tables.

Page | 68 D7.1 Brussels-Capital Region context and ATS Assessment, version 1
Table 9: Demand estimation for the complete itinerary of Saint-Luc Clinics site
Public Transport Parking lots
Station
access to or exit from the
station (people/day)
Global demand
coefficient Demand
Parking lot capacity
Coefficient Demand Total
demand
Kraainem
Métro Kraainem 1234 2.76%
231 0 - 0 231 Métro Alma 13851 1.39%
Bus Kraainem 167 2.76%
Mounier 0 - 0 315 10% 32 32
Fac Sud 0 - 0 553 10% 55 55
Fac Nord 0 - 0 343 10% 34 34
Dunette 37 25.03% 9 210 10% 21 30
Saint Luc Clinics 561 0.11% 1 100 20% 20 21
TOTAL 241 162 403
The demand for the itinerary is estimated to 403 trips per day.
4.3.3 System pre-design
The quantitative method developed by CTL to pre-design the advanced transport system was
used in the present study. It requires several parameters, including the demand estimation and
the itinerary length, to carry out the simulation.
Then the maximum allowed speed (vmax), the vehicle capacity (vc) and the maximum waiting
time (t) must be defined. The choice of these three parameters enables to determine the pre-
design coefficients for the number of vehicles (an and bn), the vehicle.kilometers run (aveh km
and bveh km), the commercial speed (av and bv) and the occupancy rate (apax/km and bpax/km)
through the tables 4 and 5 from the Annex C of the City study design, evaluation and selection
methodology. The values of these parameters are presented here:
Maximum allowed speed:𝐯𝐦𝐚𝐱 = 𝟐𝟓 𝐤𝐦/𝐡
Vehicle capacity:𝐯𝐜 = 𝟏𝟎 𝐩𝐥𝐚𝐜𝐞𝐬
Maximum waiting time: 𝐭 = 𝟐𝟓𝟎 𝐬
The following parameters concerning the number of vehicles and the vehicle.kilometers
travelled were extracted from the tables:
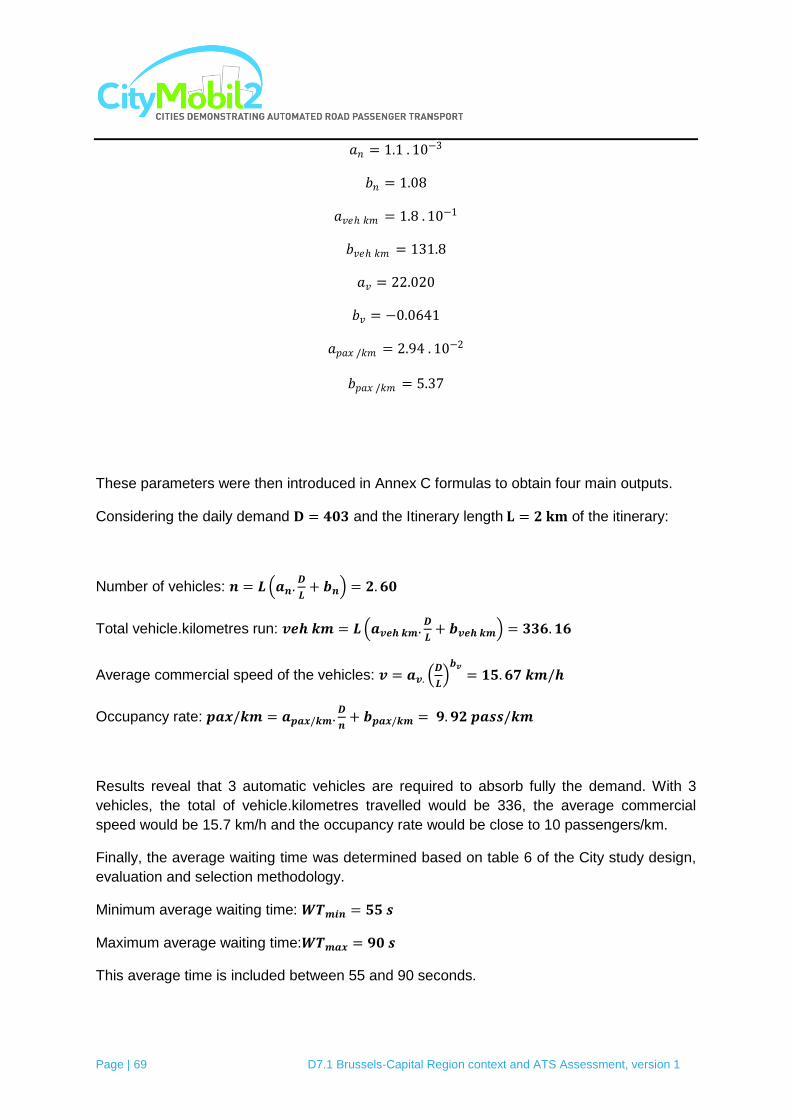
Page | 69 D7.1 Brussels-Capital Region context and ATS Assessment, version 1
𝑎𝑛 = 1.1 . 10−3
𝑏𝑛 = 1.08
𝑎𝑣𝑒 𝑘𝑚 = 1.8 . 10−1
𝑏𝑣𝑒 𝑘𝑚 = 131.8
𝑎𝑣 = 22.020
𝑏𝑣 = −0.0641
𝑎𝑝𝑎𝑥 /𝑘𝑚 = 2.94 . 10−2
𝑏𝑝𝑎𝑥 /𝑘𝑚 = 5.37
These parameters were then introduced in Annex C formulas to obtain four main outputs.
Considering the daily demand 𝐃 = 𝟒𝟎𝟑 and the Itinerary length 𝐋 = 𝟐 𝐤𝐦 of the itinerary:
Number of vehicles: 𝒏 = 𝑳 𝒂𝒏.𝑫
𝑳+ 𝒃𝒏 = 𝟐.𝟔𝟎
Total vehicle.kilometres run: 𝒗𝒆𝒉 𝒌𝒎 = 𝑳 𝒂𝒗𝒆𝒉 𝒌𝒎.𝑫
𝑳+ 𝒃𝒗𝒆𝒉 𝒌𝒎 = 𝟑𝟑𝟔.𝟏𝟔
Average commercial speed of the vehicles: 𝒗 = 𝒂𝒗. 𝑫
𝑳 𝒃𝒗
= 𝟏𝟓.𝟔𝟕 𝒌𝒎/𝒉
Occupancy rate: 𝒑𝒂𝒙/𝒌𝒎 = 𝒂𝒑𝒂𝒙/𝒌𝒎.𝑫
𝒏+ 𝒃𝒑𝒂𝒙/𝒌𝒎 = 𝟗.𝟗𝟐 𝒑𝒂𝒔𝒔/𝒌𝒎
Results reveal that 3 automatic vehicles are required to absorb fully the demand. With 3
vehicles, the total of vehicle.kilometres travelled would be 336, the average commercial
speed would be 15.7 km/h and the occupancy rate would be close to 10 passengers/km.
Finally, the average waiting time was determined based on table 6 of the City study design,
evaluation and selection methodology.
Minimum average waiting time: 𝑾𝑻𝒎𝒊𝒏 = 𝟓𝟓 𝒔
Maximum average waiting time:𝑾𝑻𝒎𝒂𝒙 = 𝟗𝟎 𝒔
This average time is included between 55 and 90 seconds.

Page | 70 D7.1 Brussels-Capital Region context and ATS Assessment, version 1
4.3.4 Initial assessment
Although a high number of students and employees go everyday to Saint-Luc Clinics site,
the demand for the automated system is relatively limited (about400 users a day). These
results were expected as for this site, the purpose of the new system is not to target the
highest number of potential users but to offer a solution for mobility impaired people.
Therefore, for most people, access to the site is more interesting by Alma metro station even
if an automated transport system is implemented. However, for mobility impaired people, the
system would offer a very interesting alternative.
The other main advantage of the site is that streets are wide and the traffic is sparse so that
the risks of conflicts between the automated system and road traffic are limited.
4.3.5 Initial practical feasibility analyses
4.3.5.1 Technical promptness
The itinerary is totally integrated in local traffic and includes several crossroads. Although
these roads do not support an important traffic, some of them constitute the main access to
the hospital and cannot be closed to the traffic. Furthermore, the width of certain parts of the
itinerary is limited and would not allow the creation of a dedicated lane.
A successful implementation of automated transport system on these itineraries would
therefore require the use of vehicles able to drive autonomously in real traffic and according
to local driving rules.
4.3.5.2 Legal promptness
The itinerary is located on public roads and an automated transport system would be subject
to all general driving rules. As there is no specific regulation for automated vehicles, the
main question that would have to be resolved is who is responsible in case of accident.
4.3.5.3 Population promptness
Although people going to or leaving the hospital may not be really prompt to testing
innovative ways of travelling, there is a clear need of improvements of the local
transportation system, especially for mobility impaired people.
As the new system would significantly improve the access to the hospital, it is therefore likely
to interest greatly a part of the people coming to or leaving the hospital.

Page | 71 D7.1 Brussels-Capital Region context and ATS Assessment, version 1
4.3.5.4 Political promptness
The itinerary runs trough roads managed by the municipality of Woluwe-Saint-Lambert and
land owned and managed by the University. Furthermore, the itinerary is clearly linked to the
activities of the clinics.
Therefore, a successful implementation would require the involvement and the support of
three entities: the municipality of Woluwe-Saint-Lambert, the University and the Hospital.
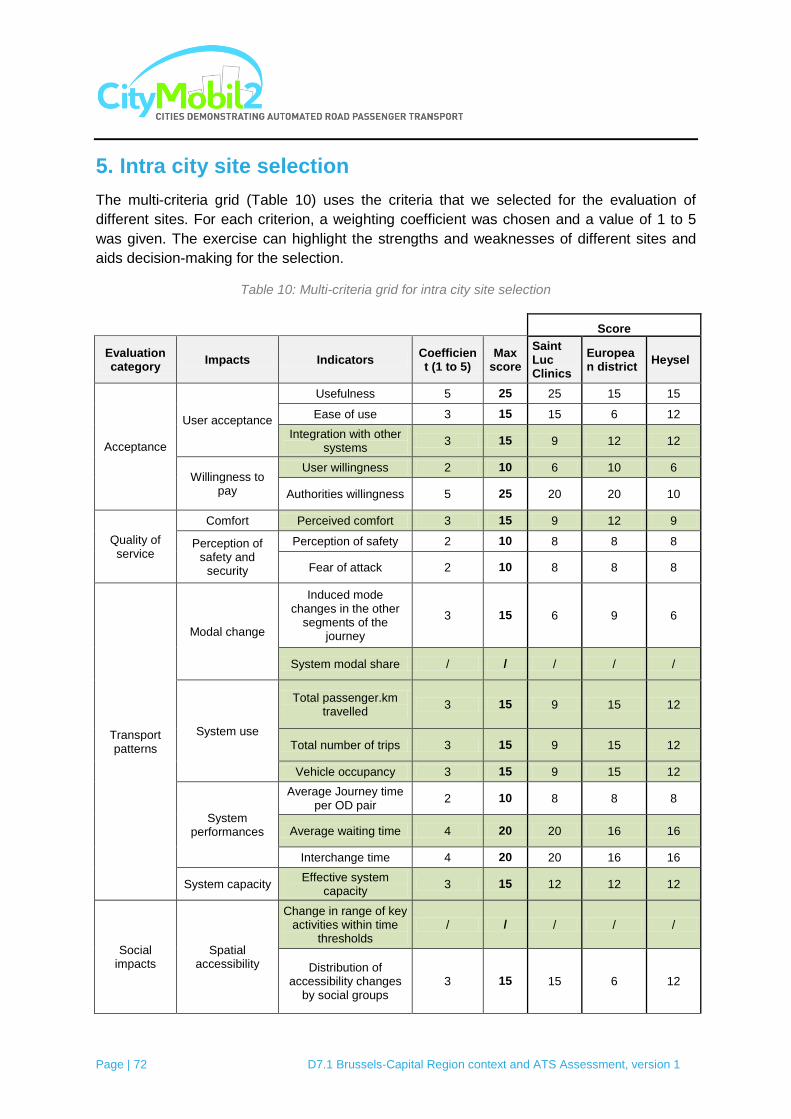
Page | 72 D7.1 Brussels-Capital Region context and ATS Assessment, version 1
5. Intra city site selection
The multi-criteria grid (Table 10) uses the criteria that we selected for the evaluation of
different sites. For each criterion, a weighting coefficient was chosen and a value of 1 to 5
was given. The exercise can highlight the strengths and weaknesses of different sites and
aids decision-making for the selection.
Table 10: Multi-criteria grid for intra city site selection
Score
Evaluation category
Impacts Indicators Coefficient (1 to 5)
Max score
Saint Luc Clinics
European district
Heysel
Acceptance
User acceptance
Usefulness 5 25 25 15 15
Ease of use 3 15 15 6 12
Integration with other systems
3 15 9 12 12
Willingness to pay
User willingness 2 10 6 10 6
Authorities willingness 5 25 20 20 10
Quality of service
Comfort Perceived comfort 3 15 9 12 9
Perception of safety and
security
Perception of safety 2 10 8 8 8
Fear of attack 2 10 8 8 8
Transport patterns
Modal change
Induced mode changes in the other
segments of the journey
3 15 6 9 6
System modal share / / / / /
System use
Total passenger.km travelled
3 15 9 15 12
Total number of trips 3 15 9 15 12
Vehicle occupancy 3 15 9 15 12
System performances
Average Journey time per OD pair
2 10 8 8 8
Average waiting time 4 20 20 16 16
Interchange time 4 20 20 16 16
System capacity Effective system
capacity 3 15 12 12 12
Social impacts
Spatial accessibility
Change in range of key activities within time
thresholds / / / / /
Distribution of accessibility changes
by social groups 3 15 15 6 12
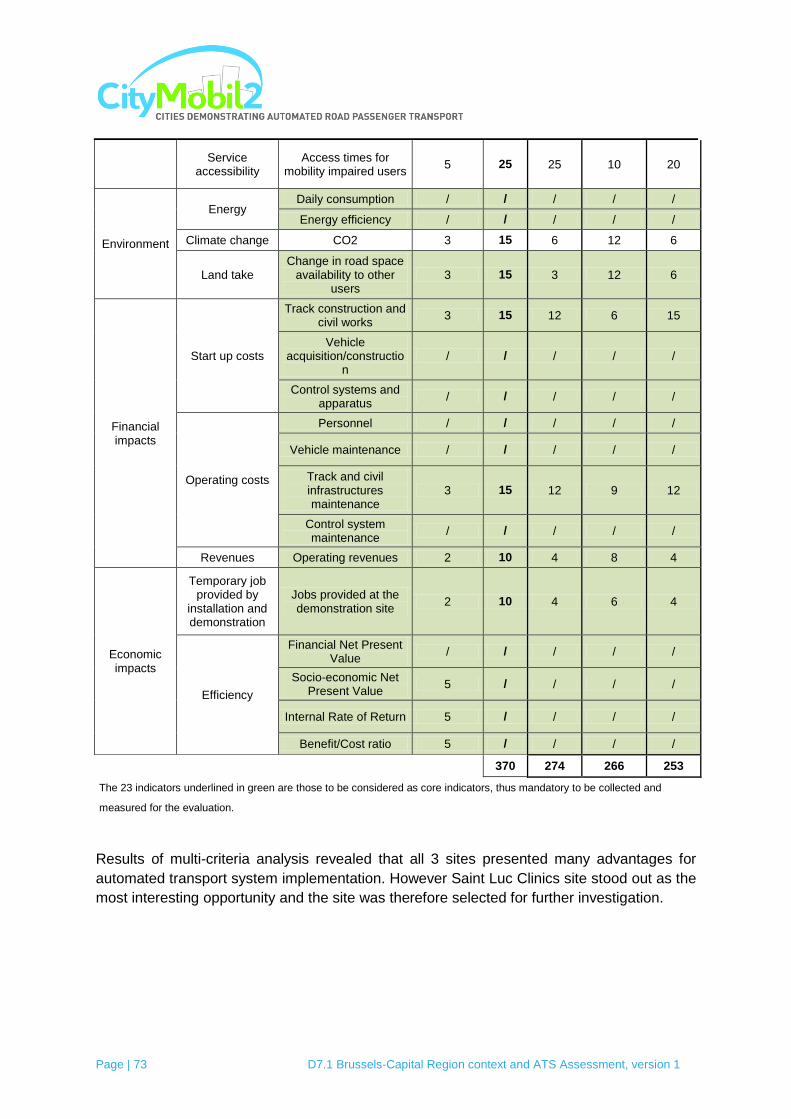
Page | 73 D7.1 Brussels-Capital Region context and ATS Assessment, version 1
Service accessibility
Access times for mobility impaired users
5 25 25 10 20
Environment
Energy Daily consumption / / / / /
Energy efficiency / / / / /
Climate change CO2 3 15 6 12 6
Land take Change in road space
availability to other users
3 15 3 12 6
Financial impacts
Start up costs
Track construction and civil works
3 15 12 6 15
Vehicle acquisition/constructio
n / / / / /
Control systems and apparatus
/ / / / /
Operating costs
Personnel / / / / /
Vehicle maintenance / / / / /
Track and civil infrastructures maintenance
3 15 12 9 12
Control system maintenance
/ / / / /
Revenues Operating revenues 2 10 4 8 4
Economic impacts
Temporary job provided by
installation and demonstration
Jobs provided at the demonstration site
2 10 4 6 4
Efficiency
Financial Net Present Value
/ / / / /
Socio-economic Net Present Value
5 / / / /
Internal Rate of Return 5 / / / /
Benefit/Cost ratio 5 / / / /
370 274 266 253
The 23 indicators underlined in green are those to be considered as core indicators, thus mandatory to be collected and
measured for the evaluation.
Results of multi-criteria analysis revealed that all 3 sites presented many advantages for
automated transport system implementation. However Saint Luc Clinics site stood out as the
most interesting opportunity and the site was therefore selected for further investigation.

Page | 74 D7.1 Brussels-Capital Region context and ATS Assessment, version 1
6. Initial evaluation
Based on the pre-designed system outputs, this step provides the expected effects of Saint-
Luc Clinics site project. Selected indicators were evaluated with analysis/derivation
techniques to verify whether the new system would provide improvements to the current
situation. Thresholds for success were also defined.
Ev
alu
ati
on
ca
teg
ory
Imp
ac
ts
Indicators Reference
case Success threshold
Su
cc
ess
?
Comments
Accep
tance Use
r accep
tance
Integration with other systems
/
≥ 20% of the people coming to the site interested by the
system. ≥ 50% of mobility impaired person
coming to the site interested in the
system
Ex-a
nte
eva
lua
tion
To judge the acceptance of system, results of the surveys will show the proportion of people interested by the service. Results will also indicate the proportion of mobility impaired people that would use this service to come to the hospital (the automated bus at the Kraainem subway station is a very interesting alternative for those people who can‟t stop at Alma and have to take a car/cab to reach Saint Luc Clinics).
Will
ing
ne
ss t
o p
ay
User willingness
/
Half the people interested in the
service agree to pay for a round-trip
Ex-a
nte
eva
lua
tion
Results of the surveys will indicate the proportion of people having the willingness to pay for an extra fare (2€ for a round-trip) for travelling with the automated bus if the travel times and waiting times are the same as the conventional bus and with waiting times lower for the automated bus (-5 minutes).
Qu
alit
y o
f se
rvic
e
Com
fort
Perceived comfort
/
Improved perceived comfort (compared to a conventional
bus)
Ex-a
nte
eva
lua
tion
Results of the surveys allowed to estimate the relative preferences of users for conventional road public transport and for the bus automated. A constant value named ASC (Alternative Specific Constant) of the automated bus is indicative of the importance attached by users to the differences in unobserved attributes (like perceived comfort) between an automated bus and a conventional minibus.

Page | 75 D7.1 Brussels-Capital Region context and ATS Assessment, version 1
Tra
nsp
ort
pa
tte
rns
Mo
dal ch
ang
e
System modal share
/
Shift from cars to automated bus
system ≥5% of the people coming to the
site by car
Ex-a
nte
eva
lua
tion
Brussels modal choice model will enable to evaluate the modal shift from the car to the automated bus. Average fuel consumption in the Brussels Capital Region, average distance from/to the Saint-Luc Clinics area by car and use of conversion tables (1 litre fuel = 10 kWh*) will allow to estimate the total fuel consumption in kWh and the fuel consumption per passenger.km in kWh/passenger.km.
Syste
m u
se
Total passenger.
km travelled
Brussels public
transport model applied
to conventional
bus
≥ 520 passengers.km
between 7-9 am. Based on the
comparison with the current situationof
the 2 bus lines serving Saint Luc
Clinics area for the period 7-9 am
(average of around 3400 passengers.km
considering an average length of 13
km)
No
The passenger.kilometers are estimated to 806 (round-trip of 2 km) according to the daily demand. For the period 7-9 am, we calculate 78 passengers.km.
Total number of
trips
Brussels public
transport model applied
to conventional
bus
≥ 230 trips for 7-9 am. Based on the
comparison with the current situation of
the 2 bus lines serving Saint Luc
Clinics area for the period 7-9 am
(demand of around 1500 passengers
considering an average length of 13
km)
No
For the period 7-9 am, the demand is estimated to 40 trips
(based on the system pre-design, the daily demand was estimated to 403 passengers based on a trip with stops at 6 stations).
Vehicle occupancy
Brussels public
transport model applied
to conventional
bus
Threshold ≥ 57%. Based on the average bus occupancy in
Brussels Capital Region for the period
7-9 am Ex-a
nte
eva
lua
tion
The vehicle occupancy will depend on the time slots and on peak periods in the time slots. The supply dimensioning was calculated in the aim of taking into account the demand fluctuations (maximum theoretical bus occupancy of 85%) and a maximum waiting
time of 90 seconds.

Page | 76 D7.1 Brussels-Capital Region context and ATS Assessment, version 1
Syste
m p
erf
orm
ances
Average Waiting
time
Brussels public
transport model applied
to conventional
bus
Threshold ≤ 72 seconds. Based on the average waiting
time of 72 seconds in the Brussels Capital Region for the period
7-9 am
Ye
s
Average waiting time is included between 55 and 90 seconds for the automated bus.
Syste
m c
ap
acity
Effective system capacity
Brussels public
transport model applied
to conventional
bus
Threshold ≤85% of theoretical capacity
(based on manufacturers requirements)
Ex-a
nte
eva
lua
tion
The supply was dimensioned to respect a maximum theoretical bus occupancy of 85% in the
aim to take into account the demand fluctuations.
So
cia
l im
pacts
Sp
atial accessib
ility
Change in range of
key activities
within time thresholds
Brussels public
transport model applied
to conventional
bus
Spatial accessibility improved by 50%
Ex-a
nte
eva
lua
tion
By comparing walking access time and access time using the automated bus.
En
vir
on
men
t
En
erg
y
Daily consumpti
on
Gain of electric
transport compared to
fossil fuel transport
Gain of 5% compared to fossil
fuel transport
Ye
s
From the system pre-design, the vehicles will travel 336 kilometers every day. We can calculate that the daily consumption is around 67 kWh (according to
Induct manufacturer specifications, one vehicle consumes around 16 kWh (nominal) for an autonomy of around 80 kilometres (with a slight slope)).
Energy efficiency
Gain of electric
transport compared to
fossil fuel transport
Gain of 5% compared to fossil
fuel transport.
Ye
s The energy used for
passenger.km is estimated to 0.02 kWh per passenger.km.
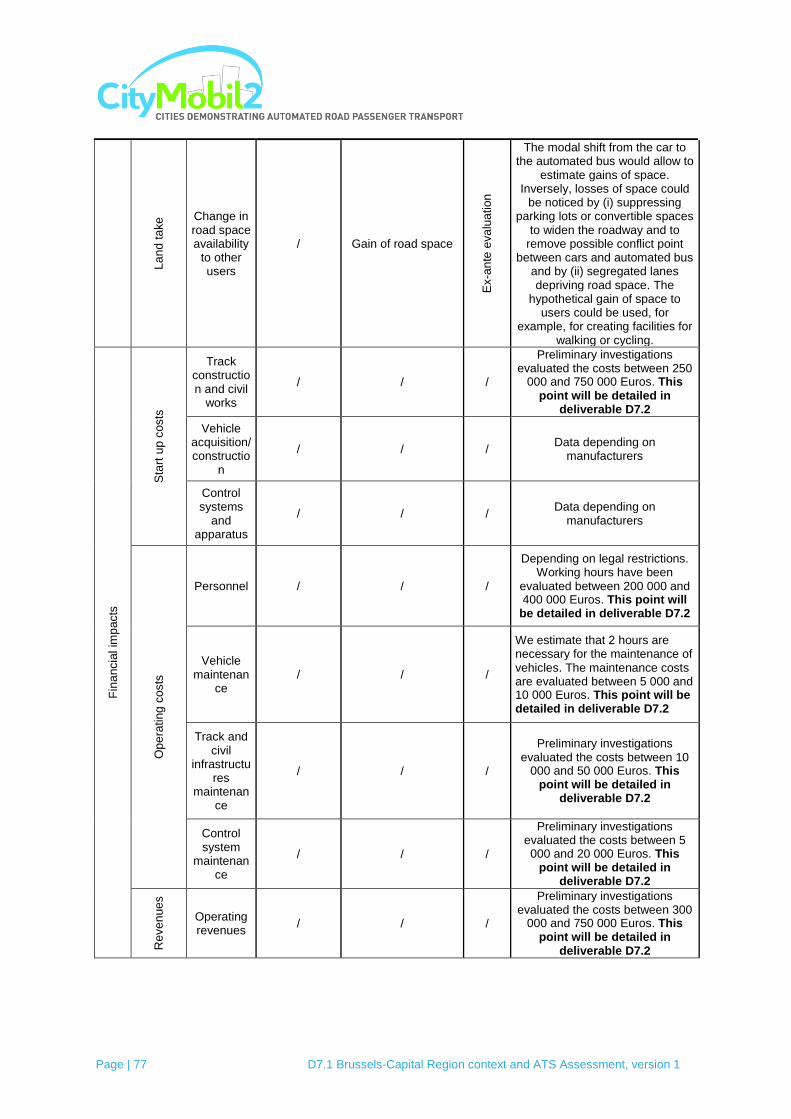
Page | 77 D7.1 Brussels-Capital Region context and ATS Assessment, version 1
La
nd
ta
ke Change in
road space availability
to other users
/ Gain of road space
Ex-a
nte
eva
lua
tion
The modal shift from the car to the automated bus would allow to
estimate gains of space. Inversely, losses of space could
be noticed by (i) suppressing parking lots or convertible spaces
to widen the roadway and to remove possible conflict point
between cars and automated bus and by (ii) segregated lanes depriving road space. The
hypothetical gain of space to users could be used, for
example, for creating facilities for walking or cycling.
Fin
ancia
l im
pacts
Sta
rt u
p c
osts
Track construction and civil
works
/ / /
Preliminary investigations evaluated the costs between 250
000 and 750 000 Euros. This point will be detailed in
deliverable D7.2
Vehicle acquisition/constructio
n
/ / / Data depending on
manufacturers
Control systems
and apparatus
/ / / Data depending on
manufacturers
Op
era
ting
co
sts
Personnel / / /
Depending on legal restrictions. Working hours have been
evaluated between 200 000 and 400 000 Euros. This point will
be detailed in deliverable D7.2
Vehicle maintenan
ce / / /
We estimate that 2 hours are necessary for the maintenance of vehicles. The maintenance costs are evaluated between 5 000 and 10 000 Euros. This point will be detailed in deliverable D7.2
Track and civil
infrastructures
maintenance
/ / /
Preliminary investigations evaluated the costs between 10
000 and 50 000 Euros. This point will be detailed in
deliverable D7.2
Control system
maintenance
/ / /
Preliminary investigations evaluated the costs between 5 000 and 20 000 Euros. This
point will be detailed in deliverable D7.2
Reve
nue
s
Operating revenues
/ / /
Preliminary investigations evaluated the costs between 300
000 and 750 000 Euros. This point will be detailed in
deliverable D7.2

Page | 78 D7.1 Brussels-Capital Region context and ATS Assessment, version 1
TO
TA
L
Total < 1 000 000
A p
rio
ri y
es
Preliminary investigations evaluated the costs between 500
000 and 1000 000 (excluding vehicle acquisition/construction
and control systems and apparatus).This point will be detailed in deliverable D7.2
Eco
nom
ic im
pacts
Te
mpo
rary
jo
b p
rovid
ed
by
insta
llation
and
de
mon
str
ation
Jobs provided at
the demonstrat
ion site
/ / /
Preliminary investigations evaluated full time 8 employees for the implementation (maintenance and operation)
Eff
icie
ncy
Financial Net
Present Value
/ / / This point will be detailed in deliverable D7.2
Socio-economic
Net Present Value
/ / / This point will be detailed in deliverable D7.2
Internal Rate of Return
/ / / This point will be detailed in deliverable D7.2
Benefit/Cost ratio
/ / / This point will be detailed in deliverable D7.2
* "People who came in the site by car and would take the service" does not indicate whether the automated bus is used for the
total travel (Origin-Destination) or just for a short distance on the site (for example to access to the parking lots).
** Brussels Capital Region transport model "IRIS2"
*** http://www.renovationdurable.eu/Notions-Valeurs-de-conversion.html
The initial evaluation underlined some positive effects of the project according to our
success thresholds (including waiting time lower than 90s., energy savings, etc.) but several
indicators require the results of the supply dimensioning and of the surveys to be estimated
(including modal shift, passengers-kilometers, vehicle occupancy, etc.). These indicators will
be estimated in the ex-ante evaluation.
Several indicators also indicated relatively small positive effects and did not reach
thresholds. The ex-ante evaluation will confirm or infirm these results.

Page | 79 D7.1 Brussels-Capital Region context and ATS Assessment, version 1
7. System dimensioning
7.1 Demand analysis
7.1.1 Modeling tools
To estimate the demand for the ARTS (Automated Road Transport System), it is first
necessary to determine the types of passengers interested in travelling with this system.
Indeed, the interest of potential users can be multiple (decrease of the perceived journey
times, increase of safety, carbon footprint reduction, facilities for mobility impaired people,
etc.). To determine the potential users, Brussels "the 4-step model" transport model was
used. In the first step of the classical model, the Trip Generation is the production and
attraction (origin and destination traffic) of each zone based on socio-demographic data (for
example, number of inhabitants and jobs). These production and attraction values define the
total demand matrix. In the second step, the Trip Distribution is determined by means of
relevant skim data (for example, journey times, fares, etc.). In the step of Modal Choice, the
total demand matrix is distributed into the different traffic modes (for example, Private and
Public Transport) on the basis of mode-specific skims (journey times and journey distances
by mode, etc.). The final step is the Assignment of the resulting mode-dependent demand
matrices on the supply network in order to obtain link volumes and new skims. This skim
data can again be used as input for trip distribution or mode choice of a new demand
calculation. This allows to iterate the calculations until a convergence criterion concerning
link volumes or matrix values.
The "4-step model" is used to calculate the demand and the supply dimensioning. We use
Visum software produced by PTV. Visum is a software system that allows the modeling of all
private and public transport types in one single integrated model. Using Visum, most basic
data provided by transport information and planning systems can be managed consistently
and maintained with the network editor. Unlike simple GIS systems, Visum allows complex
relationships within single or several transport systems to be retained, enabling to create a
suitable transport model. STRATEC has an expertise of thirty years in the modeling of
transport in Brussels. The company has been selected to upgrade the 4-step model of the
Brussels Capital Region. All progress will be used to calculate the effects of the ARTS
project on the transport demand and networks.
The Trip Generation and Trip Distribution steps will not be described in this deliverable
because their results are not dependent on the transport modes. These steps are derived
from the Brussels demand model.

Page | 80 D7.1 Brussels-Capital Region context and ATS Assessment, version 1
7.1.2 Modal Choice in Brussels model
7.1.2.1 Introduction
The modal choice model implemented in VISUM distributes the total demand between
different modes and different user's profiles, through the utility functions Uij.
The variables involved inutility functions are variables characterizing the supply of each
transport mode (for example for the Public Transport (PT): waiting time, transfer time, in-
vehicle time, travel cost, etc. and for personal vehicles: in-vehicle time, search time of a
parking lot, travel cost, etc. Moreover, the choice of variables depends on user's profiles.
An example of a utility function:
Usij(m) = p1sm * Tij(m) + p2sm * Zij(m) + p3sm * Cij(m) + p4sm
With:
- i and j: index areas O and D
- m: index mode m
- s: index of the demand's layer
- p1smto p4sm: parameters of the utility function (p4sm is the modal constant)
- Tij Zij Cij(m): variables of the utility function
The values of the utility function parameters depend on the mode and user's profiles
considered. These parameters values are estimated thanks to stated preference surveys.
For this project, we will use the traditional multinomial logit form:
Formula 1 - Multinomial logit form
Where Tij denotes the total number of travels of the demand's layer
in the relation ij
Tijm is the number of travels made with mode m
c is a procedure parameter
Below, the multinomial logit structure for this project:

Page | 81 D7.1 Brussels-Capital Region context and ATS Assessment, version 1
7.1.2.2 Stated preference surveys
First, results of stated preference surveys (SP) are used to refine the modal choice model
calibrated on the Brussels Capital Region scale (modeled in Saturn) by the knowledge of the
relative preferences of users for conventional road public transport and for the Automated
Road Transport System (ARTS).
Then, results are used to understand local attitudes towards innovation. This insight will be
the primary input for the design of a communication and marketing strategy specific for the
city.
The stated preference surveys results were produced by CTL (Research Centre for
Transport and Logistics, University of Rome La Sapienza) for the estimation of econometric
models. Econometric models provide comparisons across-European cities and across
application cases (e.g. ARTS as feeder system, ARTS as system serving specific
locations/facilities such as campuses and technology parks) of:
The statistical significance of the factors influencing choices.
The weights of the factors.
The willingness to pay for an extra fare to use the ARTS, i.e. a fare which allows a
return trip on only the ARTS and is independent of the fare system in place for the
public transport system in the city.
Factors that were considered include characteristics of the service (such as waiting time, in-
vehicle time, automated driving), socio-economic characteristics of the user (age, gender,
income, education, occupation, car ownership, public transport monthly ticket),
characteristics of the trip.
The subsequent questions of the interview were related to public transport services
proposed locally. Respondents were asked in reference to the city-specific case. About this,
we insisted on the fact that the ARTS would be set up in the Saint-Luc area particularly for
mobility impaired people to reach easily the hospital from the metro station (equipped with
lifts and ramps for mobility impaired people) or from the parking lots.
SP surveys included analysis of the waiting time, the riding time and the extra-fare, as well
as the Alternative Specific Constant (ASC) of the ARTS (the ASC of minibus is set to zero
because normalization is needed). Results related to the ASC of the ARTS are indicative of
the importance attached by users to the differences in unobserved attributes between ARTS

Page | 82 D7.1 Brussels-Capital Region context and ATS Assessment, version 1
and a conventional minibus. Therefore, results for the ASC of the ARTS can be used in the
modal split model, as an example, to fine tune the ASC of ARTS with respect to the ASC of
a conventional bus (having assumed that a bus alternative is present in the model
specification). Three possibilities are foreseen:
There is a significant difference between the ASC of ARTS and the minibus in favour
of ARTS; the modal split model may take into account an ASC of ARTS higher than
the ASC of the bus alternative.
There is a significant difference between the ASC of ARTS and the minibus in favour
of ARTS; the modal split model may take into account an ASC of ARTS higher than
the ASC of the bus alternative.
There is a significant difference between the ASC of ARTS and the minibus in favour
of minibus; the modal split model may take into account an ASC of ARTS lower than
the ASC of the bus alternative.
The ASC of ARTS is not significantly different from 0; the modal split model may take
into account the same ASC for bus and ARTS.
The SP design
Respondents of the SP survey have been faced with the choice between a minibus and the
ARTS for the specific public transport service that has been selected as candidate case for
the demonstration.
The two transport alternatives have been described in the questionnaire as follows:
Minibus: “this is the conventional bus of small size WITH DRIVER, the capacity is
about 20 passengers, passengers can sit or stand inside”.
ARTS: “this is a fully automated vehicle WITHOUT DRIVER, the capacity is about 20
passengers, passengers can sit or stand inside”.
The attributes and corresponding levels of the SP design are described below.
The number of combinations in the full factorial design (8 combinations) has been reduced to
4 combinations using a within-alternative orthogonal design technique. Therefore, each
respondent has expressed her/his choices between ARTS and minibus in 4 scenarios. For
fare, effects coding (-1/1) has been used instead of binary coding (0/1) to eliminate
confusion with the ASC.
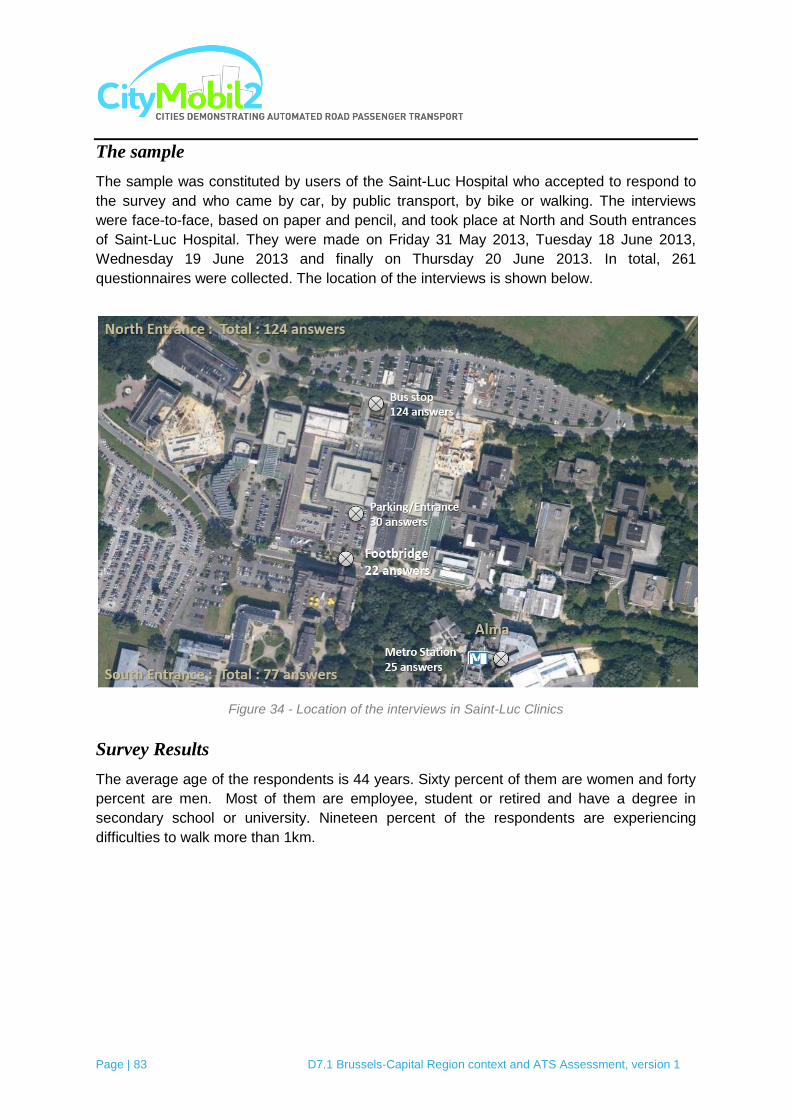
Page | 83 D7.1 Brussels-Capital Region context and ATS Assessment, version 1
The sample
The sample was constituted by users of the Saint-Luc Hospital who accepted to respond to
the survey and who came by car, by public transport, by bike or walking. The interviews
were face-to-face, based on paper and pencil, and took place at North and South entrances
of Saint-Luc Hospital. They were made on Friday 31 May 2013, Tuesday 18 June 2013,
Wednesday 19 June 2013 and finally on Thursday 20 June 2013. In total, 261
questionnaires were collected. The location of the interviews is shown below.
Figure 34 - Location of the interviews in Saint-Luc Clinics
Survey Results
The average age of the respondents is 44 years. Sixty percent of them are women and forty
percent are men. Most of them are employee, student or retired and have a degree in
secondary school or university. Nineteen percent of the respondents are experiencing
difficulties to walk more than 1km.
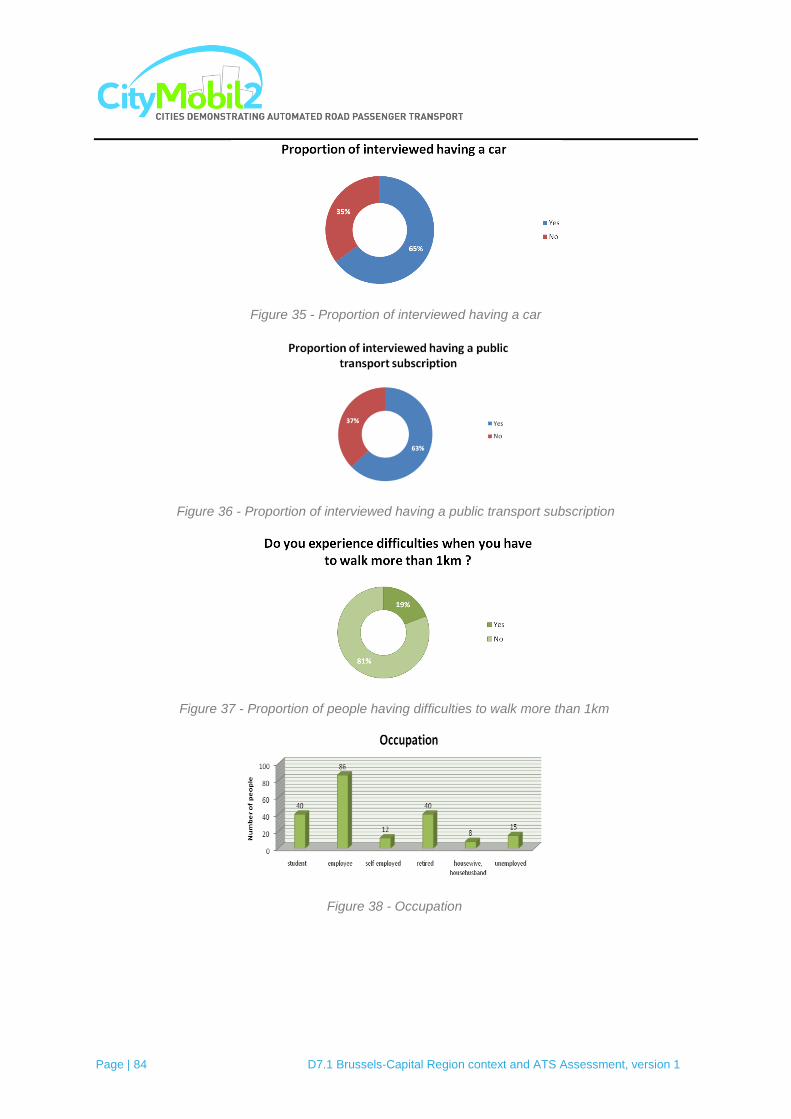
Page | 84 D7.1 Brussels-Capital Region context and ATS Assessment, version 1
Figure 35 - Proportion of interviewed having a car
Figure 36 - Proportion of interviewed having a public transport subscription
Figure 37 - Proportion of people having difficulties to walk more than 1km
Figure 38 - Occupation

Page | 85 D7.1 Brussels-Capital Region context and ATS Assessment, version 1
Figure 39 - Incomes
Figure 40 - Type of transport
Figure 41–Choice of transport mode
Around 60% of interviewed people owned a public transport subscription and 33% of the
interviewed own a car and a public transport subscription. By analyzing theErreur ! Source
du renvoi introuvable. and Erreur ! Source du renvoi introuvable., it can be noticed that
60% of Saint Luc Clinics users come by public transport, 39% by car and finally 1% walking
or cycling.
More than 70% are interested in the service and around 60% would have taken it to come to
the site.
0
10
20
30
40
50
60
70
80
90
100
Subway Train Bus Tram Car Bicycle On foot Other
78
4
62
7
97
2 110
Nu
mb
er
of
pe
op
le
What kind of transport did you use to come here today ?
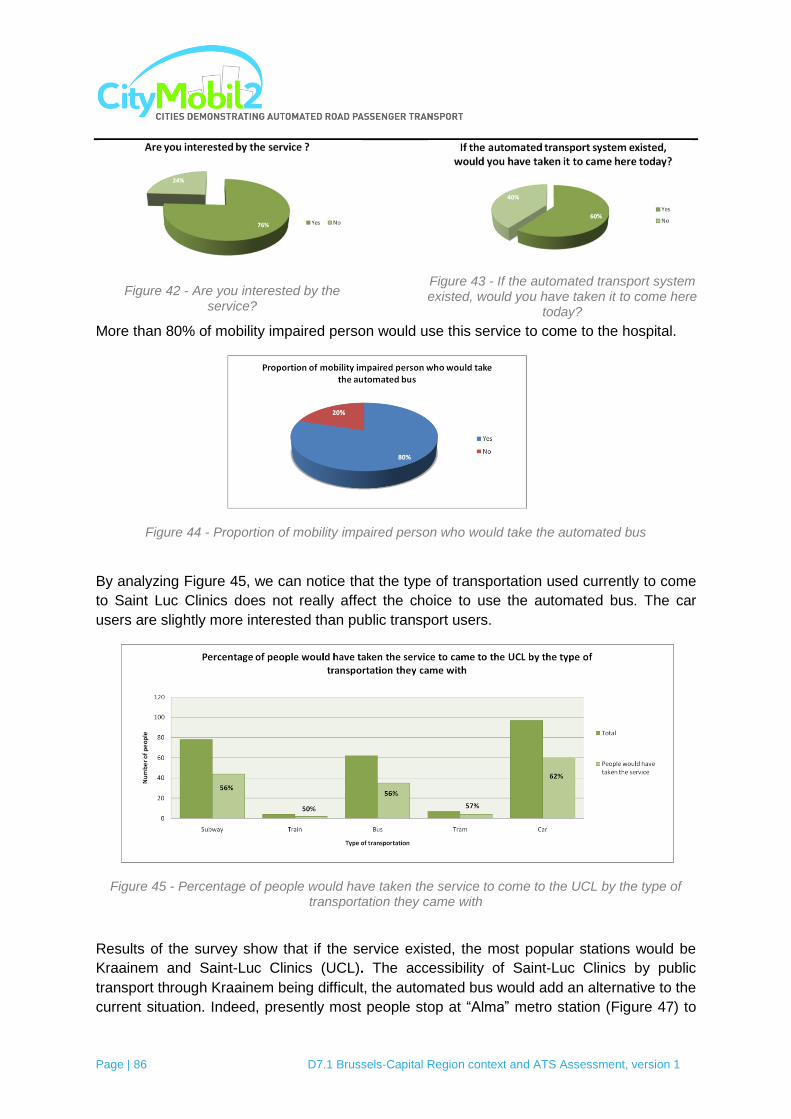
Page | 86 D7.1 Brussels-Capital Region context and ATS Assessment, version 1
Figure 42 - Are you interested by the service?
Figure 43 - If the automated transport system existed, would you have taken it to come here
today?
More than 80% of mobility impaired person would use this service to come to the hospital.
Figure 44 - Proportion of mobility impaired person who would take the automated bus
By analyzing Figure 45, we can notice that the type of transportation used currently to come
to Saint Luc Clinics does not really affect the choice to use the automated bus. The car
users are slightly more interested than public transport users.
Figure 45 - Percentage of people would have taken the service to come to the UCL by the type of transportation they came with
Results of the survey show that if the service existed, the most popular stations would be
Kraainem and Saint-Luc Clinics (UCL). The accessibility of Saint-Luc Clinics by public
transport through Kraainem being difficult, the automated bus would add an alternative to the
current situation. Indeed, presently most people stop at “Alma” metro station (Figure 47) to
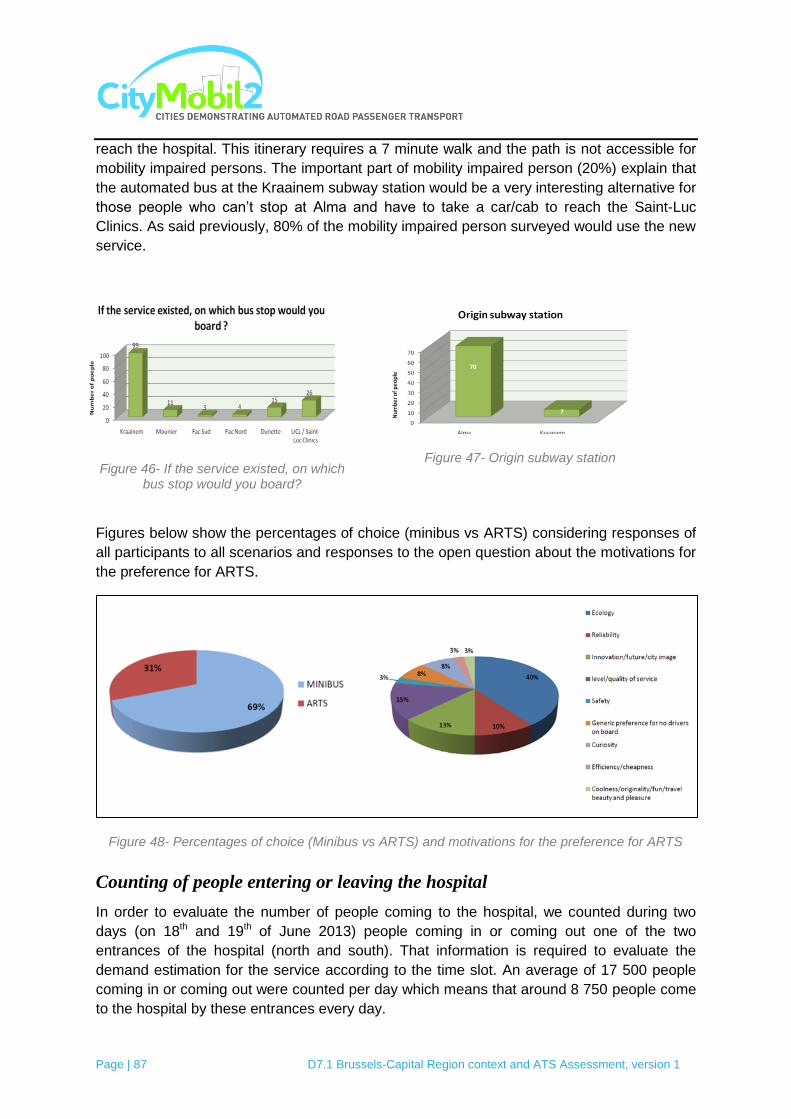
Page | 87 D7.1 Brussels-Capital Region context and ATS Assessment, version 1
reach the hospital. This itinerary requires a 7 minute walk and the path is not accessible for
mobility impaired persons. The important part of mobility impaired person (20%) explain that
the automated bus at the Kraainem subway station would be a very interesting alternative for
those people who can‟t stop at Alma and have to take a car/cab to reach the Saint-Luc
Clinics. As said previously, 80% of the mobility impaired person surveyed would use the new
service.
Figure 46- If the service existed, on which bus stop would you board?
Figure 47- Origin subway station
Figures below show the percentages of choice (minibus vs ARTS) considering responses of
all participants to all scenarios and responses to the open question about the motivations for
the preference for ARTS.
Figure 48- Percentages of choice (Minibus vs ARTS) and motivations for the preference for ARTS
Counting of people entering or leaving the hospital
In order to evaluate the number of people coming to the hospital, we counted during two
days (on 18th and 19th of June 2013) people coming in or coming out one of the two
entrances of the hospital (north and south). That information is required to evaluate the
demand estimation for the service according to the time slot. An average of 17 500 people
coming in or coming out were counted per day which means that around 8 750 people come
to the hospital by these entrances every day.

Page | 88 D7.1 Brussels-Capital Region context and ATS Assessment, version 1
Figure 49 - Outputs/Inputs sorted by entrance
Here is the distribution of Outputs and Inputs by time slot. The curve has a bell shape. We
can notice the peak period is between 9 am and 6 pm. We can also easily notice that the
North entrance is more used that the South one: approximately 50% more. In fact, the
visitors and patients majority come by cars or by bus at the north entrance. By the South
entrance, the visitors, patients and clinic workers majority come from Alma and a part of the
clinic workers from the car park, that‟s why there are less outputs and inputs. To conclude,
due to the important frequentation of the hospital there is an important demand for public
transport between 6 am and 10pm.
Figure 50 - Curve of average input/output
In accordance to CityMobil2 methodology for the city study design and evaluation of the
project, the survey results were then used in the design and system dimensioning of the
automated system: particularly the system demand analysis and the dimensioning of the
supply needed to serve this demand.
South Entrance
North Entrance

Page | 89 D7.1 Brussels-Capital Region context and ATS Assessment, version 1
In a first stage, the potential demand for the new system was evaluated with the use of
macro models traditionally used in transport planning studies and modeling results were
calibrated with counting results.
In a second stage, the potential demand for the new system was evaluated with a discrete
choice model calibrated with survey results.
In a final stage, based also on the results of the discrete choice models (second stage),
models will be used to provide estimates of the impacts that the new system, together with
additional accompanying policy measures, may have at macro level.
At the end, the demand analysis will provide (i) the daily demand expected for the new
system, (ii) corresponding modal share and (iii) the proportion of the demand shifted from
other modes.
7.1.2.3 Modal choice model
Current context
Number of trips
Survey results revealed that 60% of the Saint-Luc Clinics users came by public transport,
39% by car and finally 1% walking or cycling. The counting of people coming in or coming
out of Saint-Luc Clinics showed that on average 1737 trips were observed at the hospital
entrances between 12am and 1pm in 2013, which constitutes the peak hour in the area.
Based on these observations, we estimated public transport trips to access Saint-Luc Clinics
between 12 am and 1 pm to 1042.
Access times and generalized times to the hospital
To reach Saint-Luc Clinics by public transport, there are two main possibilities:
- Metro Alma station, located South of the hospital. This station does not offer
any connection with bus lines and, to reach the hospital, it is necessary to
walk over several hundred meters on a pathway not suitable for mobility
impaired people.
- Metro Kraainem station, located East of the hospital. This station is equipped
for mobility impaired people but is located at a 15 minute walk from the
entrance of the hospital. Moreover, there is no direct bus line between this
metro station and the main entrance of the hospital.
Currently, accessibility to the hospital for mobility impaired people is thus particularly difficult
and generally requires a car or the use of specific services. The automated system would
allow a direct access to the site by public transport.

Page | 90 D7.1 Brussels-Capital Region context and ATS Assessment, version 1
The two paths are illustrated below:
Reaching the Saint-Luc Clinics with no transport mode from the metro station Alma.
Reaching the Saint-Luc Clinics by Kraainem with the automated bus.
Figure 51 - Possible ways to reach the Saint-Luc Clinics
Travel time design: On foot
There is a distance of 450mbetweenthe hospital and the metro station Alma. It is assumed
that an average people‟s walking speed is 4km/h.The travel time by foot (Av) is 405
seconds.
𝐴𝑣 =450
1.11= 405 𝑠
For a mobility impaired person, it is particularly difficult to access to the hospital because the
path is hilly. The access speed for these profiles is estimated at 1 km/h. As seen previously,
there is 19% of mobility impaired persons who come to the Saint-Luc Clinics every day.
Figure 52 - Proportion of people having difficulties to walk more than 1km
Alma Kraainem
Saint-Luc
Clinics
Subway

Page | 91 D7.1 Brussels-Capital Region context and ATS Assessment, version 1
Then travel time for mobility impaired person (Mi) is 1620 seconds.
𝑀𝑖 =450
0.277= 1620 𝑠
So, we can calculate the average time like that:
𝐴𝑣𝑒𝑟𝑎𝑔𝑒 𝑡𝑖𝑚𝑒 = 0.19 × 1620 + 0.81 × 405 = 636 𝑠
Our Brussels transport model applies a penalty (x 1.95) for the walking trips. Thus, the
generalized time in the model is:
𝐴𝑙𝑚𝑎 𝑀𝑒𝑡𝑟𝑜 𝑠𝑡𝑎𝑡𝑖𝑜𝑛 − 𝐻𝑜𝑠𝑝𝑖𝑡𝑎𝑙 𝑜𝑛 𝑓𝑜𝑜𝑡 = 1.95 × 636 = 1240 𝑠
Travel time design: Metro + Automated Bus
The second possibility to access to the hospital is to combine existing public transport
modes with automated bus. Kraainem metro station is accessible by metro (same metro line
than Alma). There are also bus lines which deserve Kraainem station. Brussels transport
model can split the trips between these 2 alternatives.
First part of the trip:Metro between Alma and Kraainem metro stations
Travel time specified by the STIB (Society of Public Transport in Brussels) was used:
𝐴𝑙𝑚𝑎 − 𝐾𝑟𝑎𝑎𝑖𝑛𝑒𝑚 = 74 𝑠
Second part of the displacement: Walking time between metro station platform and the automated bus
stop
There is one floor to exit from the Kraainem metro platform. The travel time on foot is
estimated to 60 seconds (calculated on site).
This station is equipped to facilitate the move of mobility impaired people (lifts, facilities...).
The time for mobility impaired person to access to the exit is estimated at 90 seconds.
So, we can calculate the average time like that:
𝐴𝑣𝑒𝑟𝑎𝑔𝑒 𝑡𝑖𝑚𝑒 = 0.19 × 90 + 0.81 × 60 = 66 𝑠
Brussels transport model applies a penalty (x 1.95) for the walking trips.
𝐴𝑐𝑐𝑒𝑠𝑠 𝑡𝑜 𝑡𝑒 𝑒𝑥𝑖𝑡 = 1.95 × 66 = 129 𝑠
Third part of the trip: Automated bus
To calculate the travel time, we use the following characteristics8:
8Recommendation of manufacturers: for a people transportation use on shared lanes, 20 km/h will be applied (configurable –
depending on city‟s operating requirements). The deceleration and acceleration are fixed by operator's standard values to preserve the passengers comfort.
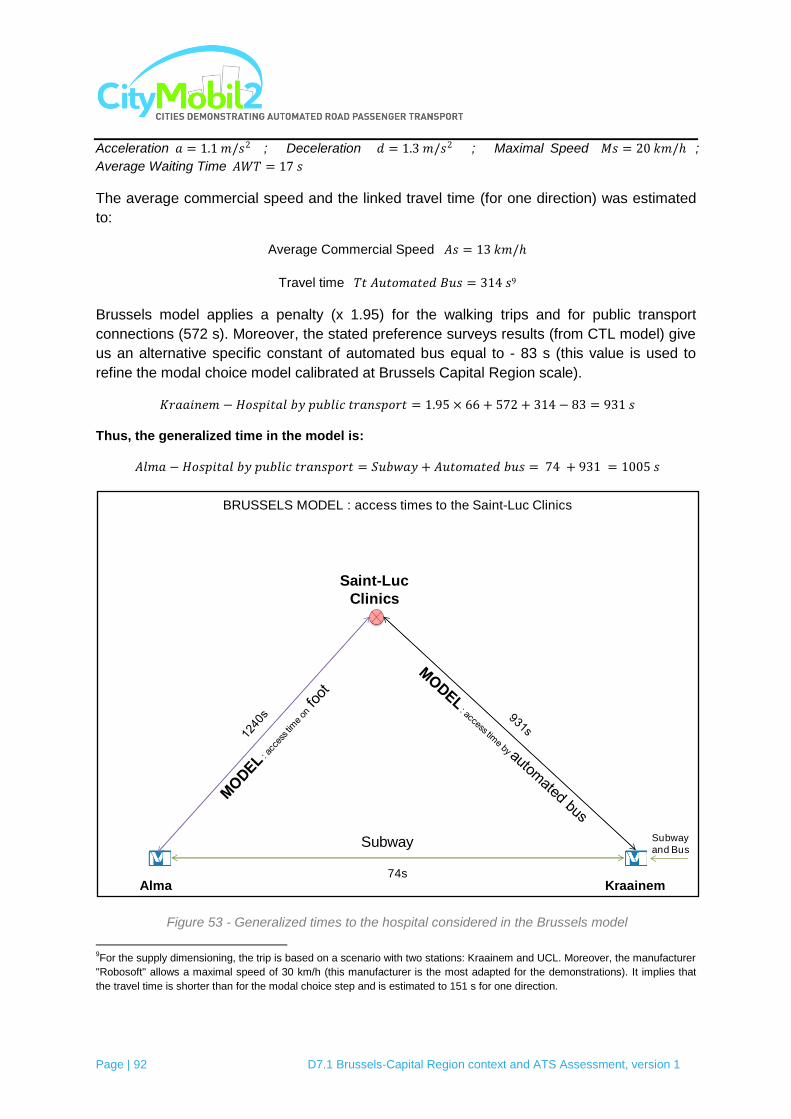
Page | 92 D7.1 Brussels-Capital Region context and ATS Assessment, version 1
Acceleration 𝑎 = 1.1 𝑚/𝑠2 ; Deceleration 𝑑 = 1.3 𝑚/𝑠2 ; Maximal Speed 𝑀𝑠 = 20 𝑘𝑚/ ;
Average Waiting Time 𝐴𝑊𝑇 = 17 𝑠
The average commercial speed and the linked travel time (for one direction) was estimated
to:
Average Commercial Speed 𝐴𝑠 = 13 𝑘𝑚/
Travel time 𝑇𝑡 𝐴𝑢𝑡𝑜𝑚𝑎𝑡𝑒𝑑 𝐵𝑢𝑠 = 314 𝑠9
Brussels model applies a penalty (x 1.95) for the walking trips and for public transport
connections (572 s). Moreover, the stated preference surveys results (from CTL model) give
us an alternative specific constant of automated bus equal to - 83 s (this value is used to
refine the modal choice model calibrated at Brussels Capital Region scale).
𝐾𝑟𝑎𝑎𝑖𝑛𝑒𝑚 − 𝐻𝑜𝑠𝑝𝑖𝑡𝑎𝑙 𝑏𝑦 𝑝𝑢𝑏𝑙𝑖𝑐 𝑡𝑟𝑎𝑛𝑠𝑝𝑜𝑟𝑡 = 1.95 × 66 + 572 + 314 − 83 = 931 𝑠
Thus, the generalized time in the model is:
𝐴𝑙𝑚𝑎 − 𝐻𝑜𝑠𝑝𝑖𝑡𝑎𝑙 𝑏𝑦 𝑝𝑢𝑏𝑙𝑖𝑐 𝑡𝑟𝑎𝑛𝑠𝑝𝑜𝑟𝑡 = 𝑆𝑢𝑏𝑤𝑎𝑦 + 𝐴𝑢𝑡𝑜𝑚𝑎𝑡𝑒𝑑 𝑏𝑢𝑠 = 74 + 931 = 1005 𝑠
Figure 53 - Generalized times to the hospital considered in the Brussels model
9For the supply dimensioning, the trip is based on a scenario with two stations: Kraainem and UCL. Moreover, the manufacturer
"Robosoft" allows a maximal speed of 30 km/h (this manufacturer is the most adapted for the demonstrations). It implies that
the travel time is shorter than for the modal choice step and is estimated to 151 s for one direction.
Alma Kraainem
Saint-Luc
Clinics
BRUSSELS MODEL : access times to the Saint-Luc Clinics
Subway Subway
and Bus
74s

Page | 93 D7.1 Brussels-Capital Region context and ATS Assessment, version 1
Alternative Specific Constant (ASC)
CTL (Research Centre for Transport and Logistics, University of Rome La Sapienza) used a
multinomial logit model with the following specifications of utilities:
where WT is the waiting time, RT is the riding time, FA is the attribute which relates to the
payment of the fare for ARTS (as other public transport, or an extra fare), β1,β2 and β3 are
the coefficients (marginal utilities), ASC is the alternative specific constant of ARTS.
Constant marginal utilities across the two alternatives have been used in this basic
calibration.
The results are obtained with the software NLOGIT by Econometric Software Inc. The
coefficients of waiting time, riding time and fare have the right sign and are statistically
significant at 95% confidence level. The ASC turns out to be negative with statistical
significance at 90% confidence level.
From the calculated coefficients, we can obtain the value of time (VOT) of the ARTS ASC by
dividing the ARTS coefficient by the RT coefficient:
ondsASCVOT ARTS sec83198917.0
275315.0
This value is used to refine the modal choice model at Brussels Capital Region scale.
Modal choice results with automated transport system
We consider that the demand variations between 2013 and the vehicles deployment (2014 or
2015) are negligible.
Brussels modal choice model allowed evaluating users' choices in case of automated
transport implementation. Results showed a modal shift of 55 passengers from personal
vehicles to public transport modes during the time period 12 am-1 pm (peak hour in Saint-
Luc Clinics area). Therefore future public transport demand can be estimated to 1097. This
constitutes an increase of 5% of the public transport demand in the hospital area.

Page | 94 D7.1 Brussels-Capital Region context and ATS Assessment, version 1
7.1.3 Assignment
The assignment procedures search some routes to travel between studied areas, and
distribute the total demand on each chosen route. A distribution model (Kirchhoff law)
determines the demand proportion which is assigned on each route j. This portion depends
on the impedance (or generalized time TGi) of a route. In any case, the percentage P of
route i in the time interval a is determined by this formula:
𝑃𝑖𝑎 =
𝑇𝐺𝑖𝑎−𝛽
𝑇𝐺𝑖𝑎−𝛽𝑛
𝑗=1
7.1.3.1 Assignment results with automated transport implemented
First, the future demand was applied in Brussels model with the distribution law of Kirchhoff
(based on generalized times) to estimate the number of public transport users who would
take the automated bus round-trip between 12 am-1 pm (Figure 54). This number was
evaluated to 899. Besides 198 people would still walk between Alma and the hospital.
So, the distribution results showed that 18% of the trips are on foot between the
hospital and Alma metro station and 82% by automated bus between the hospital and
Kraainem metro station.
Figure 54 - Distribution law of Kirchhoff applied to Saint-Luc Clinics area
Alma Kraainem
Saint-Luc
Clinics
BRUSSELS MODEL with Kirchhoff law between 12 am and 1 pm
Subway Subway
and Bus

Page | 95 D7.1 Brussels-Capital Region context and ATS Assessment, version 1
This shift from cars to public transports implied a decrease of 47 PCU10 between 12 am and
1 pm.
7.2 Supply dimensioning
Robosoft vehicle capacity is estimated to 11 passengers, taking into account the significant
proportion of mobility impaired persons (capacity of 11 passengers with a wheelchair)
among the normal passengers (capacity of 12 passengers with no wheelchair).
The peak hour demand (899 passengers), the vehicle characteristics (Vmax of 30km/h,
capacity of 11 passengers) and the trips characteristics (301s11 for a round-trip, dwell time
included) allowed calculating that 82 services would be necessary during the peak hour to
deserve the demand. The commercial speed is estimated to 25 km/h.
8 vehicles would be necessary to assimilate the peak demand of 899 passengers and the
frequency would be 45 seconds.
Therefore expected peak hour demand exceeds the capacity of the 5 vehicles
available for the demonstration (one reserve vehicle).
Survey results showed that there is a significant demand for public transport between 6 am
and 10 pm. Counting and modeling results estimated daily demand to 9134 passengers for
the automated bus service between 6 am and 10 pm.
Vehicle occupancy will depend on the demand fluctuations (Figure 56) to insure a maximum
waiting time of 90 seconds (Figure 57). Eight vehicles would be necessary for the most
loaded period (10 am-6 pm) and 4 vehicles in the off-peak hours (6-10 pm).
10
Passenger Car Unit. 11
For the supply dimensioning, the trip is based on a scenario with two stations: Kraainem and UCL. Moreover, the manufacturer "Robosoft" allows a maximal speed of 30 km/h (this manufacturer is the most adapted for the demonstrations). It implies that the travel time is shorter than for the modal choice step and is estimated to 151 s for one direction.
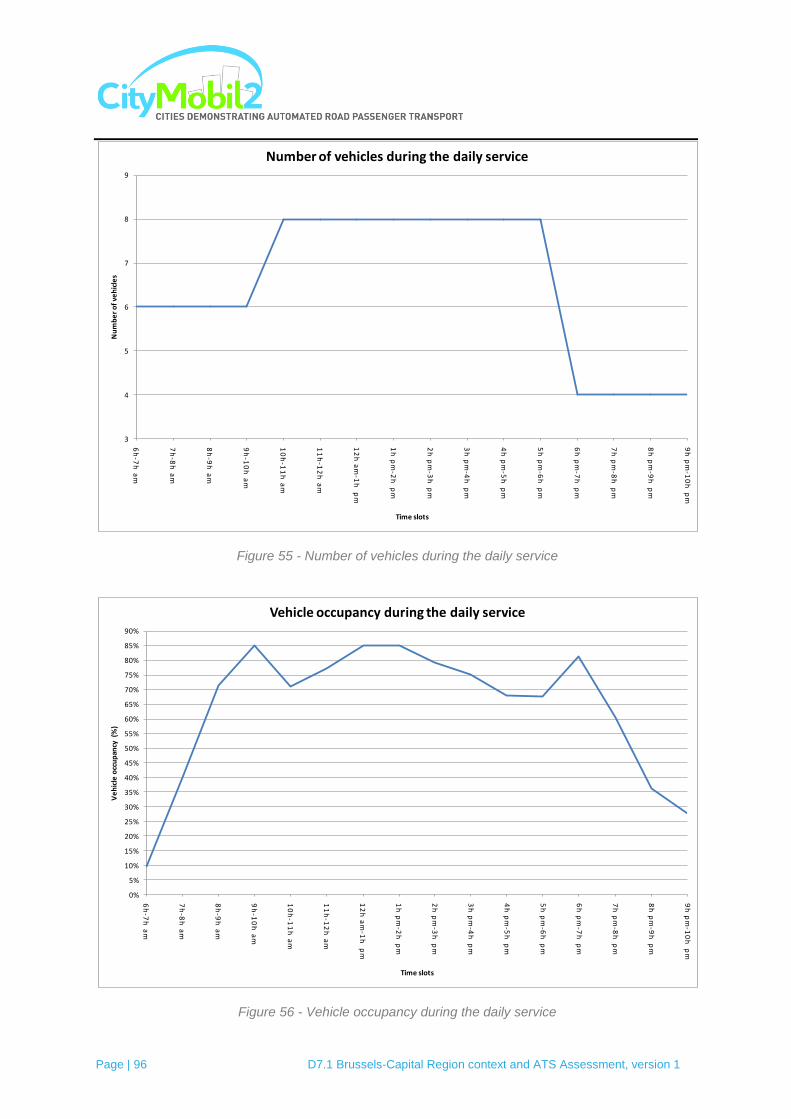
Page | 96 D7.1 Brussels-Capital Region context and ATS Assessment, version 1
Figure 55 - Number of vehicles during the daily service
Figure 56 - Vehicle occupancy during the daily service
3
4
5
6
7
8
9
6h
-7h
am
7h
-8h
am
8h
-9h
am
9h
-10
h a
m
10
h-1
1h
am
11
h-1
2h
am
12
h a
m-1
h
pm
1h
pm
-2h
pm
2h
pm
-3h
pm
3h
pm
-4h
pm
4h
pm
-5h
pm
5h
pm
-6h
pm
6h
pm
-7h
pm
7h
pm
-8h
pm
8h
pm
-9h
pm
9h
pm
-10
h p
mN
um
be
r o
f ve
hic
les
Time slots
Number of vehicles during the daily service
0%
5%
10%
15%
20%
25%
30%
35%
40%
45%
50%
55%
60%
65%
70%
75%
80%
85%
90%
6h
-7h
am
7h
-8h
am
8h
-9h
am
9h
-10
h a
m
10
h-1
1h
am
11
h-1
2h
am
12
h a
m-1
h
pm
1h
pm
-2h
pm
2h
pm
-3h
pm
3h
pm
-4h
pm
4h
pm
-5h
pm
5h
pm
-6h
pm
6h
pm
-7h
pm
7h
pm
-8h
pm
8h
pm
-9h
pm
9h
pm
-10
h p
mV
eh
icle
occ
up
ancy
(%
)
Time slots
Vehicle occupancy during the daily service

Page | 97 D7.1 Brussels-Capital Region context and ATS Assessment, version 1
Figure 57 - Average waiting times during the daily service
7.3 Urban integration
7.3.1 Safety behaviour
The City of Brussels and the private actors involved in the project decided to position
themselves to ensure a maximum of security. This involves letting automated vehicles drive
on segregated lanes as much as possible. However, automated vehicles cannot remain
indefinitely on segregated sites, especially where the available space is limited and where
roads cannot be closed to traditional vehicles. Thus, in areas where the two modes have to
coexist on the same lane, adequate measures should be taken in order to ensure the
maximum level of safety.
On the maps below, the following colour code is used:
0
5
10
15
20
25
30
35
40
45
50
55
60
65
70
75
80
6h
-7h
am
7h
-8h
am
8h
-9h
am
9h
-10
h a
m
10
h-1
1h
am
11
h-1
2h
am
12
h a
m-1
h
pm
1h
pm
-2h
pm
2h
pm
-3h
pm
3h
pm
-4h
pm
4h
pm
-5h
pm
5h
pm
-6h
pm
6h
pm
-7h
pm
7h
pm
-8h
pm
8h
pm
-9h
pm
9h
pm
-10
h p
mW
aiti
ng
tim
es
(s)
Time slots
Average waiting times during the daily service
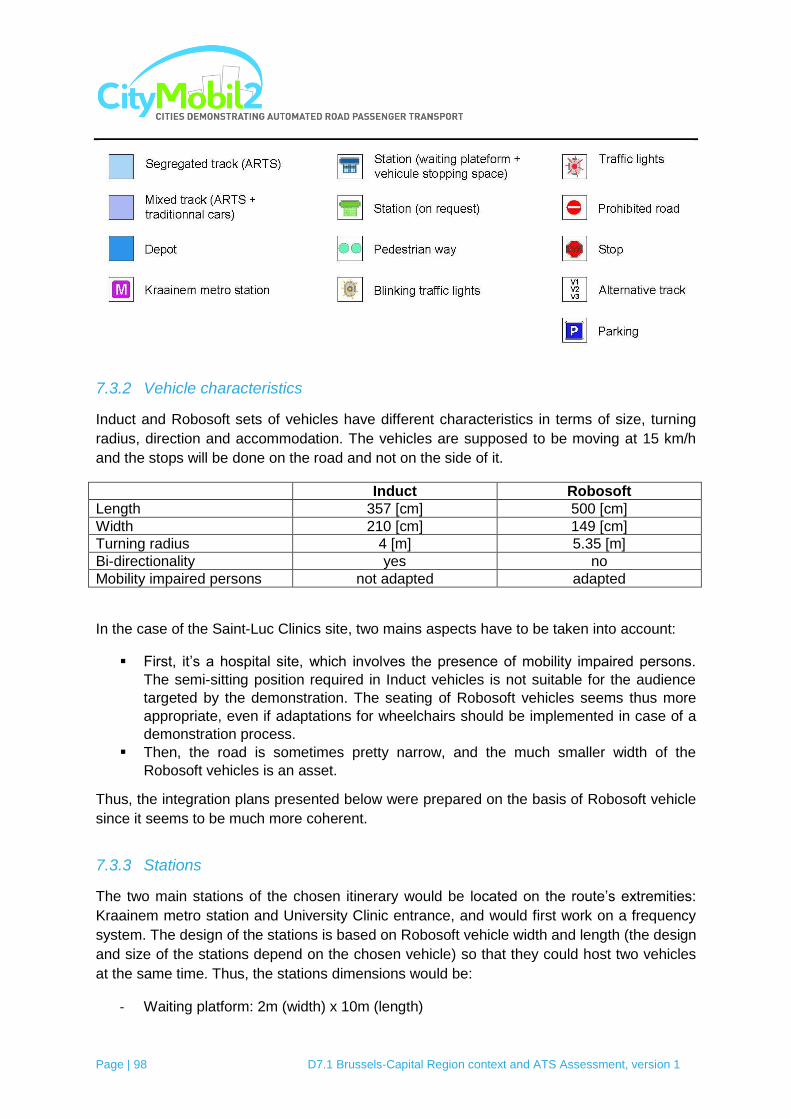
Page | 98 D7.1 Brussels-Capital Region context and ATS Assessment, version 1
7.3.2 Vehicle characteristics
Induct and Robosoft sets of vehicles have different characteristics in terms of size, turning
radius, direction and accommodation. The vehicles are supposed to be moving at 15 km/h
and the stops will be done on the road and not on the side of it.
Induct Robosoft
Length 357 [cm] 500 [cm]
Width 210 [cm] 149 [cm]
Turning radius 4 [m] 5.35 [m]
Bi-directionality yes no
Mobility impaired persons not adapted adapted
In the case of the Saint-Luc Clinics site, two mains aspects have to be taken into account:
First, it‟s a hospital site, which involves the presence of mobility impaired persons.
The semi-sitting position required in Induct vehicles is not suitable for the audience
targeted by the demonstration. The seating of Robosoft vehicles seems thus more
appropriate, even if adaptations for wheelchairs should be implemented in case of a
demonstration process.
Then, the road is sometimes pretty narrow, and the much smaller width of the
Robosoft vehicles is an asset.
Thus, the integration plans presented below were prepared on the basis of Robosoft vehicle
since it seems to be much more coherent.
7.3.3 Stations
The two main stations of the chosen itinerary would be located on the route‟s extremities:
Kraainem metro station and University Clinic entrance, and would first work on a frequency
system. The design of the stations is based on Robosoft vehicle width and length (the design
and size of the stations depend on the chosen vehicle) so that they could host two vehicles
at the same time. Thus, the stations dimensions would be:
- Waiting platform: 2m (width) x 10m (length)

Page | 99 D7.1 Brussels-Capital Region context and ATS Assessment, version 1
- Vehicle stopping area : 1.5 (width) x 10m (length)
The system dimensioning was calculated based on those two stations only, but two other
stations could be used with an on-request system to offer people the choice to use the
vehicle from/to the parking spaces or the sport centre. Those two stations would then be
developed to host only one automated vehicle, so that:
- Waiting platform: 2m (width) x 5m (length)
- Vehicle stopping space : 1.5m (width) x 5m (length)
The two optional on-request stations were located on the map as an indicative example but
would ask to redo the dimensioning system.
Furthermore, each station consists of:
- A 2 meters wide by 0.42 meters high platform (from the road pavement and not from
the sidewalk) with a 7 % ramp in order to allow an easy access to mobility impaired
persons. This implies an enhancement from the sidewalk of about 0.25 meters and
thus an access ramp length of approximately 3.5 meters on each side of the platform.
The total length of the platform is thus of 12 to 17 meters depending on the station;
- A totem indicating the location of the station;
- An information board to communicate on the route and on the frequency of the
shuttles.
Seating devices and a shelter would also be added at both terminus stations to improve
users waiting conditions.
7.3.4 Automated vehicles itinerary
As stated above, Robosoft vehicle has been used to develop the itinerary, since the aim of
such a transport system close to a hospital is to propose an alternative service to disabled
persons. Thus, a 5 meters long and 1.5 meters width vehicle has been taken into account.
One end of the automated vehicle route would be located at the Kraainem underground
station, right behind the Pizza Hut restaurant, where a station would be developed to host
two automated vehicles.
A loop would allow the vehicles to turn over, join the station and get back on their route. To
make that loop, a few parking places – which are actually not defined as it – would
disappear. Since that station wouldn‟t be very visible from the underground exit, panels and
marking should help people to join it. A device for visually impaired persons would also be
added on the ground to lead them to the ARTS station.
Next to that station (right behind the underground building) the maintenance and control
station could take place since it is located in the immediate proximity of the demonstration
route and there is enough space to host the maintenance tent (see section “accompanying
measures” below). However, it might not be the good place to show a small exhibition about
the automated vehicle, since the spot doesn‟t benefit from a good visibility.

Page | 100 D7.1 Brussels-Capital Region context and ATS Assessment, version 1
Figure 58 : Metron Kraainem with station and depot
Then, to join Mounierlaan from the station, the automated vehicle would share the
pedestrian space, which would become larger by suppressing parking spaces (29), the
squared hedge and bollards at the east extremity of that parking row. Some light civil
engineering work might help to optimise the access on both side of that path (e.g.
pavement). Sharing the space with the normal cars is also an option but a very difficult and
risky one considering that each parking space is a possible conflict point with the automated
vehicle. Figure 59 helps to figure out how the vehicles will be integrated in the parking lot.
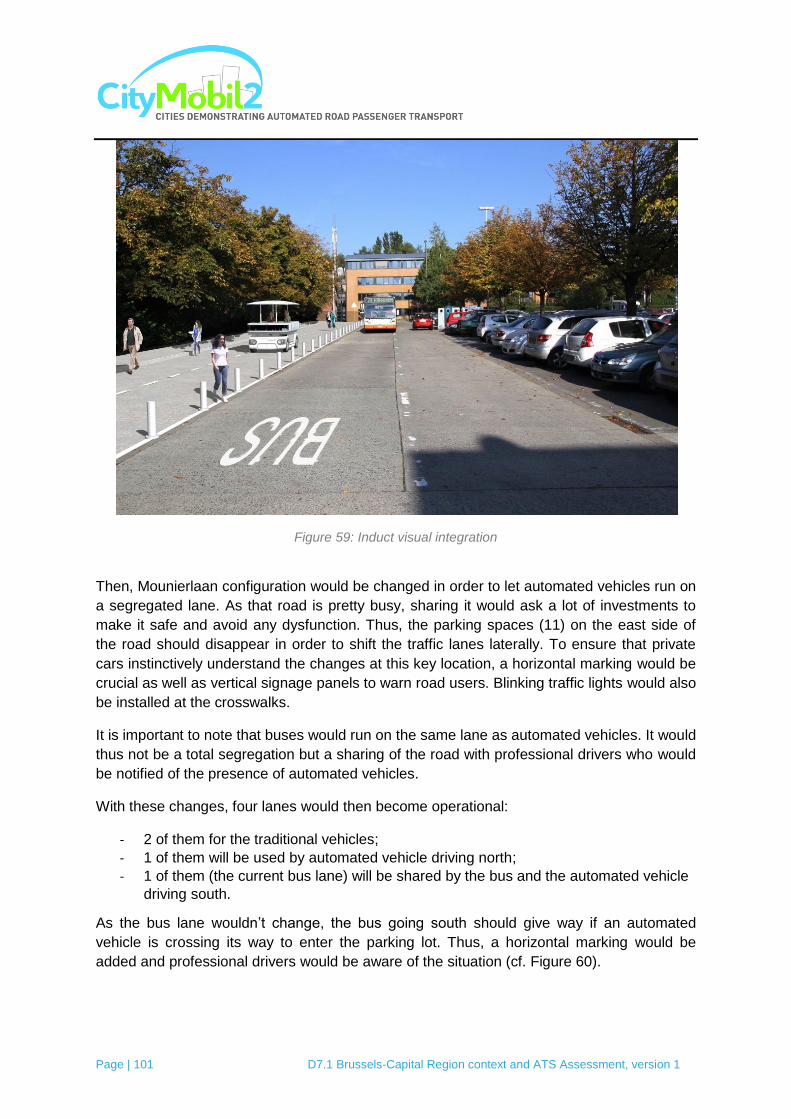
Page | 101 D7.1 Brussels-Capital Region context and ATS Assessment, version 1
Figure 59: Induct visual integration
Then, Mounierlaan configuration would be changed in order to let automated vehicles run on
a segregated lane. As that road is pretty busy, sharing it would ask a lot of investments to
make it safe and avoid any dysfunction. Thus, the parking spaces (11) on the east side of
the road should disappear in order to shift the traffic lanes laterally. To ensure that private
cars instinctively understand the changes at this key location, a horizontal marking would be
crucial as well as vertical signage panels to warn road users. Blinking traffic lights would also
be installed at the crosswalks.
It is important to note that buses would run on the same lane as automated vehicles. It would
thus not be a total segregation but a sharing of the road with professional drivers who would
be notified of the presence of automated vehicles.
With these changes, four lanes would then become operational:
- 2 of them for the traditional vehicles;
- 1 of them will be used by automated vehicle driving north;
- 1 of them (the current bus lane) will be shared by the bus and the automated vehicle
driving south.
As the bus lane wouldn‟t change, the bus going south should give way if an automated
vehicle is crossing its way to enter the parking lot. Thus, a horizontal marking would be
added and professional drivers would be aware of the situation (cf. Figure 60).

Page | 102 D7.1 Brussels-Capital Region context and ATS Assessment, version 1
Figure 60 : Crossroad Mounierlaan - Kraainem station
Then since Kimweg and Palestrelaan are parallel, very close to each other and bring both to
Hippokrateslaan, Kimweg could be closed to traditional vehicles (except special
authorisations and firemen) to let the automated vehicles on a segregated way. A diversion
would be marked for the road users.
To let the automated vehicles travel between Mounierlaan and Kimweg, traffic lights would
be installed to ensure that no car crosses the automated vehicle lane while an automated
vehicle is coming. Thus, the city of Brussels should invest in an “intelligent” traffic lights
system which provides that the traffic lights will automatically and only turned red if an
automated vehicle is approaching. Without that system of traffic lights, the Kimweg should
have priority on the Mounierlaan all day long.
The parking exit should also be secured with a STOP and possibly with an intelligent traffic
light to turn right or left. The pedestrians would here again be warned by blinking traffic lights
at the crosswalk.

Page | 103 D7.1 Brussels-Capital Region context and ATS Assessment, version 1
Figure 61 : crossroad Mounierlaan - Kimweg
To go north, Kimweg is an easy, straight and segregated path for the automated vehicles.
There are however possible conflicts at three exits (Voie Montefiore, parking of the firemen
and another parking in between). The people using those ways and parking would receive
special authorisations and STOP reminders would be drawn. As the firemen usually use the
entrance/exit on Hippokrateslaan, it might not present any danger as long as they are aware
of the situation.
Close to Hippokrateslaan, two stations would be settled on Kimweg. The east side station
would be located were the sidewalk is already large to use it as a waiting platform.
On the other side of the road, the creation of a station would imply slightly more work since
there is no real sidewalk. However, there is enough space available.
Those two stations would be developed to host one automated vehicle. As a reminder,
station dimensions for a Robosoft vehicle are:
- Waiting platform: 2m (width) x 5m (length)
- Vehicle stopping space : 1.5m (width) x 5m (length)
To connect those stations, a pedestrian crosswalk would be created, and blinking traffic
lights be added if necessary. Blinking traffic lights would also be added at the crosswalk
north Kimweg.
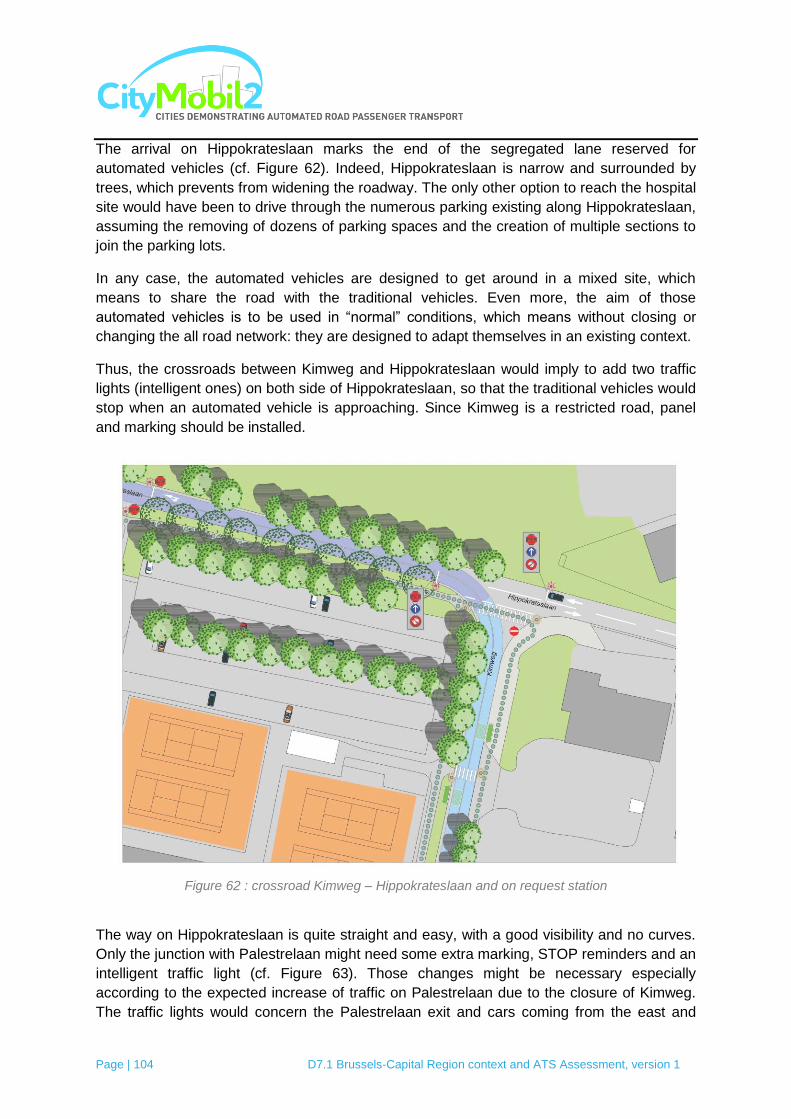
Page | 104 D7.1 Brussels-Capital Region context and ATS Assessment, version 1
The arrival on Hippokrateslaan marks the end of the segregated lane reserved for
automated vehicles (cf. Figure 62). Indeed, Hippokrateslaan is narrow and surrounded by
trees, which prevents from widening the roadway. The only other option to reach the hospital
site would have been to drive through the numerous parking existing along Hippokrateslaan,
assuming the removing of dozens of parking spaces and the creation of multiple sections to
join the parking lots.
In any case, the automated vehicles are designed to get around in a mixed site, which
means to share the road with the traditional vehicles. Even more, the aim of those
automated vehicles is to be used in “normal” conditions, which means without closing or
changing the all road network: they are designed to adapt themselves in an existing context.
Thus, the crossroads between Kimweg and Hippokrateslaan would imply to add two traffic
lights (intelligent ones) on both side of Hippokrateslaan, so that the traditional vehicles would
stop when an automated vehicle is approaching. Since Kimweg is a restricted road, panel
and marking should be installed.
Figure 62 : crossroad Kimweg – Hippokrateslaan and on request station
The way on Hippokrateslaan is quite straight and easy, with a good visibility and no curves.
Only the junction with Palestrelaan might need some extra marking, STOP reminders and an
intelligent traffic light (cf. Figure 63). Those changes might be necessary especially
according to the expected increase of traffic on Palestrelaan due to the closure of Kimweg.
The traffic lights would concern the Palestrelaan exit and cars coming from the east and

Page | 105 D7.1 Brussels-Capital Region context and ATS Assessment, version 1
wishing to turn off on Palestrelaan. The parking exist might also need a traffic light and a
STOP.
Figure 63 : Hippokrateslaan – Palestrelaan
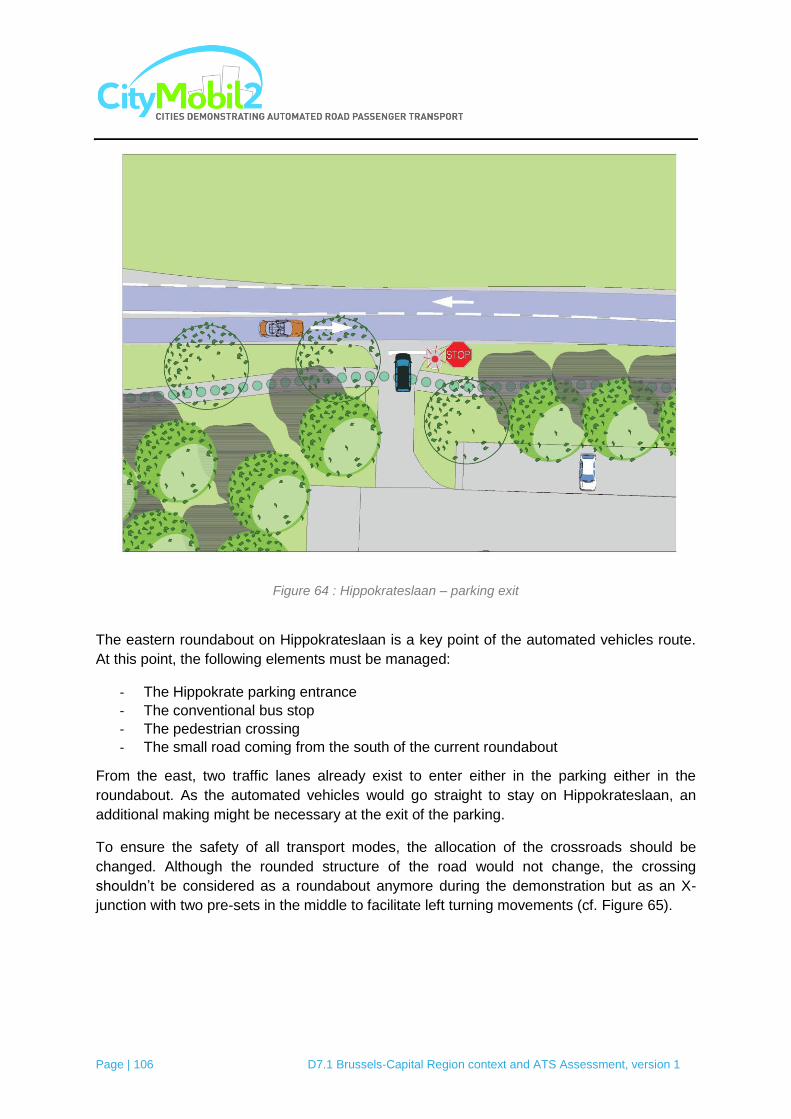
Page | 106 D7.1 Brussels-Capital Region context and ATS Assessment, version 1
Figure 64 : Hippokrateslaan – parking exit
The eastern roundabout on Hippokrateslaan is a key point of the automated vehicles route.
At this point, the following elements must be managed:
- The Hippokrate parking entrance
- The conventional bus stop
- The pedestrian crossing
- The small road coming from the south of the current roundabout
From the east, two traffic lanes already exist to enter either in the parking either in the
roundabout. As the automated vehicles would go straight to stay on Hippokrateslaan, an
additional making might be necessary at the exit of the parking.
To ensure the safety of all transport modes, the allocation of the crossroads should be
changed. Although the rounded structure of the road would not change, the crossing
shouldn‟t be considered as a roundabout anymore during the demonstration but as an X-
junction with two pre-sets in the middle to facilitate left turning movements (cf. Figure 65).
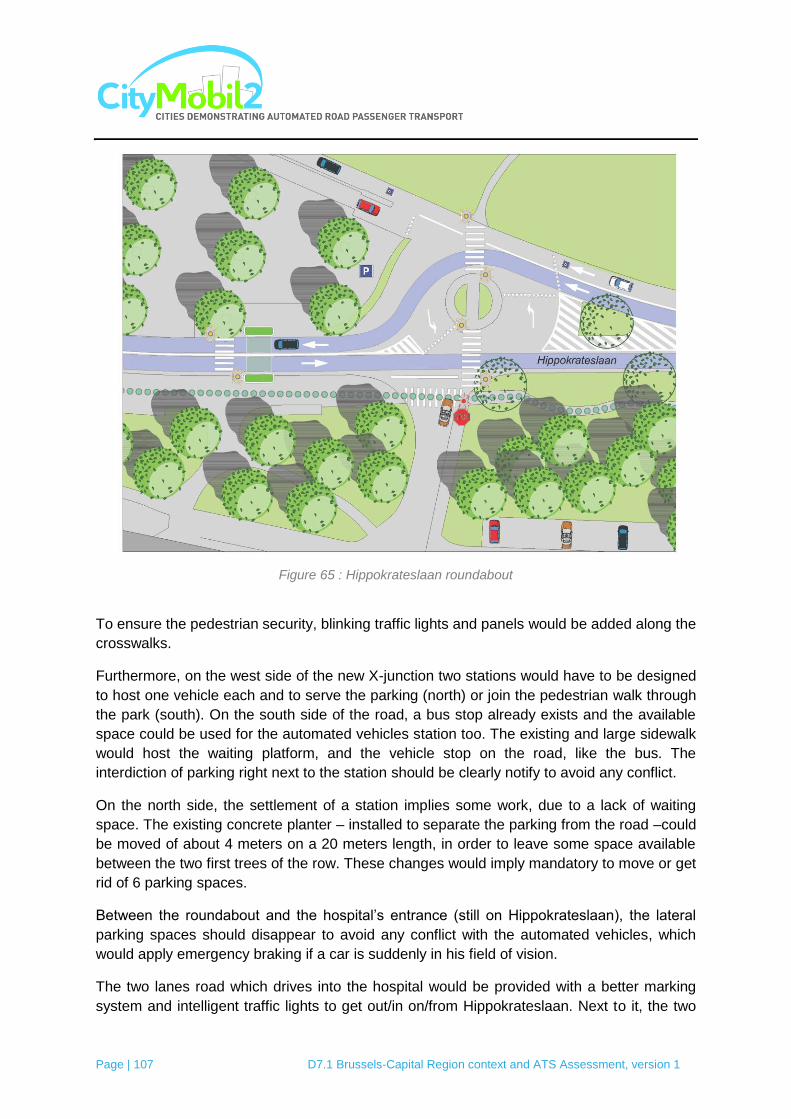
Page | 107 D7.1 Brussels-Capital Region context and ATS Assessment, version 1
Figure 65 : Hippokrateslaan roundabout
To ensure the pedestrian security, blinking traffic lights and panels would be added along the
crosswalks.
Furthermore, on the west side of the new X-junction two stations would have to be designed
to host one vehicle each and to serve the parking (north) or join the pedestrian walk through
the park (south). On the south side of the road, a bus stop already exists and the available
space could be used for the automated vehicles station too. The existing and large sidewalk
would host the waiting platform, and the vehicle stop on the road, like the bus. The
interdiction of parking right next to the station should be clearly notify to avoid any conflict.
On the north side, the settlement of a station implies some work, due to a lack of waiting
space. The existing concrete planter – installed to separate the parking from the road –could
be moved of about 4 meters on a 20 meters length, in order to leave some space available
between the two first trees of the row. These changes would imply mandatory to move or get
rid of 6 parking spaces.
Between the roundabout and the hospital‟s entrance (still on Hippokrateslaan), the lateral
parking spaces should disappear to avoid any conflict with the automated vehicles, which
would apply emergency braking if a car is suddenly in his field of vision.
The two lanes road which drives into the hospital would be provided with a better marking
system and intelligent traffic lights to get out/in on/from Hippokrateslaan. Next to it, the two
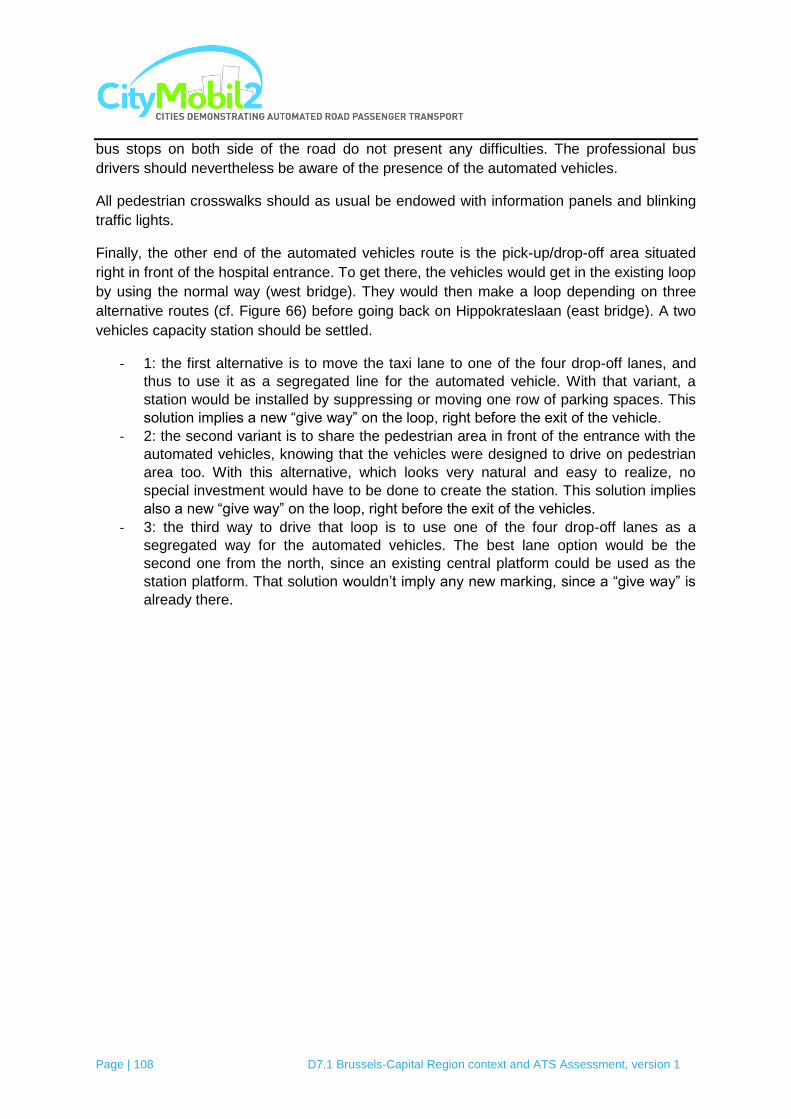
Page | 108 D7.1 Brussels-Capital Region context and ATS Assessment, version 1
bus stops on both side of the road do not present any difficulties. The professional bus
drivers should nevertheless be aware of the presence of the automated vehicles.
All pedestrian crosswalks should as usual be endowed with information panels and blinking
traffic lights.
Finally, the other end of the automated vehicles route is the pick-up/drop-off area situated
right in front of the hospital entrance. To get there, the vehicles would get in the existing loop
by using the normal way (west bridge). They would then make a loop depending on three
alternative routes (cf. Figure 66) before going back on Hippokrateslaan (east bridge). A two
vehicles capacity station should be settled.
- 1: the first alternative is to move the taxi lane to one of the four drop-off lanes, and
thus to use it as a segregated line for the automated vehicle. With that variant, a
station would be installed by suppressing or moving one row of parking spaces. This
solution implies a new “give way” on the loop, right before the exit of the vehicle.
- 2: the second variant is to share the pedestrian area in front of the entrance with the
automated vehicles, knowing that the vehicles were designed to drive on pedestrian
area too. With this alternative, which looks very natural and easy to realize, no
special investment would have to be done to create the station. This solution implies
also a new “give way” on the loop, right before the exit of the vehicles.
- 3: the third way to drive that loop is to use one of the four drop-off lanes as a
segregated way for the automated vehicles. The best lane option would be the
second one from the north, since an existing central platform could be used as the
station platform. That solution wouldn‟t imply any new marking, since a “give way” is
already there.
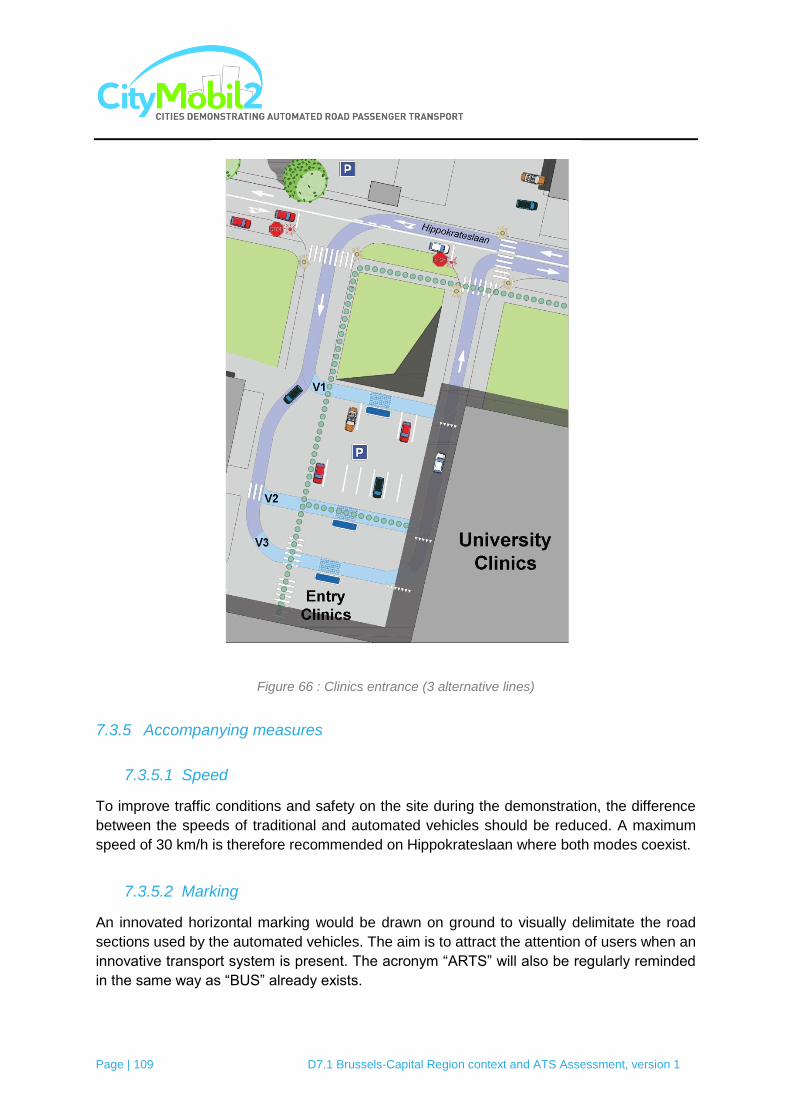
Page | 109 D7.1 Brussels-Capital Region context and ATS Assessment, version 1
Figure 66 : Clinics entrance (3 alternative lines)
7.3.5 Accompanying measures
7.3.5.1 Speed
To improve traffic conditions and safety on the site during the demonstration, the difference
between the speeds of traditional and automated vehicles should be reduced. A maximum
speed of 30 km/h is therefore recommended on Hippokrateslaan where both modes coexist.
7.3.5.2 Marking
An innovated horizontal marking would be drawn on ground to visually delimitate the road
sections used by the automated vehicles. The aim is to attract the attention of users when an
innovative transport system is present. The acronym “ARTS” will also be regularly reminded
in the same way as “BUS” already exists.
Page | 110 D7.1 Brussels-Capital Region context and ATS Assessment, version 1
When automated vehicles use separate but adjacent to conventional traffic lanes, bollards
could be added to separate flows and to increase safety by avoiding the swerved of vehicles
on the segregated lane. This would particularly be the case in the parking lot of Kraainem
metro station and on Mounierlaan.
7.3.5.3 Maintenance and control station
Loading and maintenance operations will be held in a removable tent rented for the
demonstration. To accommodate six vehicles, the tent should have a total size of
approximately 250 square meters. It must be located as close as possible of the
demonstration route and in close proximity to electrical connections.
This tent could be located behind the underground station of Kraainem, right next to the
automated vehicle station. That location might fit perfectly, except that the visibility of the
spot doesn‟t claim people‟s attention at the exit of the underground.
Another alternative solution is to settle the tent on one of the numerous parking areas, if
electrical connections are available and if the access is easy for automated vehicles.
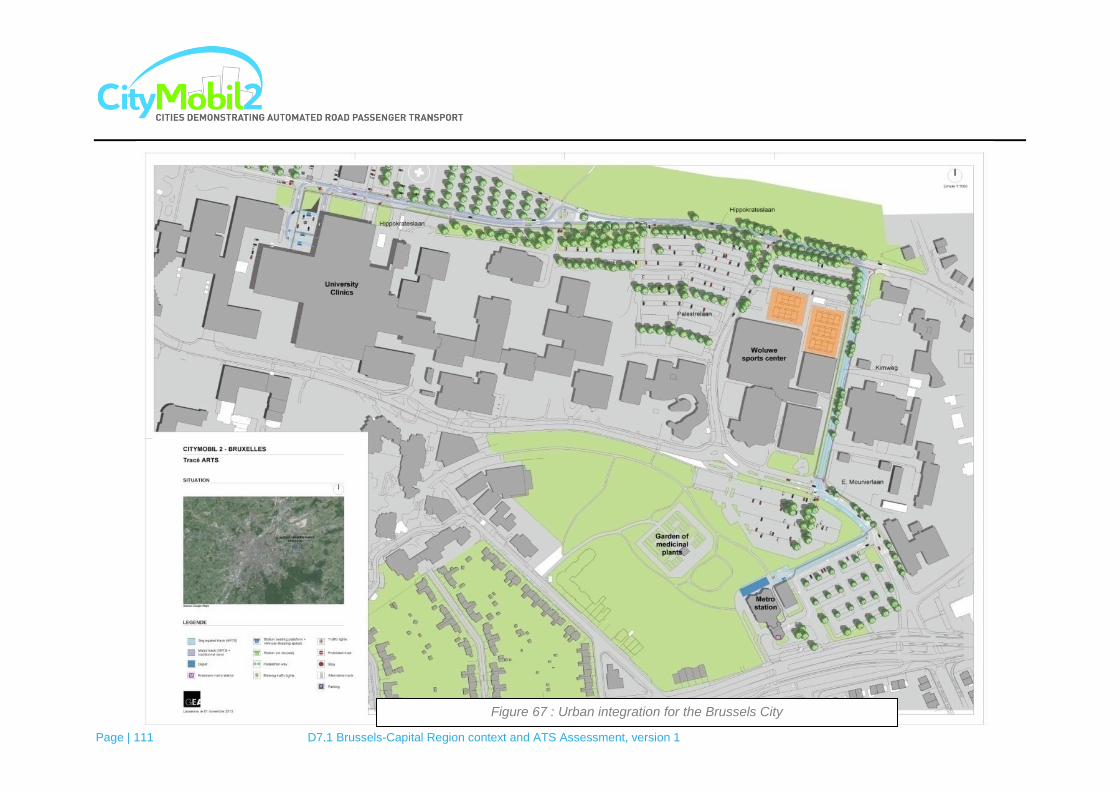
Page | 111 D7.1 Brussels-Capital Region context and ATS Assessment, version 1
Figure 67 : Urban integration for the Brussels City

Page | 112 D7.1 Brussels-Capital Region context and ATS Assessment, version 1
7.4 Citizen awareness campaign plan
7.4.1 Citizen awareness campaign context
In Brussels Capital Region, there is already a good experience of campaigns aiming to
promote alternative mobility. Historically, the first big campaign about mobility concerned the
safety issues (mainly on roads). Today, at the Region level, the budget dedicated to
alternative mobility is not far from the one dedicated to safety.
In recent years, Brussels Capital Region has been setting up more than a dozen of
campaigns on alternative mobility.
For example here are the campaigns in progress:
“The seatbelt, for everyone, everywhere, all the time!” of Brussels Mobility and IBSR (Belgian Institute for road safety).
“More comfort for pedestrians on Avenue Louise”: No Deliveries and no parking on the sidewalks of Louise bottleneck.
“The Regional Parking Plan was approved: Discover the key measures that municipalities will apply”.
“For an Albert Avenue more bikeable”. A demonstration phase begins with marked bicycle paths.
LEDs illuminate the ring near Anderlecht: A first in Belgium with Brussels Mobility “Operation satchel” The school year start is the perfect time to adopt a good
behaviour to get to school safely! On the occasion of the campaign “Operation Satchel” over 130000 calendars, day planners and brochures tips and games are distributed to students in the region to remind the few golden rules of safety on the way to school.
If we look at the recent campaign, we see that the Region is mainly active in the promotion
of the soft modes pedestrian and bike and the multimodal interactions (and safety in
collaboration with IBSR). The promotion of the public transport itself is mainly left to the
operators: STIB, SNCB, TEC, De Lijn. The Region operates alone or takes the initiative
mainly where there is no institutional stakeholder or when the message concerns multi
modal issues. We must also mention some specialized organism such as the IBSR which is
committed to road safety.
Usually, the Region seeks to involve as much as possible partners for its campaigns.
Here is an abstract of pedestrian promotion on the Region Web Site
(http://www.bruxellesmobilite.irisnet.be/articles/pieton/sensibilisation-et-actions).

Page | 113 D7.1 Brussels-Capital Region context and ATS Assessment, version 1
“For many campaigns and actions, each year, the Region educates motorists to respect
pedestrians and cyclists. Among the topics covered in the past: the respect for traffic lights,
traffic rules at intersections, parking on pedestrian crossings, the dangers of speed,
aggression and courtesy between users ... The opportunity for each campaign to remember
some rules of the highway code. Brussels Mobility also collaborates to the establishment of
mobility plans for companies’ plans and schools. Who has not met one day a rank walk `
walking bus ' guided by some parent, resulting from the mobilization projects in the context
of school travel plans? ”
Recent campaigns:
The campaign "Think of pedestrians, you will see them better" held in October 2011, providing motorists a series of tips to avoid accidents with pedestrians.
End of 2010, the campaign "Always looking before crossing" focused on teenagers and stressed the importance of looking before crossing.
In 2009, the campaign "Running a red light can cost you" addressed the issue of respect for traffic lights. The campaign, in collaboration with the Belgian Road Safety Institute, noted the dangers of non-compliance with a red light and reminded road users how to behave when approaching a traffic light.
The satchel operation, performed in collaboration with IBSR, police, etc. Renewed annually with a school calendar bringing a wealth of advice, it is intended primarily for children by giving them a few tips to get to school safely.
7.4.1.1 Types of actions and tools implemented by the Region
Production of brochures and reports to disseminate: o Reports from the mobility observatory distributed to players in the field. o Brochures "all mailboxes" distributed to all Brussels or via a wide distribution
network (municipalities, associations, operators TC, some shops, etc.): communication about the parking plan, the collective taxis service “Collecto”, etc.
Websites :
Main site internet Brussels Mobility and sites dedicated to a particular campaign such as the website https://toolboxmobilite.irisnet.be/

Page | 114 D7.1 Brussels-Capital Region context and ATS Assessment, version 1
These sites exploit most possibilities offered by the Web 2.0 to convey their
message: Multimedia (also advertising spots and reportages), interactive
modules and various applications.
Broadcast of advertising spots in the media:
Mainly through the regional press and the Regional TV‟s: TéléBruxelles (french) and TvBrussel (nederlands).
Press conferences, seminars:
The schedule of conferences organised or co-organised by the Region is well filled. The first goal is to gather professionals, share experience and explore new ways to improve the quality of life of Brussels inhabitants. The second is to exploit the visibility in the media to disseminate a message to all.
Events :
The main event of the year is the Mobility Week in September where all Medias are put to work. It ends with a car-free Sunday.
7.4.1.2 How does work a standard campaign for the Region
The campaigns are set up by a professional team from the Region staff. Depending on the
size and the ambition of the campaign the team will prepare the specifications to outsource
to the private sector or coordinate itself all the stages with various subcontractors.
7.4.1.3 Experience of campaign in Saint-Luc Hospital area
At Saint-Luc, the campaign to promote institutional values could serve as a guideline. This
made entirely in-house campaign is the result of thinking process and collective work of the
staff. It has led to the definition of a message and its communication in particular through a
poster campaign.
Extract of the website of the Hospital:
"Our staff shows its values to educate staff, patients and visitors to the five corporate values, a poster campaign was carried out with the collaboration of nearly one hundred staff members".
"By team, they have chosen a value and a slogan. These are now the subject of a poster that decorates the walls of Saint-Luc hospital and the information screens in the coming months[...]".
The means available to disseminate the messages are numerous but to reach a high
number of people; there are several ways that work well from previous experience:
Communication in the waiting room or the secretariat via a display of leaflets (preferably both).
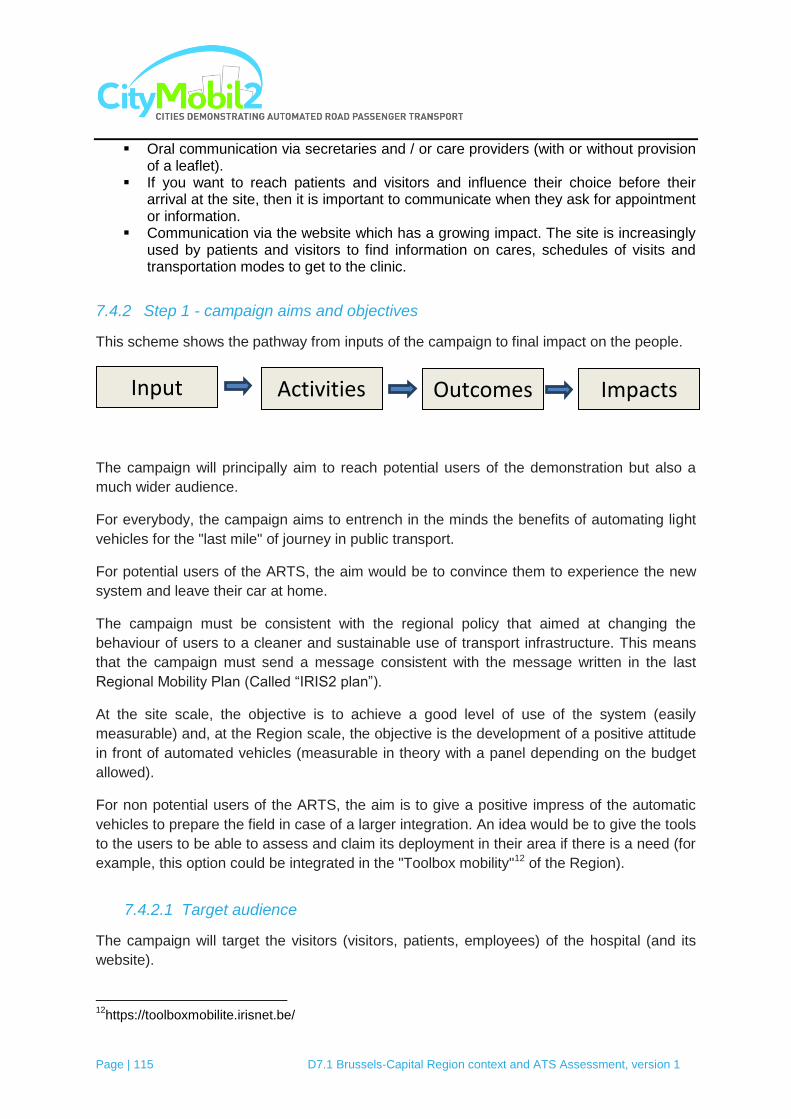
Page | 115 D7.1 Brussels-Capital Region context and ATS Assessment, version 1
Oral communication via secretaries and / or care providers (with or without provision of a leaflet).
If you want to reach patients and visitors and influence their choice before their arrival at the site, then it is important to communicate when they ask for appointment or information.
Communication via the website which has a growing impact. The site is increasingly used by patients and visitors to find information on cares, schedules of visits and transportation modes to get to the clinic.
7.4.2 Step 1 - campaign aims and objectives
This scheme shows the pathway from inputs of the campaign to final impact on the people.
The campaign will principally aim to reach potential users of the demonstration but also a
much wider audience.
For everybody, the campaign aims to entrench in the minds the benefits of automating light
vehicles for the "last mile" of journey in public transport.
For potential users of the ARTS, the aim would be to convince them to experience the new
system and leave their car at home.
The campaign must be consistent with the regional policy that aimed at changing the
behaviour of users to a cleaner and sustainable use of transport infrastructure. This means
that the campaign must send a message consistent with the message written in the last
Regional Mobility Plan (Called “IRIS2 plan”).
At the site scale, the objective is to achieve a good level of use of the system (easily
measurable) and, at the Region scale, the objective is the development of a positive attitude
in front of automated vehicles (measurable in theory with a panel depending on the budget
allowed).
For non potential users of the ARTS, the aim is to give a positive impress of the automatic
vehicles to prepare the field in case of a larger integration. An idea would be to give the tools
to the users to be able to assess and claim its deployment in their area if there is a need (for
example, this option could be integrated in the "Toolbox mobility"12 of the Region).
7.4.2.1 Target audience
The campaign will target the visitors (visitors, patients, employees) of the hospital (and its
website).
12
https://toolboxmobilite.irisnet.be/
Input Activities Outcomes Impacts

Page | 116 D7.1 Brussels-Capital Region context and ATS Assessment, version 1
The population transiting (or wishing to transit) in the two metro stations are also candidates
to be part of the target audience.
To get the total audience, we should also look at the people going (or willing to go) to the
sport Hall and the university Campus along the path of the automated bus.
To have an idea of the number of potential users we want to reach, we may look at the
annual hospital visitors and employees. That gives about 5000 employees, 40 000 patients
and an estimation of 70 000 different visitors a year. It must be noticed that the employees
are a special target because of their high frequency trips to the hospital.
Reaching 90% of employees, 50% of patients and 20% of visitors gives a target of 38 500
potential users. This figure is not very precise but gives the magnitude of the goal. If we
include the visitors of the sport hall and other facilities near the hospital 50 000 potential
users could be set as voluntarist target.
The target population will be extended to people visiting the dedicated pages of the websites
of Brussels Mobility and of the partners agreeing to participate (public transport operators,
AATL, IBGE,...).The attendance of the website of the hospital represents many thousands
visitors per day.
The campaign will be part of the permanent ongoing communication campaign of the Region
about the promotion of alternative modes. If the schedule permits, the campaign could take
place during the Mobility Week to be held in September 2014. In this case, the target
audience will be very important. For a better impact, a demo vehicle could be shown in the
area of the Parc Royal during the crowded “Sunday without car”.
7.4.2.2 Time Frame
End Month 1: 30% of bus capacity
End Month 2: 40% of bus capacity
End month 3: 50% of bus capacity
End month 4 to 6: more than 60% of bus capacity.
7.4.3 Step 2 – Formative research: target population segmentation and baseline evaluation
7.4.3.1 Target segmentation
The target audience will be segmented using the results of the SP performed in this study
and investigations of a broader SP survey conducted as part of the "Update model transport
of the Brussels-Capital "(based on CIM and BELDAM surveys). This information will allow us
Page | 117 D7.1 Brussels-Capital Region context and ATS Assessment, version 1
to segment users into different groups representing the diversity of socio-economic profiles
observed. This information will be used to select a panel of potential users.
They will be asked, specific questions to find out the factors that influence their behaviour.
The Max Sem Method will be used to evaluate the different stages “pre-contemplative,
contemplative, prepared for action, change of habit” of the panel.
► Stage 1: Pre-contemplative stage. Individuals in this stage are quite happy with the way they currently make their trips (i.e. as car drivers) and at the moment have no desire to change to another mode.
► Stage 2: Contemplative stage. Individuals in this stage are not as satisfied with their current travel behaviour (as pre-contemplators). They would like to change to another way of travelling (mode), but are unsure of which mode to switch to, or have not enough confidence to do so at this stage.
► Stage 3: Preparation/action stage. Individuals in this stage have decided which mode they intend to switch to for some or all of their trips, and may have already tried this new mode for some of their trips.
► Stage 4: Maintenance stage. Individuals in this stage have successfully replaced some or all of their trips to the „new‟ mode and this new behaviour (way of travelling) becomes the dominant mode they use for most of their trips (a new habit has been formed).
This information will be useful to decide which stage(s) the specific campaign measures
must target.
7.4.3.2 Baseline evaluation
The method suggested for evaluation is a classic method for evaluating communication
campaigns via a panel (focus group) interviewed before and after the campaign. Depending
on the budget available at the time of the campaign, the method with a control group (better
but more expensive) or with just one group will be used.

Page | 118 D7.1 Brussels-Capital Region context and ATS Assessment, version 1
In practice, the MaxSumo evaluation Tool provided by EPOMM will be used.
7.4.4 Step 3 – Campaigning the campaign: stakeholders and political support
Even if it is not the target audience, the success of the project needs also a great awareness
work toward the other stakeholders.
Like the potential users, the politicians need to be convinced of the system merits (if the
representation principle works well, the main campaign will also work for them) and different
lobbying groups that have an influence on the mode choices.
The technical advisers including the Region Itself, its institutional partners (IBGE, AATL,
Operators,…).
The authority that will give the agreement to automated projects: the Region, the communes,
the police, etc.
The authority that will finance the project: Federal, Region, Communes.
The project is managed by the administration of the Region of Brussels - Capital. The final
decision to implement a demonstration is taken by the Minister Brigitte Groewels. The
Evaluation Design
CityMobil2 Citizens Awareness Evaluation Framework
Case StudyActivities
TravelAwarenessCampaign
Innovative automated road
transportsystem
BControl Group
(not subject to awarenessraising activities)
ATravel Awareness (TA)
Target Group
CPre-Post
Target Group(same people as in A)
Case StudyImpact
% of peoplechangingattitude/
behaviorafter TA
% of people changingattitude/
behaviorwithout TA
=TA effect
Co
ntr
olG
rou
p
EXTE
RN
AL
FAC
TOR
S(e
.g.p
olit
ical
situ
atio
n, t
rans
port
pric
es, o
ther
MM
mea
sure
s, w
heat
erco
ndit
ions
, et
c.)
On
eG
rou
p Establishingcause-and-effect

Page | 119 D7.1 Brussels-Capital Region context and ATS Assessment, version 1
support of the Region and the cabinet for the demonstration will depend on the investment
costs needed.
The viability of the project also depends on the cooperation of municipal authorities to
ensure their support and agreement for local improvements to be made in territories under
their jurisdiction
Saint-Luc hospital and the university are also key partners since the service is directly and
principally designed for their employees, students, patients and visitors. A part of the route is
located directly on their property and their participation is required for various technical
aspects such as storage and night charging.
A third major player is the STIB, the Brussels public transport operator that will see his
network improved by the project.
For the awareness campaign, it is important to spread the messages to stakeholders as
many as possible: IBGE, AATL, IBSR, TEC, SNCB, De Lijn, etc.
Concerning the funds for the awareness campaign, there are many possibilities but also
many obstacles. The funds could be raised by the Region, the STIB, the Federal, NGO‟s
(foundation Roi Baudouin) but for now, there is no guarantee.
It must be noticed that in may 2014 will be held the Federal and Regional legislative
elections. it will be followed by the set up of a new Federal and Regional Government.
7.4.5 Step 4 - social Marketing mix
Extract of the methodology: "The Social Marketing Mix is drawn from the wider principles of marketing, including the four P’s (Product, Price, Promotion and Place), but adding other two criteria that are relevant for the TA campaigns: People and Process. Thus, a TA campaign team should decide on the best usage of the 6 P’s": ► Product or Social Idea: This is the offer (your main idea or social good) made to the
target audience. This will be, in terms of benefits, associated with changed behaviour, such as cleaner air, fewer deaths on the road, a better life for children in the community, less polluted city centre, etc.
► Price: In the context of Social Marketing, it is about the personal costs to an individual or household in adopting a changed behaviour such as longer journeys to work, more physical exercise, less convenience, higher car parking charges. These are, of course, perceived benefits too, for example, in improving health but for most people such factors will be seen as the price to pay for change. However, people are very receptive to ideas to improve personal health in relation to everyday transport.
► Place: The campaign should offer the optimum places where people can gain more information, or take part personally in the campaign such as exhibitions and workshops in open public spaces and community facilities and where interaction between the campaign team and the population can take place such as on public transport, in car parks, etc.

Page | 120 D7.1 Brussels-Capital Region context and ATS Assessment, version 1
► Promotion: Marketing Social Communications is vital to any campaign and the core to this is the message-what, from whom and how. In social marketing, communication elements increasingly include viral marketing (through blogs, web pages, Facebook and Twitter, word of mouth marketing and public relations) because this is how people are communicating.
► People: The delivery of a campaign often involves strong interpersonal communication between campaign organisers and their customers. It is not a matter of personal selling. At its best it is a continuous dialogue which can be very useful in campaign development. This is particularly the case at a local level where personal involvement of campaign staff in local meetings and events is a way to engage people who avoid other forms of communication.
► Processes: Social Marketing also involves processes which need to give people confidence that they can approach the campaign team to discuss matters, offer opinions and be involved. This includes responses to telephone calls, e-mails and handling feedback in a systematic and personal way.
7.4.5.1 Product or Social Idea
The objective of the awareness campaign is to persuade potential users (but also
stakeholder) that automated vehicles offer them much comfort and a good alternative to car.
All the advantages must be promoted:
Comfort: travel time, waiting time, reliable, adapted to mobility impaired person, reliable,
comfortable, silent, no congestion, no parking trouble.
Impact on environment: less noise, less pollutant emissions, less congestion, less accident,
less cars (more place for other activities).
For users of Saint-Luc hospital: the objective is to show that this particular solution provides
a substantial improvement in comfort to reach the clinic in public transport.
For other users: the objective is to show that this mode is relevant to connect the last "mile"
of a journey and that they are entitled to ask for the implementation of such type of transport
for other routes that affect them more directly.
For institutional stakeholders: the objective is demonstrated that the system "works". This
means that the socio-economic balance is positive. It brings more value to the user (the
request is real) and the environment (modal shift from car to TC) at a reasonable cost and
deserves to be part of the set of tools available for the Region to improve mobility.
7.4.5.2 Price
In term of generalized cost, the time gain must be taken into account (also the gains for the
environment but they are usually far less high than the time saved, see the socio-economic
evaluation) and compare to the price of the service.
The survey has shown that 24% of people were ready to pay 2€ per journey to reach the
clinic, and 44% with a reduced waiting time of 5 minutes. The time saved by the users is not
easy to evaluate especially for those who came from the mode “car” and for mobility

Page | 121 D7.1 Brussels-Capital Region context and ATS Assessment, version 1
impaired people obliged to walk via Alma Metro station. The mean perceived time gain
evaluated for public transport users is around 15 minutes. It takes into account the difficulty
to walk for a part of the patients and visitors. With a common mean value of time of 10€/h
(used in several studies in Brussels), the potential mean gain is equal to 2.5€.
The conclusion is that under a certain limit, it is possible to set up a special pricing for the
service without disturbing too much the level of the demand.
With reference to the demonstration, we have seen that the demand during the peak hour
may require more vehicles than provided. If necessary, the pricing could be use to adjust the
demand in the peak hour.
But in practice, it will be far easier to give access freely to the service or with a valid STIB
ticket.
In term of acceptance and the survey confirms it, the inclusion of the access license in the
STIB ticket seems to be the best accepted solution.
The campaign should communicate on the price that will be either low or free (included in
the STIB ticket) and the comparison with the price of car use and parking, gain in time, less
physical effort, etc.
7.4.5.3 Place, Promotion and People
The best places to communicate with the potential users are:
The hospital itself (lobby, staff rooms, lifts, website,…) everyday
The car parks
The metro stations Alma and Kraainem (and website of STIB)
In the most crowded places during the “Sunday without cars”
The promotion of the system demonstration should also use the viral marketing through
blogs, web pages, Facebook and Twitter. The members of the panel could be asked to place
a comment on their Facebook or twitter account. Blogger with influence could be proposed
to place a short comment on the project.
It important that the team in charge of the campaign is in direct contact with the potential
user in the different places mentioned above and especially during the events like the week
of mobility.
The experience of the previous campaign with the employee contribution on the hospital
values could be used as a good basis.
7.4.5.4 Processes
The users will have the possibility to give their feedback through a dedicated web site and
phone number. The link will be mentioned on each campaign media.
Page | 122 D7.1 Brussels-Capital Region context and ATS Assessment, version 1
But the best way to collect feedback is to ask directly the people during the campaign. It will
be one of the responsibilities of the team in charge of the dissemination. To help them, they
will have a small basic questionnaire to help structuring the exchange with potential users.
7.4.6 Step 5 - SWOT analysis
The Swot analysis is used here to review the global campaign strategy.
Strengths:
- Strong interest of the stakeholders. - The system meet a real need, the demand forecast is quite high. - The potential users are well identified and quite easy to reach. - There is an agreement with Saint-Luc hospital and the University (Saint–Luc hospital
has agreed to provide a storage room and electricity to charge the batteries). - The project is consistent with the Region plan and could be part of other campaign. - This is not the only project of this type in Brussels (see the project of the EC museum
connection).
Weaknesses
- Difficulties to find funds. - There is no direct financial participation offer from the Saint-Luc hospital. - The STIB is not yet involved in the process. - The number of partners aware of the project is still limited. - The law and fiscal context is not clear. - The cost of the infrastructure and facilities needed for the system is a major
constraint.
Opportunities
- The involvement of more Region partners could help to raise the necessary funds.
Threats
- The shortage of funds. - Difficulties to reach the futures patients or visitors if the campaign is too long before
the demonstration. - The level of involvement of the STIB and other potential partner if they do not agree
with the project.

Page | 123 D7.1 Brussels-Capital Region context and ATS Assessment, version 1
8. Ex-ante evaluation
The outcome of this step is the evaluation of the measurable indicators, and their cross-
comparison with the correspondent reference case and threshold for success.
Ev
alu
ati
on
ca
teg
ory
Impacts Indicators Success threshold Success? Comments
Accep
tance
User acceptance
Integration with other systems
≥ 20% of the people coming to the site interested by the
system. ≥ 50% of mobility impaired person
coming to the site interested in the
system
Yes
Results of the surveys indicated that 76% of the people coming to the site were interested in the service. Furthermore,
surveys showed that 20% of the people experienced problems to walk more than 1km and that more than 80% of them would use this service to come to the hospital.
Willingness to pay
User willingness
Half the people interested in the
service agree to pay for a round-trip
No but encouraging
Results of the surveys showed that 22% of people
interested by the service are willing to pay for an extra fare (2€ for a round-trip) to travel with the automated bus if the travel times and waiting times are the same as the conventional bus. With waiting times lower for the automated bus (-5 minutes), 42% of people (coming to the
site by car) are willing to pay more (2€ for a round-trip).
Qu
alit
y o
f se
rvic
e
Comfort Perceived comfort
Improved perceived comfort (compared to a conventional
bus)
Yes
From the econometric models, we observed that a time saving of 83 seconds is assigned to each trip with the automated bus.

Page | 124 D7.1 Brussels-Capital Region context and ATS Assessment, version 1
Tra
nsp
ort
pa
tte
rns
Modal change System modal share
Shift from cars to automated bus
system ≥5% of the people coming to
the site by car
Yes
Models evaluated a modal shift from personal vehicles to public transport modes of 55 passengers during the time period 12 am-1 pm (peak
hour on the Saint-Luc Clinics area), which corresponds to 8% of the people coming by car. The average fuel
consumption in the Brussels Capital Region is around 7.5 l/100km** and the average distance from/to the Saint-Luc Clinics area by car is 11.8km**. Using the conversion tables (1 litre fuel = 10 kWh***), we can estimate the total fuel consumption to 487 kWh (12h am-13h pm) and the fuel consumption per passenger.km to 0.75 kWh/passenger.km.
System use
Total passenger.km travelled
≥ 520 passengers.km between 7-9 am
Yes
The passenger.kilometers are estimated to 1850 (round-trip of 2.1 km) between 7 am and 9 am in the morning. The daily
passenger.kilometers are estimated to 19181 pass.km.
Total number of trips ≥ 230 trips for 7-9
am Yes
For the period 7-9 am, the demand is estimated to 882 trips from a trip with stops at
the 2 main stations (round-trip of 2.1km). The daily demand is estimated to 9134 passengers.
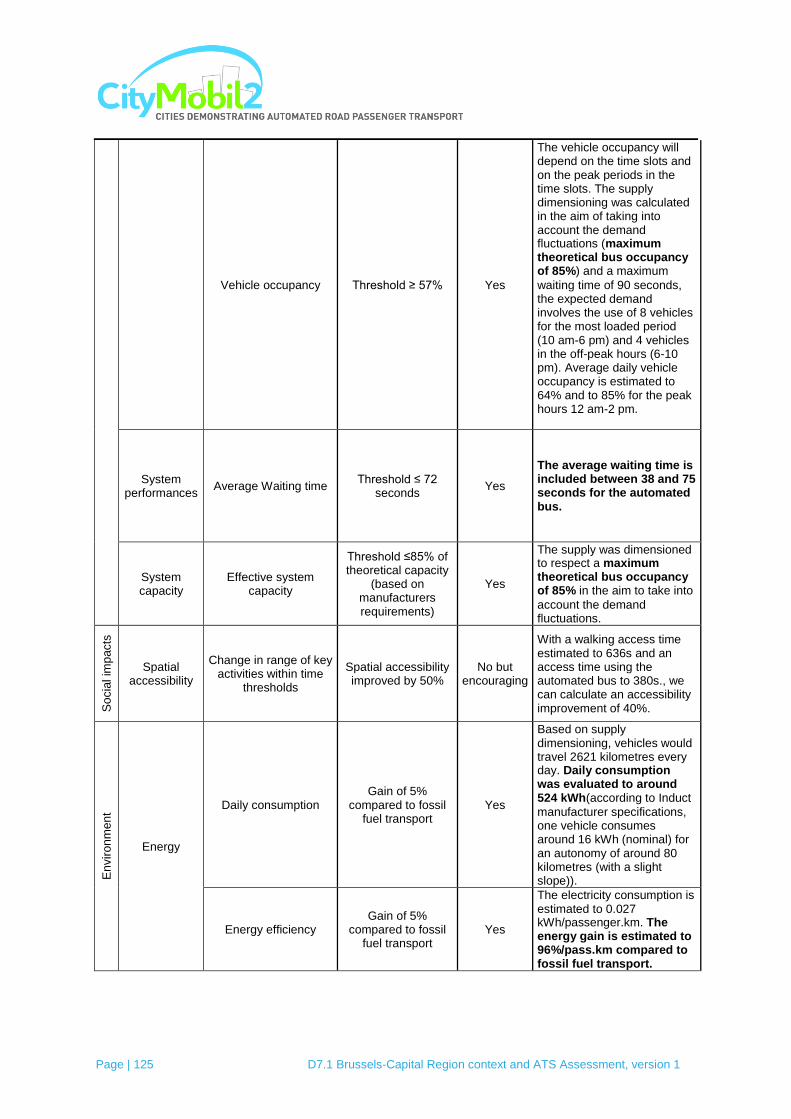
Page | 125 D7.1 Brussels-Capital Region context and ATS Assessment, version 1
Vehicle occupancy Threshold ≥ 57% Yes
The vehicle occupancy will depend on the time slots and on the peak periods in the time slots. The supply dimensioning was calculated in the aim of taking into account the demand fluctuations (maximum theoretical bus occupancy of 85%) and a maximum
waiting time of 90 seconds, the expected demand involves the use of 8 vehicles for the most loaded period (10 am-6 pm) and 4 vehicles in the off-peak hours (6-10 pm). Average daily vehicle occupancy is estimated to 64% and to 85% for the peak hours 12 am-2 pm.
System performances
Average Waiting time Threshold ≤ 72
seconds Yes
The average waiting time is included between 38 and 75 seconds for the automated bus.
System capacity
Effective system capacity
Threshold ≤85% of theoretical capacity
(based on manufacturers requirements)
Yes
The supply was dimensioned to respect a maximum theoretical bus occupancy of 85% in the aim to take into
account the demand fluctuations.
So
cia
l im
pacts
Spatial accessibility
Change in range of key activities within time
thresholds
Spatial accessibility improved by 50%
No but encouraging
With a walking access time estimated to 636s and an access time using the automated bus to 380s., we can calculate an accessibility improvement of 40%.
En
vir
on
men
t
Energy
Daily consumption Gain of 5%
compared to fossil fuel transport
Yes
Based on supply dimensioning, vehicles would travel 2621 kilometres every day. Daily consumption was evaluated to around 524 kWh(according to Induct
manufacturer specifications, one vehicle consumes around 16 kWh (nominal) for an autonomy of around 80 kilometres (with a slight slope)).
Energy efficiency Gain of 5%
compared to fossil fuel transport
Yes
The electricity consumption is estimated to 0.027 kWh/passenger.km. The energy gain is estimated to 96%/pass.km compared to fossil fuel transport.

Page | 126 D7.1 Brussels-Capital Region context and ATS Assessment, version 1
Land take Change in road space
availability to other users
Gain of road space No
Shift from cars to public transports implied a decrease of 47 PCU (between 12 am and 1 pm) and allowed to estimate gains of space of around 587m². Inversely, losses of space could be noticed by (i) suppressing parking lots (725m²) or convertible spaces (418m²) to widen the roadway and to remove possible conflict point between cars and automated bus and by (ii) depriving road space with segregated lanes (1243m²). Synthesis results showed losses of space of around 1800m².
Fin
ancia
l im
pacts
Start up costs
Track construction and civil works
/ /
Preliminary investigations evaluated the costs between 250 000 and 750 000 euros. This point will be detailed
in deliverable D7.2
Vehicle acquisition/constructio
n / /
Data depending on manufacturers
Control systems and apparatus
/ / Data depending on
manufacturers
Operating costs
Personnel / /
Working hours have been evaluated between 200 000
and 400 000 euros. This point will be detailed in
deliverable D7.2
Vehicle maintenance / /
We estimate that 2 hours are necessary for the maintenance of vehicles. The maintenance costs are evaluated between 5 000 and 10 000 euros. This point will be detailed in deliverable D7.2
Track and civil infrastructures maintenance
/ /
Preliminary investigations evaluated the costs between
10 000 and 50 000 euros. This point will be detailed
in deliverable D7.2
Control system maintenance
/ /
Preliminary investigations evaluated the costs between 5 000 and 20 000 euros. This
point will be detailed in deliverable D7.2
Revenues Operating revenues / /
Preliminary investigations evaluated the costs between 300 000 and 750 000 euros. This point will be detailed
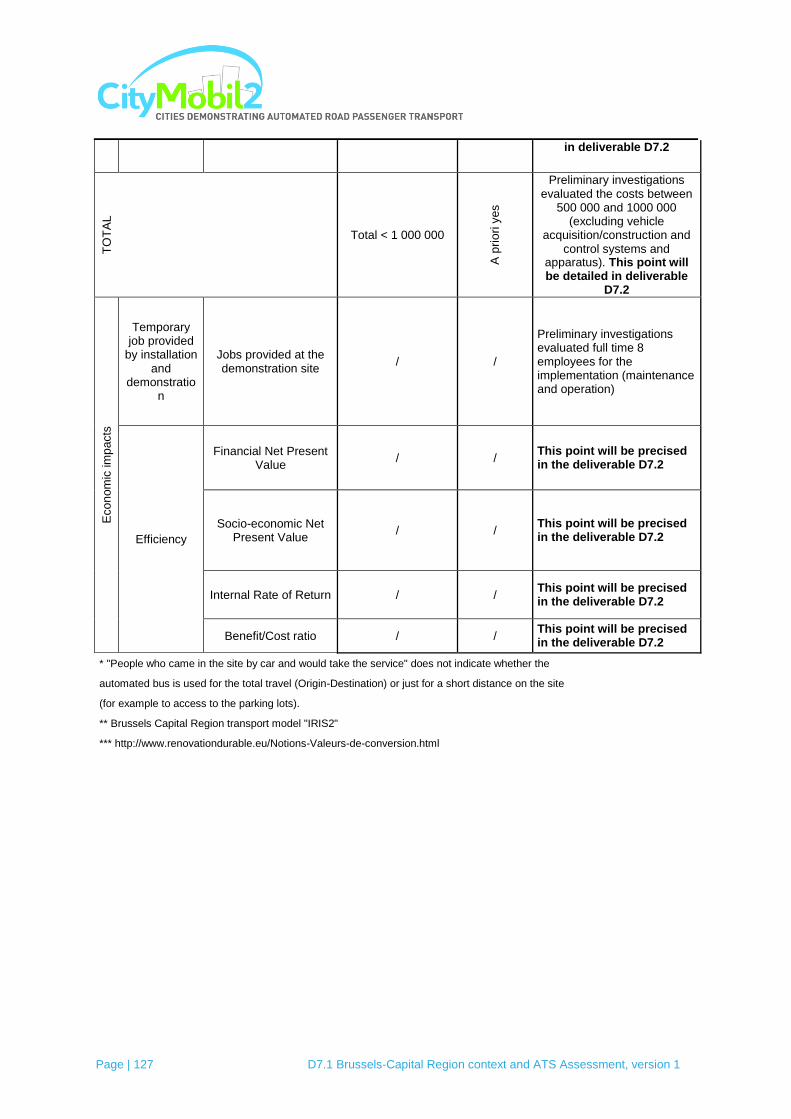
Page | 127 D7.1 Brussels-Capital Region context and ATS Assessment, version 1
in deliverable D7.2
TO
TA
L
Total < 1 000 000
A p
rio
ri y
es
Preliminary investigations evaluated the costs between
500 000 and 1000 000 (excluding vehicle
acquisition/construction and control systems and
apparatus). This point will be detailed in deliverable
D7.2
Eco
nom
ic im
pacts
Temporary job provided
by installation and
demonstration
Jobs provided at the demonstration site
/ /
Preliminary investigations evaluated full time 8 employees for the implementation (maintenance and operation)
Efficiency
Financial Net Present Value
/ / This point will be precised in the deliverable D7.2
Socio-economic Net Present Value
/ / This point will be precised in the deliverable D7.2
Internal Rate of Return / / This point will be precised in the deliverable D7.2
Benefit/Cost ratio / / This point will be precised in the deliverable D7.2
* "People who came in the site by car and would take the service" does not indicate whether the
automated bus is used for the total travel (Origin-Destination) or just for a short distance on the site
(for example to access to the parking lots).
** Brussels Capital Region transport model "IRIS2"
*** http://www.renovationdurable.eu/Notions-Valeurs-de-conversion.html
Page | 128 D7.1 Brussels-Capital Region context and ATS Assessment, version 1
9. Conclusion
Models and surveys confirmed the advantages of an automated transport system in Saint-
Luc Clinics area in terms of accessibility. The time necessary to access the main entrance of
the hospital from the nearest metro station is nearly divided by 2. This explains the high
interest of the people interviewed on the site (more than 76% are interested). Surveys also
confirmed the high proportion of people experiencing problems to walk and their increased
interest in the system (more than 80% are interested). In consequence, most indicators in
terms of use (vehicle occupancy, number of trips, etc.) are clearly above the threshold
defined previously.

![Automated Container Transport System Between Inland …Imperial)/[6] 02 METRANS Final Report.pdf · Automated Container Transport System between Inland ... The scarcity of land at](https://static.fdocuments.us/doc/165x107/5afdd52d7f8b9a864d8e17d8/automated-container-transport-system-between-inland-imperial6-02-metrans.jpg)