CITY OF TRAVERSE CITYJun 30, 2016 · City of Traverse City . Act 345 Retirement System . Traverse...
39
CITY OF TRAVERSE CITY ACT 345 RETIREMENT SYSTEM FORTY-SIXTH ANNUAL ACTUARIAL VALUATION JUNE 30, 2016
Transcript of CITY OF TRAVERSE CITYJun 30, 2016 · City of Traverse City . Act 345 Retirement System . Traverse...

CITY OF T RAVERSE CITY ACT 345 RETIREMENT SYSTEM F O R T Y - S I X T H A N N U A L A C T U A R I A L V A L U A T I O N J U N E 3 0 , 2 0 1 6

City of Traverse City Act 345 Retirement System
CONTENTS SECTION PAGE
Introduction
A Valuation Results 1-2 Computed Contributions for the Fiscal Year 3 Present Value of Future Benefits and Accrued Liability 4 Computed and Actual City Contributions - Comparative Statement 5 Development of Funding Value of Assets 6 Valuation Assets and Unfunded Actuarial Accrued Liability 7 Derivation of Actuarial Gain (Loss) 8-10 Comments and Certification
B Valuation Data 1-2 Summary of Benefit Provisions 3-5 Retired Life Data 6-8 Active Member Data 9-10 Asset Information
C Valuation Methods and Assumptions 1 Actuarial Cost Methods Used for the Valuation 2-5 Actuarial Assumptions in the Valuation Process 6-7 Definitions of Technical Terms
D Financial Reporting 1-2 Supplemental Information
Appendix 1 Amortization Payoff Schedule

February 24, 2017 Retirement Board City of Traverse City Act 345 Retirement System Traverse City, Michigan Dear Board Members: The results of the June 30, 2016 annual actuarial valuation of the City of Traverse City Act 345 Retirement System are presented in this report. The purpose of the valuation was to measure the System's funding progress and to determine the employer contribution for the 2017-2018 fiscal year. This report should not be relied upon for any other purpose. This report may be distributed to parties other than the System only in its entirety and only with the permission of the Board. GRS is not responsible for unauthorized use of this report. The valuation was based upon information, furnished by the City, concerning Retirement System benefits, financial transactions, and individual members, terminated members, retirees and beneficiaries. Data was checked for internal and year-to-year consistency, but was not audited, by us. As a result, we are unable to assume responsibility for the accuracy or completeness of the data provided. The computed contribution rate shown on page A-2 may be considered as a minimum contribution rate that complies with the Board’s funding policy. Users of this report should be aware that contributions made at that rate do not guarantee benefit security. Given the importance of benefit security to any retirement system, we suggest that contributions to the System in excess of those presented in this report be considered. The contribution rate in this report is determined using the actuarial assumptions and methods disclosed in Section C of this report. The assumptions are established by the Board after consulting with the actuary. This report does not include a more robust assessment of the risks of future experience not meeting the actuarial assumptions. Additional assessment of risks was outside the scope of this assignment. We encourage a review and assessment of investment and other significant risks that may have a material effect on the plan’s financial condition. Future actuarial measurements may differ significantly from those presented in this report due to such factors as experience differing from that anticipated by actuarial assumptions, changes in plan provisions, actuarial assumptions/methods or applicable law. Due to the limited scope of this assignment, we did not perform an analysis of the potential range of future measurements.

930
Retirement Board February 24, 2017 Page 2 To the best of our knowledge, this report is complete and accurate and the valuation was conducted in accordance with standards of practice prescribed by the Actuarial Standards Board and in compliance with the applicable state statutes. Mark Buis and James D. Anderson are independent of the plan sponsor and are Members of the American Academy of Actuaries (MAAA) who meet the Qualification Standards of the American Academy of Actuaries to render the actuarial opinions contained herein. It is our opinion that the actuarial assumptions used for the valuation produce results which are reasonable. Gabriel, Roeder, Smith & Company will be pleased to review this valuation and report with the Retirement Board and to answer any questions pertaining to the valuation. Respectfully submitted, Mark Buis, FSA, EA, FCA, MAAA James D. Anderson, FSA, EA, MAAA MB/JDA:dj

SECTION A VA L U AT I O N R E S U LT S
City of Traverse City Act 345 Retirement System A-1
FUNDING OBJECTIVE The funding objective of the Retirement System is to establish and receive contributions which,
when combined with investment income, will accumulate over each member’s working lifetime
an amount expected to be sufficient to finance benefits to be paid during retirement.
CONTRIBUTION RATES The Retirement System is supported by member contributions, City contributions, and investment
income from Retirement System assets.
Contributions which satisfy the funding objective are determined by the annual actuarial valuation and
are sufficient to:
(1) Cover the actuarial present value of benefits allocated to the current year by the actuarial
cost method described in Section C (the normal cost); and
(2) Finance over a period of future years the actuarial present value of benefits not covered by
valuation assets and anticipated future normal costs (unfunded actuarial accrued liability).
Computed contribution rates for the fiscal year beginning July 1, 2017 are shown on page A-2.

City of Traverse City Act 345 Retirement System A-2
COMPUTED CONTRIBUTIONS FOR THE FISCAL YEAR
Contributions Expressed asPercents of Annual Pay
Contributions for For Fiscal Year Beginning
July 1, 2017 July 1, 2016Normal Cost Age and service benefits 12.89 % 12.83 % Death and disability benefits 1.65 1.64 Termination benefits 0.24 0.27 Deferred age and service benefits 1.61 1.61 Total 16.39 16.35
Employee Contributions (2.07) (2.45)
Employer Normal Cost 14.32 13.90
Amortization Payment 35.59 35.05
Total Computed City Contributions 49.91 % 48.95 %
Dollars Based on Projected Payroll Policemen $ 989,955 $ 982,812 Firemen 851,860 821,118 Total $1,841,815 $1,803,930
Unfunded actuarial accrued liabilities were amortized as a level percent of active member payroll over
a closed period of 17 years.
Comparative contribution amounts for prior fiscal years are shown on page A-4.

City of Traverse City Act 345 Retirement System A-3
PRESENT VALUE OF FUTURE BENEFITS AND ACCRUED LIABILITY
Determination of Unfunded Accrued Liability
2016 2015
A. Accrued Liability
1. For retirees and beneficiaries $ 26,747,986 $ 26,474,592
2. For vested terminated members 1,340,900 409,665
3. For present active members
a. Value of expected future benefit payments 21,157,124 21,320,134
b. Value of future normal costs 5,944,369 6,064,409
c. Active member accrued liability: (a) - (b) 15,212,755 15,255,725
4. Total accrued liability 43,301,641 42,139,982
B. Present Assets (Funding Value) 27,513,168 25,942,576
C. Unfunded Accrued Liability: (A.4) - (B) 15,788,473 16,197,406
D. Funding Ratio: (B) / (A.4) 63.5% 61.6%
E. Funding Ratio: Market Value Basis 60.7% 62.3%
June 30,

City of Traverse City Act 345 Retirement System A-4
COMPUTED CITY CONTRIBUTIONS COMPARATIVE STATEMENT
Fiscal % ofYear Beginning Valuation Payroll Dollar
July 1 Payroll Contributions Contributions
1993 $2,016,886 23.99% $ 483,851 1994 2,131,177 22.99 489,957 1995 # 2,131,057 22.04 469,685 1996 2,168,366 18.52 401,581 1997 2,212,378 16.55 366,149
1998 @ 2,259,312 8.57 193,624 1999 # 2,337,389 9.74 227,662
2000 # 2,470,379 11.94 294,964 2001 2,467,235 10.67 276,417 2002 2,393,258 13.63 342,511 2003 @ 2,402,524 15.80 396,681
2004 2,671,393 22.04 615,269 2005 @# 3,139,509 26.76 877,938 2006 3,509,371 26.93 987,602 2007 # 3,234,852 26.55 897,502
2008 3,173,479 27.89 924,911 2009 # 3,348,677 32.99 1,154,441 2010 # 3,348,677 32.99 1,206,390 2011 @ 3,308,083 37.25 1,345,660 2012 # 3,131,962 45.23 1,532,181
2013 # 3,114,425 48.67 1,639,480 2014 3,018,448 51.56 1,683,306 2015 3,262,658 49.89 1,760,565 2016 3,407,221 48.95 1,803,930 2017 3,411,863 49.91 1,841,815
@ After changes in actuarial assumptions or methods. # After changes in benefit provisions.

City of Traverse City Act 345 Retirement System A-5
DEVELOPMENT OF FUNDING VALUE OF ASSETS
2015 2016 2017 2018 2019
A. Funding Value Beginning of Year $24,538,031 $25,942,576
B. Market Value End of Year 26,242,812 26,283,437
C. Market Value Beginning of Year 26,286,837 26,242,812
D. Non-Investment Net Cash Flow (507,906) (458,293)
E. Investment IncomeE1. Market Total: B - C - D 463,881 498,918E2. Amount for Immediate Recognition: (7.5%) 1,821,306 1,928,507E3. Amount for Phased-in Recognition: E1 - E2 (1,357,425) (1,429,589)
F. Phased-In Recognition of Investment IncomeF1. Current Year: 0.25 x E3 (339,356) (357,397)F2. First Prior Year 521,174 (339,356) $(357,397)F3. Second Prior Year 275,957 521,174 (339,356) $(357,397)F4. Third Prior Year (366,630) 275,957 521,174 (339,357) $(357,398)F5. Total Recognized Investment Gain 91,145 100,378 (175,579) (696,754) (357,398)
G. Funding Value End of Year: A + D + E2 + F5 25,942,576 27,513,168
H. Difference Between Market & Funding Value 300,236 (1,229,731)I. Funding Value Rate of Return 7.88% 7.89%J. Market Value Rate of Return 1.78% 1.92%
Year Ended June 30
The Funding Value of Assets recognizes assumed investment income (line E2) fully each year. Differences between actual and assumed investment income (line E3) are phased-in over a closed 4-year period. During periods when investment performance exceeds the assumed rate, Funding Value of Assets will tend to be less than Market Value. During periods when investment performance is less than the assumed rate, Funding Value of Assets will tend to be greater than Market Value. The Funding Value of Assets is unbiased with respect to Market Value. At any time it may be either greater or less than Market Value. If actual and assumed rates of investment income are exactly equal for 3 consecutive years, the Funding Value will become equal to Market Value.

City of Traverse City Act 345 Retirement System A-6
VALUATION ASSETS AND UNFUNDED ACTUARIAL ACCRUED LIABILITY In financing actuarial accrued liabilities, valuation assets of $27,513,168 were distributed as follows:
Member RetiredActuarial LifeAccrued Actuarial Contingency
Reserves for Liability Liability Reserve Totals
Employees’ Contributions $291,595 $ $ $ 291,595
Employer Contributions 421,264 421,264
Retired Benefit Payments 52,323 26,747,986 26,800,309
Undistributed Investment Income
Totals $765,182 $26,747,986 $ none $27,513,168
Present Valuation Assets Applied to
Assets were applied against actuarial accrued liabilities in determining unfunded actuarial accrued
liabilities as follows:
Retired Lives Active Members Total
Computed Actuarial Accrued Liabilities $26,747,986 $16,553,655 $43,301,641
Applied Assets 26,747,986 765,182 27,513,168
Unfunded Actuarial Accrued Liabilities $ none $15,788,473 $15,788,473
Funded Ratio 100.0% 4.62% 63.5%

City of Traverse City Act 345 Retirement System A-7
DERIVATION OF ACTUARIAL GAIN (LOSS) YEAR ENDED JUNE 30, 2016
Actual experience will usually not coincide exactly with assumed experience. It is expected that gains
and losses will cancel each other over a period of years, but sizable year-to-year fluctuations are
common. Detail on the derivation of the experience gain (loss) is shown below, along with a year-by-
year comparative schedule.
(1) UAAL* at start of year $16,197,406
(2) Employer normal cost from last valuation 557,081
(3) Actual employer contributions 1,869,075
(4) Inerest Accrual: [(1) x .075 + ((2) - (3)) x .0375] 1,165,606
(5) Expected UAAL before changes: (1) + (2) - (3) + (4) 16,051,018
(6) Change from plan provisions 0
(7) Change from revised actuarial assumptions 0
(8) Expected UAAL after changes: (5) + (6) + (7) 16,051,018
(9) Actual UAAL at end of year 15,788,473
(10) Gain (loss): (8) - (9) 262,545
(11) Gain (loss) as percent of actuarial accruedliabilities at start of year ($42,139,982) 0.6%
* Unfunded actuarial accrued liability.
Year End
2007 5.8 %2008 (2.3)2009 (15.8)2010 (6.9)2011 (6.8)2012 (4.6)2013 (2.2)2014 (0.1)2015 1.32016 0.6
as % of Beginning Accrued LiabilitiesActuarial Gain (Loss)

City of Traverse City Act 345 Retirement System A-8
COMMENTS AND CERTIFICATION Comment 1: Net Retirement System experience was more favorable than assumed for the year ended
June 30, 2016. Current year asset losses due to unfavorable investment experience were offset by
unrecognized gains from 2013 and 2014, which when added to demographic gains, resulted in a gain
of $262,545. As a result, contribution requirements increased slightly from $1,803,930 to $1,841,815.
Under the level percent of pay funding method, the contribution was expected to increase to
approximately $1,880,000.
Public Act 728: On December 30, 2002 Michigan Public Act 728 became effective. This Act sets new
standards for all Michigan State and Local government retirement systems. In particular, the Act
requires that supplemental actuarial analysis be performed by the System’s actuary (including an
analysis of the long-term costs associated with any proposed pension benefit change) and provided to
the Retirement Board and the decision-making body that will approve the proposed pension benefit
change. This analysis is required at least 7 days before a proposed pension benefit change is adopted.
There are additional requirements related to the confirmation of receipt by the System of the required
employer contributions.
Recommendation 1: The balance in the Reserve for Retired Benefit Payments was more than the
accrued liabilities for current retirants and beneficiaries by $52,323. We recommend a transfer of
$52,323 from the Reserve for Retired Benefit Payments to the Reserve for Employer Contributions.
For purposes of the valuation, the transfer was assumed to have been made as of June 30, 2016.
Certification: To the best of our knowledge and belief, the valuation is complete and accurate and was
made in accordance with generally recognized actuarial methods. The actuarial assumptions
summarized in Section D are individually, and in the aggregate, a reasonable representation of the
anticipated future experience of the System.
City of Traverse City Act 345 Retirement System A-9
COMMENTS AND CERTIFICATION (CONTINUED) ACTUARIAL DISCLOSURE: The computed contribution rate shown on A-2 may be considered as
a minimum contribution rate that complies with the Board’s funding objective. Users of this report
should be aware that contributions made at that rate do not guarantee benefit security. Given the
importance of benefit security to any retirement system, we suggest that contributions to the System in
excess of those presented in this report be considered.
The contribution rate in this report is determined using the actuarial assumptions and methods disclosed
in Section C of this report. This report includes certain risk metrics on page D-1, but does not include a
more robust assessment of the risks of future experience not meeting the actuarial assumptions.
Additional assessment of risks was outside the scope of this assignment. We encourage a review and
assessment of investment and other significant risks that may have a material effect on the plan’s
financial condition.
City of Traverse City Act 345 Retirement System A-10
COMMENTS AND CERTIFICATION (CONCLUDED) OTHER OBSERVATIONS: General Implications of Contribution Allocation Procedure or Funding Policy on Future Expected Plan Contributions and Funded Status
Given the plan’s contribution allocation procedure, if all actuarial assumptions are met (including the
assumption of the plan earning 7.5% on the actuarial value of assets), it is expected that:
1) employer normal cost amounts as a percentage of payroll will remain approximately level year-to-year;
2) the unfunded actuarial accrued liability will be fully amortized after 17 years; and
3) the funded status of the plan will increase gradually towards a 100% funded ratio.
Limitations of Funded Status Measurements
Unless otherwise indicated, a funded status measurement presented in this report is based upon the
actuarial accrued liability and the actuarial value of assets. Unless otherwise indicated, with regards to
any funded status measurements presented in this report:
1) The measurement is inappropriate for assessing the sufficiency of plan assets to cover the estimated cost of settling the plan’s benefit obligations.
2) The measurement is inappropriate for assessing the need for or the amount of future employer contributions.
3) The measurement would produce a different result if the market value of assets were used instead of the actuarial value of assets, unless the market value of assets is used in the measurement.
4) The funding level of the plan on a Market Value Basis is shown on page A-3.

SECTION B VA L U AT I O N D ATA
City of Traverse City Act 345 Retirement System B-1
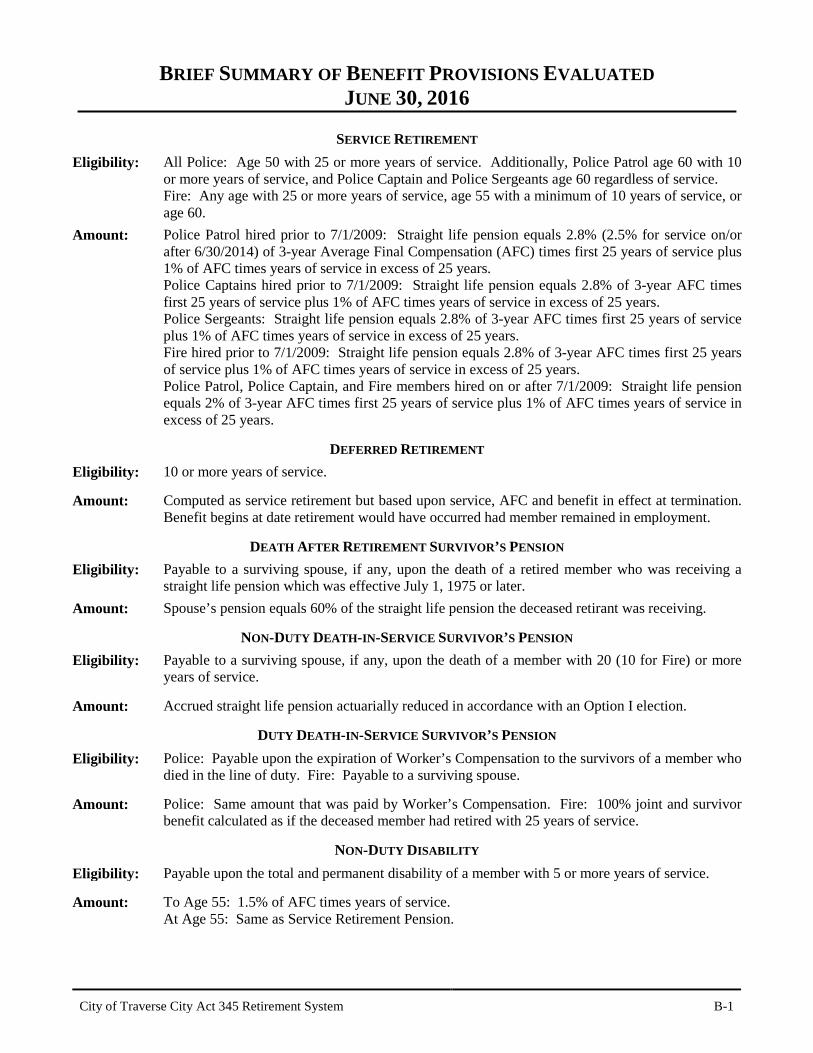
BRIEF SUMMARY OF BENEFIT PROVISIONS EVALUATED JUNE 30, 2016
SERVICE RETIREMENT
Eligibility: All Police: Age 50 with 25 or more years of service. Additionally, Police Patrol age 60 with 10 or more years of service, and Police Captain and Police Sergeants age 60 regardless of service. Fire: Any age with 25 or more years of service, age 55 with a minimum of 10 years of service, or age 60.
Amount: Police Patrol hired prior to 7/1/2009: Straight life pension equals 2.8% (2.5% for service on/or after 6/30/2014) of 3-year Average Final Compensation (AFC) times first 25 years of service plus 1% of AFC times years of service in excess of 25 years. Police Captains hired prior to 7/1/2009: Straight life pension equals 2.8% of 3-year AFC times first 25 years of service plus 1% of AFC times years of service in excess of 25 years. Police Sergeants: Straight life pension equals 2.8% of 3-year AFC times first 25 years of service plus 1% of AFC times years of service in excess of 25 years. Fire hired prior to 7/1/2009: Straight life pension equals 2.8% of 3-year AFC times first 25 years of service plus 1% of AFC times years of service in excess of 25 years. Police Patrol, Police Captain, and Fire members hired on or after 7/1/2009: Straight life pension equals 2% of 3-year AFC times first 25 years of service plus 1% of AFC times years of service in excess of 25 years.
DEFERRED RETIREMENT
Eligibility: 10 or more years of service. Amount: Computed as service retirement but based upon service, AFC and benefit in effect at termination.
Benefit begins at date retirement would have occurred had member remained in employment.
DEATH AFTER RETIREMENT SURVIVOR’S PENSION Eligibility: Payable to a surviving spouse, if any, upon the death of a retired member who was receiving a
straight life pension which was effective July 1, 1975 or later. Amount: Spouse’s pension equals 60% of the straight life pension the deceased retirant was receiving.
NON-DUTY DEATH-IN-SERVICE SURVIVOR’S PENSION Eligibility: Payable to a surviving spouse, if any, upon the death of a member with 20 (10 for Fire) or more
years of service. Amount: Accrued straight life pension actuarially reduced in accordance with an Option I election.
DUTY DEATH-IN-SERVICE SURVIVOR’S PENSION Eligibility: Police: Payable upon the expiration of Worker’s Compensation to the survivors of a member who
died in the line of duty. Fire: Payable to a surviving spouse. Amount: Police: Same amount that was paid by Worker’s Compensation. Fire: 100% joint and survivor
benefit calculated as if the deceased member had retired with 25 years of service.
NON-DUTY DISABILITY Eligibility: Payable upon the total and permanent disability of a member with 5 or more years of service. Amount: To Age 55: 1.5% of AFC times years of service.
At Age 55: Same as Service Retirement Pension.
City of Traverse City Act 345 Retirement System B-2
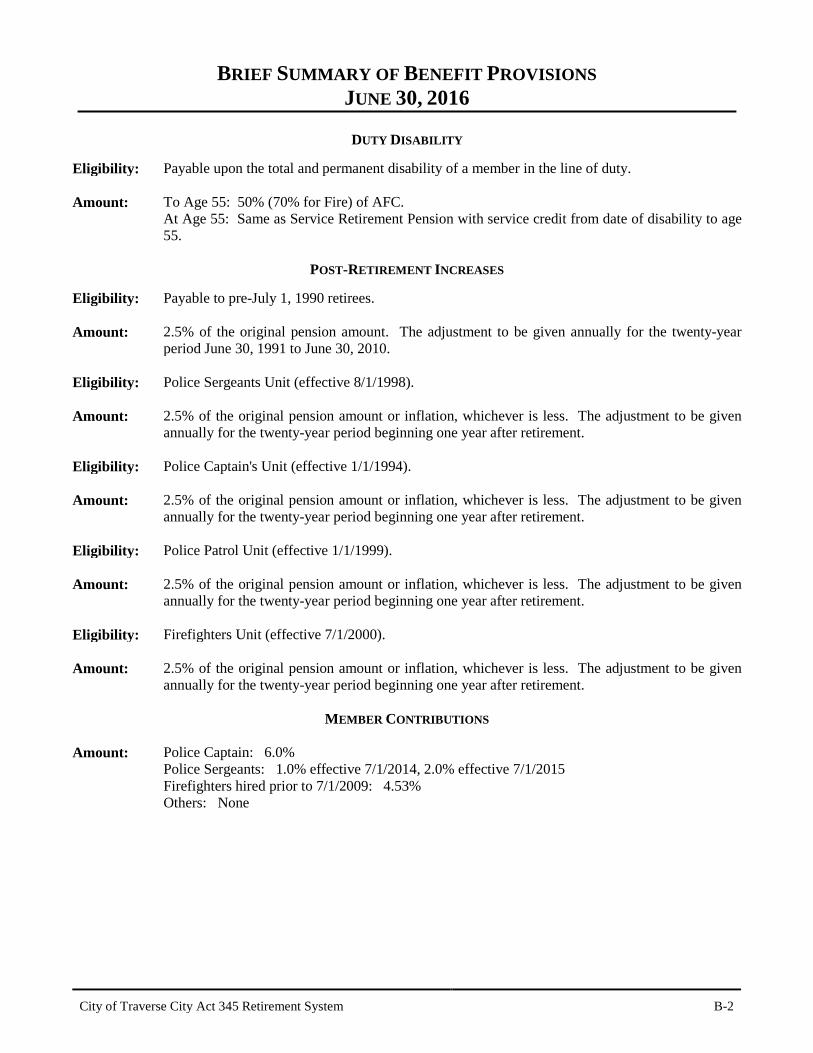
BRIEF SUMMARY OF BENEFIT PROVISIONS JUNE 30, 2016
DUTY DISABILITY
Eligibility: Payable upon the total and permanent disability of a member in the line of duty. Amount: To Age 55: 50% (70% for Fire) of AFC.
At Age 55: Same as Service Retirement Pension with service credit from date of disability to age 55.
POST-RETIREMENT INCREASES
Eligibility: Payable to pre-July 1, 1990 retirees. Amount: 2.5% of the original pension amount. The adjustment to be given annually for the twenty-year
period June 30, 1991 to June 30, 2010. Eligibility: Police Sergeants Unit (effective 8/1/1998). Amount: 2.5% of the original pension amount or inflation, whichever is less. The adjustment to be given
annually for the twenty-year period beginning one year after retirement.
Eligibility: Police Captain's Unit (effective 1/1/1994). Amount: 2.5% of the original pension amount or inflation, whichever is less. The adjustment to be given
annually for the twenty-year period beginning one year after retirement. Eligibility: Police Patrol Unit (effective 1/1/1999). Amount: 2.5% of the original pension amount or inflation, whichever is less. The adjustment to be given
annually for the twenty-year period beginning one year after retirement. Eligibility: Firefighters Unit (effective 7/1/2000). Amount: 2.5% of the original pension amount or inflation, whichever is less. The adjustment to be given
annually for the twenty-year period beginning one year after retirement.
MEMBER CONTRIBUTIONS Amount: Police Captain: 6.0%
Police Sergeants: 1.0% effective 7/1/2014, 2.0% effective 7/1/2015 Firefighters hired prior to 7/1/2009: 4.53% Others: None
City of Traverse City Act 345 Retirement System B-3
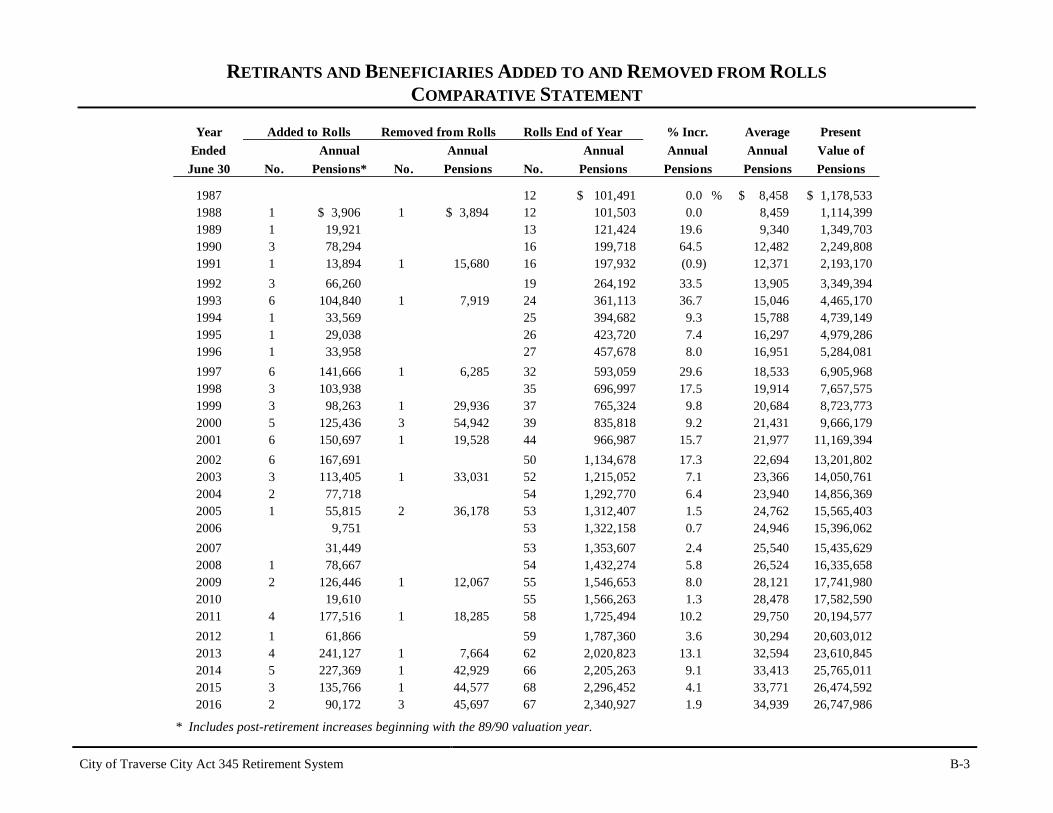
RETIRANTS AND BENEFICIARIES ADDED TO AND REMOVED FROM ROLLS COMPARATIVE STATEMENT
Year Average PresentEnded Annual Annual Annual Annual Value of
June 30 No. Pensions* No. Pensions No. Pensions Pensions Pensions
1987 12 $ 101,491 0.0 % $ 8,458 $ 1,178,5331988 1 $ 3,906 1 $ 3,894 12 101,503 0.0 8,459 1,114,3991989 1 19,921 13 121,424 19.6 9,340 1,349,7031990 3 78,294 16 199,718 64.5 12,482 2,249,8081991 1 13,894 1 15,680 16 197,932 (0.9) 12,371 2,193,1701992 3 66,260 19 264,192 33.5 13,905 3,349,3941993 6 104,840 1 7,919 24 361,113 36.7 15,046 4,465,1701994 1 33,569 25 394,682 9.3 15,788 4,739,1491995 1 29,038 26 423,720 7.4 16,297 4,979,2861996 1 33,958 27 457,678 8.0 16,951 5,284,0811997 6 141,666 1 6,285 32 593,059 29.6 18,533 6,905,9681998 3 103,938 35 696,997 17.5 19,914 7,657,5751999 3 98,263 1 29,936 37 765,324 9.8 20,684 8,723,7732000 5 125,436 3 54,942 39 835,818 9.2 21,431 9,666,1792001 6 150,697 1 19,528 44 966,987 15.7 21,977 11,169,3942002 6 167,691 50 1,134,678 17.3 22,694 13,201,8022003 3 113,405 1 33,031 52 1,215,052 7.1 23,366 14,050,7612004 2 77,718 54 1,292,770 6.4 23,940 14,856,3692005 1 55,815 2 36,178 53 1,312,407 1.5 24,762 15,565,4032006 9,751 53 1,322,158 0.7 24,946 15,396,0622007 31,449 53 1,353,607 2.4 25,540 15,435,6292008 1 78,667 54 1,432,274 5.8 26,524 16,335,6582009 2 126,446 1 12,067 55 1,546,653 8.0 28,121 17,741,9802010 19,610 55 1,566,263 1.3 28,478 17,582,5902011 4 177,516 1 18,285 58 1,725,494 10.2 29,750 20,194,5772012 1 61,866 59 1,787,360 3.6 30,294 20,603,0122013 4 241,127 1 7,664 62 2,020,823 13.1 32,594 23,610,8452014 5 227,369 1 42,929 66 2,205,263 9.1 33,413 25,765,0112015 3 135,766 1 44,577 68 2,296,452 4.1 33,771 26,474,5922016 2 90,172 3 45,697 67 2,340,927 1.9 34,939 26,747,986
Rolls End of YearRemoved from RollsAdded to Rolls
PensionsAnnual% Incr.
* Includes post-retirement increases beginning with the 89/90 valuation year.

City of Traverse City Act 345 Retirement System B-4
RETIRANTS AND BENEFICIARIES - JUNE 30, 2016 BY TYPE OF PENSIONS BEING PAID
AnnualPensions
Type of Pensions Being Paid Being Paid
Age and Service Pensions Straight life pension - terminating at death of retirant 8 $ 270,629
Straight life pension - automatic 60% survivor pension to surviving spouse 40 1,694,168
Option I pension - 100% joint and survivor 3 94,025
Option II - 50% joint and survivor 1 19,438
Pension being paid survivor beneficiary of deceased retirant * 12 179,496
Total age and service pensions 64 2,257,756
Casualty Pensions Duty disability pension 1 24,443 Duty death survivor pension 1 30,240 Non-duty disability survivor pension 1 28,488
Total casualty pensions 3 83,171
Total Pensions Being Paid 67 $2,340,927
No.
* Includes benefit being paid due to Eligible Domestic Relations Order (EDRO).

City of Traverse City Act 345 Retirement System B-5
RETIRANTS AND BENEFICIARIES - JUNE 30, 2016 TABULATED BY ATTAINED AGE
Attained AnnualAge No. Pensions
50 - 54 4 $ 200,92055 - 59 7 343,069 60 - 64 13 486,521 65 - 69 13 520,447
70 - 74 16 485,765 75 - 79 7 191,710 80 - 84 4 78,097 85 - 89 2 25,088
95 - 99 1 9,310
Totals 67 $2,340,927
Average Age at Retirement: 53.2 years Average Age Now: 68.6 years
City of Traverse City Act 345 Retirement System B-6
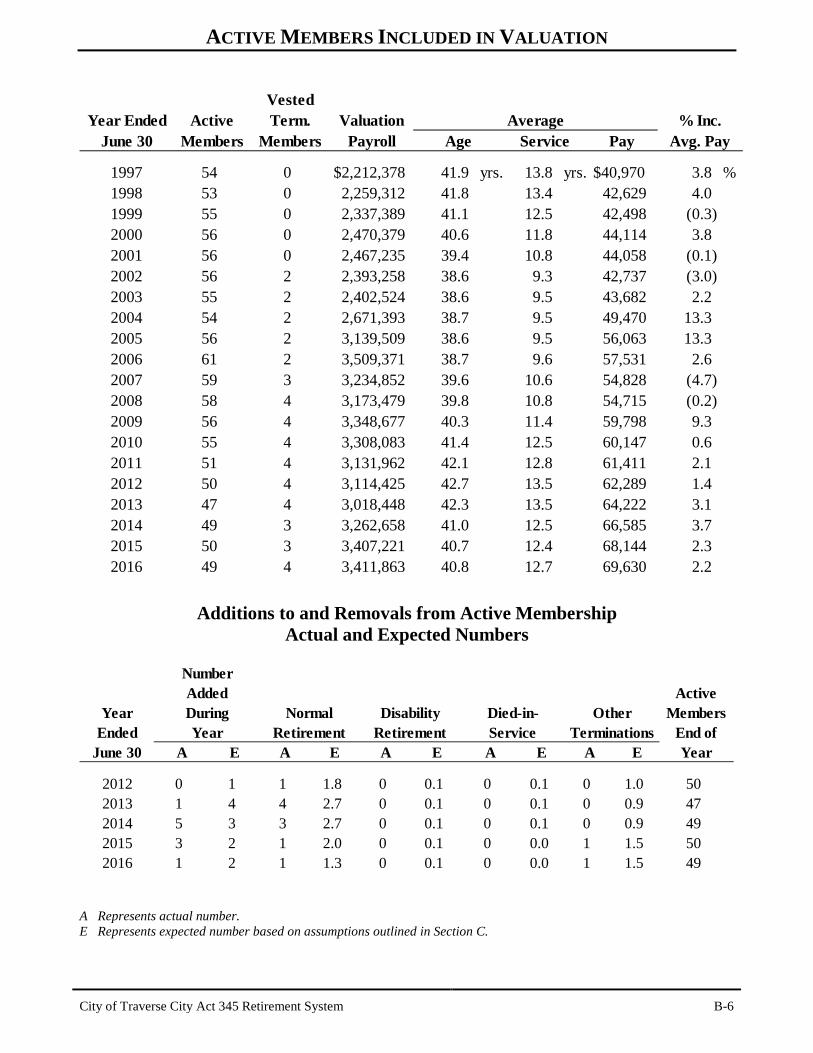
ACTIVE MEMBERS INCLUDED IN VALUATION
VestedYear Ended Active Term. Valuation
June 30 Members Members Payroll Pay
1997 54 0 $2,212,378 41.9 yrs. 13.8 yrs. $40,970 3.8 %1998 53 0 2,259,312 41.8 13.4 42,629 4.01999 55 0 2,337,389 41.1 12.5 42,498 (0.3)2000 56 0 2,470,379 40.6 11.8 44,114 3.82001 56 0 2,467,235 39.4 10.8 44,058 (0.1)2002 56 2 2,393,258 38.6 9.3 42,737 (3.0)2003 55 2 2,402,524 38.6 9.5 43,682 2.22004 54 2 2,671,393 38.7 9.5 49,470 13.32005 56 2 3,139,509 38.6 9.5 56,063 13.32006 61 2 3,509,371 38.7 9.6 57,531 2.62007 59 3 3,234,852 39.6 10.6 54,828 (4.7)2008 58 4 3,173,479 39.8 10.8 54,715 (0.2)2009 56 4 3,348,677 40.3 11.4 59,798 9.32010 55 4 3,308,083 41.4 12.5 60,147 0.62011 51 4 3,131,962 42.1 12.8 61,411 2.12012 50 4 3,114,425 42.7 13.5 62,289 1.42013 47 4 3,018,448 42.3 13.5 64,222 3.12014 49 3 3,262,658 41.0 12.5 66,585 3.72015 50 3 3,407,221 40.7 12.4 68,144 2.32016 49 4 3,411,863 40.8 12.7 69,630 2.2
Avg. PayAverage
Age Service% Inc.
Additions to and Removals from Active Membership Actual and Expected Numbers
ActiveYear Members
Ended End ofJune 30 A E A E A E A E A E Year
2012 0 1 1 1.8 0 0.1 0 0.1 0 1.0 502013 1 4 4 2.7 0 0.1 0 0.1 0 0.9 472014 5 3 3 2.7 0 0.1 0 0.1 0 0.9 492015 3 2 1 2.0 0 0.1 0 0.0 1 1.5 502016 1 2 1 1.3 0 0.1 0 0.0 1 1.5 49
TerminationsOther
RetirementNormal
RetirementDisability
YearDuring
NumberAdded
ServiceDied-in-
A Represents actual number. E Represents expected number based on assumptions outlined in Section C.
City of Traverse City Act 345 Retirement System B-7
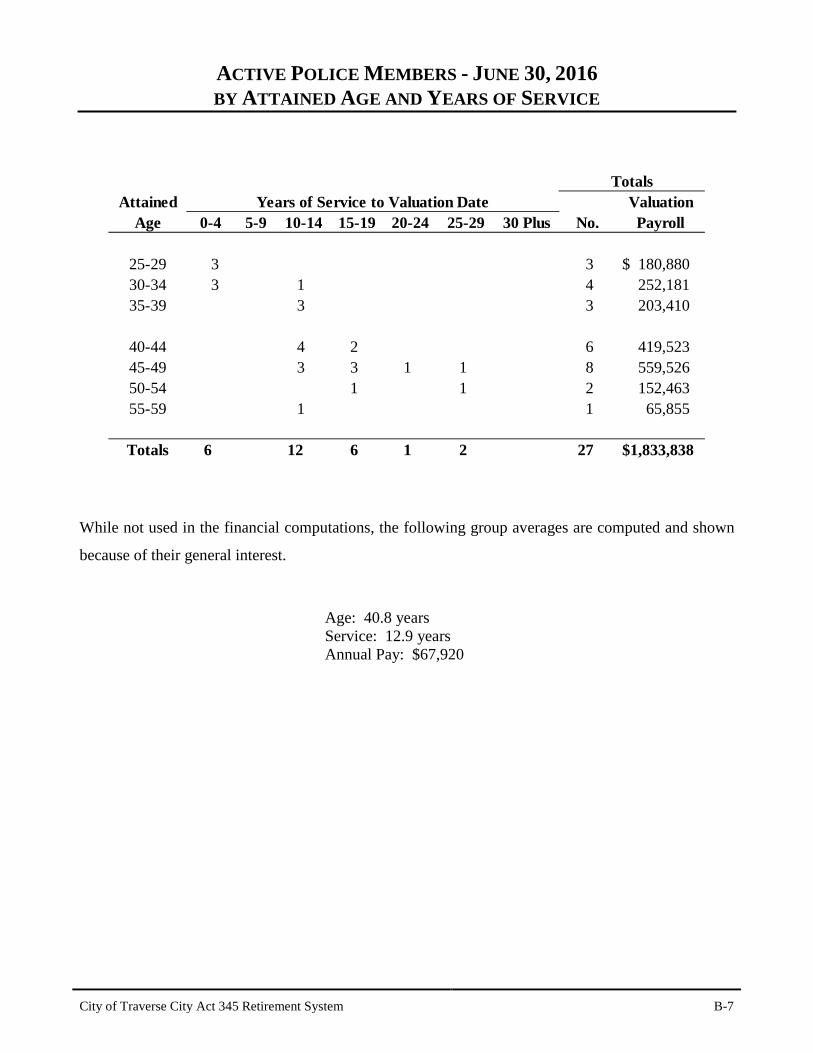
ACTIVE POLICE MEMBERS - JUNE 30, 2016 BY ATTAINED AGE AND YEARS OF SERVICE
Attained ValuationAge 0-4 5-9 10-14 15-19 20-24 25-29 30 Plus No. Payroll
25-29 3 3 $ 180,880 30-34 3 1 4 252,181 35-39 3 3 203,410
40-44 4 2 6 419,523 45-49 3 3 1 1 8 559,526 50-54 1 1 2 152,463 55-59 1 1 65,855
Totals 6 0 12 6 1 2 27 $1,833,838
Years of Service to Valuation DateTotals
While not used in the financial computations, the following group averages are computed and shown
because of their general interest.
Age: 40.8 years Service: 12.9 years Annual Pay: $67,920

City of Traverse City Act 345 Retirement System B-8
ACTIVE FIRE MEMBERS - JUNE 30, 2016 BY ATTAINED AGE AND YEARS OF SERVICE
Attained ValuationAge 0-4 5-9 10-14 15-19 20-24 25-29 30 Plus No. Payroll
30-34 3 2 1 6 $ 391,547 35-39 1 4 5 329,865
40-44 2 1 3 211,849 45-49 2 2 4 310,412 50-54 1 2 3 249,518
62 1 1 84,834
Totals 4 2 10 3 3 22 $ 1,578,025
Years of Service to Valuation DateTotals
While not used in the financial computations, the following group averages are computed and shown
because of their general interest.
Age: 40.9 years Service: 12.4 years Annual Pay: $71,728
City of Traverse City Act 345 Retirement System B-9
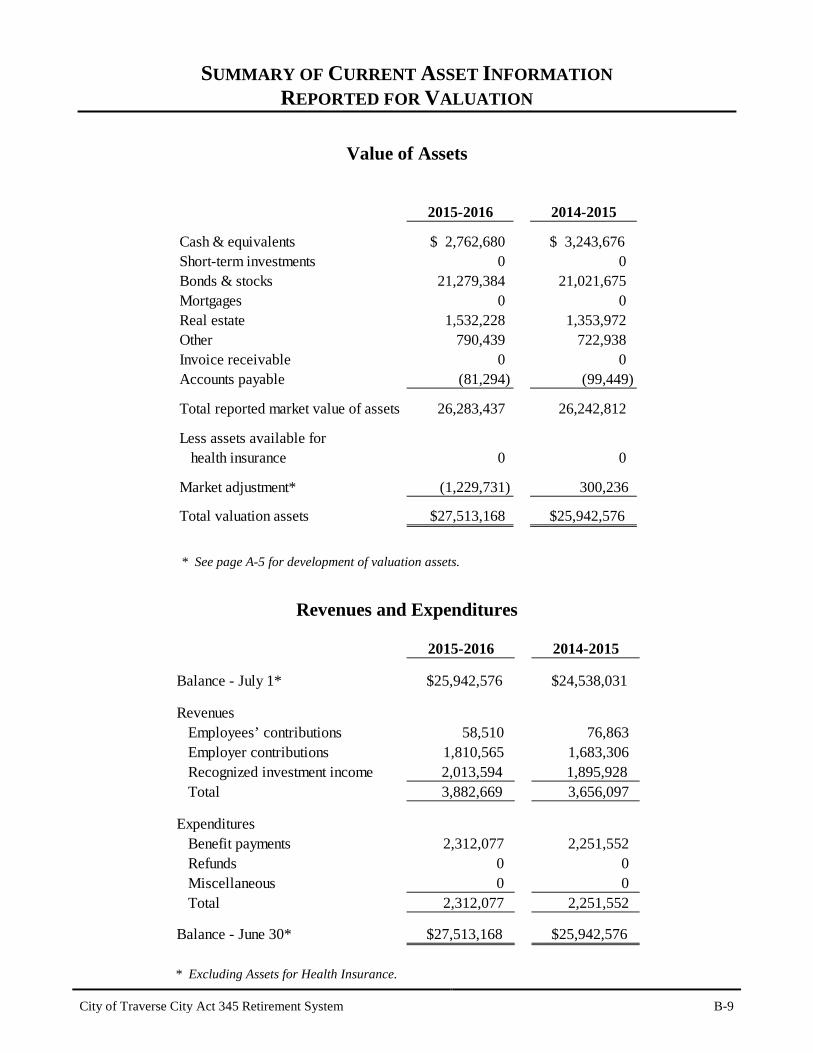
SUMMARY OF CURRENT ASSET INFORMATION REPORTED FOR VALUATION
Value of Assets
2015-2016 2014-2015
Cash & equivalents $ 2,762,680 $ 3,243,676 Short-term investments 0 0 Bonds & stocks 21,279,384 21,021,675 Mortgages 0 0 Real estate 1,532,228 1,353,972 Other 790,439 722,938 Invoice receivable 0 0 Accounts payable (81,294) (99,449)
Total reported market value of assets 26,283,437 26,242,812
Less assets available for health insurance 0 0
Market adjustment* (1,229,731) 300,236
Total valuation assets $27,513,168 $25,942,576
* See page A-5 for development of valuation assets.
Revenues and Expenditures
2015-2016 2014-2015
Balance - July 1* $25,942,576 $24,538,031
Revenues Employees’ contributions 58,510 76,863 Employer contributions 1,810,565 1,683,306 Recognized investment income 2,013,594 1,895,928 Total 3,882,669 3,656,097
Expenditures Benefit payments 2,312,077 2,251,552 Refunds 0 0 Miscellaneous 0 0 Total 2,312,077 2,251,552
Balance - June 30* $27,513,168 $25,942,576
* Excluding Assets for Health Insurance.
City of Traverse City Act 345 Retirement System B-10
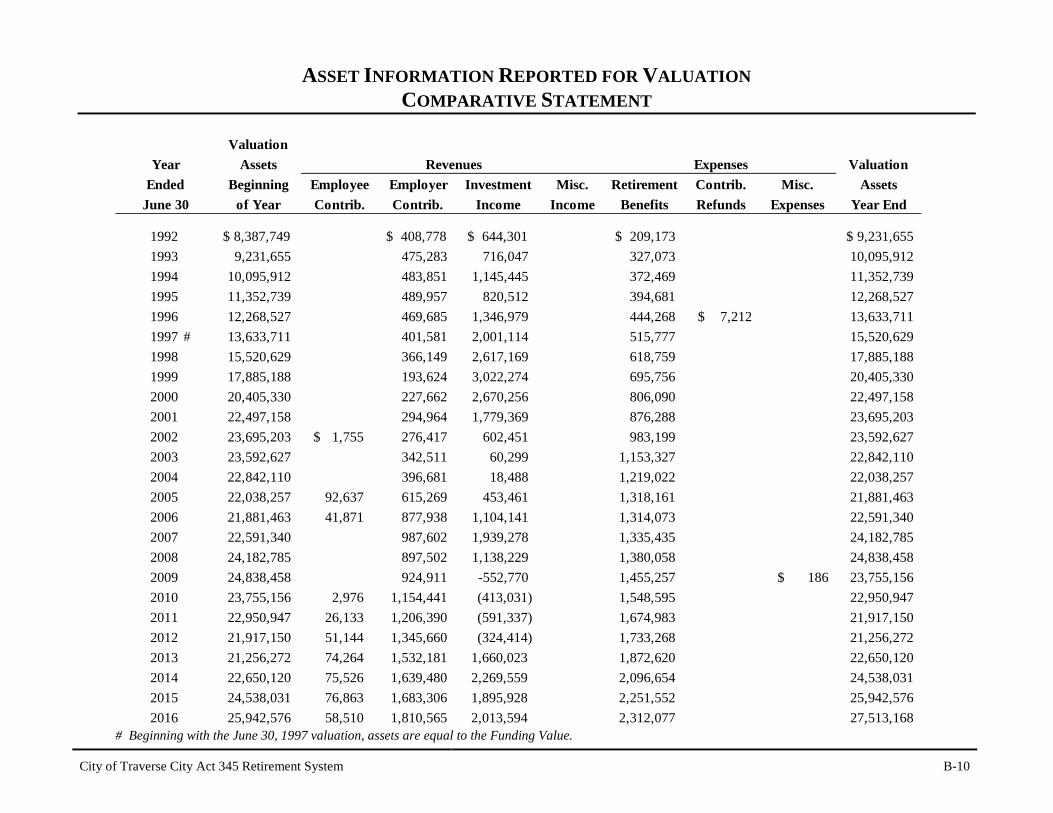
ASSET INFORMATION REPORTED FOR VALUATION COMPARATIVE STATEMENT
ValuationAssets Valuation
Beginning Employee Employer Investment Misc. Retirement Contrib. Misc. Assetsof Year Contrib. Contrib. Income Income Benefits Refunds Expenses Year End
1992 $ 8,387,749 $ 408,778 $ 644,301 $ 209,173 $ 9,231,6551993 9,231,655 475,283 716,047 327,073 10,095,9121994 10,095,912 483,851 1,145,445 372,469 11,352,7391995 11,352,739 489,957 820,512 394,681 12,268,5271996 12,268,527 469,685 1,346,979 444,268 $ 7,212 13,633,7111997 # 13,633,711 401,581 2,001,114 515,777 15,520,6291998 15,520,629 366,149 2,617,169 618,759 17,885,1881999 17,885,188 193,624 3,022,274 695,756 20,405,3302000 20,405,330 227,662 2,670,256 806,090 22,497,1582001 22,497,158 294,964 1,779,369 876,288 23,695,203
2002 23,695,203 $ 1,755 276,417 602,451 983,199 23,592,627 2003 23,592,627 342,511 60,299 1,153,327 22,842,110 2004 22,842,110 396,681 18,488 1,219,022 22,038,257 2005 22,038,257 92,637 615,269 453,461 1,318,161 21,881,463 2006 21,881,463 41,871 877,938 1,104,141 1,314,073 22,591,340 2007 22,591,340 987,602 1,939,278 1,335,435 24,182,785 2008 24,182,785 897,502 1,138,229 1,380,058 24,838,458 2009 24,838,458 924,911 -552,770 1,455,257 $ 186 23,755,156
2010 23,755,156 2,976 1,154,441 (413,031) 1,548,595 22,950,947 2011 22,950,947 26,133 1,206,390 (591,337) 1,674,983 21,917,150 2012 21,917,150 51,144 1,345,660 (324,414) 1,733,268 21,256,272 2013 21,256,272 74,264 1,532,181 1,660,023 1,872,620 22,650,120 2014 22,650,120 75,526 1,639,480 2,269,559 2,096,654 24,538,031 2015 24,538,031 76,863 1,683,306 1,895,928 2,251,552 25,942,576 2016 25,942,576 58,510 1,810,565 2,013,594 2,312,077 27,513,168
June 30EndedYear ExpensesRevenues
# Beginning with the June 30, 1997 valuation, assets are equal to the Funding Value.

SECTION C VA L U AT I O N M E T H O D S A ND A S S U M P TI O N S
City of Traverse City Act 345 Retirement System C-1
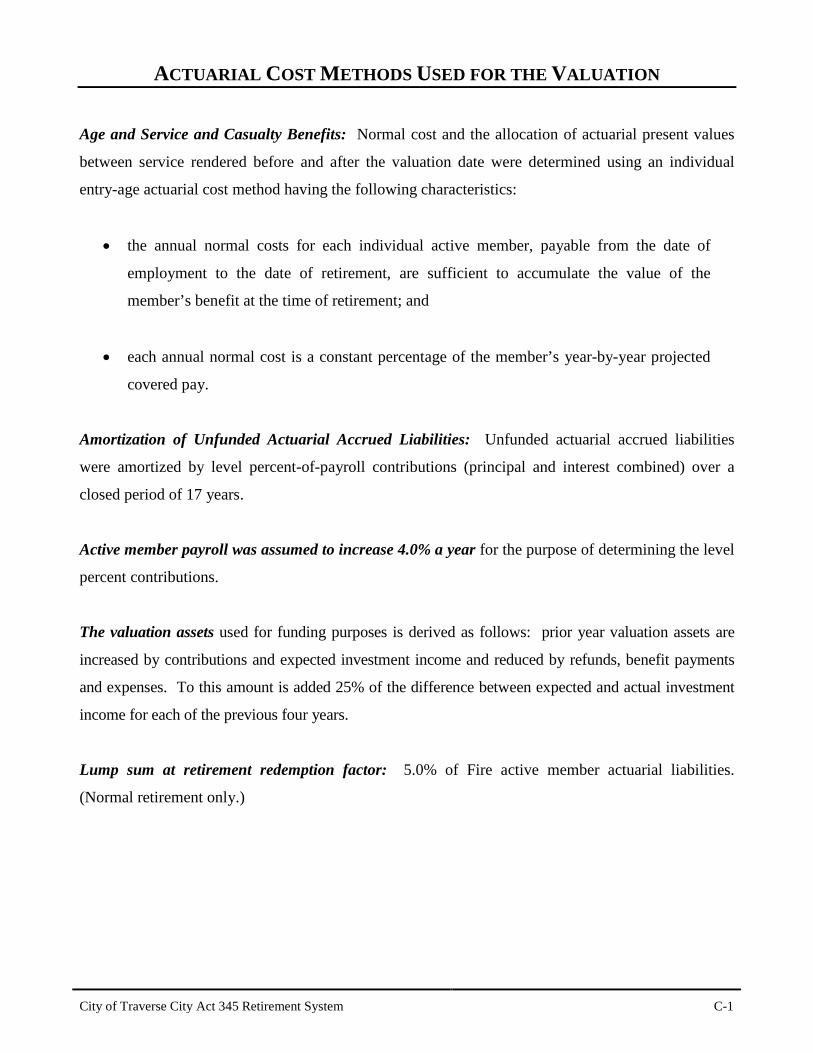
ACTUARIAL COST METHODS USED FOR THE VALUATION Age and Service and Casualty Benefits: Normal cost and the allocation of actuarial present values
between service rendered before and after the valuation date were determined using an individual
entry-age actuarial cost method having the following characteristics:
• the annual normal costs for each individual active member, payable from the date of
employment to the date of retirement, are sufficient to accumulate the value of the
member’s benefit at the time of retirement; and
• each annual normal cost is a constant percentage of the member’s year-by-year projected
covered pay.
Amortization of Unfunded Actuarial Accrued Liabilities: Unfunded actuarial accrued liabilities
were amortized by level percent-of-payroll contributions (principal and interest combined) over a
closed period of 17 years.
Active member payroll was assumed to increase 4.0% a year for the purpose of determining the level
percent contributions.
The valuation assets used for funding purposes is derived as follows: prior year valuation assets are
increased by contributions and expected investment income and reduced by refunds, benefit payments
and expenses. To this amount is added 25% of the difference between expected and actual investment
income for each of the previous four years.
Lump sum at retirement redemption factor: 5.0% of Fire active member actuarial liabilities.
(Normal retirement only.)
City of Traverse City Act 345 Retirement System C-2
ACTUARIAL ASSUMPTIONS IN THE VALUATION PROCESS The contribution and benefit values of the System are calculated by applying actuarial assumptions to
the benefit provisions and people information furnished, using the actuarial cost methods described on
the previous page.
The principal areas of risk which require assumptions about future experience are:
• long-term rates of investment return to be generated by the assets of the System
• patterns of pay increases to members
• rates of mortality among members, retirants, and beneficiaries
• rates of withdrawal of active members
• rates of disability among active members
• the age patterns of actual retirements
The monetary effect of each assumption is calculated for as long as a present covered person survives
-- a period of time which can be as long as a century.
Actual experience of the System will not coincide exactly with assumed experience, regardless of the
choice of the assumptions. Each valuation provides a complete recalculation of assumed future
experience and takes into account all past differences between assumed and actual experience. The
result is a continual series of adjustments (usually small) to the computed contribution rate.
From time-to-time, one or more of the assumptions is modified to reflect experience trends (but not
random or temporary year-to-year fluctuations).

City of Traverse City Act 345 Retirement System C-3
VALUATION ASSUMPTIONS
The rate of investment return (regular interest), net of investment expense, was 7.5% per year,
compounded annually. This rate is not the assumed real return which, for funding purposes, is the
rate of return in excess of average salary increases. Considering other assumptions used in the
valuation, the 7.5% translates to a real return over wage inflation of approximately 3.5%. Experience
over the last 5 years has been as illustrated below:
1) Nominal rate of return 7.9 % 7.9 % 10.2 % 8.0 % (1.1) % 6.6 %2) Increase in CPI 1.0 0.1 2.1 1.8 1.7 1.33) Average salary increase 2.2 2.3 3.7 3.1 1.4 2.54) Real return
- investment purposes 6.9 7.8 8.1 6.2 (2.8) 5.2 - funding purposes 5.7 5.6 6.5 4.9 (2.5) 4.0 - assumption 3.5 3.5 3.5 3.5 3.5 3.5
Average5-YearYear Ended June 30
2016 2015 2014 2013 2012
The nominal rate of return was computed using the approximate formula: i = I divided by 1/2 (A+B-I), where I is realized investment income net after expenses, A is the beginning of year asset value and B is the end of year asset value.
The mortality table used to measure pre- and post-retirement mortality was the RP-2000 Mortality
Table for males and females projected 20 years with Scale AA. Mortality rates were adjusted to
include margin for future mortality improvement as described above.
SampleAges Men Women Men Women
50 $146.52 $147.02 33.72 34.63 55 139.44 140.08 28.98 29.88 60 130.21 131.31 24.36 25.31 65 118.86 120.76 20.00 21.02
70 105.68 108.61 15.98 17.06 75 90.20 94.82 12.28 13.47 80 73.06 79.37 9.01 10.23
Single Life Retirement Values
Expectancy (Years)$1 Monthly for LifeFuture LifePresent Value of
This assumption is used to measure the probabilities of members dying before retirement and the
probabilities of each benefit payment being made after retirement. Disabled mortality is set-forward
10 years.

City of Traverse City Act 345 Retirement System C-4
Rates of separation from active membership are represented by the following table (rates do not
apply to members eligible to retire and do not include separation on account of death or disability).
This assumption measures the probabilities of members remaining in employment.
Sample Years ofAges Service
ALL 0 15.00 %1 10.002 8.003 7.004 6.00
25 5 & Over 6.0030 5.1035 2.7040 1.60
45 1.1050 1.0055 1.0060 1.00
Separating within Next Year% of Active Members
Wage Inflation used to project current salaries is represented by the following table.
SampleAges
20 4.0 % 3.0 % 7.0 %25 4.0 3.0 7.030 4.0 2.6 6.635 4.0 1.1 5.1
40 4.0 0.2 4.245 4.0 0.2 4.250 4.0 0.2 4.255 4.0 0.1 4.160 4.0 0.0 4.0
Percent Increase in Salary
Base Merit and Seniority TotalDuring Next Year
If the number of active members remains constant, then the total active member payroll will increase
4.0% annually, the base portion of the individual salary increase assumptions. This increasing payroll
was recognized in amortizing unfunded actuarial accrued liabilities.
Price inflation is not explicitly assumed in this valuation, but based upon other assumptions in this
report, price inflation of 2.75% could be assumed.
City of Traverse City Act 345 Retirement System C-5
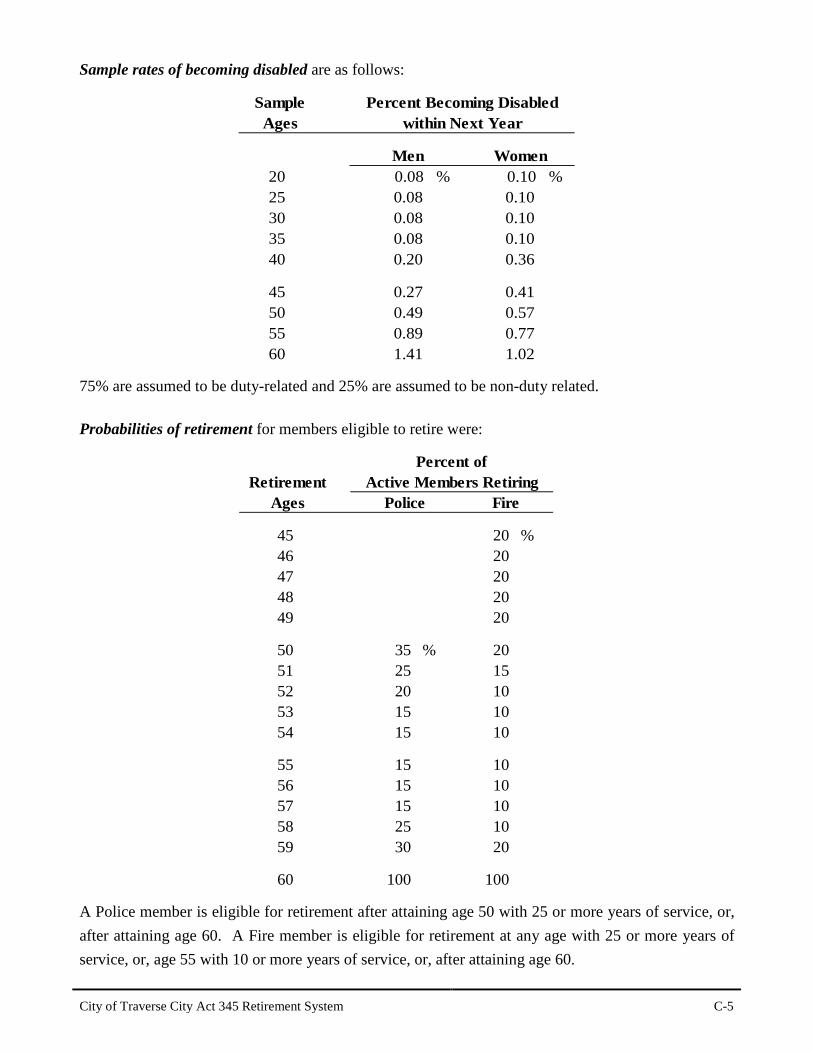
Sample rates of becoming disabled are as follows:
SampleAges
Men Women20 0.08 % 0.10 %25 0.08 0.1030 0.08 0.1035 0.08 0.1040 0.20 0.36
45 0.27 0.4150 0.49 0.5755 0.89 0.7760 1.41 1.02
Percent Becoming Disabledwithin Next Year
75% are assumed to be duty-related and 25% are assumed to be non-duty related. Probabilities of retirement for members eligible to retire were:
RetirementAges
45 20 %46 2047 2048 2049 20
50 35 % 2051 25 1552 20 1053 15 1054 15 10
55 15 1056 15 1057 15 1058 25 1059 30 20
60 100 100
Active Members RetiringPercent of
Police Fire
A Police member is eligible for retirement after attaining age 50 with 25 or more years of service, or, after attaining age 60. A Fire member is eligible for retirement at any age with 25 or more years of service, or, age 55 with 10 or more years of service, or, after attaining age 60.
City of Traverse City Act 345 Retirement System C-6
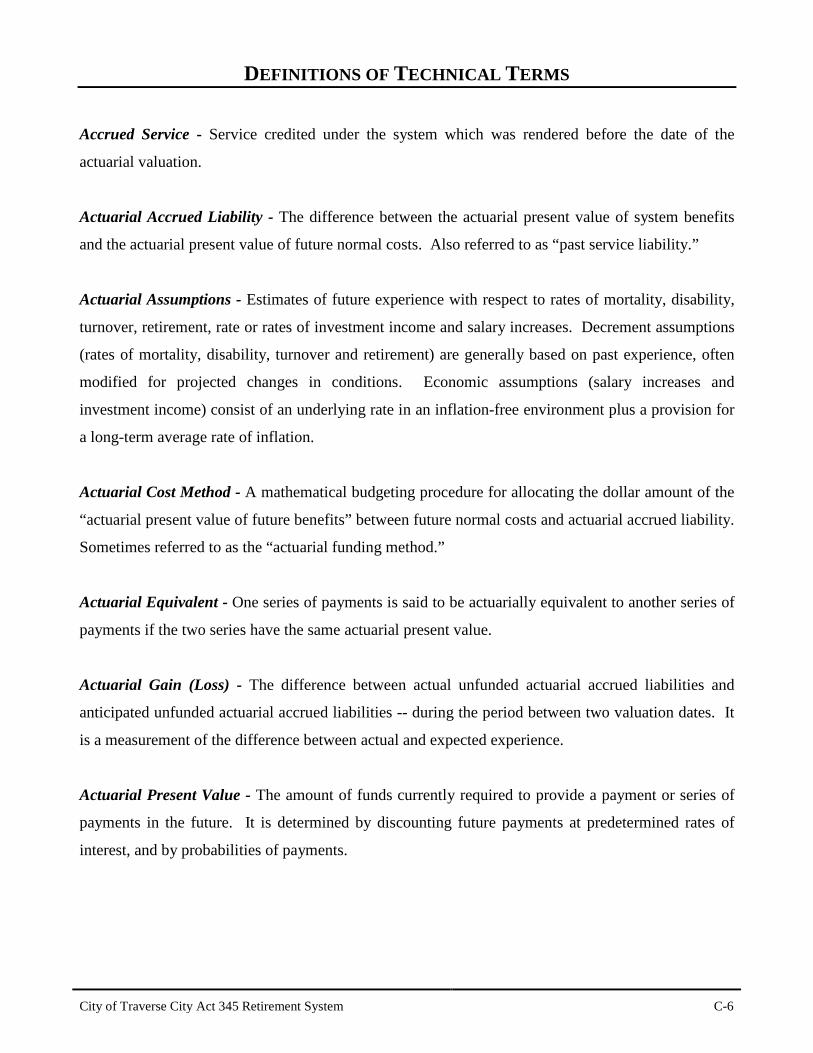
DEFINITIONS OF TECHNICAL TERMS Accrued Service - Service credited under the system which was rendered before the date of the
actuarial valuation.
Actuarial Accrued Liability - The difference between the actuarial present value of system benefits
and the actuarial present value of future normal costs. Also referred to as “past service liability.”
Actuarial Assumptions - Estimates of future experience with respect to rates of mortality, disability,
turnover, retirement, rate or rates of investment income and salary increases. Decrement assumptions
(rates of mortality, disability, turnover and retirement) are generally based on past experience, often
modified for projected changes in conditions. Economic assumptions (salary increases and
investment income) consist of an underlying rate in an inflation-free environment plus a provision for
a long-term average rate of inflation.
Actuarial Cost Method - A mathematical budgeting procedure for allocating the dollar amount of the
“actuarial present value of future benefits” between future normal costs and actuarial accrued liability.
Sometimes referred to as the “actuarial funding method.”
Actuarial Equivalent - One series of payments is said to be actuarially equivalent to another series of
payments if the two series have the same actuarial present value.
Actuarial Gain (Loss) - The difference between actual unfunded actuarial accrued liabilities and
anticipated unfunded actuarial accrued liabilities -- during the period between two valuation dates. It
is a measurement of the difference between actual and expected experience.
Actuarial Present Value - The amount of funds currently required to provide a payment or series of
payments in the future. It is determined by discounting future payments at predetermined rates of
interest, and by probabilities of payments.
City of Traverse City Act 345 Retirement System C-7
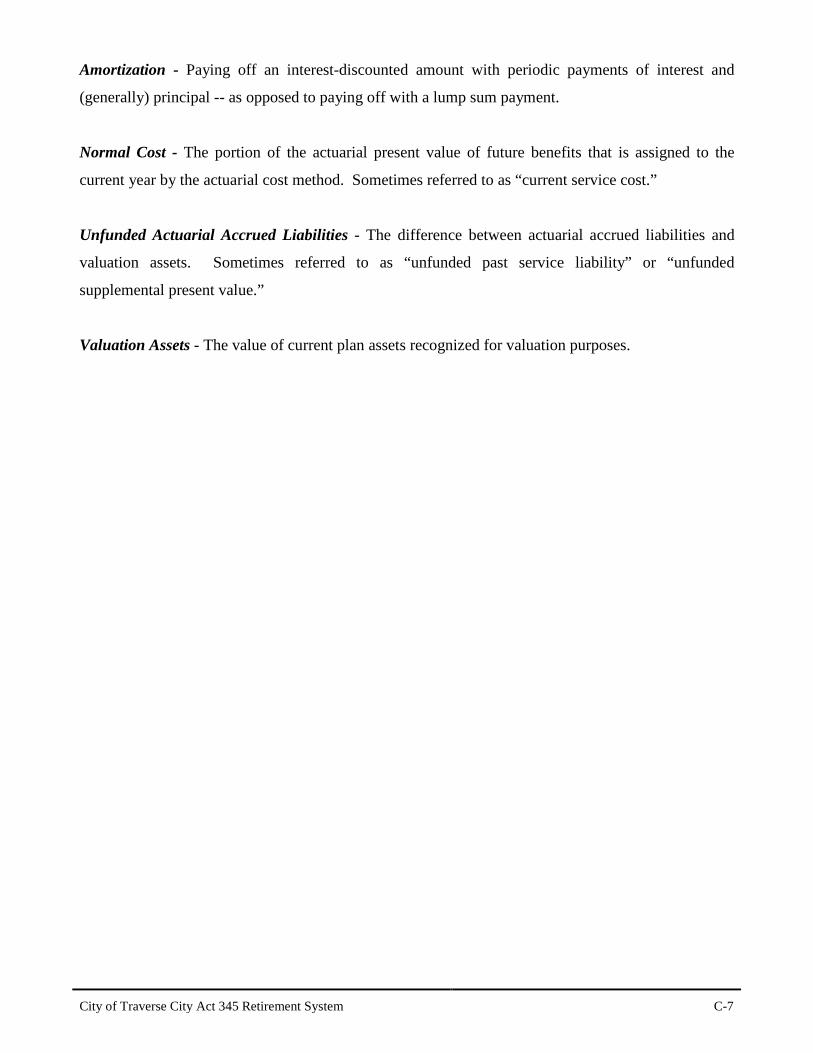
Amortization - Paying off an interest-discounted amount with periodic payments of interest and
(generally) principal -- as opposed to paying off with a lump sum payment.
Normal Cost - The portion of the actuarial present value of future benefits that is assigned to the
current year by the actuarial cost method. Sometimes referred to as “current service cost.”
Unfunded Actuarial Accrued Liabilities - The difference between actuarial accrued liabilities and
valuation assets. Sometimes referred to as “unfunded past service liability” or “unfunded
supplemental present value.”
Valuation Assets - The value of current plan assets recognized for valuation purposes.

SECTION D F I N AN C I AL R E P O R TI N G NOTE: GASB Statements No. 67 and No. 68 are effective for Governmental Retirement Plans for the fiscal year beginning after June 15, 2013 (GASB Statement No. 67) and the fiscal year beginning after June 15, 2014 (GASB Statement No. 68). These statements replace GASB Statements No. 25 and No. 27.
City of Traverse City Act 345 Retirement System D-1
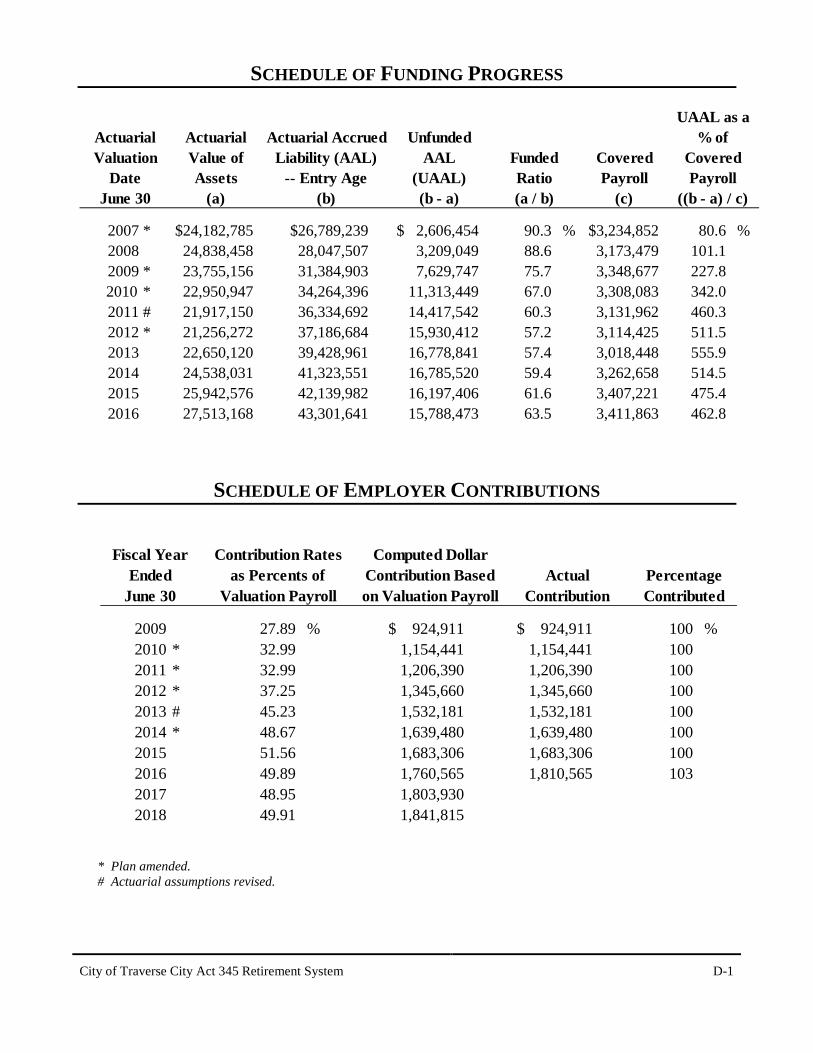
SCHEDULE OF FUNDING PROGRESS
Actuarial Actuarial Accrued UnfundedValue of Liability (AAL) AAL CoveredAssets -- Entry Age (UAAL) Payroll
(a) (b) (b - a) (c)
2007 * $24,182,785 $26,789,239 $ 2,606,454 90.3 % $3,234,852 80.6 % 2008 24,838,458 28,047,507 3,209,049 88.6 3,173,479 101.1 2009 * 23,755,156 31,384,903 7,629,747 75.7 3,348,677 227.82010 * 22,950,947 34,264,396 11,313,449 67.0 3,308,083 342.0 2011 # 21,917,150 36,334,692 14,417,542 60.3 3,131,962 460.3 2012 * 21,256,272 37,186,684 15,930,412 57.2 3,114,425 511.5 2013 22,650,120 39,428,961 16,778,841 57.4 3,018,448 555.9 2014 24,538,031 41,323,551 16,785,520 59.4 3,262,658 514.5 2015 25,942,576 42,139,982 16,197,406 61.6 3,407,221 475.4 2016 27,513,168 43,301,641 15,788,473 63.5 3,411,863 462.8
June 30Date
ValuationActuarial
UAAL as a
((b - a) / c)Payroll
Covered% of
(a / b)Ratio
Funded
SCHEDULE OF EMPLOYER CONTRIBUTIONS
Computed DollarContribution Based Actualon Valuation Payroll Contribution
2009 27.89 % $ 924,911 $ 924,911 100 %2010 * 32.99 1,154,441 1,154,441 1002011 * 32.99 1,206,390 1,206,390 1002012 * 37.25 1,345,660 1,345,660 1002013 # 45.23 1,532,181 1,532,181 1002014 * 48.67 1,639,480 1,639,480 1002015 51.56 1,683,306 1,683,306 1002016 49.89 1,760,565 1,810,565 1032017 48.95 1,803,930 2018 49.91 1,841,815
ContributedPercentage
June 30Ended
Fiscal Year
Valuation Payrollas Percents of
Contribution Rates
* Plan amended. # Actuarial assumptions revised.

City of Traverse City Act 345 Retirement System D-2
SUMMARY OF ACTUARIAL METHODS AND ASSUMPTIONS The information presented on the previous pages was determined as part of the actuarial valuations at
the dates indicated. Additional information as of the latest actuarial valuation follows:
Valuation date: June 30, 2016 Actuarial cost method: Entry Age Amortization method: Level percent Remaining amortization period: 17 years closed Asset valuation method: 4-year smoothed market Actuarial assumptions:
Investment rate of return 7.5% Projected salary increases* 4.0% - 7.0% *Includes wage inflation at 4.0% Cost-of-living adjustments 2.5% of original pension for twenty years, payable to
Pre-July 1, 1990 retirees, 2.5% of original pension or inflation whichever is less, for twenty years, payable to the Police Captains unit (effective 1/1/1994) and Police Sergeants (effective 8/1/1998) and Police Patrol (effective 1/1/1999) and Firefighters unit (effective 7/1/2000)
Membership in the plan consisted of the following on June 30, 2016, the date of the latest actuarial
valuation:
Retirees and beneficiaries receiving benefits 67 Terminated plan members entitled
to but not yet receiving benefits 4 Active plan members 49 Total 120
APPENDIX

City of Traverse City Act 345 Retirement System Appendix-1
AMORTIZATION PAYOFF SCHEDULE
Date Period
Unfunded Actuarial Accrued Liability (UAAL) (Beg. of
Year)
UAAL Payment
%UAAL
Payment $ InterestUAAL
(End of Year)June 30, 2016 15,788,473$ July 1, 2017 17 16,420,012 35.59% 1,287,776$ 1,183,791$ 16,316,027$ July 1, 2018 16 16,316,027 35.59% 1,339,287 1,174,084 16,150,824 July 1, 2019 15 16,150,824 35.59% 1,392,859 1,159,709 15,917,674 July 1, 2020 14 15,917,674 35.59% 1,448,573 1,140,159 15,609,260 July 1, 2021 13 15,609,260 35.59% 1,506,516 1,114,881 15,217,625 July 1, 2022 12 15,217,625 35.59% 1,566,777 1,083,276 14,734,124 July 1, 2023 11 14,734,124 35.59% 1,629,448 1,044,691 14,149,368 July 1, 2024 10 14,149,368 35.59% 1,694,626 998,420 13,453,163 July 1, 2025 9 13,453,163 35.59% 1,762,411 943,693 12,634,445 July 1, 2026 8 12,634,445 35.59% 1,832,907 879,678 11,681,216 July 1, 2027 7 11,681,216 35.59% 1,906,223 805,469 10,580,462 July 1, 2028 6 10,580,462 35.59% 1,982,472 720,088 9,318,078 July 1, 2029 5 9,318,078 35.59% 2,061,771 622,471 7,878,778 July 1, 2030 4 7,878,778 35.59% 2,144,242 511,468 6,246,004 July 1, 2031 3 6,246,004 35.59% 2,230,012 385,833 4,401,825 July 1, 2032 2 4,401,825 35.59% 2,319,212 244,215 2,326,828 July 1, 2033 1 2,326,828 35.59% 2,411,981 85,153 0
Unfunded liability at June 30, 2016 adjusted to July 1, 2017. Payment based on 7.50% interest and
4.00% wage base over 17 years beginning on the Fiscal Year starting July 1, 2017.