City of Surprise, Arizona Comprehensive Annual Financial ...
116
City of Surprise, Arizona Comprehensive Annual Financial Report for the fiscal year ended June 30, 2003 surprise ARIZONA
Transcript of City of Surprise, Arizona Comprehensive Annual Financial ...

City of Surprise, Arizona Comprehensive
Annual Financial Report
for the fiscal year ended June 30, 2003
surpriseARIZONA


CITY OF SURPRISE, ARIZONA
COMPREHENSIVE ANNUAL FINANCIAL REPORT
For the fiscal year ended June 30, 2003
Prepared by: Finance Department


CITY OF SURPRISE, ARIZONA COMPREHENSIVE ANNUAL FINANCIAL REPORT TABLE OF CONTENTS FOR THE FISCAL YEAR ENDED JUNE 30, 2003
(Continued) -i-
Page INTRODUCTORY SECTION Letter of Transmittal................................................................................................................................. iii – vii Certificate of Achievement for Excellence in Financial Reporting.......................................................... viii Organizational Chart ................................................................................................................................ ix List of Elected and Appointed Officials ................................................................................................... x - xiii FINANCIAL SECTION Independent Auditor’s Opinion................................................................................................................ 1 – 2 Management Discussion and Analysis ..................................................................................................... 3 – 11 Basic Financial Statements Statement of Net Assets...................................................................................................................... 12 Statement of Activities ....................................................................................................................... 13 Balance Sheet – Governmental Funds................................................................................................ 14 Reconciliation of Total Governmental Fund Balance to Net Assets of Governmental Activities............................................................................................................... 15 Statement of Revenues, Expenditures and Changes in Fund Balances – Governmental Funds .................................................................................................................... 16 Reconciliation of the Statement of Revenues, Expenditures and Changes in Fund Balances of Governmental Funds to the Statement of Activities.................................... 17 Statement of Net Assets – Proprietary Funds..................................................................................... 18 Statement of Revenues, Expenses and Changes in Net Assets – Proprietary Funds.......................... 19 Combining Statement of Cash Flows – Proprietary Funds ................................................................ 20 Statement of Fiduciary Net Assets – Pension Trust Fund .................................................................. 21 Statement of Changes in Fiduciary Net Assets – Pension Trust Fund ............................................... 22 Notes to Financial Statements:
1. Summary of Significant Accounting Policies............................................................................... 23 – 28 2. Compliance and Accountability ................................................................................................... 28 3. Reconciliation of Government-Wide and Fund Financial Statements ......................................... 28 – 29 4. Cash and Cash Equivalents........................................................................................................... 29 5. Capital Assets ............................................................................................................................... 29 – 31 6. Water Rights – Mountain Vista .................................................................................................... 31 7. Long-Term Debt ........................................................................................................................... 32 – 33 8. Municipal Property Corporation Fund Construction Commitment Liability ............................... 33 9. Restatement of Prior Year Balances ............................................................................................. 33 10. Beginning Fund Balance/Net Assets Adjustments ....................................................................... 33 – 34 11. Retirement Plans........................................................................................................................... 34 – 37 12. Risk Management ......................................................................................................................... 37 13. Contingent Liabilities ................................................................................................................... 37 14. Interfund Assets, Liabilities, and Transfers.................................................................................. 38 15. Deficit Fund Net Assets................................................................................................................ 38 – 39

TABLE OF CONTENTS
-ii-
Page Supplemental Section Required Supplemental Information – Schedule of Revenues, Expenditures and Changes in Fund Balances – Budget and Actual – General and Major Special Revenue Funds ............................................................................................................................. 40 – 43 Combining Balance Sheet – Nonmajor Governmental Funds............................................................ 44 Combining Statement of Revenues, Expenditures and Changes in Fund Balances – Nonmajor Governmental Funds ................................................................................................... 45 Combining Balance Sheet – Nonmajor Special Revenue Funds........................................................ 46 – 49 Statement of Revenues, Expenditures and Changes in Fund Balances – Nonmajor Special Revenue Funds ............................................................................................................................. 50 – 53 Supplemental Information – Schedule of Revenues, Expenditures and Changes in Fund Balances – Budget and Actual – Debt Service and Special Revenue Funds................................ 54 – 56
STATISTICAL SECTION Government Wide Expenses by Function – Last Seven Fiscal Years...................................................... 57 Government Wide Revenues – Last Seven Fiscal Years.......................................................................... 58 General Governmental Expenditures by Function – Last Seven Fiscal Years ......................................... 59 General Government Revenues by Source – Last Seven Fiscal Years..................................................... 60 Primary Property Tax Levies and Collections.......................................................................................... 61 Assessed and Estimated Actual Value of Property – Last Seven Fiscal Years ........................................ 62 Property Tax Rates – Direct and Overlapping Governments – Last Seven Fiscal Years......................... 63 Principal Taxpayers .................................................................................................................................. 64 Computation of Legal Debt Margin 6%................................................................................................... 65 Computation of Legal Debt Margin 20%................................................................................................. 65 Ratio of Net General Obligation Bonded Debt to Assessed Value and Net General Obligation Bonded Debt per Capita – Last Seven Fiscal Years ........................................................................... 66 Ratio of Annual Debt Service Expenditures for General Obligation Bonded Debt to Total General Governmental Expenditures – Last Seven Fiscal Years ....................................................... 67 Computation of Direct and Overlapping Bonded Debt – General Obligation Bonds .............................. 68 Property Value, Construction and Bank Deposits – Last Seven Fiscal Years.......................................... 69 Miscellaneous Statistics............................................................................................................................ 70 Demographic Statistics per 2000 Census ................................................................................................. 71

INTRODUCTORY
SECTION


-iii-
October 31, 2003 To the Honorable Mayor, Members of the City Council, and Citizens of the City of Surprise: State law requires that all general-purpose local governments publish within 120 days (240 days with an extension) following the close of each fiscal year, a complete set of financial statements presented in conformity with generally accepted accounting principles (GAAP) and audited in accordance with generally accepted auditing standards (GAAS) by a firm of licensed certified public accountants. Pursuant to that requirement, we hereby issue the comprehensive annual financial report of the City of Surprise for the fiscal year ended June 30, 2003. This report consists of management’s representations concerning the finances of the City of Surprise. Responsibility for the accuracy, completeness and fairness of this presentation, the data and all disclosures is the responsibility of the City of Surprise. We believe that the data, as presented, is accurate in all material aspects; that it is presented in a manner that fairly sets forth the financial position and results of the operations of the City of Surprise as measured by the financial activity of its various funds, and that all disclosures necessary to understand the City’s financial affairs to its fullest have been included. To provide a reasonable basis for making these representations, management of the City of Surprise has established a comprehensive internal control framework that is designed both to protect the government’s assets from loss, theft or misuse and to compile sufficient reliable information for the operation of the City of Surprise’s financial statements in conformity with GAAP. Because the cost of internal controls should not outweigh the benefits, the City of Surprise’s comprehensive framework of internal controls has been designed to provide reasonable rather than absolute assurance that the financial statements will be free from material misstatement. As management, we assert that, to the best of our knowledge and belief, this financial report is complete and reliable in all material respects. Eide Bailly LLP, a firm of licensed certified public accountants, has audited the City of Surprise’s financial statements. The goal of the independent audit was to provide reasonable assurance, that the financial statements of the City of Surprise for the fiscal year ended June 30, 2003, are free of material misstatement. The independent audit involved examining, on a test basis, evidence supporting the amounts and disclosures in the financial statements, assessing the accounting principles used and significant estimates made by management and evaluating the overall financial statement presentation. The independent auditor concluded, based upon the audit, that there was a reasonable basis for rendering an unqualified opinion that the City of Surprise’s financial statements for the fiscal year ended June 30, 2003, are fairly presented in conformity with GAAP. The independent auditor’s report is presented as the first component of the financial section of this report. GAAP requires management to provide a narrative introduction, overview and analysis to accompany the basic financial statements in the form of Management’s Discussion and Analysis (MD&A). This letter of transmittal is designed to complement MD&A and should be read in conjunction with it. The City of Surprise’s MD&A can be found immediately following the report of the independent auditors.

-iv-
Profile of the City of Surprise Surprise, located just 25 minutes west of downtown Phoenix along U.S. Route 60/State Highway 93, was founded in 1929 and incorporated in 1960. The name “Surprise” came from Surprise, Nebraska, hometown of the city’s founder, Homer C. Ludden. What was once a small farming village now encompasses more than 70 square miles, including urban and commercial developments, ranches and industrial parks. The once irrigated farmlands and orchards are now affordable real estate for people and industry that wish to live, work and play in a progressive city. Surprise strikes the perfect balance between the need of residential community and the growth of its business and industrial sections. Over the past 40 years, Surprise has grown from 500 residents to a city of nearly 67,000 people in 2003. The Maricopa Association of Governments (MAG), estimates that our population will continue to grow to near 100,000 in the next 3 – 5 years. Not only is our population growing, our service area has expanded from 1.67 square miles in 1980 to our current incorporated area of 74 square miles with a planning area of 228 square miles. This growth is due in large part to what we are providing and building in our community. The city offers a broad range of living styles, from small family subdivisions to a number of secluded ranches. Surprise also offers a number of retirement communities that address the needs and lifestyles of active adults. There are a number of recreation facilities including several beautiful golf courses. In 2003, the City of Surprise became the Major League Baseball Spring Training home of the Texas Rangers and the Kansas City Royals. Industrial growth zones have been carefully selected to operate competitively, but harmoniously, with the residential community.
The City’s Mission and Value Statements are as follows: Mission
The mission of the City of Surprise is to enhance the quality of life through the dedicated and efficient management of our resources.
We Value Our Citizens
Honesty and Integrity Community Pride and Sense of Commitment
Professionalism and Teamwork Mutual Respect
Surprise is a city that operates under the Council/Manager form of government. Policy-making and legislative authority are vested in a governing council consisting of the mayor and six other members. The governing council is responsible, among other things, for passing ordinances, adopting the budget, appointing committees and hiring the City Manager. The City Manager is responsible for carrying out the policies and ordinances of the governing council, for overseeing the day-to-day operations of the City, and for appointing the heads of the various departments. The council is elected on a non-partisan basis. Council members serve four year staggered terms, with three then four elected alternately every two years. The mayor is elected at large every four years, while the other council members are elected by district. The City of Surprise provides a full range of services, including police and fire protection, roadway maintenance and construction, recreational and cultural activities, health and social services, as well as, general administrative services. Sanitation, water, sewer and water recharge utility services are provided to many of the residents through the City’s enterprise funds. The City provides street lighting for developing areas through legally formed street lighting districts. The City provides and accounts for a legally separate fund volunteer firefighters pension fund as mandated by Arizona Revised Statute, Title 9.

-v-
As well as, a non-profit corporation formed under Arizona revised statutes Title 10 designed to facilitate the acquisition and improvement of City property. These last three activities essentially function as departments within the City and have been included as an integral part of the City’s financial statements. Additional information on all three of these legally separate entities can be found in Note 1.A in the notes to the financial statements. The annual budget serves as the foundation for the City of Surprise’s financial planning and control. The required legal level of budgetary compliance is at the over all City wide level. For financial management purposes all departments within the City of Surprise are required to submit requests for appropriation to the budget manager before the end of February of the preceding fiscal year. The City’s budget team, chief financial officer and city manager use these requests as the starting point for developing a proposed budget. The budget manager then presents this proposed budget to the council for review by the beginning of May. The City Council is then required to hold public hearings on the proposed budget and to adopt a final budget by the third Monday in August. The appropriated budget is prepared by fund and department. Department heads may make transfers of appropriations within a department between the major categories of services and supplies. While the city manager may authorize transfers from and within personnel and from operating capital to services or supplies within a department, all transfers between contingency dollars, between funds and between departments must be approved by the Council. Factors Affecting Financial Condition The information presented in the financial statements is perhaps best understood when it is considered from the broader perspective of the specific environment within which the City of Surprise operates. Local economy. Despite the uncertain economic conditions of the nation and slower growth of the State's economy, the City’s economy is doing relatively well. As a City on the fringe of a well-developed metropolitan area, our housing market continues to steam ahead. Due to the rapid residential growth in the City, extensive retail and office development continues to follow the rooftops. It is this business development that will provide the city with a reliable, long term, source of revenue. Further information on the history of City revenues can be found in the statistical section of this Comprehensive Annual Financial Report (CAFR) and in the Management’s Discussion and Analysis (MD&A) of the financial
statements. Long-term financial planning. During the coming year, we are faced with the challenge to accommodate growth while ensuring that the City develops as a place in which people want to live, work and play. Increases in population, tax base, development fees, commercial and retail activity and the City’s economic development efforts continue to provide additional revenue to offset the costs related to both continuing and expanding services and facilities. Because of the current economic uncertainty on the national level and local level, the City administration recognizes the need to assure reserves for future revenue shortfalls in case of economic downturns.

-vi-
Because a large portion of General Fund, operating revenue comes from construction related activity that eventually may be constrained by the economy and availability of land the following policy guidelines have been devised to assist in assuring an adequate future fund balance:
1. The equivalent of two months in operating revenue will be designated as an economic stabilization amount set-aside in all operating funds;
2. An allocation of construction related sales tax of 50 percent (50%) to subsidize general fund operations and of 50 percent (50%) to subsidize one-time expenditures and capital construction and acquisition; and,
3. Maintain a minimum debt service reserved fund balance equal to one year of debt service payments.
These amounts have not been programmed for expenditure and are only available for use within the confines of our expenditure limits. At least $15.3 million ($15,300,000) has been listed as contingency in various funds, which means that it has not been allocated for any specific activity. If revenues are sufficient, council can use this contingency for unexpected emergencies and projects. In addition, beginning fund balances (prior years’ revenues in excess of expenditures) are only available to fund capital or other one-time projects.
The City is finalizing facilities and infrastructure that have been planned, programmed and saved for over the past five years. Utilizing bond funds, state grants and local sources of revenue, the City of Surprise has spearheaded construction on a new downtown by developing 250 acres of city owned property. This new downtown, known as Surprise Center, includes a recreation complex, regional library, aquatics center, 37-acre park and a state of the art Cactus League Spring Training facility for the Texas Rangers and the Kansas City Royals. Cash management policies and practices. State statutes permit us to invest in obligations of the U.S. Treasury, commercial paper, corporate bonds, repurchase agreements and the State Treasurer’s Local Government Investment Pool (LGIP). The City of Surprise primarily invests its idle funds in the State Treasurer’s LGIP. The year-to-date yield on investments as of June 30, 2003 was 1.8719 percent (1.8719%) before LGIP adjustment (see note 13 on page 37). Investment income includes appreciation in the fair value of investments. Increases in fair value during the current year; however, do not necessarily represent trends that will continue; nor is it always possible to realize such amounts, especially in the case of temporary changes in the fair value of investments that the managers of the investment pool may intend to hold to maturity. Risk management. During 2003, the City increased its coverage from 13 million to 20 million dollars to address the growth and related increase in exposure. As the City grows it will continue to increase its deductibles and effectively self-insure for smaller claims. In order to better manage our insurance coverage and claims, a risk coordinator was hired. They will ensure that the City has adequate insurance coverage, appropriate deductibles, reasonable insurance rates, validate claims, file claims timely and provide for proper training in loss and accident prevention. They will also update and maintain the proper policies and procedures related to insurance and other risk related exposures. For further information regarding risk management please refer to Note 12 on page 37 in the financial statements. Pensions. The City has several venues available to employees to provide for them during retirement. The City participates in the Arizona Retirement System and the Arizona Public Safety Retirement System. Both of these state agency plans are offered to state and local governments statewide and funded by employee wage deductions and matching City contributions. The rates for these contributions are determined by the respective retirement systems, in order to ensure the proper amount of funding to meet the obligations to retired employees on a timely basis.

The City also must maintain a pension and relief fund for volunteer firefighters that was funded by the City as required under Title 9 of the Arizona Revised Statutes. However, the City no longer utilizes volunteer firefighters and there are no qualifying recipients for the funds contained in the plan. The City has selected a third party administrator to facilitate employee participation in a deferred compensation plan in accordance with Internal Revenue Code Section 457. For further information on these plans refer to Note 11 A.B.A.B.C. starting on page 34 in the financial statements. Awards and Acknowledgements The City of Surprise received the Government Finance Officers Associations (GFOA) Certificate of Achievement for Excellence in Financial Reporting for our (CAFR) for the fiscal year ended June 30, 2002. This was our first submission for the award. The award is equally satisfying in that we early implemented the new requirements of Government Accounting Standards Board (GASB) statement number 34. In order to qualify for the award, the document must be easily readable, efficiently organized and compliant with GAAP and applicable legal requirements. The City of Surprise has received the GFOA’s Distinguished Budget Presentation Award for its annual budget document since July 1, 2001. In order to qualify for the Distinguished Budget Presentation Award, the government’s budget document was judged to be proficient in several categories, including as a policy document, a financial plan, an operations guide and a communications device. The preparation of this report would not have been possible without the efficient and dedicated services of the entire staff of the finance department. We would like to express our appreciation to all members of the finance and other departments, who assisted and contributed to the preparation of this report. Respectfully submitted,
James Rumpeltes Robert Nilles City Manager Chief Financial Officer
-vii-

-viii-

CITY OF SURPRISE ORGANIZATIONAL CHART
Inter-GovernmentalRelations
City Attorney* City Clerk*
Information TechnologyGeographic InformationSystems (GIS)
InformationSystems
HumanResources
FirePoliceMunicipal Court*
Public Safety
AdministrationAccountingManagement& BudgetPurchasing &Materials ManagementRisk ManagementTax Auditing
Finance
AdministrativeServices
StreetsBuilding MaintenanceSanitationVehicle MaintenanceEngineeringTraffic Engineering
Public Works
AdministrationNeighborhood ServicesSenior ServicesDial-a-RideCommunity Services
CommunityInitiatives
AdministrationComplexAquaticsSpecial EventsParks MaintenanceRecreationCommunity PromotionsPublic Information Office
Parks, Recreation& Library
Water ReplenishmentWater EnterpriseSewer Enterprise
Water Services
AdministrationPlanning & ZoningBuilding SafetyEconomic Development
CommunityDevelopment
Field Services
City Manager*
Mayor & Council
Citizens of Surprise
*Council Appointed

-x-
CITY OF SURPRISE LIST OF ELECTED AND APPOINTED OFFICIALS
JUNE 30, 2003
ELECTED OFFICIALS
MAYOR JOAN H. SHAFER
Joan Shafer was born in Sacramento, Calif., a third-generation Californian. She was educated in California public schools before attending the University of Nevada at Reno.
After attending college she joined the U.S. Navy serving with the WAVES in Norfolk, VA. She is a veteran of the Korean War. After getting married Mrs. Shafer worked as a medical record librarian at several hospitals in the Valley of the Sun before retiring in 1986.
Mrs. Shafer began her political career in 1991 when she was the first woman to be elected to the Surprise City Council. She later was elected vice mayor. In 1994 she became the first elected mayor of the City of Surprise. In 1997, Mrs. Shafer was re-elected to a second two-year term as mayor and she was re-elected to four-year terms in 1999 and 2003. Her current term expires in June 2007.
Since being elected Mayor, Mrs. Shafer has helped guide the city through a period of unparalleled growth and development. During the past three years, the City of Surprise has been the fastest growing city in the state and one of the fastest growing cities in the nation. When Mrs. Shafer began her first term the city had about 70 employees, today the city staff numbers more than 450. In 2003, Surprise is home to approximately 55,000 residents.
Shafer’s term expires in June 2007. She is elected at-large.
DONALD COX
Vice Mayor Don Cox, who represents the Acacia District (District 1), was elected to the Surprise City Council in 2001. Don and his wife have lived in Surprise since 1997. He has four grown children and 10 grandchildren, all living in the Midwest.
Cox retired from the federal government in electronics from Alaska. He was a City Council member in Delta Junction, Alaska, where he was also Commissioner of Public Health and Safety and, such, was responsible for the fire department and emergency medical service for that community. He is a Korean vet, having served in the U.S. Navy.
Cox has been a community volunteer for all of his adult life, working with youth and adults. He is pleased to be able to use his experience to help the people of Surprise. Cox strongly supports voters’ rights and gathering their input on areas that affect their future. Truly representing the people is his goal.
Cox is very interested in preserving the rural aspects of Surprise because of his background, living for many years in rural areas in Minnesota and Alaska. He is also concerned about the population growing faster than the road system and bringing public transportation to residents. He supports city efforts in working to protect Luke Air Force Base.
Contact: [email protected]
Cox’s term expires in June 2005.

-xi-
CITY OF SURPRISE LIST OF ELECTED AND APPOINTED OFFICIALS
JUNE 30, 2003
ELECTED OFFICIALS (CONTINUED)
THOMAS ALLEN
Thomas Allen, who represents the Palo Verde District (District 6), was appointed to the Surprise City Council in May 1999, and elected to his first four-year term in March 2001.
Allen, who is employed as the Director of Operations for Aerotech Laboratories, is married and has two children. Allen has bachelor’s degrees in microbiology and business administration from Brigham Young University, Utah. The Phoenix native is also fluent in Spanish.
"The City of Surprise is where my growing family has decided to live," Allen said. "I feel that the good work of the past will only continue with the efforts of people who have a vested interest in seeing Surprise grow successfully. I feel that I have a responsibility to apply my efforts to assisting in this growth." Allen said he is particularly interested in trying to attract industry to the City of Surprise. "I hope we can attract good, clean industry to our City. We want and need good jobs here."
Contact: [email protected]
Allen’s term expires in June 2005.
GARY “DOC” SULLIVAN
Gary “Doc” Sullivan, representative of the Mesquite District (District 3), was elected to his first four-year term on the Surprise City Council in May 2003.
Sullivan moved to Surprise in June of 2001 from San Diego, California where the avid bowler traded a years-long career in the mortgage business for a 10-year stint managing bowling alleys for AMF. Back in the mortgage trade again, he currently works for Goldstar Mortgage in Scottsdale.
A resident of Greenway Parc II, Sullivan quickly became involved in the community. He is a member of the Greenway Parc homeowners’ association and architectural review committee, the Surprise Economic Development Advisory Board and Future Focus II, a group formed to provide direction on implementation of the City’s general plan.
He supports Luke Air Force Base and its mission. “We must stop encroachment on Luke,” said Sullivan, who witnessed first-hand the impact of the Gulf War on military towns in California. “If Luke closes, it could be catastrophic for local businesses.” He is also concerned about education and the maintenance of City streets.
Sullivan and his wife, Stephanie, have been married for 30 years and have two grown sons. For the time-being, he’s putting his bowling hobby on hold to devote the time to City business. He wants residents to know he welcomes their input and he will return phone calls.
Contact: [email protected]
Sullivan’s term expires in June 2007.

-xii-
CITY OF SURPRISE LIST OF ELECTED AND APPOINTED OFFICIALS
JUNE 30, 2003
ELECTED OFFICIALS (CONTINUED)
MARTHA BAILS
Martha Bails, who represents the Cottonwood District (2), began her first four-year term on the Surprise City Council in June 2003.
Bails moved to Surprise in 1999 from Hawthorne, California where she spent 33 years working for Rockwell International, retiring in 1996 from her job as an executive planning advisor responsible for the design and maintenance of procurement systems. She also served as a member of the Hawthorne City Council from 1994-96.
A resident of Sun City Grand, Bails quickly became involved in her new community, volunteering one day a week in the emergency room of nearby Del E. Webb Memorial Hospital, collecting stuffed animals for the Surprise Police and Fire departments through the Sun City Grand Singles Club, and finally, landing an appointment to the Surprise Planning and Zoning Commission in April 2000, most recently serving as chairperson of the seven-member group. “I like to participate and be active, rather than sit there and be a number,” she said. “I’ve always been interested in politics, budgets and spending – where the taxpayer’s money goes.”
Bails supports low density development for Surprise and her primary goal as a councilmember is to help the City Council and/or voters determine the City’s growth rate. “I would also like the City to rethink its position of no more senior communities because of the demands on the school district, and particularly in light of Luke Air Force Base’s position that no new schools be built in the flight path,” she said. Bails also supports lowering the “restaurant” tax and is concerned about transportation issues.
She wants residents to know they can call anytime. “I respect everyone’s opinion and hopefully they respect mine even though we might not agree,” Bails said. “Although I represent a district, the decisions I make impact the entire City.” Bails has one grown son and, in her spare time, enjoys traveling and needlepoint.
Contact: [email protected]
Bail’s term expires in June 2007.
DANIEL ARISMENDEZ
Danny Arismendez was elected in 2003 to a four-year term as the representative of the Mulberry District (District 4). He previously served on the City Council from 1989 to 1995 when all members were elected at-large.
A life-long resident of the area, Arismendez owns Sun Cities Appliance in El Mirage. He has owned the business since 1979. “I’m grateful and thankful for a second opportunity to serve the residents of Surprise, and especially the Original Townsite,” he said. “There are a lot of things I didn’t get done the first time around. I can do a good
job. I can make a difference.” As a resident of the City’s Original Townsite, Arismendez’ mission for the Original Townsite includes building a public swimming pool and holding Town Hall meetings twice a year.

-xiii-
CITY OF SURPRISE LIST OF ELECTED AND APPOINTED OFFICIALS
JUNE 30, 2003
ELECTED OFFICIALS (CONTINUED
Arismendez and his wife, Becky, have six children and three grandchildren. His favorite pastime is playing golf, however, he also enjoys watching the Phoenix Suns, Diamondbacks, Arizona Cardinals, ASU football and Cactus League baseball games in Surprise. He also enjoys spending time with his grandchildren.
Contact: [email protected]
Arismendez's term expires in June 2007.
BOB VUKANOVICH
A native of the Valley of the Sun, Bob Vukanovich is a first term councilman representing the Palm District (District 5). He was elected in March 2001.
Vukanovich grew up in Chandler and served in the Coast Guard during World War II. He worked as a building inspector for Los Angeles County in the 1950s and later opened his own contracting business. In the 1970s, he expanded his operations to Arizona and eventually moved back, buying a piece of property near Dysart and Grand, and in the 1980s, opened the Surprise Swap Meet as a hobby. The father of two and grandfather of four said he enjoys meeting people.
Among his goals as councilman are to see Surprise’s quality of life preserved in the face of rapid growth, and to ensure that City government remains responsive to residents’ needs. "We represent the citizens. We work for them," he said. "I’m a firm believer in ‘the buck stops here.’"
Vukanovich envisions a Surprise where residents respect and embrace the City’s various lifestyles – from resort retirement to family to rural agricultural - regardless of age or ethnic background. "I want Surprise to be a place citizens can be proud of," he said.
Contact: [email protected]
Vukanovich’s term expires in June 2005.
APPOINTED OFFICIALS
Manager Jim Rumpeltes
Clerk Sherry Aguilar
Attorney Jeffrey Blilie
Magistrate Paul Cragan


FINANCIAL
SECTION


INDEPENDENT AUDITOR’S REPORT
The Honorable Mayor and Members of the Council City of Surprise, Arizona Surprise, Arizona We have audited the accompanying financial statements of the governmental activities, the business-type activities, each major fund, and the aggregate fund information of the City of Surprise, Arizona, (the City) as of and for the year ended June 30, 2003, which collectively comprise the City’s basic financial statements as listed in the table of contents. These financial statements are the responsibility of the City of Surprise, Arizona management. Our responsibility is to express an opinion on these basic financial statements based on our audit. We conducted our audit in accordance with auditing standards generally accepted in the United States of America and the standards applicable to financial audits contained in Governmental Auditing Standards, issued by the Comptroller General of the United States. Those standards require that we plan and perform the audit to obtain reasonable assurance about whether the financial statements are free of material misstatement. An audit includes examining, on a test basis, evidence supporting the amounts and disclosures in the financial statements. An audit also includes assessing the accounting principles used and significant estimates made by management, as well as evaluating the overall financial statement presentation. We believe that our audit provides a reasonable basis for our opinion. In our opinion, the financial statements referred to above present fairly, in all material respects, the respective financial position of the governmental activities, the business-type activities, each major fund, and the aggregate remaining fund information of the City of Surprise, Arizona, at June 30, 2003, and the respective changes in financial position and cash flows, where applicable, for the year then ended, in conformity with accounting principles generally accepted in the United States of America. In accordance with Government Auditing Standards, we have also issued a report dated August 26, 2003 on our consideration of the City of Surprise, Arizona’s internal control over financial reporting and our test of its compliance with certain provisions of laws, regulations, contracts and grants. That report is an integral part of an audit performed in accordance with Government Auditing Standards and should be read in conjunction with this report in considering the results of our audit. The Management’s Discussion and Analysis and the budgetary information on pages 3-11 and pages 40-43, respectively, are not a required part of the basic financial statements but are supplementary information required by the Governmental Accounting Standards Board. We have applied certain limited procedures, which consisted principally of inquires of management regarding the methods of measurement and presentation of the supplementary information. However, we did not audit the information and express no opinion on it.

-2-
Our audit was conducted for the purpose of forming opinions on the financial statements that collectively comprise the City’s basic financial statements and on the combining and individual fund statements. The accompanying introductory section, other supplementary information and statistical tables are presented for purposes of additional analysis and are not a required part of the basic financial statements. Such information has not been subjected to the auditing procedures applied in the audit of the basic financial statements and, accordingly, we express no opinion on them.
Phoenix, Arizona August 26, 2003

-3-
MANAGEMENT’S DISCUSSION AND ANALYSIS We (The City of Surprise) are pleased to provide an overview of our financial activities for the fiscal year ended June 30, 2003. The intended purpose of the Management Discussion and Analysis (MD&A) is to provide an introduction to the basic financial statements and notes, that provides an objective and easy to read analysis of our financial activities based on currently known facts, decisions, and conditions, by providing an easily readable summary of operating results and reasons for changes, which will help to determine if our financial position improved or deteriorated over the past year. This report addresses current operational activities, the sources, uses, and changes in resources, adherence to budget, service levels, limitations, significant economic factors, and the status of infrastructure and its impacts on our debt and operation.
Please read this analysis in conjunction with our letter of transmittal. FINANCIAL HIGHLIGHTS
Our Governmental Type net assets increased 43% from $75.9 million to $108.6 million
a difference of $32.7 million. o The increase in Governmental Activity Capital Assets $31.9 million and reduced
liabilities of $35.4 offset the $34.6 million decrease in Current & Other Assets. o The $32.7 million excess of revenues ($73.8 million, $91.3 revenue - $17.5, net
transfers) over expenditures ($41.1 million) was due primarily to Parks grants of $28.7 million.
Business Type net assets increased 40% from $75.7 million to $106.2 million a difference of $30.5 million.
o In September 2002 Sewer and Sanitation rates were increased, for year two of a three-year rate increase program, intended to eliminate subsidies from the General Fund. These rate increases coupled with approximately a 20% population growth resulted in a $7.2 million dollar increase in current assets over liabilities.
o Capital assets (net) increased $23.3 million dollars. Governmental Activities Expenses of $41.1 million were exceeded by Program
Revenues of $61.3 million a difference of $20.2 million in fiscal year 2003. o Operating & Capital Grants & Contributions accounted for $44.5 million. o Charges for Services ($16.8 million) covered approximately 41% of expenses
($41.1 million). o We rely upon General revenues, such as taxes, to subsidize operating expenses.
General revenues after transfers were $12.5 million ($30 revenue - $17.5 net transfers).
Business Type Expenses were $9.4 million while program revenues, including development fees, were $22.6 million.
o The addition of General Revenues, including transfers, of $17.5 million increases the change in net assets from $13.2 million to $30.7 million.
o All four Business type activities reported increases in net assets. Component units – The City includes three types of separate legal entities in its report –
the City of Surprise Voluntary Firefighters Pension and Relief Fund, the Surprise Municipal Property Corporation, and Various Street Lighting Improvement Districts. Although legally separate, these “component units” are important because the City is accountable for reporting on them. A description of these three types of component units is available in Note 1 on page 23. These three types of entities do not issue separate Financial Statements.

-4-
USING THIS ANNUAL REPORT This annual report consists of a series of financial statements. The Statement of Net Assets and the Statement of Activities (on pages 12 and 13) provide information about the activities of the City as a whole and present a longer-term view of the City’s finances. Fund financial statements start on page 14. For governmental activities, these statements tell how these services were financed in the short term as well as what remains for future spending. Fund financial statements also report the City’s operations in more detail than the government-wide statements by providing information about the City’s most significant funds. The remaining statements provide financial information about activities for which the City acts solely as a trustee or agent for the benefit of those outside of the government.
Reporting the City as a Whole Our analysis of the City as a whole begins on page 12. One of the most important questions asked about the City’s finances is, “is the City as a whole better off or worse off as a result of the year’s activities?” The Statement of Net Assets and the Statement of Activities report information about the City as a whole and about its activities in a way that helps answer this question. These statements include all assets and liabilities using the accrual basis of accounting, which is similar to the accounting used by most private-sector companies. All of the current year’s revenues and expenses are taken into account regardless of when cash is received or paid.
These two statements report the City’s net assets and changes in them. You can think of the City’s net assets – the difference between assets and liabilities – as one way to measure the City’s financial health, or financial position. Over time, increases or decreases in the City’s net assets are one indicator of whether its financial health is improving or deteriorating. You will need to consider other non-financial factors, however, such as changes in the City’s property tax base and the condition of the City’s roads, to assess the overall health of the City. In the Statement of Net Assets and the Statement of Activities, we divided the City into two kinds of activities:
Governmental activities – Most of the City’s basic services are reported here, including the police, fire, public works, parks & recreation departments, and general administration. Business type activities – The City charges a fee to customers to help it cover all or most
of the cost of certain services it provides. The City’s water, water replenishment, sewer, and sanitation systems are reported here.
Reporting the City’s Most Significant Funds Our analysis of the City’s major funds begins on page 14. The fund financial statements provide detailed information about the most significant funds – not the City as a whole. Some funds are required to be established by State law and by bond covenants. However, the City Council establishes many other funds to help it control and manage money for particular purposes or to show that it is meeting legal responsibilities for using certain taxes, grants, and other money. The City’s two kinds of funds – governmental and proprietary – use different accounting approaches.
Governmental Funds – Most of the City’s basic services are reported in governmental funds, which focus on how money flows into and out of those funds and the balances left at year-end that are available for spending. These funds are reported using an accounting method called modified accrual accounting, which measures cash and all other financial assets that can readily be converted to cash. The governmental fund statements provide a detailed short-term view of the City’s general governmental operations and the basic services it provides. Governmental fund information helps you determine whether there are more or fewer financial resources that can be spent in the near future to finance the City’s programs. We describe the relationship (or differences) between governmental

-5-
activities (reported in the Statement of Net Assets and the Statement of Activities) and governmental funds in the reconciliation at the bottom of the fund financial statements. Proprietary Funds – When the City charges customers for the services it provides –
whether to outside customers or to other units of the City – these services are generally reported in proprietary funds. Proprietary funds are reported in the same way that all activities are reported in the Statement of Net Assets and the Statement of Activities. In fact, the City’s enterprise funds (a component of proprietary funds) are the same as the business-type activities we report in the government-wide statements but provide more detail and additional information, such as cash flows, for proprietary funds. We use internal service funds (the other component of proprietary funds) to report activities that provide supplies and services for the City’s other programs and activities – such as the City’s Risk Management Fund.
The City as Trustee The City is the trustee, or fiduciary, for its City of Surprise Voluntary Firefighters Pension and Relief Fund. It is also responsible for other assets that – because of a trust arrangement – can be used only for the trust beneficiaries. All of the City’s fiduciary activities are reported in separate Statements of Fiduciary Net Assets and Changes in Fiduciary Net Assets on pages 21-22. We exclude these activities from the City’s other financial statements because the City cannot use these assets to finance its operations. They City's responsible for ensuring that the assets reported in these funds are used for their intended purposes. THE CITY AS A WHOLE The following table reflects the condensed Statement of Net Assets as of June 30, 2002 and June 30, 2003.
City of Surprise’s Net Assets (in millions)
Governmental
Activities Business-type
Activities Total Primary Government
2002 2003 2002 2003 2002 2003 Current and other assets 99.2 64.6 21.6 29.3 120.8 93.9 Capital assets 86.8 118.7 57.3 80.7 144.1 199.4 Total assets 186.0 183.3 78.9 110.0 264.9 293.3 Liabilities: Liabilities - except general obligations 44.5 11.8 3.2 3.7 47.7 15.5 General obligations: Due within one year 2.6 3.5 - - 2.6 3.5 Due within more than one year 63.0 59.4 - - 63.0 59.4 Total liabilities 110.1 74.7 3.2 3.7 113.3 78.4 Net assets: Invested in capital assets, net of related debt 21.3 55.7 57.3 80.6 78.6 136.3 Restricted 1.1 0.1 1.1 0.1 Unrestricted 53.5 52.8 18.4 25.7 71.9 78.5 Total net assets 75.9 108.6 75.7 106.3 151.6 214.9 Total liabilities and net assets 186.0 183.3 78.9 110.0 264.9 293.3 Our combined net assets increased by 42% from $151.6 million to $214.9 million a difference of $63.3 million.

-6-
93% of combined net assets ($214.9 million) are invested in Capital assets ($199.4 million). A more in depth analysis of this table shows that current assets ($93.9 million) exceed
total liabilities ($78.4 million) by $15.5 million, suggesting that all debts of the City of Surprise could be satisfied without having to sell off capital assets
Revenues for fiscal year end June 30, 2003 totaled $113.9 million.
Fiscal Year 2003 Revenue Sources
Charges for services
23%Sales taxes16%
Franchise taxes1%
Grants and contributions
51%
Property taxes3%
Grants and contributions unrestricted
5%
Other1%
Unrestricted investment earnings
0%
Our largest revenues in 2003 were Grants & Contributions (which included development
fees) at 51% and charges for services at 23%.
Sales Tax Collection - Construction, Retail & BBB
$0.0
$2.0
$4.0
$6.0
$8.0
$10.0
FY1998 FY1999 FY2000 FY2001 FY2002 FY2003
Mill
ions
0%10%20%30%40%50%60%70%
Construction
Retail Trade
Bed, Board &Booze
This graph shows that Construction sales tax accounts for almost 50% of all sales taxes followed by Retail taxes and Hotel-Restaurant-Bar (BBB) taxes. Unrestricted Investment Earnings for 2003 were a negative 0.4 million. This was due to
a write down of investments due to a loss from the Local Government Investment Pool (LGIP) of $1.6 million. For additional information please see Note 13 on page 37.

-7-
Fiscal Year 2003 Functional Expenses
Business-type activities
19%
General Government
14%
Public Safety25%
Public works and streets
12%
Community Services
5%
Culture and recreation
17%
Cost of sales and services (SLD's)
1%
Interest on long-term debt
7%Administrative
>1%
Expenses (excluding transfers & capital outlays) were $50.5 million in 2003.
Public Safety (Police, Fire, & Courts) accounted for approximately 25% of program expenditures ($12.4 million). Business Activities (Water, Sewer, Replenishment, & Sanitation) were second with 19%
($9.4 million). Culture & Recreation (Parks & Recreation) was at 17% ($8.8 million). General Government was next at 14% ($7.1 million). Public Works & Streets rounds out the top five at 12% ($6.1 million) All others make up 13% ($6.7 million).

-8-
City of Surprise’s Changes in Net Assets (in millions)
Governmental
Activities Business-type
Activities Total Primary Government
2002 2003 2002 2003 2002 2003 REVENUES Program Revenues: Charges for service 12.3 16.8 14.8 9.9 27.1 26.7 Grants and contributions 8.9 44.5 6.4 12.9 15.3 57.4 General revenues: Property taxes 2.6 3.0 - 2.6 3.0 Sales taxes 21.9 18.7 - 21.9 18.7 Franchise taxes 1.3 1.5 - 1.3 1.5 Grants and contributions unrestricted 3.4 5.9 - 3.4 5.9 Unrestricted investment earnings 2.1 (0.2) 0.4 (0.2) 2.5 (0.4) Other 1.4 1.1 - - 1.4 1.1 Total revenues 53.9 91.3 21.6 22.6 75.5 113.9 EXPENSES Program activities: Governmental activities: General Government 5.6 7.1 - - 5.6 7.1 Public Safety 10.6 12.4 - - 10.6 12.4 Public works and streets 6.4 6.1 - - 6.4 6.1 Community Services 2.3 2.8 - - 2.3 2.8 Culture and recreation 6.0 8.8 - - 6.0 8.8 Cost of sales and services (SLD's) 0.3 0.4 - - 0.3 0.4 Interest on long-term debt 5.0 3.4 - - 5.0 3.4 Administrative 0.5 0.1 - - 0.5 0.1 Business-type activities: - - Water utility - - 1.8 2.5 1.8 2.5 Replenishment - - 0.1 0.3 0.1 0.3 Sewer - - 5.7 5.3 5.7 5.3 Sanitation utility - - 1.2 1.3 1.2 1.3 Total expenses 36.7 41.1 8.8 9.4 45.5 50.5 Excess before transfers 17.2 50.2 12.8 13.2 30.0 63.4 Transfers in (out) (2.5) (17.5) 2.5 17.5 - - Increase in net assets 14.7 32.7 15.3 30.7 30.0 63.4
-9-
$0
$5,000,000
$10,000,000
$15,000,000
$20,000,000
$25,000,000
$30,000,000
$35,000,000
$40,000,000
Gene
ral G
over
nmen
t
Publ
ic Sa
fety
Publ
ic wo
rks a
nd st
reets
Com
mun
ity S
ervi
ces
Cultu
re an
d rec
reati
on
Cost
of sa
les an
d ser
vice
s (SL
D's) Ot
her
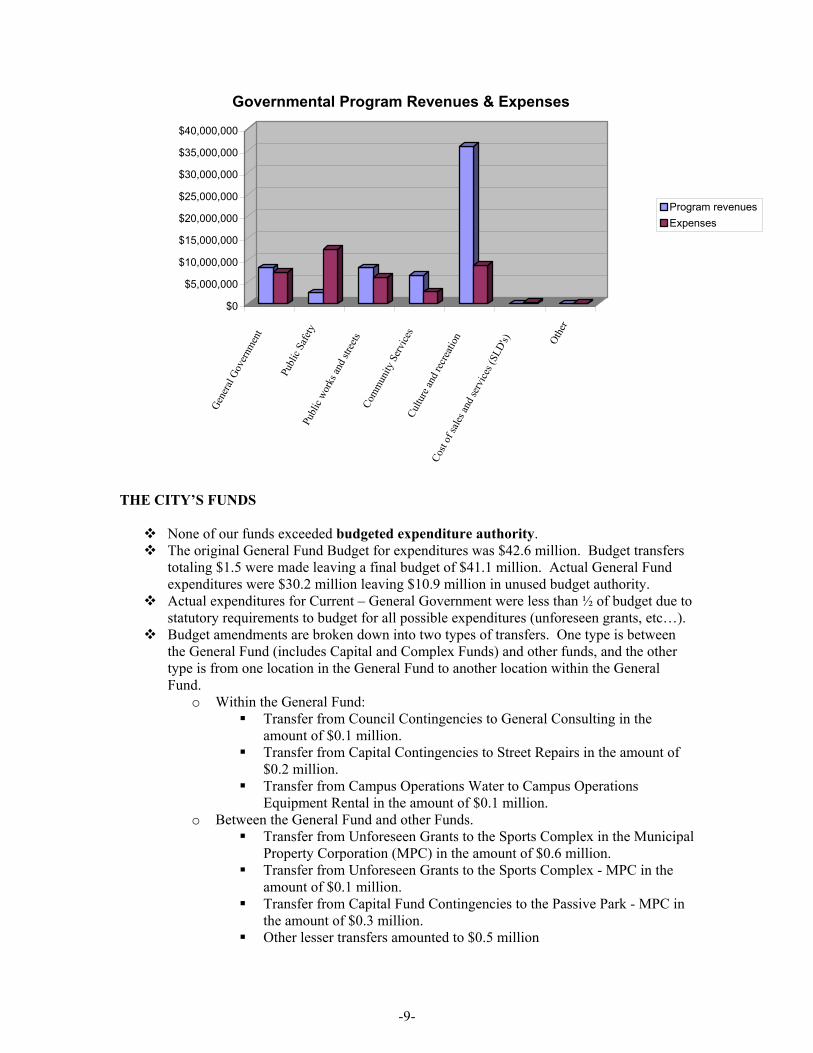
Governmental Program Revenues & Expenses
Program revenuesExpenses
THE CITY’S FUNDS
None of our funds exceeded budgeted expenditure authority. The original General Fund Budget for expenditures was $42.6 million. Budget transfers
totaling $1.5 were made leaving a final budget of $41.1 million. Actual General Fund expenditures were $30.2 million leaving $10.9 million in unused budget authority. Actual expenditures for Current – General Government were less than ½ of budget due to
statutory requirements to budget for all possible expenditures (unforeseen grants, etc…). Budget amendments are broken down into two types of transfers. One type is between
the General Fund (includes Capital and Complex Funds) and other funds, and the other type is from one location in the General Fund to another location within the General Fund.
o Within the General Fund: Transfer from Council Contingencies to General Consulting in the
amount of $0.1 million. Transfer from Capital Contingencies to Street Repairs in the amount of
$0.2 million. Transfer from Campus Operations Water to Campus Operations
Equipment Rental in the amount of $0.1 million. o Between the General Fund and other Funds.
Transfer from Unforeseen Grants to the Sports Complex in the Municipal Property Corporation (MPC) in the amount of $0.6 million.
Transfer from Unforeseen Grants to the Sports Complex - MPC in the amount of $0.1 million.
Transfer from Capital Fund Contingencies to the Passive Park - MPC in the amount of $0.3 million.
Other lesser transfers amounted to $0.5 million

-10-
CAPITAL ASSET AND DEBT ADMINISTRATION
Capital Assets at Year - End (Net of Depreciation)
(in millions)
General
Government Business-type
Activities Total Primary Government
2002 2003 2002 2003 2002 2003 Land $ 0.6 $ 0.6 $ 3.1 $ 3.1 $ 3.7 $ 3.7 Parks Land 5.1 5.1 5.1 5.1 Buildings & Improvements 10.2 61.4 10.2 61.4 Equipment & Vehicles 3.8 4.5 0.6 0.9 4.4 5.4 Streets 21.3 23.2 21.3 23.2 Curb Gutter & Sidewalks 17.7 19.7 17.7 19.7 Traffic Signals 0.8 1.0 0.8 1.0 Storm Drains 2.9 3.2 2.9 3.2 Other Infrastructure - - Sewer System 41.6 42.8 41.6 42.8 Water System 7.8 8.5 7.8 8.5 Construction in Progress 24.4 - 4.1 25.4 28.5 25.4 Total Capital Assets (Net) $86.8 $118.7 $57.2 $80.7 $144.0 $199.4
The capital assets of the governmental activities funds increased by $31.9 million net of annual depreciation ($34.3 million before depreciation).
o We substantially completed the construction of a $77 million government center known as Surprise Center. This facility includes:
$50 million Spring Training Facility/Stadium for the Texas Rangers and Kansas City Royals,
$4 million aquatics center, $1 million Recreation Center, $4 million 23,000 square foot library, $4 million 37 acre park with a 5 acre lake $14 million in furniture, fixtures, equipment, and infrastructure for the
facilities listed above and the County Court Facility built in the government center.
The capital assets of the business-type activities funds increased by $23.4 million net of annual depreciation ($24.9 million before depreciation).
o We are in the process of constructing a $25 million sewer plant expansion intended to increase daily treatment from the current 3.2 million gallons per day (mgd) to 7.2 mgd. This project should be completed by December 2003.
o There are water supply facilities being constructed by developers, which will be dedicated to the City upon completion, as they are the property of the Developer until dedicated to the City they are not shown as construction in progress.
For more detailed information on Capital Assets see Note 5 on page 29 of this report. Long-term debt decreased this year from $66.5 million to less than $64 million. Greater
detail of outstanding Long-term debt can be found in Note 7 on page 32. o $2.6 million in debt was retired during the year, reducing long-term debt o $0.2 million in compensated employee absences was added to long-term debt.

-11-
ECONOMIC FACTORS, NEXT YEAR’S BUDGET, AND RATES
Bond rating – This Spring our General Obligation and Municipal Property Corporation bond rates were increased from A/-A to +A/A.
City of Surprise, AZ Secondary Tax Rate
1990 - 2004
$0.09
$0.73
$1.30
$1.62
$1.28
$0.22$0.18 $0.25$0.44
$0.63
$0.94
$0.94
$1.76$1.54
$0.15
$0.00
$0.50
$1.00
$1.50
$2.00
1990 1992 1994 1996 1998 2000 2002 2004
Secondary Property Tax Rate – The 2003-2004 rate decreased by $0.03 from the
previous year. The reason for the decrease was due to a +50% increase in Secondary Assessed Valuation (from $229.7 million to $352.0 million). The above graph shows that over the last ten years the rate has dropped steadily from $1.76 to $0.22. Spring Training – March 1, 2003 marked the first ever Spring Training Game held in
the City of Surprise. We attracted the Texas Rangers and Kansas City Royals to Surprise from Florida by agreeing to build a new state of the art two-team facility.
o A $32 million grant from the Tourism Sports Authority (TSA) has made this project successful.
FINANCIAL CONTACT The financial report is designed to provide a general overview of the City of Surprise, Arizona’s finances and to demonstrate accountability for the use of public funds. Questions about any of the information provided in this report, or requests for additional financial information should be addressed to the City’s Chief Financial Officer at the following address: 12425 W. Bell Rd. Suite D-100, Surprise, Arizona 85374.


See Notes to Financial Statements -12-
CITY OF SURPRISE, ARIZONA STATEMENT OF NET ASSETS JUNE 30, 2003
Governmental Business-TypeASSETS Activities Activities Total
ASSETS Cash and cash equivalents 56,708,120$ 28,227,370$ 84,935,490$ Receivables, (net of allowances)
Interest 139,076 117,440 256,516 Taxes and franchise fees 821,765 - 821,765
Accounts 75,219 1,792,110 1,867,329 Due from (to) other funds 4,519,952 (4,519,952) -
Capital assets, net 118,691,177 80,646,084 199,337,261 Prepaid items 2,289,308 - 2,289,308 Other Assets 87,479 3,722,546 3,810,025
Total assets 183,332,096$ 109,985,598$ 293,317,694$
LIABILITIESAccounts payable 3,221,817$ 2,007,454$ 5,229,271$ Accrued payroll and related taxes 391,899 27,001 418,900 Deposits 6,720 438,296 445,016 Accrued interest payable 1,522,076 - 1,522,076 Deferred revenues 5,559,441 820,570 6,380,011 Contracts payable - 280,000 280,000 Other liabilities 32,056 - 32,056 Compensated absences payable 1,014,959 80,386 1,095,345 General obligation bonds payable:
Due within one year 3,533,830 - 3,533,830 Due within more than one year 59,412,469 - 59,412,469
Total liabilities 74,695,267 3,653,707 78,348,974
NET ASSETSInvested in capital assets, net of related debt 55,744,878 80,646,084 136,390,962 Restricted for: Debt service 127,420 - 127,420 Unrestricted 52,764,531 25,685,807 78,450,338
Total net assets 108,636,829 106,331,891 214,968,720
Total liabilities and net assets 183,332,096$ 109,985,598$ 293,317,694$
LIABILITIES AND NET ASSETS

See Notes to Financial Statements -13-
STATEMENT OF ACTIVITIESFOR THE YEAR ENDED JUNE 30, 2003
Operating Capital GrantsCharges for Grants and and Governmental Business-type
FUNCTIONS/PROGRAMS Expenses Services Contributions Contributions Activities Activities TotalGovernmental Activities
General government 7,123,534$ 133,663$ 8,796$ 8,088,616$ 1,107,541$ -$ 1,107,541$ Public safety 12,421,571 809,559 218,136 1,495,732 (9,898,144) - (9,898,144) Public works and streets 6,075,568 2,445,654 - 5,748,700 2,118,786 - 2,118,786 Community services 2,765,942 6,501,088 - - 3,735,146 - 3,735,146 Culture and recreation 8,814,719 6,938,081 245,346 28,742,803 27,111,511 - 27,111,511 Cost of sales and services (SLD's) 368,044 - - - (368,044) - (368,044) Administrative 138,464 - - - (138,464) - (138,464) Interest 3,439,953 - - - (3,439,953) - (3,439,953)
41,147,795 16,828,045 472,278 44,075,851 20,228,379 - 20,228,379
Business Type ActivitiesWater 2,520,676 2,402,258 - 2,979,592 - 2,861,174 2,861,174 Replenishment 269,688 319,719 - 1,161,368 - 1,211,399 1,211,399 Sewer 5,299,290 5,416,830 - 8,786,739 - 8,904,279 8,904,279 Sanitation 1,286,846 1,771,777 - - - 484,931 484,931
9,376,500 9,910,584 - 12,927,699 - 13,461,783 13,461,783
Total Primary Government 50,524,295$ 26,738,629$ 472,278$ 57,003,550$ 20,228,379$ 13,461,783$ 33,690,162$
General RevenuesProperty taxes 2,945,714$ -$ 2,945,714$ Sales taxes 18,649,326 - 18,649,326Franchise taxes 1,469,246 - 1,469,246Grants and contributions not restricted to specific programs 5,919,754 - 5,919,754Unrestricted investment earnings (151,038) (244,180) (395,218)Other 1,137,581 - 1,137,581
Transfers (17,459,444) 17,459,444 - Total General Revenues and Transfers 12,511,139 17,215,264 29,726,403
Increase (decrease) in net assets 32,739,518 30,677,047 63,416,565Net Assets - beginning (As restated in footnote 10) 75,897,311 75,654,844 151,552,155Net Assets - ending 108,636,829$ 106,331,891$ 214,968,720$
CITY OF SURPRISE, ARIZONA
Program RevenuesPrimary Government
Net (Expense) Revenue andChanges in Net Assets


See Notes to Financial Statements -14-
CITY OF SURPRISE, ARIZONA BALANCE SHEET GOVERNMENTAL FUNDS JUNE 30, 2003
MunicipalProperty Highway
General Corporation User ASSETS Fund Fund Fund
ASSETS Cash and cash equivalents 21,646,052$ 27,899,244$ 581,441$
Investment in employee deferred compensation fund Receivables, (net of allowances)
Interest 111,056 - 2,825 Taxes and franchise fees 647,113 - 174,652
Grants 73,885 - - Due from other funds 4,758,200 - -
Prepaid items - - - Other assets 72,375 - -
Total assets 27,308,681$ 27,899,244$ 758,918$
LIABILITIESAccounts payable 1,266,969$ 1,254,352$ 206,596$ Accrued payroll and related taxes 389,195 - - Due to other funds - - -
6,720 - - Deferred revenues 557,831 4,999,610 2,000 Other liabilities 32,056 - -
Total liabilities 2,252,771 6,253,962 208,596
FUND BALANCE
Reserved for prepaid items - - - Unreserved, reported in:
General fund 25,055,910 - - Special revenue funds - 21,645,282 550,322 Debt service funds - - -
Total fund balance 25,055,910 21,645,282 550,322
Total liabilities and fund balance 27,308,681$ 27,899,244$ 758,918$
Fund Balances
Deposits
LIABILITIES AND FUND BALANCE

Public Safety Other TotalDevelopment Governmental Governmental
Fee Fund Funds Funds
1,075,902$ 5,191,144$ 56,393,783$
4,466 20,729 139,076 - - 821,765 - 11,851 85,736 - - 4,758,200
439,635 1,849,673 2,289,308 - 3,253 75,628
1,520,003$ 7,076,650$ 64,563,496$
209,114$ 170,597$ 3,107,628$ - - 389,195 - 238,248 238,248 - - 6,720 - - 5,559,441 - - 32,056
209,114 408,845 9,333,288
439,635 1,849,673 2,289,308
- - 25,055,910
871,254 4,690,712 27,757,570 - 127,420 127,420
1,310,889 6,667,805 55,230,208
1,520,003$ 7,076,650$ 64,563,496$

See Notes to Financial Statements -15-
CITY OF SURPRISE, ARIZONARECONCILIATION OF TOTAL GOVERNMENTAL FUND BALANCETO NET ASSETS OF GOVERNMENTAL ACTIVITIESJUNE 30, 2003
Total Governmental Fund Balances 55,230,208$
Capital assets used in governmental activities are not financial resources and therefore are not reported in funds 118,691,177
Current liabilities, including accrued interest, are not due and payable in the current period and therefore are not reported in the funds (1,522,076)
Internal service funds used by the management to charge cost of insurance to individual fund 198,778
Long-term liabilities, including bonds payable, are not due and payablein the current period and therefore are not reported in the funds (63,961,258)
Net Assets of Governmental Activities 108,636,829$


See Notes to Financial Statements -16-
STATEMENT OF REVENUES, EXPENDITURESAND CHANGES IN FUND BALANCESGOVERNMENTAL FUNDSFOR THE YEAR ENDED JUNE 30, 2003
MunicipalProperty Highway
General Corporation User Fund Fund Fund
REVENUESTaxes 21,636,438$ -$ 2,462,104$ Licenses and permits 1,469,246 28,742,802 - Intergovernmental 6,027,330 - - Charges for services 9,560,210 - - Fines 778,307 - - Rents 431,504 5,000,000 - Grants 119,309 - - Development fees - - - Investment income (455,667) 181,835 33,470 Other 949,104 1,518,436 -
Total revenues 40,515,781 35,443,073 2,495,574
EXPENDITURESCurrent
General government 6,513,426 259,450 - Public safety 11,531,799 - - Public works and streets 2,278,396 - 2,364,301 Community services 2,535,905 - 190,977 Culture and recreation 5,572,987 34,628 - Costs of sales and services (SLD's) - - - Administration - - -
Capital outlay 1,515,086 25,701,535 1,031,994 Debt service
Principal 215,080 1,850,000 - Interest and fiscal charges 170,134 3,088,090 -
Total expenditures 30,332,813 30,933,703 3,587,272
REVENUES OVER (UNDER) EXPENDITURES 10,182,968 4,509,370 (1,091,698)
OTHER FINANCING SOURCES (USES)Transfers in (out) (1,819,368) (16,542,850) 782,600
Total other financing sources (uses) (1,819,368) (16,542,850) 782,600
NET CHANGE IN FUND BALANCES 8,363,600 (12,033,480) (309,098)
FUND BALANCES, beginning of year - As restated in Footnote 10 16,692,310 33,678,762 859,420
FUND BALANCES, end of year 25,055,910$ 21,645,282$ 550,322$
CITY OF SURPRISE, ARIZONA

Public Safety Other TotalDevelopment Governmental Governmental
Fee Fund Funds Funds
-$ 1,172,134$ 25,270,676$ - - 30,212,048 - 152,810 6,180,140 - 7,537 9,567,747 - - 778,307 - - 5,431,504 - - 119,309
1,495,732 6,874,077 8,369,809 24,974 104,098 (111,290)
- 218,773 2,686,313
1,520,706 8,529,429 88,504,563
7,362 198,089 6,978,327 500,402 - 12,032,201
- 322,720 4,965,417 - - 2,726,882 - 2,969,603 8,577,218 - 368,044 368,044 - 138,464 138,464
1,444,351 1,146,545 30,839,511
- 548,058 2,613,138 - 225,667 3,483,891
1,952,115 5,917,190 72,723,093
(431,409) 2,612,239 15,781,470
20,000 100,174 (17,459,444)
20,000 100,174 (17,459,444)
(411,409) 2,712,413 (1,677,974)
1,722,298 3,955,392 56,908,182
1,310,889$ 6,667,805$ 55,230,208$

See Notes to Financial Statements -17-
RECONCILIATION OF THE STATEMENT OF REVENUES, EXPENDITURES AND CHANGES IN FUND BALANCES OFGOVERNMENTAL FUNDS TO THE STATEMENT OF ACTIVITIESFOR THE YEAR ENDED JUNE 30, 2003
Net Change in Fund Balances - Total Governmental Funds (1,677,974)$
Governmental funds report capital outlays as expenditures. However, in the statement of activities, the cost of those assets is allocated overtheir estimated useful lives as depreciation expense. This is the amount by which capital outlays exceeded depreciation in the currentperiod. 31,434,748
In the statement of activities, interest is accrued on outstanding bonds, whereas in governmental funds, an interest expenditure is reported when paid 43,938
Internal service funds used by management to charge the cost of insurance to individual 170,584 funds
Some expenses reported in the statement of activities, such as compensated absences,do not require the use of current financial resources and therefore are notreported as expenditures in governmental funds. 155,084
Repayment of long term debt is an expenditure in the governmental fund, but the repayment reduces long-term liabilities in the statement ofnet assets 2,613,138
32,739,518$
CITY OF SURPRISE, ARIZONA


See Notes to Financial Statements -18-
CITY OF SURPRISE, ARIZONA STATEMENT OF NET ASSETS PROPRIETARY FUNDSJUNE 30, 2003
ASSETS Water Sewer Sanitation Replenishment
ASSETS Cash and cash equivalents 10,409,098$ 13,705,912$ 739,477$ 3,372,883$ Receivables, (net of allowances) Accounts 452,355 966,230 308,491 65,034
Interest 41,436 58,753 3,217 14,034 Capital assets, net 11,516,147 68,504,711 581,595 43,631 Other assets 1,012,244 2,710,302 - -
Total assets 23,431,280$ 85,945,908$ 1,632,780$ 3,495,582$
LIABILITIES
LIABILITIESAccounts payable 1,227,235$ 619,686$ 137,384$ 23,149$ Accrued payroll and related taxes 2,755 15,635 6,768 1,843 Due to other funds 4,519,952 - - -
150,092 166,562 102,934 18,708 Deferred revenues 780,745 32,056 6,978 791 Compensated absences payable 12,222 48,143 16,451 3,570 Contracts payable 280,000 - - -
Total liabilities 6,973,001 882,082 270,515 48,061
NET ASSETSInvested in capital assets, net of related debt 11,516,147 68,504,711 581,595 43,631 Unrestricted 4,942,132 16,559,115 780,670 3,403,890
Total net assets 16,458,279 85,063,826 1,362,265 3,447,521
Total liabilities and net assets 23,431,280$ 85,945,908$ 1,632,780$ 3,495,582$
Business-type Activities
Deposits

Business-type GovernmentalActivities Activities
InternalTotals Service
28,227,370$ 314,337
1,792,110 - 117,440 1,334
80,646,084 - 3,722,546 -
114,505,550$ 315,671
2,007,454$ 114,189 27,001 1,306
4,519,952 - 438,296 - 820,570 -
80,386 1,398 280,000 -
8,173,659 116,893
80,646,084 - 25,685,807 198,778
106,331,891 198,778
114,505,550$ 315,671$

See Notes to Financial Statements -19-
STATEMENT OF REVENUES, EXPENSESAND CHANGES IN NET ASSETSPROPRIETARY FUNDSFOR THE YEAR ENDED JUNE 30, 2003
Water Sewer Sanitation ReplenishmentOPERATING REVENUES
Charges for services 2,404,520$ 6,183,573$ 1,771,778$ 319,719$
OPERATING EXPENSESCost of sales and services 2,303,295 4,030,530 1,193,500 269,688 Administration - - - -
217,381 1,268,760 93,346 -
2,520,676 5,299,290 1,286,846 269,688
Operating income (loss) (116,156) 884,283 484,932 50,031
NONOPERATING REVENUES Donations 884,426 2,351,516 - - Development Fees 2,092,902 5,668,480 - 1,161,368 Investment income (198,428) (127,080) 10,860 70,468
Total nonoperating revenues 2,778,900 7,892,916 10,860 1,231,836
Income before transfers 2,662,744 8,777,199 495,792 1,281,867
TRANSFERSTransfers in 15,932 17,296,750 146,762 -
CHANGE IN NET ASSETS 2,678,676 26,073,949 642,554 1,281,867
NET ASSETS, beginning of the year 13,779,603 58,989,877 719,711 2,165,654
NET ASSETS, ending of year 16,458,279$ 85,063,826$ 1,362,265$ 3,447,521$
Total operating expenses
CITY OF SURPRISE, ARIZONA
Business-type Activities
Depreciation

Business-type GovernmentalActivities Activities
InternalTotals Service
10,679,590$ 948,166$
7,797,013 - - 790,586
1,579,487 -
9,376,500 790,586
1,303,090 157,580
3,235,942 - 8,922,750 - (244,180) 13,004
11,914,512 13,004
13,217,602 170,584
17,459,444 -
30,677,046 170,584
75,654,845 28,194
106,331,891$ 198,778$

CITY OF SURPRISE, ARIZONACOMBINING STATEMENT OF CASH FLOWSPROPRIETARY FUNDSFOR THE YEAR ENDED JUNE 30, 2003
Water Sewer Sanitation ReplenishmentCASH FLOWS FROM OPERATING ACTIVITIES
Cash received from customers 3,538,705$ 5,542,184$ 1,816,413$ 459,026$ (1,856,296) (3,442,225) (869,543) (221,638)
Cash paid to employees (129,075) (718,518) (277,537) (61,583) Cash paid for insurance - - - -
Net cash provided by operating activities 1,553,334 1,381,441 669,333 175,805
CASH FLOWS FROM CAPITAL AND RELATEDFINANCING TRANSACTIONSProceeds received from development fees 2,092,902 5,668,480 - 1,161,368 Capital assets received from donations 884,426 2,351,516 - - Acquisitions, construction, and transfer of capital assets (3,407,644) (21,435,091) (124,637) -
Net cash provided by capital and related financingtransactions (430,316) (13,415,095) (124,637) 1,161,368
CASH FLOWS FROM NONCAPITAL FINANCING ACTIVITIESCash received from other funds 1,886,447 17,296,750 146,762 -
Net cash provided by noncapitalfinancing activities 1,886,447 17,296,750 146,762 -
CASH FLOWS FROM INVESTING ACTIVITIESCash received from interest income (239,864) (185,833) 7,643 56,435
Net cash provided by investing activities (239,864) (185,833) 7,643 56,435
NET CHANGE IN CASH 2,769,601 5,077,263 699,101 1,393,608
CASH AND CASH EQUIVALENTS, beginning of year 7,639,497 8,628,649 40,376 1,979,275
CASH AND CASH EQUIVALENTS, end of year 10,409,098$ 13,705,912$ 739,477$ 3,372,883$
RECONCILIATION OF OPERATING INCOME (LOSS) TO NET CASH PROVIDED BY (USED IN) OPERATING ACTIVITIES:Operating income (loss) (116,156)$ 884,283$ 484,932$ 50,031$
Depreciation expense 217,381 1,268,760 93,346 - (Increase) decrease in
Accounts receivable 453,434 148,330 106,756 138,694 Other assets (1,249) (385,302) - -
Increase (decrease) inAccounts payable 311,787 (141,631) 41,962 (16,848) Accrued payroll and taxes 568 4,276 2,316 1,236 Utility deposits 15,624 (140,761) (63,099) 13,246 Deferred revenues 666,376 (263,657) 978 (12,633) Compensated absences payable 5,569 7,143 2,142 2,079
Total adjustments 1,669,490 497,158 184,401 125,774
Net cash provided by operating activities 1,553,334 1,381,441 669,333 175,805
Cash paid to suppliers
Business-type Activities
Changes in operating assets and liabilities

Business-type GovernmentalActivities Activities
InternalTotals Service
11,356,328$ 949,215$ (6,389,702) - (1,186,713) -
- (674,093)
3,779,913 275,122
8,922,750 - 3,235,942 -
(24,967,372) -
(12,808,680) -
19,329,959 -
19,329,959 -
(361,619) 11,670
(361,619) 11,670
9,939,573 286,792
18,287,797 27,545
28,227,370$ 314,337$
1,303,090$ 157,580$
1,579,487 -
847,214 1,049 (386,551) -
195,270 113,789 8,396 1,306
(174,990) - 391,064 -
16,933 1,398 2,476,823 117,542
3,779,913 275,122

See Notes to Financial Statements -21-
CITY OF SURPRISE, ARIZONASTATEMENT OF FIDUCIARY NET ASSETSPENSION TRUST FUNDJUNE 30, 2003
Volunteer FirefightersPension and Relief Fund
ASSETSCash and cash equivalents 84,451$ Receivables
Interest 350
84,801$
NET ASSETS HELD IN TRUST FOR PENSION BENEFITSNet assets 84,801$

See Notes to Financial Statements -22-
STATEMENT OF CHANGES IN FIDUCIARY NET ASSETSPENSION TRUST FUNDFOR THE YEAR ENDED JUNE 30, 2003
VolunteerFirefightersPension and Relief Fund
REVENUESInterest 3,383$
Total revenues 3,383
EXPENSESMiscellaneous -
Net income 3,383
NET ASSETS, beginning of year 81,418
NET ASSETS, end of year 84,801$
CITY OF SURPRISE, ARIZONA


CITY OF SURPRISE, ARIZONA NOTES TO FINANCIAL STATEMENTS FOR THE YEAR ENDED JUNE 30, 2003
(Continued) -23-
NOTE 1 - SUMMARY OF SIGNIFICANT ACCOUNTING POLICIES The financial statements of the City of Surprise, Arizona (the City), have been prepared in conformity with accounting principles generally accepted in the United States of America (GAAP) as applied to government units. The Governmental Accounting Standards Board (GASB) is the accepted standard-setting body for establishing governmental accounting and financial reporting principles. The more significant of the government’s accounting policies are described below. A. REPORTING ENTITY The City is located approximately 20 miles northwest of downtown Phoenix and was incorporated in 1964 under the provision of the Arizona Constitution. During 1999, the voters approved the Home Rule, an alternative expenditure limitation for budget years through June 30, 2003. The City is governed by an elected mayor, vice mayor, and a five member council, and offers the following services: public safety (police and fire), highways and streets, sanitation, water, sewer, health and social services, culture and recreation, public improvements, planning and zoning, and general administrative services. COMPONENT UNITS As required by accounting principles generally accepted in the United States of America, these financial statements present the primary government and its component units, entities for which the government is considered to be financially accountable. A primary government is considered financially accountable for another organization when it can impose its will or have a financial benefit or burden relationship. Blended component units, although legally separate entities are, in substance, part of the government’s operations and so data from these units are combined with data of the primary government. The following entities are blended component units of the City: The City of Surprise Voluntary Firefighters Pension and Relief Fund (Fund) is administered by an appointed board as set forth by Title 9 of the Arizona Revised Statutes. The Fund provides retirement benefits to the City’s firefighters, and is held by the City in a trustee capacity. The City is responsible for appointing the board members. The Surprise Municipal Property Corporation is an Arizona nonprofit corporation formed under the provision of Title 10 of the Arizona Revised Statutes. The Corporation was organized to acquire, construct, reconstruct, or improve buildings and other real and personal property suitable for leasing or sale to the City. The board members are appointed by the City. Various Street Lighting Districts (SLD’s) are maintained by the City for developing areas. The SLD assessment rates are approved by the City’s council. The SLD’s are reported in the special revenue fund. For the fiscal year ended June 30, 2003, the City had no discretely presented component units. RELATED ORGANIZATIONS A related organization is one for which the primary government is not financially accountable even though the primary government appoints a voting majority of the organization’s governing board.

NOTES TO FINANCIAL STATEMENTS
(Continued) -24-
EXCLUDED ORGANIZATIONS Although there are schools located within the geographic boundaries of the City, school districts are separate from the municipalities in which they are located, with their own elected officials and taxing powers. Consequently, the report does not include the activities of the area school districts. B. MEASUREMENT FOCUS, BASIS OF ACCOUNTING, AND BASIS OF PRESENTATION The accounts of the City are organized and operated on the basis of funds. A fund is an independent fiscal and accounting entity with a self-balancing set of accounts. Fund accounting segregates funds according to their intended purpose and is used to aid management in demonstrating compliance with finance-related legal and contractual provisions. The minimum number of funds is maintained consistent with legal and managerial requirements. Government-Wide Financial Statements The statement of net assets and the statement of activities display information about the City, the primary government, as a whole. These statements distinguish between activities that are governmental and those that are considered business-type activities. Internal service fund activity is eliminated to avoid “doubling up” revenues and expenses. The government-wide statements are prepared using the economic resources measurement focus and the accrual basis of accounting. This is the same approach used in the preparation of the proprietary fund financial statements but differs from the manner in which governmental fund financial statements are prepared. The revenues susceptible to accrual are property taxes, franchise fees, licenses, charges for services, interest income and intergovernmental revenues. Sales taxes collected and held by the state at year end and on behalf of the government are also recognized as revenue. All other governmental fund types revenues are recognized when received. Therefore, governmental fund financial statements include a reconciliation with a brief explanation to better identify the relationship between the government-wide statements and the statements for governmental funds. The government-wide statements of activities present a comparison between expenses and program revenues for each segment of the business-type activities of the City and for each governmental program. Direct expenses are those that are specifically associated with the service, program or department and are therefore clearly identifiable to a particular function. Program revenues include charges paid by the receipts of the goods or services offered by the programs and grants and contributions that are restricted to meeting the operational or capital requirements of a particular program. Revenues which are not classified as program revenues are presented as requirements of a particular program. Revenues which are not classified as program revenue are presented as general revenues. The comparison of program revenues and expenses identifies the extent to which each program or business segment is self-financing or draws from the general revenues of the City. Net assets should be reported as restricted when constraints placed on net asset use are either externally imposed by creditors (such as through debt covenants), grantors, contributors, or laws or regulations of other governments or imposed by law through constitutional provisions or enabling legislation. The net assets restricted for other purposes result from special revenue funds and the restrictions on their net asset use.

NOTES TO FINANCIAL STATEMENTS
Using a fund accounting system, amounts are spent in accordance with established fund authorities. Fund authorities provide rule for the fund activity and are separately established for restricted and unrestricted activity. For both restricted and unrestricted funds that are available for expenditures, the decision for funding is transactional based with the departmental management system in place at the City. Fund Financial Statements Fund financial statements report detailed information about the City. The focus of governmental and enterprise fund financial statements is on major funds rather than reporting funds by type. Each major fund is presented in a separate column. Non-major funds are aggregated and presented in a single column. The internal service fund is presented in a single column on the face of the proprietary fund statements. Governmental Funds All governmental funds are accounted for using modified accrual basis of accounting and current financial resources measurement focus. Under the basis revenues are recognized in the accounting period in which they become measurable and available, except for the City’s court fines for which revenues are recognized when fines are collected. The major sources of revenues susceptible to accrual are taxes, grants, and investment earnings. Expenditures are recognized in the accounting period in which the fund liability is incurred, if measurable. Governmental funds include the following: The general fund is the City’s primary operating fund. It accounts for all financial resources of the general government, except those required to be accounted for in another fund. The highway user fund accounts for revenue and expenditures that are legally restricted to expenditures for the construction, repairs, and maintenance of public works and streets. The municipal property corporation fund accounts for revenue and expenditures that are legally restricted to expenditures for the construction of major capital facilities. The City Council appoints the governing board and the City staff performs all administrative and accounting functions for the corporation. The public safety development fee fund accounts for revenue and expenditures that are legally restricted to expenditures for public safety activities. Proprietary Funds All proprietary funds are accounted for on the flow of economic resources measurement focus and use of accrual basis of accounting. Under this method, revenues are recorded when earned and expenses are recorded at the time liabilities are incurred. Proprietary funds distinguish operating revenues and expenses from non-operation items. Operating revenues and expenses generally result from providing services and producing and delivering goods in connection with a proprietary fund’s principal ongoing operations. Revenues and expenses not meeting this definition are reported as non-operating revenues and expenses. The proprietary funds apply Financial Accounting Standards Board (FASB) pronouncements and Accounting Principal Board (APB) opinions issued on or before November 30, 1989, unless these pronouncements conflict with or contradict GASB pronouncements, in which case, GASB prevails. The proprietary fund of the City includes the following fund type: The water fund accounts for the provision of the water treatment and distribution to the residents and commercial users of the City. (Continued)
-25-

NOTES TO FINANCIAL STATEMENTS
(Continued) -26-
The sewer fund accounts for sanitary sewer services provided to the residential and commercial users of the City. The sanitation fund accounts for trash collection services provided to the residential and some commercial users of the City. The replenishment fund accounts for future replenishment of water sources used in the water treatment and distribution to residents and commercial users of the City. In addition, the City reports the following fund types:
Internal Service Fund is accounted for in essentially the same manner as the proprietary funds, using the same measurement focus and basis of accounting. The fund accounts for financial activity of the City’s internal insurance activity. Pension Trust Fund (not included in government-wide statements) is accounted for in essentially the same manner as the proprietary funds, using the same measurement focus and basis of accounting. The fund accounts for the assets of the City’s firefighter pension and trust. The City Council acts as the governing board and the City staff performs all administrative and accounting functions for this fund.
C. CASH AND CASH EQUIVALENTS The City’s cash and cash equivalents are considered to be cash on hand, demand deposits and short-term investments with original maturities of three months or less, including amounts on deposit with the Local Government Investment Pool. State statutes authorize the City to invest in obligations of the U.S. Treasury, commercial paper, corporate bonds, repurchase agreements and the State Treasurer’s Local Government Investment Pool. Investments are stated at fair value. D. RECEIVABLES AND PAYABLES Outstanding balances between funds are reported as “due from other funds” or “due to other funds.” All accounts receivable are shown net of allowance for uncollectibles when applicable. E. INVENTORIES Inventories consist of expendable supplies held for consumption and are recorded at the time of purchase as expenditures in the fund from which the purchases were made; and because the amounts on hand at June 30, 2003 are immaterial, they were not included in the statement of net assets. F. PREPAID ITEMS Prepaid items consist of governmental departments prepaid rent for the use of certain facilities throughout the year. G. CAPITAL ASSETS The accounting and reporting treatment applied to the capital assets associated with a fund are determined by its measurement focus. General capital assets are long-lived assets of the City as a whole. When purchased, such assets are recorded as expenditures in the governmental funds and capitalized. The City capitalizes all purchases

NOTES TO FINANCIAL STATEMENTS
(Continued) -27-
greater than $10,000. Infrastructure such as streets, traffic signals and signs are capitalized. The valuation basis for general capital assets are historical costs, or where historical costs is not available, estimated historical costs based on replacement costs. Capital assets in the proprietary funds are capitalized in the fund in which they are utilized. The valuation bases for proprietary fund capital assets are the same as those used for the general capital assets. Donated capital assets are capitalized at estimated fair value on date donated. Depreciation of capital assets is computed and recorded by the straight-line method. Estimated useful lives of the various classes of depreciated capital assets are as follows: building, 20 to 50 years; improvements/infrastructure, 5 to 50 years; equipment, 2 to 15 years. H. COMPENSATED ABSENCES Vested or accumulated vacation leave that is expected to be liquidated with expendable available financial resources is reported as an expenditure and a fund liability of the governmental fund that will pay it. Amounts of vested or accumulated vacation leave that are not expected to be liquidated with expendable available financial resources are not reported as an expenditure in the fund financial statements. Vested or accumulated vacation leave of proprietary funds is recorded as an expense and liability of those funds as the benefits accrue to employees. In accordance with the provision of Statement of Financial Accounting Standards No. 43, Accounting for Compensated Absences, no liability is recorded for nonvesting accumulating rights to receive sick pay benefits. The City pays employees for unused sick leave annually, at which point the expenditure is recognized. I. FUND BALANCE Reservations of fund balances represent amounts that are not appropriate or are legally segregated for a specific purpose. Reservations of retained earnings are limited to outside third-party restrictions. Designations of fund balance represent tentative management plans that are subject to change. J. PROPERTY TAXES A primary tax levy is limited to an increase of two percent over the previous year’s maximum allowable primary levy plus an increased dollar amount due to a net gain in property not taxed the previous year (Section 42-301, Arizona Revised Statutes). The two percent increase is based on the City’s “maximum allowable levy” for the prior year. The two-tiered system includes a primary levy (discussed above) and a secondary property tax for the purpose of retiring the principal and interest on bonded indebtedness. This levy is referred to as the “unlimited” levy. In other words, this property tax may be levied in an amount necessary by the City (Article IX, Section 19, Subsection 2, Paragraph A, Arizona State Constitution). Property taxes are recognized as revenues in the year they are levied and collected or if they are collected within 60 days subsequent to fiscal year-end. Property taxes not collected within 60 days subsequent to fiscal year-end or collected in advance of the year-end for which they are levied are reported as deferred revenues. The County levies real property taxes on or before the third Monday in August, that become due and payable in two equal installments. The first installment is due on the first day of October and becomes delinquent after the first business day in November. The second installment is due on the first day of March of the next year and
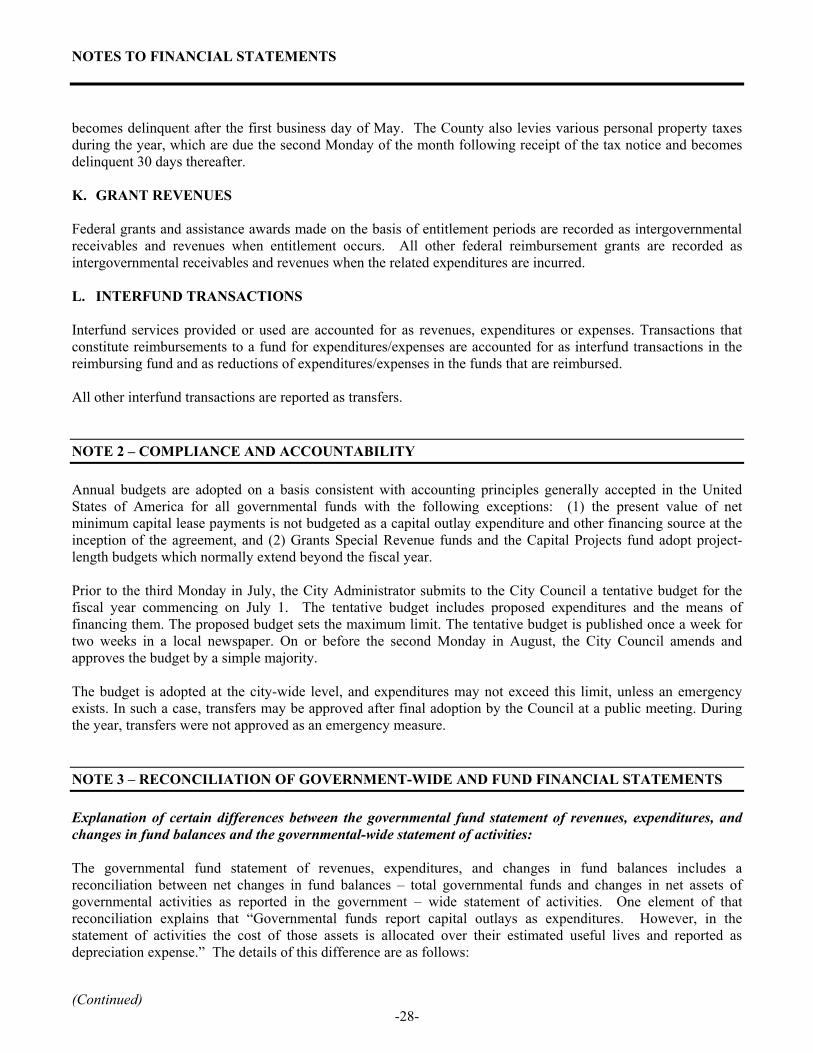
NOTES TO FINANCIAL STATEMENTS
(Continued) -28-
becomes delinquent after the first business day of May. The County also levies various personal property taxes during the year, which are due the second Monday of the month following receipt of the tax notice and becomes delinquent 30 days thereafter. K. GRANT REVENUES Federal grants and assistance awards made on the basis of entitlement periods are recorded as intergovernmental receivables and revenues when entitlement occurs. All other federal reimbursement grants are recorded as intergovernmental receivables and revenues when the related expenditures are incurred. L. INTERFUND TRANSACTIONS Interfund services provided or used are accounted for as revenues, expenditures or expenses. Transactions that constitute reimbursements to a fund for expenditures/expenses are accounted for as interfund transactions in the reimbursing fund and as reductions of expenditures/expenses in the funds that are reimbursed. All other interfund transactions are reported as transfers. NOTE 2 – COMPLIANCE AND ACCOUNTABILITY Annual budgets are adopted on a basis consistent with accounting principles generally accepted in the United States of America for all governmental funds with the following exceptions: (1) the present value of net minimum capital lease payments is not budgeted as a capital outlay expenditure and other financing source at the inception of the agreement, and (2) Grants Special Revenue funds and the Capital Projects fund adopt project-length budgets which normally extend beyond the fiscal year. Prior to the third Monday in July, the City Administrator submits to the City Council a tentative budget for the fiscal year commencing on July 1. The tentative budget includes proposed expenditures and the means of financing them. The proposed budget sets the maximum limit. The tentative budget is published once a week for two weeks in a local newspaper. On or before the second Monday in August, the City Council amends and approves the budget by a simple majority. The budget is adopted at the city-wide level, and expenditures may not exceed this limit, unless an emergency exists. In such a case, transfers may be approved after final adoption by the Council at a public meeting. During the year, transfers were not approved as an emergency measure. NOTE 3 – RECONCILIATION OF GOVERNMENT-WIDE AND FUND FINANCIAL STATEMENTS Explanation of certain differences between the governmental fund statement of revenues, expenditures, and changes in fund balances and the governmental-wide statement of activities: The governmental fund statement of revenues, expenditures, and changes in fund balances includes a reconciliation between net changes in fund balances – total governmental funds and changes in net assets of governmental activities as reported in the government – wide statement of activities. One element of that reconciliation explains that “Governmental funds report capital outlays as expenditures. However, in the statement of activities the cost of those assets is allocated over their estimated useful lives and reported as depreciation expense.” The details of this difference are as follows:

NOTES TO FINANCIAL STATEMENTS
Capital outlays $ 30,839,511
Donated capital assets 3,535,855 Depreciation expense (2,763,876) Loss on disposal of assets (177,042)
$ 31,434,448
NOTE 4 - CASH AND CASH EQUIVALENTS
Cash and cash equivalents are made up of deposits in the bank, cash on hand, and cash invested in the Local Government Investment Pool (L.G.I.P.) managed by the Arizona State Treasurer in accordance with Arizona statutes. With consideration for the loss as indicated in Note 13, the total cash and cash equivalents were $85,019,941 as of June 30, 2003, which includes the volunteer firefighters pension fund. Deposits and Invested Deposits - At year-end, the carrying amount of the City’s operating deposits were $2,513,193 and the bank balance was $1,636,247. The difference represents outstanding checks and deposits which are held in the checking account at the financial institutions trust department until checks are presented for payment. Of the bank balance, seven percent was covered by federal depository insurance and the remainder was covered by collateral held in the pledgting financial institution’s trust department in the City’s name. The City has an additional $3,842,720 deposited into bank accounts under the Municipal Property Corporation Fund. Cash Invested - Funds of $80,259,387 are held exclusive in the L.G.I.P.. The City’s investment in the L.G.I.P. is stated at cost, which approximates fair value. In this Pool, the City’s monies are combined with those of the other investors in the Pool. As such, the City does not own specific securities within the Pool; they are, therefore, not categorized. The state does not provide specific fair values to its participants. Interest earned from investments in the L.G.I.P. is allocated to all funds monthly. Cash on Hand - This includes a petty cash fund and beginning cash for the registers kept at the City Hall, the Courthouse, and the Parks and Recreation Department. Cash on hand at June 30, 2003 was $1,999.
NOTE 5 - CAPITAL ASSETS
Capital assets activity for the year ended June 30, 2003, was as follows: (Continued)
-29-

(Continued) -30-
Beginning EndingBalance Increases Decreases Transfers Balance
Governmental activities:Not being depreciated:
Land and land improvements 5,701,753$ 32,498$ -$ -$ 5,734,251$ Construction in process 24,405,852 - - (24,405,852) -
Other capital assets:Building and improvements 11,552,991 27,268,618 (163,584) 24,405,852 63,063,877 Equipment and vehicles 6,657,904 1,595,367 (315,707) - 7,937,564 Infrastructure 46,105,042 5,924,888 - - 52,029,930
94,423,542 34,821,371 (479,291) - 128,765,622 Accumulated depreciation:
Building and improvements (1,343,723) (351,448) - - (1,695,171) Equipment and vehicles (2,809,723) (919,040) 302,249 - (3,426,514) Infrastructure (3,459,372) (1,493,388) - - (4,952,760)
(7,612,818) (2,763,876) 302,249 - (10,074,445)
86,810,724$ 32,057,495$ (177,042)$ -$ 118,691,177$
Depreciation was charged by function as follows:General government 300,291$ Public safety 559,954 Public works and streets, includes depreciation for infrastructure 1,627,070 Community services 39,060 Culture and recreation 237,501
Total governmental activities depreciation expense 2,763,876$
Primary Government

NOTES TO FINANCIAL STATEMENTS
-31-
Beginning EndingBalance Increases Decreases Balance
Business-type activities:Not being depreciated:
Land 3,087,151$ -$ -$ 3,087,151$ Construction in progress 4,131,665 21,338,234 (100,000) 25,369,899
7,218,816 21,338,234 (100,000) 28,457,050 Other capital assets:
Plant and improvements 55,050,912 3,335,943 - 58,386,855 Vehicles and equipment 1,313,384 416,569 (87,769) 1,642,184
56,364,296 3,752,512 (87,769) 60,029,039
63,583,112 25,090,746 (187,769) 88,486,089 Accumulated depreciation:
Sewer (5,323,509) (1,270,010) - (6,593,519) Sanitation (596,127) (93,346) 65,644 (623,829) Water (405,276) (217,381) - (622,657)
(6,324,912) (1,580,737) 65,644 (7,840,005)
57,258,200$ 23,510,009$ (122,125)$ 80,646,084$
Depreciation was charged by function as follows:Sewer 1,270,010$ Sanitation 93,346 Water 217,381
1,580,737$
Primary Government
During the year ended June 30, 2002, the City implemented the infrastructure reporting requirements of GASB Statement #34, including retroactive infrastructure, with the following exception: the City is currently working with other governmental entities to obtain appropriate records to value certain roads and buildings. NOTE 6 - WATER RIGHTS – MOUNTAIN VISTA Water rights reported in the water enterprise fund represent the intangible right to water usage in conjunction with the purchase of Mountain Vista. The land is not usable for any other purpose and therefore has no value to the City separate from the water rights. Water rights are to be amortized over a 40 year estimated useful life. As of June 30, 2003, the water rights had not been used; therefore, no amortization expense was incurred. Contracts payable in the water enterprise fund represent $280,000 due to the same developer for the purchase of the water rights. The contract payable is to be repaid as the City collects water development fees once the water well is in operation.

NOTES TO FINANCIAL STATEMENTS
(Continued) -32-
NOTE 7 - LONG-TERM DEBT The following is a summary of long-term debt for the year ended June 30, 2003:
AmountsBeginning Ending Due WithinBalance Additions Reductions Balance One Year
Governmental activities:General obligation bonds
4.5% 1994 Series A, $1,500,000 issued 1,055,000$ -$ (75,000)$ 980,000$ 80,000$ 4.5% 1994 Series B, $2,530,000 issued 1,775,000 - (130,000) 1,645,000 135,000
2,830,000 - (205,000) 2,625,000 215,000
General municipal property corporationfund obligationSeries 2000 Bonds, $59,120,000 issued 57,845,000 - (1,850,000) 55,995,000 1,950,000
Total governmental obligation bonds 60,675,000 - (2,055,000) 58,620,000 2,165,000
Notes payable3.15% Loan-Wastewater
Management Authority, $4,765,955 issued 2,640,796 - (343,058) 2,297,738 353,871
Capital leases5.20% Front-end loader 24,142 - (24,142) - - 5.20% Police Vehicles 37,803 - (37,803) - - 5.20% Fire engine 104,553 - (104,553) - -
166,498 - (166,498) - -
Compensated absences 859,875 155,084 - 1,014,959 1,014,959
Developer payable 2,077,143 - (48,582) 2,028,561 -
Total governmental activities debt 66,419,312$ 155,084$ (2,613,138)$ 63,961,258$ 3,533,830$
Business-type activities:Compensated absences 63,454$ 16,932$ -$ 80,386$ 80,386$
Contracts payable 280,000$ -$ -$ 280,000$ 280,000$
Principal Interest Principal Interest
2004 2,165,000$ 3,115,478$ 353,871$ 72,425$ 2005 2,275,000 3,009,802 365,025 61,270 2006 2,410,000 2,895,977 376,531 49,765 2007 2,495,000 2,774,878 388,399 37,896 2008 2,630,000 2,648,227 400,642 25,654 2009-2013 15,225,000 10,993,256 413,270 13,026 2014-2018 17,980,000 6,461,660 - - 2019-2023 13,440,000 1,177,620 - -
Total 58,620,000$ 33,076,898$ 2,297,738$ 260,036$
WWMA LoanGovernmental Activities - Bonds & Loans
December 31Year Ended
Governmental Obligation

NOTES TO FINANCIAL STATEMENTS
(Continued) -33-
Municipal Property Corporation The City of Surprise Municipal Property Corporation (MPC) issued special limited obligations for the construction of major capital facilities. The bonds and interest are limited obligations of the MPC, payable from lease rental income. Developer Payable Del Webb, a developer, incurred $2,077,143 in costs for road development. As of June 30, 2003, the remaining balance of these costs was $2,028,561. In an agreement with the City, the first $200,000 in sales tax received annually from the applicable parcels goes to the City. The second $200,000 goes to the developer to be applied to interest and the $2,077,143. Any monies received over $400,000 are split equally between the City and the developer. In 2003, $212,195 was paid to the developer, with $48,582 applied to principal and the remaining $163,613 applied to accrued interest. Legal Debt Limit The Arizona Constitution provides that the general obligation bonded indebtedness for a city may not exceed twenty percent of the secondary assessed valuation of the taxable property of the city for projects supplying the city with water, artificial light or sewers. The 2002 secondary assessed valuation of the City of Surprise is $280,190,899. Accordingly, the legal limit for bonded indebtedness for the City is $56,038,180 for the fiscal year ended June 30, 2003, leaving $51,115,442, respectively of unused borrowing capacity. NOTE 8 – MUNICIPAL PROPERTY CORPORATION FUND CONSTRUCTION COMMITMENT LIABILITY Government funds report deferred revenue in connection to resources that have been received, but not yet earned. As of June 30, 2003, the deferred revenue balance of $4,999,610 in the Municipal Property Corporation Fund represents payments made by the City for use in future periods. NOTE 9 – RESTATEMENT OF PRIOR YEAR BALANCES During the current year, the City evaluated its ability to collect court fine revenue that was in prior years recorded as deferred revenue, and has subsequently determined these amounts not to be collectable. This has resulted in a current year reduction in the accounts receivable and deferred revenue for the City of Surprise of approximately $2.5 million dollars. NOTE 10 – BEGINNING FUND BALANCE/NET ASSETS ADJUSTMENTS The following schedule reconciles June 30, 2002 fund balances/net assets as previously reported, to beginning fund balances/net assets, as restated.

(Continued) -34-
Governmental Funds Special Revenue Funds
Fund balance/net assets, June 30, 2002 3,755,652$ Correction of an error 9,811
Fund balance/net assets, June 30, 2002, as restated 3,765,463$
Governmental Activities
Fund balance/net assets, June 30, 2002 75,887,500$
Correction of error 9,811
Fund balance/net assets, June 30, 2002, as restated 75,897,311$
Government Wide Statements
NOTE 11 - RETIREMENT PLANS Arizona State Retirement Plan A. Plan Description The Arizona State Retirement System (the System) is a cost-sharing multiple-employer defined benefit plan-covering employees of Arizona school districts, the State and certain political subdivisions. The System provides for retirement, disability, health insurance benefits, and death and survivor benefits. Benefits are paid from resources contributed by members and employers and from earnings on the invested funds. The Arizona Revised Statutes provide statutory authority for determining the employees' and employer contribution amounts as a percentage of covered payroll. The Arizona State Retirement System issues a publicly available financial report that includes financial statements and required supplementary information for the System. That report may be obtained by writing to Arizona State Retirement System, 3300 North Central Avenue, Suite 1300, Phoenix, AZ 85012 or by calling (602) 240-2000. B. Funding Policy Under Arizona State Statutes, employee member contributions to the System were fixed at two percent of their compensation for the year ended June 30, 2003, with the contributions made by payroll deduction. Employers are required to contribute at the same rate as employees. Although the statutes prescribe the basis of making the actuarial calculation, the Arizona legislature is able to change the contribution rate from that actuarially determined rate. The total contributions made by the City for the years ended June 30, 2003, 2002, and 2001, were $228,340, $176,735, and $139,215, respectively, equal to the required contributions for each year. Retirement Plan For Public Safety Employees A. Plan Description The City contributes to an agent multiple-employer retirement plan, the Arizona Public Safety Personnel Retirement System (APSPRS), for public safety employees. The APSPRS functions as an investment and administrative agent for the City with respect to the retirement plan for policemen and firemen. The APSPRS

NOTES TO FINANCIAL STATEMENTS
(Continued) -35-
provides retirement benefits as well as death and disability benefits. Both benefits and contributions are determined by State of Arizona statutes. The APSPRS issues a publicly available financial report that includes financial statements and required supplementary information for the plan. That report may be obtained by writing to Public Safety Personnel Retirement System, 1020 East Missouri Avenue, Phoenix, AZ 85014 or by calling (602) 255-5575. B. Funding Policy Employee members are required to contribute 7.65% of their annual covered salary. The retirement plan provides for periodic employer contributions at actuarially determined rates that, expressed as percentage of annual covered payroll, are designed to accumulate sufficient assets to pay benefits when due. For the year ended June 30, 2003, the City contributed 7.51% and 7.53% of annual covered firefighter and police payroll to the plan, respectively. C. Annual Pension Cost For 2002, the City’s annual pension cost of $527,619 for ASPSPRS was equal to the City’s required and actual contributions. The required contribution was determined as part of the June 30, 2002 actuarial valuation using the individual entry age normal cost method. Significant actuarial assumptions used in determining the pension benefit obligation include (a) a rate of return on the investment of present and future assets of 9.0% per year compounded annually, (b) projected salary increases of 5.5% per year compounded annually attributable to inflation and (c) additional projected salary increases ranging from 1.0% to 4.0% per year, depending on age, attributable to seniority/merit. The actuarial value of APSPRS assets are determined on a smoothed market basis which spreads differences between actual and assumed investment return over a four-year period. APSPRS’s unfunded actuarial accrued liability, calculated as of June 30, 2002, is being amortized as a level percentage open of projected payroll over a period of 40 years (from July 1, 1978). The remaining amortization period at June 30, 2002, was 20 years. Required Supplementary Information – Schedule of Employer Contributions
Fire PercentFighters Police Contributed
Year ended June 30,1998 46,869$ 108,020$ 100.0%1999 93,000 84,376 100.0%2000 120,353 95,652 100.0%2001 198,361 220,241 100.0%2002 254,228 273,391 100.0%2003 * 192,711 246,413 100.0%
Annual Required Contribution
*Actual recognized contribution dollar amount will be based on the required contribution rate and the actual pensionable payroll for the period.

(Continued) -36-
Schedule of Funding Progress
Actuarial UAAL as a Actuarial Accrued Unfunded PercentageValuation Actuarial Liability AAL Funded Covered of Covered
Date Value of (AAL) (UAAL) Ratio Payroll PayrollJune 30 Assets (a) Entry Age (b) (b-a) (a/b) (c) ((b-a)/c)
1997 2,410,417$ 2,239,515 (170,902) 107.6% 1,267,395 (0.13)
1998 3,003,120 2,855,963 (147,157) 105.2% 2,067,826 (0.08)
1999 3,807,496 3,756,622 (50,874) 101.4% 2,416,085 (0.02)
2000 4,941,863 4,582,526 (359,337) 107.8% 2,934,962 (0.12)
2001 6,447,706 5,031,601 (1,416,105) 128.1% 4,077,707 (0.35)
2002 8,514,189 6,452,541 (2,061,648) 132.0% 5,838,324 (0.35) Six-Year Trend Information
Percent Net PensionFire Police Contributed Obligation
Fiscal Year Ended June 30,1997 35,905$ 89,385$ 100.0% -$ 1998 46,869 108,020 100.0% - 1999 93,000 84,376 100.0% - 2000 120,353 95,652 100.0% - 2001 198,361 220,241 100.0% - 2002 * 254,228 273,391 100.0% -
Annual Pension Cost
Volunteer Firefighters’ Pension and Relief Fund Plan Description The Volunteer Firefighters’ Pension and Relief Fund is a discretionary defined benefit plan directly administered by the City. The fund was established to provide pension benefits for its qualified volunteer firefighters. The fund is authorized by Title 9, Chapter VIII, Article 3 of the Arizona Revised Statutes, and is administered by the Board of Trustees. No actuarial valuation of the fund’s position has been made, and no separate report is prepared. Assets of the fund are invested in the State Local Government Investment Pool. Pension Benefits Volunteer firefighters having served twenty-five years or more, or having reached sixty years of age and served twenty years or more, shall be paid a monthly pension not to exceed $150 per month as determined by the Board of Trustees. Such pension, if paid, may be increased, decreased, or discontinued at the discretion of the Board of Trustees. If the fund resources are insufficient to pay fully the pensions authorized, the fund shall be prorated among those entitled thereto. The Board of Trustees may grant temporary relief and assistance from the fund to any qualified participant, or beneficiaries of such participant.

NOTES TO FINANCIAL STATEMENTS
-37-
Deferred Compensation Plans The City offers its employees deferred compensation plans created in accordance with Internal Revenue Code Section 457. The plan, available to all full-time government employees at their option, permits participants to defer a portion of their salary until future years. The deferred compensation is not available to participants until termination, retirement, or death of unforeseeable emergency. The City's fiduciary responsibility is that of exercising "due care" in selecting a third-party administrator. Federal legislation requires that Section 457 plan assets be held in trust for employees. This means that employee assets held in Section 457 plan assets be held in trust for employees. This means that employee assets held in Section 457 plans are not the property of the City and are not subject to claims of the City's general creditors. Therefore, the Deferred Compensation Agency Fund is not included in the City's Financial Statements. NOTE 12 - RISK MANAGEMENT The City is exposed to various risks of loss related to torts; theft of, damage to and destruction of assets; errors and omissions; and natural disasters. Thus, the City participates in the Arizona Municipal Risk Retention Pool (AMRRP), which provides a comprehensive municipal coverage program including property, general liability, public officials liability, automobile liability and physical damage, bonds and crime. The basic coverage program is standard for all participants and deemed to be appropriate by the governing board of the AMRRP. Individual limits are determined by the Council and staff members. The limit for basic coverage is $20 million per occurrence on a claim made basis. The AMRRP is structured such that member premiums are based on actuarial review that will provide adequate reserves to allow the Pool to meet its expected financial obligation. The Pool has the authority to assess its members additional premiums should reserves and annual premiums be insufficient to meet the Pool’s obligations. The City can be assessed up to the amount of the current year’s contribution. The City’s obligation is to file claims timely. The AMRRP is responsible for investigating claims, settling claims and billing the City for any deductible portion. The City’s loss has not exceeded its coverage in any of the last three years, and the deductible portion has not been material to the City’s financial position. NOTE 13 - CONTINGENT LIABILITIES The City was not involved in any pending or threatened litigation that could materially affect the City’s financial position and results of operations at June 30, 2003.
Amounts received or receivable from grantor agencies are subject to audit and adjustment by grantor agencies, principally the federal government. Any disallowed claims, including amounts already collected, may constitute a liability of the applicable funds. The amount, if any, of expenditures which may be disallowed by the grantor cannot be determined at this time, although the City expects such amounts, if any, to be immaterial. During the year ended June 30, 2003, investors in the Local Governments Investment Pool (LGIP) sustained investments losses due to the bankruptcy of a financing corporation in which LGIP funds were invested. The City’s portion of this investment loss was $1,597,358 and has been recorded as a reduction of investment income. The City has joined a class action lawsuit with the State of Arizona and other investors against the financing corporation in an effort to recover lost funds. The class action lawsuit is in its early stages and the likelihood of outcomes is not estimable or able to be reasonable determined; however, the City may recover a portion of its losses in the long-term.

NOTES TO FINANCIAL STATEMENTS
(Continued) -38-
NOTE 14 - INTERFUND ASSETS, LIABILITIES, AND TRANSFERS
Due (to) from Transfers in (out)Governmental funds
Major governmental funds General fund 4,758,201$ (1,819,368)$
Municipal property corporation fund - (16,542,850) Highway user fund - 782,600 Public safety developmental fund - 20,000 Other governmental funds (238,249) 100,174
4,519,952 (17,459,444) Business-type funds Major business-type funds Water (4,519,952) 15,932 Sewer - 17,296,750
Sanitation - 146,762 (4,519,952) 17,459,444
Total -$ -$
The above due to/due from other funds were short-term receivables or payables in the normal course of the City’ operations and the above transfers resulted in the normal course of the City’s operations. NOTE 15 – DEFICIT FUND NET ASSETS Governmental Funds Equity Deficits:
Transit Fund – Deficit fund equity balance of $109,652 is the result of revenues inadequate to cover expenditures for the current year. The following Special Revenue SLID Districts have deficit fund equity balances as of June 30, 2003 as a result of revenues inadequate to cover expenses. Future revenue collected is expected to fund the deficit fund equity balances.

NOTES TO FINANCIAL STATEMENTS
-39-
Deficit FundBalance
Park Row SLID 9,899$ Sun City Grand III SLID 4,207 Bell West Ranch SLD 1,248 Mountain Vista Ranch III SLD 13,340 Countryside SLD 7,154 NW Ranch #2 7,637 Ashton Ranch SLID Unit III 12,067 Ashton Ranch SLID Unit IV 7,843 Legacy Park GHI SLID 4,187 Rancho Gabriela Phase I 8,678 Sun City Grand 4 SLID 17,593 Rancho Gabriela 2,3 SLD 2,217 Greenway Park II SLD 4,494 Greenway Park III SLD 281 Tash/Weste Meadows SLD 1,814 Roseview 5, 5A, 7&8 18,432 Orchards 1,2,3,4,5 SLD 5,114 Surprise Farms 1A SLD 2,479 Legacy Park Parcels E, F & J 2,514 Sierra Montana SLD 1,352 Bell West Ranch 2 SLD 1,089
There are certain street and lighting districts that reflect a deficit fund variance. This is due to the state-imposed limit on taxes within those districts.
# # # # #


SUPPLEMENTAL SECTION

(Continued) -40-
REQUIRED SUPPLEMENTAL INFORMATIONSCHEDULE OF REVENUES, EXPENDITURES ANDCHANGES IN FUND BALANCES - BUDGET AND ACTUAL GENERAL AND MAJOR SPECIAL REVENUE FUNDSFOR THE YEAR ENDED JUNE 30, 2003
Original FinalBudget Budget Actual
REVENUESTaxes 19,834,200$ 19,834,200$ 21,636,438$ Licenses and permits 1,275,000 1,275,000 1,469,246 Intergovernmental 5,772,100 5,772,100 6,027,330 Charges for services 7,020,000 7,020,000 9,560,210 Fines 610,000 610,000 778,307 Rents 66,000 66,000 431,504 Grants 136,500 136,500 119,309 Investment income 300,000 300,000 (455,667) Other 7,727,500 7,727,500 949,104
Total revenues 42,741,300 42,741,300 40,515,781
EXPENDITURESCurrent
General government 13,294,600 12,244,000 6,513,426 Public safety 12,547,200 12,526,000 11,531,799 Public works and streets 2,326,700 2,366,600 2,278,396 Community services 2,942,600 2,916,400 2,535,905 Culture and recreation 6,446,800 6,303,900 5,572,987
Capital outlay 4,825,600 4,555,700 1,515,086 Debt service:
Principal 190,600 190,600 215,080 Interest and fiscal charges 15,400 15,400 170,134
Total expenditures 42,589,500 41,118,600 30,332,813
REVENUES OVER (UNDER) EXPENDITURES 151,800 1,622,700 10,182,968
OTHER FINANCING SOURCES (USES)Transfers in (out) (2,867,800) (2,867,800) (1,819,368)
NET CHANGE IN FUND BALANCE (2,716,000) (1,245,100) 8,363,600
FUND BALANCES, beginning ofthe year 11,818,000 11,818,000 16,692,310
FUND BALANCES, end of the year 9,102,000$ 10,572,900$ 25,055,910$
CITY OF SURPRISE, ARIZONA
General Fund

(Continued) -41-
REQUIRED SUPPLEMENTAL INFORMATIONSCHEDULE OF REVENUES, EXPENDITURES ANDCHANGES IN FUND BALANCES - BUDGET AND ACTUALGENERAL AND MAJOR SPECIAL REVENUE FUNDS
Original FinalBudget Budget Actual
REVENUESLicenses and permits 22,742,800$ 22,742,800$ 28,742,802$ Rents 5,900,000 5,900,000 5,000,000 Investment income 300,000 300,000 181,835 Other 10,000,000 10,000,000 1,518,436
Total revenues 38,942,800 38,942,800 35,443,073
EXPENDITURESCurrent
General government 245,000 245,000 259,450 Culture and recreation - - 34,628
Capital outlay 58,212,600 60,845,500 25,701,535 Debt Service:
Principal 1,850,000 1,850,000 1,850,000 Interest and fiscal charges 3,089,590 3,089,590 3,088,090
Total expenditures 63,397,190 66,030,090 30,933,703
REVENUES OVER (UNDER) EXPENDITURES (24,454,390) (27,087,290) 4,509,370
OTHER FINANCING USESTransfers out - - (16,542,850)
NET CHANGE IN FUND BALANCE (24,454,390) (27,087,290) (12,033,480)
FUND BALANCES, beginning ofthe year 24,514,800 24,514,800 33,678,762
FUND BALANCES (DEFICIT), end of the year 60,410$ (2,572,490)$ 21,645,282$
Municipal Property Corporation Fund

(Continued) -42-
REQUIRED SUPPLEMENTAL INFORMATIONSCHEDULE OF REVENUES, EXPENDITURES ANDCHANGES IN FUND BALANCES - BUDGET AND ACTUALGENERAL AND MAJOR SPECIAL REVENUE FUNDS
Original FinalBudget Budget Actual
REVENUESTaxes 2,239,500$ 2,239,500$ 2,462,104$ Investment income 40,000 40,000 33,470
Total revenues 2,279,500 2,279,500 2,495,574
EXPENDITURESCurrent
Public works and streets 2,344,000 2,021,500 2,364,301 Community services - 210,800 190,977
Capital outlay 1,266,200 1,125,600 1,031,994
Total expenditures 3,610,200 3,357,900 3,587,272
REVENUES OVER (UNDER) EXPENDITURES (1,330,700) (1,078,400) (1,091,698)
OTHER FINANCING SOURCES Transfers in 850,300 850,300 782,600
NET CHANGE IN FUND BALANCE (480,400) (228,100) (309,098)
FUND BALANCES, beginning ofthe year 510,300 510,300 859,420
FUND BALANCES (DEFICIT), end of the year 29,900$ 282,200$ 550,322$
Highway User Fund

-43-
REQUIRED SUPPLEMENTAL INFORMATIONSCHEDULE OF REVENUES, EXPENDITURES ANDCHANGES IN FUND BALANCES - BUDGET AND ACTUALGENERAL AND MAJOR SPECIAL REVENUE FUNDS
Original FinalBudget Budget Actual
REVENUESDevelopment Fees 743,700$ 743,700$ 1,495,732$ Investment income 1,000 1,000 24,974
Total revenues 744,700 744,700 1,520,706
EXPENDITURESCurrent
General government 10,000 16,000 7,362 Public safety 442,000 503,600 500,402
Capital outlay 2,006,900 1,985,300 1,444,351
Total expenditures 2,458,900 2,504,900 1,952,115
REVENUES OVER (UNDER) EXPENDITURES (1,714,200) (1,760,200) (431,409)
OTHER FINANCING SOURCES (USES)Transfers in (out) - - 20,000
NET CHANGE IN FUND BALANCE (1,714,200) (1,760,200) (411,409)
FUND BALANCES, beginning ofthe year 1,714,200 1,714,200 1,722,298
FUND BALANCES (DEFICIT), end of the year -$ (46,000)$ 1,310,889$
Public Safety Development Fee Fund

-44-
CITY OF SURPRISE, ARIZONA COMBINING BALANCE SHEET NONMAJOR GOVERNMENTAL FUNDSJUNE 30, 2003
Special Debt Total NonmajorRevenue Service Governmental
ASSETS Funds Fund Funds
ASSETS Cash and cash equivalents 5,063,724$ 127,420$ 5,191,144$ Receivables, (net of allowances)
Interest 20,729 - 20,729 Accounts 11,851 - 11,851
Prepaid items 1,849,673 - 1,849,673 Other Assets 3,253 - 3,253
Total assets 6,949,230$ 127,420$ 7,076,650$
LIABILITIESAccounts payable 170,597$ -$ 170,597$ Due to other funds 238,248 - 238,248
Total liabilities 408,845 - 408,845
FUND BALANCEReserved for prepaid items 1,849,673 - 1,849,673 Unreserved, reported in: Special revenue funds 4,690,712 4,690,712
Debt service funds - 127,420 127,420 Total fund balance 6,540,385 127,420 6,667,805
Total liabilities and fund balance 6,949,230$ 127,420$ 7,076,650$
LIABILITIES AND FUND BALANCE

-45-
COMBINING STATEMENT OF REVENUES, EXPENDITURESAND CHANGES IN FUND BALANCESNONMAJOR GOVERNMENTAL FUNDSFOR THE YEAR ENDED JUNE 30, 2003
Special Debt Total NonmajorRevenue Service GovernmentalFunds Fund Funds
REVENUESTaxes 486,800$ 685,334$ 1,172,134$ Intergovernmental 152,810 - 152,810 Charges for services 7,537 - 7,537 Development fees 6,874,077 - 6,874,077 Investment income 78,216 25,882 104,098 Other 218,773 - 218,773
Total revenues 7,818,213 711,216 8,529,429
EXPENDITURESCurrent
General government 198,089 - 198,089 Public works and streets 322,720 - 322,720 Culture and recreation 2,969,603 - 2,969,603 Costs of sales and services (SLD's) 368,044 - 368,044 Administration 138,464 - 138,464
Capital outlay 1,146,545 - 1,146,545 Debt service
Principal - 548,058 548,058 Interest and fiscal charges - 225,667 225,667
Total expenditures 5,143,465 773,725 5,917,190
REVENUES OVER (UNDER) EXPENDITURES 2,674,748 (62,509) 2,612,239
OTHER FINANCING SOURCESTransfers in 100,174 - 100,174
Total other financing sources 100,174 - 100,174
REVENUES AND OTHER FINANCING SOURCESOVER (UNDER) EXPENDITURES 2,774,922 (62,509) 2,712,413
FUND BALANCES, beginning of year 3,765,463 189,929 3,955,392
FUND BALANCES, end of year 6,540,385$ 127,420$ 6,667,805$
CITY OF SURPRISE, ARIZONA

(Continued) -46-
CITY OF SURPRISE, ARIZONACOMBINING BALANCE SHEETNONMAJOR SPECIAL REVENUE FUNDSJUNE 30, 2003
Library, Parks Publicworks 10% Set General Govt.& Recreational Transit Expansion Aside Dev FeeEnhancement Fund Development Square Mile Fund
ASSETSCash and cash equivalents 453,134$ -$ 2,594,561$ 36,082$ 1,434,143$ Receivables, net
Interest 1,881 10,862 146 5,953 Accounts - - - -
Prepaid items 1,849,673 - - - - Other Assets - - 3,253 - -
Total assets 2,304,688$ -$ 2,608,676$ 36,228$ 1,440,096$
LIABILITIESAccounts payable 8,975 3,016$ 83,528$ 2,245$ 37,322$ Due to other funds - 106,636 - - -
Total liabilities 8,975 109,652 83,528 2,245 37,322
Fund balancesReserved for prepaid items 1,849,673 - - - - Unreserved
Undesignated 446,040 (109,652) 2,525,148 33,983 1,402,774
Total fund balances 2,295,713 (109,652) 2,525,148 33,983 1,402,774
Total liabilities and fund balances 2,304,688$ -$ 2,608,676$ 36,228$ 1,440,096$
FUND EQUITY

Del Webb West Point Continental Mountain Sun City Sun CityPark Row Kingswood Sun City Towne Kingswood Vista Grand II Grand III
SLID Park SLD Grand SLD Center SLD SLD Ranch SLD SLD SLD
-$ 81,142$ 85,076$ 81,491$ 36,882$ 29,020$ 38,280$ -$
- 337 353 338 153 120 159 - - - - - - - - - - - - - - - - - - - - - - - - -
-$ 81,479$ 85,429$ 81,829$ 37,035$ 29,140$ 38,439$ -$
-$ -$ 16,692$ -$ -$ -$ 15,342$ 60$ 9,899 - - - - - - 4,147
9,899 - 16,692 - - - 15,342 4,207
- - - - - - - -
(9,899) 81,479 68,737 81,829 37,035 29,140 23,097 (4,207)-
(9,899) 81,479 68,737 81,829 37,035 29,140 23,097 (4,207)
-$ 81,479$ 85,429$ 81,829$ 37,035$ 29,140$ 38,439$ -$
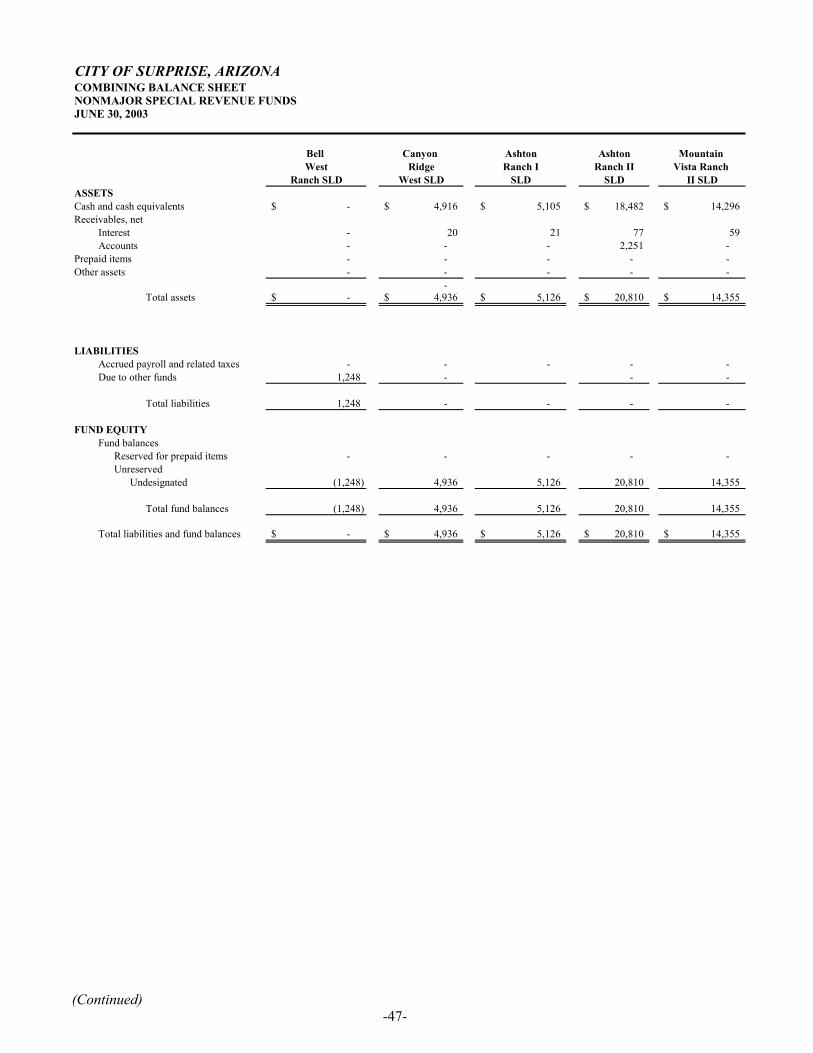
(Continued) -47-
CITY OF SURPRISE, ARIZONACOMBINING BALANCE SHEETNONMAJOR SPECIAL REVENUE FUNDSJUNE 30, 2003
Bell Canyon Ashton Ashton Mountain West Ridge Ranch I Ranch II Vista Ranch
Ranch SLD West SLD SLD SLD II SLDASSETSCash and cash equivalents -$ 4,916$ 5,105$ 18,482$ 14,296$ Receivables, net
Interest - 20 21 77 59 Accounts - - - 2,251 -
Prepaid items - - - - - Other assets - - - - -
- Total assets -$ 4,936$ 5,126$ 20,810$ 14,355$
LIABILITIESAccrued payroll and related taxes - - - - - Due to other funds 1,248 - - -
Total liabilities 1,248 - - - -
Fund balancesReserved for prepaid items - - - - - Unreserved
Undesignated (1,248) 4,936 5,126 20,810 14,355
Total fund balances (1,248) 4,936 5,126 20,810 14,355
Total liabilities and fund balances -$ 4,936$ 5,126$ 20,810$ 14,355$
FUND EQUITY

Mountain Legacy Greenway Ashton RanchVista Ranch Parc Parc Roseview Countryside NW Ranch Bell West SLID
III SLD SLD SLD SLD SLD #2 Ranch 1B Unit III
-$ 5,895$ 13,039$ 17,131$ -$ -$ 6,033$ -$
- 24 54 71 - - 25 - - - 9,600 - - - - - - - - - - - - - - - - - - - - -
-$ 5,919$ 22,693$ 17,202$ -$ -$ 6,058$ -$
- - - - - - - - 13,340 - - - 7,154 7,637 - 12,067
13,340 - - - 7,154 7,637 - 12,067
- - - - - - - -
(13,340) 5,919 22,693 17,202 (7,154) (7,637) 6,058 (12,067)
(13,340) 5,919 22,693 17,202 (7,154) (7,637) 6,058 (12,067)
-$ 5,919$ 22,693$ 17,202$ -$ -$ 6,058$ -$

(Continued) -48-
CITY OF SURPRISE, ARIZONACOMBINING BALANCE SHEETNONMAJOR SPECIAL REVENUE FUNDSJUNE 30, 2003
Ashton Ranch Legacy Park Rancho NW Sun CitySLID GHI Gabriela Ranch 1 Grand 4
Unit IV SLID Phase 1 SLID SLIDASSETSCash and cash equivalents -$ -$ -$ 1,408$ -$ Receivables, net
Interest - - - 6 - Accounts - - - - -
Prepaid items - - - - - Other assets - - - - -
Total assets -$ -$ -$ 1,414$ -$
LIABILITIESAccounts payable -$ -$ -$ -$ 1,976$ Due to other funds 7,843 4,187 8,678 - 15,617
Total liabilities 7,843 4,187 8,678 - 17,593
Fund balancesReserved for prepaid items - - - - - Unreserved
Undesignated (7,843) (4,187) (8,678) 1,414 (17,593)
Total fund balances (7,843) (4,187) (8,678) 1,414 (17,593)
Total liabilities and fund balances -$ -$ -$ 1,414$ -$
FUND EQUITY

Rancho Greenway Greenway Bell West Western Roseview Orchards SurpriseGabriela 2,3 Parc II Parc III Ranch Meadows 5,5A 1,2,3,4,5 Farms 1A
SLID SLID SLID 1A SLID 7&8 SLID SLID
-$ 4$ 5$ 5,817$ -$ -$ -$ -$
- - - 24 - - - - - - - - - - - - - - - - - - - - - - - - - - - -
-$ 4$ 5$ 5,841$ -$ -$ -$ -$
-$ -$ -$ -$ -$ -$ -$ -$ 2,217 4,498 286 - 1,814 18,432 5,114 2,479
2,217 4,498 286 - 1,814 18,432 5,114 2,479
- - - - - - - -
(2,217) (4,494) (281) 5,841 (1,814) (18,432) (5,114) (2,479)
(2,217) (4,494) (281) 5,841 (1,814) (18,432) (5,114) (2,479)
-$ 4$ 5$ 5,841$ -$ -$ -$ -$

(Continued) -49-
CITY OF SURPRISE, ARIZONACOMBINING BALANCE SHEETNONMAJOR SPECIAL REVENUE FUNDSJUNE 30, 2003
Legacy Parc Sierra Bell West MunicipalParcels Montana Ranch Donations CourtE,F & J SLID 2 SLID Fund Enhancement
ASSETSCash and cash equivalents -$ -$ -$ 55,649$ 27,798$ Receivables, net
Interest - - - - - Accounts - - - - -
Prepaid items - - - - - Other assets - - - - -
Total assets -$ -$ -$ 55,649$ 27,798$
LIABILITIESAccounts payable -$ -$ -$ 1,441$ -$ Due to other funds 2,514 1,352 1,089 - -
Total liabilities 2,514 1,352 1,089 1,441 -
Fund balancesReserved for prepaid items - - - - - Unreserved
Undesignated (2,514) (1,352) (1,089) 54,208 27,798
Total fund balances (2,514) (1,352) (1,089) 54,208 27,798
Total liabilities and fund balances -$ -$ -$ 55,649$ 27,798$
FUND EQUITY

Neighborh. EmployeeRevitaliz. Dep
Fund Scholarship Totals
7,168$ 11,167$ 5,063,724$
- 46 20,729 - - 11,851 - - 1,849,673 - - 3,253
7,168$ 11,213$ 6,949,230$
-$ -$ 170,597$ - 238,248
- - 408,845$
- - 1,849,673
7,168 11,213 4,690,712
7,168 11,213 6,540,385
7,168$ 11,213$ 6,949,230$

(Continued) -50-
CITY OF SURPRISE, ARIZONASTATEMENT OF REVENUES, EXPENDITURESAND CHANGES IN FUND BALANCESNONMAJOR SPECIAL REVENUE FUNDS FOR THE YEAR ENDED JUNE 30, 2003
Library, Parks Publicworks 10% Set General Govt.& Recreational Transit Expansion Aside Dev FeeEnhancement Fund Development Square Mile Fund
REVENUESTaxes -$ -$ -$ -$ -$ Intergovernmental 80,610 - - Charges for services - 7,537 - - - Development fees 4,015,540 - 1,750,286 - 1,108,251 Investment income 2,375 183 38,101 5,940 20,843 Other - 96,476 - -
Total revenues 4,017,915 88,330 1,884,863 5,940 1,129,094
EXPENDITURESCurrent
General government - 169,658 9,880 - 4,436 Public works and streets - - 48,364 - Culture and recreation 2,955,362 - - - - Costs of sales of services (SLD's) - - - - - Administration - - - - -
Capital outlay 303,649 - 229,732 105,365 507,799
Total expenditures 3,259,011 169,658 239,612 153,729 512,235
REVENUES OVER (UNDER) EXPENDITURES 758,904 (81,328) 1,645,251 (147,789) 616,859
OTHER FINANCING SOURCES (USES)Interfund transfers in (out) - 41,400 (146,762) 173,400 -
Total other financing sources (uses) - 41,400 (146,762) 173,400 -
NET CHANGE IN FUND BALANCE758,904 (39,928) 1,498,489 25,611 616,859
FUND BALANCES (DEFICIT), beginning of year 1,536,809 (69,724) 1,026,659 8,372 785,915
FUND BALANCES (DEFICIT), end of year 2,295,713$ (109,652)$ 2,525,148$ 33,983$ 1,402,774$

Del Webb West Point Continental Mountain Sun City Sun CityPark Row Kingswood Sun City Towne Kingswood Vista Grand II Grand III
SLID Park SLD Grand SLD Center SLD SLD Ranch SLD SLD SLD
-$ 70$ 265,059$ 1,461$ 140$ -$ 11,221$ 6,003$ - - - - - - - - - - - - - - - - - - - - - - - - 1,863 1,101 2,092 855 693 2,537 - - - - - - - - -
- 1,933 266,160 3,553 995 693 13,758 6,003
480 480 480 480 480 480 480 480 10,141 220,164 35,553 5,267 - - -
- - - - - - - - - 6,332 199,672 6,063
4,887 - - - - - - - - - - - - - - -
5,367 10,621 220,644 36,033 5,747 6,812 200,152 6,543
(5,367) (8,688) 45,516 (32,480) (4,752) (6,119) (186,394) (540)
- - - - - - - -
- - - - - - - -
(5,367) (8,688) 45,516 (32,480) (4,752) (6,119) (186,394) (540)
(4,532) 90,167 23,221 114,309 41,787 35,259 209,491 (3,667)
(9,899)$ 81,479$ 68,737$ 81,829$ 37,035$ 29,140$ 23,097$ (4,207)$

(Continued) -51-
CITY OF SURPRISE, ARIZONASTATEMENT OF REVENUES, EXPENDITURESAND CHANGES IN FUND BALANCESNONMAJOR SPECIAL REVENUE FUNDSFOR THE YEAR ENDED JUNE 30, 2003
Bell Canyon Ashton Ashton Mountain West Ridge Ranch I Ranch II Vista Ranch
Ranch SLD West SLD SLD SLD II SLDREVENUES
Taxes 3,984$ 119$ 286$ 34,179$ 285$ Intergovernmental - - - - - Charges for services - - - - - Development fees - - - - - Investment income - 124 139 140 358 Other 1,850 - - - -
Total revenues 5,834 243 425 34,319 643
EXPENDITURESCurrent
General government 480 480 480 480 480 Public works and streets - - - - - Water project (Fund 2) - - - - - Costs of sales of services (SLD's) - 1,569 5,068 6,464 4,254 Administration - - - - -
Capital outlay - - - - -
Total expenditures 480 2,049 5,548 6,944 4,734
REVENUES OVER (UNDER) EXPENDITURES 5,354 (1,806) (5,123) 27,375 (4,091)
OTHER FINANCING SOURCES (USES)Interfund transfers in (out) - - - - -
Total other financing sources (uses) - - - - -
NET CHANGE IN FUND BALANCE5,354 (1,806) (5,123) 27,375 (4,091)
FUND BALANCES (DEFICIT), beginning of year (6,602) 6,742 10,249 (6,565) 18,446
FUND BALANCES (DEFICIT), end of year (1,248)$ 4,936$ 5,126$ 20,810$ 14,355$

Mountain Legacy Greenway Ashton RanchVista Ranch Parc Parc Roseview Countryside NW Ranch Bell West SLID
III SLD SLD SLD SLD SLD #2 Ranch 1B Unit III
2,114$ 192$ 27,648$ 55,754$ 26,672$ 291$ 9,395$ -$ - - - - - - - - - - - - - - - - - - - - - - - - - 176 108 82 - - 44 - - - - - - - - -
2,114 368 27,756 55,836 26,672 291 9,439 -
480 480 475 480 480 480 480 480 - - - - - - - - - - - - - - - -
7,900 6,941 - 6,524 14,500 5,368 1,921 7,314 - - - - - - - - - - - - - - - -
8,380 7,421 475 7,004 14,980 5,848 2,401 7,794
(6,266) (7,053) 27,281 48,832 11,692 (5,557) 7,038 (7,794)
- - - - - - - -
- - - - - - - -
(6,266) (7,053) 27,281 48,832 11,692 (5,557) 7,038 (7,794)
(7,074) 12,972 (4,588) (31,630) (18,846) (2,080) (980) (4,273)
(13,340)$ 5,919$ 22,693$ 17,202$ (7,154)$ (7,637)$ 6,058$ (12,067)$

(Continued) -52-
CITY OF SURPRISE, ARIZONASTATEMENT OF REVENUES, EXPENDITURESAND CHANGES IN FUND BALANCESNONMAJOR SPECIAL REVENUE FUNDSFOR THE YEAR ENDED JUNE 30, 2003
Ashton Ranch Legacy Park Rancho NW Sun CitySLID GHI Gabriela Ranch 1 Grand 4
Unit IV SLID Phase 1 SLID SLIDREVENUES
Taxes -$ -$ -$ 4,967$ 7,201$ Intergovernmental - - - - - Charges for services - - - - - Development fees - - - - - Investment income - - - 38 - Other - - - - -
Total revenues - - - 5,005 7,201
EXPENDITURESCurrent
General government 480 480 480 360 360 Public works and streets - - - - - Culture and recreation - - - - - Costs of sales of services (SLD's) 4,845 2,040 3,372 3,231 24,434 Administration - - 4,826 - -
Capital outlay - - - - -
Total expenditures 5,325 2,520 8,678 3,591 24,794
REVENUES OVER (UNDER) EXPENDITURES (5,325) (2,520) (8,678) 1,414 (17,593)
OTHER FINANCING SOURCES (USES)Interfund transfers in (out) - - - - -
Total other financing sources (uses) - - - - -
NET CHANGE IN FUND BALANCE(5,325) (2,520) (8,678) 1,414 (17,593)
FUND BALANCES (DEFICIT), beginning of year (2,518) (1,667) - - -
FUND BALANCES (DEFICIT), end of year (7,843)$ (4,187)$ (8,678)$ 1,414$ (17,593)$
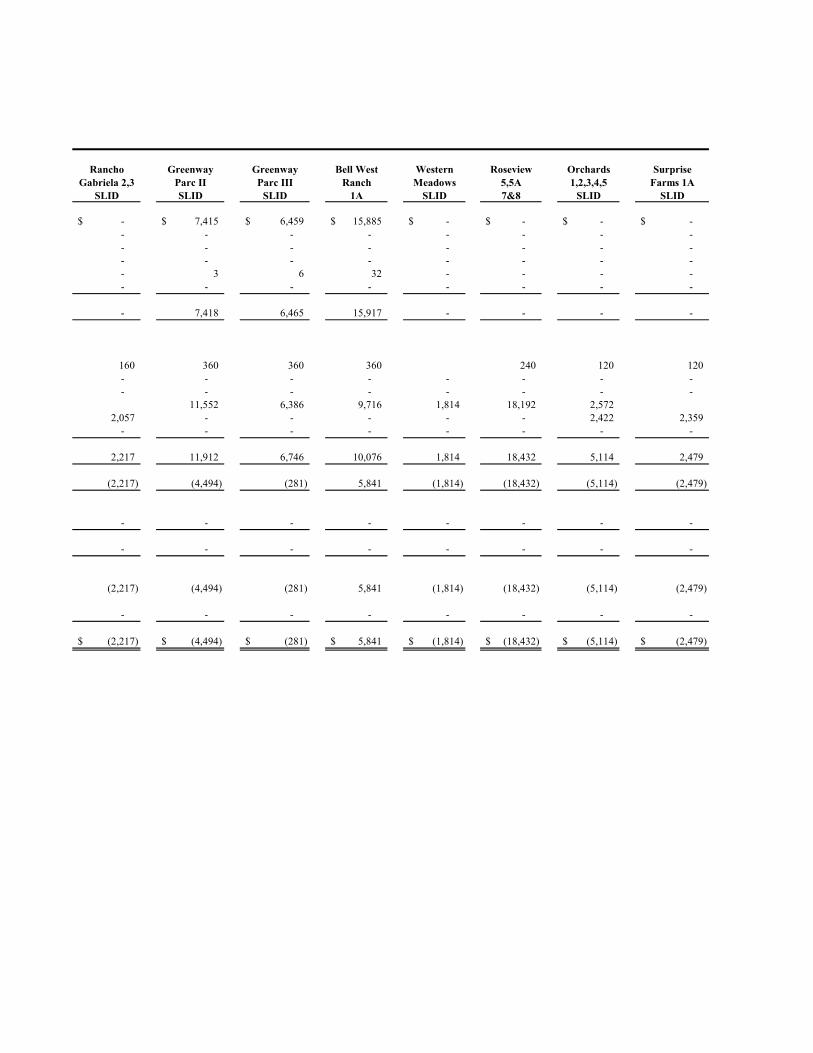
Rancho Greenway Greenway Bell West Western Roseview Orchards SurpriseGabriela 2,3 Parc II Parc III Ranch Meadows 5,5A 1,2,3,4,5 Farms 1A
SLID SLID SLID 1A SLID 7&8 SLID SLID
-$ 7,415$ 6,459$ 15,885$ -$ -$ -$ -$ - - - - - - - - - - - - - - - - - - - - - - - - - 3 6 32 - - - - - - - - - - - -
- 7,418 6,465 15,917 - - - -
160 360 360 360 240 120 120 - - - - - - - - - - - - - - - -
11,552 6,386 9,716 1,814 18,192 2,572 2,057 - - - - - 2,422 2,359
- - - - - - - -
2,217 11,912 6,746 10,076 1,814 18,432 5,114 2,479
(2,217) (4,494) (281) 5,841 (1,814) (18,432) (5,114) (2,479)
- - - - - - - -
- - - - - - - -
(2,217) (4,494) (281) 5,841 (1,814) (18,432) (5,114) (2,479)
- - - - - - - -
(2,217)$ (4,494)$ (281)$ 5,841$ (1,814)$ (18,432)$ (5,114)$ (2,479)$

(Continued) -53-
CITY OF SURPRISE, ARIZONASTATEMENT OF REVENUES, EXPENDITURESAND CHANGES IN FUND BALANCESNONMAJOR SPECIAL REVENUE FUNDSFOR THE YEAR ENDED JUNE 30, 2003
Legacy Parc Sierra Bell West MunicipalParcels Montana Ranch Donations CourtE,F & J SLID 2 SLID Fund Enhancement
REVENUESTaxes -$ -$ -$ -$ -$ Intergovernmental - - - - - Charges for services - - - - - Development fees - - - - - Investment income - - - - - Other - - - 53,557 27,798
Total revenues - - - 53,557 27,798
EXPENDITURESCurrent
General government 80 80 - - - Public works and streets - - - 3,231 - Culture and recreation - - - 14,241 - Costs of sales of services (SLD's) - - - - - Administration 2,434 1,272 1,089 14,013 -
Capital outlay - - - - -
Total expenditures 2,514 1,352 1,089 31,485 -
REVENUES OVER (UNDER) EXPENDITURES (2,514) (1,352) (1,089) 22,072 27,798
OTHER FINANCING SOURCES (USES)Interfund transfers in (out) - - - 32,136 -
Total other financing sources (uses) - - - 32,136 -
NET CHANGE IN FUND BALANCE(2,514) (1,352) (1,089) 54,208 27,798
FUND BALANCES, beginning of year - - - - -
FUND BALANCES, end of year (2,514)$ (1,352)$ (1,089)$ 54,208$ 27,798$

Neighborh. EmployeeRevitaliz. Dep
Fund Scholarship Total
-$ -$ 486,800$ 72,200 - 152,810
- - 7,537 - - 6,874,077 - 383 78,216
38,073 1,019 218,773
110,273 1,402 7,818,213$
- - 198,089$ - - 322,720 - - 2,969,603 - - 368,044
103,105 - 138,464 - - 1,146,545
103,105 - 5,143,465$
7,168 1,402 2,674,748
- - 100,174
- - 100,174
7,168 1,402 2,774,922
- 9,811 3,765,463
7,168$ 11,213$ 6,540,385$

(Continued) -54-
SUPPLEMENTAL INFORMATIONSCHEDULE OF REVENUES, EXPENDITURES ANDCHANGES IN FUND BALANCES - BUDGET AND ACTUALDEBT SERVICE AND SPECIAL REVENUE FUNDSFOR THE YEAR ENDED JUNE 30, 2003
Original FinalBudget Budget Actual
REVENUESTaxes 691,900$ 691,900$ 685,334$ Investment income 10,000 10,000 25,882
Total revenues 701,900 701,900 711,216
EXPENDITURESDebt service 826,600 826,600 773,725
Total expenditures 826,600 826,600 773,725
REVENUES UNDER EXPENDITURES (124,700) (124,700) (62,509)
FUND BALANCES, beginning ofthe year 124,700 124,700 189,929
FUND BALANCES, end of the year -$ -$ 127,420$
Original FinalBudget Budget Actual
REVENUESIntergovernmental -$ -$ 80,610$ Charges for services 8,000 8,000 7,537 Investment income 10,000 10,000 183
Total revenues 18,000 18,000 88,330
EXPENDITURESGeneral government 247,200 247,200 169,658
Total expenditures 247,200 247,200 169,658
REVENUES UNDER EXPENDITURES (229,200) (229,200) (81,328)
OTHER FINANCING SOURCES Transfers in 41,400 41,400 41,400
REVENUE UNDER EXPENDITURES ANDOTHER FINANCING USES (187,800) (187,800) (39,928)
FUND BALANCES, beginning ofthe year 187,800 187,800 (69,724)
FUND BALANCES, end of the year -$ -$ (109,652)$
Transit Fund
CITY OF SURPRISE, ARIZONA
Debt Service Fund
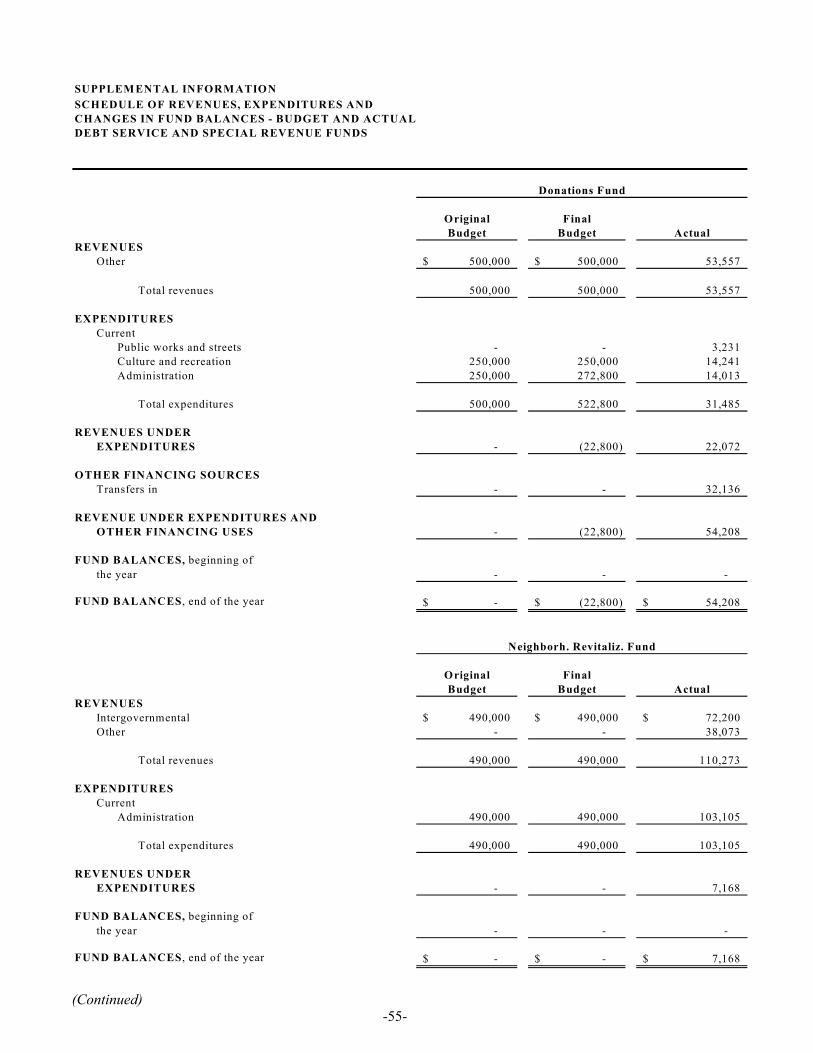
(Continued) -55-
SUPPLEM ENTAL INFORM ATIONSCHEDULE OF REVENUES, EXPENDITURES ANDCHANGES IN FUND BALANCES - BUDGET AND ACTUAL DEBT SERVICE AND SPECIAL REVENUE FUNDS
Original FinalBudget Budget Actual
REVENUESOther 500,000$ 500,000$ 53,557
Total revenues 500,000 500,000 53,557
EXPENDITURESCurrent
Public works and streets - - 3,231 Culture and recreation 250,000 250,000 14,241
Administration 250,000 272,800 14,013
Total expenditures 500,000 522,800 31,485
REVENUES UNDER EXPENDITURES - (22,800) 22,072
OTHER FINANCING SOURCES Transfers in - - 32,136
REVENUE UNDER EXPENDITURES ANDOTHER FINANCING USES - (22,800) 54,208
FUND BALANCES, beginning ofthe year - - -
FUND BALANCES, end of the year -$ (22,800)$ 54,208$
Original FinalBudget Budget Actual
REVENUESIntergovernmental 490,000$ 490,000$ 72,200$ Other - - 38,073
Total revenues 490,000 490,000 110,273
EXPENDITURESCurrent
Administration 490,000 490,000 103,105
Total expenditures 490,000 490,000 103,105
REVENUES UNDER EXPENDITURES - - 7,168
FUND BALANCES, beginning ofthe year - - -
FUND BALANCES, end of the year -$ -$ 7,168$
Neighborh. Revitaliz. Fund
Donations Fund

-56-
SUPPLEMENTAL INFORMATIONSCHEDULE OF REVENUES, EXPENDITURES ANDCHANGES IN FUND BALANCES - BUDGET AND ACTUAL DEBT SERVICE AND SPECIAL REVENUE FUNDS
Original FinalBudget Budget Actual
REVENUESInvestment income 1,000$ 1,000$ 5,940$
Total revenues 1,000 1,000 5,940
EXPENDITURESCurrent
Public works and streets 90,100 90,100 48,364 Capital outlay 180,000 180,000 105,365
Total expenditures 270,100 270,100 153,729
REVENUES UNDER EXPENDITURES (269,100) (269,100) (147,789)
OTHER FINANCING SOURCES Transfers in 173,400 173,400 173,400
REVENUE UNDER EXPENDITURES ANDOTHER FINANCING USES (95,700) (95,700) 25,611
FUND BALANCES, beginning ofthe year 95,700 95,700 8,372
FUND BALANCES (DEFICIT), end of the year -$ -$ 33,983$
10% Set Aside Square Mile

STATISTICAL
SECTION


-57-
Fiscal Year
General Government Public Safety
Public Works and
Streets Community
Services Culture and Recreation
Cost of Sales and Services Admin. Interest Water
Replenish- ment Sewer Sanitation Total
1996/97 1,586,995$ 2,156,627$ 1,550,661$ 473,607$ 736,622$ 15,063$ 28,200$ 405,840$ 51,450$ -$ 1,297,325$ 289,554$ 8,591,944$ 1997/98 2,416,141 3,570,003 2,042,990 619,493 1,199,841 248,328 22,326 322,782 981,564 - 659,109 272,881 12,355,459 1998/99 2,033,748 3,478,494 3,438,777 156,072 1,337,691 159,541 20,361 734,904 640,315 - 991,467 481,446 13,472,814 1999/00 6,219,296 5,262,491 5,325,395 1,339,271 1,677,460 431,550 1,120,788 387,413 1,136,521 10,000 1,393,103 645,457 24,948,743 2000/01 5,341,087 8,617,222 6,095,121 1,925,975 6,253,556 591,290 85,717 2,306,856 1,249,808 32,074 2,017,488 960,484 35,476,679 2001/02 5,641,126 10,638,974 6,385,869 2,271,931 5,959,097 277,592 510,003 4,988,389 1,782,272 104,292 5,659,805 1,171,441 45,390,791 2002/03 7,123,534 12,421,571 6,075,568 2,765,942 8,814,719 368,044 138,464 3,439,953 2,520,676 269,688 5,299,290 1,286,846 50,524,295
1Restricted to last seven fiscal years, this is the first year a CAFR was prepared and the information available on expenditures prior to this was not available in sufficient detail to utilize in the preparation of this schedule.
City of SurpriseGovernment-wide Expenses by Function
Last Seven Fiscal Years1

-58-
Fiscal YearCharges for
Services
Operating Grants and
Contributions
Capital Grants and
Contributions Taxes
Grants and Contributions Not Restricted
to Specific Programs
Unrestricted Investment Earnings Miscellaneous Total
1996/97 3,764,415$ 651,804$ 2,750,033$ 5,491,692$ 1,598,720$ 458,793$ 961,438$ 15,676,895$ 1997/98 8,033,523 715,187 5,799,152 8,147,674 1,734,403 681,787 393,162 25,504,888 1998/99 7,664,019 1,089,718 4,954,062 11,034,560 2,034,199 1,256,548 330,398 28,363,504 1999/00 8,992,188 697,460 6,352,992 12,372,499 2,089,608 1,787,835 466,800 32,759,382 2000/01 14,194,713 671,386 11,523,869 17,252,888 2,330,568 5,539,740 310,662 51,823,828 2001/02 27,109,896 3,001,252 12,275,834 25,730,075 3,438,860 2,487,976 1,379,420 75,423,313 2002/03 26,738,629 472,278 57,003,550 23,064,286 5,919,754 (395,218) 1,137,581 113,940,860
1 Only seven years of financial information exists is sufficient detail to aggregrate in this format.
City of SurpriseGovernment Wide Revenues
Last Seven Fiscal Years1

-59-
Fiscal Year
General Government
Public Safety
Public Works and
Streets Community
Services Culture and Recreation
Cost of Sales and Services Administrative Debt Service Total
1996/97 1,744,174$ 2,657,903$ 1,841,866$ 473,607$ 791,971$ 15,063$ 28,200$ 1,426,715$ 8,979,499$ 1997/98 2,501,228 4,148,482 2,240,259 619,493 1,208,159 248,328 22,326 1,201,533 12,189,809 1998/99 2,343,274 4,556,219 3,687,772 156,072 2,452,738 159,541 20,361 1,207,914 14,583,889 1999/00 6,184,242 5,244,899 5,330,203 1,339,271 1,634,867 431,550 1,120,788 874,973 22,160,792 2000/01 5,838,779 8,895,622 6,197,062 1,925,975 6,246,519 591,290 85,717 4,664,269 34,445,233 2001/02 6,999,921 10,187,801 5,031,757 2,255,604 4,639,572 277,592 510,003 5,449,653 35,351,903 2002/03 6,978,327 12,032,201 4,965,417 2,726,882 8,577,218 368,044 138,464 6,097,029 41,883,582
1Restricted to last seven fiscal years, this is the first year a CAFR was prepared and the information available on expenditures prior to this was not available in sufficient detail to utilize in the preparation of this schedule.2Does not include Capital Outlay
City of SurpriseGeneral Governmental Expenditures by Function2
Last Seven Fiscal Years1

-60-
Fiscal Year Taxes
Licenses and Permits
Inter-govern-mental
Charges for Services Fines Rents Donations
Development Fees
Investment Earnings Misc. Total
1996/97 5,491,692$ 1,981,144$ 3,327,969$ 283,334$ 252,339$ 251,362$ 16,862$ 242,220$ 331,973$ 960,938$ 13,139,832$ 1997/98 8,147,674 3,776,847 3,179,802 334,849 248,515 357,947 10,756 507,360 545,668 296,310 17,405,730 1998/99 11,034,560 4,560,554 4,167,068 270,001 309,972 272,642 124,018 499,306 1,042,756 187,911 22,468,788 1999/00 12,372,499 5,345,864 3,554,763 187,012 403,310 461,878 16,318 685,424 1,387,719 445,753 24,860,541 2000/01 17,252,888 4,900,470 3,822,729 225,117 530,101 5,063,371 21,864 3,160,751 5,012,497 357,279 40,347,066 2001/02 21,733,191 4,518,042 6,065,448 6,925,318 681,061 5,630,923 9,336 4,551,017 2,127,574 1,560,586 53,802,496 2002/03 25,270,676 30,212,048 6,180,140 9,567,747 778,307 5,431,504 119,309 8,369,809 (111,290) 2,686,313 88,504,563
1 Only seven years of financial information exists is sufficient detail to aggregrate in this format. 2Includes general, MPC, highway user, public safety development, debt service and special revenue funds.
Fiscal Year Property Tax Sales Tax
Franchise & Business Licenses Total Auto Lieu
Street Lighting
District Tax1996/97 1,666,635$ 3,295,691$ 252,566$ 5,214,891$ 276,801$ 11,795$ 1997/98 1,454,176 6,044,297 342,561 7,841,033$ 306,457 - 1998/99 1,553,843 8,649,516 468,987 10,672,346$ 362,214 408,845 1999/00 1,681,033 9,530,907 761,629 11,973,569$ 398,930 445,935 2000/01 2,415,461 13,298,824 985,407 16,699,693$ 553,196 964,577 2001/02 2,350,274 17,198,508 1,174,630 20,723,412$ 1,009,779 761,988 2002/03 2,945,714 18,649,326 1,469,246 23,064,286$
1 Only seven years of financial information exists is sufficient detail to aggregrate in this format.
General Government Tax Revenues by Source Last Seven Fiscal Years1
City of SurpriseGeneral Government Revenues by Source
Last Seven Fiscal Years1, 2
City of Surprise

-61-
Fiscal YearTotal Tax
LevyCurrent Tax Collections
Percent of Current Taxes
Collected
Delinquent Tax
CollectionsTotal Tax
Collections
Ratio of Total Tax Collections to Total Tax Levy
Outstanding Delinquent
Taxes
Ratio of Delinquent Taxes to Total Tax Levy
1996/97 1,016,647 923,966 90.9% 6,968 930,935 91.6% 85,712 8.4%1997/98 1,013,125 937,128 92.5 18,776 955,904 94.4 57,221 5.6 1998/99 1,144,130 1,050,014 91.8 3,083 1,053,097 92.0 91,033 8.0 1999/00 1,250,000 1,238,869 99.1 - 1,238,869 99.1 11,131 0.9 2000/01 657,800 614,901 93.5 16,732 631,632 96.0 26,168 4.0 2001/02 1,394,900 1,371,554 98.3 - 1,371,554 98.3 23,346 1.7 2002/03 1,734,200 1,717,390 99.0 34,462 1,751,852 101.0 16,810 1.0
1Limited all schedules to seven years to be consistent with restrictions on revenue and expenditure schedules in this section.
City of SurprisePrimary Property Tax Levies and Collections1

-62-
Exemptions Ratio of Total
Year Assessed ValueEstimated Actual
Value Real PropertyAssessed
ValueEstimated
Actual Value
Assessed Value to Total
Estimated Actual Value
1996/97 51,803,339$ 355,668,191$ 3,353,245$ 48,450,094$ 355,668,191$ 13.62%1997/98 64,436,219 458,500,211 3,542,274 60,893,945 458,500,211 13.28 1998/99 92,039,533 672,327,949 5,030,081 87,009,452 672,327,949 12.94 1999/00 129,054,533 1,002,586,737 5,214,223 123,840,310 1,002,586,737 12.35 2000/01 181,991,654 1,507,408,770 5,897,004 176,094,650 1,507,408,770 11.68 2001/02 235,522,019 1,977,250,961 5,859,449 229,662,570 1,977,250,961 11.62 2002/03 287,397,730 2,419,215,265 7,206,831 280,190,899 2,419,215,265 11.58
1Limited all schedules to seven years to be consistent with restrictions on revenue and expenditure schedules in this section.2 Source: Maricopa County Assessor's Office
Real Property Total
Assessed and Estimated Actual Value of PropertyCity of Surprise
Last Seven Fiscal Years1,2

-63-
YearOperating
Millage
Debt Service Millage
Total City Millage
Operating Millage
Debt Service Millage
County Library
Total County Millage
Operating Millage
Debt Service Millage
Total School District Other Total
1997 0.4089 1.2806 1.6895 1.1054 0.1575 0.0421 1.3050 5.9232 2.2044 8.1276 0.3425 11.46461998 0.4155 0.9413 1.3568 1.1265 0.1364 0.0421 1.3050 4.3921 1.5918 5.9839 0.3425 8.98821999 0.4155 0.9413 1.3568 1.1472 0.1312 0.0421 1.3205 4.1829 1.4064 5.5893 0.3270 8.59362000 0.411 0.6298 1.0408 1.1884 0.1085 0.0421 1.3390 4.5713 1.5735 6.1448 0.2858 8.81042001 0.6632 0.4400 1.1032 1.1641 0.1152 0.0421 1.3214 4.3012 1.2575 5.5587 0.2534 8.23672002 0.6632 0.1777 0.8409 1.1832 0.0876 0.0421 1.3129 4.0828 1.3021 5.3849 0.2319 7.77062003 0.6936 0.2165 0.9101 1.2108 0.0700 0.0521 1.3329 4.3099 1.5850 5.8949 0.3389 8.4768
1Limited all schedules to seven years to be consistent with restrictions on revenue and expenditure schedules in this section.2 Source: Maricopa County Assessor's Office
Dysart School District
City of SurpriseProperty Tax Rates2
Direct and Overlapping GovernmentsLast Seven Fiscal Years1
City of Surprise Maricopa County

-64-
Taxpayer Type of Property
2001-02 Assessed Valuation
As % of City's Total Assessed
ValuationArizona Public Service Company Gas & Electric Utility 8,226,445$ 3.49%Del Webb Construction Vacant Land 3,174,718 1.35%Sun City Grand Drive-In/Golf Course/Race Track 2,619,466 1.11%Cox Communications TV System 2,297,510 0.98%Southwest Gas Corporation Gas & Electric Utility 2,163,067 0.92%Elliott Homes Vacant Land 1,892,550 0.80%Surprises Village Co. L.L.C. Vacant Land 1,868,464 0.79%Qwest U.S. West Communications, Inc. TV System 1,729,138 0.73%Target Corp. Department Store 1,630,080 0.69%Paseo Village Ltd. Partnership Shopping Center 1,568,898 0.67%Grand Village Deborado LLC Shopping Center 1,549,625 0.66%Wal Mart Stores Shopping Center 1,509,567 0.64%Arizona -American Water Co. Water Utility 1,382,983 0.59%Home Depot Shopping Center 1,280,700 0.54%Albertson's Stores Shopping Center 1,114,787 0.47%Windmill Inn Hotel 1,045,045 0.44%Alliance Residential Co. Apartments 909,901 0.39%Surprise Center Development Vacant Land 835,023 0.35%
36,797,967 15.62%
1Data obtained from the Maricopa County Treasurer's Office.2Most recent data available.
City of SurprisePrincipal Taxpayers1
June 30, 20022

-65-
Assessed valuations:Secondary Assessed Value 280,190,899$
Unrestricted-Legal debt marginDebt limitation-6 percent of total secondary assessed valuation 16,811,454$ Debt applicable to limitation:Total Bonded Debt 60,917,738$ Less: Water, Light, Sewer, Open Space and Park Bonds 55,995,000
Amount available for repayment of 127,420 general obligation bonds
Total debt applicable to limitation 4,795,318 Unrestricted Legal debt margin 12,016,136$
Assessed valuations:Secondary Assessed Value 280,190,899$
Restricted-Legal debt marginDebt limitation-20 percent of total secondary assessed valuation 56,038,180$ Debt applicable to limitation:Total Bonded Debt 60,917,738$ Less: Debt covered under 6% limitation Water, Light, Sewer, Open Space and Park Bonds 60,790,318
Amount available for repayment of 127,420 general obligation bonds
Total debt applicable to limitation - Restricted Legal debt margin 56,038,180$
1See note 8 - Legal Debt Limit
June 30, 2003
City of SurpriseComputation of Legal Debt Margin 6%1
June 30, 2003
Computation of Legal Debt Margin 20%1

-66-
Fiscal Year Population1
Secondary Assessed
Value2Gross
Bonded Debt3Less Debt
Service Fund4Net Bonded
Debt
Ratio of Net Bonded Debt to Assessed Value
Net Bonded Debt per Capita
1996/97 16,405 48,450,094$ 7,925,106$ 324,640$ 7,600,466$ 15.69% 463$ 1997/98 18,685 60,893,945 7,466,355 432,586 7,033,769 11.55 376 1998/99 26,145 87,009,452 6,993,345 426,816 6,566,529 7.55 251 1999/00 30,848 6 123,840,310 6,505,784 468,715 6,037,069 4.87 196 2000/01 38,400 176,094,650 5,998,371 520,891 5,477,480 3.11 143 2001/02 45,125 229,662,570 5,470,796 189,929 5,280,867 2.30 117 2002/03 59,000 280,190,899 4,922,738 127,420 4,795,318 1.71 81
1Unless otherwise noted, annual estimates provided by Arizona Department of Economic Security or Maricopa County2From the Assessed and Estimated Actual Value of Property table in this section3Amount does not include debt related to Water, Light, Sewer, Open Space and Park Bonds4Amount available for repayment of general obligation bonds5Limited all schedules to seven years to be consistent with restrictions on revenue and expenditure schedules in this section.6Per 2000 Census
City of Surprise
To Assessed Value and Net General Obligation Bonded Debt per CapitaRatio of Net General Obligation Bonded Debt
Last Seven Fiscal Years

-67-
Fiscal Year Principal InterestTotal Debt
Service
Total Governmental Expenditures
Ratio of Net Bonded Debt to Assessed Value
1996/97 1,024,775$ 430,140$ 1,454,915$ 6,547,775$ 22.22%1997/98 878,751 345,109 1,223,860 10,119,122 12.09 1998/99 473,010 303,622 1,228,275 10,624,683 11.56 1999/00 487,561 285,057 772,618 21,376,250 3.61 2000/01 507,413 267,113 774,526 28,909,970 2.68 2001/02 527,575 246,588 774,163 31,684,592 2.44 2002/03 548,058 210,588 758,646 37,707,842 2.01
1General obligation bonds only.2Excludes bond issuance and other costs3Limited all schedules to seven years to be consistent with restrictions on revenue and expenditure schedules in this section.
Last Seven Fiscal Years3
City of SurpriseRatio of Annual Debt Service ExpendituresFor General Obligation Bonded Debt1, 2,
to Total General Governmental Expenditures
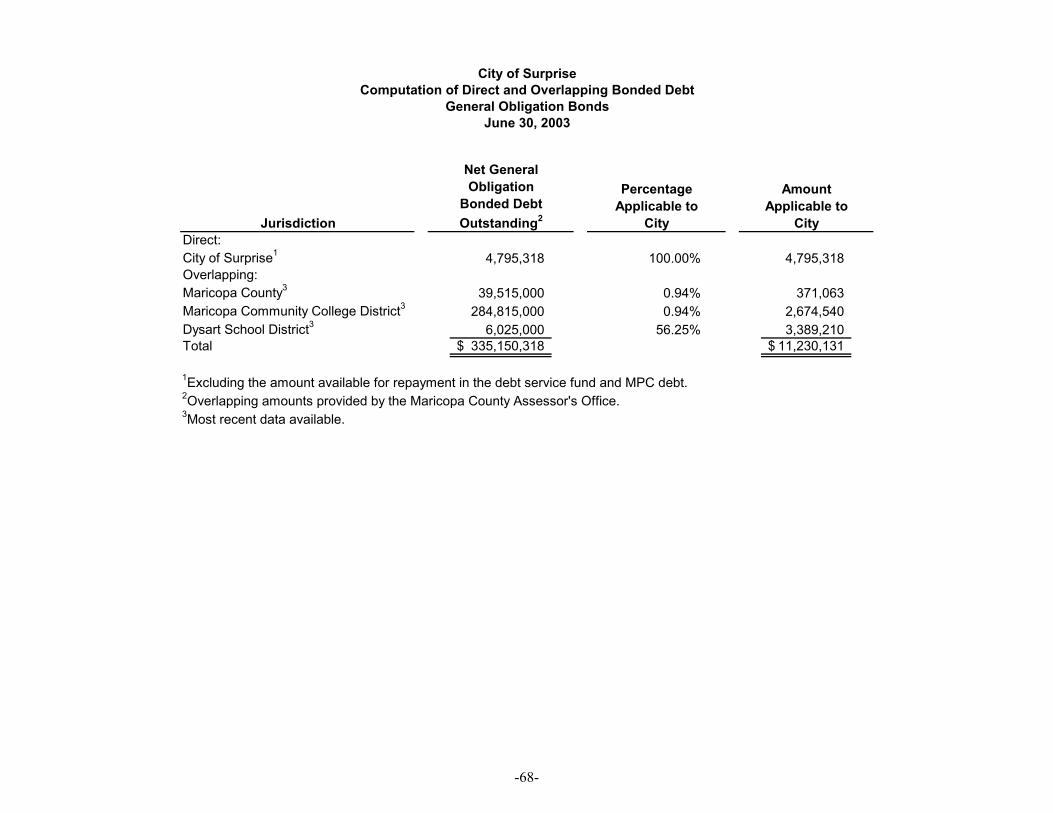
-68-
Jurisdiction
Net General Obligation
Bonded Debt Outstanding2
Percentage Applicable to
City
Amount Applicable to
CityDirect:City of Surprise1 4,795,318 100.00% 4,795,318 Overlapping:Maricopa County3 39,515,000 0.94% 371,063 Maricopa Community College District3 284,815,000 0.94% 2,674,540 Dysart School District3 6,025,000 56.25% 3,389,210 Total 335,150,318$ 11,230,131$
1Excluding the amount available for repayment in the debt service fund and MPC debt.2Overlapping amounts provided by the Maricopa County Assessor's Office.3Most recent data available.
City of SurpriseComputation of Direct and Overlapping Bonded Debt
General Obligation BondsJune 30, 2003

-69-
Year Commercial Residential Total
Commercial Permits
CompletedCommercial
Valuation
Residential Number of
UnitsResidential Valuation Bank Deposits4
1997 179,607,529$ 176,060,662$ 355,668,191$ 23 $5,627,655 981 $69,876,893 11,148,000$ 1998 146,759,338 311,740,873 458,500,211 31 13,752,923 2,812 261,260,865 8,238,000 1999 293,383,163 378,944,786 672,327,949 30 17,387,674 3,070 298,613,520 7,519,000 2000 380,134,773 622,451,964 1,002,586,737 61 25,889,014 3,262 327,300,941 59,495,000 2001 513,908,896 993,499,874 1,507,408,770 86 25,187,420 3,215 323,247,757 159,677,000 2002 632,889,659 1,344,361,302 1,977,250,961 82 29,056,290 3,008 333,289,300 246,379,000 2003 745,887,218 1,673,328,047 2,419,215,265 13 2 11,105,099 2 1,593 2 209,904,969 2 Not yet available
1Limited all schedules to seven years to be consistent with restrictions on revenue and expenditure schedules in this section.2Includes only the first six months of calendar year 20033Source: Maricopa County Treasurer's Office4Source: Federal Deposit Insurance Corporation, most recent data available.
Property Value2 Commercial Construction Residential Construction
City of SurpriseProperty Value, Construction and Bank Deposits
Last Seven Fiscal Years1

City of SurpriseMiscellaneous Statistics
June 30, 2003
Date of Incorporation 1960Form of Government Council/ManagerNumber of employees (excluding police and fire):
Classified 326Exempt 78
Area in square miles 74
Name of Government facilities and services:Miles of streets 540Number of street lights 435Culture and Recreation:
Community Centers 2Parks 5Swimming Pools 1
Fire Protection:Number of stations 4Number of fire personnel and officers 60Number of calls answered 5,086Number of inspections conducted 1,796
Police Protection:Number of stations 2Number of police personnel and officers 78Number of patrol units 44Number of law violations:
Criminal traffic Caseload 1,847Misdemeanor Caseload 1,974Civil Traffic Caseload 8,799Hearings 322Bench Trials 32Jury Trials 4Search Warrants 14Orders of Protection & Injunction 192
Sewerage System:Number of treatment plants 2Number of service connections 17,293Daily average treatment in gallons 7,200,000Maximum daily capacity of treatment plant in gallons 18,000,000
Water systems:Number of service connections 5,939Daily average consumption in gallons 1,100,000Maximum daily capacity of plant in gallons 3,300,000
-70-

-71-
Total Population 30,848
Per Capita Income 21,451$
Median Household Income 44,156$
Median Age 50
School Enrollment 5,356
Education Level 13.5
City of SurpriseDemographic Statistics
Per 2000 Census