City of Satellite Beach Sustainability Action Plan 2017 Documents/City... · 2 City of Satellite...
49
GoGreenSB.org City of Satellite Beach Sustainability Action Plan 2017
Transcript of City of Satellite Beach Sustainability Action Plan 2017 Documents/City... · 2 City of Satellite...

G o G r e e n S B . o r g
City of Satellite Beach Sustainability Action
Plan 2017

2
City of Satellite Beach Sustainability Action Plan
2017
Report to the City of Satellite Beach
May 3, 2017
Z. Eichholz and K. Lindeman Dept. of Education & Interdisciplinary Studies
Florida Institute of Technology Edited by Rochelle W. Lawandales, AICP
3
Table of Contents A. Letter to Residents: For Today and Tomorrow B. Message From Mayor Frank Catino C. Executive Summary
D. Taking Action
E. Sustainability Action Plan
1. Built Environment a. Stressors b. Recommendations
2. Land and Water Systems a. Stressors b. Recommendations
3. Energy and Transportation a. Stressors b. Recommendations
4. Community Outreach a. Stressors b. Recommendations
5. Quality of Life a. Stressors
b. Recommendations F. Measuring Progress Acknowledgements Literature Cited Appendices: 1-4

4
For Today and Tomorrow
With the future of our special community in mind, the City of Satellite Beach has constructed its first Sustainability Action Plan as a way to prepare for seen or unseen resilience challenges. Moving forward, our citizens can maintain a healthy, prosperous, and sustainable future for generations to come.
This Plan is for all those who have or will experience this beautiful city in the past, present, or future. Satellite Beach is a community built on a historical foundation of great scientific advancement and exploration. Each thundering rocket launch that streaks into the sky from the nearby Cape brings wonder and knowledge, and reminds us of what we are together capable of achieving. Sustainability is more than just caring for environmental assets. Sustainable development also spurs a spirit of innovation to create economic prosperity and improve quality of life while building a society that thinks beyond its time.
Figure 1. An Atlas V rocket soars into space as seen from the shores of Satellite Beach.
Photo credit: https://www.reddit.com/user/johnkphotos

5
A Message from Mayor Frank Catino
While living in the paradise that is Satellite beach for almost 60 years, I often find myself looking towards the future, thinking about sustainability and how we can adjust our behavior to be more efficient and effective. There have been numerous advances in the fields of sustainability and the cities of Florida are taking lead in applying these new technologies and practices. It is with this in mind that the City of Satellite Beach has conducted a report on sustainability looking at
where we are currently to better understand how to move forward. One way we are moving forward is with this Sustainability Action Plan (SAP). When fishing it’s important to choose the right bait, this plan is the right bait to catch the fish of sustainability. I support this plan because its goals are achievable and will produce tangible results with measurable success. The city has conducted extensive outreach about this plan to you the residents, friends and neighbors that call Satellite beach home. You have spoken with me and staff at events and meetings about this plan and the things that we love about this city. Talking with you reminds me how fortunate we are to be part of this great city and of all the hard work that is put into making it feel like home. From the miles of beach and lagoon shorelines to the numerous parks like Pelican Park and Samson’s Island as well as the community facilities, each one of these amenities help create the City that is home to us all. As citizens, you make this city home by being involved and sharing your cares and concerns and participating in events creating a vision for the city. It is with this in mind that the Sustainability Action Plan was created. It builds on the inspiration that you have brought by taking part in sustainable practices and technologies from solar panels and rain barrels to energy efficient windows and native landscaping all of which results in an increased property value and quality of life for everyone. I hope this plan inspires you as you have inspired the City. By being aware of what is happening in the world today, we can catch this wave of sustainability and ride it into a future that is both efficient and effective. This city is our home and we all want it to continue to be a home that we can both be proud of and enjoy for years to come. Please read this plan and see how the City is becoming more sustainable for the future.
Figure 2. City of Satellite Beach welcome sign along A1A. Photo credit: http://ihmontessori.com/satellite-beach-schools/

6
Executive Summary
The City of Satellite Beach began the process of planning and writing its Sustainability Action Plan in 2016 with the establishment of a city Sustainability Board. Sustainability action plans are living documents that are meant to display and guide a city’s current and future sustainability-based endeavors that range from policy development to infrastructure improvements. The Plan that you are currently reading is meant to be adaptable, allowing the City to adaptively manage based on economic, social, and environmental needs.
There are numerous principles, plans, and indicators to measure performance across all three principles of societal sustainability: Economic, Social, and Environmental.
The City started this process by compiling a Sustainability Assessment Report (SAR, 2016) that identified high priority indicators and measurements to be addressed in the sustainability program using five broad categories:
• Built environment
• Land and water systems
• Energy and transportation
• Community outreach
• Quality of life These five categories include 33 subcategories of specific components that capture the goals and culture of the community with a focus on recommended actions for implementation. The framework of the Plan outlines opportunities and recommendations under the five primary categories listed above. This allows for the identification of a hierarchical structure of terms, development of action plans and implementation processes for each indicator, and then proffer a full suite of measurements or indicators to create checkpoints to ensure full compliance and quality controls. The original Sustainability Assessment Report (SAR) prepared by Florida Institute of Technology students is a separate document. The salient parts of the SAR, the assessment table matrix is located in Appendix 1. Due to the sheer number of indicators (121) within the prior assessment, not all are detailed at the individual level. Those indicators of the highest potential near-term priority (currently estimated in column 8 of the assessment matrix in Appendix 1) are highlighted in the Measuring Progress section. These priorities are based on evaluations with City staff, Sustainability Board members, and other City of Satellite Beach citizens. Priority recommendations at the end of each of the five categories for residents and businesses owners to guide and provide options for future sustainability based-actions that can be taken across the City. The City Council will use information to set priorities
Figure 3. The three capitals of sustainability. Photo credit: https://inside.mines.edu/SUS-Sustainability

7
based on this plan and guidance from the community and city boards to adopt appropriate actions and measurement protocols to optimize plan implementation. City staff and members of the Sustainability Board, through review of the Appendix 1 indicators and SAR, have targeted twenty initiatives that the City government can pursue over the next five years to lead by example. These are not the only things the City can do, but include the many near-term high priority initiatives identified in this planning process. These twenty targets, collectively called the Green Achievement Targets (GATs), are detailed in the text. They represent six recommendations from the Built Environment category, six from the Land and Water Systems category, four from the Energy and Transportation category, three from the Community Outreach category, and one from the Quality of Life category. Based on metric reviews and assessments, these targets will be re-examined and amended by City staff and Sustainability Board members as needed, at least every five years after their implementation.
This Sustainability Action Plan will help the City of Satellite Beach improve the quality of the City’s natural environment, expand economic opportunities for residents and business leaders, reduce and mitigate risk posed by natural disasters and climate change, increase community awareness on how residents can help and build overall community resilience. With this document, the City will continue its commitment to maintaining its economic vitality and continuity, citizens’ health, and community environmental wellbeing. Satellite Beach is committed to the future by optimizing its present.
Figure 4. Nighttime image of the State of Florida taken from the International Space Station. Major urban development is seen across the state, especially along the coast.
Photo credit: http://earthobservatory.nasa.gov/IOTD/view.php?id=84737

8
Taking Action Sustainability is broadly defined as the act of meeting the needs of the present without compromising the ability of future generations to meet their own needs (Appendix 2). To ensure these future needs are not compromised, current resources and the natural environment must be adaptively managed using sustainable actions that lower resource consumption, reduce sources of pollution, spur habitual change through education and awareness, and enhance the community’s socio-economic conditions.
Many examples of sustainable development have been pioneered by city and local governments (Bowser et al., 2015). Anthropogenic forces across the globe are having an impact on the planet that are diminishing its ability to sustain and support current habits of consumption, energy production, manufacturing, agriculture, and waste disposal. If the environment cannot be sustained, neither can the people or economies within. Citizen engagement allows communities to be more effective at implementing best practices to confront these challenges.
Globally, cities account for 80% of all greenhouse gas emissions and consume 75% of all electricity (UN Habitat). Today, 54% of the world’s population lives in urban areas, resulting in most of the planet’s resources being diverted to and consumed in these urban areas. By 2050, this percentage is expected to increase to 66% of the world’s population (Collyer, 2015). Some U.S. cities are
committing to convert their energy generation to 100% renewable energy within the next 20 years. A comparable example to Satellite Beach is Park City, Utah, that is striving to meet
100% of its energy needs with renewable energy by 2032 (Climate Reality Project, 2016). St. Petersburg, Florida has also recently committed to going 100% renewable (Lindberg, 2016). A list of some of these cities can be seen in Table 1.
In 2015, the City of San Francisco became the first U.S. city to ban plastic bottles to try and reduce plastic pollution (Jensen, 2016). The City of Big Spring, Texas became the first city in the U.S. to use filtered reclaimed water as its primary drinking source to contend with intense drought in 2011 (CBS, 2014). Austin, Texas, a city of nearly a million people, aims to be carbon neutral by 2020 (Carbon Neutral, 2013). Satellite Beach has started a reusable bag program and is exploring eliminating the use of balloons and other plastics for city facilities and functions. Satellite Beach, a small city on the Space Coast of just over 10,000 people, is no stranger to change and advancement. Established in 1951 just several miles south of Cape Canaveral in the shadow of the Space Race, Satellite Beach has watched the pinnacle of human ingenuity and
Table 1. Cities pursing 100% renewable energy include the following.
City/State Target year
Greensburg, KS 2013
Burlington, VT 2014
Aspen, CO 2015
Georgetown, TX 2017
Grand Rapids, MI 2020
East Hampton, NY 2020
San Jose, CA 2022
San Francisco, CA 2030
Rochester, MN 2031
Park City, UT 2032
San Diego, CA 2035

9
achievement literally take off from its shores since its foundation. The Space Race was one of humanity’s greatest challenges. It defined an entire generation and started new cultures in science, engineering, technology, and education that thrive to this day. Satellite Beach’s Sustainability Action Plan will take its place among approximately 20 city sustainability plans in Florida, listed in Table 2. Most of these cities have a larger population and geographic size when compared to Satellite Beach, making this plan relatively unique in scale. Sustainability planning also occurs at the county scale in Florida as shown in Figure 5, with at least 9 of 67 Florida counties having sustainability plans. The Southeast Florida Regional Climate Change Compact, an agreement among Palm Beach, Broward, Miami-Dade, and Monroe County to pursue cooperative resilience planning, is an example of multi-county regional sustainability planning and development.
Satellite Beach faces challenges on local (e.g., stormwater runoff), regional (e.g., pollution in the Indian River Lagoon), and global levels (e.g., sea level rise). Sandwiched between the Atlantic Ocean and the Indian River Lagoon (IRL) on a narrow barrier island, the City and its aquatic resources are vulnerable to extreme weather, sea level rise, coastal flooding, loss of revenues from declining commerce, aging infrastructure, and numerous water quality challenges.
Figure 5. Counties shaded in green have
countywide sustainability plans. Photo credit: Alexis Miller
City Sustainability Plan Draft Year
Plan Updates
Sustainability Assessment
Climate Change Reference
Palm Bay 2010 - Not Available Yes Fort Lauderdale
2011 2015 Not Available Yes
Coconut Creek 2009 2009 - 2014 Available Yes Hollywood In Progress - - - Davie 2011 - Not Available Yes Tampa Annual since 2013 2013 - 2014 Available No Tallahassee 2015 - Not Available No Pinecrest 2010 - Not Available Yes Key Biscayne 2014 - Not Available Yes Miami Beach 2010 - Not Available Yes Marathon 2012 - Not Available Yes Orlando 2012 (municipal) - Not Available Yes Winter Park 2012 2015 Not Available Yes West Palm Beach
2012 - Not Available Yes
Delray Beach 2013 - Not Available No Clearwater 2011 - Not Available Yes Largo 2011 - Not Available No DeLand 2009 - Not Available No
Table 2. Florida city sustainability plans as of 2016. Appendix 4 provides links for all these plans.

10
Satellite Beach intends to lead by example when managing 21st century challenges. The City has been striving to reduce its environmental impact for years (Appendix 3) as it has seen the effects human activity has had on local ecosystems. Large stormwater improvements and retrofit programs, land acquisition and trades for creating new retention/detention ponds for pre-treatment of run-off, Xeriscape landscaping programs, community gardens, and building retrofits with solar and LEED certified materials are all part of the new vocabulary of a Sustainable Satellite Beach. Additionally, Satellite Beach owns the largest amount of public beachfront of any community in Brevard County. These actions represent ongoing efforts to design a sustainable community.
According to Local Governments for Sustainability (ICLEI, 2015), sustainable cities work towards environmentally, socially, and economically healthy systems. Building and developing a city to incorporate sustainability metrics allows it to become more resilient and able to adapt to the unexpected (Tanguay 2009). The City has developed and continues to expand a science-based approach to evaluate potential impacts from climate change upon a variety of infrastructure types. This is to develop best practices to handle impacts from disasters in all pre, present, and post time frames. Sustainability can reinvigorate a community, opening up economic and social well-being opportunities that attract new residents and businesses. The Indian River Lagoon is the largest and one of the most diverse lagoon ecosystems in the Northern Hemisphere. The lagoon is home to over 3,000 species of plants and animals and according to a 2016 Treasure Coast Regional Planning Council economic analysis, the lagoon has an estimated yearly value of $7.64 billion dollars along its 156-mile length (Defiebre, 2016). Over the last few decades, however, the lagoon has seen significant environmental degradation due to factors including over-population, septic tank and groundwater issues, and excess fertilizer and sediment runoff that contribute to algae blooms (Waymer, 2014). Continued lagoon degradation could lead to ecosystem failures and economic losses. Satellite Beach is one of several cities who are part of PACE (Property Assessed Clean Energy) program. PACE funding provides an alternative to
traditional credit sources to pay for photovoltaic systems, energy conservation and wind hardening improvements. PACE is available to those living in local government jurisdictions where the governing body has taken action necessary to implement PACE funding. Just one of the four organizations providing PACE funding in Florida, Ygrene Energy Fund, has created 1,945 jobs and generated an estimated $324 million in economic stimulus across Florida since 2013 (Shahan, 2017). This is an interesting renewable energy option for those with equity in a property, but: a) do not have cash available, and b) lack access to traditional financing options.
Figure 6. Satellite Beach City Hall. Photo credit: Zachary Eichholz
Figure 7. Map depicting 2011 “Superbloom”.
Photo credit: http://www.sjrwmd.com/indianriverla
goon/2011superbloom.html

11
Sustainability Action Plan
The Plan The five sustainability categories fall under the three overlapping categories of capital: Environment, Social, and Economic. The capitals have singular strengths and purposes but, most importantly, they functionally overlap. These capitals can be referred to as "P3": People, Prosperity and the Planet. Each of the five primary categories are further defined in context below.
1. Built Environment 2. Land and Water Systems 3. Energy and Transportation Networks 4. Community Outreach 5. Quality of Life
These five categories include 121 individual indicators and metrics which are summarized in Appendix 1.
Category 1: Built Environment A definition set forth by the Center for Disease Control (CDC) states that built environment refers to manmade surroundings that individuals work, live, and interact in on a daily basis. Built environments generally include spaces like public buildings, homes, streets, sidewalks, and other city infrastructure. Areas within a city’s built environment must be maintained and managed adaptively to allow for a healthy, productive, and efficient landscape in which citizens can grow and thrive socially, economically, and environmentally. A City controls the built environment through a variety of means, but predominately through management of municipal structures and land use and planning, in order to create a viable and sustainable community with the resources to thrive.
According to the National League of Cities: "Land use is the most visible of the sustainability topics. Cities with sustainable land use create an obvious balance of environmental preservation, commerce, and livability. Land use and transportation are intricately connected." Principles of sustainable land use and planning are defined as:
a. Open Space: Communities should contain an ample supply of open green spaces designed to encourage consistent active and passive use.
b. Sustainable Water Sources: The current and long-term availability of water should be treated as the vital starting point of any land use decision. Community planning must include the provision and protection of local water supply.
c. Walkability & Connectivity: Communities should be pedestrian-oriented, with daily needs situated within easy and enjoyable walking distance of each other. To promote this access, residential, commercial, recreational, and civic uses should be connected by both public and private transportation options.
A resilient city is prepared to absorb
and recover from any shock or stress
while maintaining its essential functions,
structures, and identity, as well as
adapting and thriving in the face of
continual change (ICLEI, 2015).
12
d. Integration of Diverse Community Features: Community planning should integrate a variety of residential, commercial, recreational, and civic facilities essential to the daily life of residents of differing demographic profiles
e. Strong Sense of Place: The design of geographic spaces and structures should reflect and celebrate what is unique about a community's people, culture, heritage, and natural history."
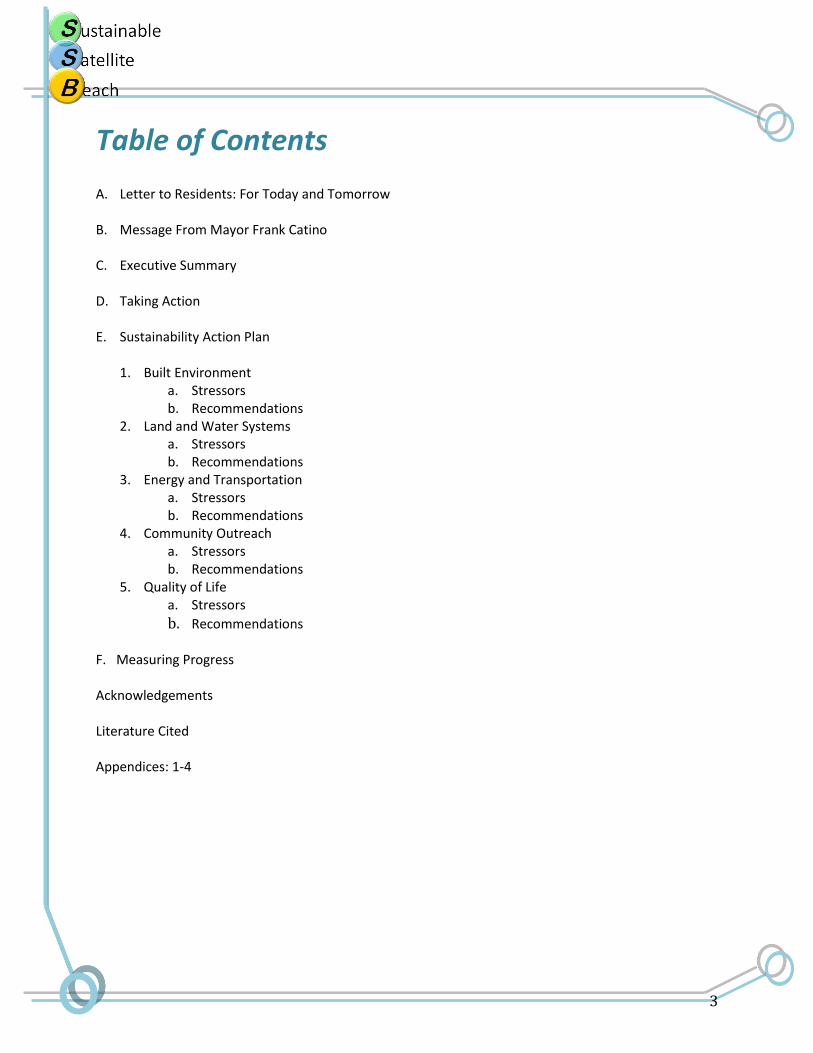
The sustainability of the built environment in a barrier-island city can be measured in terms of resilience to short and long-term threats like hurricanes and sea level rise. Since 2009, the city has addressed potential effects of sea level rise using grants from the National Estuary Program, Florida DEP, Florida Sea Grant and NOAA’s Climate Program Office, with multiple university, consulting and government partners (Parkinson and McCue, 2011; Lindeman et al., 2015).
The Built Environment includes the following: 1. Integrating green building standards into both public and private developments 2. Land use practices, and promotion of sustainable development for infill of local goods and
services to create a stable and long-term economy and walkable community 3. Re-use and redevelopment of both public and private lands and buildings 4. Government decisions for repurpose, operation, and retirement of municipal structures 5. Creation and maintenance of public spaces 6. Creating walkable, bikable, and alternative vehicle use opportunities and safe spaces 7. Evaluating density increases for residential development to support commercial ventures 8. Long term tax bases with equal land use support (i.e. residential and commercial, as opposed to
predominantly residential) 9. Providing incentives for better natural resource management for new construction and
redevelopment, thereby reducing wasted spaces, vacancies, and derelict buildings or spaces
13
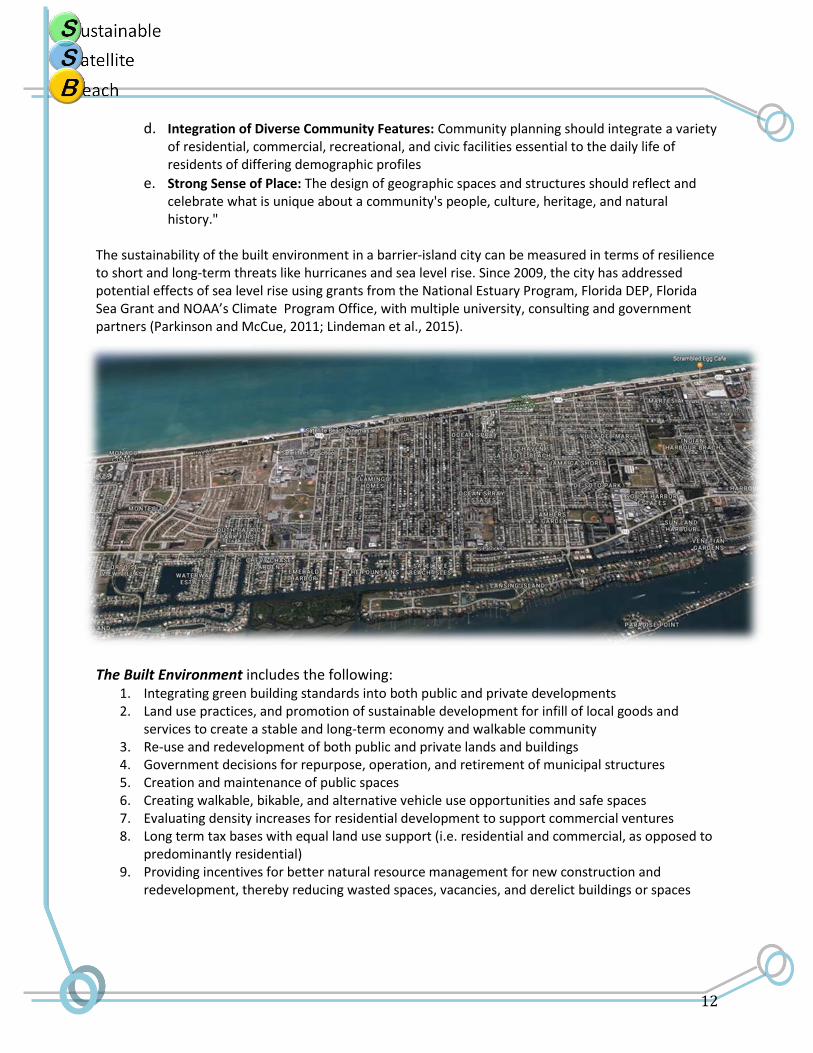
Built Environment Stressors: Primary stressors in regards to sustainability in the built environment include stormwater events, hurricanes, and sea level rise, each with secondary effects and problems. Other stressors include providing a proper mix, mass, and mesh of land usage to support the community's needs for goods and services in close proximity. Additionally, there is a need to create the right mix of land uses to support the City's tax base and not stress one category (e.g., all on the residential lands) and enable the City to provide for the needs of all citizens. Hurricanes are an annual threat to Florida’s east coast from the months of June to November (National Hurricane Center, 2017). All present and future municipal structures must be built to withstand and cope with these storms by becoming safe and secure locations for both citizens and relief officials. Data from the 2011 city sanctioned report Assessing municipal vulnerability to predicted sea level rise: City of Satellite Beach, Florida, made apparent that sea level rise will effect some of the city’s most critical pieces of infrastructure within the century (Parkinson and McCue, 2011) in association with a global sea level rise of over three feet by 2100. A tipping point for municipal operations being effected will be +2 feet of water rise above present around 2050. Negative effects of this rise will be seen earlier in the form of enhanced storm surges, tidal flooding, and stormwater runoff issues.
The topographic map of the City shown in Figure 8 shows the most at-risk areas of the City are not along the ocean but are on the west side along the Indian River Lagoon. Even with a water rise of as little as two feet, recurring impacts can be expected on key City infrastructure, starting most likely with fall “king-tide” flooding of South Patrick Drive in front of the Fire Station. At three feet, flooding will likely expand to include parking at City Hall and the David R. Schechter Community Center and along South Patrick Drive and adjacent streets and landscapes. At four feet icons and key infrastructure such as City Hall, the fire station, the David R. Schechter Center, and Desoto Park may experience recurring flooding, along with some homes and businesses (Parkinson, McCue, 2011).
Figure 8. Topographic map of Satellite Beach. Photo credit: Assessing municipal vulnerability to predicted sea
level rise: City of Satellite Beach, Florida
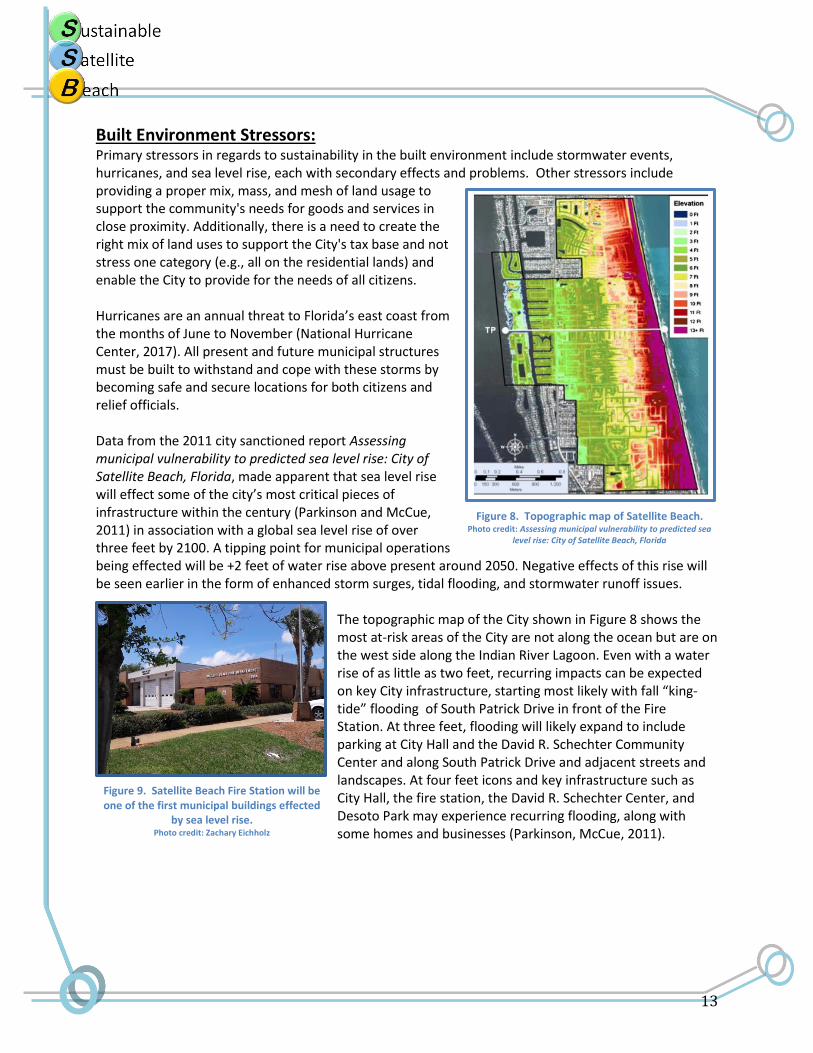
Figure 9. Satellite Beach Fire Station will be one of the first municipal buildings effected
by sea level rise. Photo credit: Zachary Eichholz

14
Climate change will bring about other issues that must be confronted such as severe rainstorms, heat waves, the spreading of tropical diseases such as the Zika virus, and prolonged droughts (Affecting Florida, 2015). Drought resistant gardening techniques that do not use fertilizers, such as Xeriscaping, should expand in adoption among residents and in all municipal building grounds. Built Environment Recommendations:
1. Increase the climate resilience of municipal structures and buildings within the City with the study and adoption of appropriate infrastructure projects.
2. Increase resident education about environmental stressors to the City’s built environment. 3. Certify one municipal building as LEED-certified or LEED-equivalent by 2022. 4. Reduce light pollution within all public beaches and municipal buildings through low-level
shielded light fixtures that produce long wavelength LED lighting. 5. Develop action plans for listed high priority indicators as quickly as possible in order to better
understand current needs and facilitate meaningful adaptive change. 6. Review and revise city code to improve sustainability and efficiency standards in all municipal
buildings. 7. The development, education, and adoption of Xeriscaping lawn practices leading to a goal of at
least one third of city residential lawns being certified through the Lagoon Friendly Lawns program by 2027.
8. All municipal buildings will employ Xeriscaping lawn practices by 2022. 9. Survey how many residences use solar panels and water conservation techniques such as low
flow faucets. This will give the City a baseline from which to grow green-building techniques post sustainability plan.
Category 2: Land and Water Systems Natural land and water systems are ever changing due to bio-physical forces of the planet. Human population growth, urban development, industry, and agriculture have altered many of these natural land and water systems with little regard for ecosystem wellbeing. Land and water systems encompass all terrestrial and aquatic environments around and within a city that must interact and deal with human intervention and stressors. These systems are highly interconnected, with a change in one having the potential to greatly affect the others. The City of Satellite Beach is highly dependent on its surrounding land and water systems, with both directly influencing the health of the City’s social, economic, and environmental capitals.
This category considers the actions necessary to maintain and preserve the land and water systems of the City of Satellite Beach, all the while helping to sustain local natural resources and keep the local economic and social systems strong. Higher priority was placed on specific indicators because of the City’s location on a barrier island, with extensive shoreline along the IRL. Each of these indicators and their measured data are of importance to benchmark current coastal margin status.
Figure 10. A gazebo on Samson’s Island. Photo credit:
http://www.visitspacecoast.com/listings/samsons-island/212/

15
Land and Water Systems includes the principles of:
1. Promoting the use of green infrastructure by the public and private sectors 2. Using low impact landscaping and native beach gardens 3. Creating more opportunity for regional stormwater management, swale systems, and clean
drainage systems 4. Identifying how municipal resource consumption of energy, water, gas, trash, and sewer can
be reduced, re-used, and recycled 5. Identifying ways to instill and educate the community on waste reduction and recycling and
eliminating harmful elements such as plastics, balloons, and non-bio-degradable materials from the environment
6. Identifying ways to create shoreline protection areas 7. Creating ways to reduce harmful pollutants and waste
Land and Water System Stressors: Many daunting environmental issues pose a significant short and long-term challenges to the future health and sustainability of many land and water systems surrounding the City of Satellite Beach. Natural systems are highly interconnected not only to themselves but also to human endeavors. If a natural system is degraded outside of the City limits, it can negatively affect systems within. The City’s marine habitats within the Indian River Lagoon and Atlantic Ocean, as well as terrestrial habitats, are vulnerable to human activity. Mangrove communities and other aquatic species are expected to be challenged by impacts from sea level rise but also changes in lagoon and beach sedimentation, amplified tidal impacts, and increasing aquatic and terrestrial resources usage. Threats to land and water systems in the City are important to take note of as smart infrastructure decisions can improve city resilience to tropical cyclones, coastal flooding, and introduction of pollutants to the system.
Over the short-term local land and water systems must contend with stormwater runoff that is polluted with fertilizers, lawn clippings, sediments, and litter that is not biodegradable. Once introduced into the environment, these contaminants can feed algae blooms, choke out native species, and hurt local wildlife as well as affect other cities’ natural ecosystems. Areas with ecological sensitivity, such as Samson’s Island and various beaches that contribute heavily to local land and water system wellbeing, must be adaptively managed for multiple human impacts for long-term system resilience.
Long-term issues of decreasing local aquatic and terrestrial ecosystem habitats and their associated species are expected in both the Indian River Lagoon and Atlantic Ocean and across the island as
Figure 11. View from Samson’s Island Nature Park looking west towards Merritt Island.
Photo credit: http://www.findbrevardhomes.com/satellite-beach-parks-recreation-activities-things-to-do.php

16
development increases. On the eastern shore of the City, a nearshore reef composed of lithified coquina rock provides habitat to game fishes, invertebrates, sea turtles, and birds. The hardbottom reef system also provides natural wave reduction services against storms, is a refuge for reef-organism biodiversity in Brevard County, and provides recreational functions (e.g., fishing, surfing). As sea levels rise, ecosystems on both sides of the island could face inundation. Increasing ocean temperatures and ocean acidification are also expected to induce macro-scale changes in the makeup and natural efficiency of marine ecosystems. When used in Satellite Beach, runoff can transport chemicals to the Indian River Lagoon and the Atlantic Ocean. These chemicals can be toxic to wildlife and humans. The City should inventory what chemicals are being used for lawn and agricultural care, and accurately estimate the concentration at which these chemicals are being discharged in both land and water systems.
Land and Water Systems Recommendations: 1. Establish a tracking system and baseline measurement for annual city fertilizer runoff by 2020.
From this original baseline measurement the City will have the goal of reducing its fertilizer runoff to three-quarters the amount originally benchmarked every four years after tracking system implementation.
2. Freely educate and advise city residents and business owners about the harm synthetic fertilizers and grass clippings can have on the environment and incentivize natural lawn care practices.
3. Increase the amount of lagoon shoreline with mangrove plantings to better stabilize the coastline against erosion and to filter the Indian River Lagoon.
4. Keep commercial and residential properties and the City's parks free of invasive exotic species. 5. Establish baseline readings and begin actively tracking data for resources handling for municipal
structures, businesses, homeowners, and the City community as a whole for: a. Electricity usage b. Water consumption c. Natural gas usage d. Solid waste generation e. Recyclables
6. Explore the goal of building an artificial reef(s) in conjunction with local scientists, citizen input, federal officials, and the Army Corps of Engineers before any new large-scale beach nourishment project occurs that could negatively alter the natural nearshore reef already in place off of Satellite Beach’s Atlantic coast.
7. Work with Brevard County to remove muck from navigable canals in the City using opportunities set forth by the new Lagoon Sales Tax.
8. Continue seasonal fertilizer ban. 9. Increase the amount of irrigation derived from rainwater harvesting amongst city infrastructure.
Category 3: Energy and Transportation Energy and transportation networks power and link our world. It is estimated by the International Energy Agency that roughly 80% of the global population has access to electricity with that percentage increasing every year as nations expand and develop their energy infrastructure (Walsh, 2013). But

17
getting and keeping the lights on is not only a worry for developing nations. How we create and sustain the power grid is of importance to all. While Satellite Beach does not create electricity directly, it can have an effect on consumption, which relates to oil, gas, and other fossil fuel resource usage. The same goes for expanding and maintaining transportation system and how that effects our resource consumptions.
Much of America’s energy and transportation infrastructure is in need of repair or complete replacement. According to the U.S. Department of Energy and the North American Electric Reliability Corps, the United States endures more blackouts than any other developed nation due to aging infrastructure, weather related incidents, and a lack of investment in new and cleaner forms of power. These outages are costing the American public up to $150 billion dollars each year (Clark, 2015). As for the transportation sector, the U.S. Department of Transportation estimates that up to 14,000 highways deaths every year are caused by poor road conditions and outdated designs (Nixon, 2015). According to the U.S. Energy Information Agency (EIA), renewable energy (hydroelectric, wind, solar, geothermal, and biomass) powered 16.9% of the United States energy grid through the first half of 2016 with 9.2% coming from non-hydroelectric renewable sources. To put that into perspective renewable energy, through all of 2015, powered 13.7% of the United States grid with 7.6% of that coming from non-hydroelectric sources. With this increase, renewable energy is on the rise (Fleischmann, 2016).
This section outlines possible renewable energy integration strategies to make the City’s grid and transportation sector cleaner and more resilient against environmental stressors and adaptable to population growth. These two sectors contribute the most to the City’s greenhouse gas emissions, which contribute to climate change and a general lowering of air quality that can be harmful to humans, especially to small children, the elderly, and those with pre-existing respiratory conditions. Energy and Transportation includes the following:
1. Promoting the use of alternative energy use in municipal, business, and residential buildings for new construction and retrofit
2. Creating "complete streets" 3. Promoting alternative vehicle usage and safety 4. Encourage densities and intensities of land use that will foster transit, or enable people to
walk, bike, or use golf carts/electric vehicles to nearby shopping and restaurants 5. Identifying ways to operate, manage, and replace municipal fleets for public works, building,
code compliance, administration, and non-safety related departments 6. How do we promote and encourage mixing of land uses to reduce drive times, create job
opportunities near homes, and reduce vacancies creating a sustainable economic structure
Figure 11. Cassia Boulevard, one of the main connectors between A1A and South Patrick
Drive. Photo credit: Google Maps

18
Energy and Transportation Stressors: Energy and transportation systems, when brought down to a local scale, have many common stressors. According to the National Hurricane Center Brevard County has been struck seventeen times by land falling hurricanes over the course of 110 years, which places the county with the sixth highest number of landfalls within that time span (National Hurricane Center, 2017). October 2016’s Hurricane Matthew near-miss only highlighted the issue of powerful hurricanes and the damage they can potentially do, especially to coastal communities. Risks from these storms to energy infrastructure include: above ground power lines being damaged or destroyed, fire from arcing power lines, traditionally fueled backup generator failure, and associated blackouts that can last for days or weeks. Threats posed by these storms to transportation infrastructure include flooding, roads being blocked by debris, cracking, erosion, over wash, and loss of traditional fuel to city resident’s vehicles and the municipal fleet, should power or supplies be cut off.
As with other sustainability action plan categories, sea level rise will also have an effect on energy and transportation systems. An increase in the water table could prevent future power and gas lines from being buried and can worsen the effects of tropical cyclone storm surges. If the frequency and intensity of future storms increases due to warming ocean temperatures and increasing atmospheric water vapor, the City of Satellite Beach could be facing extremely damaging infrastructure stressors in the future that include higher storm surges, larger rainfall events, and more powerful windstorms.
The increasing population of Satellite Beach is considered
another stressor on the City’s energy and transportation systems due to increased grid usage and traffic congestion, specifically on the island’s two main thoroughfares, A1A and South Patrick Drive. Increased congestion could lead to reduced air quality and increased noise pollution. Traditional energy and transportation systems need to be modernized and made exceptionally resilient to become self-sufficient and cleaner while also reducing utility cost and vulnerability to environmental degradations. A sound economy can only thrive when people are there to purchase goods and services. Better design of buildings and proximity can reduce greenhouse emissions and create complete streets with walkable and bikeable community access. Changing codes to incentivize renewable energy, modify land use policies to foster mixed uses and convert some long vacant commercial lands to residential areas will foster a sustainable community future.
Figure 13. The David R. Schechter Community Center. Photo credit: http://wfit.org/post/satellite-beach-founders-day-
marketplace-nov-7#stream/0
Figure 14. Pelican Beach Park electric vehicle charging station.
Photo credit: http://www.plugshare.com/?location=73304

19
Energy and Transportation Recommendations The City of Satellite Beach must track and review energy consumption data for both renewable and non-renewable generation for municipal infrastructure.
1. The City should prepare to power at least one of its municipal buildings with renewable energy with photovoltaic solar panels by 2022.
2. At least one electric vehicle charging station should be installed at every city property by 2030 as demand for electric vehicles grows (Bloomberg New Energy Finance, 2016). Consumption and usage data should be tracked for all current and future electric vehicle-charging installations. Anyone seeking knowledge about where electric vehicle charging stations are located can go to http://www.plugshare.com/ to find a public station nearest you.
3. The City should strive to make improvements in its fleet management to improve gas mileage and overall efficiency, and move toward more hybrids or alternative vehicles in its replacement programs.
4. Where possible and feasible, the City, residents, and business owners should be encouraged to use electric lawn care equipment.
5. PACE programs should continue to be supported and implemented for the City’s residents to encourage the growth of renewable energy installations.
6. The City should strive to have 25% of its power come from renewable energy by 2030.
7. The City should strive to be completely powered by renewable energy by 2050.
8. At least one solar panel car canopy should be installed as a means of renewable energy generation, public outreach, testing, and education. A primary location for one such canopy is a city school such as Surfside Elementary School.
9. The City should strive to increase the use of bicycle lanes where appropriate. Bicycle lanes should also be included along all future road improvement projects where appropriate.
10. Encourage implementation of rain gardens and other landscape features, and severing of directly connected surfaces, to eliminate or reduce that amount of water entering streets and parking areas throughout the City.
11. A review of all cities roads, crosswalks, and sidewalks should be conducted to determine their current safety conditions, vulnerability to flooding and sea level rise, and areas for future improvement.
12. All current and future crosswalks along SR A1A and South Patrick Drive (513) should be built with LED pedestrian-activated signs, either in road or along the right of way at the proper height. The warning light systems should be solar powered.
Figure 15. Resident David Vigliotti’s home solar array now provides his family with
almost zero electric utility expenses. Photo credit: Zachary Eichholz
Figure 16. Children pose in front of Surfside Elementary School’s
community garden. Photo credit:
http://dev.woollyschoolgarden.org/support/surfside-elementary.html

20
13. The City should create programs to encourage people to take transit, walk, or bike to work. 14. The City should redevelop its current official website to include Space Coast Area Transit bus
routes, travel times, and destinations locally and regionally across the County. This webpage should also promote the use and need for public transit.
Category 4: Social/Community Outreach Community outreach involves the offering of education, social planning, and support of activities to community residents freely and openly. In terms of sustainability, community outreach allows citizens opportunities to get involved with their city in ways that allow them to choose and act upon the ways in which they believe are most fulfilling to themselves and their neighborhoods. Within the City of Satellite Beach there are already many ways for local citizens to get involved, such as with the annual Founders Day Marketplace and Parade, but as challenges arise more outreach must be done to encourage residents to become a part of the solution. The future city community garden, to be built on the grounds of Desoto Park by the racquetball court, should be considered for use as an opportunity for developing new social programs for all citizens. Community gardens have been shown to improve community health, rehabilitate land, improve terrestrial aesthetics, reduce crime, and give participants a renewed sense of community belonging, participation, and stronger social connections with neighbors (DeMuro, 2015).
Programs that further community outreach and interactions between residents and government officials should continue and be expanded, like the City of Satellite Beach Police Department’s Stop By and Say Hi program. Stop By and Say Hi is a free volunteer program with the goal of providing weekly companionship, friendship, support and basic resources to city residents. Client attendance should be cataloged in this program (confidentially) and in other recreational senior citizen programs. It is in every resident’s best interest and for the island they live on to involve themselves in the issues that will face it in the future. It is also the duty of the local government to provide residents with factual
information, education, and opportunities to get involved and make a difference in the community’s health and quality of life (category 5). Being a small city, it is easier for outreach to occur, especially through social media and advertising campaigns. It is also easier to attract large numbers of local
Figure 17. Desoto Park, the future home of Satellite Beach’s first community garden.
Photo credit: http://www.findbrevardhomes.com/satellite-beach-parks-recreation-activities-things-to-do.php
Figure 18. The 2016 Ocean Reef Beach Festival at Pelican Beach Park.
Photo credit: Zachary Eichholz

21
residents to public events, meaning sustainability education and support can have more of an impact with each local event.
Community Outreach includes the following: 1. Creating fun, educational, and enticing public events, including marketing and promoting current ones, like the Farmer's Market, Ocean Reef Festival, Electric Car Exhibition, Founder's Day, Native Plant events, etc. 2. Promoting and successfully engaging the residents in the Community Garden, composting, and a potential food co-operative 3. Engaging the senior population to be active volunteers or mentors 4. Providing educational forums, incentives for gardens and rain gardens, local food production and coops
Community Outreach Stressors: The primary stressors to community outreach in terms of sustainability are public support, communication, and a willingness to learn and act upon challenges. Sustainability needs to be seen as a necessity for all and not as a political driver for some. The benefits of sustainability are meant to be seen across all capitals of society; economically, socially, and environmentally. By enlightening residents of Satellite Beach to the opportunities a more sustainable community offers, this plan strives to create a happier and healthier city. Community outreach for sustainability cannot be achieved unless all members of the City are included and given a chance to voice their opinions and concerns so that they may be addressed bilaterally and fairly. Outreach programs must be active, not passive, in their attempts to attract residents.
Community Outreach Recommendations 1. An inventory of local and regional citizen groups and organizations that could benefit in
sustainability based outreach and education should be compiled and made available to the public for easier event coordination purposes.
2. Every public event should employ recycling and strive to be waste free; this includes food waste. Leftover food should be composted for the City’s future community garden.
3. Every community event should strive to be litter free and should employ volunteers to help reduce the amount of litter produced during events.
4. The City should hold monthly trash pickups of beaches, Samson’s Island, and other available public areas along the Indian River Lagoon.
5. City schools should invest in school gardening programs and develop their own gardens for their students and faculty to care for and promote better living and health among City youth.
6. Cigarette butt collection should begin at all city facilities along with a program that educates the public on the negative environmental (Green, 2013) and human health impacts of smoking cigarettes (Health Effects, 2016).
Figure 19. Above shows the construction site of the future Satellite Beach community garden.
Photo credit: Zachary Eichholz

22
Category 5: Quality of Life Quality of life recognizes the basic needs of all citizens. All citizens have the right to a decent and just quality of life and the City government of Satellite Beach must uphold this right for its residents, visitors, and workers. Some of these basic needs include quality education, employment, recreational access, healthcare, and a sustained environment. A good example is the Handyman program. Handyman support is a service offered to seniors that may be on a fixed income and need extra help with tasks around their home, such as plumbing, electrical, etc. that is provided through the Satellite Beach Methodist Church. The number of clients serviced is important for the City to know so that it may expand this program and possibly provide it directly. Quality of life brings all the capitals of sustainability (social, economic, and environmental) together, as all three must be in balance to advance societal sustainability. Achieving sustainability in these capitals will raise the overall quality of living throughout the City by improving the area’s natural environment, reducing public health risk, reducing long-term cost of living by lowering utility cost through energy efficiency upgrades and renewable energy, and making the City safer to live in. This final category goes over specific ways in which the City can do this. Quality of Life issues includes the following:
1. Public safety and security needs are met for all citizens 2. Employment opportunities are close to home and have ease of access 3. Confidence in local government and governance 4. A sustainable tax base, where there is ample diversity of land uses so as to not burden one
segment of the population
Quality of Life Stressors: Stressors to quality of life include personal safety, residential and commercial security, lack of access to basic services, weather-related incidents, environmental health issues, economic challenges at local, state, and federal levels, population growth, social pressures, and poor or outdated infrastructure.
Quality of Life Recommendations 1. Continue, expand, and track social
programs such as the Community Paramedics and Stop By and Say Hi programs that increase community interactions and care for those that may not necessarily be able to take care of themselves without assistance.
Figure 20. A Satellite Beach Police Department patrol car.
Photo credit: https://www.flickr.com/photos/formerwmdriver/3887968204/
Figure 21. Pelican Beach Photo Credit: Zachary Eichholz

23
2. Advocate voter registration programs of all eligible citizens and encourage voter turnout at
each election cycle for every level of government. 3. Assure a mix of land uses to encourage access to health care facilities in proximity to
population needs and centers. 4. Develop, promote, and build a fully functioning community garden at Desoto Park by the
beginning of 2018 with attached social programs for all ages. 5. Determine and track crime statistics within the City and organize the police department
accordingly and adaptively to these statistical findings. Develop and promote social programs for ex-convicts and juvenile offenders to re-educate/rehabilitate back into society.
6. Be aware of local employment statistics as a means to encourage economic development and job creation.
7. The City should strive to ensure continuing Community Paramedic care to aid in protecting the health and wellbeing of the community.
Figure 22. Coquina Rock Sculpture Garden at Pelican Beach Park. Photo Credit: Zachary Eichholz

24
Measuring Progress
Green Achievement Targets (GATs) The City of Satellite Beach wishes to lead by example and be a standard for other coastal municipalities across Florida. Twenty initiatives were identified via a comprehensive review of the SAR and developing city sustainability plan by city staff, members of the Sustainability Board, and broad citizen review. These twenty initiatives, the Green Achievement Targets (GATs), will be the highest priority short-term endeavors taken by the City. These and other plan initiatives will be reviewed and assessed every five years by city staff, Sustainability Board members, and through public input to determine implementation success and new needs. Levels of success will be based on metrics in Appendix 1 and accompanying content in this document.
1. Convert all municipal buildings to solar power in the next two decades, while striving to
make City Hall and the Public Works building run completely off solar power by 2022. [Energy and Transportation]
2. Establish a financially sustainable community garden at Desoto Park. [Community Outreach] 3. Achieve LEED-equivalent certification for at least one municipal building. [Built
Environment] 4. Install at least one electric vehicle charging station at a municipal building. [Energy and
Transportation] 5. Employ xeriscaping practices at all municipal building grounds. [Land and Water Systems] 6. Replace all fossil fuel based city administrative vehicles with electric vehicles. [Energy and
Transportation] 7. Plan and standardize a schedule for free public workshops that educate and explore topics
such as community gardening, the Indian River Lagoon, climate change, sustainable transportation, and renewable energy. [Community Outreach]
8. Assess, identify, and prioritize city vulnerabilities to climate change threats and stressors. [Built Environment]
9. Allow for better citizen access to public transportation and ensure that one mile of city streets are designed to follow the principles of “Complete Streets”. [Quality of Life]
10. To improve ecosystem health, determine the current amount of city shoreline with mangrove coverage and convert 500 square feet of shoreline to begin to restore appropriate levels of mangrove coverage. [Land and Water Systems]
11. Pilot a compost project in conjunction with Waste Management. [Land and Water Systems] 12. All city-hosted events, departments, and buildings will phase out use of petroleum based
plastic bags, balloons, utensils, and cups and begin using bio-based plastics that are made from plant based materials such as soy. [Built Environment]
13. Obtain provisional status of the Dark Sky Certification. [Built Environment] 14. Convert all municipal building lighting (both interior and exterior) to more efficient and
longer-lasting LED lighting. [Built Environment] 15. Partner with at least one city commercial entity to help research and build a solar
installation that either partially or fully powers their business. [Energy and Transportation] 16. In collaboration with Keep Brevard Beautiful, begin to coordinate, sponsor, and perform
regularly scheduled public beach and lagoon trash pickups. [Community outreach]

25
17. Develop an internal sustainability review for all new city buildings that helps to streamline
future construction and management operations, and make this service available to home and business owners as well. [Built Environment]
18. Identify locations within the Indian River Lagoon that are suitable for the development of oyster beds and implement as feasible. [Land and Water Systems]
19. Test and track synthetic fertilizer concentrations within the City’s runoff so that the City may better gauge nutrient loading into the Indian River Lagoon. [Land and Water Systems]
20. Design and implement soft infrastructure techniques to help control and filter stormwater runoff. [Land and Water Systems]
Moving Forward Satellite Beach sustainability efforts do not end with the completion of this city plan. This is a living document, designed to be amended and refined to meet the needs of the community in response to whatever the present and the future may hold . Moving forward, this plan must be implemented across the municipality in a way that benefits all residents, businesses owners, visitors, and government workers to create positive overlaps of the key Economics, Environment, and Social principles. Appendix 1 contains the 121 indicators identified in the SAR. Eighty-eight (88) were listed as near-term high priority, meaning they were deemed by city staff and sustainability board members to be both feasible and priority in terms of implementation and relevance. Each of these near-term high priority indicators are listed below.
Built Environment Sub-Categories: Municipal Structures, local businesses, residential community, public spaces
❖ Multiple metrics can be used in regards to these indicators including: Water resource accounting – Total amount of water use.
❖ Green building certification – Number of certified buildings (LEED or some other high level of certification).
❖ Hazard vulnerability – Building elevation, sea level rise vulnerability and storm surge. ❖ Sea level vulnerability – Minimum base floor elevation: feet above annual high water level
(AHWL). ❖ Dwelling density – Number of dwelling units within the City; Dwelling units per residential acre. ❖ Low impact development – “Lagoon friendly lawns”- Florida native lawns; Xeriscaping.
Percentage of yard space that requires minimal upkeep, e.g., little to no fertilizer, pesticide, herbicide, or water use.
❖ Green-building initiatives – Number of homes with solar panels, number of water conservation techniques, etc.
❖ Light pollution – Amount of light from built environment; Measured unnatural light. ❖ Recreational areas – Areas of recreational facilities, e.g. parks, beaches, etc., per 100 residents. ❖ Amenity standards – Per Capita average of features: fields, playgrounds, picnic facilities, water
fountains promoting reusable containers. ❖ Accessibility – Parking, bike racks, wheelchair ramps. ❖ City code provisions – Low Impact Development, allowed density, required open space, required
sidewalks. Parks: water fountains, shade trees, lack of invasive species, habitat preservation.
26
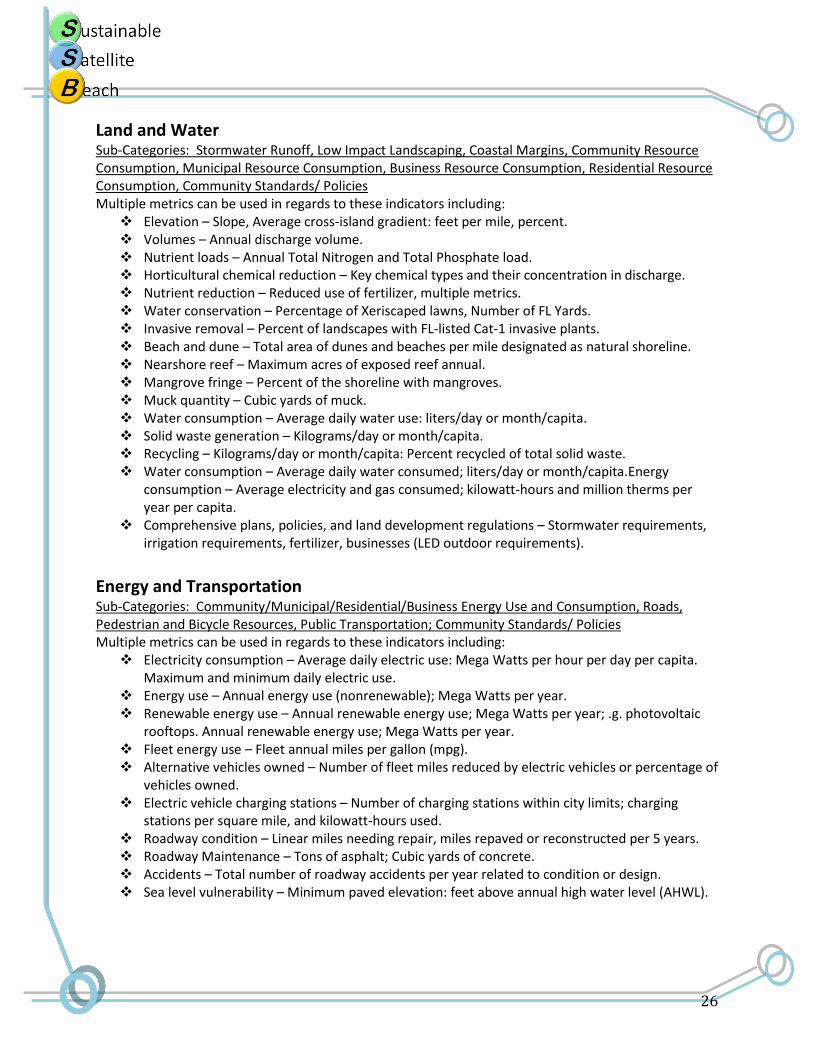
Land and Water Sub-Categories: Stormwater Runoff, Low Impact Landscaping, Coastal Margins, Community Resource Consumption, Municipal Resource Consumption, Business Resource Consumption, Residential Resource Consumption, Community Standards/ Policies Multiple metrics can be used in regards to these indicators including:
❖ Elevation – Slope, Average cross-island gradient: feet per mile, percent. ❖ Volumes – Annual discharge volume. ❖ Nutrient loads – Annual Total Nitrogen and Total Phosphate load. ❖ Horticultural chemical reduction – Key chemical types and their concentration in discharge. ❖ Nutrient reduction – Reduced use of fertilizer, multiple metrics. ❖ Water conservation – Percentage of Xeriscaped lawns, Number of FL Yards. ❖ Invasive removal – Percent of landscapes with FL-listed Cat-1 invasive plants. ❖ Beach and dune – Total area of dunes and beaches per mile designated as natural shoreline. ❖ Nearshore reef – Maximum acres of exposed reef annual. ❖ Mangrove fringe – Percent of the shoreline with mangroves. ❖ Muck quantity – Cubic yards of muck. ❖ Water consumption – Average daily water use: liters/day or month/capita. ❖ Solid waste generation – Kilograms/day or month/capita. ❖ Recycling – Kilograms/day or month/capita: Percent recycled of total solid waste. ❖ Water consumption – Average daily water consumed; liters/day or month/capita.Energy
consumption – Average electricity and gas consumed; kilowatt-hours and million therms per year per capita.
❖ Comprehensive plans, policies, and land development regulations – Stormwater requirements, irrigation requirements, fertilizer, businesses (LED outdoor requirements).
Energy and Transportation Sub-Categories: Community/Municipal/Residential/Business Energy Use and Consumption, Roads, Pedestrian and Bicycle Resources, Public Transportation; Community Standards/ Policies Multiple metrics can be used in regards to these indicators including:
❖ Electricity consumption – Average daily electric use: Mega Watts per hour per day per capita. Maximum and minimum daily electric use.
❖ Energy use – Annual energy use (nonrenewable); Mega Watts per year. ❖ Renewable energy use – Annual renewable energy use; Mega Watts per year; .g. photovoltaic
rooftops. Annual renewable energy use; Mega Watts per year. ❖ Fleet energy use – Fleet annual miles per gallon (mpg). ❖ Alternative vehicles owned – Number of fleet miles reduced by electric vehicles or percentage of
vehicles owned. ❖ Electric vehicle charging stations – Number of charging stations within city limits; charging
stations per square mile, and kilowatt-hours used. ❖ Roadway condition – Linear miles needing repair, miles repaved or reconstructed per 5 years. ❖ Roadway Maintenance – Tons of asphalt; Cubic yards of concrete. ❖ Accidents – Total number of roadway accidents per year related to condition or design. ❖ Sea level vulnerability – Minimum paved elevation: feet above annual high water level (AHWL).

27
❖ Complete Streets-Sidewalk connectivity – Percentage of total streets with available sidewalks on
both sides: Percent of streets with sidewalks of 125 total streets in the City. ❖ Bicycle network connectivity – Percentage of total street distance with bike routes: Percentage
of streets with bike routes. ❖ Proximity to public spaces and commerce (goods and services)– Maximum travel rate from
residential areas to closest public spaces; Maximum walking distance and time to closest public space; Percent of public spaces within a quarter mile of a bus stop; Connectivity to other public transit and regional destinations – Regional destinations in another part of the County or to another transit.
❖ Crosswalk availability – Percent of protected crosswalks for SR A1A and South Patrick Drive. ❖ Bus transit – Total amount of ridership that used the Space Coast Area Transit system that
ended or started in the City: Total number of riders per month. ❖ Bus stops – Percent of total households within a quarter mile of a bus stop. ❖ Transit Schedule convenience, safety and security– Head time difference, number of bus routes,
shelter availability, lighting, and proximity to gathering places. ❖ Comprehensive plans, Transit convenience, and Availability – Transportation Planning
Organization (TPO) Long Range Transportation, Brevard County spending on transit.
Social/Community Outreach Sub-Categories: Public Events and Outreach; Sustainability Education; Primary Education; Community Gardening/ Composting Multiple metrics can be used in regards to these indicators including:
❖ Within existing events – Number of vendors that offer some type of sustainability education. ❖ Annual education programs – Number of educational programs concerning sustainable living,
offered annually and number of residents that voluntarily attend; Resident attendance/educational program.
❖ Recreation programs for sustainability – Number of sustainability programs offered by the City or local organizations.
❖ City contracts for schools – Number of students reached. ❖ Amount of environmental education in local schools – Number of classes offered. ❖ Education for homeowners – Number of educational opportunities provided relating to
sustainable living. ❖ High school graduation rate – High school graduation success rate. Total percent of graduating
high school seniors per school year. ❖ Comprehensive plans, Stormwater plans, Land development regulations – BMAP requirement
for education, recycling requirement for events.
Quality of Life Sub-Categories: Senior Residents, Social Wellbeing, Affordability/Cost of Living; Employment Availability; Public Safety; Government; Community Standards/ Policies Multiple metrics can be used in regards to these indicators including:
❖ Community paramedics program – Monitoring at risk senior residents within the City of Satellite Beach; Number of clients.
❖ Medicine disposal – Percent of total medicine recycled at designated drop stations.

28
❖ Social Integration – Number of participants in recreational senior citizen programs, Number of
clients in Stop By and Say Hi program. ❖ Transportation – Number of senior citizens in need of transportation; clients transported. ❖ Handyman support – Once initiated, Number of clients served. ❖ Access to health care – Number of uninsured. Number of facilities. ❖ Housing costs – Median assessed value of homes and its impact on the local tax structure. This
will help determine what other land use categories are needed to make the City financially stable.
❖ Employment rate – Percent of residents with full-time employment and the need to promote economic development for job creation opportunities.
❖ Police officers – Number of police officers per 1000 residents. ❖ Unlawful incidents – Number of violent and property crimes per 1000 residents. ❖ Juvenile crime – Percentage of crime committed by residents 18 years and younger. ❖ Fire suppression – Annual fire losses as a percent of involved structural value. ❖ Government participation – Total percentage of the population registered to vote. ❖ Voter participation – Voter turnout as percentage of registered voters. ❖ Recreational opportunities – Number of participants.

29
Acknowledgements We extend thanks to the many people who made this municipal Sustainability Action Plan possible. Courtney Barker, AICP, City Manager, has led this initiative at all stages and been a primary reviewer. Mayor Frank Catino and all other Council Members have been highly supportive throughout. The Satellite Beach Sustainability Board has been a leader throughout this process and contributed review comments, we thank all past and current members of this board. Dr. John Fergus, Allen Potter, Public Works Director, Nicholas F. Sanzone, City Environmental Programs Coordinator, who have also been primary reviewers of the document at all stages. Rochelle W. Lawandales, AICP, a citizen and long-time city planner, has integrated part of her sustainability work into the document and provided valuable editing assistance. Assistance from the following has also been very valuable: Julie Finch, Administrative Assistant to the City Manager, FIT interns; Alexis Miller, Jessica Morse, and Thomas Ruppert, Dr. Jason Evans. We also thank the citizens of Satellite Beach that have provided public comments on the draft Sustainability Action Plan, their input and continued interest is fundamental to these initiatives.

30
Literature Cited
Bloomberg New Energy Finance. (2016, February 25). Electric vehicles to be 35% of global new car sales by 2040. Retrieved March 02, 2017, from https://about.bnef.com/blog/electric-vehicles-to-be-35-of-global-new-car-sales-by-2040/ Bowser, M., Lee, E., & Walsh, M. J. (2015, October 16). Cities to the Rescue. Retrieved March 02, 2017, from https://www.usnews.com/opinion/articles/2015/10/16/cities-are-leading-the-way-on-climate-action Carbon Neutral. (2013, May 29). Getting to Carbon Neutral. Retrieved March 02, 2017, from http://www.austintexas.gov/blog/getting-carbon-neutral CBS. (2014, July 10). "Toilet to tap" wastewater recycling begins in Texas city. Retrieved March 02, 2017, from http://www.cbsnews.com/news/toilet-to-tap-wastewater-recycling-begins-in-wichita-falls-texas/ CDC. (2016, December 01). Health Effects of Cigarette Smoking. Retrieved March 02, 2017, from https://www.cdc.gov/tobacco/data_statistics/fact_sheets/health_effects/effects_cig_smoking/ Clark, M. (2015, December 05). Aging US Power Grid Blacks Out More Than Any Other Developed Nation. Retrieved March 02, 2017, from http://www.ibtimes.com/aging-us-power-grid-blacks-out-more-any-other-developed-nation-1631086 Climate Reality Project. (2015, August 7). How is climate change affecting Florida? Retrieved March 02, 2017, from https://www.climaterealityproject.org/blog/how-climate-change-affecting-florida Climate Reality Project. (2016, October 11). Climate Reality Project & Park City Announce 100% Renewable Electricity Pledge. Retrieved March 02, 2017, from https://www.climaterealityproject.org/press/climate-reality-project-park-city-announce-100-renewable-electricity-pledge Collyer, M. (2015, November 16). The World's Urban Population Is Growing - So How Can Cities Plan for Migrants? Retrieved March 02, 2017, from http://scitechconnect.elsevier.com/urban-population-growing-plan-migrants/ Defiebre, C. (2016, August 12). New study calculates Indian River Lagoon’s annual economic impact at $7.64 billion. Retrieved March 02, 2017, from http://theguardiansofmartincounty.com/new-study-calculates-indian-river-lagoons-annual-economic-impact-at-7-64-billion/ DeMuro , K. (2015, December 07). The Many Benefits of Community Gardens. Retrieved March 02, 2017, from https://greenleafcommunities.org/the-many-benefits-of-community-gardens/ Fleischmann, D. (2016, August 25). Renewable Energy Was 16.9 Percent of US Electric Generation in the First Half of 2016. Retrieved March 02, 2017, from http://www.renewableenergyworld.com/articles/2016/08/renewable-energy-was-16-9-percent-of-u-s-electric-generation-in-the-first-half-of-2016.html Green, N. (2013, November 27). The Environment vs Cigarettes. Retrieved March 02, 2017, from https://quitsmokingcommunity.org/the-environment-vs-cigarettes/ ICLEI. (2015). Resilient Cities Report: Global developments in urban adaptation and resilience. Local Governments for Sustainability, 20 pp.

31
Jensen, S. (2016, March 08). San Francisco Becomes The First City to Ban Sale of Plastic Bottles. Retrieved March 02, 2017, from http://globalflare.com/san-francisco-becomes-the-first-city-to-ban-sale-of-plastic-bottles/ Lindberg, A. (2016, November 22). St. Pete is first Florida city to commit to 100 percent clean energy, Sierra Club says. Retrieved March 02, 2017, from http://saintpetersblog.com/st-pete-first-florida-city-commit-100-percent-clean-energy-sierra-club-says/ Morse, J. & Lindeman, K. (2016). Assessment and measurement of city sustainability: categories, indicators, metrics and associated factors, City of Satellite Beach, Florida, 34 pp.
Lindeman, K.C., L.E. Dame, C.B. Avenarius, B.P. Horton, J.P. Donnelly, D.R. Corbett, A.C. Kemp, P. Lane, M.E. Mann and W.R. Peltier. 2015. Science needs for sea-level adaptation planning: comparisons among three U.S. Atlantic coastal regions. Coastal Management 43(5):555-574.
National Hurricane Center. (2017). Tropical cyclone climatology. Retrieved March 02, 2017, from http://www.nhc.noaa.gov/climo/ Nixon, R. (2015, November 05). Human Cost Rises as Old Bridges, Dams and Roads Go Unrepaired. Retrieved March 02, 2017, from https://www.nytimes.com/2015/11/06/us/politics/human-cost-rises-as-old-bridges-dams-and-roads-go-unrepaired.html?_r=1 Parkinson, R. W. and T. McCue. (2011). Assessing municipal vulnerability to predicted sea level rise: City of Satellite Beach, Florida. Climatic Change 107(1-2):203-223. Senge, P. M. (2006). The Fifth Discipline: The art and practice of the learning organization. Crown Pub., 427 pp. Shahan, C. (2017, January 09). $324 Million In Economic Stimuli Across Florida Thanks To YgreneWorks PACE. Retrieved March 02, 2017, from https://cleantechnica.com/2017/01/09/324-million-economic-stimuli-across-florida-thanks-ygreneworks-pace/ Shashaty, A. (2011). Housing Demand. Sustainable Communities, p. 14-18. Tanguay, G. A., et al. (2009). Measuring the sustainability of cities: a survey-based analysis of the use of local indicators. SSRN Electronic Journal, 1-32. UN Habitat (n.d.). Energy. Retrieved March 02, 2017, from https://unhabitat.org/urban-themes/energy/ Walsh, B. (2013, September 05). Blackout: 1 Billion Live Without Electric Light. Retrieved March 02, 2017, from http://business.time.com/2013/09/05/blackout-1-billion-live-without-electric-light/ Waymer, J. (2014, May 03). Indian River Lagoon: What went wrong? Retrieved March 02, 2017, from http://www.floridatoday.com/story/news/local/environment/lagoon/2014/05/03/indian-river-lagoon-went-wrong/8672245/

32
Appendix 1. Assessment Framework
The Satellite Beach Sustainability Assessment Report (2016) established an adaptable baseline for currently identified indicators and metrics under five Sustainability Action Plan categories: Built Environment, Land and Water Systems, Energy and Transportation Systems, Community Outreach and Quality of Life. The figure below shows the distribution of the number of indicators for each of the categories. Also identified were the a) metric(s) specific to each indicator, b) time periods of measurement, c) generic importance of the indicator, d) ease of measurement (expenses and City staff time) and d) points of contact, for the 121 indicators, columns 4, 5, 6, 7, and 9 in Appendix 1 Table. These estimates were based on literature review and discussions with City staff, Sustainability Board members, and City of Satellite Beach citizens.
These priority rankings, time periods of measurement, and points of contact are nonetheless estimates. Periodic re-evaluation by City staff and Sustainability Board members will help revise and codify the priority ranks and other attributes currently estimated in the assessment matrix.
Built Environ. 28
Land & Water 22
Energy &
Trans. 32
Comms. Outreach 17
Quality of Life 22

33
Sustainability Assessment Matrix Categories
Sub-Categories Indicators
Indicator Description and Metrics
Time Period
Import.
Ease/ Cost
Priority
Point of Contact
Built Environment
Municipal Structures
Municipal buildings
Total Number of municipal buildings within the City of Satellite Beach and square footage of each; (can be represented per capita/per employee).
Onedur 5 yr
Low
Low
Low Insur. Info. Suzanne Sherman
Building code conformity
Number of buildings conforming to current building codes.
5 yr
Low Low Low Bldg Dept
Indoor air quality
Quality of air in indoor spaces; indoor air quality/municipal structure/yr. Dust, Particulates, Mold.
Baseline Low Med Low City Hall
Low impact development
Amount of certified furnishings: lights, furniture, flooring, etc.
Baseline Low Low Med Public Works
Energy accounting
See Energy and Transportation.
Water resource accounting
Total amount of municipal water use.
Annual High Low High Mel. Utility
Green building certification (e.g., LEED or STAR)
Number of certified buildings. As needed
High Low High Public Works
Hazard vulnerability
Building elevation/SLR and Storm Surge.
Refer to docs
High Med High City Hall
Local Businesses
Local business density
Number of local businesses vs commercial chain businesses.
3-5 yr Med Med Med City Hall
Local business diversity
Number of service/good categories (health, food, etc.) that are accessed frequently by users.
5 yr Low Low Low City Hall

34
Built Environment (cont.)
Low impact development
Amount of certified furnishings or buildings e.g. lights, furniture, flooring etc; certified furnishings/local business.
5 yr Low High Low Survey
Indoor air quality
Quality of air in indoor spaces; indoor air quality/local business/yr.
5 yr Low High Low Survey
Energy accounting
See Energy and Transportation.
Water resource accounting
Total amount of water use. Annual High Med High Mel. Utility
Green advertising
Using sustainability as an Ad for business. Percentage of ads.
5 yr Med Med Med Survey
Certified Green Businesses (some level of certification)
Percentage of businesses with some level of sustainability certification.
5 yr Med Med Med Survey
Sea level vulnerability
Min. base floor elevation: ft above AHWL.
TBD High Low High City Hall
Residential Housing
Dwelling density
Number of dwelling units within the City; DU/res residential acre
5 yr High Low High City Hall
Water resource accounting
Total amount of water use Annual High Low High Mel. Utility
Low impact development
“Lagoon friendly lawns”- Florida native lawns; xeriscaping. Percentage of yard space that requires minimal upkeep, e.g., little to no fertilizer, pesticide, herbicide, or water use.
Annual High Med High Survey

35
Green building initiatives
Number of homes with solar panels, number of water conservation techniques, etc.
Annual High Med High Survey
Sea level vulnerability
Minimum base floor elevation: ft above AHWL
TBD High Low High City Hall
Public Spaces Outdoor air quality
Quality of air in outdoor spaces; outdoor air quality/recreational area/yr.
Baseline, 5 yr
Low Med Low City Hall
Noise pollution Number of residents exposed to traffic related noise; Residents. Avg decibels, (meter reading).
5 yr Low Low Low Survey
Light pollution Amount of light from built environment; Measured unnatural light.
Annual High Med High Study reference
Number of disturbed sea turtle nests/yr.
Annual High Low High Brev Co
Recreational areas
Areas of recreational facilities, e.g. parks, beaches, etc., per 100 residents; m2/s/100 residents.
5 yr High Low High City
Amenity standards
Per capita: fields, picnic and play facilities, fountain signage for bottles
5 yr High Low High STAR, survey
Accessibility Parking, bike racks, wheelchair ramps.
5 yr High Low High Public works
Community Standards/ Policies
City Code Provisions
Low Impact Development, allowed density, required open space, required sidewalks Parks: water fountains, shade trees, lack of invasive species, habitat preservation.
5 yr High Med High Public Works
Stormwater Runoff
Elevation Slope. Average cross-island gradient: ft/mi, %.
Once High Low High Public Works

36
Land and Water Systems Land and Water Systems (cont).
Volumes Annual discharge volume. Model & monitor
High Low High Public Works
Nutrients Annual TN and TP loads. Model & monitor
High Low High Public Works
Low Impact Landscaping
Horticultural chemical reduction
Key chemical types concentration in discharge.
Baseline High Med High City Hall
Nutrient reduction
Reduced use of fertilizer. Survey High High High City Hall
Water conservation
Percentage of xeriscaped lawns, Number of FL Yards.
Survey High Med High City Hall
Invasive removal
Percent of landscapes with FL-listed Cat-1 invasives.
Survey High Low High City Hall
Coastal Margins
Beach and dune
Total area of dunes and beaches per mile designated as natural shoreline.
5 yr High Low High County/ GIS
Nearshore reef Max annual acres of exposed reef.
5 yr High Low High County/ GIS
Mangrove fringe
Percent of the shoreline with mangroves.
5 yr High Med High GIS survey
Wetlands Percentage of wetlands protected.
TBD Low Low Low City
Muck quantity Cubic yards of muck. Survey High Low High City Community Resource Consumption
Water consumption
Average daily water use: liters/day/capita.
Monthly High Low High Mel. Utility
Solid waste generation
Pounds/capita/day. Monthly High Low High City
Recycling Pounds/capita/day, Percent recycled/ percent of solid waste.
Monthly High Low High City
Municipal Resource Consumption
Water consumption
Average daily water consumed; Liters/day.
Monthly High Low High Mel. Utility
Energy consumption, e.g. electricity, gas, etc.
Average electricity/gas consumed; MW/yr/capita and kg/yr.
Monthly High Low High FPL
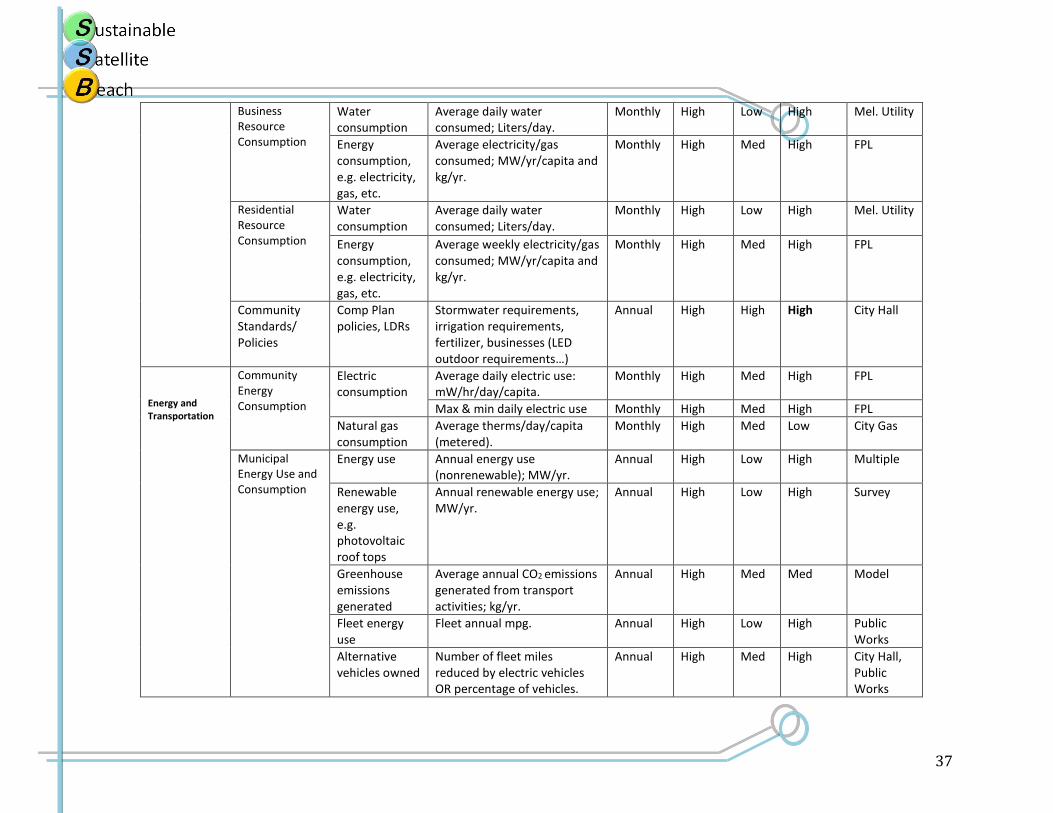
37
Business Resource Consumption
Water consumption
Average daily water consumed; Liters/day.
Monthly High Low High Mel. Utility
Energy consumption, e.g. electricity, gas, etc.
Average electricity/gas consumed; MW/yr/capita and kg/yr.
Monthly High Med High FPL
Residential Resource Consumption
Water consumption
Average daily water consumed; Liters/day.
Monthly High Low High Mel. Utility
Energy consumption, e.g. electricity, gas, etc.
Average weekly electricity/gas consumed; MW/yr/capita and kg/yr.
Monthly High Med High FPL
Community Standards/ Policies
Comp Plan policies, LDRs
Stormwater requirements, irrigation requirements, fertilizer, businesses (LED outdoor requirements…)
Annual High High High City Hall
Energy and Transportation
Community Energy Consumption
Electric consumption
Average daily electric use: mW/hr/day/capita.
Monthly High Med High FPL
Max & min daily electric use Monthly High Med High FPL
Natural gas consumption
Average therms/day/capita (metered).
Monthly High Med Low City Gas
Municipal Energy Use and Consumption
Energy use Annual energy use (nonrenewable); MW/yr.
Annual High Low High Multiple
Renewable energy use, e.g. photovoltaic roof tops
Annual renewable energy use; MW/yr.
Annual High Low High Survey
Greenhouse emissions generated
Average annual CO2 emissions generated from transport activities; kg/yr.
Annual High Med Med Model
Fleet energy use
Fleet annual mpg. Annual High Low High Public Works
Alternative vehicles owned
Number of fleet miles reduced by electric vehicles OR percentage of vehicles.
Annual High Med High City Hall, Public Works

38
Energy and Transportation (cont.)
Electric vehicle charging stations
Number of charging stations within city limits; Charging stations per square mile and KW hrs.
Annual High Low High Public Works
Business Energy Use and Consumption
Energy use Annual energy use (nonrenewable); MW/yr.
Annual High High High FPL
Renewable energy use, e.g. photovoltaic roof tops
Annual renewable energy use; MW/yr.
Annual High Low High B&Z
Greenhouse emissions generated
Average annual CO2 emissions generated from transport activities; kg/yr.
Annual Low Med Low Model
Alternative vehicles owned
Number of alternative vehicles owned and operated by businesses EVs/ business.
Annual Low High Low Survey
Residential Energy Use and Consumption
Energy use Annual energy use (nonrenewable); MW/yr.
Annual Med High Med FPL
Renewable energy use, e.g. photovoltaic roof tops
Annual renewable energy use; MW/yr.
Annual High Low High B&Z
Greenhouse emissions generated
Average annual CO2 emissions generated from transport activities; kg/yr.
Annual Low Med Low Model, TBD
Alternative vehicles owned
Number of alternative vehicles owned and operated by residents; EV’s/capita.
Annual Med Med Med Survey
Roads Condition Linear miles needing repair, miles repaved/reconstructed every 5 yr.
5 yr High Low High Public Works
Maintenance Tons of asphalt; Cubic yards of concrete.
Annual High Low High Public Works

39
Energy and Transportation (cont.)
Accidents Total number of roadway accidents per year related to condition or design
Annual High Low High Police Dept
Sea level vulnerability
Minimum paved elevation: ft above AHWL.
5 yr High Low High City
Pedestrian and Bicycle Resources
Sidewalk connectivity
Percentage of total streets with available sidewalks on both sides; % of streets with sidewalks.
5 yr High Med High Public Works GIS
Bicycle network connectivity
Percentage of total street distance with bike routes; % of streets with bike routes.
5 yr High Low High Public Works GIS
Proximity to public spaces (parks, municipal buildings)
Maximum travel distance/time from residential areas to closest public spaces; Maximum walking distance and time to closest public space.
5 yr High Low High GIS
Crosswalk availability
% Protected crosswalks for SR A1A and South Patrick Drive.
5 yr High Low High GIS
Public Transportation
Bus transit Total amount of ridership that used the Space Coast Area Transit system that ended or started in the City; Total amount of riders/mo.
Annual High Low High SCAT
Bus stops Percent of total households within ¼ mile of a bus stop.
5 yr High Low High GIS
Proximity to schools
Percent of household that meet the School District’s guidelines for busing.
5 yr Med Low Med School District
Proximity to public spaces
Percent of bus stops within ¼ mile of a public space.
5 yr High Low High SCAT GIS
Connectivity to other public transit and regional destinations
Talk to SCAT Regional destination in another part of the County or to another transit.
5 yr High Low High SCAT GIS
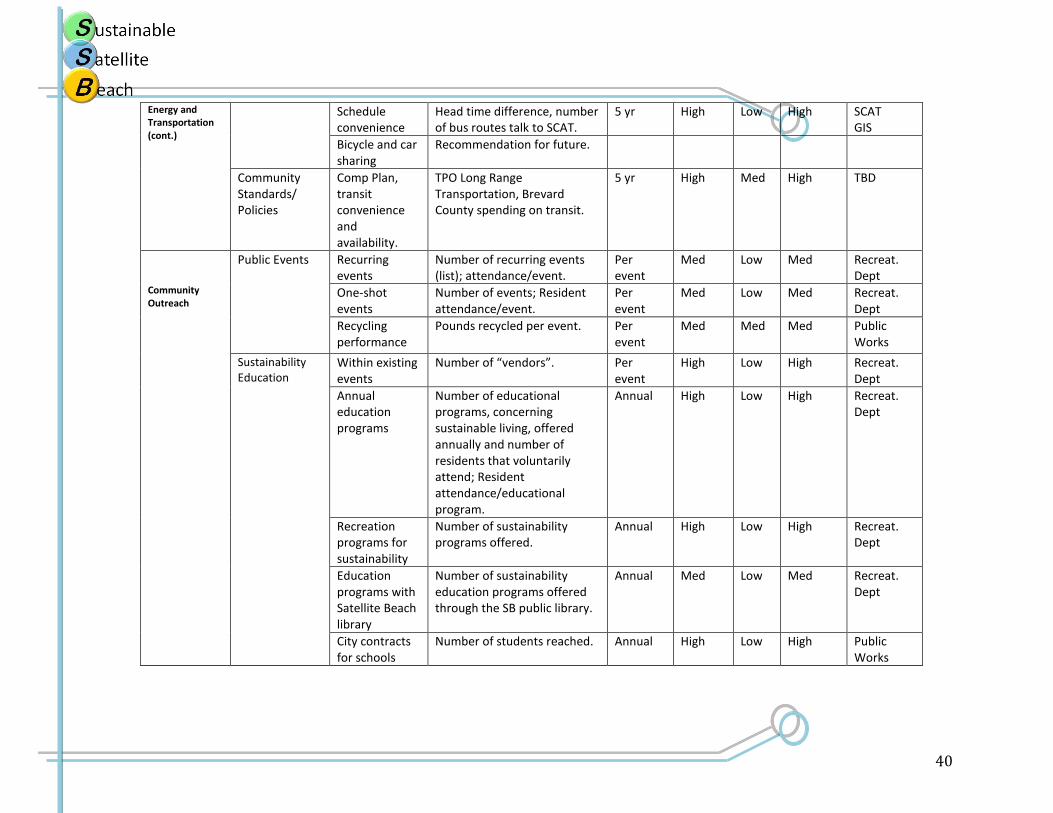
40
Energy and Transportation (cont.)
Schedule convenience
Head time difference, number of bus routes talk to SCAT.
5 yr High Low High SCAT GIS
Bicycle and car sharing
Recommendation for future.
Community Standards/ Policies
Comp Plan, transit convenience and availability.
TPO Long Range Transportation, Brevard County spending on transit.
5 yr High Med High TBD
Community Outreach
Public Events Recurring events
Number of recurring events (list); attendance/event.
Per event
Med Low Med Recreat. Dept
One-shot events
Number of events; Resident attendance/event.
Per event
Med Low Med Recreat. Dept
Recycling performance
Pounds recycled per event. Per event
Med Med Med Public Works
Sustainability Education
Within existing events
Number of “vendors”. Per event
High Low High Recreat. Dept
Annual education programs
Number of educational programs, concerning sustainable living, offered annually and number of residents that voluntarily attend; Resident attendance/educational program.
Annual High Low High Recreat. Dept
Recreation programs for sustainability
Number of sustainability programs offered.
Annual High Low High Recreat. Dept
Education programs with Satellite Beach library
Number of sustainability education programs offered through the SB public library.
Annual Med Low Med Recreat. Dept
City contracts for schools
Number of students reached. Annual High Low High Public Works

41
Community Outreach (cont.)
Amount of environmental education in local schools
Number of classes offered. Annual High Med High BCPS
Education for homeowners
Number of educational opportunities provided relating to sustainable living.
Annual High Low High City Hall
Primary Education
Student/Teacher ratio
Average number of students per teacher in grades K-12.
Annual High Low High SB schools, BCPS
Percent of residents with higher education
Total percent of SB residents with education beyond high school diploma.
3 yr Med Low Med TBD
High school graduation rate
High school graduation success rate. Total percent per school year.
Annual High Low High Satellite High School, BCPS
High school students attending college
Number of high school students currently enrolled in a college duel enrollment or head start program with local colleges or universities.
Annual Med Low Med Satellite High School, BCPS
Community Garden and Composting
School gardens Number of school gardens. Annual Low Low Low SB schools for K-12.
School composting
Number of school compost stations.
Annual Low Low Low SB schools for K-12.
Community Standards/ Policies
Comp Plan, stormwater plan, LDRs
BMAP requirement for education, recycling requirement for events.
Annual High Med High All CSB Depts.
Quality of Life
Senior Resident Community paramedics program
Monitoring at risk senior residents within the City of Satellite Beach; Number of clients
Annual High Low High Fire Dept
Medicine disposal
Percent of total medicine recycled at designated drop stations.
Annual High High High Police Dept
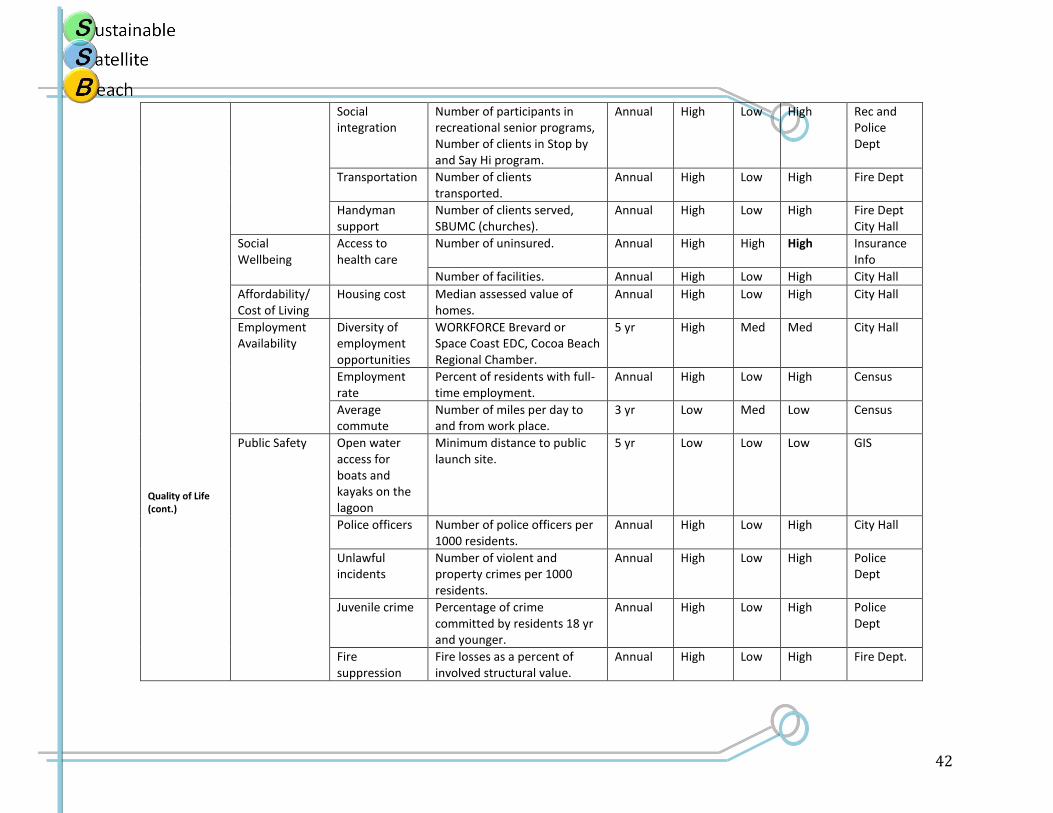
42
Quality of Life (cont.)
Social integration
Number of participants in recreational senior programs, Number of clients in Stop by and Say Hi program.
Annual High Low High Rec and Police Dept
Transportation Number of clients transported.
Annual High Low High Fire Dept
Handyman support
Number of clients served, SBUMC (churches).
Annual High Low High Fire Dept City Hall
Social Wellbeing
Access to health care
Number of uninsured. Annual High High High Insurance Info
Number of facilities. Annual High Low High City Hall
Affordability/ Cost of Living
Housing cost Median assessed value of homes.
Annual High Low High City Hall
Employment Availability
Diversity of employment opportunities
WORKFORCE Brevard or Space Coast EDC, Cocoa Beach Regional Chamber.
5 yr High Med Med City Hall
Employment rate
Percent of residents with full-time employment.
Annual High Low High Census
Average commute
Number of miles per day to and from work place.
3 yr Low Med Low Census
Public Safety Open water access for boats and kayaks on the lagoon
Minimum distance to public launch site.
5 yr Low Low Low GIS
Police officers Number of police officers per 1000 residents.
Annual High Low High City Hall
Unlawful incidents
Number of violent and property crimes per 1000 residents.
Annual High Low High Police Dept
Juvenile crime Percentage of crime committed by residents 18 yr and younger.
Annual High Low High Police Dept
Fire suppression
Fire losses as a percent of involved structural value.
Annual High Low High Fire Dept.

43
Government Local government participation
Total percentage of the population participating in local elections.
Annual High Low High City Clerk
Voter participation
Voter turnout as percentage of local population.
Annual High Low High City Clerk
Formal community contacts with City staff
Number of contacts. Annual Med Med Med City Clerk
Opinion on access to government information
Survey to the public. Annual? Survey
Med Med Med City Hall
Community Standards/ Policies
Comp Plan, Regulations, public safety/council standards
Annual Med Med Med City Hall
Recreational opportunities
Number of participants. Annual High Low High Recreat. Dept.

44
Appendix 2: A Brief Overview of Sustainability Sustainability by basic definition is the ability to sustain or uphold something of value for the long-term. A common definition of sustainability was developed in 1987 by the World Commission on Environment and Development, known commonly as the Brundtland Report: “… development that meets the needs of the present without compromising the needs of future generations to meet their own needs.” Fundamental to sustainability and the many science and policy fields it involves are the three capitals: the intertwined environmental, social, and economic assets of a governance system, such as a small city. Many cities and counties are working to align the management of these broad realms along paths that complement all three of the capitals (ICLEI, 2015). The goal of parent-to-children transfer of our current quality of life is fundamental and requires thinking of present resource consumption in terms of future resource needs. There are thousands of examples of cities and businesses adopting best management practices (BMPs) in sustainability - policies that improve near-term efficiency and long-term production. A list of such cities, just in Florida, is provided in Appendix 4. Economic savings from encouraging BMPs accrue across multiple systems and are documented in many sources (Senge, 2006; Shashaty, 2011). As it sounds, sustainability often involves interdisciplinary tasks driven by coordinated planning across many city resource needs including municipal infrastructure, roads, private and commercial properties, energy efficiency, parks and public spaces, community outreach and many other scales.
Nobel Prize laureate and former U.S. Secretary of Energy Dr. Steven Chu said, “As you rebuild urban centers, that creates jobs. As you create better living and building infrastructure and spend less time in a traffic jam, the productivity increases as well as your quality of life.” Sustainability based development, planning, infrastructure, and support will present the City of Satellite Beach with the chance to optimize, modernize, and increase its efficiency in terms of its built environment, land and water systems, energy and transportation, community outreach, and overall quality of life. In a world of rising costs, cities must continually rethink how they operate and manage local resources and infrastructure.
A rapidly increasing driver of coastal sustainability is preparation for changes in sea level and other features associated with climate change. Examples surround us from Portland, Maine to Key West, Florida, and Ft. Meyers, Florida, to Galveston, Texas (see Table 2 for Florida). These cities are following the consensus among all major U.S. professional scientific societies including the American Association for the Advancement of Science, American Geophysical Union, American Meteorological Society, American Medical Association, American Chemical Society, Geological Society of America, and American Physical Society. A list of policy statements can be found at http://climate.nasa.gov/scientific-consensus.

45
There are now many tools and case studies on the applications of diverse fields of sustainability science for the adaptive management of coastal dynamics, many with a focus on smaller coastal cities not unlike Satellite Beach, examples include: NOAA’s Digital Coast; Georgetown Climate Center; Climate Central – Surging Seas; Virtual Climate Adaptation Library; Climate Adaptation Knowledge Exchange. Summaries of coastal adaptation alternatives in Florida using non-technical infographics are available in English or Spanish and can aid sustainable coastal planning and education.
As with the certification of buildings for green standards that save energy (LEED construction certification), communities can also become certified as leaders in local economic, environmental, and social performance measures. Citizens and local leaders can use the ratings to assess their current level of sustainability, set smart targets, and measure progress along the way. STAR was developed for local governments by local governments. Released in 2012, the ratings system collectively defines community-scale sustainability and present a vision of how communities can become more healthy, inclusive, and prosperous across seven goal areas. More information is at: http://www.starcommunities.org/.

46
Appendix 3:
History of Satellite Beach Sustainability Efforts and Challenges • 1940’s: Banana River Naval Air Station initiated regular spraying with DDT to control
mosquitoes.
• 1950’s: Brevard County sprayed DDT from planes and trucks on a frequent basis to control mosquitoes.
• 1958: Joe Wickham, County Commissioner, dredged the Grand Canal to fill in mangrove swamp along the Banana River to remove mosquito-breeding habitat.
• 1960’s: Satellite Beach attempted, unsuccessfully, to remove the ocean shoreline reef using a bulldozer and dynamite.
• 1960’s-70’s: The City acquired as much oceanfront land for beach accesses and parks as they could without the City, itself, purchasing land.
• 1990: The year by which the Florida Legislature mandated sewage treatment plants cease discharging into the Indian River Lagoon.
• 1990: Residents opposed a consultant’s recommendation for the City to sell 50-acre Samson’s Island (which the City had been unable to develop into an active recreation complex as planned) to increase tax base, preferring to develop it as a passive recreation park and nature preserve.
• 1994: Governor Chiles awarded the City the first annual Florida Excellence in Coastal Management Award for work on Samson’s Island.
• Mid-1990’s: City leaders became concerned about the impact of stormwater runoff on the health of the Banana River, teaming with the St Johns River Water Management District to install on Roosevelt Avenue what was then the largest baffle box installed in Brevard County.
• 1998: City applied for state Preservation 2000 funds with which to purchase oceanfront land for conservation, resulting in the 1999 acquisition of the bulk of 18.45-acre Hightower Beach Park.
• 1999: City applied for state Preservation 2000 funds with which to purchase oceanfront land for conservation, resulting in the 2001 acquisition of 1.8 acres adjoining the southern boundary of Pelican Beach Park.
• 2000: The City completed its first major stormwater flooding reduction/water quality improvement project, on Jackson Avenue. Over the next 15 years the City spends over $6 million on stormwater flooding/water quality improvement projects.
• 2000: The City began investigating the feasibility of dredging muck from canals in the City.
• 2004: Hurricanes Frances and Jeanne, making landfall within weeks of each other along the Florida east coast in Martin County, cause severe structural damage and beach erosion to Satellite Beach’s coastline.
• 2006: The City, alongside the SJRWMD, formally objects to FDEP delisting the Indian River Lagoon as an “impaired water body”, initiating a process that resulted in the IRL Basin Management Action Plan process.
• 2009: The City takes an active role in guiding the Banana River Basin Management Action Plan (BMAP) development effort resulting from FDEP’s listing of the Indian River Lagoon as an impaired water body.
• 2009: The City obtains a Climate Ready Estuaries grant from the National Estuary Program to contract a sea level rise vulnerability study.
47
• 2010: The City Comprehensive Planning and Advisory Board (CPAB) creates a Sea Level Rise Subcommittee to assist evaluation of the Coastal Element of the City Land Use Plan.
• 2011: The City’s attempt to team with DCS Energy to installed leased PV arrays on six City buildings to generate 10.2 MWh of power per month fails with the bankruptcy of Solyndra collector manufacturer. Subsequent contacts with other PV providers over the next several years were also non-productive.
• 2012: The City supports local environmental organizations’ to present the first annual Ocean-Reef-Beach Festival at Pelican Beach Park hosting a wide variety of “vendors” of environmental information. The event has grown each year since.
• 2013: The CPAB approves sea level rise management text using Adaptation Action Areas within the Coastal Element of its Comprehensive Land Use Plan.
• 2014: The City purchases a light-duty utility vehicle to replace a full-size pickup truck.
• 2015: The City requires removal of Brazilian pepper, Australian pine, and Melaleuca invasive exotic trees
• 2015: The City establishes an ad hoc “Green Committee” to investigate the potential for implementing more sustainable practices in the City.
• 2015: The City installs an electric car charging station at Pelican Beach Park with which to gauge how much such service will be used by the public.
• 2015: The City makes available space at Pelican Beach Park for a weekly farmers’ market.
• 2016: The City converts the ad hoc “Green Committee” into a permanent “Sustainability Board”. The Board then initiates projects to: improve landscaping practices by residents and businesses, develop a community garden, make available to property owners Property Assessed Clean Energy (PACE) funding, and make available affordable rooftop PV systems.
• 2016: The City contracts with Florida Institute of Technology to begin developing a sustainability action plan.
• 2016: The City is one of 14 communities nationwide, the only one in the Southeast, designated as “Gold SolSmart” for its efforts to remove barriers to the installation of photovoltaic systems.
• 2016: The City formally supports the Space Coast League of Women Voters’ Florida Solar United Neighborhoods (FL SUN) Spacecoast rooftop photovoltaic system purchasing co-op.
• 2016: A stepping-stone to finalizing the City sustainability action plan, the Sustainability Assessment Report is completed, identifying and highlighting areas within the municipality that citizens and local government deem viable for sustainability improvements.
• 2016: Hurricane Matthew, a category four storm, narrowly misses making a direct landfall in southern Brevard County just south of Cape Canaveral. The worst of the storm stays just offshore but Satellite Beach still sustains areas of structural damage and some beach erosion. Most importantly perhaps thought the storm once again, after over a decade of “hurricane drought”, highlights the dangers of hurricanes and the need for a resilient and sustainable city.
• 2017: The Satellite Beach Sustainability Action Plan is completed and made available to the public for economic, social, and environmental guidance and to showcase the City’s efforts to lead by example in regards to issues within each respective capital.
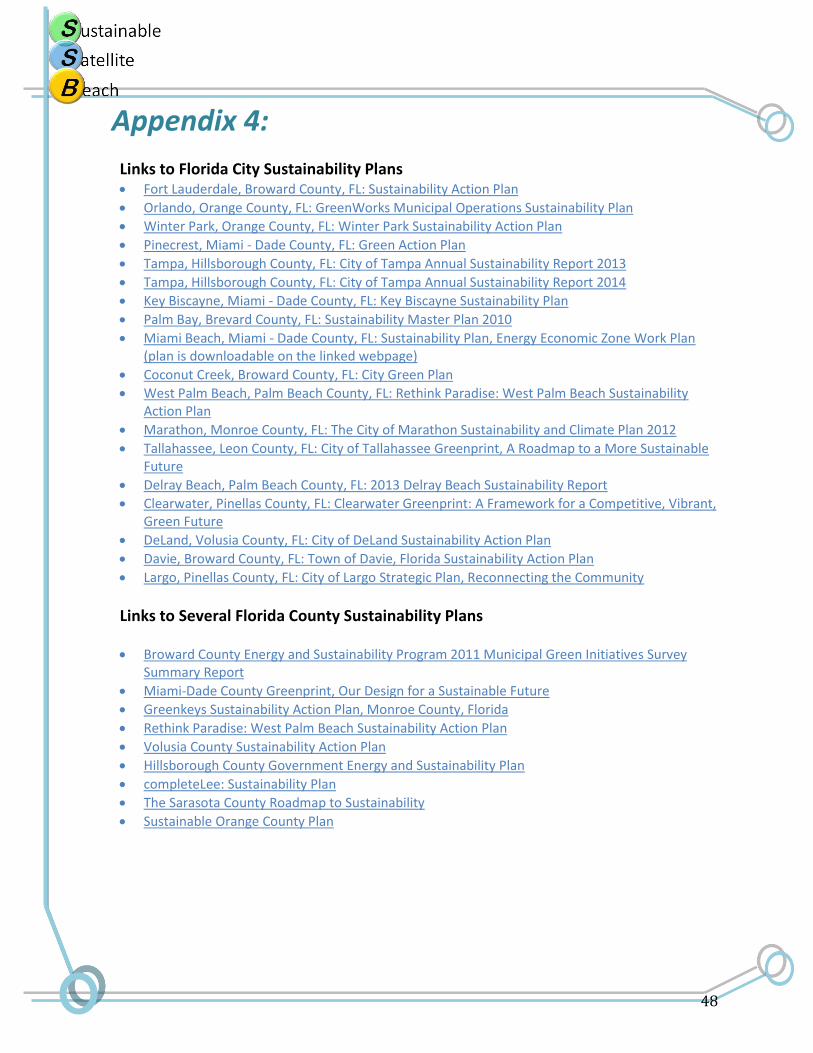
48
Appendix 4:
Links to Florida City Sustainability Plans • Fort Lauderdale, Broward County, FL: Sustainability Action Plan
• Orlando, Orange County, FL: GreenWorks Municipal Operations Sustainability Plan
• Winter Park, Orange County, FL: Winter Park Sustainability Action Plan
• Pinecrest, Miami - Dade County, FL: Green Action Plan
• Tampa, Hillsborough County, FL: City of Tampa Annual Sustainability Report 2013
• Tampa, Hillsborough County, FL: City of Tampa Annual Sustainability Report 2014
• Key Biscayne, Miami - Dade County, FL: Key Biscayne Sustainability Plan
• Palm Bay, Brevard County, FL: Sustainability Master Plan 2010
• Miami Beach, Miami - Dade County, FL: Sustainability Plan, Energy Economic Zone Work Plan (plan is downloadable on the linked webpage)
• Coconut Creek, Broward County, FL: City Green Plan
• West Palm Beach, Palm Beach County, FL: Rethink Paradise: West Palm Beach Sustainability Action Plan
• Marathon, Monroe County, FL: The City of Marathon Sustainability and Climate Plan 2012
• Tallahassee, Leon County, FL: City of Tallahassee Greenprint, A Roadmap to a More Sustainable Future
• Delray Beach, Palm Beach County, FL: 2013 Delray Beach Sustainability Report
• Clearwater, Pinellas County, FL: Clearwater Greenprint: A Framework for a Competitive, Vibrant, Green Future
• DeLand, Volusia County, FL: City of DeLand Sustainability Action Plan
• Davie, Broward County, FL: Town of Davie, Florida Sustainability Action Plan
• Largo, Pinellas County, FL: City of Largo Strategic Plan, Reconnecting the Community
Links to Several Florida County Sustainability Plans
• Broward County Energy and Sustainability Program 2011 Municipal Green Initiatives Survey Summary Report
• Miami-Dade County Greenprint, Our Design for a Sustainable Future
• Greenkeys Sustainability Action Plan, Monroe County, Florida
• Rethink Paradise: West Palm Beach Sustainability Action Plan
• Volusia County Sustainability Action Plan
• Hillsborough County Government Energy and Sustainability Plan
• completeLee: Sustainability Plan
• The Sarasota County Roadmap to Sustainability
• Sustainable Orange County Plan

49