
City of San Diego CALGRIP Project: Evaluation Report bulletin Criminal Justice Research Division,...
15
bulletin CJ Criminal Justice Research Division, SANDAG City of San Diego CALGRIP Project: Evaluation Report May 2011 Sandy Keaton Janelle Sisting Cynthia Burke, Ph.D. 401 B Street Suite 800 San Diego, CA 92101 (619) 699-1900 A SANDAG CJ BULLETIN
Transcript of City of San Diego CALGRIP Project: Evaluation Report bulletin Criminal Justice Research Division,...

bulletin
CJ Criminal Justice Research Division, SANDAG
City of San Diego CALGRIP Project: Evaluation Report
May 2011
Sandy Keaton Janelle Sisting Cynthia Burke, Ph.D.
401 B Street Suite 800 San Diego, CA 92101 (619) 699-1900
A SANDAG CJ BULLETIN

BOARD OF DIRECTORS
Hon. Jerome Stocks Hon. Jack Dale
Hon. Matt Hall, Mayor
(A) Hon. Ann Kulchin, Mayor Pro Tem
(A) Hon. Farrah Douglas, Councilmember
Hon. Cheryl Cox, Mayor
(A) Hon. Rudy Ramirez, Deputy Mayor
(A) Hon. Steve Castaneda, Councilmember
Hon. Carrie Downey, Councilmember
(A) Hon. Al Ovrom, Mayor Pro Tem
(A) Hon. Michael Woiwode, Councilmember
Hon. Carl Hilliard, Deputy Mayor
(A) Hon. Terry Sinnott, Councilmember
(A) Hon. Mark Filanc, Councilmember
Hon. Mark Lewis, Mayor
(A) Hon. Jillian Hanson-Cox, Councilmember
Hon. Jerome Stocks, Deputy Mayor
(A) Hon. Kristin Gaspar, Councilmember
(A) Hon. Teresa Barth, Councilmember
Hon. Sam Abed, Mayor
(A) Hon. Marie Waldron, Councilmember
Hon. Jim Janney, Mayor
(A) Hon. Jim King, Councilmember
(A) Hon. Lorie Bragg, Councilmember
Hon. Art Madrid, Mayor
(A) Hon. Mark Arapostathis, Councilmember
(A) Hon. Ruth Sterling, Vice Mayor
Hon. Mary Teresa Sessom, Mayor
(A) Hon. Jerry Jones, Mayor Pro Tem
(A) Hon. George Gastil, Councilmember
Hon. Ron Morrison, Mayor
(A) Hon. Rosalie Zarate, Councilmember
(A) Hon. Alejandra Sotelo-Solis, Vice Mayor
Hon. Jim Wood, Mayor
(A) Hon. Jack Feller, Councilmember
(A) Hon. Gary Felien, Councilmember
Hon. Don Higginson, Mayor
(A) Hon. Jim Cunningham, Councilmember
(A) Hon. John Mullin, Councilmember
Hon. Jerry Sanders, Mayor
(A) Hon. Lorie Zapf, Councilmember
(A) Hon. David Alvarez, Councilmember
Hon. Anthony Young, Council President
(A) Hon. Sherri Lightner, Councilmember
(A) Hon. Todd Gloria, Councilmember
Hon. Jim Desmond, Mayor
(A) Hon. Hal Martin, Vice Mayor
(A) Hon. Rebecca Jones, Councilmember
Hon. Jim Janney Gary L. Gallegos
Hon. Jack Dale, Councilmember
(A) Hon. John Minto, Vice Mayor
(A) Hon. Rob McNelis, Councilmember
Hon. Lesa Heebner, Mayor
(A) Hon. Mike Nichols, Councilmember
(A) Hon. Dave Roberts, Councilmember
Hon. Judy Ritter, Mayor
(A) Hon. Steve Gronke, Councilmember
(A) Hon. John Aguilera, Mayor Pro Tem
Hon. Bill Horn, Chairman
(A) Hon. Dianne Jacob, Supervisor Hon. Ron Roberts, Vice Chair (A) Hon. Greg Cox, Chair Pro Tem
(A) Hon. Pam Slater-Price, Supervisor
Vacant
(A) Vacant
Cindy McKim, Director
(A) Laurie Berman, District 11 Director
Harry Mathis, Chairman
(A) Hon. Al Ovrom
(A) Vacant
Hon. Chris Orlando, Chairman
(A) Hon. Dave Roberts, Councilmember
(A) Hon. Mark Packard, Councilmember
CAPT Keith Hamilton, USN, CEC, Southwest Division Naval Facilities Engineering Command (A) CAPT James W. Wink, USN, CEC
Southwest Division Naval Facilities Engineering Command
Scott Peters, Chairman
(A) Dan Malcolm, Commissioner
Mark Muir, Director
(A) Javier Saunders, Director
Hon. Edwin 'Thorpe' Romero
Barona Band of Mission Indians
Hon. Allen Lawson
San Pasqual Band of Dieguieño Indians
(A) Dennis Turner, SCTCA Executive Director
Hon. Remedios Gómez-Arnau
Cónsul General of Mexico
Hon. Martha E. Rosas,
Deputy Cónsul General of Mexico
As of April 7, 2011

violence and proliferation. SDPD has been focusing resources in high gang activity neighborhoods and applied for the CalGRIP grant intending to increase their presence in communities located within SDPD's Southeastern and Mid-City Divisions. The 20 neighborhoods located in the target area are characterized by low socioeconomic status, numerous subsidized housing units, run-down buildings, and are home to some of the most violent and established gangs in the city (i.e., Logan 30, 5/9 Brim, Southeast Locos, and Shelltown Gamma) involving over 1,000 members.
Program Description
Prevention Services: Analysis conducted as part of Project Safe Neighborhoods (PSN)\ showed that a disproportionate amount of gun-related crime in the San Diego region occurred on weekend evenings. As such, providing youth a safe and engaging place to go during these times were the goals of prevention efforts. CalGRIP funds were utilized to extend the hours of three San Diego City Park and Recreation centers located in the target area: Memorial, Mountain View, and Southcrest. Between June 2008 and December 2010, these three recreation centers extended their hours from 6:00 p.m. to 9:00 p.m. on Fridays. Because of the high gang activity in these neighborhoods, SDPD provided an extra police car that would patrol the recreation centers during the extended hours. In addition to open recreational activities, supplemental programming was brought into the centers during these times. Activities included softball games between youth and staff (i.e., recreation staff, police officers, CBO staff), movies, and talks by police officers.
1 PSN is a Department of Justice-sponsored initiative to reduce gun and gang crime in the United States. The United States Attorney's Office is the coordinator of the project.
Intervention Services: The intervention arm of the project involved a partnership with the United Methodist Urban Ministry (METRO), a local CBO that serves gang-involved individuals, as well as at-risk youth and their families. Working closely with the SDPD's Juvenile Service Team (JST), METRO offered youth referred from JST, as well as from other sources (e.g., Probation, schools, and the community), case management services. METRO's primary role was to refer youth to services within the community and provide mentorship and case management to monitor their progress. Youth were assessed at intake and then teamed with a case manager to assist them in obtaining needed services.
Suppression: The enforcement component of the project centered on intelligence-led policing, targeting high-profile gang members and gang activity in the project areas. To accomplish this, a crime analyst was hired and assigned to work with the SDPD's Gang Unit. The analyst utilized technology to organize the vast amount of information (e.g. field contacts, arrests, and probation and parole searches) in order to identify patterns, hot spots, and linkages. This information was then used by the Gang Unit to direct suppression operations.
Advisory Committee: The City of San Diego Commission on Gang Prevention and Intervention acted as the advisory committee for this project. Staff from the Commission facilitated the project meetings, and project updates were provided to the Commission on a quarterly basis.
METHODOLOGY
To help document the services delivered and outcomes achieved, SANDAG worked closely with the project partners to develop documenting systems and data collection instruments, and also analyzed and summarized the information.
City of San Diego CalGRIP Project: Evaluation Report 3

followed by Mountain View (30%), and Memorial (29%).
Figure 1 SOUTHCREST CENTER HAD THE GREATEST
PROPORTION OF VISITORS 100%
80%
60%
41% 40%
20%
0% Memorial Ml_ View Soutl,,,est
TOTAL =5,338 NOTE: Cases with missing information not included.
SOURCE: SANDAG Park and Recreation sign-in sheets
On average these youth were around 13 years old, with those at Mountain View being slightly younger (12.91, SD = 2.80) than those attending Memorial (13.46, SD = 2.33) and Southcrest (13.78, SD 2.90)2 (not shown). Overall, two-thirds of attendees were male (66%) ranging from 62 percent at Southcrest to 69 percent at Memorial (not shown). These data are consistent with the project's desire to engage younger youth in pro-social activities. Research shows that gang association starts in early adolescence (i.e., 12 to 13) and progresses to membersh ip as the youth ages (Curry, Decker, & Eagley, Jr., 2002)3. Given the lag between gang association and membership, the Park and Recreation prevention activities are reaching the appropriate age population of at-risk youth.
What where the characteristics of the youth who attended the Park and Recreation centers during the extended hours?
To better understand what the youth thought of the extended center hours, as well as learn about their awareness of gangs and their level of safety in the area, a survey was distributed to youth who participated in any of the three centers on Friday nights during the month of September 2010. A total of 175 youth completed the survey, with the majority attending Memorial (61 %), followed by Southcrest (22%), and Mountain View (17%) (not shown). While it was not possible to conduct a random sample, the respondents were similar in age (13.62, SD=2.68) to the general population who attended on Friday nights. However, there was a larger representation of girls (45%) among the respondents compared to the overall population (34%). The exception was respondents from Mountain View, who were almost all male (86%) (not shown).
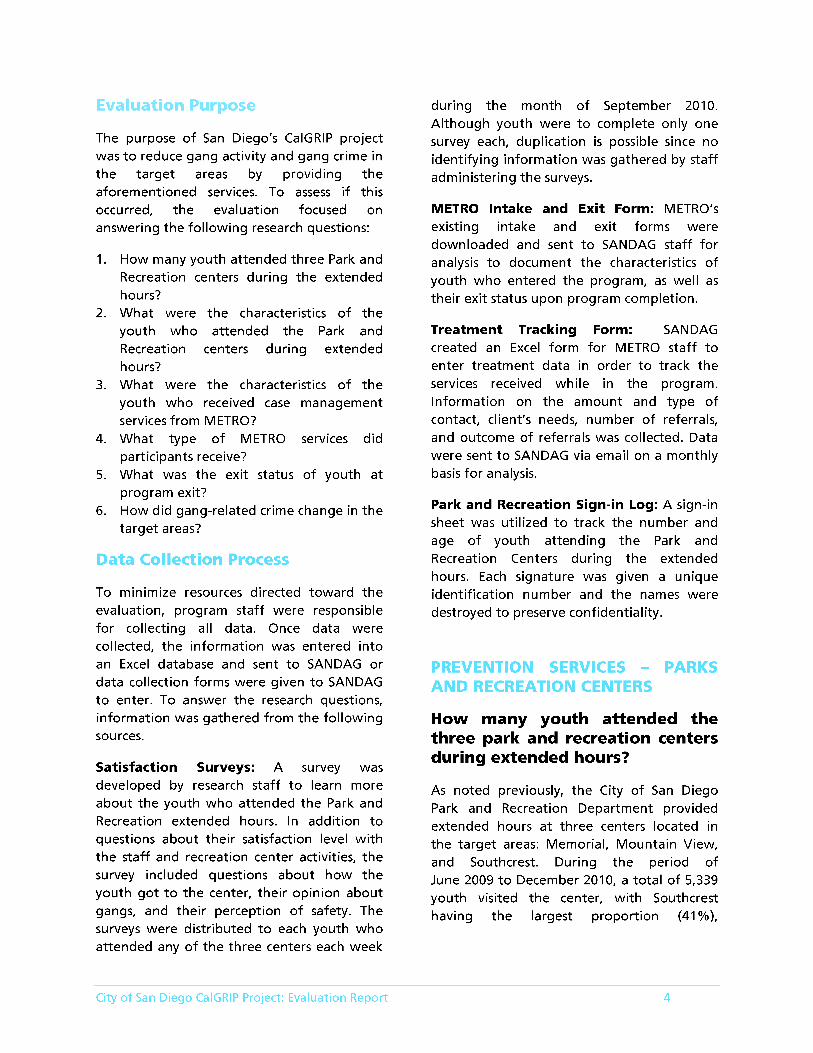
As expected, the centers served youth who lived in the neighborhood. Most of the respondents reported that they lived within five to nine blocks (41%) or three to four blocks (29%) from the center, with only 14 percent living ten or more blocks from the center (Figure 2).
2 Average age is based on those attendees that were 20 years or younger. 3 Curry, D.G., Decker, S.H., Egley Jr. A. (2002). Gang involvement and delinquency in a middle school population. JQ: Justice Quarterly, 19(2), 275.
City of San Diego CalGRIP Project: Evaluation Report 5
Figure 2
THE MAJORITY OF RESPONDENTS LIVED WITHIN A FEW BLOCKS FROM THE
CENTERS 100%
80%
60%
41% 40%
20%
0% 1-2 blocks 3-4 blocks 5-9 blocks 10 or more blocks
TOTAL =170 NOTE: Cases with missing information not included.
SOURCE: Park and Recreation participant survey, 2010
Consistent with living in close proximity to the center, most respondents walked (67%) or rode their bike (25%) to the center, with the fewest getting there by car (15%) (not shown). This information is important for several reasons. First, since the project partners anticipated youth walking to and from the center, they shortened the originally scheduled hours from 10:00 p.m. to 9:00 p.m. to avoid any issues with curfew. Secondly, because of the expected increase in youth traveling to and from the center at night,
having a police presence at and around the center was a priority.
To assess the respondent's level of participation and satisfaction with the centers' activities, the survey included a series of questions to measure how respondents heard about the extended hours, how often they attended, their level of satisfaction, and what they would be doing if they were not at the center during its extended hours.
Given the influence of peers in an adolescent's life, it is not surprising that the most common way a respondent heard about the extended hours was from his/her friend (52%). Around one-third (32%) were informed while at the center during normal hours, and a similar proportion heard at school (11 %) or through a family member ( 1 0 %) (Tab I e 1).
Table 1 RESPONDENTS MOST LIKELY TO HEAR ABOUT EXTENDED HOURS THROUGH
52%
while at the center 32% school 11 %
family 10% other 6% church 5%
SOURCE: Park and Recreation participant survey, 2010
Most of the respondents were regular participants at the center, with 95 percent having previously visited the center during its normal hours and having attended the center during its extended hours on Friday evenings (not shown). The respondents were also frequent visitors, with nearly two-th irds (62%) visiting the center nine or more times during its extended hours, almost onequarter (23%) visiting five to eight times, and 10 percent visiting two to four times (Figure 3). This attendance pattern suggests that youth who had visited the center prior, were now taking advantage of the extended hours.
Figure 3 RESPONDENTS WERE FREQUENT USERS OF
THE CENTERS 100%
80%
62% 60%
40%
20%
0% 9 or more times 5 to 8 times 2 to 4 times First time visiting
TOTAL =174 NOTE: Cases with missing information not included.
SOURCE: Park and Recreation participant survey, 2010
In an effort to encourage regular attendance, a variety of extracurricular activities were offered to the youth. When asked to select the three activities they preferred at the
City of San Diego CalGRIP Project: Evaluation Report 6

center, the most common responses were meeting with friends and playing sports (39% each), followed by watching movies and talking with the staff (32% each) and doing arts and crafts (26%) (Table 2).
Table 2
RESPONDENTS ENJOYED A VARIETY OF ACTIVITIES WHILE AT THE CENTERS
meeting with friends 39% playing sports 39% watching movies 32% talking with staff 32% doing arts and crafts 26% playing games 23% dancing 14% playing softball with staff 11 % participating in other activities 7%
NOTE: Cases with missing information not included.
SOURCE: Park and Recreation participant survey, 2010
When asked to rank their level of satisfaction with the activities the center provides on Friday even ings, the majority of respondents said they were "very" satisfied (81 %) or "somewhat" satisfied (17%) with the activities (not shown). This satisfaction level varied among centers, with Memorial having the highest percentage (90%) and Southcrest having the fewest respondents (66%) stating they were "very" satisfied (not shown).
The purpose of the extended hours is to provide a safe alternative for youth in the neighborhood. As such, the survey asked where youth might be if they were not at the center. Although the majority of respondents stated they would be at home (53%), almost one-third (31 %) reported that they would be "hanging out" in the neighborhood or at a friend's house (28%) (Table 3). This is critical since these recreation centers are located in generally unsafe neighborhoods where gang activity is a reality.
Table 3
OVER HALF OF RESPONDENTS WOULD BE HANGING OUT OR AT A FRIENDS HOUSE IF
NOT AT THE CENTER
home 53% hanging out in the neighborhood 31% a friend's house 28% the mall 12% the movies 8% someplace else (other) 5%
NOTE: Cases with missing information not included. Percentages based on multiple responses.
SOURCE: Park and Recreation participant survey, 2010
Having the recreation center open for these extended hours allows the youth to engage in pro-social activities while being in a safe, supervised environment. When asked about their feeling of safety, almost all (99%) respondents said that they felt safe while at the center. The remaining two respondents reported not feeling safe because of gangs, but said having a police officer at the center would make them feel safer (not shown).
The survey also asked youth to share how safe they felt traveling to and from the center. Since the majority of respondents (92%) walk or ride their bike to the center, the response to this question was especially noteworthy. All but four respondents (97%) reported feeling safe going to and from the center (not shown).
As part of measuring level of safety, youth were also asked about the presence of gangs in their neighborhood. Results indicate that the youth were concerned about gangs, with close to two-third (65%) reporting they were "somewhat" or "very" worried about gangs in their neighborhood. In concert with this
City of San Diego CalGRIP Project: Evaluation Report 7

result, when respondents were asked how serious of a gang problem exists in their neighborhood, a similar percentage (69%) felt gangs were "somewhat" of a problem or a "very serious" problem (not shown). Interestingly, when the data were analyzed by site, the youths' perceptions of the gang problem varied. As Figure 4 shows, respondents attending Memorial were less likely to be worried about gangs (20%) and to report having gang problems in their neighborhood (20%), compared to Southcrest (53% and 37%, respectively) and Mountain View (70% and 67%, respectively). Feedback from staff who work at the Mountain View center commented that a substantial amount of gang activity does exist around the center. Females overall were also more likely to report having a concern about gangs (73%) and viewing them as a problem (78%) compared to males (58% and 61 %, respectively) (not shown).
Figure 4 MOST YOUTH AT MOUNTAIN VIEW FELT GANGS WERE A PROBLEM*
100%
80% 70% 67%
60%
40%
20%
0% Memorial Southcrest Mountain View
• Worried about gangs . Gangs are a problem
TOTAL =172 *Significant difference at p < .05.
NOTE: Cases with missing information not included. Categories "somewhat and "very serious" were collapsed into "a problem" or "not a problem".
SOURCE: Park and Recreation participant survey, 2010
These results suggest that youth recogn ize there is an issue with gangs in their neighborhood. However, the responses are interesting because wh ile the youth were worried about gangs, they still felt safe traveling within their neighborhood to get to the center. This disconnect warrants further exploration to learn more about the
perceived impact gangs have in the neighborhood, as well as how entrenched gangs may be in these neighborhoods. That is, youth and their families may be friends and neighbors with gang members and therefore don't perceive them as an immediate threat.
INTERVENTION SERVICES
What were the characteristics of youth who received case management services from METRO'?
As the lead agency for the intervention component of the project, METRO was charged with providing services to the higher risk youth (e.g., those associating with or members of gangs). During the period between March 2009 to August 2010, 89 youth4 enrolled in METRO. Almost all (97%) participants were referred by to the program by METRO, with the remaining 3 percent referred by the San Diego Police Department's Juvenile Service Team (JST) officer. There were slightly more males (54%) than females (46%) enrolled in the program (not shown). Almost two-thirds (62%) of participants were African-American, over onethird Hispanic (36%), and 1 percent each were Asian or biracial (Figure 5) .
Figure 5 MAJORITY OF PARTICIPANTS WERE
AFRICAN AMERICAN 100%
80% 62%
60%
40%
20%
1% 1% 0%
African American Hispanic Asian Birac,al
TOTAL =84 NOTE: Cases with missing information not included.
4 Exact age wa~ not collected so an average cannot be presented.
City of San Diego CalGRIP Project: Evaluation Report 8

SOURCE: METRO Intake form
At the onset of the program, all youth were enrolled in school (100%) and almost all had a stable housing situation (99%) (not shown). Over half of the youth lived with their mother (54%) and about one-quarter (26%) lived with both biological parents (Figure 6). Youths' average monthly household income was $1,568 ~ = $637). Additionally, four percent of youth reported having a family member in jail (not shown).
Figure 6 MOST YOUTH LIVED IN SINGLE FEMALE
HEADED HOUSEHOLDS 100%
80%
60% 54%
40%
20% 1%
0% Mom alone Both parents Biological Other Father alone
parent & step parent
TOTAL =85 NOTE: Cases with missing information not included. Percentages do not equal 100 due to rounding.
SOURCE: METRO Intake form
At enrollment, almost all (98%) participants
reported being exposed to gangs and onefifth (20%) reported being involved with gangs. Additionally, youth were asked to complete a nine-item "Attitudes Toward GangsSII assessment to measure if s/he viewed gangs in a positive or negative light. A review of the answers shows that although most youth were not in a gang, their lives were heavily influenced by gangs. Specifically, the majority had friends in school that belonged to gangs (88%) and/or had family members with gang affiliation (79%). Furthermore, the youth were clearly aware of the dangers associated with gangs, with two in five (41 %)
believing joining a gang offered them protection but at the same time threequarters (75%) felt joining a gang was
5 The assessment was created by Nadel, Spell mann, AlvarezCan i no, La usell-Bryant & La ndsberg, 1996 a nd is avai lable at: http.JJwww.cdc.gov/ncipcJpub-res/measure.htm.
dangerous. Additionally, one-third of youth reported they would either join a gang (14%) or that they already belonged to a gang (19%). Overall, the average assessment score was 3.48 ~ = 1.68), with a higher score indicating a more positive attitude toward gangs (the possible range was 0 to 9).
Table 4 PARTICIPANTS HAD SUBSTANTIAL GANG
EXPOSURE IN THEIR LIVES
You are safer and have protection if you join a gang. 41 %
I will probably join a gang. 14% Some of my friends at school
belong to gangs. 88% It is cool to be in a gang. 13% My friends would think less of me if
I joined a gang. 49% It is dangerous to join a gang. 75% Being in a gang makes it more likely
that you will get into trouble. 81 % Some of my family belongs or used
to belong to a gang. 79% I belong to a gang. 19%
NOTE: Cases with missing information not included. Questions 5, 6, and 7 were reverse coded when calculating the overall score.
SCORCE: METRO Attitudes Toward Gangs survey
What type Of METRO services did participants receive?
As described earlier, youth were teamed with a case manager who helped guide the youth's case plan. METRO was not responsible for providing all the services but for assisting the youth to connect with services in the community. On average, youth were in the METRO program for 24 weeks (range 6 to 52 weeks) and met with their case manager an average of 4 times (range 0 to 17) in person and 8 times (range 0 to 30) by phone (not shown). When examining who was contacted by program staff, it is apparent that METRO
City of San Diego CalGRIP Project: Evaluation Report 9

made an effort to involve the youth and the adult in his/her life in the case management plan. As Figure 7 shows, most program contacts were with the youth and adult (4.70, SD=4.33), followed by the youth alone (3.98, SD=5.98), and an adult alone (3.19, SD =5.36).
Figure 7 BOTH YOUTH AND AN ADULT WERE
CONTACTED DURING PROGRAM PARTICIPATION
6_00
4,71
4_00
2_00
0_00 Youth Adult Both
TOTAL =89 SOURCE: METRO Treatment Tracking Form
During case management meetings, staff assessed the youth's needs and determined the appropriate type of referral(s). Academic assistance was identified as the greatest need (93%) by program participants upon entrance to the program, followed by wrap-around services (39%), and employment assistance (32%). A small portion (8%) of the youth required some form of emergency assistance (e.g., food, clothing), and only one percent were in need of substance abuse treatment (Table 5).
In regard to services received, since academic assistance was the greatest need identified at intake, it follows that 98 percent of program participants were referred to an academic assistance program. Additionally, over half (56%) of youth were referred to a program that provided wrap-around services. One-fifth (20%) of program participants were referred to a substance abuse treatment program, but only one percent cited substance abuse treatment as a need upon entering the program. One possible explanation for this could be that as a youth interacted more with his/her case manager, his/her trust level
increased and so did his/her willingness to disclose any substance abuse problems. It is also worth noting that only five percent of youth were referred to an employment assistance program, although almost onethird (32%) reported it as a need at intake (Table 5).
Table 5 ALMOST ALL PARTICIPANTS RECEIVED
ACADEMIC REFERRAL
Academic assistance 93% 98% Wrap-around services 39% 56% Employment assistance 32% 5% Emergency assistance 8% 0% Substance abuse
treatment 1% 20% Mental health treatment 0% 1%
NOTE. Percentages based on multiple responses
SOURCE: METRO Treatment Tracking Form
While almost all participants received some type of referral (98%), not all participants chose to follow through and contact the program (not shown). Specifically, threefourths (76%) of those who received a
referral made and attended their appointment, one-third (33%) made an appointment but did not attend, less than half (45%) who received a referral eventually enrolled (Table 6).
Table 6 NEARLY ONE-HALF OF YOUTH ENROLLED
INTO THE REFERRED PROGRAM
Made and attended an appointment 76% Enrolled in the program 45% Made but did not attend an
33%
NOTES: Percentages based on multiple responses. Cases with missing information not included.
SOURCE: METRO Treatment Tracking Form
City of San Diego CalGRIP Project: Evaluation Report 10

What was the status of youth at program exit?
At exit from the program, more than nine in ten (92%) youth completed their planned services, 6 percent exited early because they got a job, and 2 percent were incarcerated (not shown). When asked more specifically about their status at exit, 45 percent of youth were active with a mentor, 24 percent were enrolled in an academic assistance program, 15 percent were enrolled in an after school program, 14 percent had obtained an internship or employment, 13 percent were enrolled in wrap around services, 4 percent were involved in a sports program, and 2 percent each were incarcerated or not allowed to receive services per their parents (Table 7).
Table 7 MENTORSHIP WAS THE MOST POPULAR
Parent refused services
Mentorship 45% Academic assistance program 24% After school program 15% I nternsh ip/em ployment 14% Wraparound services 13% Sports program 4% Inca rcer ated 2%
2%
NOTES: Percentages based on multiple responses. Cases with missing information not included.
SOURCE: METRO Treatment Tracking Form
Data on participants' gang affiliation and involvement was difficult to interpret because of the direction of the change and the inconsistency in the results. Specifically, a significantly smaller proportion (78%) of youth reported being exposed to gangs at exit compared to intake (98%). However, a significantly higher proportion of youth reported involvement in gangs (38%) at exit compared to intake (20%) (Figure 8).
Figure 8 MORE YOUTH WERE INVOLVED IN GANGS
AT EXIT THAN INTAKE
98% 100%
80%
60%
40%
20%
0% Gang Expo~ure Gang Involvement
_ Entering program _ Exiting program
TOTAL =76 - 80 Significant difference at P < .05.
NOTE: Cases with missing information not included.
SOURCE: METRO Intake and Exit Forms
When program staff were asked why there was an increase in reported gang involvement, staff noted youth were more forthcoming about the level of their gang involvement at exit. Specifically, after establish ing a trusting relationsh ip with staff youth were more likely to admit their involvement. This admission of involvement was viewed as a positive outcome by staff because the increased level of trust was an asset in assisting in being able to both engage and assist the youth in achieving their goals.
An additional contradiction was found in the results of the gang assessment. The overall score of the exit gang assessment indicated that youth were sign ificantly less likely to view gangs positively at exit (1.59, 50=1.68) than at intake (3.48, 50=1.68) (not shown). However, a comparison of each individual question at intake and exit highlights some inconsistencies in the youths' responses. For example, as Table 8 shows, only one percent of youth reported they belonged to a gang at exit and none said they would probably join one in spite of the results that more reported involvement (38%) at exit. Furthermore, fewer (60%) youth reported that a family member was or had been involved in a gang at exit compared to intake (79%). There are a few possible explanations for these findings including the reliability of the instrument, the administration of the instrument, and the
City of San Diego CalGRIP Project: Evaluation Report 11

change in trust level on the part of the youth. While the assessment has been tested for internal consistency (.74), the reliability of the instrument has not been tested and these mixed results could be a factor of the assessment. The results could also be influenced by how and when the instruments were administered by program staff. Different staff may have administered the post from the pre-tests or asked the question differently over time. Finally, feedback from
program staff indicated that youth may have enhanced their own involvement and that of their parents at intake in order to establish some "street credibility," which was not necessary at exit. Even with these inconsistencies, the overall result of the gang assessment indicated that youth were less likely to view gangs in a positive light and indicated they were also less likely to join them.
Table 8 YOUTH LESS LIKELY TO VIEW GANG POSITIVELY
You are safer and have protection if you join a gang I will probably join a gang Some of my friends at school belong to gangs It is cool to be in a gang My friend would think less of me if I joined a gang It is dangerous to join a gang Being in a gang makes it more likely that you will
trouble Some of my family belong or used to belong to a gang
41% 2% 14% 0% 88% 31% 13% 2% 49% 45% 75% 95%
get into 81% 98%
79% 60% I belong to a gang 19% 1%
NOTE: Cases with missing information not included. Questions 5, 6, and 7 were reverse coded when calculating the overall score.
SCORCE: METRO Attitudes Towards Gang survey
How Did Gang-Related Crime Change In the Target Areas'?
As noted earlier, a crime analyst was hired as part of this project to gather and analyze data from various sources and provide a strategic picture of gang activity in the target areas. In addition, the analyst provided crime statistics before and during the project period. While the overall violent crime rate in the City of San Diego decreased by seven percent between 2008 and 2010, gangrelated crime in the target law enforcement divisions decreased 35 percent in Central division and 37 percent in Southeastern from 2008 (prior to CaIGRIP) to 2010. There were several large scale gang operations that occurred during this time that have been
attributed to the overall reduction of gang crime in the City. These multi-jurisdictional operations included Operation Stamped (2008 - 2009) that resulted in 31 arrests, including three gang-related homicide arrests; Operation Red Sky (2009) that culminated with 93 arrests, 19 firearms and significant narcotic seizures; and Operation Winter Storm (2009 - 2010) that resulted in 53 arrests, 16 firearms recovered and the seizure of cocaine, ecstasy, and methamphetamine. While CalGRIP did not fund the operations, the CalGRIP analyst did supply key information on possible gang targets in support of these efforts.
City of San Diego CalGRIP Project: Evaluation Report 12

Table 9 GANG-RELATED CRIMES DECREASED IN TARGET AREAS BETWEEN 2008 TO 2010
Central 66 Southeastern 123
I • i e '
SOURCE: SDPD CRIME ANAL YST 2011
SUMMARY
In 2008, SDPD in partnership with the San Diego Commission on Gang Prevention and Intervention was successful in their submission of a CalGRIP grant application. The purpose of the project was to implement a continuum of services from prevention to suppression in communities with high rates of gang violence. Prevention activities entailed San Diego Parks and Recreation Department extending normal hours of three recreation centers located in high gang crime areas. A local community-based organization provided case management and mentoring services to youth and families who were impacted by gang activity (either through membership or association). SDPD led the suppression component of the project, utilizing CalGRIP funds to hire a crime analyst who supported the gang unit by synthesizing data to inform operations and targets. SDPD also supported the intervention portion of the project by identifying at-risk youth and referring them to METRO and also providing patrols around the centers during the extended hours.
Information gathered from a variety of data collection methods showed that the project was well received by participants, that positive gains were achieved, and that gang crime did decrease around the three target areas. Specifically, attendees at the centers during the extended hours reported high levels of satisfaction with the services and over half reported that they would be hanging out in the neighborhood or at a
friend's house if the centers were not open. Outcome data gathered on those youth who received intervention services from METRO showed a lower propensity towards gang and gang activity and an engagement in supportive services in the community. Finally, gang crime decreased dramatically in the police divisions where the three centers are located.
While the evaluation was limited in scope because of resources, the results indicate that the CalGRIP funds targeted the appropriate at-risk population and had a positive impact in the target neighborhoods.
RECOMMENDATIONS
Continue to engage the San Diego Parks and Recreation Department in gang reduction strategies: The positive feedback from participants, the consistent level of engagement, and the locations of the centers demonstrate a need for pro-social services in these areas. With threats of closures due to reduced funds, strategically aligning hours of operation with high risk times could reduce the potential negative impact from shortened hours of operations and reductions of other prevention services in high risk neighborhoods.
Increase referrals from police to the community-based organization: The original intention of the grant was to utilize the community policing activities of SDPD to identify at risk youth and refer them for services. However, the data shows that only three of the youth participating in METRO were referred from police. The reasons for these low numbers is unclear from the data available; however, this is a valuable pipeline to services and exploring ways to enhance this opportunity should be considered.
Increase the assessment of the project: The data gathered as part of the evaluation
City of San Diego CalGRIP Project: Evaluation Report 13

elude to the positive impact CalGRIP money has on at-risk community. Additional collection and analysis would provide a clearer picture of what components are responsible for change, as well as learn more about the individuals served. Furthermore, adding a follow-up component would allow for measuring the longer term impact of the interventions.
City of San Diego CalGRIP Project: Evaluation Report 14