CITY OF PITTSBURGH NEIGHBORHOOD PROFILES ... householder, no husband present 82 15.1% 75 to 79 years...
118
CITY OF PITTSBURGH NEIGHBORHOOD PROFILES CENSUS 2010 SUMMARY FILE 1 (SF1) DATA PROGRAM IN URBAN AND REGIONAL ANALYSIS UNIVERSITY CENTER FOR SOCIAL AND URBAN RESEARCH UNIVERSITY OF PITTSBURGH JULY 2011 www.ucsur.pitt.edu
Transcript of CITY OF PITTSBURGH NEIGHBORHOOD PROFILES ... householder, no husband present 82 15.1% 75 to 79 years...

CITY OF PITTSBURGH NEIGHBORHOOD PROFILES
CENSUS 2010 SUMMARY FILE 1 (SF1) DATA
PROGRAM IN URBAN AND REGIONAL ANALYSISUNIVERSITY CENTER FOR SOCIAL AND URBAN RESEARCH UNIVERSITY OF PITTSBURGH JULY 2011
www.ucsur.pitt.edu


1
About the University Center for Social and Urban Research (UCSUR)
The University Center for Social and Urban Research (UCSUR) was established in 1972 to serve as a
resource for researchers and educators interested in the basic and applied social and behavioral
sciences. As a hub for interdisciplinary research and collaboration, UCSUR promotes a research agenda
focused on the social, economic and health issues most relevant to our society. UCSUR maintains a
permanent research infrastructure available to faculty and the community with the capacity to: (1)
conduct all types of survey research, including complex web surveys; (2) carry out regional econometric
modeling; (3) analyze qualitative data using state‐of‐the‐art computer methods, including web‐based
studies; (4) obtain, format, and analyze spatial data; (5) acquire, manage, and analyze large secondary
and administrative data sets including Census data; and (6) design and carry out descriptive, evaluation,
and intervention studies. UCSUR plays a critical role in the development of new research projects
through consultation with faculty investigators.
The long‐term goals of UCSUR fall into three broad domains: (1) provide state‐of‐the‐art research and
support services for investigators interested in interdisciplinary research in the behavioral, social, and
clinical sciences; (2) develop nationally recognized research programs within the Center in a few
selected areas; and (3) support the teaching mission of the University through graduate student, post‐
doctoral, and junior faculty mentoring, teaching courses on research methods in the social sciences, and
providing research internships to undergraduate and graduate students. Achieving these goals requires
that we continually upgrade and improve the research infrastructure of the Center, and that we recruit,
develop, and maintain a core staff of investigators capable of being leaders in their fields.
About the Program in Urban and Regional Analysis
UCSUR’s Program in Urban and Regional Analysis focuses on economic change in the Pittsburgh region.
UCSUR is a research affiliate of the Pennsylvania State Data Center (PaSDC) and maintains the Pittsburgh
REMI model, an economic impact model for conducting economic impact analysis and economic and
demographic forecasting for the greater Southwestern Pennsylvania region. This report is part of the
program’s decades‐long work to studying patterns of change in Pittsburgh neighborhoods.
UCSUR’s Program in Urban and Regional Analysis also maintains the Pittsburgh Neighborhood and
Community Information System (PNCIS), a property information system that collects integrated
information on community conditions and provides it to local stakeholders. The PNCIS is a partnership
of UCSUR, the Pittsburgh Partnership for Neighborhood Development (PPND), the City of Pittsburgh,
and other stakeholders. UCSUR operates PNCIS in agreement with the City of Pittsburgh and PPND.

2
Table of Contents
About the University Center for Social and Urban Research (UCSUR) .................... 1
Table of Contents .................................................................................................... 2
Neighborhood Index ............................................................................................... 3
Overview ................................................................................................................. 4
Neighborhood Profiles ............................................................................................ 5
Neighborhood Rankings ........................................................................................ 97
Appendix 1: Census Tract and Census Block Group to Neighborhood Index ...... 112

3
Neighborhood Index
Allegheny Center ..................................... 7 Allegheny West ....................................... 8 Allentown ................................................ 9 Arlington ............................................... 10 Arlington Heights .................................. 11 Banksville .............................................. 12 Bedford Dwellings ................................. 13 Beechview ............................................. 14 Beltzhoover ........................................... 15 Bloomfield ............................................. 16 Bluff ....................................................... 17 Bon Air ................................................... 18 Brighton Heights ................................... 19 Brookline ............................................... 20 California‐Kirkbride ............................... 21 Carrick ................................................... 22 Central Business District ....................... 23 Central Lawrenceville ............................ 24 Central Northside .................................. 25 Central Oakland .................................... 26 Chartiers City ......................................... 27 Chateau ................................................. 28 Crafton Heights ..................................... 29 Crawford‐Roberts .................................. 30 Duquesne Heights ................................. 31 East Allegheny ....................................... 32 East Carnegie ......................................... 33 East Hills ................................................ 34 East Liberty ............................................ 35 Elliott ..................................................... 36 Esplen .................................................... 37 Fairywood.............................................. 38 Fineview ................................................ 39 Friendship .............................................. 40 Garfield .................................................. 41 Glen Hazel ............................................. 42 Greenfield ............................................. 43 Hays ....................................................... 44 Hazelwood............................................. 45 Highland Park ........................................ 46 Homewood North ................................. 47 Homewood South ................................. 48 Homewood West .................................. 49 Knoxville ................................................ 50 Larimer .................................................. 51
Lincoln Place .......................................... 52 Lincoln‐Lemington‐Belmar .................... 53 Lower Lawrenceville .............................. 54 Manchester ............................................ 55 Marshall‐Shadeland ............................... 56 Middle Hill ............................................. 57 Morningside ........................................... 58 Mount Washington ................................ 59 Mt. Oliver ............................................... 60 New Homestead .................................... 61 North Oakland ....................................... 62 North Shore ........................................... 63 Northview Heights ................................. 64 Oakwood................................................ 65 Overbrook .............................................. 66 Perry North ............................................ 67 Perry South ............................................ 68 Point Breeze ........................................... 69 Point Breeze North ................................ 70 Polish Hill ............................................... 71 Regent Square ....................................... 72 Ridgemont ............................................. 73 Shadyside ............................................... 74 Sheraden ................................................ 75 South Oakland ....................................... 76 South Shore ........................................... 77 Southside Flats ....................................... 78 Southside Slopes .................................... 79 Spring Garden ........................................ 80 Spring Hill‐City View .............................. 81 Squirrel Hill North .................................. 82 Squirrel Hill South .................................. 83 St. Clair ................................................... 84 Stanton Heights ..................................... 85 Strip District ........................................... 86 Summer Hill ........................................... 87 Swisshelm Park ...................................... 88 Terrace Village ....................................... 89 Troy Hill .................................................. 90 Upper Hill ............................................... 91 Upper Lawrenceville .............................. 92 West End ................................................ 93 West Oakland ........................................ 94 Westwood ............................................. 95 Windgap ................................................ 96

City of Pittsburgh Neighborhood Profiles – Census 2010 Summary File 1 (SF1) Data
4
Overview
This research report compiles data from the 2010 Decennial Census Summary File 1 (SF1) data for City of
Pittsburgh neighborhoods. The SF1 data contains basic information on the U.S. population from the
100% enumeration of the United States’ residential population and housing stock collected in the 2010
Decennial Census. It includes data on people's age, sex, and race, their family and household groups,
and whether their home is owned or rented. The reference date for the collection of data in the 2010
Decennial Census was April 1, 2010.
This report should complement data reported from the Census Bureau’s American Community Survey
(ACS) program. The 2010 Decennial Census was limited to what was once described as the “short form”
which asked a total of 10 questions of every respondent. The majority of data collected by the
Decennial Census in recent decades came from a longer set of questions asked of one in six households
in the nation. This “long form” questionnaire was eliminated in the 2010 Decennial Census.
The ACS is a relatively new survey‐based program which replaces the “long form” of the Decennial
Census. Data is available from the ACS program annually. UCSUR has produced a series of
neighborhood profiles based upon the first release of ACS data at the census tract level. The profiles are
contained in a report available online on the center’s web page (www.ucsur.pitt.edu).
This report follows similar reports of neighborhood conditions compiled by UCSUR. Past neighborhood
data compendiums are available on the center’s web page (www.ucsur.pitt.edu) and include sets of
neighborhood reports from 1974, 1977, and 2000. UCSUR produced “The Social Geography of Allegheny
County” for 1990 Census data which is available in print form upon request. Past projects focused on
neighborhood level data for the City of Pittsburgh include the Pittsburgh Atlas Project from the 1970s,
and the Pittsburgh Neighborhood Information System (NIS) generated in the 1980s, which compiled
data for all city neighborhoods back to 1930. Today, the center’s focus for neighborhood level data is
also encompassed in the Pittsburgh Neighborhood and Community Information (PNCIS), which includes
an interactive GIS system of address‐level data for the City of Pittsburgh and other communities in
Allegheny County.
This report includes 7 tables for each of the 90 neighborhoods in the City of Pittsburgh. A set of ordinal
rankings for the major descriptive variables are presented here as well.

City of Pittsburgh Neighborhood Profiles – Census 2010 Summary File 1 (SF1) Data
5
Neighborhood Profiles
This report compiles data from a subset of summary tables available from the 2010 Decennial Census
Summary File 1 (SF1) data. Individual profiles are provided for each of the 90 neighborhoods currently
defined by the City of Pittsburgh. Seven selected summary tables from the SF1 data are included in
these profiles. The selected SF1 tables reported here are listed in Table 1.
Table 1. Selected SF1 Tables Used
SF1 Table Description
P3 Total Population by Race
P4 Total Population by Hispanic or Latino Origin
P12 Total Population by Sex and Age
P18 Total Households by Household Type
H3 Total Housing Units by Occupancy Status
H4 Occupied Housing Units by Tenure (Mortgage Status)
H5 Vacant Housing Units by Vacancy Status
Other summary tables are available from the Census Bureau online via their Factfinder web page
(http://factfinder2.census.gov). City of Pittsburgh neighborhoods are not a level of geography compiled
by the U.S. Census Bureau. The Census Bureau’s Factfinder web page reports data at the census tract
level and census block group level which can be aggregated by users to generate neighborhood level
data. Further information on the SF1 is available from the Census Bureau via the 2010 Census Summary
File 1 – Technical Documentation report online at: http://www.census.gov/prod/cen2010/doc/sf1.pdf.
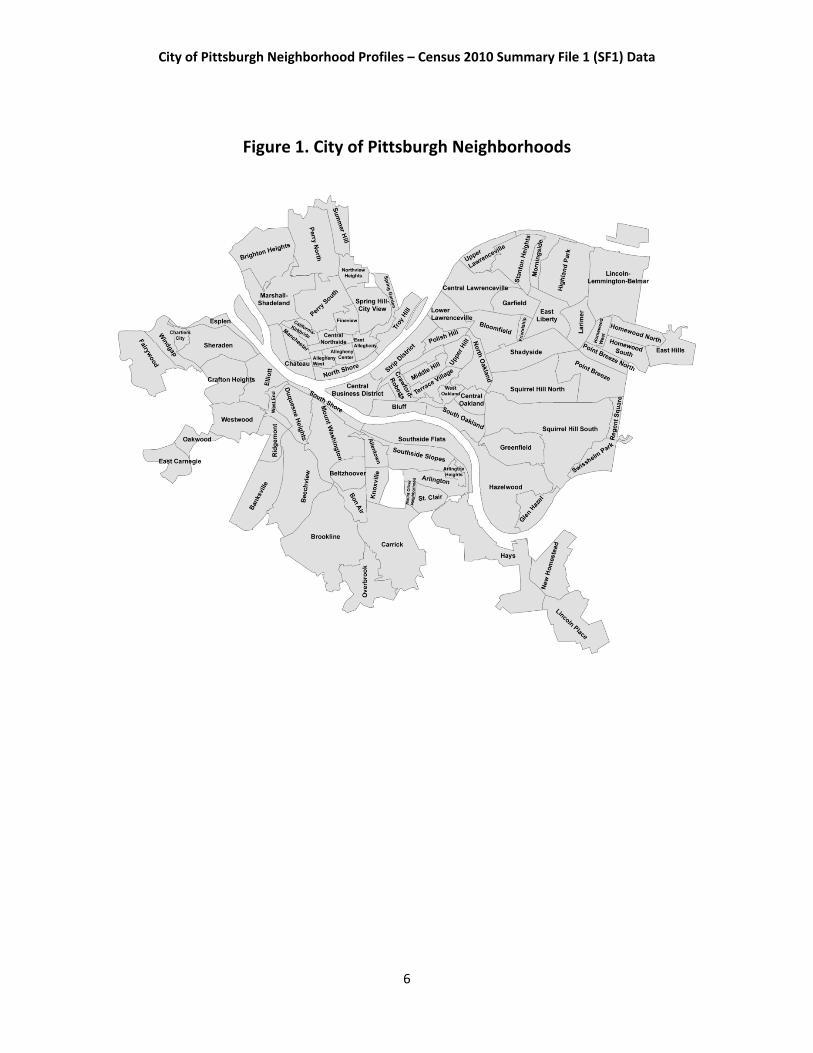
The City of Pittsburgh currently defines 90 distinct neighborhoods. Each neighborhood is a collection of
one or more census tracts or, in certain cases, census block groups. The index of specific census tracts
and block groups to neighborhoods used to generate these profiles is included as an appendix to this
report. A map of current City of Pittsburgh neighborhoods is depicted in Figure 1.
City of Pittsburgh Neighborhood Profiles – Census 2010 Summary File 1 (SF1) Data
6
Figure 1. City of Pittsburgh Neighborhoods

City of Pittsburgh Neighborhood Profiles – Census 2010 Summary File 1 (SF1) Data
University Center for Social and Urban Research – University of Pittsburgh
7
Allegheny Center Population by Race Area (Square Miles) 0.21
Total population 933 Density (Persons per Square Mile) 4,509
White alone 381 40.8%
Black or African American alone 453 48.6%
American Indian and Alaska Native alone
4 0.4% Population by Age
Total population 933
Asian alone 56 6.0% Under 5 years 50 5.4%
Native Hawaiian and Other Pacific Islander alone
1 0.1% 5 to 9 years 57 6.1%
10 to 14 years 35 3.8%
Some other race alone 1 0.1% 15 to 17 years 22 2.4%
Two or more races 37 4.0% 18 and 19 years 45 4.8%
20 years 15 1.6%
21 years 26 2.8%
Population by Hispanic or Latino Origin 22 to 24 years 64 6.9%
Total population 933 25 to 29 years 127 13.6%
Not Hispanic or Latino 906 97.1% 30 to 34 years 68 7.3%
Hispanic or Latino 27 2.9% 35 to 39 years 46 4.9%
40 to 44 years 33 3.5%
45 to 49 years 40 4.3%
Household Type 50 to 54 years 48 5.1%
Total households 542 55 to 59 years 43 4.6%
Family households: 157 29.0% 60 and 61 years 19 2.0%
Husband‐wife family 61 11.3% 62 to 64 years 30 3.2%
Other family: 96 17.7% 65 and 66 years 17 1.8%
Male householder, no wife present
14 2.6% 67 to 69 years 22 2.4%
70 to 74 years 33 3.5%
Female householder, no husband present
82 15.1% 75 to 79 years 34 3.6%
80 to 84 years 40 4.3%
Nonfamily households: 385 71.0% Age 85 and over 19 2.0%
Householder living alone 321 59.2%
Householder not living alone 64 11.8% Under age 18 164 17.6%
Age 65 and over 165 17.7%
Housing Occupancy Status Housing Vacancy Status Total housing units 1,052 Vacant housing units 510
Occupied 542 51.5% For rent 212 41.6%
Vacant 510 48.5% Rented, not occupied 1 0.2%
For sale only 0 0.0%
Sold, not occupied 0 0.0%
Housing Tenure For seasonal, recreational or occasional use
81 15.9% Total occupied housing units 542
Owned with a mortgage or a loan 20 3.7% For migrant workers 0 0.0%
Owned free and clear 25 4.6%
Renter‐occupied 497 91.7% Other Vacant 216 42.4%

City of Pittsburgh Neighborhood Profiles – Census 2010 Summary File 1 (SF1) Data
University Center for Social and Urban Research – University of Pittsburgh
8
Allegheny West Population by Race Area (Square Miles) 0.14
Total population 462 Density (Persons per Square Mile) 3,196
White alone 354 76.6%
Black or African American alone 84 18.2%
American Indian and Alaska Native alone
1 0.2% Population by Age
Total population 462
Asian alone 7 1.5% Under 5 years 11 2.4%
Native Hawaiian and Other Pacific Islander alone
0 0.0% 5 to 9 years 6 1.3%
10 to 14 years 14 3.0%
Some other race alone 2 0.4% 15 to 17 years 5 1.1%
Two or more races 14 3.0% 18 and 19 years 3 0.6%
20 years 1 0.2%
21 years 8 1.7%
Population by Hispanic or Latino Origin 22 to 24 years 25 5.4%
Total population 462 25 to 29 years 48 10.4%
Not Hispanic or Latino 449 97.2% 30 to 34 years 56 12.1%
Hispanic or Latino 13 2.8% 35 to 39 years 35 7.6%
40 to 44 years 44 9.5%
45 to 49 years 37 8.0%
Household Type 50 to 54 years 39 8.4%
Total households 266 55 to 59 years 44 9.5%
Family households: 81 30.5% 60 and 61 years 21 4.5%
Husband‐wife family 64 24.1% 62 to 64 years 20 4.3%
Other family: 17 6.4% 65 and 66 years 10 2.2%
Male householder, no wife present
4 1.5% 67 to 69 years 10 2.2%
70 to 74 years 13 2.8%
Female householder, no husband present
13 4.9% 75 to 79 years 8 1.7%
80 to 84 years 2 0.4%
Nonfamily households: 185 69.5% Age 85 and over 2 0.4%
Householder living alone 146 54.9%
Householder not living alone 39 14.7% Under age 18 36 7.8%
Age 65 and over 45 9.7%
Housing Occupancy Status Housing Vacancy Status Total housing units 355 Vacant housing units 89
Occupied 266 74.9% For rent 39 43.8%
Vacant 89 25.1% Rented, not occupied 0 0.0%
For sale only 17 19.1%
Sold, not occupied 0 0.0%
Housing Tenure For seasonal, recreational or occasional use
3 3.4% Total occupied housing units 266
Owned with a mortgage or a loan 63 23.7% For migrant workers 0 0.0%
Owned free and clear 25 9.4%
Renter‐occupied 178 66.9% Other Vacant 30 33.7%

City of Pittsburgh Neighborhood Profiles – Census 2010 Summary File 1 (SF1) Data
University Center for Social and Urban Research – University of Pittsburgh
9
Allentown Population by Race Area (Square Miles) 0.30
Total population 2,500 Density (Persons per Square Mile) 8,368
White alone 1,485 59.4%
Black or African American alone 878 35.1%
American Indian and Alaska Native alone
9 0.4% Population by Age
Total population 2,500
Asian alone 1 0.0% Under 5 years 169 6.8%
Native Hawaiian and Other Pacific Islander alone
0 0.0% 5 to 9 years 180 7.2%
10 to 14 years 194 7.8%
Some other race alone 11 0.4% 15 to 17 years 117 4.7%
Two or more races 116 4.6% 18 and 19 years 57 2.3%
20 years 41 1.6%
21 years 48 1.9%
Population by Hispanic or Latino Origin 22 to 24 years 169 6.8%
Total population 2,500 25 to 29 years 216 8.6%
Not Hispanic or Latino 2,442 97.7% 30 to 34 years 143 5.7%
Hispanic or Latino 58 2.3% 35 to 39 years 129 5.2%
40 to 44 years 135 5.4%
45 to 49 years 171 6.8%
Household Type 50 to 54 years 185 7.4%
Total households 1,033 55 to 59 years 184 7.4%
Family households: 575 55.7% 60 and 61 years 58 2.3%
Husband‐wife family 212 20.5% 62 to 64 years 60 2.4%
Other family: 363 35.1% 65 and 66 years 28 1.1%
Male householder, no wife present
77 7.5% 67 to 69 years 44 1.8%
70 to 74 years 56 2.2%
Female householder, no husband present
286 27.7% 75 to 79 years 49 2.0%
80 to 84 years 26 1.0%
Nonfamily households: 458 44.3% Age 85 and over 41 1.6%
Householder living alone 373 36.1%
Householder not living alone 85 8.2% Under age 18 660 26.4%
Age 65 and over 244 9.8%
Housing Occupancy Status Housing Vacancy Status Total housing units 1,291 Vacant housing units 258
Occupied 1,033 80.0% For rent 72 27.9%
Vacant 258 20.0% Rented, not occupied 3 1.2%
For sale only 34 13.2%
Sold, not occupied 23 8.9%
Housing Tenure For seasonal, recreational or occasional use
6 2.3% Total occupied housing units 1,033
Owned with a mortgage or a loan 252 24.4% For migrant workers 1 0.4%
Owned free and clear 194 18.8%
Renter‐occupied 587 56.8% Other Vacant 119 46.1%

City of Pittsburgh Neighborhood Profiles – Census 2010 Summary File 1 (SF1) Data
University Center for Social and Urban Research – University of Pittsburgh
10
Arlington Population by Race Area (Square Miles) 0.49
Total population 1,869 Density (Persons per Square Mile) 3,793
White alone 1,429 76.5%
Black or African American alone 371 19.9%
American Indian and Alaska Native alone
6 0.3% Population by Age
Total population 1,869
Asian alone 3 0.2% Under 5 years 101 5.4%
Native Hawaiian and Other Pacific Islander alone
0 0.0% 5 to 9 years 118 6.3%
10 to 14 years 123 6.6%
Some other race alone 1 0.1% 15 to 17 years 82 4.4%
Two or more races 59 3.2% 18 and 19 years 52 2.8%
20 years 36 1.9%
21 years 36 1.9%
Population by Hispanic or Latino Origin 22 to 24 years 92 4.9%
Total population 1,869 25 to 29 years 165 8.8%
Not Hispanic or Latino 1,842 98.6% 30 to 34 years 108 5.8%
Hispanic or Latino 27 1.4% 35 to 39 years 114 6.1%
40 to 44 years 103 5.5%
45 to 49 years 147 7.9%
Household Type 50 to 54 years 139 7.4%
Total households 767 55 to 59 years 145 7.8%
Family households: 466 60.8% 60 and 61 years 45 2.4%
Husband‐wife family 232 30.2% 62 to 64 years 48 2.6%
Other family: 234 30.5% 65 and 66 years 25 1.3%
Male householder, no wife present
67 8.7% 67 to 69 years 36 1.9%
70 to 74 years 41 2.2%
Female householder, no husband present
167 21.8% 75 to 79 years 44 2.4%
80 to 84 years 39 2.1%
Nonfamily households: 301 39.2% Age 85 and over 30 1.6%
Householder living alone 235 30.6%
Householder not living alone 66 8.6% Under age 18 424 22.7%
Age 65 and over 215 11.5%
Housing Occupancy Status Housing Vacancy Status Total housing units 886 Vacant housing units 119
Occupied 767 86.6% For rent 28 23.5%
Vacant 119 13.4% Rented, not occupied 3 2.5%
For sale only 10 8.4%
Sold, not occupied 3 2.5%
Housing Tenure For seasonal, recreational or occasional use
0 0.0% Total occupied housing units 767
Owned with a mortgage or a loan 288 37.5% For migrant workers 0 0.0%
Owned free and clear 230 30.0%
Renter‐occupied 249 32.5% Other Vacant 75 63.0%

City of Pittsburgh Neighborhood Profiles – Census 2010 Summary File 1 (SF1) Data
University Center for Social and Urban Research – University of Pittsburgh
11
Arlington Heights Population by Race Area (Square Miles) 0.11
Total population 244 Density (Persons per Square Mile) 2,148
White alone 23 9.4%
Black or African American alone 205 84.0%
American Indian and Alaska Native alone
3 1.2% Population by Age
Total population 244
Asian alone 0 0.0% Under 5 years 48 19.7%
Native Hawaiian and Other Pacific Islander alone
0 0.0% 5 to 9 years 13 5.3%
10 to 14 years 6 2.5%
Some other race alone 1 0.4% 15 to 17 years 6 2.5%
Two or more races 12 4.9% 18 and 19 years 10 4.1%
20 years 12 4.9%
21 years 4 1.6%
Population by Hispanic or Latino Origin 22 to 24 years 24 9.8%
Total population 244 25 to 29 years 18 7.4%
Not Hispanic or Latino 242 99.2% 30 to 34 years 13 5.3%
Hispanic or Latino 2 0.8% 35 to 39 years 7 2.9%
40 to 44 years 5 2.0%
45 to 49 years 13 5.3%
Household Type 50 to 54 years 21 8.6%
Total households 135 55 to 59 years 10 4.1%
Family households: 63 46.7% 60 and 61 years 0 0.0%
Husband‐wife family 5 3.7% 62 to 64 years 9 3.7%
Other family: 58 43.0% 65 and 66 years 7 2.9%
Male householder, no wife present
1 0.7% 67 to 69 years 7 2.9%
70 to 74 years 5 2.0%
Female householder, no husband present
57 42.2% 75 to 79 years 1 0.4%
80 to 84 years 3 1.2%
Nonfamily households: 72 53.3% Age 85 and over 2 0.8%
Householder living alone 59 43.7%
Householder not living alone 13 9.6% Under age 18 73 29.9%
Age 65 and over 25 10.2%
Housing Occupancy Status Housing Vacancy Status Total housing units 148 Vacant housing units 13
Occupied 135 91.2% For rent 12 92.3%
Vacant 13 8.8% Rented, not occupied 1 7.7%
For sale only 0 0.0%
Sold, not occupied 0 0.0%
Housing Tenure For seasonal, recreational or occasional use
0 0.0% Total occupied housing units 135
Owned with a mortgage or a loan 1 0.7% For migrant workers 0 0.0%
Owned free and clear 4 3.0%
Renter‐occupied 130 96.3% Other Vacant 0 0.0%
City of Pittsburgh Neighborhood Profiles – Census 2010 Summary File 1 (SF1) Data
University Center for Social and Urban Research – University of Pittsburgh
12
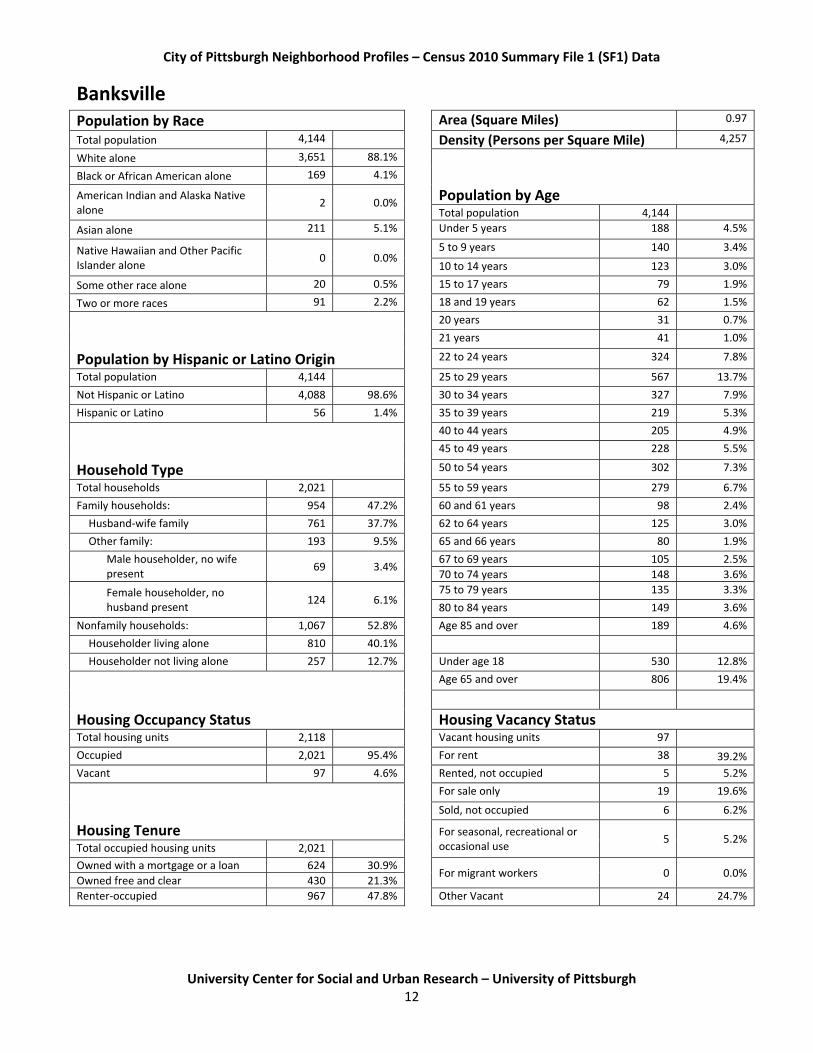
Banksville Population by Race Area (Square Miles) 0.97
Total population 4,144 Density (Persons per Square Mile) 4,257
White alone 3,651 88.1%
Black or African American alone 169 4.1%
American Indian and Alaska Native alone
2 0.0% Population by Age
Total population 4,144
Asian alone 211 5.1% Under 5 years 188 4.5%
Native Hawaiian and Other Pacific Islander alone
0 0.0% 5 to 9 years 140 3.4%
10 to 14 years 123 3.0%
Some other race alone 20 0.5% 15 to 17 years 79 1.9%
Two or more races 91 2.2% 18 and 19 years 62 1.5%
20 years 31 0.7%
21 years 41 1.0%
Population by Hispanic or Latino Origin 22 to 24 years 324 7.8%
Total population 4,144 25 to 29 years 567 13.7%
Not Hispanic or Latino 4,088 98.6% 30 to 34 years 327 7.9%
Hispanic or Latino 56 1.4% 35 to 39 years 219 5.3%
40 to 44 years 205 4.9%
45 to 49 years 228 5.5%
Household Type 50 to 54 years 302 7.3%
Total households 2,021 55 to 59 years 279 6.7%
Family households: 954 47.2% 60 and 61 years 98 2.4%
Husband‐wife family 761 37.7% 62 to 64 years 125 3.0%
Other family: 193 9.5% 65 and 66 years 80 1.9%
Male householder, no wife present
69 3.4% 67 to 69 years 105 2.5%
70 to 74 years 148 3.6%
Female householder, no husband present
124 6.1% 75 to 79 years 135 3.3%
80 to 84 years 149 3.6%
Nonfamily households: 1,067 52.8% Age 85 and over 189 4.6%
Householder living alone 810 40.1%
Householder not living alone 257 12.7% Under age 18 530 12.8%
Age 65 and over 806 19.4%
Housing Occupancy Status Housing Vacancy Status Total housing units 2,118 Vacant housing units 97
Occupied 2,021 95.4% For rent 38 39.2%
Vacant 97 4.6% Rented, not occupied 5 5.2%
For sale only 19 19.6%
Sold, not occupied 6 6.2%
Housing Tenure For seasonal, recreational or occasional use
5 5.2% Total occupied housing units 2,021
Owned with a mortgage or a loan 624 30.9% For migrant workers 0 0.0%
Owned free and clear 430 21.3%
Renter‐occupied 967 47.8% Other Vacant 24 24.7%

City of Pittsburgh Neighborhood Profiles – Census 2010 Summary File 1 (SF1) Data
University Center for Social and Urban Research – University of Pittsburgh
13
Bedford Dwellings Population by Race Area (Square Miles) 0.18
Total population 1,202 Density (Persons per Square Mile) 6,729
White alone 48 4.0%
Black or African American alone 1,106 92.0%
American Indian and Alaska Native alone
8 0.7% Population by Age
Total population 1,202
Asian alone 3 0.2% Under 5 years 176 14.6%
Native Hawaiian and Other Pacific Islander alone
0 0.0% 5 to 9 years 81 6.7%
10 to 14 years 59 4.9%
Some other race alone 1 0.1% 15 to 17 years 39 3.2%
Two or more races 36 3.0% 18 and 19 years 64 5.3%
20 years 22 1.8%
21 years 38 3.2%
Population by Hispanic or Latino Origin 22 to 24 years 83 6.9%
Total population 1,202 25 to 29 years 77 6.4%
Not Hispanic or Latino 1,183 98.4% 30 to 34 years 46 3.8%
Hispanic or Latino 19 1.6% 35 to 39 years 44 3.7%
40 to 44 years 53 4.4%
45 to 49 years 56 4.7%
Household Type 50 to 54 years 72 6.0%
Total households 651 55 to 59 years 75 6.2%
Family households: 307 47.2% 60 and 61 years 21 1.7%
Husband‐wife family 27 4.1% 62 to 64 years 17 1.4%
Other family: 280 43.0% 65 and 66 years 13 1.1%
Male householder, no wife present
24 3.7% 67 to 69 years 30 2.5%
70 to 74 years 51 4.2%
Female householder, no husband present
256 39.3% 75 to 79 years 32 2.7%
80 to 84 years 34 2.8%
Nonfamily households: 344 52.8% Age 85 and over 19 1.6%
Householder living alone 316 48.5%
Householder not living alone 28 4.3% Under age 18 355 29.5%
Age 65 and over 179 14.9%
Housing Occupancy Status Housing Vacancy Status Total housing units 746 Vacant housing units 95
Occupied 651 87.3% For rent 53 55.8%
Vacant 95 12.7% Rented, not occupied 0 0.0%
For sale only 2 2.1%
Sold, not occupied 4 4.2%
Housing Tenure For seasonal, recreational or occasional use
1 1.1% Total occupied housing units 651
Owned with a mortgage or a loan 23 3.5% For migrant workers 0 0.0%
Owned free and clear 30 4.6%
Renter‐occupied 598 91.9% Other Vacant 35 36.8%

City of Pittsburgh Neighborhood Profiles – Census 2010 Summary File 1 (SF1) Data
University Center for Social and Urban Research – University of Pittsburgh
14
Beechview Population by Race Area (Square Miles) 1.46
Total population 7,974 Density (Persons per Square Mile) 5,447
White alone 6,454 80.9%
Black or African American alone 963 12.1%
American Indian and Alaska Native alone
8 0.1% Population by Age
Total population 7,974
Asian alone 125 1.6% Under 5 years 477 6.0%
Native Hawaiian and Other Pacific Islander alone
1 0.0% 5 to 9 years 433 5.4%
10 to 14 years 383 4.8%
Some other race alone 212 2.7% 15 to 17 years 225 2.8%
Two or more races 211 2.6% 18 and 19 years 166 2.1%
20 years 93 1.2%
21 years 112 1.4%
Population by Hispanic or Latino Origin 22 to 24 years 436 5.5%
Total population 7,974 25 to 29 years 781 9.8%
Not Hispanic or Latino 7,530 94.4% 30 to 34 years 626 7.9%
Hispanic or Latino 444 5.6% 35 to 39 years 483 6.1%
40 to 44 years 464 5.8%
45 to 49 years 542 6.8%
Household Type 50 to 54 years 576 7.2%
Total households 3,516 55 to 59 years 553 6.9%
Family households: 1,944 55.3% 60 and 61 years 171 2.1%
Husband‐wife family 1,153 32.8% 62 to 64 years 247 3.1%
Other family: 791 22.5% 65 and 66 years 102 1.3%
Male householder, no wife present
219 6.2% 67 to 69 years 165 2.1%
70 to 74 years 246 3.1%
Female householder, no husband present
572 16.3% 75 to 79 years 212 2.7%
80 to 84 years 237 3.0%
Nonfamily households: 1,572 44.7% Age 85 and over 244 3.1%
Householder living alone 1,209 34.4%
Householder not living alone 363 10.3% Under age 18 1,518 19.0%
Age 65 and over 1,206 15.1%
Housing Occupancy Status Housing Vacancy Status Total housing units 3,939 Vacant housing units 423
Occupied 3,516 89.3% For rent 142 33.6%
Vacant 423 10.7% Rented, not occupied 15 3.5%
For sale only 66 15.6%
Sold, not occupied 15 3.5%
Housing Tenure For seasonal, recreational or occasional use
2 0.5% Total occupied housing units 3,516
Owned with a mortgage or a loan 1,406 40.0% For migrant workers 0 0.0%
Owned free and clear 717 20.4%
Renter‐occupied 1,393 39.6% Other Vacant 183 43.3%

City of Pittsburgh Neighborhood Profiles – Census 2010 Summary File 1 (SF1) Data
University Center for Social and Urban Research – University of Pittsburgh
15
Beltzhoover Population by Race Area (Square Miles) 0.41
Total population 1,925 Density (Persons per Square Mile) 4,659
White alone 191 9.9%
Black or African American alone 1,604 83.3%
American Indian and Alaska Native alone
11 0.6% Population by Age
Total population 1,925
Asian alone 3 0.2% Under 5 years 134 7.0%
Native Hawaiian and Other Pacific Islander alone
2 0.1% 5 to 9 years 153 7.9%
10 to 14 years 142 7.4%
Some other race alone 23 1.2% 15 to 17 years 107 5.6%
Two or more races 91 4.7% 18 and 19 years 61 3.2%
20 years 24 1.2%
21 years 25 1.3%
Population by Hispanic or Latino Origin 22 to 24 years 68 3.5%
Total population 1,925 25 to 29 years 118 6.1%
Not Hispanic or Latino 1,886 98.0% 30 to 34 years 80 4.2%
Hispanic or Latino 39 2.0% 35 to 39 years 102 5.3%
40 to 44 years 102 5.3%
45 to 49 years 134 7.0%
Household Type 50 to 54 years 144 7.5%
Total households 797 55 to 59 years 122 6.3%
Family households: 481 60.4% 60 and 61 years 45 2.3%
Husband‐wife family 188 23.6% 62 to 64 years 35 1.8%
Other family: 293 36.8% 65 and 66 years 23 1.2%
Male householder, no wife present
45 5.6% 67 to 69 years 46 2.4%
70 to 74 years 80 4.2%
Female householder, no husband present
248 31.1% 75 to 79 years 81 4.2%
80 to 84 years 61 3.2%
Nonfamily households: 316 39.6% Age 85 and over 38 2.0%
Householder living alone 285 35.8%
Householder not living alone 31 3.9% Under age 18 536 27.8%
Age 65 and over 329 17.1%
Housing Occupancy Status Housing Vacancy Status Total housing units 1,085 Vacant housing units 288
Occupied 797 73.5% For rent 33 11.5%
Vacant 288 26.5% Rented, not occupied 0 0.0%
For sale only 20 6.9%
Sold, not occupied 10 3.5%
Housing Tenure For seasonal, recreational or occasional use
3 1.0% Total occupied housing units 797
Owned with a mortgage or a loan 224 28.1% For migrant workers 0 0.0%
Owned free and clear 247 31.0%
Renter‐occupied 326 40.9% Other Vacant 222 77.1%

City of Pittsburgh Neighborhood Profiles – Census 2010 Summary File 1 (SF1) Data
University Center for Social and Urban Research – University of Pittsburgh
16
Bloomfield Population by Race Area (Square Miles) 0.70
Total population 8,442 Density (Persons per Square Mile) 12,042
White alone 6,886 81.6%
Black or African American alone 739 8.8%
American Indian and Alaska Native alone
11 0.1% Population by Age
Total population 8,442
Asian alone 542 6.4% Under 5 years 278 3.3%
Native Hawaiian and Other Pacific Islander alone
3 0.0% 5 to 9 years 193 2.3%
10 to 14 years 196 2.3%
Some other race alone 74 0.9% 15 to 17 years 139 1.6%
Two or more races 187 2.2% 18 and 19 years 127 1.5%
20 years 124 1.5%
21 years 201 2.4%
Population by Hispanic or Latino Origin 22 to 24 years 1,026 12.2%
Total population 8,442 25 to 29 years 1,502 17.8%
Not Hispanic or Latino 8,223 97.4% 30 to 34 years 809 9.6%
Hispanic or Latino 219 2.6% 35 to 39 years 500 5.9%
40 to 44 years 419 5.0%
45 to 49 years 438 5.2%
Household Type 50 to 54 years 515 6.1%
Total households 4,572 55 to 59 years 499 5.9%
Family households: 1,477 32.3% 60 and 61 years 214 2.5%
Husband‐wife family 947 20.7% 62 to 64 years 220 2.6%
Other family: 530 11.6% 65 and 66 years 133 1.6%
Male householder, no wife present
133 2.9% 67 to 69 years 137 1.6%
70 to 74 years 202 2.4%
Female householder, no husband present
397 8.7% 75 to 79 years 215 2.5%
80 to 84 years 208 2.5%
Nonfamily households: 3,095 67.7% Age 85 and over 147 1.7%
Householder living alone 2,203 48.2%
Householder not living alone 892 19.5% Under age 18 806 9.5%
Age 65 and over 1,042 12.3%
Housing Occupancy Status Housing Vacancy Status Total housing units 5,136 Vacant housing units 564
Occupied 4,572 89.0% For rent 214 37.9%
Vacant 564 11.0% Rented, not occupied 45 8.0%
For sale only 34 6.0%
Sold, not occupied 36 6.4%
Housing Tenure For seasonal, recreational or occasional use
30 5.3% Total occupied housing units 4,572
Owned with a mortgage or a loan 938 20.5% For migrant workers 0 0.0%
Owned free and clear 608 13.3%
Renter‐occupied 3,026 66.2% Other Vacant 205 36.3%

City of Pittsburgh Neighborhood Profiles – Census 2010 Summary File 1 (SF1) Data
University Center for Social and Urban Research – University of Pittsburgh
17
Bluff Population by Race Area (Square Miles) 0.33
Total population 6,600 Density (Persons per Square Mile) 19,847
White alone 4,345 65.8%
Black or African American alone 2,057 31.2%
American Indian and Alaska Native alone
13 0.2% Population by Age
Total population 6,600
Asian alone 73 1.1% Under 5 years 42 0.6%
Native Hawaiian and Other Pacific Islander alone
2 0.0% 5 to 9 years 29 0.4%
10 to 14 years 17 0.3%
Some other race alone 23 0.3% 15 to 17 years 39 0.6%
Two or more races 87 1.3% 18 and 19 years 1,806 27.4%
20 years 1,019 15.4%
21 years 560 8.5%
Population by Hispanic or Latino Origin 22 to 24 years 745 11.3%
Total population 6,600 25 to 29 years 581 8.8%
Not Hispanic or Latino 6,439 97.6% 30 to 34 years 380 5.8%
Hispanic or Latino 161 2.4% 35 to 39 years 317 4.8%
40 to 44 years 305 4.6%
45 to 49 years 294 4.5%
Household Type 50 to 54 years 191 2.9%
Total households 282 55 to 59 years 115 1.7%
Family households: 91 32.3% 60 and 61 years 26 0.4%
Husband‐wife family 28 9.9% 62 to 64 years 26 0.4%
Other family: 63 22.3% 65 and 66 years 13 0.2%
Male householder, no wife present
18 6.4% 67 to 69 years 21 0.3%
70 to 74 years 28 0.4%
Female householder, no husband present
45 16.0% 75 to 79 years 10 0.2%
80 to 84 years 18 0.3%
Nonfamily households: 191 67.7% Age 85 and over 18 0.3%
Householder living alone 130 46.1%
Householder not living alone 61 21.6% Under age 18 127 1.9%
Age 65 and over 108 1.6%
Housing Occupancy Status Housing Vacancy Status Total housing units 388 Vacant housing units 106
Occupied 282 72.7% For rent 51 48.1%
Vacant 106 27.3% Rented, not occupied 0 0.0%
For sale only 2 1.9%
Sold, not occupied 1 0.9%
Housing Tenure For seasonal, recreational or occasional use
0 0.0% Total occupied housing units 282
Owned with a mortgage or a loan 32 11.3% For migrant workers 0 0.0%
Owned free and clear 65 23.0%
Renter‐occupied 185 65.6% Other Vacant 52 49.1%
City of Pittsburgh Neighborhood Profiles – Census 2010 Summary File 1 (SF1) Data
University Center for Social and Urban Research – University of Pittsburgh
18
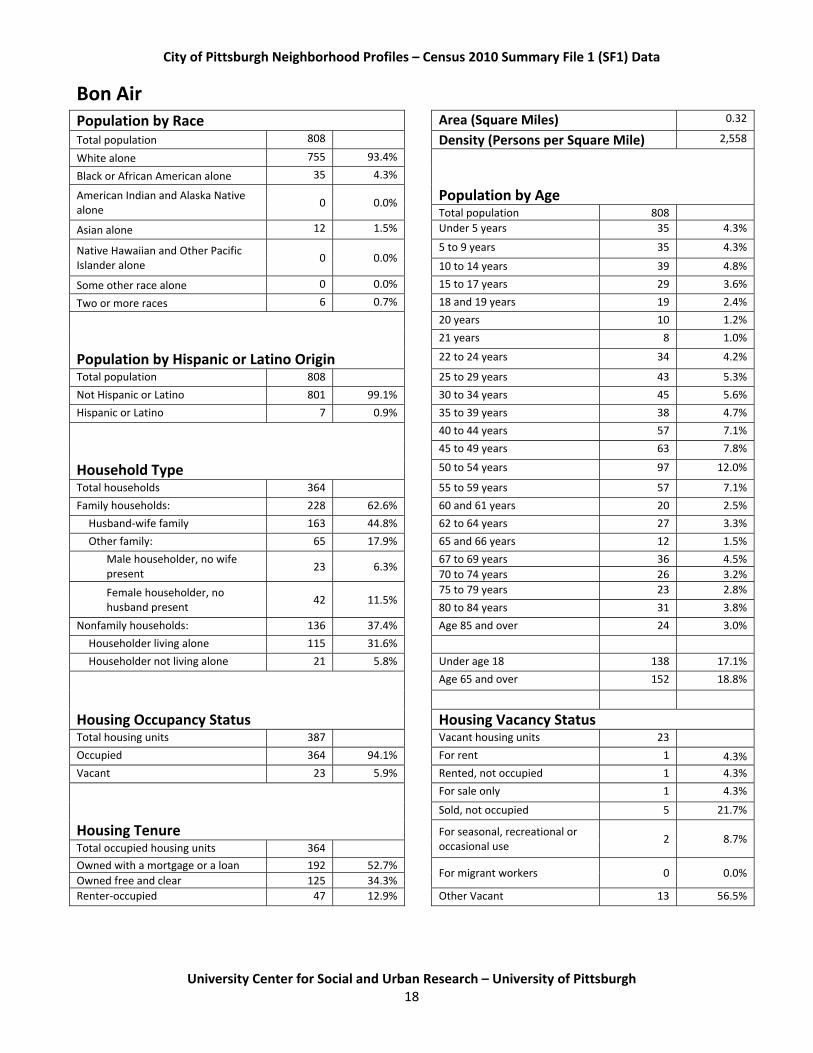
Bon Air Population by Race Area (Square Miles) 0.32
Total population 808 Density (Persons per Square Mile) 2,558
White alone 755 93.4%
Black or African American alone 35 4.3%
American Indian and Alaska Native alone
0 0.0% Population by Age
Total population 808
Asian alone 12 1.5% Under 5 years 35 4.3%
Native Hawaiian and Other Pacific Islander alone
0 0.0% 5 to 9 years 35 4.3%
10 to 14 years 39 4.8%
Some other race alone 0 0.0% 15 to 17 years 29 3.6%
Two or more races 6 0.7% 18 and 19 years 19 2.4%
20 years 10 1.2%
21 years 8 1.0%
Population by Hispanic or Latino Origin 22 to 24 years 34 4.2%
Total population 808 25 to 29 years 43 5.3%
Not Hispanic or Latino 801 99.1% 30 to 34 years 45 5.6%
Hispanic or Latino 7 0.9% 35 to 39 years 38 4.7%
40 to 44 years 57 7.1%
45 to 49 years 63 7.8%
Household Type 50 to 54 years 97 12.0%
Total households 364 55 to 59 years 57 7.1%
Family households: 228 62.6% 60 and 61 years 20 2.5%
Husband‐wife family 163 44.8% 62 to 64 years 27 3.3%
Other family: 65 17.9% 65 and 66 years 12 1.5%
Male householder, no wife present
23 6.3% 67 to 69 years 36 4.5%
70 to 74 years 26 3.2%
Female householder, no husband present
42 11.5% 75 to 79 years 23 2.8%
80 to 84 years 31 3.8%
Nonfamily households: 136 37.4% Age 85 and over 24 3.0%
Householder living alone 115 31.6%
Householder not living alone 21 5.8% Under age 18 138 17.1%
Age 65 and over 152 18.8%
Housing Occupancy Status Housing Vacancy Status Total housing units 387 Vacant housing units 23
Occupied 364 94.1% For rent 1 4.3%
Vacant 23 5.9% Rented, not occupied 1 4.3%
For sale only 1 4.3%
Sold, not occupied 5 21.7%
Housing Tenure For seasonal, recreational or occasional use
2 8.7% Total occupied housing units 364
Owned with a mortgage or a loan 192 52.7% For migrant workers 0 0.0%
Owned free and clear 125 34.3%
Renter‐occupied 47 12.9% Other Vacant 13 56.5%

City of Pittsburgh Neighborhood Profiles – Census 2010 Summary File 1 (SF1) Data
University Center for Social and Urban Research – University of Pittsburgh
19
Brighton Heights Population by Race Area (Square Miles) 1.13
Total population 7,247 Density (Persons per Square Mile) 6,438
White alone 5,354 73.9%
Black or African American alone 1,583 21.8%
American Indian and Alaska Native alone
5 0.1% Population by Age
Total population 7,247
Asian alone 47 0.6% Under 5 years 429 5.9%
Native Hawaiian and Other Pacific Islander alone
1 0.0% 5 to 9 years 374 5.2%
10 to 14 years 424 5.9%
Some other race alone 32 0.4% 15 to 17 years 257 3.5%
Two or more races 225 3.1% 18 and 19 years 155 2.1%
20 years 62 0.9%
21 years 81 1.1%
Population by Hispanic or Latino Origin 22 to 24 years 248 3.4%
Total population 7,247 25 to 29 years 519 7.2%
Not Hispanic or Latino 7,132 98.4% 30 to 34 years 484 6.7%
Hispanic or Latino 115 1.6% 35 to 39 years 442 6.1%
40 to 44 years 471 6.5%
45 to 49 years 519 7.2%
Household Type 50 to 54 years 585 8.1%
Total households 3,259 55 to 59 years 586 8.1%
Family households: 1,770 54.3% 60 and 61 years 170 2.3%
Husband‐wife family 1,076 33.0% 62 to 64 years 244 3.4%
Other family: 694 21.3% 65 and 66 years 122 1.7%
Male householder, no wife present
153 4.7% 67 to 69 years 178 2.5%
70 to 74 years 264 3.6%
Female householder, no husband present
541 16.6% 75 to 79 years 188 2.6%
80 to 84 years 218 3.0%
Nonfamily households: 1,489 45.7% Age 85 and over 227 3.1%
Householder living alone 1,241 38.1%
Householder not living alone 248 7.6% Under age 18 1,484 20.5%
Age 65 and over 1,197 16.5%
Housing Occupancy Status Housing Vacancy Status Total housing units 3,615 Vacant housing units 356
Occupied 3,259 90.2% For rent 124 34.8%
Vacant 356 9.8% Rented, not occupied 11 3.1%
For sale only 71 19.9%
Sold, not occupied 11 3.1%
Housing Tenure For seasonal, recreational or occasional use
6 1.7% Total occupied housing units 3,259
Owned with a mortgage or a loan 1,445 44.3% For migrant workers 0 0.0%
Owned free and clear 679 20.8%
Renter‐occupied 1,135 34.8% Other Vacant 133 37.4%

City of Pittsburgh Neighborhood Profiles – Census 2010 Summary File 1 (SF1) Data
University Center for Social and Urban Research – University of Pittsburgh
20
Brookline Population by Race Area (Square Miles) 2.09
Total population 13,214 Density (Persons per Square Mile) 6,337
White alone 12,081 91.4%
Black or African American alone 608 4.6%
American Indian and Alaska Native alone
16 0.1% Population by Age
Total population 13,214
Asian alone 152 1.2% Under 5 years 762 5.8%
Native Hawaiian and Other Pacific Islander alone
0 0.0% 5 to 9 years 689 5.2%
10 to 14 years 663 5.0%
Some other race alone 79 0.6% 15 to 17 years 434 3.3%
Two or more races 278 2.1% 18 and 19 years 257 1.9%
20 years 105 0.8%
21 years 136 1.0%
Population by Hispanic or Latino Origin 22 to 24 years 541 4.1%
Total population 13,214 25 to 29 years 1,118 8.5%
Not Hispanic or Latino 13,003 98.4% 30 to 34 years 1,054 8.0%
Hispanic or Latino 211 1.6% 35 to 39 years 875 6.6%
40 to 44 years 886 6.7%
45 to 49 years 937 7.1%
Household Type 50 to 54 years 1,011 7.7%
Total households 5,951 55 to 59 years 924 7.0%
Family households: 3,427 57.6% 60 and 61 years 338 2.6%
Husband‐wife family 2,324 39.1% 62 to 64 years 467 3.5%
Other family: 1,103 18.5% 65 and 66 years 212 1.6%
Male householder, no wife present
285 4.8% 67 to 69 years 286 2.2%
70 to 74 years 421 3.2%
Female householder, no husband present
818 13.7% 75 to 79 years 374 2.8%
80 to 84 years 374 2.8%
Nonfamily households: 2,524 42.4% Age 85 and over 350 2.6%
Householder living alone 2,063 34.7%
Householder not living alone 461 7.7% Under age 18 2,548 19.3%
Age 65 and over 2,017 15.3%
Housing Occupancy Status Housing Vacancy Status Total housing units 6,364 Vacant housing units 413
Occupied 5,951 93.5% For rent 97 23.5%
Vacant 413 6.5% Rented, not occupied 3 0.7%
For sale only 91 22.0%
Sold, not occupied 27 6.5%
Housing Tenure For seasonal, recreational or occasional use
11 2.7% Total occupied housing units 5,951
Owned with a mortgage or a loan 2,910 48.9% For migrant workers 0 0.0%
Owned free and clear 1,493 25.1%
Renter‐occupied 1,548 26.0% Other Vacant 184 44.6%

City of Pittsburgh Neighborhood Profiles – Census 2010 Summary File 1 (SF1) Data
University Center for Social and Urban Research – University of Pittsburgh
21
California‐Kirkbride Population by Race Area (Square Miles) 0.22
Total population 761 Density (Persons per Square Mile) 3,518
White alone 143 18.8%
Black or African American alone 578 76.0%
American Indian and Alaska Native alone
0 0.0% Population by Age
Total population 761
Asian alone 0 0.0% Under 5 years 87 11.4%
Native Hawaiian and Other Pacific Islander alone
1 0.1% 5 to 9 years 61 8.0%
10 to 14 years 51 6.7%
Some other race alone 6 0.8% 15 to 17 years 40 5.3%
Two or more races 33 4.3% 18 and 19 years 29 3.8%
20 years 13 1.7%
21 years 18 2.4%
Population by Hispanic or Latino Origin 22 to 24 years 61 8.0%
Total population 761 25 to 29 years 39 5.1%
Not Hispanic or Latino 756 99.3% 30 to 34 years 42 5.5%
Hispanic or Latino 5 0.7% 35 to 39 years 31 4.1%
40 to 44 years 41 5.4%
45 to 49 years 57 7.5%
Household Type 50 to 54 years 50 6.6%
Total households 312 55 to 59 years 42 5.5%
Family households: 175 56.1% 60 and 61 years 11 1.4%
Husband‐wife family 36 11.5% 62 to 64 years 15 2.0%
Other family: 139 44.6% 65 and 66 years 11 1.4%
Male householder, no wife present
9 2.9% 67 to 69 years 18 2.4%
70 to 74 years 21 2.8%
Female householder, no husband present
130 41.7% 75 to 79 years 10 1.3%
80 to 84 years 9 1.2%
Nonfamily households: 137 43.9% Age 85 and over 4 0.5%
Householder living alone 116 37.2%
Householder not living alone 21 6.7% Under age 18 239 31.4%
Age 65 and over 73 9.6%
Housing Occupancy Status Housing Vacancy Status Total housing units 393 Vacant housing units 81
Occupied 312 79.4% For rent 11 13.6%
Vacant 81 20.6% Rented, not occupied 3 3.7%
For sale only 2 2.5%
Sold, not occupied 0 0.0%
Housing Tenure For seasonal, recreational or occasional use
0 0.0% Total occupied housing units 312
Owned with a mortgage or a loan 59 18.9% For migrant workers 0 0.0%
Owned free and clear 43 13.8%
Renter‐occupied 210 67.3% Other Vacant 65 80.2%

City of Pittsburgh Neighborhood Profiles – Census 2010 Summary File 1 (SF1) Data
University Center for Social and Urban Research – University of Pittsburgh
22
Carrick Population by Race Area (Square Miles) 1.67
Total population 10,113 Density (Persons per Square Mile) 6,048
White alone 8,696 86.0%
Black or African American alone 972 9.6%
American Indian and Alaska Native alone
15 0.1% Population by Age
Total population 10,113
Asian alone 113 1.1% Under 5 years 559 5.5%
Native Hawaiian and Other Pacific Islander alone
1 0.0% 5 to 9 years 589 5.8%
10 to 14 years 553 5.5%
Some other race alone 46 0.5% 15 to 17 years 363 3.6%
Two or more races 270 2.7% 18 and 19 years 226 2.2%
20 years 133 1.3%
21 years 143 1.4%
Population by Hispanic or Latino Origin 22 to 24 years 418 4.1%
Total population 10,113 25 to 29 years 772 7.6%
Not Hispanic or Latino 9,947 98.4% 30 to 34 years 670 6.6%
Hispanic or Latino 166 1.6% 35 to 39 years 566 5.6%
40 to 44 years 625 6.2%
45 to 49 years 737 7.3%
Household Type 50 to 54 years 909 9.0%
Total households 4,444 55 to 59 years 770 7.6%
Family households: 2,551 57.4% 60 and 61 years 265 2.6%
Husband‐wife family 1,518 34.2% 62 to 64 years 294 2.9%
Other family: 1,033 23.2% 65 and 66 years 158 1.6%
Male householder, no wife present
237 5.3% 67 to 69 years 217 2.1%
70 to 74 years 308 3.0%
Female householder, no husband present
796 17.9% 75 to 79 years 264 2.6%
80 to 84 years 309 3.1%
Nonfamily households: 1,893 42.6% Age 85 and over 265 2.6%
Householder living alone 1,548 34.8%
Householder not living alone 345 7.8% Under age 18 2,064 20.4%
Age 65 and over 1,521 15.0%
Housing Occupancy Status Housing Vacancy Status Total housing units 5,041 Vacant housing units 597
Occupied 4,444 88.2% For rent 205 34.3%
Vacant 597 11.8% Rented, not occupied 27 4.5%
For sale only 98 16.4%
Sold, not occupied 15 2.5%
Housing Tenure For seasonal, recreational or occasional use
7 1.2% Total occupied housing units 4,444
Owned with a mortgage or a loan 1,728 38.9% For migrant workers 0 0.0%
Owned free and clear 1,050 23.6%
Renter‐occupied 1,666 37.5% Other Vacant 245 41.0%

City of Pittsburgh Neighborhood Profiles – Census 2010 Summary File 1 (SF1) Data
University Center for Social and Urban Research – University of Pittsburgh
23
Central Business District Population by Race Area (Square Miles) 0.65
Total population 3,629 Density (Persons per Square Mile) 5,597
White alone 2,706 74.6%
Black or African American alone 580 16.0%
American Indian and Alaska Native alone
8 0.2% Population by Age
Total population 3,629
Asian alone 171 4.7% Under 5 years 31 0.9%
Native Hawaiian and Other Pacific Islander alone
2 0.1% 5 to 9 years 13 0.4%
10 to 14 years 9 0.2%
Some other race alone 61 1.7% 15 to 17 years 15 0.4%
Two or more races 101 2.8% 18 and 19 years 545 15.0%
20 years 333 9.2%
21 years 245 6.8%
Population by Hispanic or Latino Origin 22 to 24 years 384 10.6%
Total population 3,629 25 to 29 years 367 10.1%
Not Hispanic or Latino 3,510 96.7% 30 to 34 years 202 5.6%
Hispanic or Latino 119 3.3% 35 to 39 years 155 4.3%
40 to 44 years 133 3.7%
45 to 49 years 156 4.3%
Household Type 50 to 54 years 208 5.7%
Total households 1,906 55 to 59 years 229 6.3%
Family households: 283 14.8% 60 and 61 years 79 2.2%
Husband‐wife family 218 11.4% 62 to 64 years 91 2.5%
Other family: 65 3.4% 65 and 66 years 50 1.4%
Male householder, no wife present
22 1.2% 67 to 69 years 72 2.0%
70 to 74 years 112 3.1%
Female householder, no husband present
43 2.3% 75 to 79 years 82 2.3%
80 to 84 years 71 2.0%
Nonfamily households: 1,623 85.2% Age 85 and over 47 1.3%
Householder living alone 1,399 73.4%
Householder not living alone 224 11.8% Under age 18 68 1.9%
Age 65 and over 434 12.0%
Housing Occupancy Status Housing Vacancy Status Total housing units 2,342 Vacant housing units 436
Occupied 1,906 81.4% For rent 202 46.3%
Vacant 436 18.6% Rented, not occupied 22 5.0%
For sale only 53 12.2%
Sold, not occupied 12 2.8%
Housing Tenure For seasonal, recreational or occasional use
136 31.2% Total occupied housing units 1,906
Owned with a mortgage or a loan 206 10.8% For migrant workers 0 0.0%
Owned free and clear 125 6.6%
Renter‐occupied 1,575 82.6% Other Vacant 11 2.5%

City of Pittsburgh Neighborhood Profiles – Census 2010 Summary File 1 (SF1) Data
University Center for Social and Urban Research – University of Pittsburgh
24
Central Lawrenceville Population by Race Area (Square Miles) 0.96
Total population 4,482 Density (Persons per Square Mile) 4,660
White alone 3,862 86.2%
Black or African American alone 422 9.4%
American Indian and Alaska Native alone
3 0.1% Population by Age
Total population 4,482
Asian alone 78 1.7% Under 5 years 193 4.3%
Native Hawaiian and Other Pacific Islander alone
0 0.0% 5 to 9 years 152 3.4%
10 to 14 years 127 2.8%
Some other race alone 31 0.7% 15 to 17 years 98 2.2%
Two or more races 86 1.9% 18 and 19 years 68 1.5%
20 years 42 0.9%
21 years 46 1.0%
Population by Hispanic or Latino Origin 22 to 24 years 283 6.3%
Total population 4,482 25 to 29 years 516 11.5%
Not Hispanic or Latino 4,404 98.3% 30 to 34 years 397 8.9%
Hispanic or Latino 78 1.7% 35 to 39 years 251 5.6%
40 to 44 years 248 5.5%
45 to 49 years 260 5.8%
Household Type 50 to 54 years 341 7.6%
Total households 2,293 55 to 59 years 267 6.0%
Family households: 927 40.4% 60 and 61 years 99 2.2%
Husband‐wife family 546 23.8% 62 to 64 years 139 3.1%
Other family: 381 16.6% 65 and 66 years 79 1.8%
Male householder, no wife present
79 3.4% 67 to 69 years 122 2.7%
70 to 74 years 198 4.4%
Female householder, no husband present
302 13.2% 75 to 79 years 164 3.7%
80 to 84 years 166 3.7%
Nonfamily households: 1,366 59.6% Age 85 and over 226 5.0%
Householder living alone 1,048 45.7%
Householder not living alone 318 13.9% Under age 18 570 12.7%
Age 65 and over 955 21.3%
Housing Occupancy Status Housing Vacancy Status Total housing units 2,670 Vacant housing units 377
Occupied 2,293 85.9% For rent 111 29.4%
Vacant 377 14.1% Rented, not occupied 5 1.3%
For sale only 32 8.5%
Sold, not occupied 75 19.9%
Housing Tenure For seasonal, recreational or occasional use
31 8.2% Total occupied housing units 2,293
Owned with a mortgage or a loan 617 26.9% For migrant workers 0 0.0%
Owned free and clear 451 19.7%
Renter‐occupied 1,225 53.4% Other Vacant 123 32.6%

City of Pittsburgh Neighborhood Profiles – Census 2010 Summary File 1 (SF1) Data
University Center for Social and Urban Research – University of Pittsburgh
25
Central Northside Population by Race Area (Square Miles) 0.26
Total population 2,923 Density (Persons per Square Mile) 11,255
White alone 1,439 49.2%
Black or African American alone 1,347 46.1%
American Indian and Alaska Native alone
5 0.2% Population by Age
Total population 2,923
Asian alone 23 0.8% Under 5 years 148 5.1%
Native Hawaiian and Other Pacific Islander alone
0 0.0% 5 to 9 years 106 3.6%
10 to 14 years 115 3.9%
Some other race alone 23 0.8% 15 to 17 years 55 1.9%
Two or more races 86 2.9% 18 and 19 years 64 2.2%
20 years 23 0.8%
21 years 45 1.5%
Population by Hispanic or Latino Origin 22 to 24 years 160 5.5%
Total population 2,923 25 to 29 years 313 10.7%
Not Hispanic or Latino 2,843 97.3% 30 to 34 years 273 9.3%
Hispanic or Latino 80 2.7% 35 to 39 years 184 6.3%
40 to 44 years 187 6.4%
45 to 49 years 231 7.9%
Household Type 50 to 54 years 260 8.9%
Total households 1,587 55 to 59 years 209 7.2%
Family households: 532 33.5% 60 and 61 years 75 2.6%
Husband‐wife family 255 16.1% 62 to 64 years 98 3.4%
Other family: 277 17.5% 65 and 66 years 57 2.0%
Male householder, no wife present
47 3.0% 67 to 69 years 57 2.0%
70 to 74 years 86 2.9%
Female householder, no husband present
230 14.5% 75 to 79 years 67 2.3%
80 to 84 years 61 2.1%
Nonfamily households: 1,055 66.5% Age 85 and over 49 1.7%
Householder living alone 857 54.0%
Householder not living alone 198 12.5% Under age 18 424 14.5%
Age 65 and over 377 12.9%
Housing Occupancy Status Housing Vacancy Status Total housing units 1,971 Vacant housing units 384
Occupied 1,587 80.5% For rent 90 23.4%
Vacant 384 19.5% Rented, not occupied 8 2.1%
For sale only 27 7.0%
Sold, not occupied 57 14.8%
Housing Tenure For seasonal, recreational or occasional use
9 2.3% Total occupied housing units 1,587
Owned with a mortgage or a loan 400 25.2% For migrant workers 0 0.0%
Owned free and clear 163 10.3%
Renter‐occupied 1,024 64.5% Other Vacant 193 50.3%

City of Pittsburgh Neighborhood Profiles – Census 2010 Summary File 1 (SF1) Data
University Center for Social and Urban Research – University of Pittsburgh
26
Central Oakland Population by Race Area (Square Miles) 0.28
Total population 6,086 Density (Persons per Square Mile) 21,742
White alone 5,054 83.0%
Black or African American alone 321 5.3%
American Indian and Alaska Native alone
15 0.2% Population by Age
Total population 6,086
Asian alone 518 8.5% Under 5 years 35 0.6%
Native Hawaiian and Other Pacific Islander alone
1 0.0% 5 to 9 years 19 0.3%
10 to 14 years 23 0.4%
Some other race alone 61 1.0% 15 to 17 years 14 0.2%
Two or more races 116 1.9% 18 and 19 years 447 7.3%
20 years 1,210 19.9%
21 years 1,759 28.9%
Population by Hispanic or Latino Origin 22 to 24 years 1,590 26.1%
Total population 6,086 25 to 29 years 249 4.1%
Not Hispanic or Latino 5,929 97.4% 30 to 34 years 126 2.1%
Hispanic or Latino 157 2.6% 35 to 39 years 88 1.4%
40 to 44 years 66 1.1%
45 to 49 years 48 0.8%
Household Type 50 to 54 years 62 1.0%
Total households 2,384 55 to 59 years 75 1.2%
Family households: 275 11.5% 60 and 61 years 24 0.4%
Husband‐wife family 152 6.4% 62 to 64 years 22 0.4%
Other family: 123 5.2% 65 and 66 years 18 0.3%
Male householder, no wife present
47 2.0% 67 to 69 years 26 0.4%
70 to 74 years 51 0.8%
Female householder, no husband present
76 3.2% 75 to 79 years 47 0.8%
80 to 84 years 49 0.8%
Nonfamily households: 2,109 88.5% Age 85 and over 38 0.6%
Householder living alone 784 32.9%
Householder not living alone 1,325 55.6% Under age 18 91 1.5%
Age 65 and over 229 3.8%
Housing Occupancy Status Housing Vacancy Status Total housing units 2,531 Vacant housing units 147
Occupied 2,384 94.2% For rent 60 40.8%
Vacant 147 5.8% Rented, not occupied 16 10.9%
For sale only 6 4.1%
Sold, not occupied 3 2.0%
Housing Tenure For seasonal, recreational or occasional use
9 6.1% Total occupied housing units 2,384
Owned with a mortgage or a loan 67 2.8% For migrant workers 0 0.0%
Owned free and clear 133 5.6%
Renter‐occupied 2,184 91.6% Other Vacant 53 36.1%

City of Pittsburgh Neighborhood Profiles – Census 2010 Summary File 1 (SF1) Data
University Center for Social and Urban Research – University of Pittsburgh
27
Chartiers City Population by Race Area (Square Miles) 0.13
Total population 477 Density (Persons per Square Mile) 3,604
White alone 142 29.8%
Black or African American alone 325 68.1%
American Indian and Alaska Native alone
3 0.6% Population by Age
Total population 477
Asian alone 0 0.0% Under 5 years 15 3.1%
Native Hawaiian and Other Pacific Islander alone
0 0.0% 5 to 9 years 16 3.4%
10 to 14 years 24 5.0%
Some other race alone 0 0.0% 15 to 17 years 17 3.6%
Two or more races 7 1.5% 18 and 19 years 14 2.9%
20 years 5 1.0%
21 years 8 1.7%
Population by Hispanic or Latino Origin 22 to 24 years 15 3.1%
Total population 477 25 to 29 years 12 2.5%
Not Hispanic or Latino 475 99.6% 30 to 34 years 15 3.1%
Hispanic or Latino 2 0.4% 35 to 39 years 24 5.0%
40 to 44 years 27 5.7%
45 to 49 years 41 8.6%
Household Type 50 to 54 years 43 9.0%
Total households 213 55 to 59 years 35 7.3%
Family households: 136 63.8% 60 and 61 years 12 2.5%
Husband‐wife family 65 30.5% 62 to 64 years 18 3.8%
Other family: 71 33.3% 65 and 66 years 7 1.5%
Male householder, no wife present
18 8.5% 67 to 69 years 23 4.8%
70 to 74 years 36 7.5%
Female householder, no husband present
53 24.9% 75 to 79 years 31 6.5%
80 to 84 years 14 2.9%
Nonfamily households: 77 36.2% Age 85 and over 25 5.2%
Householder living alone 70 32.9%
Householder not living alone 7 3.3% Under age 18 72 15.1%
Age 65 and over 136 28.5%
Housing Occupancy Status Housing Vacancy Status Total housing units 236 Vacant housing units 23
Occupied 213 90.3% For rent 6 26.1%
Vacant 23 9.7% Rented, not occupied 2 8.7%
For sale only 1 4.3%
Sold, not occupied 9 39.1%
Housing Tenure For seasonal, recreational or occasional use
2 8.7% Total occupied housing units 213
Owned with a mortgage or a loan 105 49.3% For migrant workers 0 0.0%
Owned free and clear 71 33.3%
Renter‐occupied 37 17.4% Other Vacant 3 13.0%

City of Pittsburgh Neighborhood Profiles – Census 2010 Summary File 1 (SF1) Data
University Center for Social and Urban Research – University of Pittsburgh
28
Chateau Population by Race Area (Square Miles) 0.38
Total population 11 Density (Persons per Square Mile) 29
White alone 8 72.7%
Black or African American alone 3 27.3%
American Indian and Alaska Native alone
0 0.0% Population by Age
Total population 11
Asian alone 0 0.0% Under 5 years 0 0.0%
Native Hawaiian and Other Pacific Islander alone
0 0.0% 5 to 9 years 0 0.0%
10 to 14 years 0 0.0%
Some other race alone 0 0.0% 15 to 17 years 0 0.0%
Two or more races 0 0.0% 18 and 19 years 0 0.0%
20 years 0 0.0%
21 years 0 0.0%
Population by Hispanic or Latino Origin 22 to 24 years 0 0.0%
Total population 11 25 to 29 years 0 0.0%
Not Hispanic or Latino 11 100.0% 30 to 34 years 0 0.0%
Hispanic or Latino 0 0.0% 35 to 39 years 1 9.1%
40 to 44 years 1 9.1%
45 to 49 years 0 0.0%
Household Type 50 to 54 years 0 0.0%
Total households 4 55 to 59 years 3 27.3%
Family households: 2 50.0% 60 and 61 years 1 9.1%
Husband‐wife family 1 25.0% 62 to 64 years 3 27.3%
Other family: 1 25.0% 65 and 66 years 1 9.1%
Male householder, no wife present
0 0.0% 67 to 69 years 0 0.0%
70 to 74 years 0 0.0%
Female householder, no husband present
1 25.0% 75 to 79 years 0 0.0%
80 to 84 years 1 9.1%
Nonfamily households: 2 50.0% Age 85 and over 0 0.0%
Householder living alone 1 25.0%
Householder not living alone 1 25.0% Under age 18 0 0.0%
Age 65 and over 2 18.2%
Housing Occupancy Status Housing Vacancy Status Total housing units 4 Vacant housing units 0
Occupied 4 100.0% For rent 0
Vacant 0 0.0% Rented, not occupied 0
For sale only 0
Sold, not occupied 0
Housing Tenure For seasonal, recreational or occasional use
0 Total occupied housing units 4
Owned with a mortgage or a loan 0 0.0% For migrant workers 0
Owned free and clear 2 50.0%
Renter‐occupied 2 50.0% Other Vacant 0

City of Pittsburgh Neighborhood Profiles – Census 2010 Summary File 1 (SF1) Data
University Center for Social and Urban Research – University of Pittsburgh
29
Crafton Heights Population by Race Area (Square Miles) 0.75
Total population 3,814 Density (Persons per Square Mile) 5,076
White alone 2,528 66.3%
Black or African American alone 1,093 28.7%
American Indian and Alaska Native alone
12 0.3% Population by Age
Total population 3,814
Asian alone 28 0.7% Under 5 years 337 8.8%
Native Hawaiian and Other Pacific Islander alone
0 0.0% 5 to 9 years 260 6.8%
10 to 14 years 241 6.3%
Some other race alone 17 0.4% 15 to 17 years 147 3.9%
Two or more races 136 3.6% 18 and 19 years 83 2.2%
20 years 36 0.9%
21 years 55 1.4%
Population by Hispanic or Latino Origin 22 to 24 years 166 4.4%
Total population 3,814 25 to 29 years 312 8.2%
Not Hispanic or Latino 3,756 98.5% 30 to 34 years 240 6.3%
Hispanic or Latino 58 1.5% 35 to 39 years 210 5.5%
40 to 44 years 225 5.9%
45 to 49 years 239 6.3%
Household Type 50 to 54 years 284 7.4%
Total households 1,625 55 to 59 years 258 6.8%
Family households: 985 60.6% 60 and 61 years 82 2.1%
Husband‐wife family 566 34.8% 62 to 64 years 106 2.8%
Other family: 419 25.8% 65 and 66 years 52 1.4%
Male householder, no wife present
74 4.6% 67 to 69 years 82 2.1%
70 to 74 years 115 3.0%
Female householder, no husband present
345 21.2% 75 to 79 years 105 2.8%
80 to 84 years 105 2.8%
Nonfamily households: 640 39.4% Age 85 and over 74 1.9%
Householder living alone 519 31.9%
Householder not living alone 121 7.4% Under age 18 985 25.8%
Age 65 and over 533 14.0%
Housing Occupancy Status Housing Vacancy Status Total housing units 1,836 Vacant housing units 211
Occupied 1,625 88.5% For rent 80 37.9%
Vacant 211 11.5% Rented, not occupied 4 1.9%
For sale only 25 11.8%
Sold, not occupied 13 6.2%
Housing Tenure For seasonal, recreational or occasional use
5 2.4% Total occupied housing units 1,625
Owned with a mortgage or a loan 670 41.2% For migrant workers 0 0.0%
Owned free and clear 352 21.7%
Renter‐occupied 603 37.1% Other Vacant 84 39.8%
City of Pittsburgh Neighborhood Profiles – Census 2010 Summary File 1 (SF1) Data
University Center for Social and Urban Research – University of Pittsburgh
30
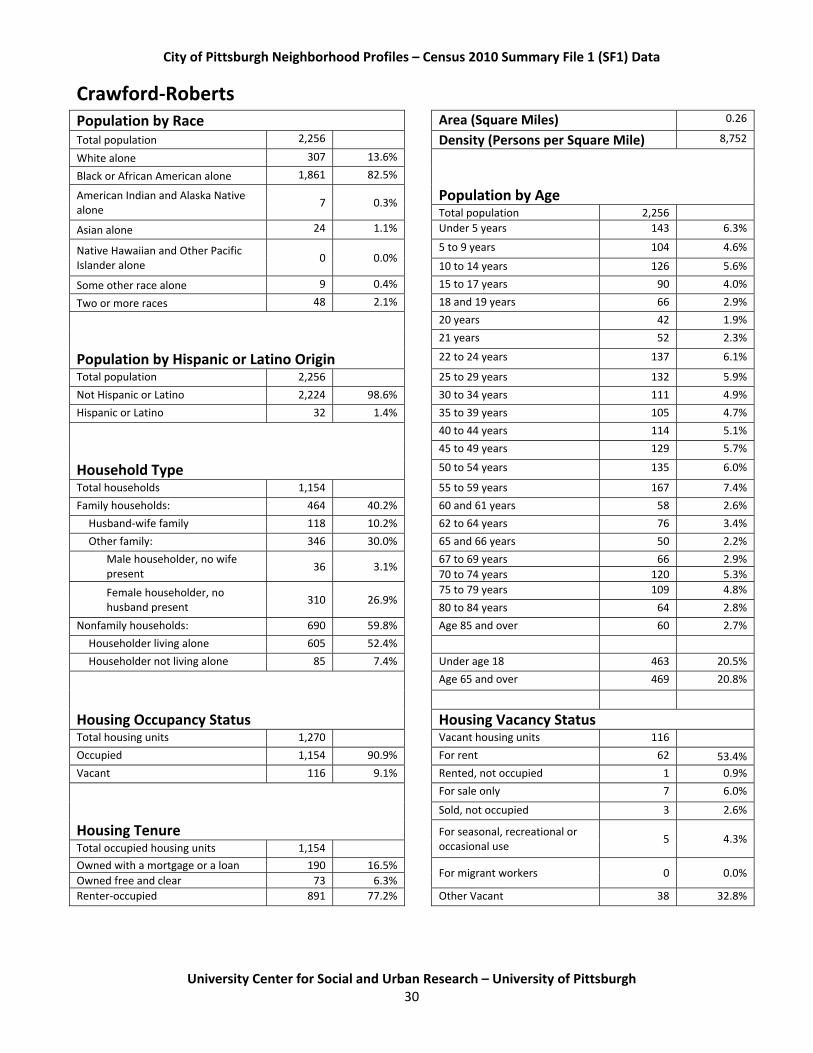
Crawford‐Roberts Population by Race Area (Square Miles) 0.26
Total population 2,256 Density (Persons per Square Mile) 8,752
White alone 307 13.6%
Black or African American alone 1,861 82.5%
American Indian and Alaska Native alone
7 0.3% Population by Age
Total population 2,256
Asian alone 24 1.1% Under 5 years 143 6.3%
Native Hawaiian and Other Pacific Islander alone
0 0.0% 5 to 9 years 104 4.6%
10 to 14 years 126 5.6%
Some other race alone 9 0.4% 15 to 17 years 90 4.0%
Two or more races 48 2.1% 18 and 19 years 66 2.9%
20 years 42 1.9%
21 years 52 2.3%
Population by Hispanic or Latino Origin 22 to 24 years 137 6.1%
Total population 2,256 25 to 29 years 132 5.9%
Not Hispanic or Latino 2,224 98.6% 30 to 34 years 111 4.9%
Hispanic or Latino 32 1.4% 35 to 39 years 105 4.7%
40 to 44 years 114 5.1%
45 to 49 years 129 5.7%
Household Type 50 to 54 years 135 6.0%
Total households 1,154 55 to 59 years 167 7.4%
Family households: 464 40.2% 60 and 61 years 58 2.6%
Husband‐wife family 118 10.2% 62 to 64 years 76 3.4%
Other family: 346 30.0% 65 and 66 years 50 2.2%
Male householder, no wife present
36 3.1% 67 to 69 years 66 2.9%
70 to 74 years 120 5.3%
Female householder, no husband present
310 26.9% 75 to 79 years 109 4.8%
80 to 84 years 64 2.8%
Nonfamily households: 690 59.8% Age 85 and over 60 2.7%
Householder living alone 605 52.4%
Householder not living alone 85 7.4% Under age 18 463 20.5%
Age 65 and over 469 20.8%
Housing Occupancy Status Housing Vacancy Status Total housing units 1,270 Vacant housing units 116
Occupied 1,154 90.9% For rent 62 53.4%
Vacant 116 9.1% Rented, not occupied 1 0.9%
For sale only 7 6.0%
Sold, not occupied 3 2.6%
Housing Tenure For seasonal, recreational or occasional use
5 4.3% Total occupied housing units 1,154
Owned with a mortgage or a loan 190 16.5% For migrant workers 0 0.0%
Owned free and clear 73 6.3%
Renter‐occupied 891 77.2% Other Vacant 38 32.8%

City of Pittsburgh Neighborhood Profiles – Census 2010 Summary File 1 (SF1) Data
University Center for Social and Urban Research – University of Pittsburgh
31
Duquesne Heights Population by Race Area (Square Miles) 0.62
Total population 2,425 Density (Persons per Square Mile) 3,915
White alone 2,244 92.5%
Black or African American alone 69 2.8%
American Indian and Alaska Native alone
2 0.1% Population by Age
Total population 2,425
Asian alone 53 2.2% Under 5 years 66 2.7%
Native Hawaiian and Other Pacific Islander alone
0 0.0% 5 to 9 years 56 2.3%
10 to 14 years 79 3.3%
Some other race alone 8 0.3% 15 to 17 years 57 2.4%
Two or more races 49 2.0% 18 and 19 years 43 1.8%
20 years 26 1.1%
21 years 41 1.7%
Population by Hispanic or Latino Origin 22 to 24 years 183 7.5%
Total population 2,425 25 to 29 years 306 12.6%
Not Hispanic or Latino 2,395 98.8% 30 to 34 years 167 6.9%
Hispanic or Latino 30 1.2% 35 to 39 years 142 5.9%
40 to 44 years 129 5.3%
45 to 49 years 146 6.0%
Household Type 50 to 54 years 201 8.3%
Total households 1,236 55 to 59 years 222 9.2%
Family households: 533 43.1% 60 and 61 years 62 2.6%
Husband‐wife family 383 31.0% 62 to 64 years 91 3.8%
Other family: 150 12.1% 65 and 66 years 40 1.6%
Male householder, no wife present
47 3.8% 67 to 69 years 64 2.6%
70 to 74 years 90 3.7%
Female householder, no husband present
103 8.3% 75 to 79 years 85 3.5%
80 to 84 years 79 3.3%
Nonfamily households: 703 56.9% Age 85 and over 50 2.1%
Householder living alone 522 42.2%
Householder not living alone 181 14.6% Under age 18 258 10.6%
Age 65 and over 408 16.8%
Housing Occupancy Status Housing Vacancy Status Total housing units 1,393 Vacant housing units 157
Occupied 1,236 88.7% For rent 42 26.8%
Vacant 157 11.3% Rented, not occupied 3 1.9%
For sale only 23 14.6%
Sold, not occupied 8 5.1%
Housing Tenure For seasonal, recreational or occasional use
17 10.8% Total occupied housing units 1,236
Owned with a mortgage or a loan 455 36.8% For migrant workers 0 0.0%
Owned free and clear 265 21.4%
Renter‐occupied 516 41.7% Other Vacant 64 40.8%

City of Pittsburgh Neighborhood Profiles – Census 2010 Summary File 1 (SF1) Data
University Center for Social and Urban Research – University of Pittsburgh
32
East Allegheny Population by Race Area (Square Miles) 0.24
Total population 2,136 Density (Persons per Square Mile) 9,079
White alone 1,339 62.7%
Black or African American alone 643 30.1%
American Indian and Alaska Native alone
9 0.4% Population by Age
Total population 2,136
Asian alone 23 1.1% Under 5 years 91 4.3%
Native Hawaiian and Other Pacific Islander alone
0 0.0% 5 to 9 years 59 2.8%
10 to 14 years 68 3.2%
Some other race alone 27 1.3% 15 to 17 years 50 2.3%
Two or more races 95 4.4% 18 and 19 years 52 2.4%
20 years 38 1.8%
21 years 29 1.4%
Population by Hispanic or Latino Origin 22 to 24 years 101 4.7%
Total population 2,136 25 to 29 years 215 10.1%
Not Hispanic or Latino 2,050 96.0% 30 to 34 years 145 6.8%
Hispanic or Latino 86 4.0% 35 to 39 years 146 6.8%
40 to 44 years 147 6.9%
45 to 49 years 184 8.6%
Household Type 50 to 54 years 208 9.7%
Total households 1,252 55 to 59 years 190 8.9%
Family households: 368 29.4% 60 and 61 years 72 3.4%
Husband‐wife family 164 13.1% 62 to 64 years 50 2.3%
Other family: 204 16.3% 65 and 66 years 41 1.9%
Male householder, no wife present
63 5.0% 67 to 69 years 51 2.4%
70 to 74 years 67 3.1%
Female householder, no husband present
141 11.3% 75 to 79 years 43 2.0%
80 to 84 years 52 2.4%
Nonfamily households: 884 70.6% Age 85 and over 37 1.7%
Householder living alone 752 60.1%
Householder not living alone 132 10.5% Under age 18 268 12.5%
Age 65 and over 291 13.6%
Housing Occupancy Status Housing Vacancy Status Total housing units 1,577 Vacant housing units 325
Occupied 1,252 79.4% For rent 88 27.1%
Vacant 325 20.6% Rented, not occupied 3 0.9%
For sale only 25 7.7%
Sold, not occupied 23 7.1%
Housing Tenure For seasonal, recreational or occasional use
8 2.5% Total occupied housing units 1,252
Owned with a mortgage or a loan 204 16.3% For migrant workers 0 0.0%
Owned free and clear 157 12.5%
Renter‐occupied 891 71.2% Other Vacant 178 54.8%

City of Pittsburgh Neighborhood Profiles – Census 2010 Summary File 1 (SF1) Data
University Center for Social and Urban Research – University of Pittsburgh
33
East Carnegie Population by Race Area (Square Miles) 0.43
Total population 570 Density (Persons per Square Mile) 1,316
White alone 447 78.4%
Black or African American alone 92 16.1%
American Indian and Alaska Native alone
0 0.0% Population by Age
Total population 570
Asian alone 3 0.5% Under 5 years 35 6.1%
Native Hawaiian and Other Pacific Islander alone
0 0.0% 5 to 9 years 16 2.8%
10 to 14 years 22 3.9%
Some other race alone 15 2.6% 15 to 17 years 16 2.8%
Two or more races 13 2.3% 18 and 19 years 13 2.3%
20 years 13 2.3%
21 years 16 2.8%
Population by Hispanic or Latino Origin 22 to 24 years 46 8.1%
Total population 570 25 to 29 years 59 10.4%
Not Hispanic or Latino 545 95.6% 30 to 34 years 39 6.8%
Hispanic or Latino 25 4.4% 35 to 39 years 33 5.8%
40 to 44 years 33 5.8%
45 to 49 years 46 8.1%
Household Type 50 to 54 years 36 6.3%
Total households 224 55 to 59 years 33 5.8%
Family households: 118 52.7% 60 and 61 years 22 3.9%
Husband‐wife family 60 26.8% 62 to 64 years 26 4.6%
Other family: 58 25.9% 65 and 66 years 7 1.2%
Male householder, no wife present
21 9.4% 67 to 69 years 7 1.2%
70 to 74 years 13 2.3%
Female householder, no husband present
37 16.5% 75 to 79 years 15 2.6%
80 to 84 years 17 3.0%
Nonfamily households: 106 47.3% Age 85 and over 7 1.2%
Householder living alone 77 34.4%
Householder not living alone 29 12.9% Under age 18 89 15.6%
Age 65 and over 66 11.6%
Housing Occupancy Status Housing Vacancy Status Total housing units 251 Vacant housing units 27
Occupied 224 89.2% For rent 6 22.2%
Vacant 27 10.8% Rented, not occupied 3 11.1%
For sale only 1 3.7%
Sold, not occupied 0 0.0%
Housing Tenure For seasonal, recreational or occasional use
4 14.8% Total occupied housing units 224
Owned with a mortgage or a loan 83 37.1% For migrant workers 0 0.0%
Owned free and clear 46 20.5%
Renter‐occupied 95 42.4% Other Vacant 13 48.1%

City of Pittsburgh Neighborhood Profiles – Census 2010 Summary File 1 (SF1) Data
University Center for Social and Urban Research – University of Pittsburgh
34
East Hills Population by Race Area (Square Miles) 0.54
Total population 3,169 Density (Persons per Square Mile) 5,847
White alone 65 2.1%
Black or African American alone 2,953 93.2%
American Indian and Alaska Native alone
18 0.6% Population by Age
Total population 3,169
Asian alone 14 0.4% Under 5 years 312 9.8%
Native Hawaiian and Other Pacific Islander alone
2 0.1% 5 to 9 years 280 8.8%
10 to 14 years 266 8.4%
Some other race alone 7 0.2% 15 to 17 years 167 5.3%
Two or more races 110 3.5% 18 and 19 years 105 3.3%
20 years 34 1.1%
21 years 56 1.8%
Population by Hispanic or Latino Origin 22 to 24 years 149 4.7%
Total population 3,169 25 to 29 years 179 5.6%
Not Hispanic or Latino 3,132 98.8% 30 to 34 years 139 4.4%
Hispanic or Latino 37 1.2% 35 to 39 years 154 4.9%
40 to 44 years 133 4.2%
45 to 49 years 161 5.1%
Household Type 50 to 54 years 208 6.6%
Total households 1,318 55 to 59 years 184 5.8%
Family households: 826 62.7% 60 and 61 years 67 2.1%
Husband‐wife family 264 20.0% 62 to 64 years 105 3.3%
Other family: 562 42.6% 65 and 66 years 52 1.6%
Male householder, no wife present
53 4.0% 67 to 69 years 74 2.3%
70 to 74 years 110 3.5%
Female householder, no husband present
509 38.6% 75 to 79 years 93 2.9%
80 to 84 years 74 2.3%
Nonfamily households: 492 37.3% Age 85 and over 67 2.1%
Householder living alone 450 34.1%
Householder not living alone 42 3.2% Under age 18 1,025 32.3%
Age 65 and over 470 14.8%
Housing Occupancy Status Housing Vacancy Status Total housing units 1,522 Vacant housing units 204
Occupied 1,318 86.6% For rent 50 24.5%
Vacant 204 13.4% Rented, not occupied 1 0.5%
For sale only 9 4.4%
Sold, not occupied 7 3.4%
Housing Tenure For seasonal, recreational or occasional use
0 0.0% Total occupied housing units 1,318
Owned with a mortgage or a loan 331 25.1% For migrant workers 0 0.0%
Owned free and clear 247 18.7%
Renter‐occupied 740 56.1% Other Vacant 137 67.2%

City of Pittsburgh Neighborhood Profiles – Census 2010 Summary File 1 (SF1) Data
University Center for Social and Urban Research – University of Pittsburgh
35
East Liberty Population by Race Area (Square Miles) 0.58
Total population 5,869 Density (Persons per Square Mile) 10,152
White alone 1,467 25.0%
Black or African American alone 3,976 67.7%
American Indian and Alaska Native alone
11 0.2% Population by Age
Total population 5,869
Asian alone 190 3.2% Under 5 years 358 6.1%
Native Hawaiian and Other Pacific Islander alone
11 0.2% 5 to 9 years 262 4.5%
10 to 14 years 256 4.4%
Some other race alone 31 0.5% 15 to 17 years 210 3.6%
Two or more races 183 3.1% 18 and 19 years 132 2.2%
20 years 90 1.5%
21 years 74 1.3%
Population by Hispanic or Latino Origin 22 to 24 years 356 6.1%
Total population 5,869 25 to 29 years 591 10.1%
Not Hispanic or Latino 5,727 97.6% 30 to 34 years 362 6.2%
Hispanic or Latino 142 2.4% 35 to 39 years 310 5.3%
40 to 44 years 307 5.2%
45 to 49 years 433 7.4%
Household Type 50 to 54 years 462 7.9%
Total households 3,056 55 to 59 years 429 7.3%
Family households: 1,122 36.7% 60 and 61 years 181 3.1%
Husband‐wife family 367 12.0% 62 to 64 years 170 2.9%
Other family: 755 24.7% 65 and 66 years 95 1.6%
Male householder, no wife present
102 3.3% 67 to 69 years 145 2.5%
70 to 74 years 188 3.2%
Female householder, no husband present
653 21.4% 75 to 79 years 192 3.3%
80 to 84 years 136 2.3%
Nonfamily households: 1,934 63.3% Age 85 and over 130 2.2%
Householder living alone 1,669 54.6%
Householder not living alone 265 8.7% Under age 18 1,086 18.5%
Age 65 and over 886 15.1%
Housing Occupancy Status Housing Vacancy Status Total housing units 3,519 Vacant housing units 463
Occupied 3,056 86.8% For rent 252 54.4%
Vacant 463 13.2% Rented, not occupied 4 0.9%
For sale only 24 5.2%
Sold, not occupied 43 9.3%
Housing Tenure For seasonal, recreational or occasional use
5 1.1% Total occupied housing units 3,056
Owned with a mortgage or a loan 331 10.8% For migrant workers 0 0.0%
Owned free and clear 160 5.2%
Renter‐occupied 2,565 83.9% Other Vacant 135 29.2%

City of Pittsburgh Neighborhood Profiles – Census 2010 Summary File 1 (SF1) Data
University Center for Social and Urban Research – University of Pittsburgh
36
Elliott Population by Race Area (Square Miles) 0.61
Total population 2,381 Density (Persons per Square Mile) 3,880
White alone 1,560 65.5%
Black or African American alone 704 29.6%
American Indian and Alaska Native alone
5 0.2% Population by Age
Total population 2,381
Asian alone 16 0.7% Under 5 years 154 6.5%
Native Hawaiian and Other Pacific Islander alone
0 0.0% 5 to 9 years 143 6.0%
10 to 14 years 150 6.3%
Some other race alone 17 0.7% 15 to 17 years 96 4.0%
Two or more races 79 3.3% 18 and 19 years 76 3.2%
20 years 32 1.3%
21 years 37 1.6%
Population by Hispanic or Latino Origin 22 to 24 years 121 5.1%
Total population 2,381 25 to 29 years 159 6.7%
Not Hispanic or Latino 2,344 98.4% 30 to 34 years 145 6.1%
Hispanic or Latino 37 1.6% 35 to 39 years 124 5.2%
40 to 44 years 171 7.2%
45 to 49 years 180 7.6%
Household Type 50 to 54 years 198 8.3%
Total households 1,028 55 to 59 years 163 6.8%
Family households: 594 57.8% 60 and 61 years 54 2.3%
Husband‐wife family 280 27.2% 62 to 64 years 72 3.0%
Other family: 314 30.5% 65 and 66 years 51 2.1%
Male householder, no wife present
82 8.0% 67 to 69 years 54 2.3%
70 to 74 years 59 2.5%
Female householder, no husband present
232 22.6% 75 to 79 years 52 2.2%
80 to 84 years 51 2.1%
Nonfamily households: 434 42.2% Age 85 and over 39 1.6%
Householder living alone 362 35.2%
Householder not living alone 72 7.0% Under age 18 543 22.8%
Age 65 and over 306 12.9%
Housing Occupancy Status Housing Vacancy Status Total housing units 1,270 Vacant housing units 242
Occupied 1,028 80.9% For rent 76 31.4%
Vacant 242 19.1% Rented, not occupied 2 0.8%
For sale only 29 12.0%
Sold, not occupied 18 7.4%
Housing Tenure For seasonal, recreational or occasional use
6 2.5% Total occupied housing units 1,028
Owned with a mortgage or a loan 347 33.8% For migrant workers 0 0.0%
Owned free and clear 244 23.7%
Renter‐occupied 437 42.5% Other Vacant 111 45.9%

City of Pittsburgh Neighborhood Profiles – Census 2010 Summary File 1 (SF1) Data
University Center for Social and Urban Research – University of Pittsburgh
37
Esplen Population by Race Area (Square Miles) 0.23
Total population 301 Density (Persons per Square Mile) 1,293
White alone 196 65.1%
Black or African American alone 90 29.9%
American Indian and Alaska Native alone
4 1.3% Population by Age
Total population 301
Asian alone 2 0.7% Under 5 years 18 6.0%
Native Hawaiian and Other Pacific Islander alone
0 0.0% 5 to 9 years 22 7.3%
10 to 14 years 21 7.0%
Some other race alone 3 1.0% 15 to 17 years 13 4.3%
Two or more races 6 2.0% 18 and 19 years 9 3.0%
20 years 5 1.7%
21 years 2 0.7%
Population by Hispanic or Latino Origin 22 to 24 years 12 4.0%
Total population 301 25 to 29 years 22 7.3%
Not Hispanic or Latino 297 98.7% 30 to 34 years 16 5.3%
Hispanic or Latino 4 1.3% 35 to 39 years 17 5.6%
40 to 44 years 16 5.3%
45 to 49 years 35 11.6%
Household Type 50 to 54 years 21 7.0%
Total households 131 55 to 59 years 27 9.0%
Family households: 76 58.0% 60 and 61 years 4 1.3%
Husband‐wife family 37 28.2% 62 to 64 years 10 3.3%
Other family: 39 29.8% 65 and 66 years 6 2.0%
Male householder, no wife present
10 7.6% 67 to 69 years 7 2.3%
70 to 74 years 6 2.0%
Female householder, no husband present
29 22.1% 75 to 79 years 6 2.0%
80 to 84 years 2 0.7%
Nonfamily households: 55 42.0% Age 85 and over 4 1.3%
Householder living alone 48 36.6%
Householder not living alone 7 5.3% Under age 18 74 24.6%
Age 65 and over 31 10.3%
Housing Occupancy Status Housing Vacancy Status Total housing units 166 Vacant housing units 35
Occupied 131 78.9% For rent 7 20.0%
Vacant 35 21.1% Rented, not occupied 0 0.0%
For sale only 2 5.7%
Sold, not occupied 0 0.0%
Housing Tenure For seasonal, recreational or occasional use
0 0.0% Total occupied housing units 131
Owned with a mortgage or a loan 40 30.5% For migrant workers 0 0.0%
Owned free and clear 38 29.0%
Renter‐occupied 53 40.5% Other Vacant 26 74.3%

City of Pittsburgh Neighborhood Profiles – Census 2010 Summary File 1 (SF1) Data
University Center for Social and Urban Research – University of Pittsburgh
38
Fairywood Population by Race Area (Square Miles) 0.97
Total population 1,002 Density (Persons per Square Mile) 1,030
White alone 630 62.9%
Black or African American alone 284 28.3%
American Indian and Alaska Native alone
5 0.5% Population by Age
Total population 1,002
Asian alone 18 1.8% Under 5 years 55 5.5%
Native Hawaiian and Other Pacific Islander alone
0 0.0% 5 to 9 years 22 2.2%
10 to 14 years 17 1.7%
Some other race alone 16 1.6% 15 to 17 years 15 1.5%
Two or more races 49 4.9% 18 and 19 years 41 4.1%
20 years 40 4.0%
21 years 56 5.6%
Population by Hispanic or Latino Origin 22 to 24 years 211 21.1%
Total population 1,002 25 to 29 years 223 22.3%
Not Hispanic or Latino 954 95.2% 30 to 34 years 82 8.2%
Hispanic or Latino 48 4.8% 35 to 39 years 41 4.1%
40 to 44 years 33 3.3%
45 to 49 years 25 2.5%
Household Type 50 to 54 years 33 3.3%
Total households 465 55 to 59 years 28 2.8%
Family households: 163 35.1% 60 and 61 years 10 1.0%
Husband‐wife family 89 19.1% 62 to 64 years 16 1.6%
Other family: 74 15.9% 65 and 66 years 8 0.8%
Male householder, no wife present
24 5.2% 67 to 69 years 11 1.1%
70 to 74 years 9 0.9%
Female householder, no husband present
50 10.8% 75 to 79 years 13 1.3%
80 to 84 years 5 0.5%
Nonfamily households: 302 64.9% Age 85 and over 8 0.8%
Householder living alone 151 32.5%
Householder not living alone 151 32.5% Under age 18 109 10.9%
Age 65 and over 54 5.4%
Housing Occupancy Status Housing Vacancy Status Total housing units 540 Vacant housing units 75
Occupied 465 86.1% For rent 56 74.7%
Vacant 75 13.9% Rented, not occupied 2 2.7%
For sale only 4 5.3%
Sold, not occupied 0 0.0%
Housing Tenure For seasonal, recreational or occasional use
3 4.0% Total occupied housing units 465
Owned with a mortgage or a loan 45 9.7% For migrant workers 0 0.0%
Owned free and clear 38 8.2%
Renter‐occupied 382 82.2% Other Vacant 10 13.3%

City of Pittsburgh Neighborhood Profiles – Census 2010 Summary File 1 (SF1) Data
University Center for Social and Urban Research – University of Pittsburgh
39
Fineview Population by Race Area (Square Miles) 0.25
Total population 1,285 Density (Persons per Square Mile) 5,171
White alone 569 44.3%
Black or African American alone 665 51.8%
American Indian and Alaska Native alone
2 0.2% Population by Age
Total population 1,285
Asian alone 1 0.1% Under 5 years 141 11.0%
Native Hawaiian and Other Pacific Islander alone
0 0.0% 5 to 9 years 63 4.9%
10 to 14 years 62 4.8%
Some other race alone 11 0.9% 15 to 17 years 44 3.4%
Two or more races 37 2.9% 18 and 19 years 41 3.2%
20 years 29 2.3%
21 years 29 2.3%
Population by Hispanic or Latino Origin 22 to 24 years 86 6.7%
Total population 1,285 25 to 29 years 94 7.3%
Not Hispanic or Latino 1,260 98.1% 30 to 34 years 73 5.7%
Hispanic or Latino 25 1.9% 35 to 39 years 72 5.6%
40 to 44 years 63 4.9%
45 to 49 years 104 8.1%
Household Type 50 to 54 years 97 7.5%
Total households 612 55 to 59 years 85 6.6%
Family households: 355 58.0% 60 and 61 years 34 2.6%
Husband‐wife family 126 20.6% 62 to 64 years 27 2.1%
Other family: 229 37.4% 65 and 66 years 22 1.7%
Male householder, no wife present
38 6.2% 67 to 69 years 25 1.9%
70 to 74 years 35 2.7%
Female householder, no husband present
191 31.2% 75 to 79 years 22 1.7%
80 to 84 years 22 1.7%
Nonfamily households: 257 42.0% Age 85 and over 15 1.2%
Householder living alone 220 35.9%
Householder not living alone 37 6.0% Under age 18 310 24.1%
Age 65 and over 141 11.0%
Housing Occupancy Status Housing Vacancy Status Total housing units 760 Vacant housing units 148
Occupied 612 80.5% For rent 67 45.3%
Vacant 148 19.5% Rented, not occupied 5 3.4%
For sale only 13 8.8%
Sold, not occupied 16 10.8%
Housing Tenure For seasonal, recreational or occasional use
0 0.0% Total occupied housing units 612
Owned with a mortgage or a loan 173 28.3% For migrant workers 0 0.0%
Owned free and clear 108 17.6%
Renter‐occupied 331 54.1% Other Vacant 47 31.8%

City of Pittsburgh Neighborhood Profiles – Census 2010 Summary File 1 (SF1) Data
University Center for Social and Urban Research – University of Pittsburgh
40
Friendship Population by Race Area (Square Miles) 0.11
Total population 1,785 Density (Persons per Square Mile) 16,808
White alone 1,120 62.7%
Black or African American alone 362 20.3%
American Indian and Alaska Native alone
13 0.7% Population by Age
Total population 1,785
Asian alone 226 12.7% Under 5 years 73 4.1%
Native Hawaiian and Other Pacific Islander alone
0 0.0% 5 to 9 years 48 2.7%
10 to 14 years 30 1.7%
Some other race alone 23 1.3% 15 to 17 years 33 1.8%
Two or more races 41 2.3% 18 and 19 years 24 1.3%
20 years 19 1.1%
21 years 32 1.8%
Population by Hispanic or Latino Origin 22 to 24 years 227 12.7%
Total population 1,785 25 to 29 years 397 22.2%
Not Hispanic or Latino 1,709 95.7% 30 to 34 years 245 13.7%
Hispanic or Latino 76 4.3% 35 to 39 years 108 6.1%
40 to 44 years 89 5.0%
45 to 49 years 86 4.8%
Household Type 50 to 54 years 68 3.8%
Total households 1,071 55 to 59 years 89 5.0%
Family households: 223 20.8% 60 and 61 years 26 1.5%
Husband‐wife family 154 14.4% 62 to 64 years 44 2.5%
Other family: 69 6.4% 65 and 66 years 25 1.4%
Male householder, no wife present
22 2.1% 67 to 69 years 27 1.5%
70 to 74 years 37 2.1%
Female householder, no husband present
47 4.4% 75 to 79 years 23 1.3%
80 to 84 years 17 1.0%
Nonfamily households: 848 79.2% Age 85 and over 18 1.0%
Householder living alone 662 61.8%
Householder not living alone 186 17.4% Under age 18 184 10.3%
Age 65 and over 147 8.2%
Housing Occupancy Status Housing Vacancy Status Total housing units 1,163 Vacant housing units 92
Occupied 1,071 92.1% For rent 49 53.3%
Vacant 92 7.9% Rented, not occupied 9 9.8%
For sale only 3 3.3%
Sold, not occupied 0 0.0%
Housing Tenure For seasonal, recreational or occasional use
8 8.7% Total occupied housing units 1,071
Owned with a mortgage or a loan 118 11.0% For migrant workers 0 0.0%
Owned free and clear 39 3.6%
Renter‐occupied 914 85.3% Other Vacant 23 25.0%

City of Pittsburgh Neighborhood Profiles – Census 2010 Summary File 1 (SF1) Data
University Center for Social and Urban Research – University of Pittsburgh
41
Garfield Population by Race Area (Square Miles) 0.46
Total population 3,675 Density (Persons per Square Mile) 8,034
White alone 498 13.6%
Black or African American alone 2,943 80.1%
American Indian and Alaska Native alone
9 0.2% Population by Age
Total population 3,675
Asian alone 97 2.6% Under 5 years 237 6.4%
Native Hawaiian and Other Pacific Islander alone
2 0.1% 5 to 9 years 298 8.1%
10 to 14 years 303 8.2%
Some other race alone 20 0.5% 15 to 17 years 193 5.3%
Two or more races 106 2.9% 18 and 19 years 114 3.1%
20 years 63 1.7%
21 years 59 1.6%
Population by Hispanic or Latino Origin 22 to 24 years 159 4.3%
Total population 3,675 25 to 29 years 285 7.8%
Not Hispanic or Latino 3,624 98.6% 30 to 34 years 214 5.8%
Hispanic or Latino 51 1.4% 35 to 39 years 194 5.3%
40 to 44 years 165 4.5%
45 to 49 years 256 7.0%
Household Type 50 to 54 years 275 7.5%
Total households 1,516 55 to 59 years 221 6.0%
Family households: 870 57.4% 60 and 61 years 76 2.1%
Husband‐wife family 278 18.3% 62 to 64 years 98 2.7%
Other family: 592 39.1% 65 and 66 years 64 1.7%
Male householder, no wife present
70 4.6% 67 to 69 years 72 2.0%
70 to 74 years 114 3.1%
Female householder, no husband present
522 34.4% 75 to 79 years 101 2.7%
80 to 84 years 62 1.7%
Nonfamily households: 646 42.6% Age 85 and over 52 1.4%
Householder living alone 558 36.8%
Householder not living alone 88 5.8% Under age 18 1,031 28.1%
Age 65 and over 465 12.7%
Housing Occupancy Status Housing Vacancy Status Total housing units 1,971 Vacant housing units 455
Occupied 1,516 76.9% For rent 138 30.3%
Vacant 455 23.1% Rented, not occupied 8 1.8%
For sale only 24 5.3%
Sold, not occupied 14 3.1%
Housing Tenure For seasonal, recreational or occasional use
2 0.4% Total occupied housing units 1,516
Owned with a mortgage or a loan 423 27.9% For migrant workers 0 0.0%
Owned free and clear 261 17.2%
Renter‐occupied 832 54.9% Other Vacant 269 59.1%

City of Pittsburgh Neighborhood Profiles – Census 2010 Summary File 1 (SF1) Data
University Center for Social and Urban Research – University of Pittsburgh
42
Glen Hazel Population by Race Area (Square Miles) 0.46
Total population 716 Density (Persons per Square Mile) 1,548
White alone 208 29.1%
Black or African American alone 488 68.2%
American Indian and Alaska Native alone
6 0.8% Population by Age
Total population 716
Asian alone 0 0.0% Under 5 years 37 5.2%
Native Hawaiian and Other Pacific Islander alone
0 0.0% 5 to 9 years 35 4.9%
10 to 14 years 45 6.3%
Some other race alone 3 0.4% 15 to 17 years 31 4.3%
Two or more races 11 1.5% 18 and 19 years 14 2.0%
20 years 12 1.7%
21 years 5 0.7%
Population by Hispanic or Latino Origin 22 to 24 years 14 2.0%
Total population 716 25 to 29 years 28 3.9%
Not Hispanic or Latino 709 99.0% 30 to 34 years 24 3.4%
Hispanic or Latino 7 1.0% 35 to 39 years 23 3.2%
40 to 44 years 30 4.2%
45 to 49 years 33 4.6%
Household Type 50 to 54 years 38 5.3%
Total households 236 55 to 59 years 66 9.2%
Family households: 109 46.2% 60 and 61 years 23 3.2%
Husband‐wife family 16 6.8% 62 to 64 years 29 4.1%
Other family: 93 39.4% 65 and 66 years 26 3.6%
Male householder, no wife present
6 2.5% 67 to 69 years 31 4.3%
70 to 74 years 32 4.5%
Female householder, no husband present
87 36.9% 75 to 79 years 34 4.7%
80 to 84 years 40 5.6%
Nonfamily households: 127 53.8% Age 85 and over 66 9.2%
Householder living alone 117 49.6%
Householder not living alone 10 4.2% Under age 18 148 20.7%
Age 65 and over 229 32.0%
Housing Occupancy Status Housing Vacancy Status Total housing units 249 Vacant housing units 13
Occupied 236 94.8% For rent 4 30.8%
Vacant 13 5.2% Rented, not occupied 1 7.7%
For sale only 4 30.8%
Sold, not occupied 1 7.7%
Housing Tenure For seasonal, recreational or occasional use
0 0.0% Total occupied housing units 236
Owned with a mortgage or a loan 12 5.1% For migrant workers 0 0.0%
Owned free and clear 8 3.4%
Renter‐occupied 216 91.5% Other Vacant 3 23.1%

City of Pittsburgh Neighborhood Profiles – Census 2010 Summary File 1 (SF1) Data
University Center for Social and Urban Research – University of Pittsburgh
43
Greenfield Population by Race Area (Square Miles) 0.78
Total population 7,294 Density (Persons per Square Mile) 9,398
White alone 6,440 88.3%
Black or African American alone 320 4.4%
American Indian and Alaska Native alone
13 0.2% Population by Age
Total population 7,294
Asian alone 312 4.3% Under 5 years 333 4.6%
Native Hawaiian and Other Pacific Islander alone
0 0.0% 5 to 9 years 283 3.9%
10 to 14 years 293 4.0%
Some other race alone 52 0.7% 15 to 17 years 205 2.8%
Two or more races 157 2.2% 18 and 19 years 128 1.8%
20 years 65 0.9%
21 years 91 1.2%
Population by Hispanic or Latino Origin 22 to 24 years 453 6.2%
Total population 7,294 25 to 29 years 878 12.0%
Not Hispanic or Latino 7,085 97.1% 30 to 34 years 650 8.9%
Hispanic or Latino 209 2.9% 35 to 39 years 428 5.9%
40 to 44 years 429 5.9%
45 to 49 years 475 6.5%
Household Type 50 to 54 years 525 7.2%
Total households 3,478 55 to 59 years 533 7.3%
Family households: 1,811 52.1% 60 and 61 years 179 2.5%
Husband‐wife family 1,287 37.0% 62 to 64 years 227 3.1%
Other family: 524 15.1% 65 and 66 years 127 1.7%
Male householder, no wife present
147 4.2% 67 to 69 years 168 2.3%
70 to 74 years 245 3.4%
Female householder, no husband present
377 10.8% 75 to 79 years 218 3.0%
80 to 84 years 201 2.8%
Nonfamily households: 1,667 47.9% Age 85 and over 160 2.2%
Householder living alone 1,263 36.3%
Householder not living alone 404 11.6% Under age 18 1,114 15.3%
Age 65 and over 1,119 15.3%
Housing Occupancy Status Housing Vacancy Status Total housing units 3,805 Vacant housing units 327
Occupied 3,478 91.4% For rent 100 30.6%
Vacant 327 8.6% Rented, not occupied 11 3.4%
For sale only 41 12.5%
Sold, not occupied 12 3.7%
Housing Tenure For seasonal, recreational or occasional use
11 3.4% Total occupied housing units 3,478
Owned with a mortgage or a loan 1,378 39.6% For migrant workers 0 0.0%
Owned free and clear 772 22.2%
Renter‐occupied 1,328 38.2% Other Vacant 152 46.5%

City of Pittsburgh Neighborhood Profiles – Census 2010 Summary File 1 (SF1) Data
University Center for Social and Urban Research – University of Pittsburgh
44
Hays Population by Race Area (Square Miles) 1.73
Total population 362 Density (Persons per Square Mile) 209
White alone 318 87.8%
Black or African American alone 26 7.2%
American Indian and Alaska Native alone
0 0.0% Population by Age
Total population 362
Asian alone 6 1.7% Under 5 years 14 3.9%
Native Hawaiian and Other Pacific Islander alone
0 0.0% 5 to 9 years 26 7.2%
10 to 14 years 18 5.0%
Some other race alone 0 0.0% 15 to 17 years 7 1.9%
Two or more races 12 3.3% 18 and 19 years 6 1.7%
20 years 8 2.2%
21 years 2 0.6%
Population by Hispanic or Latino Origin 22 to 24 years 7 1.9%
Total population 362 25 to 29 years 26 7.2%
Not Hispanic or Latino 349 96.4% 30 to 34 years 21 5.8%
Hispanic or Latino 13 3.6% 35 to 39 years 19 5.2%
40 to 44 years 28 7.7%
45 to 49 years 33 9.1%
Household Type 50 to 54 years 33 9.1%
Total households 166 55 to 59 years 28 7.7%
Family households: 99 59.6% 60 and 61 years 10 2.8%
Husband‐wife family 68 41.0% 62 to 64 years 14 3.9%
Other family: 31 18.7% 65 and 66 years 9 2.5%
Male householder, no wife present
15 9.0% 67 to 69 years 9 2.5%
70 to 74 years 15 4.1%
Female householder, no husband present
16 9.6% 75 to 79 years 10 2.8%
80 to 84 years 10 2.8%
Nonfamily households: 67 40.4% Age 85 and over 9 2.5%
Householder living alone 57 34.3%
Householder not living alone 10 6.0% Under age 18 65 18.0%
Age 65 and over 62 17.1%
Housing Occupancy Status Housing Vacancy Status Total housing units 203 Vacant housing units 37
Occupied 166 81.8% For rent 3 8.1%
Vacant 37 18.2% Rented, not occupied 1 2.7%
For sale only 6 16.2%
Sold, not occupied 0 0.0%
Housing Tenure For seasonal, recreational or occasional use
1 2.7% Total occupied housing units 166
Owned with a mortgage or a loan 55 33.1% For migrant workers 0 0.0%
Owned free and clear 54 32.5%
Renter‐occupied 57 34.3% Other Vacant 26 70.3%

City of Pittsburgh Neighborhood Profiles – Census 2010 Summary File 1 (SF1) Data
University Center for Social and Urban Research – University of Pittsburgh
45
Hazelwood Population by Race Area (Square Miles) 1.59
Total population 4,317 Density (Persons per Square Mile) 2,722
White alone 2,346 54.3%
Black or African American alone 1,771 41.0%
American Indian and Alaska Native alone
8 0.2% Population by Age
Total population 4,317
Asian alone 66 1.5% Under 5 years 293 6.8%
Native Hawaiian and Other Pacific Islander alone
0 0.0% 5 to 9 years 312 7.2%
10 to 14 years 250 5.8%
Some other race alone 17 0.4% 15 to 17 years 189 4.4%
Two or more races 109 2.5% 18 and 19 years 132 3.1%
20 years 53 1.2%
21 years 35 0.8%
Population by Hispanic or Latino Origin 22 to 24 years 157 3.6%
Total population 4,317 25 to 29 years 312 7.2%
Not Hispanic or Latino 4,230 98.0% 30 to 34 years 245 5.7%
Hispanic or Latino 87 2.0% 35 to 39 years 212 4.9%
40 to 44 years 251 5.8%
45 to 49 years 323 7.5%
Household Type 50 to 54 years 368 8.5%
Total households 1,884 55 to 59 years 318 7.4%
Family households: 1,048 55.6% 60 and 61 years 90 2.1%
Husband‐wife family 494 26.2% 62 to 64 years 158 3.7%
Other family: 554 29.4% 65 and 66 years 63 1.5%
Male householder, no wife present
99 5.3% 67 to 69 years 107 2.5%
70 to 74 years 141 3.3%
Female householder, no husband present
455 24.2% 75 to 79 years 114 2.6%
80 to 84 years 111 2.6%
Nonfamily households: 836 44.4% Age 85 and over 83 1.9%
Householder living alone 714 37.9%
Householder not living alone 122 6.5% Under age 18 1,044 24.2%
Age 65 and over 619 14.3%
Housing Occupancy Status Housing Vacancy Status Total housing units 2,361 Vacant housing units 477
Occupied 1,884 79.8% For rent 103 21.6%
Vacant 477 20.2% Rented, not occupied 15 3.1%
For sale only 25 5.2%
Sold, not occupied 10 2.1%
Housing Tenure For seasonal, recreational or occasional use
3 0.6% Total occupied housing units 1,884
Owned with a mortgage or a loan 543 28.8% For migrant workers 0 0.0%
Owned free and clear 491 26.1%
Renter‐occupied 850 45.1% Other Vacant 321 67.3%

City of Pittsburgh Neighborhood Profiles – Census 2010 Summary File 1 (SF1) Data
University Center for Social and Urban Research – University of Pittsburgh
46
Highland Park Population by Race Area (Square Miles) 1.12
Total population 6,395 Density (Persons per Square Mile) 5,729
White alone 4,253 66.5%
Black or African American alone 1,684 26.3%
American Indian and Alaska Native alone
13 0.2% Population by Age
Total population 6,395
Asian alone 218 3.4% Under 5 years 390 6.1%
Native Hawaiian and Other Pacific Islander alone
0 0.0% 5 to 9 years 317 5.0%
10 to 14 years 292 4.6%
Some other race alone 57 0.9% 15 to 17 years 190 3.0%
Two or more races 170 2.7% 18 and 19 years 105 1.6%
20 years 62 1.0%
21 years 80 1.3%
Population by Hispanic or Latino Origin 22 to 24 years 374 5.8%
Total population 6,395 25 to 29 years 661 10.3%
Not Hispanic or Latino 6,207 97.1% 30 to 34 years 499 7.8%
Hispanic or Latino 188 2.9% 35 to 39 years 419 6.6%
40 to 44 years 429 6.7%
45 to 49 years 442 6.9%
Household Type 50 to 54 years 495 7.7%
Total households 3,002 55 to 59 years 484 7.6%
Family households: 1,502 50.0% 60 and 61 years 162 2.5%
Husband‐wife family 1,041 34.7% 62 to 64 years 231 3.6%
Other family: 461 15.4% 65 and 66 years 115 1.8%
Male householder, no wife present
103 3.4% 67 to 69 years 132 2.1%
70 to 74 years 164 2.6%
Female householder, no husband present
358 11.9% 75 to 79 years 131 2.0%
80 to 84 years 123 1.9%
Nonfamily households: 1,500 50.0% Age 85 and over 98 1.5%
Householder living alone 1,161 38.7%
Householder not living alone 339 11.3% Under age 18 1,189 18.6%
Age 65 and over 763 11.9%
Housing Occupancy Status Housing Vacancy Status Total housing units 3,272 Vacant housing units 270
Occupied 3,002 91.7% For rent 115 42.6%
Vacant 270 8.3% Rented, not occupied 6 2.2%
For sale only 26 9.6%
Sold, not occupied 12 4.4%
Housing Tenure For seasonal, recreational or occasional use
8 3.0% Total occupied housing units 3,002
Owned with a mortgage or a loan 1,064 35.4% For migrant workers 1 0.4%
Owned free and clear 442 14.7%
Renter‐occupied 1,496 49.8% Other Vacant 102 37.8%

City of Pittsburgh Neighborhood Profiles – Census 2010 Summary File 1 (SF1) Data
University Center for Social and Urban Research – University of Pittsburgh
47
Homewood North Population by Race Area (Square Miles) 0.43
Total population 3,280 Density (Persons per Square Mile) 7,581
White alone 68 2.1%
Black or African American alone 3,060 93.3%
American Indian and Alaska Native alone
14 0.4% Population by Age
Total population 3,280
Asian alone 7 0.2% Under 5 years 263 8.0%
Native Hawaiian and Other Pacific Islander alone
0 0.0% 5 to 9 years 258 7.9%
10 to 14 years 259 7.9%
Some other race alone 38 1.2% 15 to 17 years 184 5.6%
Two or more races 93 2.8% 18 and 19 years 121 3.7%
20 years 55 1.7%
21 years 55 1.7%
Population by Hispanic or Latino Origin 22 to 24 years 130 4.0%
Total population 3,280 25 to 29 years 183 5.6%
Not Hispanic or Latino 3,219 98.1% 30 to 34 years 155 4.7%
Hispanic or Latino 61 1.9% 35 to 39 years 173 5.3%
40 to 44 years 165 5.0%
45 to 49 years 218 6.6%
Household Type 50 to 54 years 236 7.2%
Total households 1,294 55 to 59 years 214 6.5%
Family households: 814 62.9% 60 and 61 years 70 2.1%
Husband‐wife family 227 17.5% 62 to 64 years 110 3.4%
Other family: 587 45.4% 65 and 66 years 34 1.0%
Male householder, no wife present
84 6.5% 67 to 69 years 71 2.2%
70 to 74 years 90 2.7%
Female householder, no husband present
503 38.9% 75 to 79 years 92 2.8%
80 to 84 years 78 2.4%
Nonfamily households: 480 37.1% Age 85 and over 66 2.0%
Householder living alone 421 32.5%
Householder not living alone 59 4.6% Under age 18 964 29.4%
Age 65 and over 431 13.1%
Housing Occupancy Status Housing Vacancy Status Total housing units 1,807 Vacant housing units 513
Occupied 1,294 71.6% For rent 129 25.1%
Vacant 513 28.4% Rented, not occupied 3 0.6%
For sale only 12 2.3%
Sold, not occupied 12 2.3%
Housing Tenure For seasonal, recreational or occasional use
0 0.0% Total occupied housing units 1,294
Owned with a mortgage or a loan 305 23.6% For migrant workers 0 0.0%
Owned free and clear 299 23.1%
Renter‐occupied 690 53.3% Other Vacant 357 69.6%

City of Pittsburgh Neighborhood Profiles – Census 2010 Summary File 1 (SF1) Data
University Center for Social and Urban Research – University of Pittsburgh
48
Homewood South Population by Race Area (Square Miles) 0.39
Total population 2,344 Density (Persons per Square Mile) 5,949
White alone 46 2.0%
Black or African American alone 2,220 94.7%
American Indian and Alaska Native alone
12 0.5% Population by Age
Total population 2,344
Asian alone 7 0.3% Under 5 years 167 7.1%
Native Hawaiian and Other Pacific Islander alone
0 0.0% 5 to 9 years 170 7.3%
10 to 14 years 158 6.7%
Some other race alone 7 0.3% 15 to 17 years 153 6.5%
Two or more races 52 2.2% 18 and 19 years 94 4.0%
20 years 31 1.3%
21 years 28 1.2%
Population by Hispanic or Latino Origin 22 to 24 years 74 3.2%
Total population 2,344 25 to 29 years 111 4.7%
Not Hispanic or Latino 2,323 99.1% 30 to 34 years 94 4.0%
Hispanic or Latino 21 0.9% 35 to 39 years 118 5.0%
40 to 44 years 118 5.0%
45 to 49 years 152 6.5%
Household Type 50 to 54 years 147 6.3%
Total households 1,079 55 to 59 years 142 6.1%
Family households: 542 50.2% 60 and 61 years 48 2.0%
Husband‐wife family 124 11.5% 62 to 64 years 77 3.3%
Other family: 418 38.7% 65 and 66 years 50 2.1%
Male householder, no wife present
52 4.8% 67 to 69 years 76 3.2%
70 to 74 years 98 4.2%
Female householder, no husband present
366 33.9% 75 to 79 years 90 3.8%
80 to 84 years 88 3.8%
Nonfamily households: 537 49.8% Age 85 and over 60 2.6%
Householder living alone 495 45.9%
Householder not living alone 42 3.9% Under age 18 648 27.6%
Age 65 and over 462 19.7%
Housing Occupancy Status Housing Vacancy Status Total housing units 1,507 Vacant housing units 428
Occupied 1,079 71.6% For rent 83 19.4%
Vacant 428 28.4% Rented, not occupied 3 0.7%
For sale only 9 2.1%
Sold, not occupied 15 3.5%
Housing Tenure For seasonal, recreational or occasional use
1 0.2% Total occupied housing units 1,079
Owned with a mortgage or a loan 220 20.4% For migrant workers 0 0.0%
Owned free and clear 193 17.9%
Renter‐occupied 666 61.7% Other Vacant 317 74.1%

City of Pittsburgh Neighborhood Profiles – Census 2010 Summary File 1 (SF1) Data
University Center for Social and Urban Research – University of Pittsburgh
49
Homewood West Population by Race Area (Square Miles) 0.20
Total population 818 Density (Persons per Square Mile) 4,113
White alone 19 2.3%
Black or African American alone 782 95.6%
American Indian and Alaska Native alone
3 0.4% Population by Age
Total population 818
Asian alone 1 0.1% Under 5 years 50 6.1%
Native Hawaiian and Other Pacific Islander alone
0 0.0% 5 to 9 years 44 5.4%
10 to 14 years 61 7.5%
Some other race alone 1 0.1% 15 to 17 years 31 3.8%
Two or more races 12 1.5% 18 and 19 years 28 3.4%
20 years 20 2.4%
21 years 13 1.6%
Population by Hispanic or Latino Origin 22 to 24 years 19 2.3%
Total population 818 25 to 29 years 36 4.4%
Not Hispanic or Latino 811 99.1% 30 to 34 years 27 3.3%
Hispanic or Latino 7 0.9% 35 to 39 years 28 3.4%
40 to 44 years 54 6.6%
45 to 49 years 54 6.6%
Household Type 50 to 54 years 56 6.8%
Total households 414 55 to 59 years 54 6.6%
Family households: 192 46.4% 60 and 61 years 20 2.4%
Husband‐wife family 47 11.4% 62 to 64 years 22 2.7%
Other family: 145 35.0% 65 and 66 years 21 2.6%
Male householder, no wife present
22 5.3% 67 to 69 years 20 2.4%
70 to 74 years 57 7.0%
Female householder, no husband present
123 29.7% 75 to 79 years 28 3.4%
80 to 84 years 40 4.9%
Nonfamily households: 222 53.6% Age 85 and over 35 4.3%
Householder living alone 209 50.5%
Householder not living alone 13 3.1% Under age 18 186 22.7%
Age 65 and over 201 24.6%
Housing Occupancy Status Housing Vacancy Status Total housing units 532 Vacant housing units 118
Occupied 414 77.8% For rent 44 37.3%
Vacant 118 22.2% Rented, not occupied 3 2.5%
For sale only 1 0.8%
Sold, not occupied 3 2.5%
Housing Tenure For seasonal, recreational or occasional use
0 0.0% Total occupied housing units 414
Owned with a mortgage or a loan 84 20.3% For migrant workers 0 0.0%
Owned free and clear 73 17.6%
Renter‐occupied 257 62.1% Other Vacant 67 56.8%

City of Pittsburgh Neighborhood Profiles – Census 2010 Summary File 1 (SF1) Data
University Center for Social and Urban Research – University of Pittsburgh
50
Knoxville Population by Race Area (Square Miles) 0.30
Total population 3,747 Density (Persons per Square Mile) 12,512
White alone 1,603 42.8%
Black or African American alone 1,930 51.5%
American Indian and Alaska Native alone
2 0.1% Population by Age
Total population 3,747
Asian alone 33 0.9% Under 5 years 267 7.1%
Native Hawaiian and Other Pacific Islander alone
0 0.0% 5 to 9 years 304 8.1%
10 to 14 years 310 8.3%
Some other race alone 31 0.8% 15 to 17 years 229 6.1%
Two or more races 148 3.9% 18 and 19 years 129 3.4%
20 years 46 1.2%
21 years 55 1.5%
Population by Hispanic or Latino Origin 22 to 24 years 176 4.7%
Total population 3,747 25 to 29 years 242 6.5%
Not Hispanic or Latino 3,698 98.7% 30 to 34 years 221 5.9%
Hispanic or Latino 49 1.3% 35 to 39 years 195 5.2%
40 to 44 years 227 6.1%
45 to 49 years 266 7.1%
Household Type 50 to 54 years 277 7.4%
Total households 1,460 55 to 59 years 237 6.3%
Family households: 928 63.6% 60 and 61 years 82 2.2%
Husband‐wife family 352 24.1% 62 to 64 years 100 2.7%
Other family: 576 39.5% 65 and 66 years 55 1.5%
Male householder, no wife present
96 6.6% 67 to 69 years 75 2.0%
70 to 74 years 78 2.1%
Female householder, no husband present
480 32.9% 75 to 79 years 69 1.8%
80 to 84 years 61 1.6%
Nonfamily households: 532 36.4% Age 85 and over 46 1.2%
Householder living alone 444 30.4%
Householder not living alone 88 6.0% Under age 18 1,110 29.6%
Age 65 and over 384 10.2%
Housing Occupancy Status Housing Vacancy Status Total housing units 1,857 Vacant housing units 397
Occupied 1,460 78.6% For rent 117 29.5%
Vacant 397 21.4% Rented, not occupied 6 1.5%
For sale only 64 16.1%
Sold, not occupied 18 4.5%
Housing Tenure For seasonal, recreational or occasional use
3 0.8% Total occupied housing units 1,460
Owned with a mortgage or a loan 453 31.0% For migrant workers 0 0.0%
Owned free and clear 313 21.4%
Renter‐occupied 694 47.5% Other Vacant 189 47.6%

City of Pittsburgh Neighborhood Profiles – Census 2010 Summary File 1 (SF1) Data
University Center for Social and Urban Research – University of Pittsburgh
51
Larimer Population by Race Area (Square Miles) 0.45
Total population 1,728 Density (Persons per Square Mile) 3,882
White alone 155 9.0%
Black or African American alone 1,483 85.8%
American Indian and Alaska Native alone
4 0.2% Population by Age
Total population 1,728
Asian alone 20 1.2% Under 5 years 102 5.9%
Native Hawaiian and Other Pacific Islander alone
0 0.0% 5 to 9 years 111 6.4%
10 to 14 years 114 6.6%
Some other race alone 13 0.8% 15 to 17 years 82 4.7%
Two or more races 53 3.1% 18 and 19 years 58 3.4%
20 years 18 1.0%
21 years 23 1.3%
Population by Hispanic or Latino Origin 22 to 24 years 48 2.8%
Total population 1,728 25 to 29 years 80 4.6%
Not Hispanic or Latino 1,696 98.1% 30 to 34 years 73 4.2%
Hispanic or Latino 32 1.9% 35 to 39 years 81 4.7%
40 to 44 years 89 5.2%
45 to 49 years 106 6.1%
Household Type 50 to 54 years 168 9.7%
Total households 662 55 to 59 years 138 8.0%
Family households: 359 54.2% 60 and 61 years 42 2.4%
Husband‐wife family 90 13.6% 62 to 64 years 54 3.1%
Other family: 269 40.6% 65 and 66 years 36 2.1%
Male householder, no wife present
48 7.3% 67 to 69 years 38 2.2%
70 to 74 years 55 3.2%
Female householder, no husband present
221 33.4% 75 to 79 years 63 3.6%
80 to 84 years 59 3.4%
Nonfamily households: 303 45.8% Age 85 and over 90 5.2%
Householder living alone 265 40.0%
Householder not living alone 38 5.7% Under age 18 409 23.7%
Age 65 and over 341 19.7%
Housing Occupancy Status Housing Vacancy Status Total housing units 892 Vacant housing units 230
Occupied 662 74.2% For rent 36 15.7%
Vacant 230 25.8% Rented, not occupied 9 3.9%
For sale only 10 4.3%
Sold, not occupied 4 1.7%
Housing Tenure For seasonal, recreational or occasional use
2 0.9% Total occupied housing units 662
Owned with a mortgage or a loan 147 22.2% For migrant workers 0 0.0%
Owned free and clear 152 23.0%
Renter‐occupied 363 54.8% Other Vacant 169 73.5%

City of Pittsburgh Neighborhood Profiles – Census 2010 Summary File 1 (SF1) Data
University Center for Social and Urban Research – University of Pittsburgh
52
Lincoln Place Population by Race Area (Square Miles) 0.98
Total population 3,227 Density (Persons per Square Mile) 3,288
White alone 3,131 97.0%
Black or African American alone 48 1.5%
American Indian and Alaska Native alone
2 0.1% Population by Age
Total population 3,227
Asian alone 7 0.2% Under 5 years 132 4.1%
Native Hawaiian and Other Pacific Islander alone
5 0.2% 5 to 9 years 153 4.7%
10 to 14 years 166 5.1%
Some other race alone 4 0.1% 15 to 17 years 113 3.5%
Two or more races 30 0.9% 18 and 19 years 71 2.2%
20 years 42 1.3%
21 years 30 0.9%
Population by Hispanic or Latino Origin 22 to 24 years 89 2.8%
Total population 3,227 25 to 29 years 215 6.7%
Not Hispanic or Latino 3,208 99.4% 30 to 34 years 179 5.5%
Hispanic or Latino 19 0.6% 35 to 39 years 182 5.6%
40 to 44 years 237 7.3%
45 to 49 years 279 8.6%
Household Type 50 to 54 years 292 9.0%
Total households 1,455 55 to 59 years 262 8.1%
Family households: 887 61.0% 60 and 61 years 90 2.8%
Husband‐wife family 659 45.3% 62 to 64 years 135 4.2%
Other family: 228 15.7% 65 and 66 years 60 1.9%
Male householder, no wife present
57 3.9% 67 to 69 years 83 2.6%
70 to 74 years 127 3.9%
Female householder, no husband present
171 11.8% 75 to 79 years 89 2.8%
80 to 84 years 96 3.0%
Nonfamily households: 568 39.0% Age 85 and over 105 3.3%
Householder living alone 484 33.3%
Householder not living alone 84 5.8% Under age 18 564 17.5%
Age 65 and over 560 17.4%
Housing Occupancy Status Housing Vacancy Status Total housing units 1,569 Vacant housing units 114
Occupied 1,455 92.7% For rent 21 18.4%
Vacant 114 7.3% Rented, not occupied 3 2.6%
For sale only 19 16.7%
Sold, not occupied 12 10.5%
Housing Tenure For seasonal, recreational or occasional use
4 3.5% Total occupied housing units 1,455
Owned with a mortgage or a loan 777 53.4% For migrant workers 0 0.0%
Owned free and clear 446 30.7%
Renter‐occupied 232 15.9% Other Vacant 55 48.2%

City of Pittsburgh Neighborhood Profiles – Census 2010 Summary File 1 (SF1) Data
University Center for Social and Urban Research – University of Pittsburgh
53
Lincoln‐Lemington‐Belmar Population by Race Area (Square Miles) 1.78
Total population 4,883 Density (Persons per Square Mile) 2,737
White alone 788 16.1%
Black or African American alone 3,876 79.4%
American Indian and Alaska Native alone
21 0.4% Population by Age
Total population 4,883
Asian alone 83 1.7% Under 5 years 251 5.1%
Native Hawaiian and Other Pacific Islander alone
0 0.0% 5 to 9 years 224 4.6%
10 to 14 years 300 6.1%
Some other race alone 7 0.1% 15 to 17 years 308 6.3%
Two or more races 108 2.2% 18 and 19 years 196 4.0%
20 years 100 2.0%
21 years 72 1.5%
Population by Hispanic or Latino Origin 22 to 24 years 169 3.5%
Total population 4,883 25 to 29 years 255 5.2%
Not Hispanic or Latino 4,824 98.8% 30 to 34 years 210 4.3%
Hispanic or Latino 59 1.2% 35 to 39 years 231 4.7%
40 to 44 years 231 4.7%
45 to 49 years 301 6.2%
Household Type 50 to 54 years 299 6.1%
Total households 2,033 55 to 59 years 384 7.9%
Family households: 1,098 54.0% 60 and 61 years 133 2.7%
Husband‐wife family 435 21.4% 62 to 64 years 184 3.8%
Other family: 663 32.6% 65 and 66 years 110 2.3%
Male householder, no wife present
110 5.4% 67 to 69 years 127 2.6%
70 to 74 years 187 3.8%
Female householder, no husband present
553 27.2% 75 to 79 years 207 4.2%
80 to 84 years 218 4.5%
Nonfamily households: 935 46.0% Age 85 and over 186 3.8%
Householder living alone 826 40.6%
Householder not living alone 109 5.4% Under age 18 1,083 22.2%
Age 65 and over 1,035 21.2%
Housing Occupancy Status Housing Vacancy Status Total housing units 2,551 Vacant housing units 518
Occupied 2,033 79.7% For rent 156 30.1%
Vacant 518 20.3% Rented, not occupied 0 0.0%
For sale only 73 14.1%
Sold, not occupied 24 4.6%
Housing Tenure For seasonal, recreational or occasional use
14 2.7% Total occupied housing units 2,033
Owned with a mortgage or a loan 575 28.3% For migrant workers 0 0.0%
Owned free and clear 439 21.6%
Renter‐occupied 1,019 50.1% Other Vacant 251 48.5%

City of Pittsburgh Neighborhood Profiles – Census 2010 Summary File 1 (SF1) Data
University Center for Social and Urban Research – University of Pittsburgh
54
Lower Lawrenceville Population by Race Area (Square Miles) 0.43
Total population 2,341 Density (Persons per Square Mile) 5,417
White alone 1,649 70.4%
Black or African American alone 546 23.3%
American Indian and Alaska Native alone
3 0.1% Population by Age
Total population 2,341
Asian alone 59 2.5% Under 5 years 85 3.6%
Native Hawaiian and Other Pacific Islander alone
1 0.0% 5 to 9 years 89 3.8%
10 to 14 years 108 4.6%
Some other race alone 25 1.1% 15 to 17 years 68 2.9%
Two or more races 58 2.5% 18 and 19 years 36 1.5%
20 years 18 0.8%
21 years 33 1.4%
Population by Hispanic or Latino Origin 22 to 24 years 193 8.2%
Total population 2,341 25 to 29 years 351 15.0%
Not Hispanic or Latino 2,311 98.7% 30 to 34 years 208 8.9%
Hispanic or Latino 30 1.3% 35 to 39 years 132 5.6%
40 to 44 years 143 6.1%
45 to 49 years 139 5.9%
Household Type 50 to 54 years 152 6.5%
Total households 1,180 55 to 59 years 154 6.6%
Family households: 424 35.9% 60 and 61 years 65 2.8%
Husband‐wife family 220 18.6% 62 to 64 years 62 2.6%
Other family: 204 17.3% 65 and 66 years 31 1.3%
Male householder, no wife present
33 2.8% 67 to 69 years 61 2.6%
70 to 74 years 55 2.3%
Female householder, no husband present
171 14.5% 75 to 79 years 62 2.6%
80 to 84 years 44 1.9%
Nonfamily households: 756 64.1% Age 85 and over 52 2.2%
Householder living alone 573 48.6%
Householder not living alone 183 15.5% Under age 18 350 15.0%
Age 65 and over 305 13.0%
Housing Occupancy Status Housing Vacancy Status Total housing units 1,386 Vacant housing units 206
Occupied 1,180 85.1% For rent 62 30.1%
Vacant 206 14.9% Rented, not occupied 6 2.9%
For sale only 28 13.6%
Sold, not occupied 26 12.6%
Housing Tenure For seasonal, recreational or occasional use
4 1.9% Total occupied housing units 1,180
Owned with a mortgage or a loan 288 24.4% For migrant workers 0 0.0%
Owned free and clear 160 13.6%
Renter‐occupied 732 62.0% Other Vacant 80 38.8%

City of Pittsburgh Neighborhood Profiles – Census 2010 Summary File 1 (SF1) Data
University Center for Social and Urban Research – University of Pittsburgh
55
Manchester Population by Race Area (Square Miles) 0.28
Total population 2,130 Density (Persons per Square Mile) 7,629
White alone 340 16.0%
Black or African American alone 1,707 80.1%
American Indian and Alaska Native alone
9 0.4% Population by Age
Total population 2,130
Asian alone 13 0.6% Under 5 years 97 4.6%
Native Hawaiian and Other Pacific Islander alone
1 0.0% 5 to 9 years 115 5.4%
10 to 14 years 146 6.9%
Some other race alone 4 0.2% 15 to 17 years 102 4.8%
Two or more races 56 2.6% 18 and 19 years 69 3.2%
20 years 19 0.9%
21 years 25 1.2%
Population by Hispanic or Latino Origin 22 to 24 years 77 3.6%
Total population 2,130 25 to 29 years 162 7.6%
Not Hispanic or Latino 2,101 98.6% 30 to 34 years 121 5.7%
Hispanic or Latino 29 1.4% 35 to 39 years 130 6.1%
40 to 44 years 132 6.2%
45 to 49 years 158 7.4%
Household Type 50 to 54 years 167 7.8%
Total households 1,036 55 to 59 years 177 8.3%
Family households: 480 46.3% 60 and 61 years 68 3.2%
Husband‐wife family 170 16.4% 62 to 64 years 71 3.3%
Other family: 310 29.9% 65 and 66 years 44 2.1%
Male householder, no wife present
43 4.2% 67 to 69 years 61 2.9%
70 to 74 years 71 3.3%
Female householder, no husband present
267 25.8% 75 to 79 years 45 2.1%
80 to 84 years 46 2.2%
Nonfamily households: 556 53.7% Age 85 and over 27 1.3%
Householder living alone 484 46.7%
Householder not living alone 72 6.9% Under age 18 460 21.6%
Age 65 and over 294 13.8%
Housing Occupancy Status Housing Vacancy Status Total housing units 1,319 Vacant housing units 283
Occupied 1,036 78.5% For rent 98 34.6%
Vacant 283 21.5% Rented, not occupied 1 0.4%
For sale only 12 4.2%
Sold, not occupied 10 3.5%
Housing Tenure For seasonal, recreational or occasional use
2 0.7% Total occupied housing units 1,036
Owned with a mortgage or a loan 308 29.7% For migrant workers 0 0.0%
Owned free and clear 136 13.1%
Renter‐occupied 592 57.1% Other Vacant 160 56.5%

City of Pittsburgh Neighborhood Profiles – Census 2010 Summary File 1 (SF1) Data
University Center for Social and Urban Research – University of Pittsburgh
56
Marshall‐Shadeland Population by Race Area (Square Miles) 1.24
Total population 6,043 Density (Persons per Square Mile) 4,866
White alone 3,108 51.4%
Black or African American alone 2,618 43.3%
American Indian and Alaska Native alone
13 0.2% Population by Age
Total population 6,043
Asian alone 15 0.2% Under 5 years 255 4.2%
Native Hawaiian and Other Pacific Islander alone
1 0.0% 5 to 9 years 231 3.8%
10 to 14 years 301 5.0%
Some other race alone 164 2.7% 15 to 17 years 189 3.1%
Two or more races 124 2.1% 18 and 19 years 134 2.2%
20 years 75 1.2%
21 years 90 1.5%
Population by Hispanic or Latino Origin 22 to 24 years 317 5.2%
Total population 6,043 25 to 29 years 618 10.2%
Not Hispanic or Latino 5,867 97.1% 30 to 34 years 597 9.9%
Hispanic or Latino 176 2.9% 35 to 39 years 514 8.5%
40 to 44 years 490 8.1%
45 to 49 years 490 8.1%
Household Type 50 to 54 years 530 8.8%
Total households 1,827 55 to 59 years 402 6.7%
Family households: 1,037 56.8% 60 and 61 years 142 2.3%
Husband‐wife family 440 24.1% 62 to 64 years 155 2.6%
Other family: 597 32.7% 65 and 66 years 55 0.9%
Male householder, no wife present
109 6.0% 67 to 69 years 85 1.4%
70 to 74 years 112 1.9%
Female householder, no husband present
488 26.7% 75 to 79 years 109 1.8%
80 to 84 years 76 1.3%
Nonfamily households: 790 43.2% Age 85 and over 76 1.3%
Householder living alone 675 36.9%
Householder not living alone 115 6.3% Under age 18 976 16.2%
Age 65 and over 513 8.5%
Housing Occupancy Status Housing Vacancy Status Total housing units 2,253 Vacant housing units 426
Occupied 1,827 81.1% For rent 76 17.8%
Vacant 426 18.9% Rented, not occupied 4 0.9%
For sale only 38 8.9%
Sold, not occupied 10 2.3%
Housing Tenure For seasonal, recreational or occasional use
5 1.2% Total occupied housing units 1,827
Owned with a mortgage or a loan 689 37.7% For migrant workers 0 0.0%
Owned free and clear 412 22.6%
Renter‐occupied 726 39.7% Other Vacant 293 68.8%

City of Pittsburgh Neighborhood Profiles – Census 2010 Summary File 1 (SF1) Data
University Center for Social and Urban Research – University of Pittsburgh
57
Middle Hill Population by Race Area (Square Miles) 0.31
Total population 1,707 Density (Persons per Square Mile) 5,594
White alone 65 3.8%
Black or African American alone 1,610 94.3%
American Indian and Alaska Native alone
2 0.1% Population by Age
Total population 1,707
Asian alone 2 0.1% Under 5 years 74 4.3%
Native Hawaiian and Other Pacific Islander alone
0 0.0% 5 to 9 years 67 3.9%
10 to 14 years 90 5.3%
Some other race alone 1 0.1% 15 to 17 years 67 3.9%
Two or more races 27 1.6% 18 and 19 years 45 2.6%
20 years 16 0.9%
21 years 25 1.5%
Population by Hispanic or Latino Origin 22 to 24 years 62 3.6%
Total population 1,707 25 to 29 years 75 4.4%
Not Hispanic or Latino 1,692 99.1% 30 to 34 years 73 4.3%
Hispanic or Latino 15 0.9% 35 to 39 years 73 4.3%
40 to 44 years 102 6.0%
45 to 49 years 137 8.0%
Household Type 50 to 54 years 165 9.7%
Total households 920 55 to 59 years 137 8.0%
Family households: 380 41.3% 60 and 61 years 59 3.5%
Husband‐wife family 101 11.0% 62 to 64 years 73 4.3%
Other family: 279 30.3% 65 and 66 years 47 2.8%
Male householder, no wife present
27 2.9% 67 to 69 years 52 3.0%
70 to 74 years 85 5.0%
Female householder, no husband present
252 27.4% 75 to 79 years 65 3.8%
80 to 84 years 68 4.0%
Nonfamily households: 540 58.7% Age 85 and over 50 2.9%
Householder living alone 482 52.4%
Householder not living alone 58 6.3% Under age 18 298 17.5%
Age 65 and over 367 21.5%
Housing Occupancy Status Housing Vacancy Status Total housing units 1,120 Vacant housing units 200
Occupied 920 82.1% For rent 59 29.5%
Vacant 200 17.9% Rented, not occupied 14 7.0%
For sale only 17 8.5%
Sold, not occupied 4 2.0%
Housing Tenure For seasonal, recreational or occasional use
1 0.5% Total occupied housing units 920
Owned with a mortgage or a loan 142 15.4% For migrant workers 0 0.0%
Owned free and clear 137 14.9%
Renter‐occupied 641 69.7% Other Vacant 105 52.5%

City of Pittsburgh Neighborhood Profiles – Census 2010 Summary File 1 (SF1) Data
University Center for Social and Urban Research – University of Pittsburgh
58
Morningside Population by Race Area (Square Miles) 0.37
Total population 3,346 Density (Persons per Square Mile) 8,976
White alone 2,652 79.3%
Black or African American alone 552 16.5%
American Indian and Alaska Native alone
3 0.1% Population by Age
Total population 3,346
Asian alone 33 1.0% Under 5 years 200 6.0%
Native Hawaiian and Other Pacific Islander alone
2 0.1% 5 to 9 years 144 4.3%
10 to 14 years 140 4.2%
Some other race alone 24 0.7% 15 to 17 years 114 3.4%
Two or more races 80 2.4% 18 and 19 years 78 2.3%
20 years 46 1.4%
21 years 37 1.1%
Population by Hispanic or Latino Origin 22 to 24 years 149 4.5%
Total population 3,346 25 to 29 years 295 8.8%
Not Hispanic or Latino 3,294 98.4% 30 to 34 years 286 8.5%
Hispanic or Latino 52 1.6% 35 to 39 years 221 6.6%
40 to 44 years 228 6.8%
45 to 49 years 212 6.3%
Household Type 50 to 54 years 253 7.6%
Total households 1,526 55 to 59 years 224 6.7%
Family households: 882 57.8% 60 and 61 years 85 2.5%
Husband‐wife family 560 36.7% 62 to 64 years 121 3.6%
Other family: 322 21.1% 65 and 66 years 43 1.3%
Male householder, no wife present
52 3.4% 67 to 69 years 88 2.6%
70 to 74 years 130 3.9%
Female householder, no husband present
270 17.7% 75 to 79 years 95 2.8%
80 to 84 years 81 2.4%
Nonfamily households: 644 42.2% Age 85 and over 76 2.3%
Householder living alone 521 34.1%
Householder not living alone 123 8.1% Under age 18 598 17.9%
Age 65 and over 513 15.3%
Housing Occupancy Status Housing Vacancy Status Total housing units 1,643 Vacant housing units 117
Occupied 1,526 92.9% For rent 43 36.8%
Vacant 117 7.1% Rented, not occupied 1 0.9%
For sale only 15 12.8%
Sold, not occupied 4 3.4%
Housing Tenure For seasonal, recreational or occasional use
4 3.4% Total occupied housing units 1,526
Owned with a mortgage or a loan 661 43.3% For migrant workers 0 0.0%
Owned free and clear 331 21.7%
Renter‐occupied 534 35.0% Other Vacant 50 42.7%

City of Pittsburgh Neighborhood Profiles – Census 2010 Summary File 1 (SF1) Data
University Center for Social and Urban Research – University of Pittsburgh
59
Mount Washington
Population by Race Area (Square Miles) 1.15
Total population 8,799 Density (Persons per Square Mile) 7,638
White alone 7,561 85.9%
Black or African American alone 906 10.3%
American Indian and Alaska Native alone
12 0.1% Population by Age
Total population 8,799
Asian alone 63 0.7% Under 5 years 337 3.8%
Native Hawaiian and Other Pacific Islander alone
1 0.0% 5 to 9 years 256 2.9%
10 to 14 years 270 3.1%
Some other race alone 57 0.6% 15 to 17 years 190 2.2%
Two or more races 199 2.3% 18 and 19 years 187 2.1%
20 years 142 1.6%
21 years 214 2.4%
Population by Hispanic or Latino Origin 22 to 24 years 975 11.1%
Total population 8,799 25 to 29 years 1,312 14.9%
Not Hispanic or Latino 8,659 98.4% 30 to 34 years 704 8.0%
Hispanic or Latino 140 1.6% 35 to 39 years 430 4.9%
40 to 44 years 360 4.1%
45 to 49 years 539 6.1%
Household Type 50 to 54 years 622 7.1%
Total households 4,468 55 to 59 years 531 6.0%
Family households: 1,716 38.4% 60 and 61 years 197 2.2%
Husband‐wife family 1,017 22.8% 62 to 64 years 263 3.0%
Other family: 699 15.6% 65 and 66 years 148 1.7%
Male householder, no wife present
205 4.6% 67 to 69 years 205 2.3%
70 to 74 years 278 3.2%
Female householder, no husband present
494 11.1% 75 to 79 years 225 2.6%
80 to 84 years 243 2.8%
Nonfamily households: 2,752 61.6% Age 85 and over 171 1.9%
Householder living alone 1,911 42.8%
Householder not living alone 841 18.8% Under age 18 1,053 12.0%
Age 65 and over 1,270 14.4%
Housing Occupancy Status Housing Vacancy Status Total housing units 5,175 Vacant housing units 707
Occupied 4,468 86.3% For rent 270 38.2%
Vacant 707 13.7% Rented, not occupied 12 1.7%
For sale only 58 8.2%
Sold, not occupied 41 5.8%
Housing Tenure For seasonal, recreational or occasional use
50 7.1% Total occupied housing units 4,468
Owned with a mortgage or a loan 1,291 28.9% For migrant workers 0 0.0%
Owned free and clear 836 18.7%
Renter‐occupied 2,341 52.4% Other Vacant 276 39.0%

City of Pittsburgh Neighborhood Profiles – Census 2010 Summary File 1 (SF1) Data
University Center for Social and Urban Research – University of Pittsburgh
60
Mt. Oliver Population by Race Area (Square Miles) 0.10
Total population 509 Density (Persons per Square Mile) 4,913
White alone 296 58.2%
Black or African American alone 192 37.7%
American Indian and Alaska Native alone
5 1.0% Population by Age
Total population 509
Asian alone 2 0.4% Under 5 years 33 6.5%
Native Hawaiian and Other Pacific Islander alone
0 0.0% 5 to 9 years 39 7.7%
10 to 14 years 41 8.1%
Some other race alone 0 0.0% 15 to 17 years 20 3.9%
Two or more races 14 2.8% 18 and 19 years 15 2.9%
20 years 12 2.4%
21 years 7 1.4%
Population by Hispanic or Latino Origin 22 to 24 years 23 4.5%
Total population 509 25 to 29 years 33 6.5%
Not Hispanic or Latino 500 98.2% 30 to 34 years 36 7.1%
Hispanic or Latino 9 1.8% 35 to 39 years 27 5.3%
40 to 44 years 27 5.3%
45 to 49 years 32 6.3%
Household Type 50 to 54 years 44 8.6%
Total households 194 55 to 59 years 53 10.4%
Family households: 136 70.1% 60 and 61 years 6 1.2%
Husband‐wife family 61 31.4% 62 to 64 years 7 1.4%
Other family: 75 38.7% 65 and 66 years 12 2.4%
Male householder, no wife present
11 5.7% 67 to 69 years 10 2.0%
70 to 74 years 13 2.6%
Female householder, no husband present
64 33.0% 75 to 79 years 8 1.6%
80 to 84 years 6 1.2%
Nonfamily households: 58 29.9% Age 85 and over 5 1.0%
Householder living alone 45 23.2%
Householder not living alone 13 6.7% Under age 18 133 26.1%
Age 65 and over 54 10.6%
Housing Occupancy Status Housing Vacancy Status Total housing units 232 Vacant housing units 38
Occupied 194 83.6% For rent 4 10.5%
Vacant 38 16.4% Rented, not occupied 3 7.9%
For sale only 2 5.3%
Sold, not occupied 1 2.6%
Housing Tenure For seasonal, recreational or occasional use
1 2.6% Total occupied housing units 194
Owned with a mortgage or a loan 71 36.6% For migrant workers 0 0.0%
Owned free and clear 56 28.9%
Renter‐occupied 67 34.5% Other Vacant 27 71.1%

City of Pittsburgh Neighborhood Profiles – Census 2010 Summary File 1 (SF1) Data
University Center for Social and Urban Research – University of Pittsburgh
61
New Homestead Population by Race Area (Square Miles) 0.79
Total population 990 Density (Persons per Square Mile) 1,252
White alone 868 87.7%
Black or African American alone 88 8.9%
American Indian and Alaska Native alone
2 0.2% Population by Age
Total population 990
Asian alone 5 0.5% Under 5 years 51 5.2%
Native Hawaiian and Other Pacific Islander alone
0 0.0% 5 to 9 years 71 7.2%
10 to 14 years 53 5.4%
Some other race alone 4 0.4% 15 to 17 years 26 2.6%
Two or more races 23 2.3% 18 and 19 years 24 2.4%
20 years 6 0.6%
21 years 6 0.6%
Population by Hispanic or Latino Origin 22 to 24 years 35 3.5%
Total population 990 25 to 29 years 42 4.2%
Not Hispanic or Latino 973 98.3% 30 to 34 years 65 6.6%
Hispanic or Latino 17 1.7% 35 to 39 years 66 6.7%
40 to 44 years 55 5.6%
45 to 49 years 86 8.7%
Household Type 50 to 54 years 95 9.6%
Total households 403 55 to 59 years 77 7.8%
Family households: 285 70.7% 60 and 61 years 21 2.1%
Husband‐wife family 228 56.6% 62 to 64 years 30 3.0%
Other family: 57 14.1% 65 and 66 years 11 1.1%
Male householder, no wife present
19 4.7% 67 to 69 years 28 2.8%
70 to 74 years 50 5.1%
Female householder, no husband present
38 9.4% 75 to 79 years 46 4.6%
80 to 84 years 27 2.7%
Nonfamily households: 118 29.3% Age 85 and over 19 1.9%
Householder living alone 106 26.3%
Householder not living alone 12 3.0% Under age 18 201 20.3%
Age 65 and over 181 18.3%
Housing Occupancy Status Housing Vacancy Status Total housing units 429 Vacant housing units 26
Occupied 403 93.9% For rent 11 42.3%
Vacant 26 6.1% Rented, not occupied 1 3.8%
For sale only 0 0.0%
Sold, not occupied 1 3.8%
Housing Tenure For seasonal, recreational or occasional use
1 3.8% Total occupied housing units 403
Owned with a mortgage or a loan 216 53.6% For migrant workers 0 0.0%
Owned free and clear 150 37.2%
Renter‐occupied 37 9.2% Other Vacant 12 46.2%

City of Pittsburgh Neighborhood Profiles – Census 2010 Summary File 1 (SF1) Data
University Center for Social and Urban Research – University of Pittsburgh
62
North Oakland Population by Race Area (Square Miles) 0.50
Total population 10,551 Density (Persons per Square Mile) 21,150
White alone 7,698 73.0%
Black or African American alone 857 8.1%
American Indian and Alaska Native alone
20 0.2% Population by Age
Total population 10,551
Asian alone 1,607 15.2% Under 5 years 62 0.6%
Native Hawaiian and Other Pacific Islander alone
8 0.1% 5 to 9 years 43 0.4%
10 to 14 years 22 0.2%
Some other race alone 85 0.8% 15 to 17 years 22 0.2%
Two or more races 276 2.6% 18 and 19 years 3,516 33.3%
20 years 1,961 18.6%
21 years 1,041 9.9%
Population by Hispanic or Latino Origin 22 to 24 years 1,014 9.6%
Total population 10,551 25 to 29 years 645 6.1%
Not Hispanic or Latino 10,267 97.3% 30 to 34 years 266 2.5%
Hispanic or Latino 284 2.7% 35 to 39 years 127 1.2%
40 to 44 years 78 0.7%
45 to 49 years 111 1.1%
Household Type 50 to 54 years 133 1.3%
Total households 3,554 55 to 59 years 192 1.8%
Family households: 581 16.3% 60 and 61 years 85 0.8%
Husband‐wife family 454 12.8% 62 to 64 years 98 0.9%
Other family: 127 3.6% 65 and 66 years 80 0.8%
Male householder, no wife present
47 1.3% 67 to 69 years 111 1.1%
70 to 74 years 189 1.8%
Female householder, no husband present
80 2.3% 75 to 79 years 211 2.0%
80 to 84 years 235 2.2%
Nonfamily households: 2,973 83.7% Age 85 and over 309 2.9%
Householder living alone 2,037 57.3%
Householder not living alone 936 26.3% Under age 18 149 1.4%
Age 65 and over 1,135 10.8%
Housing Occupancy Status Housing Vacancy Status Total housing units 3,761 Vacant housing units 207
Occupied 3,554 94.5% For rent 71 34.3%
Vacant 207 5.5% Rented, not occupied 6 2.9%
For sale only 58 28.0%
Sold, not occupied 12 5.8%
Housing Tenure For seasonal, recreational or occasional use
28 13.5% Total occupied housing units 3,554
Owned with a mortgage or a loan 290 8.2% For migrant workers 0 0.0%
Owned free and clear 592 16.7%
Renter‐occupied 2,672 75.2% Other Vacant 32 15.5%
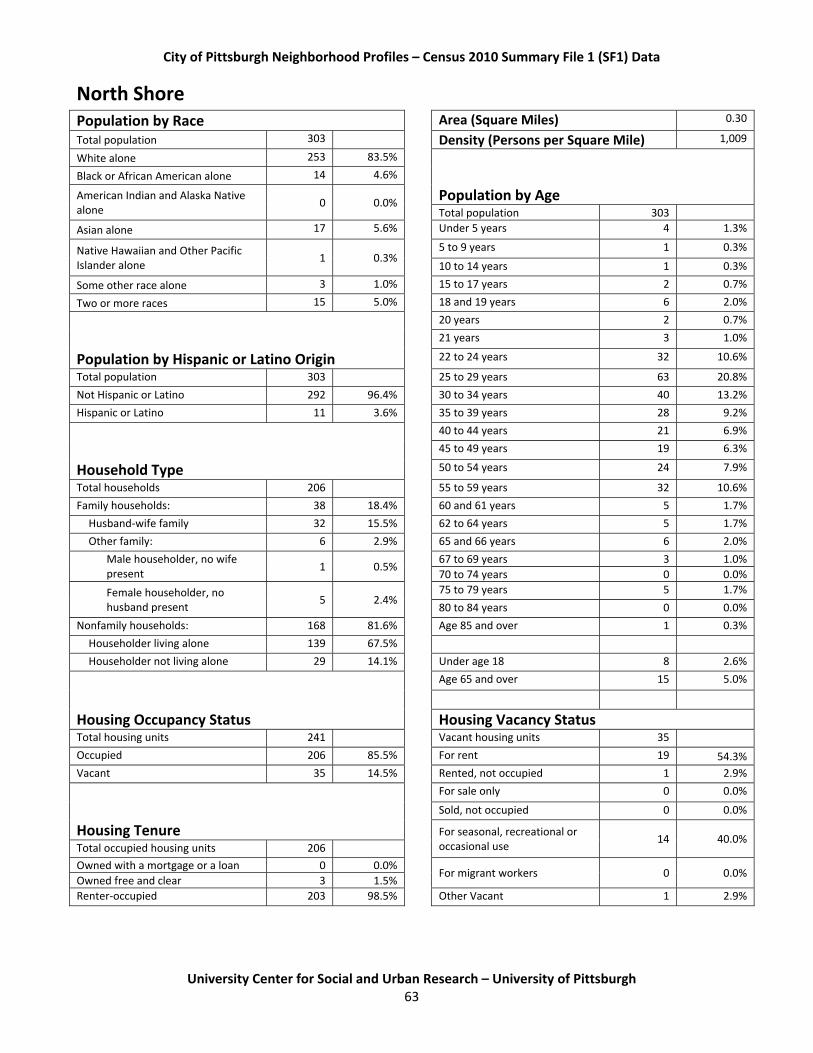
City of Pittsburgh Neighborhood Profiles – Census 2010 Summary File 1 (SF1) Data
University Center for Social and Urban Research – University of Pittsburgh
63
North Shore Population by Race Area (Square Miles) 0.30
Total population 303 Density (Persons per Square Mile) 1,009
White alone 253 83.5%
Black or African American alone 14 4.6%
American Indian and Alaska Native alone
0 0.0% Population by Age
Total population 303
Asian alone 17 5.6% Under 5 years 4 1.3%
Native Hawaiian and Other Pacific Islander alone
1 0.3% 5 to 9 years 1 0.3%
10 to 14 years 1 0.3%
Some other race alone 3 1.0% 15 to 17 years 2 0.7%
Two or more races 15 5.0% 18 and 19 years 6 2.0%
20 years 2 0.7%
21 years 3 1.0%
Population by Hispanic or Latino Origin 22 to 24 years 32 10.6%
Total population 303 25 to 29 years 63 20.8%
Not Hispanic or Latino 292 96.4% 30 to 34 years 40 13.2%
Hispanic or Latino 11 3.6% 35 to 39 years 28 9.2%
40 to 44 years 21 6.9%
45 to 49 years 19 6.3%
Household Type 50 to 54 years 24 7.9%
Total households 206 55 to 59 years 32 10.6%
Family households: 38 18.4% 60 and 61 years 5 1.7%
Husband‐wife family 32 15.5% 62 to 64 years 5 1.7%
Other family: 6 2.9% 65 and 66 years 6 2.0%
Male householder, no wife present
1 0.5% 67 to 69 years 3 1.0%
70 to 74 years 0 0.0%
Female householder, no husband present
5 2.4% 75 to 79 years 5 1.7%
80 to 84 years 0 0.0%
Nonfamily households: 168 81.6% Age 85 and over 1 0.3%
Householder living alone 139 67.5%
Householder not living alone 29 14.1% Under age 18 8 2.6%
Age 65 and over 15 5.0%
Housing Occupancy Status Housing Vacancy Status Total housing units 241 Vacant housing units 35
Occupied 206 85.5% For rent 19 54.3%
Vacant 35 14.5% Rented, not occupied 1 2.9%
For sale only 0 0.0%
Sold, not occupied 0 0.0%
Housing Tenure For seasonal, recreational or occasional use
14 40.0% Total occupied housing units 206
Owned with a mortgage or a loan 0 0.0% For migrant workers 0 0.0%
Owned free and clear 3 1.5%
Renter‐occupied 203 98.5% Other Vacant 1 2.9%

City of Pittsburgh Neighborhood Profiles – Census 2010 Summary File 1 (SF1) Data
University Center for Social and Urban Research – University of Pittsburgh
64
Northview Heights Population by Race Area (Square Miles) 0.31
Total population 1,214 Density (Persons per Square Mile) 3,872
White alone 57 4.7%
Black or African American alone 1,099 90.5%
American Indian and Alaska Native alone
2 0.2% Population by Age
Total population 1,214
Asian alone 1 0.1% Under 5 years 159 13.1%
Native Hawaiian and Other Pacific Islander alone
0 0.0% 5 to 9 years 166 13.7%
10 to 14 years 114 9.4%
Some other race alone 3 0.2% 15 to 17 years 76 6.3%
Two or more races 52 4.3% 18 and 19 years 56 4.6%
20 years 22 1.8%
21 years 15 1.2%
Population by Hispanic or Latino Origin 22 to 24 years 42 3.5%
Total population 1,214 25 to 29 years 92 7.6%
Not Hispanic or Latino 1,189 97.9% 30 to 34 years 51 4.2%
Hispanic or Latino 25 2.1% 35 to 39 years 38 3.1%
40 to 44 years 53 4.4%
45 to 49 years 50 4.1%
Household Type 50 to 54 years 48 4.0%
Total households 460 55 to 59 years 34 2.8%
Family households: 283 61.5% 60 and 61 years 20 1.6%
Husband‐wife family 32 7.0% 62 to 64 years 20 1.6%
Other family: 251 54.6% 65 and 66 years 10 0.8%
Male householder, no wife present
14 3.0% 67 to 69 years 37 3.0%
70 to 74 years 33 2.7%
Female householder, no husband present
237 51.5% 75 to 79 years 22 1.8%
80 to 84 years 30 2.5%
Nonfamily households: 177 38.5% Age 85 and over 26 2.1%
Householder living alone 168 36.5%
Householder not living alone 9 2.0% Under age 18 515 42.4%
Age 65 and over 158 13.0%
Housing Occupancy Status Housing Vacancy Status Total housing units 723 Vacant housing units 263
Occupied 460 63.6% For rent 127 48.3%
Vacant 263 36.4% Rented, not occupied 0 0.0%
For sale only 0 0.0%
Sold, not occupied 0 0.0%
Housing Tenure For seasonal, recreational or occasional use
2 0.8% Total occupied housing units 460
Owned with a mortgage or a loan 9 2.0% For migrant workers 0 0.0%
Owned free and clear 8 1.7%
Renter‐occupied 443 96.3% Other Vacant 134 51.0%

City of Pittsburgh Neighborhood Profiles – Census 2010 Summary File 1 (SF1) Data
University Center for Social and Urban Research – University of Pittsburgh
65
Oakwood Population by Race Area (Square Miles) 0.25
Total population 1,027 Density (Persons per Square Mile) 4,069
White alone 927 90.3%
Black or African American alone 60 5.8%
American Indian and Alaska Native alone
2 0.2% Population by Age
Total population 1,027
Asian alone 11 1.1% Under 5 years 46 4.5%
Native Hawaiian and Other Pacific Islander alone
0 0.0% 5 to 9 years 41 4.0%
10 to 14 years 35 3.4%
Some other race alone 7 0.7% 15 to 17 years 39 3.8%
Two or more races 20 1.9% 18 and 19 years 14 1.4%
20 years 5 0.5%
21 years 9 0.9%
Population by Hispanic or Latino Origin 22 to 24 years 50 4.9%
Total population 1,027 25 to 29 years 98 9.5%
Not Hispanic or Latino 1,016 98.9% 30 to 34 years 78 7.6%
Hispanic or Latino 11 1.1% 35 to 39 years 51 5.0%
40 to 44 years 67 6.5%
45 to 49 years 64 6.2%
Household Type 50 to 54 years 70 6.8%
Total households 545 55 to 59 years 62 6.0%
Family households: 230 42.2% 60 and 61 years 27 2.6%
Husband‐wife family 176 32.3% 62 to 64 years 48 4.7%
Other family: 54 9.9% 65 and 66 years 14 1.4%
Male householder, no wife present
14 2.6% 67 to 69 years 30 2.9%
70 to 74 years 50 4.9%
Female householder, no husband present
40 7.3% 75 to 79 years 49 4.8%
80 to 84 years 34 3.3%
Nonfamily households: 315 57.8% Age 85 and over 46 4.5%
Householder living alone 267 49.0%
Householder not living alone 48 8.8% Under age 18 161 15.7%
Age 65 and over 223 21.7%
Housing Occupancy Status Housing Vacancy Status Total housing units 571 Vacant housing units 26
Occupied 545 95.4% For rent 6 23.1%
Vacant 26 4.6% Rented, not occupied 2 7.7%
For sale only 2 7.7%
Sold, not occupied 0 0.0%
Housing Tenure For seasonal, recreational or occasional use
3 11.5% Total occupied housing units 545
Owned with a mortgage or a loan 175 32.1% For migrant workers 0 0.0%
Owned free and clear 86 15.8%
Renter‐occupied 284 52.1% Other Vacant 13 50.0%

City of Pittsburgh Neighborhood Profiles – Census 2010 Summary File 1 (SF1) Data
University Center for Social and Urban Research – University of Pittsburgh
66
Overbrook Population by Race Area (Square Miles) 0.84
Total population 3,644 Density (Persons per Square Mile) 4,352
White alone 3,423 93.9%
Black or African American alone 129 3.5%
American Indian and Alaska Native alone
1 0.0% Population by Age
Total population 3,644
Asian alone 33 0.9% Under 5 years 183 5.0%
Native Hawaiian and Other Pacific Islander alone
0 0.0% 5 to 9 years 151 4.1%
10 to 14 years 171 4.7%
Some other race alone 9 0.2% 15 to 17 years 116 3.2%
Two or more races 49 1.3% 18 and 19 years 67 1.8%
20 years 34 0.9%
21 years 37 1.0%
Population by Hispanic or Latino Origin 22 to 24 years 117 3.2%
Total population 3,644 25 to 29 years 273 7.5%
Not Hispanic or Latino 3,605 98.9% 30 to 34 years 255 7.0%
Hispanic or Latino 39 1.1% 35 to 39 years 219 6.0%
40 to 44 years 215 5.9%
45 to 49 years 250 6.9%
Household Type 50 to 54 years 313 8.6%
Total households 1,585 55 to 59 years 321 8.8%
Family households: 973 61.4% 60 and 61 years 87 2.4%
Husband‐wife family 722 45.6% 62 to 64 years 129 3.5%
Other family: 251 15.8% 65 and 66 years 66 1.8%
Male householder, no wife present
86 5.4% 67 to 69 years 109 3.0%
70 to 74 years 119 3.3%
Female householder, no husband present
165 10.4% 75 to 79 years 146 4.0%
80 to 84 years 124 3.4%
Nonfamily households: 612 38.6% Age 85 and over 142 3.9%
Householder living alone 510 32.2%
Householder not living alone 102 6.4% Under age 18 621 17.0%
Age 65 and over 706 19.4%
Housing Occupancy Status Housing Vacancy Status Total housing units 1,706 Vacant housing units 121
Occupied 1,585 92.9% For rent 23 19.0%
Vacant 121 7.1% Rented, not occupied 5 4.1%
For sale only 30 24.8%
Sold, not occupied 13 10.7%
Housing Tenure For seasonal, recreational or occasional use
6 5.0% Total occupied housing units 1,585
Owned with a mortgage or a loan 806 50.9% For migrant workers 0 0.0%
Owned free and clear 476 30.0%
Renter‐occupied 303 19.1% Other Vacant 44 36.4%

City of Pittsburgh Neighborhood Profiles – Census 2010 Summary File 1 (SF1) Data
University Center for Social and Urban Research – University of Pittsburgh
67
Perry North Population by Race Area (Square Miles) 1.24
Total population 4,050 Density (Persons per Square Mile) 3,269
White alone 2,538 62.7%
Black or African American alone 1,310 32.3%
American Indian and Alaska Native alone
6 0.1% Population by Age
Total population 4,050
Asian alone 36 0.9% Under 5 years 265 6.5%
Native Hawaiian and Other Pacific Islander alone
0 0.0% 5 to 9 years 234 5.8%
10 to 14 years 239 5.9%
Some other race alone 33 0.8% 15 to 17 years 158 3.9%
Two or more races 127 3.1% 18 and 19 years 115 2.8%
20 years 49 1.2%
21 years 48 1.2%
Population by Hispanic or Latino Origin 22 to 24 years 157 3.9%
Total population 4,050 25 to 29 years 339 8.4%
Not Hispanic or Latino 3,979 98.2% 30 to 34 years 303 7.5%
Hispanic or Latino 71 1.8% 35 to 39 years 266 6.6%
40 to 44 years 258 6.4%
45 to 49 years 285 7.0%
Household Type 50 to 54 years 354 8.7%
Total households 1,679 55 to 59 years 306 7.6%
Family households: 990 59.0% 60 and 61 years 105 2.6%
Husband‐wife family 592 35.3% 62 to 64 years 108 2.7%
Other family: 398 23.7% 65 and 66 years 64 1.6%
Male householder, no wife present
96 5.7% 67 to 69 years 86 2.1%
70 to 74 years 84 2.1%
Female householder, no husband present
302 18.0% 75 to 79 years 84 2.1%
80 to 84 years 72 1.8%
Nonfamily households: 689 41.0% Age 85 and over 71 1.8%
Householder living alone 522 31.1%
Householder not living alone 167 9.9% Under age 18 896 22.1%
Age 65 and over 461 11.4%
Housing Occupancy Status Housing Vacancy Status Total housing units 1,929 Vacant housing units 250
Occupied 1,679 87.0% For rent 61 24.4%
Vacant 250 13.0% Rented, not occupied 1 0.4%
For sale only 37 14.8%
Sold, not occupied 12 4.8%
Housing Tenure For seasonal, recreational or occasional use
5 2.0% Total occupied housing units 1,679
Owned with a mortgage or a loan 750 44.7% For migrant workers 0 0.0%
Owned free and clear 338 20.1%
Renter‐occupied 591 35.2% Other Vacant 134 53.6%

City of Pittsburgh Neighborhood Profiles – Census 2010 Summary File 1 (SF1) Data
University Center for Social and Urban Research – University of Pittsburgh
68
Perry South Population by Race Area (Square Miles) 0.92
Total population 4,145 Density (Persons per Square Mile) 4,523
White alone 1,100 26.5%
Black or African American alone 2,849 68.7%
American Indian and Alaska Native alone
19 0.5% Population by Age
Total population 4,145
Asian alone 21 0.5% Under 5 years 310 7.5%
Native Hawaiian and Other Pacific Islander alone
8 0.2% 5 to 9 years 251 6.1%
10 to 14 years 298 7.2%
Some other race alone 25 0.6% 15 to 17 years 209 5.0%
Two or more races 123 3.0% 18 and 19 years 117 2.8%
20 years 50 1.2%
21 years 47 1.1%
Population by Hispanic or Latino Origin 22 to 24 years 174 4.2%
Total population 4,145 25 to 29 years 273 6.6%
Not Hispanic or Latino 4,101 98.9% 30 to 34 years 221 5.3%
Hispanic or Latino 44 1.1% 35 to 39 years 215 5.2%
40 to 44 years 228 5.5%
45 to 49 years 288 6.9%
Household Type 50 to 54 years 315 7.6%
Total households 1,806 55 to 59 years 298 7.2%
Family households: 924 51.2% 60 and 61 years 123 3.0%
Husband‐wife family 355 19.7% 62 to 64 years 117 2.8%
Other family: 569 31.5% 65 and 66 years 71 1.7%
Male householder, no wife present
102 5.6% 67 to 69 years 95 2.3%
70 to 74 years 122 2.9%
Female householder, no husband present
467 25.9% 75 to 79 years 95 2.3%
80 to 84 years 108 2.6%
Nonfamily households: 882 48.8% Age 85 and over 120 2.9%
Householder living alone 745 41.3%
Householder not living alone 137 7.6% Under age 18 1,068 25.8%
Age 65 and over 611 14.7%
Housing Occupancy Status Housing Vacancy Status Total housing units 2,361 Vacant housing units 555
Occupied 1,806 76.5% For rent 150 27.0%
Vacant 555 23.5% Rented, not occupied 10 1.8%
For sale only 30 5.4%
Sold, not occupied 21 3.8%
Housing Tenure For seasonal, recreational or occasional use
4 0.7% Total occupied housing units 1,806
Owned with a mortgage or a loan 540 29.9% For migrant workers 0 0.0%
Owned free and clear 295 16.3%
Renter‐occupied 971 53.8% Other Vacant 340 61.3%

City of Pittsburgh Neighborhood Profiles – Census 2010 Summary File 1 (SF1) Data
University Center for Social and Urban Research – University of Pittsburgh
69
Point Breeze Population by Race Area (Square Miles) 1.00
Total population 5,315 Density (Persons per Square Mile) 5,296
White alone 4,737 89.1%
Black or African American alone 247 4.6%
American Indian and Alaska Native alone
9 0.2% Population by Age
Total population 5,315
Asian alone 178 3.3% Under 5 years 324 6.1%
Native Hawaiian and Other Pacific Islander alone
2 0.0% 5 to 9 years 288 5.4%
10 to 14 years 294 5.5%
Some other race alone 38 0.7% 15 to 17 years 168 3.2%
Two or more races 104 2.0% 18 and 19 years 67 1.3%
20 years 21 0.4%
21 years 32 0.6%
Population by Hispanic or Latino Origin 22 to 24 years 181 3.4%
Total population 5,315 25 to 29 years 394 7.4%
Not Hispanic or Latino 5,178 97.4% 30 to 34 years 373 7.0%
Hispanic or Latino 137 2.6% 35 to 39 years 399 7.5%
40 to 44 years 375 7.1%
45 to 49 years 360 6.8%
Household Type 50 to 54 years 439 8.3%
Total households 2,362 55 to 59 years 439 8.3%
Family households: 1,404 59.4% 60 and 61 years 180 3.4%
Husband‐wife family 1,171 49.6% 62 to 64 years 231 4.3%
Other family: 233 9.9% 65 and 66 years 114 2.1%
Male householder, no wife present
60 2.5% 67 to 69 years 124 2.3%
70 to 74 years 167 3.1%
Female householder, no husband present
173 7.3% 75 to 79 years 121 2.3%
80 to 84 years 116 2.2%
Nonfamily households: 958 40.6% Age 85 and over 108 2.0%
Householder living alone 709 30.0%
Householder not living alone 249 10.5% Under age 18 1,074 20.2%
Age 65 and over 750 14.1%
Housing Occupancy Status Housing Vacancy Status Total housing units 2,483 Vacant housing units 121
Occupied 2,362 95.1% For rent 39 32.2%
Vacant 121 4.9% Rented, not occupied 5 4.1%
For sale only 12 9.9%
Sold, not occupied 12 9.9%
Housing Tenure For seasonal, recreational or occasional use
17 14.0% Total occupied housing units 2,362
Owned with a mortgage or a loan 1,137 48.1% For migrant workers 0 0.0%
Owned free and clear 554 23.5%
Renter‐occupied 671 28.4% Other Vacant 36 29.8%

City of Pittsburgh Neighborhood Profiles – Census 2010 Summary File 1 (SF1) Data
University Center for Social and Urban Research – University of Pittsburgh
70
Point Breeze North Population by Race Area (Square Miles) 0.29
Total population 2,054 Density (Persons per Square Mile) 7,040
White alone 721 35.1%
Black or African American alone 1,137 55.4%
American Indian and Alaska Native alone
7 0.3% Population by Age
Total population 2,054
Asian alone 64 3.1% Under 5 years 101 4.9%
Native Hawaiian and Other Pacific Islander alone
0 0.0% 5 to 9 years 73 3.6%
10 to 14 years 96 4.7%
Some other race alone 23 1.1% 15 to 17 years 60 2.9%
Two or more races 102 5.0% 18 and 19 years 40 1.9%
20 years 19 0.9%
21 years 31 1.5%
Population by Hispanic or Latino Origin 22 to 24 years 117 5.7%
Total population 2,054 25 to 29 years 247 12.0%
Not Hispanic or Latino 1,985 96.6% 30 to 34 years 162 7.9%
Hispanic or Latino 69 3.4% 35 to 39 years 115 5.6%
40 to 44 years 115 5.6%
45 to 49 years 128 6.2%
Household Type 50 to 54 years 167 8.1%
Total households 1,039 55 to 59 years 160 7.8%
Family households: 458 44.1% 60 and 61 years 68 3.3%
Husband‐wife family 216 20.8% 62 to 64 years 73 3.6%
Other family: 242 23.3% 65 and 66 years 48 2.3%
Male householder, no wife present
46 4.4% 67 to 69 years 50 2.4%
70 to 74 years 69 3.4%
Female householder, no husband present
196 18.9% 75 to 79 years 48 2.3%
80 to 84 years 39 1.9%
Nonfamily households: 581 55.9% Age 85 and over 28 1.4%
Householder living alone 461 44.4%
Householder not living alone 120 11.5% Under age 18 330 16.1%
Age 65 and over 282 13.7%
Housing Occupancy Status Housing Vacancy Status Total housing units 1,167 Vacant housing units 128
Occupied 1,039 89.0% For rent 68 53.1%
Vacant 128 11.0% Rented, not occupied 1 0.8%
For sale only 4 3.1%
Sold, not occupied 5 3.9%
Housing Tenure For seasonal, recreational or occasional use
2 1.6% Total occupied housing units 1,039
Owned with a mortgage or a loan 259 24.9% For migrant workers 0 0.0%
Owned free and clear 110 10.6%
Renter‐occupied 670 64.5% Other Vacant 48 37.5%

City of Pittsburgh Neighborhood Profiles – Census 2010 Summary File 1 (SF1) Data
University Center for Social and Urban Research – University of Pittsburgh
71
Polish Hill Population by Race Area (Square Miles) 0.25
Total population 1,274 Density (Persons per Square Mile) 5,018
White alone 1,056 82.9%
Black or African American alone 155 12.2%
American Indian and Alaska Native alone
2 0.2% Population by Age
Total population 1,274
Asian alone 16 1.3% Under 5 years 55 4.3%
Native Hawaiian and Other Pacific Islander alone
0 0.0% 5 to 9 years 45 3.5%
10 to 14 years 27 2.1%
Some other race alone 7 0.5% 15 to 17 years 28 2.2%
Two or more races 38 3.0% 18 and 19 years 11 0.9%
20 years 11 0.9%
21 years 15 1.2%
Population by Hispanic or Latino Origin 22 to 24 years 83 6.5%
Total population 1,274 25 to 29 years 147 11.5%
Not Hispanic or Latino 1,246 97.8% 30 to 34 years 141 11.1%
Hispanic or Latino 28 2.2% 35 to 39 years 76 6.0%
40 to 44 years 84 6.6%
45 to 49 years 93 7.3%
Household Type 50 to 54 years 84 6.6%
Total households 697 55 to 59 years 102 8.0%
Family households: 268 38.5% 60 and 61 years 35 2.7%
Husband‐wife family 153 22.0% 62 to 64 years 33 2.6%
Other family: 115 16.5% 65 and 66 years 11 0.9%
Male householder, no wife present
30 4.3% 67 to 69 years 32 2.5%
70 to 74 years 50 3.9%
Female householder, no husband present
85 12.2% 75 to 79 years 23 1.8%
80 to 84 years 50 3.9%
Nonfamily households: 429 61.5% Age 85 and over 38 3.0%
Householder living alone 331 47.5%
Householder not living alone 98 14.1% Under age 18 155 12.2%
Age 65 and over 204 16.0%
Housing Occupancy Status Housing Vacancy Status Total housing units 849 Vacant housing units 152
Occupied 697 82.1% For rent 44 28.9%
Vacant 152 17.9% Rented, not occupied 3 2.0%
For sale only 13 8.6%
Sold, not occupied 16 10.5%
Housing Tenure For seasonal, recreational or occasional use
3 2.0% Total occupied housing units 697
Owned with a mortgage or a loan 181 26.0% For migrant workers 0 0.0%
Owned free and clear 168 24.1%
Renter‐occupied 348 49.9% Other Vacant 73 48.0%

City of Pittsburgh Neighborhood Profiles – Census 2010 Summary File 1 (SF1) Data
University Center for Social and Urban Research – University of Pittsburgh
72
Regent Square Population by Race Area (Square Miles) 0.20
Total population 928 Density (Persons per Square Mile) 4,732
White alone 857 92.3%
Black or African American alone 17 1.8%
American Indian and Alaska Native alone
1 0.1% Population by Age
Total population 928
Asian alone 29 3.1% Under 5 years 58 6.3%
Native Hawaiian and Other Pacific Islander alone
1 0.1% 5 to 9 years 42 4.5%
10 to 14 years 33 3.6%
Some other race alone 7 0.8% 15 to 17 years 18 1.9%
Two or more races 16 1.7% 18 and 19 years 8 0.9%
20 years 4 0.4%
21 years 3 0.3%
Population by Hispanic or Latino Origin 22 to 24 years 40 4.3%
Total population 928 25 to 29 years 81 8.7%
Not Hispanic or Latino 905 97.5% 30 to 34 years 85 9.2%
Hispanic or Latino 23 2.5% 35 to 39 years 66 7.1%
40 to 44 years 67 7.2%
45 to 49 years 68 7.3%
Household Type 50 to 54 years 54 5.8%
Total households 456 55 to 59 years 91 9.8%
Family households: 239 52.4% 60 and 61 years 24 2.6%
Husband‐wife family 202 44.3% 62 to 64 years 50 5.4%
Other family: 37 8.1% 65 and 66 years 18 1.9%
Male householder, no wife present
11 2.4% 67 to 69 years 28 3.0%
70 to 74 years 33 3.6%
Female householder, no husband present
26 5.7% 75 to 79 years 27 2.9%
80 to 84 years 15 1.6%
Nonfamily households: 217 47.6% Age 85 and over 15 1.6%
Householder living alone 169 37.1%
Householder not living alone 48 10.5% Under age 18 151 16.3%
Age 65 and over 136 14.7%
Housing Occupancy Status Housing Vacancy Status Total housing units 479 Vacant housing units 23
Occupied 456 95.2% For rent 7 30.4%
Vacant 23 4.8% Rented, not occupied 0 0.0%
For sale only 3 13.0%
Sold, not occupied 4 17.4%
Housing Tenure For seasonal, recreational or occasional use
2 8.7% Total occupied housing units 456
Owned with a mortgage or a loan 217 47.6% For migrant workers 0 0.0%
Owned free and clear 109 23.9%
Renter‐occupied 130 28.5% Other Vacant 7 30.4%

City of Pittsburgh Neighborhood Profiles – Census 2010 Summary File 1 (SF1) Data
University Center for Social and Urban Research – University of Pittsburgh
73
Ridgemont Population by Race Area (Square Miles) 0.36
Total population 483 Density (Persons per Square Mile) 1,347
White alone 442 91.5%
Black or African American alone 31 6.4%
American Indian and Alaska Native alone
0 0.0% Population by Age
Total population 483
Asian alone 6 1.2% Under 5 years 35 7.2%
Native Hawaiian and Other Pacific Islander alone
0 0.0% 5 to 9 years 15 3.1%
10 to 14 years 27 5.6%
Some other race alone 4 0.8% 15 to 17 years 15 3.1%
Two or more races 0 0.0% 18 and 19 years 7 1.4%
20 years 7 1.4%
21 years 5 1.0%
Population by Hispanic or Latino Origin 22 to 24 years 20 4.1%
Total population 483 25 to 29 years 39 8.1%
Not Hispanic or Latino 476 98.6% 30 to 34 years 29 6.0%
Hispanic or Latino 7 1.4% 35 to 39 years 22 4.6%
40 to 44 years 33 6.8%
45 to 49 years 32 6.6%
Household Type 50 to 54 years 46 9.5%
Total households 209 55 to 59 years 42 8.7%
Family households: 133 63.6% 60 and 61 years 10 2.1%
Husband‐wife family 92 44.0% 62 to 64 years 19 3.9%
Other family: 41 19.6% 65 and 66 years 5 1.0%
Male householder, no wife present
12 5.7% 67 to 69 years 13 2.7%
70 to 74 years 13 2.7%
Female householder, no husband present
29 13.9% 75 to 79 years 22 4.6%
80 to 84 years 19 3.9%
Nonfamily households: 76 36.4% Age 85 and over 8 1.7%
Householder living alone 62 29.7%
Householder not living alone 14 6.7% Under age 18 92 19.0%
Age 65 and over 80 16.6%
Housing Occupancy Status Housing Vacancy Status Total housing units 218 Vacant housing units 9
Occupied 209 95.9% For rent 0 0.0%
Vacant 9 4.1% Rented, not occupied 0 0.0%
For sale only 3 33.3%
Sold, not occupied 0 0.0%
Housing Tenure For seasonal, recreational or occasional use
1 11.1% Total occupied housing units 209
Owned with a mortgage or a loan 120 57.4% For migrant workers 0 0.0%
Owned free and clear 67 32.1%
Renter‐occupied 22 10.5% Other Vacant 5 55.6%

City of Pittsburgh Neighborhood Profiles – Census 2010 Summary File 1 (SF1) Data
University Center for Social and Urban Research – University of Pittsburgh
74
Shadyside Population by Race Area (Square Miles) 0.92
Total population 13,915 Density (Persons per Square Mile) 15,103
White alone 10,005 71.9%
Black or African American alone 751 5.4%
American Indian and Alaska Native alone
12 0.1% Population by Age
Total population 13,915
Asian alone 2,764 19.9% Under 5 years 427 3.1%
Native Hawaiian and Other Pacific Islander alone
7 0.1% 5 to 9 years 240 1.7%
10 to 14 years 163 1.2%
Some other race alone 108 0.8% 15 to 17 years 80 0.6%
Two or more races 268 1.9% 18 and 19 years 223 1.6%
20 years 398 2.9%
21 years 470 3.4%
Population by Hispanic or Latino Origin 22 to 24 years 2,446 17.6%
Total population 13,915 25 to 29 years 3,200 23.0%
Not Hispanic or Latino 13,457 96.7% 30 to 34 years 1,650 11.9%
Hispanic or Latino 458 3.3% 35 to 39 years 759 5.5%
40 to 44 years 486 3.5%
45 to 49 years 432 3.1%
Household Type 50 to 54 years 444 3.2%
Total households 8,037 55 to 59 years 520 3.7%
Family households: 1,915 23.8% 60 and 61 years 207 1.5%
Husband‐wife family 1,619 20.1% 62 to 64 years 301 2.2%
Other family: 296 3.7% 65 and 66 years 145 1.0%
Male householder, no wife present
115 1.4% 67 to 69 years 203 1.5%
70 to 74 years 300 2.2%
Female householder, no husband present
181 2.3% 75 to 79 years 263 1.9%
80 to 84 years 257 1.8%
Nonfamily households: 6,122 76.2% Age 85 and over 301 2.2%
Householder living alone 4,447 55.3%
Householder not living alone 1,675 20.8% Under age 18 910 6.5%
Age 65 and over 1,469 10.6%
Housing Occupancy Status Housing Vacancy Status Total housing units 8,610 Vacant housing units 573
Occupied 8,037 93.3% For rent 225 39.3%
Vacant 573 6.7% Rented, not occupied 21 3.7%
For sale only 87 15.2%
Sold, not occupied 23 4.0%
Housing Tenure For seasonal, recreational or occasional use
106 18.5% Total occupied housing units 8,037
Owned with a mortgage or a loan 1,322 16.4% For migrant workers 0 0.0%
Owned free and clear 764 9.5%
Renter‐occupied 5,951 74.0% Other Vacant 111 19.4%

City of Pittsburgh Neighborhood Profiles – Census 2010 Summary File 1 (SF1) Data
University Center for Social and Urban Research – University of Pittsburgh
75
Sheraden Population by Race Area (Square Miles) 0.89
Total population 5,299 Density (Persons per Square Mile) 5,946
White alone 2,695 50.9%
Black or African American alone 2,186 41.3%
American Indian and Alaska Native alone
11 0.2% Population by Age
Total population 5,299
Asian alone 128 2.4% Under 5 years 367 6.9%
Native Hawaiian and Other Pacific Islander alone
0 0.0% 5 to 9 years 351 6.6%
10 to 14 years 397 7.5%
Some other race alone 30 0.6% 15 to 17 years 257 4.8%
Two or more races 249 4.7% 18 and 19 years 162 3.1%
20 years 83 1.6%
21 years 82 1.5%
Population by Hispanic or Latino Origin 22 to 24 years 220 4.2%
Total population 5,299 25 to 29 years 344 6.5%
Not Hispanic or Latino 5,215 98.4% 30 to 34 years 314 5.9%
Hispanic or Latino 84 1.6% 35 to 39 years 319 6.0%
40 to 44 years 325 6.1%
45 to 49 years 394 7.4%
Household Type 50 to 54 years 436 8.2%
Total households 2,132 55 to 59 years 344 6.5%
Family households: 1,336 62.7% 60 and 61 years 115 2.2%
Husband‐wife family 643 30.2% 62 to 64 years 152 2.9%
Other family: 693 32.5% 65 and 66 years 73 1.4%
Male householder, no wife present
123 5.8% 67 to 69 years 99 1.9%
70 to 74 years 170 3.2%
Female householder, no husband present
570 26.7% 75 to 79 years 126 2.4%
80 to 84 years 104 2.0%
Nonfamily households: 796 37.3% Age 85 and over 65 1.2%
Householder living alone 675 31.7%
Householder not living alone 121 5.7% Under age 18 1,372 25.9%
Age 65 and over 637 12.0%
Housing Occupancy Status Housing Vacancy Status Total housing units 2,509 Vacant housing units 377
Occupied 2,132 85.0% For rent 74 19.6%
Vacant 377 15.0% Rented, not occupied 13 3.4%
For sale only 45 11.9%
Sold, not occupied 10 2.7%
Housing Tenure For seasonal, recreational or occasional use
6 1.6% Total occupied housing units 2,132
Owned with a mortgage or a loan 796 37.3% For migrant workers 0 0.0%
Owned free and clear 457 21.4%
Renter‐occupied 879 41.2% Other Vacant 229 60.7%
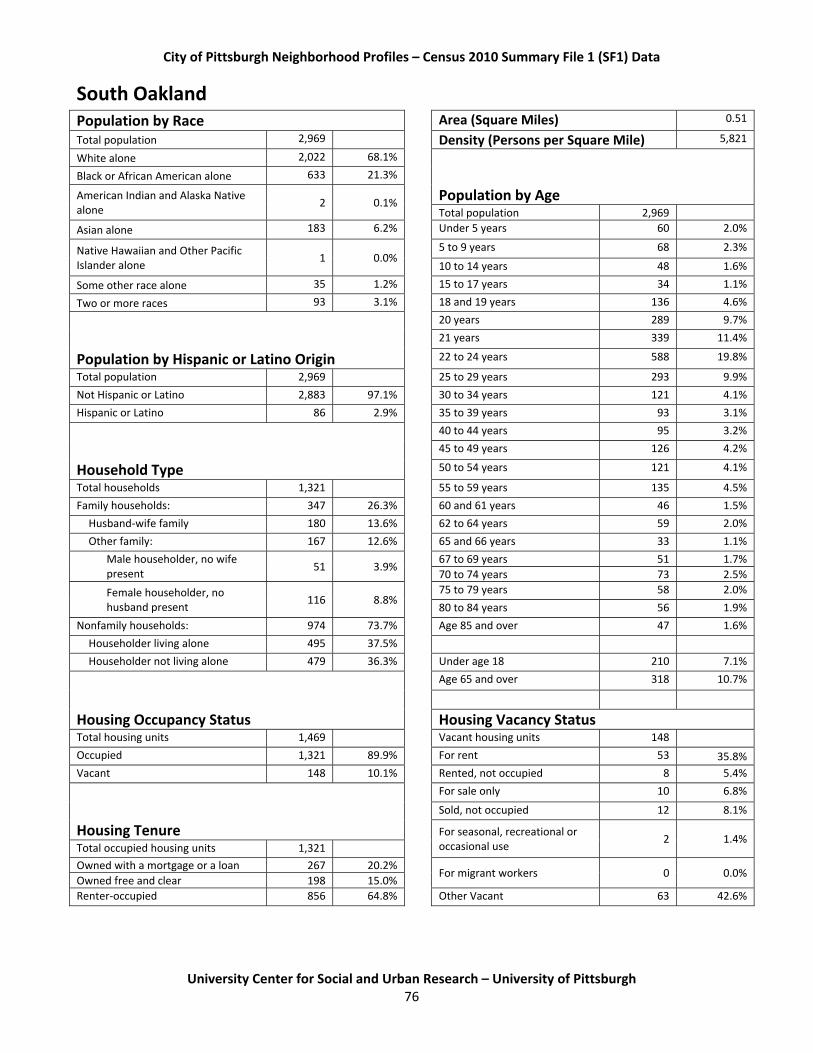
City of Pittsburgh Neighborhood Profiles – Census 2010 Summary File 1 (SF1) Data
University Center for Social and Urban Research – University of Pittsburgh
76
South Oakland Population by Race Area (Square Miles) 0.51
Total population 2,969 Density (Persons per Square Mile) 5,821
White alone 2,022 68.1%
Black or African American alone 633 21.3%
American Indian and Alaska Native alone
2 0.1% Population by Age
Total population 2,969
Asian alone 183 6.2% Under 5 years 60 2.0%
Native Hawaiian and Other Pacific Islander alone
1 0.0% 5 to 9 years 68 2.3%
10 to 14 years 48 1.6%
Some other race alone 35 1.2% 15 to 17 years 34 1.1%
Two or more races 93 3.1% 18 and 19 years 136 4.6%
20 years 289 9.7%
21 years 339 11.4%
Population by Hispanic or Latino Origin 22 to 24 years 588 19.8%
Total population 2,969 25 to 29 years 293 9.9%
Not Hispanic or Latino 2,883 97.1% 30 to 34 years 121 4.1%
Hispanic or Latino 86 2.9% 35 to 39 years 93 3.1%
40 to 44 years 95 3.2%
45 to 49 years 126 4.2%
Household Type 50 to 54 years 121 4.1%
Total households 1,321 55 to 59 years 135 4.5%
Family households: 347 26.3% 60 and 61 years 46 1.5%
Husband‐wife family 180 13.6% 62 to 64 years 59 2.0%
Other family: 167 12.6% 65 and 66 years 33 1.1%
Male householder, no wife present
51 3.9% 67 to 69 years 51 1.7%
70 to 74 years 73 2.5%
Female householder, no husband present
116 8.8% 75 to 79 years 58 2.0%
80 to 84 years 56 1.9%
Nonfamily households: 974 73.7% Age 85 and over 47 1.6%
Householder living alone 495 37.5%
Householder not living alone 479 36.3% Under age 18 210 7.1%
Age 65 and over 318 10.7%
Housing Occupancy Status Housing Vacancy Status Total housing units 1,469 Vacant housing units 148
Occupied 1,321 89.9% For rent 53 35.8%
Vacant 148 10.1% Rented, not occupied 8 5.4%
For sale only 10 6.8%
Sold, not occupied 12 8.1%
Housing Tenure For seasonal, recreational or occasional use
2 1.4% Total occupied housing units 1,321
Owned with a mortgage or a loan 267 20.2% For migrant workers 0 0.0%
Owned free and clear 198 15.0%
Renter‐occupied 856 64.8% Other Vacant 63 42.6%

City of Pittsburgh Neighborhood Profiles – Census 2010 Summary File 1 (SF1) Data
University Center for Social and Urban Research – University of Pittsburgh
77
South Shore Population by Race Area (Square Miles) 0.22
Total population 19 Density (Persons per Square Mile) 87
White alone 19 100.0%
Black or African American alone 0 0.0%
American Indian and Alaska Native alone
0 0.0% Population by Age
Total population 19
Asian alone 0 0.0% Under 5 years 1 5.3%
Native Hawaiian and Other Pacific Islander alone
0 0.0% 5 to 9 years 0 0.0%
10 to 14 years 0 0.0%
Some other race alone 0 0.0% 15 to 17 years 0 0.0%
Two or more races 0 0.0% 18 and 19 years 0 0.0%
20 years 0 0.0%
21 years 0 0.0%
Population by Hispanic or Latino Origin 22 to 24 years 5 26.3%
Total population 19 25 to 29 years 4 21.1%
Not Hispanic or Latino 19 100.0% 30 to 34 years 3 15.8%
Hispanic or Latino 0 0.0% 35 to 39 years 0 0.0%
40 to 44 years 0 0.0%
45 to 49 years 4 21.1%
Household Type 50 to 54 years 1 5.3%
Total households 10 55 to 59 years 0 0.0%
Family households: 4 40.0% 60 and 61 years 0 0.0%
Husband‐wife family 1 10.0% 62 to 64 years 0 0.0%
Other family: 3 30.0% 65 and 66 years 1 5.3%
Male householder, no wife present
2 20.0% 67 to 69 years 0 0.0%
70 to 74 years 0 0.0%
Female householder, no husband present
1 10.0% 75 to 79 years 0 0.0%
80 to 84 years 0 0.0%
Nonfamily households: 6 60.0% Age 85 and over 0 0.0%
Householder living alone 3 30.0%
Householder not living alone 3 30.0% Under age 18 1 5.3%
Age 65 and over 1 5.3%
Housing Occupancy Status Housing Vacancy Status Total housing units 15 Vacant housing units 5
Occupied 10 66.7% For rent 4 80.0%
Vacant 5 33.3% Rented, not occupied 0 0.0%
For sale only 0 0.0%
Sold, not occupied 0 0.0%
Housing Tenure For seasonal, recreational or occasional use
0 0.0% Total occupied housing units 10
Owned with a mortgage or a loan 0 0.0% For migrant workers 0 0.0%
Owned free and clear 2 20.0%
Renter‐occupied 8 80.0% Other Vacant 1 20.0%

City of Pittsburgh Neighborhood Profiles – Census 2010 Summary File 1 (SF1) Data
University Center for Social and Urban Research – University of Pittsburgh
78
Southside Flats Population by Race Area (Square Miles) 0.91
Total population 6,597 Density (Persons per Square Mile) 7,223
White alone 6,142 93.1%
Black or African American alone 196 3.0%
American Indian and Alaska Native alone
8 0.1% Population by Age
Total population 6,597
Asian alone 143 2.2% Under 5 years 132 2.0%
Native Hawaiian and Other Pacific Islander alone
2 0.0% 5 to 9 years 72 1.1%
10 to 14 years 59 0.9%
Some other race alone 24 0.4% 15 to 17 years 33 0.5%
Two or more races 82 1.2% 18 and 19 years 151 2.3%
20 years 200 3.0%
21 years 338 5.1%
Population by Hispanic or Latino Origin 22 to 24 years 1,204 18.3%
Total population 6,597 25 to 29 years 1,335 20.2%
Not Hispanic or Latino 6,435 97.5% 30 to 34 years 618 9.4%
Hispanic or Latino 162 2.5% 35 to 39 years 354 5.4%
40 to 44 years 270 4.1%
45 to 49 years 256 3.9%
Household Type 50 to 54 years 262 4.0%
Total households 3,775 55 to 59 years 277 4.2%
Family households: 852 22.6% 60 and 61 years 103 1.6%
Husband‐wife family 543 14.4% 62 to 64 years 154 2.3%
Other family: 309 8.2% 65 and 66 years 70 1.1%
Male householder, no wife present
103 2.7% 67 to 69 years 110 1.7%
70 to 74 years 166 2.5%
Female householder, no husband present
206 5.5% 75 to 79 years 140 2.1%
80 to 84 years 159 2.4%
Nonfamily households: 2,923 77.4% Age 85 and over 134 2.0%
Householder living alone 1,956 51.8%
Householder not living alone 967 25.6% Under age 18 296 4.5%
Age 65 and over 779 11.8%
Housing Occupancy Status Housing Vacancy Status Total housing units 4,326 Vacant housing units 551
Occupied 3,775 87.3% For rent 215 39.0%
Vacant 551 12.7% Rented, not occupied 17 3.1%
For sale only 56 10.2%
Sold, not occupied 16 2.9%
Housing Tenure For seasonal, recreational or occasional use
39 7.1% Total occupied housing units 3,775
Owned with a mortgage or a loan 817 21.6% For migrant workers 0 0.0%
Owned free and clear 438 11.6%
Renter‐occupied 2,520 66.8% Other Vacant 208 37.7%

City of Pittsburgh Neighborhood Profiles – Census 2010 Summary File 1 (SF1) Data
University Center for Social and Urban Research – University of Pittsburgh
79
Southside Slopes Population by Race Area (Square Miles) 0.72
Total population 4,423 Density (Persons per Square Mile) 6,156
White alone 3,916 88.5%
Black or African American alone 316 7.1%
American Indian and Alaska Native alone
8 0.2% Population by Age
Total population 4,423
Asian alone 42 0.9% Under 5 years 138 3.1%
Native Hawaiian and Other Pacific Islander alone
7 0.2% 5 to 9 years 128 2.9%
10 to 14 years 145 3.3%
Some other race alone 32 0.7% 15 to 17 years 108 2.4%
Two or more races 102 2.3% 18 and 19 years 68 1.5%
20 years 89 2.0%
21 years 162 3.7%
Population by Hispanic or Latino Origin 22 to 24 years 542 12.3%
Total population 4,423 25 to 29 years 642 14.5%
Not Hispanic or Latino 4,331 97.9% 30 to 34 years 318 7.2%
Hispanic or Latino 92 2.1% 35 to 39 years 250 5.7%
40 to 44 years 217 4.9%
45 to 49 years 280 6.3%
Household Type 50 to 54 years 309 7.0%
Total households 2,130 55 to 59 years 286 6.5%
Family households: 838 39.3% 60 and 61 years 72 1.6%
Husband‐wife family 470 22.1% 62 to 64 years 123 2.8%
Other family: 368 17.3% 65 and 66 years 60 1.4%
Male householder, no wife present
109 5.1% 67 to 69 years 85 1.9%
70 to 74 years 109 2.5%
Female householder, no husband present
259 12.2% 75 to 79 years 113 2.6%
80 to 84 years 92 2.1%
Nonfamily households: 1,292 60.7% Age 85 and over 87 2.0%
Householder living alone 817 38.4%
Householder not living alone 475 22.3% Under age 18 519 11.7%
Age 65 and over 546 12.3%
Housing Occupancy Status Housing Vacancy Status Total housing units 2,552 Vacant housing units 422
Occupied 2,130 83.5% For rent 124 29.4%
Vacant 422 16.5% Rented, not occupied 22 5.2%
For sale only 59 14.0%
Sold, not occupied 38 9.0%
Housing Tenure For seasonal, recreational or occasional use
12 2.8% Total occupied housing units 2,130
Owned with a mortgage or a loan 642 30.1% For migrant workers 0 0.0%
Owned free and clear 482 22.6%
Renter‐occupied 1,006 47.2% Other Vacant 167 39.6%

City of Pittsburgh Neighborhood Profiles – Census 2010 Summary File 1 (SF1) Data
University Center for Social and Urban Research – University of Pittsburgh
80
Spring Garden Population by Race Area (Square Miles) 0.26
Total population 884 Density (Persons per Square Mile) 3,356
White alone 703 79.5%
Black or African American alone 134 15.2%
American Indian and Alaska Native alone
5 0.6% Population by Age
Total population 884
Asian alone 8 0.9% Under 5 years 50 5.7%
Native Hawaiian and Other Pacific Islander alone
0 0.0% 5 to 9 years 44 5.0%
10 to 14 years 33 3.7%
Some other race alone 6 0.7% 15 to 17 years 40 4.5%
Two or more races 28 3.2% 18 and 19 years 11 1.2%
20 years 7 0.8%
21 years 7 0.8%
Population by Hispanic or Latino Origin 22 to 24 years 44 5.0%
Total population 884 25 to 29 years 74 8.4%
Not Hispanic or Latino 864 97.7% 30 to 34 years 61 6.9%
Hispanic or Latino 20 2.3% 35 to 39 years 57 6.4%
40 to 44 years 46 5.2%
45 to 49 years 74 8.4%
Household Type 50 to 54 years 101 11.4%
Total households 412 55 to 59 years 69 7.8%
Family households: 214 51.9% 60 and 61 years 19 2.1%
Husband‐wife family 112 27.2% 62 to 64 years 23 2.6%
Other family: 102 24.8% 65 and 66 years 19 2.1%
Male householder, no wife present
24 5.8% 67 to 69 years 25 2.8%
70 to 74 years 30 3.4%
Female householder, no husband present
78 18.9% 75 to 79 years 18 2.0%
80 to 84 years 12 1.4%
Nonfamily households: 198 48.1% Age 85 and over 20 2.3%
Householder living alone 163 39.6%
Householder not living alone 35 8.5% Under age 18 167 18.9%
Age 65 and over 124 14.0%
Housing Occupancy Status Housing Vacancy Status Total housing units 552 Vacant housing units 140
Occupied 412 74.6% For rent 31 22.1%
Vacant 140 25.4% Rented, not occupied 1 0.7%
For sale only 13 9.3%
Sold, not occupied 1 0.7%
Housing Tenure For seasonal, recreational or occasional use
1 0.7% Total occupied housing units 412
Owned with a mortgage or a loan 135 32.8% For migrant workers 0 0.0%
Owned free and clear 125 30.3%
Renter‐occupied 152 36.9% Other Vacant 93 66.4%

City of Pittsburgh Neighborhood Profiles – Census 2010 Summary File 1 (SF1) Data
University Center for Social and Urban Research – University of Pittsburgh
81
Spring Hill‐City View Population by Race Area (Square Miles) 0.64
Total population 2,648 Density (Persons per Square Mile) 4,165
White alone 1,799 67.9%
Black or African American alone 754 28.5%
American Indian and Alaska Native alone
1 0.0% Population by Age
Total population 2,648
Asian alone 18 0.7% Under 5 years 261 9.9%
Native Hawaiian and Other Pacific Islander alone
0 0.0% 5 to 9 years 156 5.9%
10 to 14 years 126 4.8%
Some other race alone 9 0.3% 15 to 17 years 89 3.4%
Two or more races 67 2.5% 18 and 19 years 74 2.8%
20 years 31 1.2%
21 years 46 1.7%
Population by Hispanic or Latino Origin 22 to 24 years 133 5.0%
Total population 2,648 25 to 29 years 184 6.9%
Not Hispanic or Latino 2,606 98.4% 30 to 34 years 151 5.7%
Hispanic or Latino 42 1.6% 35 to 39 years 144 5.4%
40 to 44 years 150 5.7%
45 to 49 years 196 7.4%
Household Type 50 to 54 years 210 7.9%
Total households 1,160 55 to 59 years 152 5.7%
Family households: 649 55.9% 60 and 61 years 46 1.7%
Husband‐wife family 314 27.1% 62 to 64 years 52 2.0%
Other family: 335 28.9% 65 and 66 years 29 1.1%
Male householder, no wife present
52 4.5% 67 to 69 years 61 2.3%
70 to 74 years 110 4.2%
Female householder, no husband present
283 24.4% 75 to 79 years 87 3.3%
80 to 84 years 87 3.3%
Nonfamily households: 511 44.1% Age 85 and over 73 2.8%
Householder living alone 422 36.4%
Householder not living alone 89 7.7% Under age 18 632 23.9%
Age 65 and over 447 16.9%
Housing Occupancy Status Housing Vacancy Status Total housing units 1,326 Vacant housing units 166
Occupied 1,160 87.5% For rent 55 33.1%
Vacant 166 12.5% Rented, not occupied 3 1.8%
For sale only 14 8.4%
Sold, not occupied 11 6.6%
Housing Tenure For seasonal, recreational or occasional use
2 1.2% Total occupied housing units 1,160
Owned with a mortgage or a loan 375 32.3% For migrant workers 3 1.8%
Owned free and clear 298 25.7%
Renter‐occupied 487 42.0% Other Vacant 78 47.0%

City of Pittsburgh Neighborhood Profiles – Census 2010 Summary File 1 (SF1) Data
University Center for Social and Urban Research – University of Pittsburgh
82
Squirrel Hill North Population by Race Area (Square Miles) 1.22
Total population 11,363 Density (Persons per Square Mile) 9,293
White alone 8,524 75.0%
Black or African American alone 368 3.2%
American Indian and Alaska Native alone
21 0.2% Population by Age
Total population 11,363
Asian alone 1,935 17.0% Under 5 years 429 3.8%
Native Hawaiian and Other Pacific Islander alone
2 0.0% 5 to 9 years 410 3.6%
10 to 14 years 359 3.2%
Some other race alone 225 2.0% 15 to 17 years 236 2.1%
Two or more races 288 2.5% 18 and 19 years 1,767 15.6%
20 years 920 8.1%
21 years 804 7.1%
Population by Hispanic or Latino Origin 22 to 24 years 1,068 9.4%
Total population 11,363 25 to 29 years 785 6.9%
Not Hispanic or Latino 10,894 95.9% 30 to 34 years 513 4.5%
Hispanic or Latino 469 4.1% 35 to 39 years 434 3.8%
40 to 44 years 418 3.7%
45 to 49 years 391 3.4%
Household Type 50 to 54 years 480 4.2%
Total households 3,620 55 to 59 years 514 4.5%
Family households: 1,850 51.1% 60 and 61 years 203 1.8%
Husband‐wife family 1,621 44.8% 62 to 64 years 319 2.8%
Other family: 229 6.3% 65 and 66 years 141 1.2%
Male householder, no wife present
68 1.9% 67 to 69 years 242 2.1%
70 to 74 years 283 2.5%
Female householder, no husband present
161 4.4% 75 to 79 years 212 1.9%
80 to 84 years 235 2.1%
Nonfamily households: 1,770 48.9% Age 85 and over 200 1.8%
Householder living alone 1,153 31.9%
Householder not living alone 617 17.0% Under age 18 1,434 12.6%
Age 65 and over 1,313 11.6%
Housing Occupancy Status Housing Vacancy Status Total housing units 3,892 Vacant housing units 272
Occupied 3,620 93.0% For rent 54 19.9%
Vacant 272 7.0% Rented, not occupied 51 18.8%
For sale only 32 11.8%
Sold, not occupied 23 8.5%
Housing Tenure For seasonal, recreational or occasional use
64 23.5% Total occupied housing units 3,620
Owned with a mortgage or a loan 1,250 34.5% For migrant workers 0 0.0%
Owned free and clear 812 22.4%
Renter‐occupied 1,558 43.0% Other Vacant 48 17.6%

City of Pittsburgh Neighborhood Profiles – Census 2010 Summary File 1 (SF1) Data
University Center for Social and Urban Research – University of Pittsburgh
83
Squirrel Hill South Population by Race Area (Square Miles) 2.68
Total population 15,110 Density (Persons per Square Mile) 5,644
White alone 12,395 82.0%
Black or African American alone 487 3.2%
American Indian and Alaska Native alone
11 0.1% Population by Age
Total population 15,110
Asian alone 1,723 11.4% Under 5 years 833 5.5%
Native Hawaiian and Other Pacific Islander alone
1 0.0% 5 to 9 years 655 4.3%
10 to 14 years 597 4.0%
Some other race alone 145 1.0% 15 to 17 years 365 2.4%
Two or more races 348 2.3% 18 and 19 years 155 1.0%
20 years 155 1.0%
21 years 233 1.5%
Population by Hispanic or Latino Origin 22 to 24 years 1,323 8.8%
Total population 15,110 25 to 29 years 2,037 13.5%
Not Hispanic or Latino 14,622 96.8% 30 to 34 years 1,308 8.7%
Hispanic or Latino 488 3.2% 35 to 39 years 825 5.5%
40 to 44 years 750 5.0%
45 to 49 years 715 4.7%
Household Type 50 to 54 years 841 5.6%
Total households 7,105 55 to 59 years 898 5.9%
Family households: 3,108 43.7% 60 and 61 years 376 2.5%
Husband‐wife family 2,639 37.1% 62 to 64 years 481 3.2%
Other family: 469 6.6% 65 and 66 years 227 1.5%
Male householder, no wife present
149 2.1% 67 to 69 years 311 2.1%
70 to 74 years 415 2.7%
Female householder, no husband present
320 4.5% 75 to 79 years 382 2.5%
80 to 84 years 455 3.0%
Nonfamily households: 3,997 56.3% Age 85 and over 773 5.1%
Householder living alone 2,948 41.5%
Householder not living alone 1,049 14.8% Under age 18 2,450 16.2%
Age 65 and over 2,563 17.0%
Housing Occupancy Status Housing Vacancy Status Total housing units 7,514 Vacant housing units 409
Occupied 7,105 94.6% For rent 201 49.1%
Vacant 409 5.4% Rented, not occupied 20 4.9%
For sale only 56 13.7%
Sold, not occupied 28 6.8%
Housing Tenure For seasonal, recreational or occasional use
38 9.3% Total occupied housing units 7,105
Owned with a mortgage or a loan 2,039 28.7% For migrant workers 0 0.0%
Owned free and clear 1,057 14.9%
Renter‐occupied 4,009 56.4% Other Vacant 66 16.1%

City of Pittsburgh Neighborhood Profiles – Census 2010 Summary File 1 (SF1) Data
University Center for Social and Urban Research – University of Pittsburgh
84
St. Clair Population by Race Area (Square Miles) 0.31
Total population 209 Density (Persons per Square Mile) 670
White alone 110 52.6%
Black or African American alone 98 46.9%
American Indian and Alaska Native alone
0 0.0% Population by Age
Total population 209
Asian alone 0 0.0% Under 5 years 10 4.8%
Native Hawaiian and Other Pacific Islander alone
0 0.0% 5 to 9 years 18 8.6%
10 to 14 years 17 8.1%
Some other race alone 0 0.0% 15 to 17 years 7 3.3%
Two or more races 1 0.5% 18 and 19 years 5 2.4%
20 years 4 1.9%
21 years 4 1.9%
Population by Hispanic or Latino Origin 22 to 24 years 5 2.4%
Total population 209 25 to 29 years 7 3.3%
Not Hispanic or Latino 208 99.5% 30 to 34 years 10 4.8%
Hispanic or Latino 1 0.5% 35 to 39 years 10 4.8%
40 to 44 years 11 5.3%
45 to 49 years 19 9.1%
Household Type 50 to 54 years 20 9.6%
Total households 83 55 to 59 years 23 11.0%
Family households: 61 73.5% 60 and 61 years 6 2.9%
Husband‐wife family 24 28.9% 62 to 64 years 4 1.9%
Other family: 37 44.6% 65 and 66 years 2 1.0%
Male householder, no wife present
8 9.6% 67 to 69 years 4 1.9%
70 to 74 years 11 5.3%
Female householder, no husband present
29 34.9% 75 to 79 years 5 2.4%
80 to 84 years 4 1.9%
Nonfamily households: 22 26.5% Age 85 and over 3 1.4%
Householder living alone 21 25.3%
Householder not living alone 1 1.2% Under age 18 52 24.9%
Age 65 and over 29 13.9%
Housing Occupancy Status Housing Vacancy Status Total housing units 165 Vacant housing units 82
Occupied 83 50.3% For rent 7 8.5%
Vacant 82 49.7% Rented, not occupied 0 0.0%
For sale only 7 8.5%
Sold, not occupied 0 0.0%
Housing Tenure For seasonal, recreational or occasional use
0 0.0% Total occupied housing units 83
Owned with a mortgage or a loan 34 41.0% For migrant workers 0 0.0%
Owned free and clear 23 27.7%
Renter‐occupied 26 31.3% Other Vacant 68 82.9%

City of Pittsburgh Neighborhood Profiles – Census 2010 Summary File 1 (SF1) Data
University Center for Social and Urban Research – University of Pittsburgh
85
Stanton Heights Population by Race Area (Square Miles) 0.74
Total population 4,601 Density (Persons per Square Mile) 6,202
White alone 2,571 55.9%
Black or African American alone 1,843 40.1%
American Indian and Alaska Native alone
11 0.2% Population by Age
Total population 4,601
Asian alone 40 0.9% Under 5 years 236 5.1%
Native Hawaiian and Other Pacific Islander alone
0 0.0% 5 to 9 years 232 5.0%
10 to 14 years 222 4.8%
Some other race alone 17 0.4% 15 to 17 years 174 3.8%
Two or more races 119 2.6% 18 and 19 years 78 1.7%
20 years 32 0.7%
21 years 52 1.1%
Population by Hispanic or Latino Origin 22 to 24 years 143 3.1%
Total population 4,601 25 to 29 years 326 7.1%
Not Hispanic or Latino 4,535 98.6% 30 to 34 years 300 6.5%
Hispanic or Latino 66 1.4% 35 to 39 years 259 5.6%
40 to 44 years 244 5.3%
45 to 49 years 321 7.0%
Household Type 50 to 54 years 377 8.2%
Total households 2,097 55 to 59 years 421 9.2%
Family households: 1,232 58.8% 60 and 61 years 154 3.3%
Husband‐wife family 799 38.1% 62 to 64 years 178 3.9%
Other family: 433 20.6% 65 and 66 years 103 2.2%
Male householder, no wife present
75 3.6% 67 to 69 years 150 3.3%
70 to 74 years 183 4.0%
Female householder, no husband present
358 17.1% 75 to 79 years 160 3.5%
80 to 84 years 129 2.8%
Nonfamily households: 865 41.2% Age 85 and over 127 2.8%
Householder living alone 740 35.3%
Householder not living alone 125 6.0% Under age 18 864 18.8%
Age 65 and over 852 18.5%
Housing Occupancy Status Housing Vacancy Status Total housing units 2,223 Vacant housing units 126
Occupied 2,097 94.3% For rent 17 13.5%
Vacant 126 5.7% Rented, not occupied 5 4.0%
For sale only 26 20.6%
Sold, not occupied 17 13.5%
Housing Tenure For seasonal, recreational or occasional use
2 1.6% Total occupied housing units 2,097
Owned with a mortgage or a loan 1,145 54.6% For migrant workers 0 0.0%
Owned free and clear 546 26.0%
Renter‐occupied 406 19.4% Other Vacant 59 46.8%
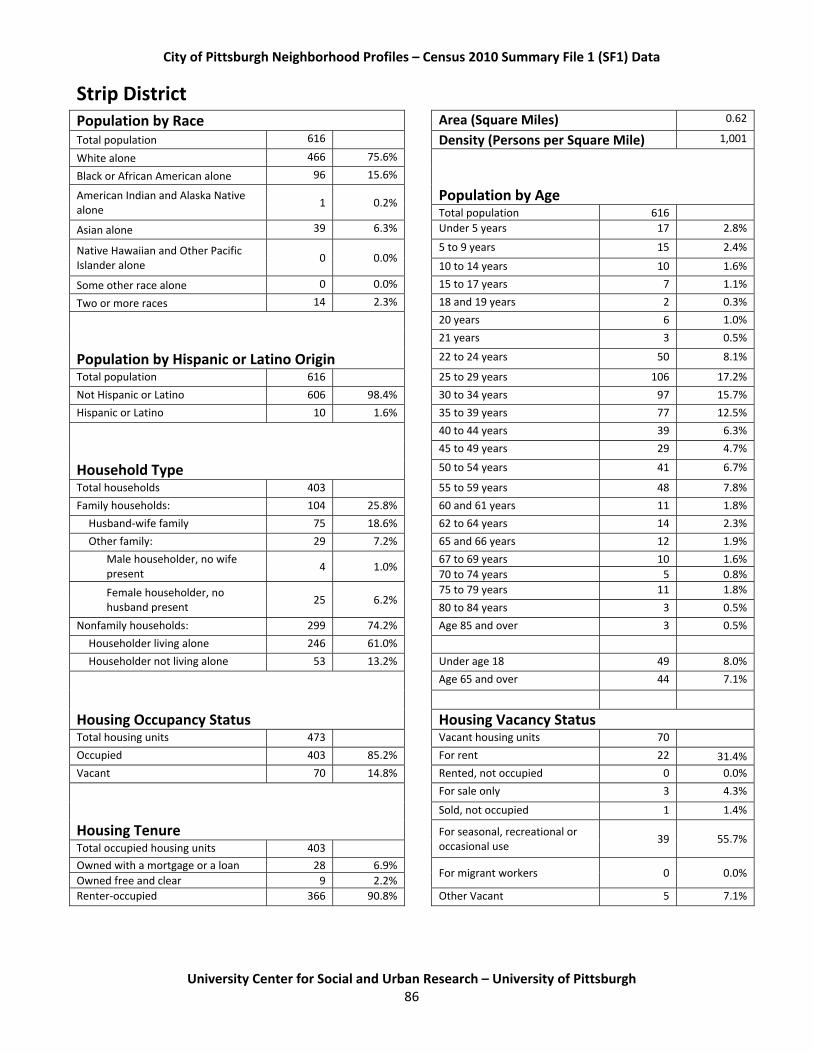
City of Pittsburgh Neighborhood Profiles – Census 2010 Summary File 1 (SF1) Data
University Center for Social and Urban Research – University of Pittsburgh
86
Strip District Population by Race Area (Square Miles) 0.62
Total population 616 Density (Persons per Square Mile) 1,001
White alone 466 75.6%
Black or African American alone 96 15.6%
American Indian and Alaska Native alone
1 0.2% Population by Age
Total population 616
Asian alone 39 6.3% Under 5 years 17 2.8%
Native Hawaiian and Other Pacific Islander alone
0 0.0% 5 to 9 years 15 2.4%
10 to 14 years 10 1.6%
Some other race alone 0 0.0% 15 to 17 years 7 1.1%
Two or more races 14 2.3% 18 and 19 years 2 0.3%
20 years 6 1.0%
21 years 3 0.5%
Population by Hispanic or Latino Origin 22 to 24 years 50 8.1%
Total population 616 25 to 29 years 106 17.2%
Not Hispanic or Latino 606 98.4% 30 to 34 years 97 15.7%
Hispanic or Latino 10 1.6% 35 to 39 years 77 12.5%
40 to 44 years 39 6.3%
45 to 49 years 29 4.7%
Household Type 50 to 54 years 41 6.7%
Total households 403 55 to 59 years 48 7.8%
Family households: 104 25.8% 60 and 61 years 11 1.8%
Husband‐wife family 75 18.6% 62 to 64 years 14 2.3%
Other family: 29 7.2% 65 and 66 years 12 1.9%
Male householder, no wife present
4 1.0% 67 to 69 years 10 1.6%
70 to 74 years 5 0.8%
Female householder, no husband present
25 6.2% 75 to 79 years 11 1.8%
80 to 84 years 3 0.5%
Nonfamily households: 299 74.2% Age 85 and over 3 0.5%
Householder living alone 246 61.0%
Householder not living alone 53 13.2% Under age 18 49 8.0%
Age 65 and over 44 7.1%
Housing Occupancy Status Housing Vacancy Status Total housing units 473 Vacant housing units 70
Occupied 403 85.2% For rent 22 31.4%
Vacant 70 14.8% Rented, not occupied 0 0.0%
For sale only 3 4.3%
Sold, not occupied 1 1.4%
Housing Tenure For seasonal, recreational or occasional use
39 55.7% Total occupied housing units 403
Owned with a mortgage or a loan 28 6.9% For migrant workers 0 0.0%
Owned free and clear 9 2.2%
Renter‐occupied 366 90.8% Other Vacant 5 7.1%

City of Pittsburgh Neighborhood Profiles – Census 2010 Summary File 1 (SF1) Data
University Center for Social and Urban Research – University of Pittsburgh
87
Summer Hill Population by Race Area (Square Miles) 0.41
Total population 1,051 Density (Persons per Square Mile) 2,573
White alone 866 82.4%
Black or African American alone 160 15.2%
American Indian and Alaska Native alone
0 0.0% Population by Age
Total population 1,051
Asian alone 0 0.0% Under 5 years 53 5.0%
Native Hawaiian and Other Pacific Islander alone
0 0.0% 5 to 9 years 53 5.0%
10 to 14 years 62 5.9%
Some other race alone 0 0.0% 15 to 17 years 33 3.1%
Two or more races 25 2.4% 18 and 19 years 18 1.7%
20 years 7 0.7%
21 years 8 0.8%
Population by Hispanic or Latino Origin 22 to 24 years 32 3.0%
Total population 1,051 25 to 29 years 68 6.5%
Not Hispanic or Latino 1,040 99.0% 30 to 34 years 61 5.8%
Hispanic or Latino 11 1.0% 35 to 39 years 68 6.5%
40 to 44 years 63 6.0%
45 to 49 years 74 7.0%
Household Type 50 to 54 years 97 9.2%
Total households 481 55 to 59 years 90 8.6%
Family households: 270 56.1% 60 and 61 years 29 2.8%
Husband‐wife family 190 39.5% 62 to 64 years 43 4.1%
Other family: 80 16.6% 65 and 66 years 19 1.8%
Male householder, no wife present
22 4.6% 67 to 69 years 39 3.7%
70 to 74 years 32 3.0%
Female householder, no husband present
58 12.1% 75 to 79 years 34 3.2%
80 to 84 years 31 2.9%
Nonfamily households: 211 43.9% Age 85 and over 37 3.5%
Householder living alone 177 36.8%
Householder not living alone 34 7.1% Under age 18 201 19.1%
Age 65 and over 192 18.3%
Housing Occupancy Status Housing Vacancy Status Total housing units 510 Vacant housing units 29
Occupied 481 94.3% For rent 6 20.7%
Vacant 29 5.7% Rented, not occupied 0 0.0%
For sale only 2 6.9%
Sold, not occupied 4 13.8%
Housing Tenure For seasonal, recreational or occasional use
1 3.4% Total occupied housing units 481
Owned with a mortgage or a loan 235 48.9% For migrant workers 0 0.0%
Owned free and clear 152 31.6%
Renter‐occupied 94 19.5% Other Vacant 16 55.2%

City of Pittsburgh Neighborhood Profiles – Census 2010 Summary File 1 (SF1) Data
University Center for Social and Urban Research – University of Pittsburgh
88
Swisshelm Park Population by Race Area (Square Miles) 0.47
Total population 1,361 Density (Persons per Square Mile) 2,874
White alone 1,226 90.1%
Black or African American alone 57 4.2%
American Indian and Alaska Native alone
0 0.0% Population by Age
Total population 1,361
Asian alone 43 3.2% Under 5 years 91 6.7%
Native Hawaiian and Other Pacific Islander alone
2 0.1% 5 to 9 years 74 5.4%
10 to 14 years 71 5.2%
Some other race alone 3 0.2% 15 to 17 years 40 2.9%
Two or more races 30 2.2% 18 and 19 years 19 1.4%
20 years 4 0.3%
21 years 8 0.6%
Population by Hispanic or Latino Origin 22 to 24 years 34 2.5%
Total population 1,361 25 to 29 years 90 6.6%
Not Hispanic or Latino 1,330 97.7% 30 to 34 years 98 7.2%
Hispanic or Latino 31 2.3% 35 to 39 years 77 5.7%
40 to 44 years 72 5.3%
45 to 49 years 100 7.3%
Household Type 50 to 54 years 117 8.6%
Total households 602 55 to 59 years 137 10.1%
Family households: 376 62.5% 60 and 61 years 49 3.6%
Husband‐wife family 298 49.5% 62 to 64 years 36 2.6%
Other family: 78 13.0% 65 and 66 years 26 1.9%
Male householder, no wife present
20 3.3% 67 to 69 years 38 2.8%
70 to 74 years 48 3.5%
Female householder, no husband present
58 9.6% 75 to 79 years 47 3.5%
80 to 84 years 48 3.5%
Nonfamily households: 226 37.5% Age 85 and over 37 2.7%
Householder living alone 200 33.2%
Householder not living alone 26 4.3% Under age 18 276 20.3%
Age 65 and over 244 17.9%
Housing Occupancy Status Housing Vacancy Status Total housing units 625 Vacant housing units 23
Occupied 602 96.3% For rent 11 47.8%
Vacant 23 3.7% Rented, not occupied 0 0.0%
For sale only 2 8.7%
Sold, not occupied 1 4.3%
Housing Tenure For seasonal, recreational or occasional use
0 0.0% Total occupied housing units 602
Owned with a mortgage or a loan 321 53.3% For migrant workers 0 0.0%
Owned free and clear 194 32.2%
Renter‐occupied 87 14.5% Other Vacant 9 39.1%

City of Pittsburgh Neighborhood Profiles – Census 2010 Summary File 1 (SF1) Data
University Center for Social and Urban Research – University of Pittsburgh
89
Terrace Village Population by Race Area (Square Miles) 0.45
Total population 4,062 Density (Persons per Square Mile) 9,084
White alone 1,048 25.8%
Black or African American alone 2,839 69.9%
American Indian and Alaska Native alone
9 0.2% Population by Age
Total population 4,062
Asian alone 93 2.3% Under 5 years 319 7.9%
Native Hawaiian and Other Pacific Islander alone
0 0.0% 5 to 9 years 197 4.8%
10 to 14 years 193 4.8%
Some other race alone 6 0.1% 15 to 17 years 148 3.6%
Two or more races 67 1.6% 18 and 19 years 904 22.3%
20 years 163 4.0%
21 years 140 3.4%
Population by Hispanic or Latino Origin 22 to 24 years 287 7.1%
Total population 4,062 25 to 29 years 241 5.9%
Not Hispanic or Latino 4,016 98.9% 30 to 34 years 174 4.3%
Hispanic or Latino 46 1.1% 35 to 39 years 115 2.8%
40 to 44 years 146 3.6%
45 to 49 years 178 4.4%
Household Type 50 to 54 years 200 4.9%
Total households 1,679 55 to 59 years 186 4.6%
Family households: 727 43.3% 60 and 61 years 78 1.9%
Husband‐wife family 108 6.4% 62 to 64 years 80 2.0%
Other family: 619 36.9% 65 and 66 years 41 1.0%
Male householder, no wife present
64 3.8% 67 to 69 years 75 1.8%
70 to 74 years 67 1.6%
Female householder, no husband present
555 33.1% 75 to 79 years 55 1.4%
80 to 84 years 37 0.9%
Nonfamily households: 952 56.7% Age 85 and over 38 0.9%
Householder living alone 814 48.5%
Householder not living alone 138 8.2% Under age 18 857 21.1%
Age 65 and over 313 7.7%
Housing Occupancy Status Housing Vacancy Status Total housing units 1,983 Vacant housing units 304
Occupied 1,679 84.7% For rent 236 77.6%
Vacant 304 15.3% Rented, not occupied 3 1.0%
For sale only 5 1.6%
Sold, not occupied 1 0.3%
Housing Tenure For seasonal, recreational or occasional use
2 0.7% Total occupied housing units 1,679
Owned with a mortgage or a loan 83 4.9% For migrant workers 0 0.0%
Owned free and clear 67 4.0%
Renter‐occupied 1,529 91.1% Other Vacant 57 18.8%

City of Pittsburgh Neighborhood Profiles – Census 2010 Summary File 1 (SF1) Data
University Center for Social and Urban Research – University of Pittsburgh
90
Troy Hill Population by Race Area (Square Miles) 0.47
Total population 2,714 Density (Persons per Square Mile) 5,736
White alone 2,204 81.2%
Black or African American alone 331 12.2%
American Indian and Alaska Native alone
3 0.1% Population by Age
Total population 2,714
Asian alone 108 4.0% Under 5 years 149 5.5%
Native Hawaiian and Other Pacific Islander alone
1 0.0% 5 to 9 years 122 4.5%
10 to 14 years 138 5.1%
Some other race alone 16 0.6% 15 to 17 years 74 2.7%
Two or more races 51 1.9% 18 and 19 years 63 2.3%
20 years 32 1.2%
21 years 25 0.9%
Population by Hispanic or Latino Origin 22 to 24 years 142 5.2%
Total population 2,714 25 to 29 years 306 11.3%
Not Hispanic or Latino 2,664 98.2% 30 to 34 years 228 8.4%
Hispanic or Latino 50 1.8% 35 to 39 years 196 7.2%
40 to 44 years 165 6.1%
45 to 49 years 183 6.7%
Household Type 50 to 54 years 211 7.8%
Total households 1,349 55 to 59 years 208 7.7%
Family households: 623 46.2% 60 and 61 years 68 2.5%
Husband‐wife family 328 24.3% 62 to 64 years 73 2.7%
Other family: 295 21.9% 65 and 66 years 35 1.3%
Male householder, no wife present
85 6.3% 67 to 69 years 69 2.5%
70 to 74 years 63 2.3%
Female householder, no husband present
210 15.6% 75 to 79 years 56 2.1%
80 to 84 years 52 1.9%
Nonfamily households: 726 53.8% Age 85 and over 56 2.1%
Householder living alone 579 42.9%
Householder not living alone 147 10.9% Under age 18 483 17.8%
Age 65 and over 331 12.2%
Housing Occupancy Status Housing Vacancy Status Total housing units 1,608 Vacant housing units 259
Occupied 1,349 83.9% For rent 76 29.3%
Vacant 259 16.1% Rented, not occupied 2 0.8%
For sale only 31 12.0%
Sold, not occupied 10 3.9%
Housing Tenure For seasonal, recreational or occasional use
13 5.0% Total occupied housing units 1,349
Owned with a mortgage or a loan 376 27.9% For migrant workers 0 0.0%
Owned free and clear 244 18.1%
Renter‐occupied 729 54.0% Other Vacant 127 49.0%

City of Pittsburgh Neighborhood Profiles – Census 2010 Summary File 1 (SF1) Data
University Center for Social and Urban Research – University of Pittsburgh
91
Upper Hill Population by Race Area (Square Miles) 0.31
Total population 2,057 Density (Persons per Square Mile) 6,607
White alone 380 18.5%
Black or African American alone 1,593 77.4%
American Indian and Alaska Native alone
5 0.2% Population by Age
Total population 2,057
Asian alone 21 1.0% Under 5 years 68 3.3%
Native Hawaiian and Other Pacific Islander alone
0 0.0% 5 to 9 years 93 4.5%
10 to 14 years 104 5.1%
Some other race alone 15 0.7% 15 to 17 years 86 4.2%
Two or more races 43 2.1% 18 and 19 years 64 3.1%
20 years 32 1.6%
21 years 43 2.1%
Population by Hispanic or Latino Origin 22 to 24 years 82 4.0%
Total population 2,057 25 to 29 years 104 5.1%
Not Hispanic or Latino 2,028 98.6% 30 to 34 years 67 3.3%
Hispanic or Latino 29 1.4% 35 to 39 years 93 4.5%
40 to 44 years 124 6.0%
45 to 49 years 143 7.0%
Household Type 50 to 54 years 163 7.9%
Total households 1,016 55 to 59 years 148 7.2%
Family households: 480 47.2% 60 and 61 years 55 2.7%
Husband‐wife family 191 18.8% 62 to 64 years 76 3.7%
Other family: 289 28.4% 65 and 66 years 38 1.8%
Male householder, no wife present
50 4.9% 67 to 69 years 61 3.0%
70 to 74 years 62 3.0%
Female householder, no husband present
239 23.5% 75 to 79 years 72 3.5%
80 to 84 years 111 5.4%
Nonfamily households: 536 52.8% Age 85 and over 168 8.2%
Householder living alone 482 47.4%
Householder not living alone 54 5.3% Under age 18 351 17.1%
Age 65 and over 512 24.9%
Housing Occupancy Status Housing Vacancy Status Total housing units 1,240 Vacant housing units 224
Occupied 1,016 81.9% For rent 44 19.6%
Vacant 224 18.1% Rented, not occupied 2 0.9%
For sale only 11 4.9%
Sold, not occupied 9 4.0%
Housing Tenure For seasonal, recreational or occasional use
1 0.4% Total occupied housing units 1,016
Owned with a mortgage or a loan 317 31.2% For migrant workers 0 0.0%
Owned free and clear 214 21.1%
Renter‐occupied 485 47.7% Other Vacant 157 70.1%

City of Pittsburgh Neighborhood Profiles – Census 2010 Summary File 1 (SF1) Data
University Center for Social and Urban Research – University of Pittsburgh
92
Upper Lawrenceville Population by Race Area (Square Miles) 0.41
Total population 2,669 Density (Persons per Square Mile) 6,584
White alone 1,754 65.7%
Black or African American alone 751 28.1%
American Indian and Alaska Native alone
10 0.4% Population by Age
Total population 2,669
Asian alone 37 1.4% Under 5 years 171 6.4%
Native Hawaiian and Other Pacific Islander alone
1 0.0% 5 to 9 years 164 6.1%
10 to 14 years 145 5.4%
Some other race alone 37 1.4% 15 to 17 years 125 4.7%
Two or more races 79 3.0% 18 and 19 years 56 2.1%
20 years 40 1.5%
21 years 60 2.2%
Population by Hispanic or Latino Origin 22 to 24 years 172 6.4%
Total population 2,669 25 to 29 years 308 11.5%
Not Hispanic or Latino 2,586 96.9% 30 to 34 years 213 8.0%
Hispanic or Latino 83 3.1% 35 to 39 years 170 6.4%
40 to 44 years 142 5.3%
45 to 49 years 153 5.7%
Household Type 50 to 54 years 224 8.4%
Total households 1,168 55 to 59 years 152 5.7%
Family households: 601 51.5% 60 and 61 years 52 1.9%
Husband‐wife family 257 22.0% 62 to 64 years 58 2.2%
Other family: 344 29.5% 65 and 66 years 33 1.2%
Male householder, no wife present
86 7.4% 67 to 69 years 41 1.5%
70 to 74 years 52 1.9%
Female householder, no husband present
258 22.1% 75 to 79 years 49 1.8%
80 to 84 years 40 1.5%
Nonfamily households: 567 48.5% Age 85 and over 49 1.8%
Householder living alone 400 34.2%
Householder not living alone 167 14.3% Under age 18 605 22.7%
Age 65 and over 264 9.9%
Housing Occupancy Status Housing Vacancy Status Total housing units 1,442 Vacant housing units 274
Occupied 1,168 81.0% For rent 52 19.0%
Vacant 274 19.0% Rented, not occupied 19 6.9%
For sale only 6 2.2%
Sold, not occupied 18 6.6%
Housing Tenure For seasonal, recreational or occasional use
1 0.4% Total occupied housing units 1,168
Owned with a mortgage or a loan 280 24.0% For migrant workers 0 0.0%
Owned free and clear 247 21.1%
Renter‐occupied 641 54.9% Other Vacant 178 65.0%

City of Pittsburgh Neighborhood Profiles – Census 2010 Summary File 1 (SF1) Data
University Center for Social and Urban Research – University of Pittsburgh
93
West End Population by Race Area (Square Miles) 0.20
Total population 254 Density (Persons per Square Mile) 1,284
White alone 135 53.1%
Black or African American alone 95 37.4%
American Indian and Alaska Native alone
0 0.0% Population by Age
Total population 254
Asian alone 2 0.8% Under 5 years 19 7.5%
Native Hawaiian and Other Pacific Islander alone
0 0.0% 5 to 9 years 11 4.3%
10 to 14 years 11 4.3%
Some other race alone 3 1.2% 15 to 17 years 10 3.9%
Two or more races 19 7.5% 18 and 19 years 3 1.2%
20 years 9 3.5%
21 years 8 3.1%
Population by Hispanic or Latino Origin 22 to 24 years 16 6.3%
Total population 254 25 to 29 years 25 9.8%
Not Hispanic or Latino 253 99.6% 30 to 34 years 16 6.3%
Hispanic or Latino 1 0.4% 35 to 39 years 22 8.7%
40 to 44 years 15 5.9%
45 to 49 years 21 8.3%
Household Type 50 to 54 years 16 6.3%
Total households 123 55 to 59 years 10 3.9%
Family households: 56 45.5% 60 and 61 years 8 3.1%
Husband‐wife family 26 21.1% 62 to 64 years 10 3.9%
Other family: 30 24.4% 65 and 66 years 4 1.6%
Male householder, no wife present
10 8.1% 67 to 69 years 3 1.2%
70 to 74 years 5 2.0%
Female householder, no husband present
20 16.3% 75 to 79 years 8 3.1%
80 to 84 years 2 0.8%
Nonfamily households: 67 54.5% Age 85 and over 2 0.8%
Householder living alone 53 43.1%
Householder not living alone 14 11.4% Under age 18 51 20.1%
Age 65 and over 24 9.4%
Housing Occupancy Status Housing Vacancy Status Total housing units 165 Vacant housing units 42
Occupied 123 74.5% For rent 25 59.5%
Vacant 42 25.5% Rented, not occupied 2 4.8%
For sale only 2 4.8%
Sold, not occupied 5 11.9%
Housing Tenure For seasonal, recreational or occasional use
2 4.8% Total occupied housing units 123
Owned with a mortgage or a loan 13 10.6% For migrant workers 0 0.0%
Owned free and clear 17 13.8%
Renter‐occupied 93 75.6% Other Vacant 6 14.3%

City of Pittsburgh Neighborhood Profiles – Census 2010 Summary File 1 (SF1) Data
University Center for Social and Urban Research – University of Pittsburgh
94
West Oakland Population by Race Area (Square Miles) 0.11
Total population 1,770 Density (Persons per Square Mile) 16,217
White alone 1,225 69.2%
Black or African American alone 346 19.5%
American Indian and Alaska Native alone
4 0.2% Population by Age
Total population 1,770
Asian alone 153 8.6% Under 5 years 10 0.6%
Native Hawaiian and Other Pacific Islander alone
0 0.0% 5 to 9 years 9 0.5%
10 to 14 years 12 0.7%
Some other race alone 5 0.3% 15 to 17 years 21 1.2%
Two or more races 37 2.1% 18 and 19 years 739 41.8%
20 years 227 12.8%
21 years 144 8.1%
Population by Hispanic or Latino Origin 22 to 24 years 213 12.0%
Total population 1,770 25 to 29 years 112 6.3%
Not Hispanic or Latino 1,720 97.2% 30 to 34 years 33 1.9%
Hispanic or Latino 50 2.8% 35 to 39 years 20 1.1%
40 to 44 years 18 1.0%
45 to 49 years 21 1.2%
Household Type 50 to 54 years 26 1.5%
Total households 181 55 to 59 years 21 1.2%
Family households: 75 41.4% 60 and 61 years 10 0.6%
Husband‐wife family 22 12.2% 62 to 64 years 12 0.7%
Other family: 53 29.3% 65 and 66 years 6 0.3%
Male householder, no wife present
7 3.9% 67 to 69 years 9 0.5%
70 to 74 years 24 1.4%
Female householder, no husband present
46 25.4% 75 to 79 years 19 1.1%
80 to 84 years 29 1.6%
Nonfamily households: 106 58.6% Age 85 and over 35 2.0%
Householder living alone 34 18.8%
Householder not living alone 72 39.8% Under age 18 52 2.9%
Age 65 and over 122 6.9%
Housing Occupancy Status Housing Vacancy Status Total housing units 213 Vacant housing units 32
Occupied 181 85.0% For rent 10 31.3%
Vacant 32 15.0% Rented, not occupied 1 3.1%
For sale only 0 0.0%
Sold, not occupied 1 3.1%
Housing Tenure For seasonal, recreational or occasional use
1 3.1% Total occupied housing units 181
Owned with a mortgage or a loan 72 39.8% For migrant workers 0 0.0%
Owned free and clear 19 10.5%
Renter‐occupied 90 49.7% Other Vacant 19 59.4%

City of Pittsburgh Neighborhood Profiles – Census 2010 Summary File 1 (SF1) Data
University Center for Social and Urban Research – University of Pittsburgh
95
Westwood Population by Race Area (Square Miles) 0.69
Total population 3,066 Density (Persons per Square Mile) 4,438
White alone 2,535 82.7%
Black or African American alone 250 8.2%
American Indian and Alaska Native alone
3 0.1% Population by Age
Total population 3,066
Asian alone 174 5.7% Under 5 years 190 6.2%
Native Hawaiian and Other Pacific Islander alone
1 0.0% 5 to 9 years 155 5.1%
10 to 14 years 132 4.3%
Some other race alone 17 0.6% 15 to 17 years 89 2.9%
Two or more races 86 2.8% 18 and 19 years 40 1.3%
20 years 18 0.6%
21 years 32 1.0%
Population by Hispanic or Latino Origin 22 to 24 years 132 4.3%
Total population 3,066 25 to 29 years 255 8.3%
Not Hispanic or Latino 3,022 98.6% 30 to 34 years 251 8.2%
Hispanic or Latino 44 1.4% 35 to 39 years 220 7.2%
40 to 44 years 201 6.6%
45 to 49 years 207 6.8%
Household Type 50 to 54 years 220 7.2%
Total households 1,403 55 to 59 years 190 6.2%
Family households: 804 57.3% 60 and 61 years 70 2.3%
Husband‐wife family 584 41.6% 62 to 64 years 110 3.6%
Other family: 220 15.7% 65 and 66 years 53 1.7%
Male householder, no wife present
63 4.5% 67 to 69 years 100 3.3%
70 to 74 years 107 3.5%
Female householder, no husband present
157 11.2% 75 to 79 years 101 3.3%
80 to 84 years 100 3.3%
Nonfamily households: 599 42.7% Age 85 and over 93 3.0%
Householder living alone 473 33.7%
Householder not living alone 126 9.0% Under age 18 566 18.5%
Age 65 and over 554 18.1%
Housing Occupancy Status Housing Vacancy Status Total housing units 1,496 Vacant housing units 93
Occupied 1,403 93.8% For rent 31 33.3%
Vacant 93 6.2% Rented, not occupied 2 2.2%
For sale only 15 16.1%
Sold, not occupied 5 5.4%
Housing Tenure For seasonal, recreational or occasional use
0 0.0% Total occupied housing units 1,403
Owned with a mortgage or a loan 602 42.9% For migrant workers 0 0.0%
Owned free and clear 375 26.7%
Renter‐occupied 426 30.4% Other Vacant 40 43.0%

City of Pittsburgh Neighborhood Profiles – Census 2010 Summary File 1 (SF1) Data
University Center for Social and Urban Research – University of Pittsburgh
96
Windgap Population by Race Area (Square Miles) 0.42
Total population 1,369 Density (Persons per Square Mile) 3,287
White alone 846 61.8%
Black or African American alone 476 34.8%
American Indian and Alaska Native alone
0 0.0% Population by Age
Total population 1,369
Asian alone 7 0.5% Under 5 years 57 4.2%
Native Hawaiian and Other Pacific Islander alone
0 0.0% 5 to 9 years 70 5.1%
10 to 14 years 71 5.2%
Some other race alone 7 0.5% 15 to 17 years 38 2.8%
Two or more races 33 2.4% 18 and 19 years 25 1.8%
20 years 17 1.2%
21 years 18 1.3%
Population by Hispanic or Latino Origin 22 to 24 years 40 2.9%
Total population 1,369 25 to 29 years 74 5.4%
Not Hispanic or Latino 1,353 98.8% 30 to 34 years 53 3.9%
Hispanic or Latino 16 1.2% 35 to 39 years 76 5.6%
40 to 44 years 70 5.1%
45 to 49 years 92 6.7%
Household Type 50 to 54 years 139 10.2%
Total households 628 55 to 59 years 126 9.2%
Family households: 370 58.9% 60 and 61 years 51 3.7%
Husband‐wife family 235 37.4% 62 to 64 years 67 4.9%
Other family: 135 21.5% 65 and 66 years 29 2.1%
Male householder, no wife present
32 5.1% 67 to 69 years 45 3.3%
70 to 74 years 60 4.4%
Female householder, no husband present
103 16.4% 75 to 79 years 55 4.0%
80 to 84 years 54 3.9%
Nonfamily households: 258 41.1% Age 85 and over 42 3.1%
Householder living alone 228 36.3%
Householder not living alone 30 4.8% Under age 18 236 17.2%
Age 65 and over 285 20.8%
Housing Occupancy Status Housing Vacancy Status Total housing units 671 Vacant housing units 43
Occupied 628 93.6% For rent 16 37.2%
Vacant 43 6.4% Rented, not occupied 1 2.3%
For sale only 6 14.0%
Sold, not occupied 6 14.0%
Housing Tenure For seasonal, recreational or occasional use
0 0.0% Total occupied housing units 628
Owned with a mortgage or a loan 291 46.3% For migrant workers 0 0.0%
Owned free and clear 210 33.4%
Renter‐occupied 127 20.2% Other Vacant 14 32.6%

City of Pittsburgh Neighborhood Profiles – Census 2010 Summary File 1 (SF1) Data
University Center for Social and Urban Research – University of Pittsburgh
97
Neighborhood Rankings
The following tables are rankings of the 90 City of Pittsburgh neighborhoods for a selected set of variables
reported in the SF1 data and compiled to a neighborhood level geography. Each ranking refers to a specific
descriptive variable included in the neighborhood profiles. The list of rankings compiled here and the relevant
SF1 tables they are derived from are listed in Table 2.
Table 2. Rankings Tables
Ranking Table SF1 Tables Used to Derive Data
Total Population P3
Population Density (Persons Per Square Mile Of Land) P3
Total Population Under Age 18 P12
Total Population Age 65 And Over P12
Percentage Of Population Under Age 18 P12
Percentage Of Population Age 65 And Over P12
Population Black Alone P3
Popualtion Asian Alone P3
Percentage Of Population Black Alone P3
Percentage Of Population Asian Alone P3
Population Hispanic Or Latino P18
Percentage Of Population Hispanic Or Latino P18
Percentage Of Housing Units That Are Vacant
H3
Percentage Of Occupied Housing Units That Are Renter‐Occupied H4
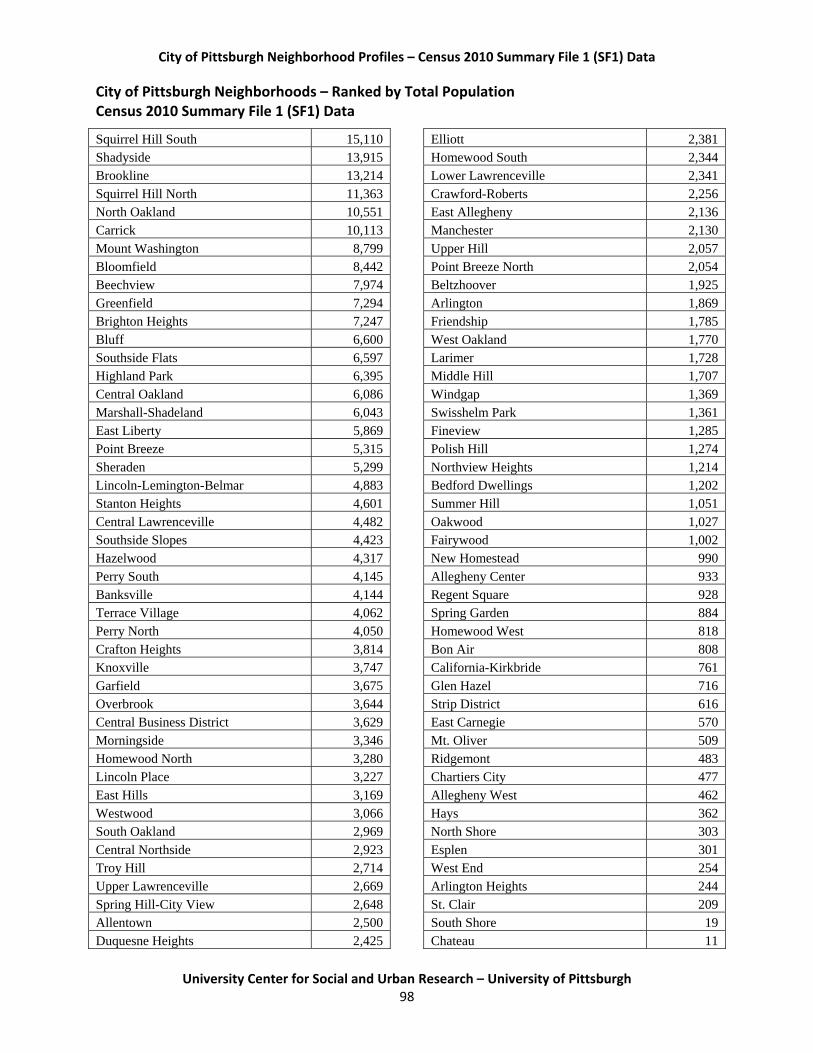
City of Pittsburgh Neighborhood Profiles – Census 2010 Summary File 1 (SF1) Data
University Center for Social and Urban Research – University of Pittsburgh
98
City of Pittsburgh Neighborhoods – Ranked by Total Population Census 2010 Summary File 1 (SF1) Data
Squirrel Hill South 15,110 Shadyside 13,915 Brookline 13,214 Squirrel Hill North 11,363 North Oakland 10,551 Carrick 10,113 Mount Washington 8,799 Bloomfield 8,442 Beechview 7,974 Greenfield 7,294 Brighton Heights 7,247 Bluff 6,600 Southside Flats 6,597 Highland Park 6,395 Central Oakland 6,086 Marshall-Shadeland 6,043 East Liberty 5,869 Point Breeze 5,315 Sheraden 5,299 Lincoln-Lemington-Belmar 4,883 Stanton Heights 4,601 Central Lawrenceville 4,482 Southside Slopes 4,423 Hazelwood 4,317 Perry South 4,145 Banksville 4,144 Terrace Village 4,062 Perry North 4,050 Crafton Heights 3,814 Knoxville 3,747 Garfield 3,675 Overbrook 3,644 Central Business District 3,629 Morningside 3,346 Homewood North 3,280 Lincoln Place 3,227 East Hills 3,169 Westwood 3,066 South Oakland 2,969 Central Northside 2,923 Troy Hill 2,714 Upper Lawrenceville 2,669 Spring Hill-City View 2,648 Allentown 2,500 Duquesne Heights 2,425
Elliott 2,381 Homewood South 2,344 Lower Lawrenceville 2,341 Crawford-Roberts 2,256 East Allegheny 2,136 Manchester 2,130 Upper Hill 2,057 Point Breeze North 2,054 Beltzhoover 1,925 Arlington 1,869 Friendship 1,785 West Oakland 1,770 Larimer 1,728 Middle Hill 1,707 Windgap 1,369 Swisshelm Park 1,361 Fineview 1,285 Polish Hill 1,274 Northview Heights 1,214 Bedford Dwellings 1,202 Summer Hill 1,051 Oakwood 1,027 Fairywood 1,002 New Homestead 990 Allegheny Center 933 Regent Square 928 Spring Garden 884 Homewood West 818 Bon Air 808 California-Kirkbride 761 Glen Hazel 716 Strip District 616 East Carnegie 570 Mt. Oliver 509 Ridgemont 483 Chartiers City 477 Allegheny West 462 Hays 362 North Shore 303 Esplen 301 West End 254 Arlington Heights 244 St. Clair 209 South Shore 19 Chateau 11

City of Pittsburgh Neighborhood Profiles – Census 2010 Summary File 1 (SF1) Data
University Center for Social and Urban Research – University of Pittsburgh
99
City of Pittsburgh Neighborhoods – Ranked by Population Density (Persons per Sqare Mile) Census 2010 Summary File 1 (SF1) Data
Central Oakland 21,742 North Oakland 21,150 Bluff 19,847 Friendship 16,808 West Oakland 16,217 Shadyside 15,103 Knoxville 12,512 Bloomfield 12,042 Central Northside 11,255 East Liberty 10,152 Greenfield 9,398 Squirrel Hill North 9,293 Terrace Village 9,084 East Allegheny 9,079 Morningside 8,976 Crawford-Roberts 8,752 Allentown 8,368 Garfield 8,034 Mount Washington 7,638 Manchester 7,629 Homewood North 7,581 Southside Flats 7,223 Point Breeze North 7,040 Bedford Dwellings 6,729 Upper Hill 6,607 Upper Lawrenceville 6,584 Brighton Heights 6,438 Brookline 6,337 Stanton Heights 6,202 Southside Slopes 6,156 Carrick 6,048 Homewood South 5,949 Sheraden 5,946 East Hills 5,847 South Oakland 5,821 Troy Hill 5,736 Highland Park 5,729 Squirrel Hill South 5,644 Central Business District 5,597 Middle Hill 5,594 Beechview 5,447 Lower Lawrenceville 5,417 Point Breeze 5,296 Fineview 5,171 Crafton Heights 5,076
Polish Hill 5,018 Mt. Oliver 4,913 Marshall-Shadeland 4,866 Regent Square 4,732 Central Lawrenceville 4,660 Beltzhoover 4,659 Perry South 4,523 Allegheny Center 4,509 Westwood 4,438 Overbrook 4,352 Banksville 4,257 Spring Hill-City View 4,165 Homewood West 4,113 Oakwood 4,069 Duquesne Heights 3,915 Larimer 3,882 Elliott 3,880 Northview Heights 3,872 Arlington 3,793 Chartiers City 3,604 California-Kirkbride 3,518 Spring Garden 3,356 Lincoln Place 3,288 Windgap 3,287 Perry North 3,269 Allegheny West 3,196 Swisshelm Park 2,874 Lincoln-Lemington-Belmar 2,737 Hazelwood 2,722 Summer Hill 2,573 Bon Air 2,558 Arlington Heights 2,148 Glen Hazel 1,548 Ridgemont 1,347 East Carnegie 1,316 Esplen 1,293 West End 1,284 New Homestead 1,252 Fairywood 1,030 North Shore 1,009 Strip District 1,001 St. Clair 670 Hays 209 South Shore 87 Chateau 29

City of Pittsburgh Neighborhood Profiles – Census 2010 Summary File 1 (SF1) Data
University Center for Social and Urban Research – University of Pittsburgh
100
City of Pittsburgh Neighborhoods – Ranked by Total Population Under Age 18 Census 2010 Summary File 1 (SF1) Data
Brookline 2,548 Squirrel Hill South 2,450 Carrick 2,064 Beechview 1,518 Brighton Heights 1,484 Squirrel Hill North 1,434 Sheraden 1,372 Highland Park 1,189 Greenfield 1,114 Knoxville 1,110 East Liberty 1,086 Lincoln-Lemington-Belmar 1,083 Point Breeze 1,074 Perry South 1,068 Mount Washington 1,053 Hazelwood 1,044 Garfield 1,031 East Hills 1,025 Crafton Heights 985 Marshall-Shadeland 976 Homewood North 964 Shadyside 910 Perry North 896 Stanton Heights 864 Terrace Village 857 Bloomfield 806 Allentown 660 Homewood South 648 Spring Hill-City View 632 Overbrook 621 Upper Lawrenceville 605 Morningside 598 Central Lawrenceville 570 Westwood 566 Lincoln Place 564 Elliott 543 Beltzhoover 536 Banksville 530 Southside Slopes 519 Northview Heights 515 Troy Hill 483 Crawford-Roberts 463 Manchester 460 Central Northside 424 Arlington 424
Larimer 409 Bedford Dwellings 355 Upper Hill 351 Lower Lawrenceville 350 Point Breeze North 330 Fineview 310 Middle Hill 298 Southside Flats 296 Swisshelm Park 276 East Allegheny 268 Duquesne Heights 258 California-Kirkbride 239 Windgap 236 South Oakland 210 New Homestead 201 Summer Hill 201 Homewood West 186 Friendship 184 Spring Garden 167 Allegheny Center 164 Oakwood 161 Polish Hill 155 Regent Square 151 North Oakland 149 Glen Hazel 148 Bon Air 138 Mt. Oliver 133 Bluff 127 Fairywood 109 Ridgemont 92 Central Oakland 91 East Carnegie 89 Esplen 74 Arlington Heights 73 Chartiers City 72 Central Business District 68 Hays 65 West Oakland 52 St. Clair 52 West End 51 Strip District 49 Allegheny West 36 North Shore 8 South Shore 1 Chateau 0

City of Pittsburgh Neighborhood Profiles – Census 2010 Summary File 1 (SF1) Data
University Center for Social and Urban Research – University of Pittsburgh
101
City of Pittsburgh Neighborhoods – Ranked by Total Population Age 65 and Over Census 2010 Summary File 1 (SF1) Data
Squirrel Hill South 2,563 Brookline 2,017 Carrick 1,521 Shadyside 1,469 Squirrel Hill North 1,313 Mount Washington 1,270 Beechview 1,206 Brighton Heights 1,197 North Oakland 1,135 Greenfield 1,119 Bloomfield 1,042 Lincoln-Lemington-Belmar 1,035 Central Lawrenceville 955 East Liberty 886 Stanton Heights 852 Banksville 806 Southside Flats 779 Highland Park 763 Point Breeze 750 Overbrook 706 Sheraden 637 Hazelwood 619 Perry South 611 Lincoln Place 560 Westwood 554 Southside Slopes 546 Crafton Heights 533 Marshall-Shadeland 513 Morningside 513 Upper Hill 512 East Hills 470 Crawford-Roberts 469 Garfield 465 Homewood South 462 Perry North 461 Spring Hill-City View 447 Central Business District 434 Homewood North 431 Duquesne Heights 408 Knoxville 384 Central Northside 377 Middle Hill 367 Larimer 341 Troy Hill 331 Beltzhoover 329
South Oakland 318 Terrace Village 313 Elliott 306 Lower Lawrenceville 305 Manchester 294 East Allegheny 291 Windgap 285 Point Breeze North 282 Upper Lawrenceville 264 Allentown 244 Swisshelm Park 244 Central Oakland 229 Glen Hazel 229 Oakwood 223 Arlington 215 Polish Hill 204 Homewood West 201 Summer Hill 192 New Homestead 181 Bedford Dwellings 179 Allegheny Center 165 Northview Heights 158 Bon Air 152 Friendship 147 Fineview 141 Chartiers City 136 Regent Square 136 Spring Garden 124 West Oakland 122 Bluff 108 Ridgemont 80 California-Kirkbride 73 East Carnegie 66 Hays 62 Fairywood 54 Mt. Oliver 54 Allegheny West 45 Strip District 44 Esplen 31 St. Clair 29 Arlington Heights 25 West End 24 North Shore 15 Chateau 2 South Shore 1

City of Pittsburgh Neighborhood Profiles – Census 2010 Summary File 1 (SF1) Data
University Center for Social and Urban Research – University of Pittsburgh
102
City of Pittsburgh Neighborhoods – Percentage of Population Under Age 18 Census 2010 Summary File 1 (SF1) Data
Northview Heights 42.4 East Hills 32.3 California-Kirkbride 31.4 Arlington Heights 29.9 Knoxville 29.6 Bedford Dwellings 29.5 Homewood North 29.4 Garfield 28.1 Beltzhoover 27.8 Homewood South 27.6 Allentown 26.4 Mt. Oliver 26.1 Sheraden 25.9 Crafton Heights 25.8 Perry South 25.8 St. Clair 24.9 Esplen 24.6 Hazelwood 24.2 Fineview 24.1 Spring Hill-City View 23.9 Larimer 23.7 Elliott 22.8 Homewood West 22.7 Arlington 22.7 Upper Lawrenceville 22.7 Lincoln-Lemington-Belmar 22.2 Perry North 22.1 Manchester 21.6 Terrace Village 21.1 Glen Hazel 20.7 Crawford-Roberts 20.5 Brighton Heights 20.5 Carrick 20.4 New Homestead 20.3 Swisshelm Park 20.3 Point Breeze 20.2 West End 20.1 Brookline 19.3 Summer Hill 19.1 Ridgemont 19.0 Beechview 19.0 Spring Garden 18.9 Stanton Heights 18.8 Highland Park 18.6 East Liberty 18.5
Westwood 18.5 Hays 18.0 Morningside 17.9 Troy Hill 17.8 Allegheny Center 17.6 Lincoln Place 17.5 Middle Hill 17.5 Windgap 17.2 Bon Air 17.1 Upper Hill 17.1 Overbrook 17.0 Regent Square 16.3 Squirrel Hill South 16.2 Marshall-Shadeland 16.2 Point Breeze North 16.1 Oakwood 15.7 East Carnegie 15.6 Greenfield 15.3 Chartiers City 15.1 Lower Lawrenceville 15.0 Central Northside 14.5 Banksville 12.8 Central Lawrenceville 12.7 Squirrel Hill North 12.6 East Allegheny 12.5 Polish Hill 12.2 Mount Washington 12.0 Southside Slopes 11.7 Fairywood 10.9 Duquesne Heights 10.6 Friendship 10.3 Bloomfield 9.5 Strip District 8.0 Allegheny West 7.8 South Oakland 7.1 Shadyside 6.5 South Shore 5.3 Southside Flats 4.5 West Oakland 2.9 North Shore 2.6 Bluff 1.9 Central Business District 1.9 Central Oakland 1.5 North Oakland 1.4 Chateau 0.0
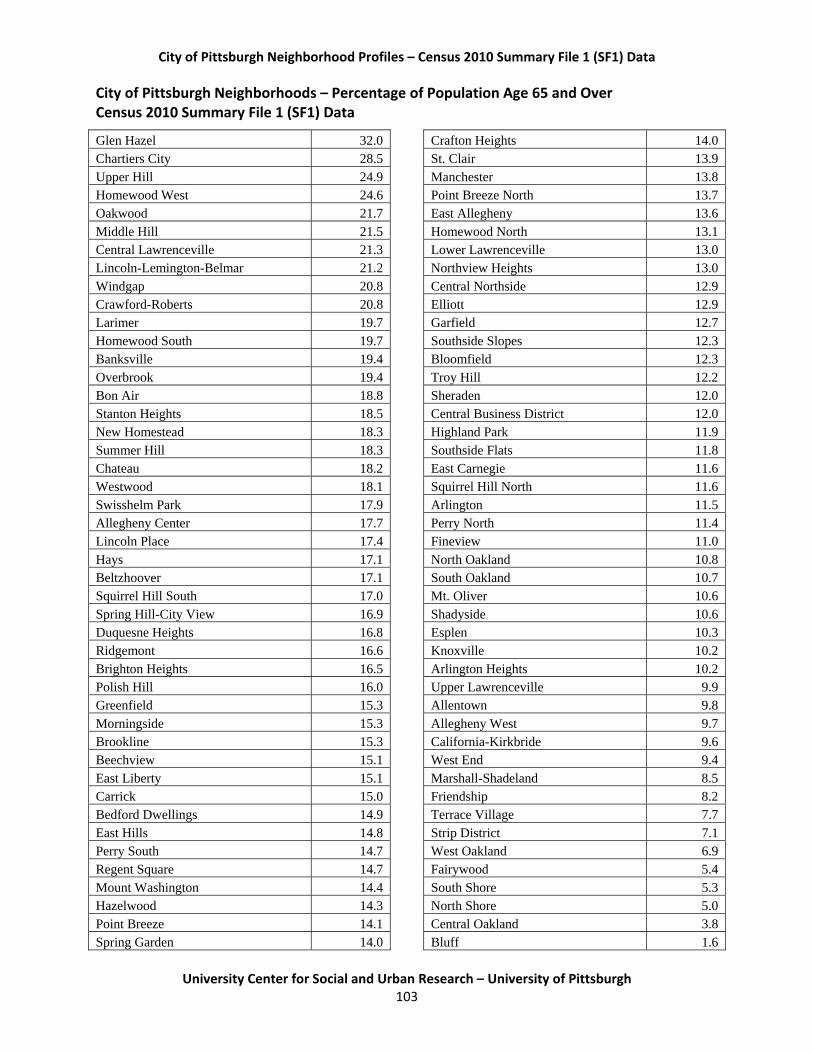
City of Pittsburgh Neighborhood Profiles – Census 2010 Summary File 1 (SF1) Data
University Center for Social and Urban Research – University of Pittsburgh
103
City of Pittsburgh Neighborhoods – Percentage of Population Age 65 and Over Census 2010 Summary File 1 (SF1) Data
Glen Hazel 32.0 Chartiers City 28.5 Upper Hill 24.9 Homewood West 24.6 Oakwood 21.7 Middle Hill 21.5 Central Lawrenceville 21.3 Lincoln-Lemington-Belmar 21.2 Windgap 20.8 Crawford-Roberts 20.8 Larimer 19.7 Homewood South 19.7 Banksville 19.4 Overbrook 19.4 Bon Air 18.8 Stanton Heights 18.5 New Homestead 18.3 Summer Hill 18.3 Chateau 18.2 Westwood 18.1 Swisshelm Park 17.9 Allegheny Center 17.7 Lincoln Place 17.4 Hays 17.1 Beltzhoover 17.1 Squirrel Hill South 17.0 Spring Hill-City View 16.9 Duquesne Heights 16.8 Ridgemont 16.6 Brighton Heights 16.5 Polish Hill 16.0 Greenfield 15.3 Morningside 15.3 Brookline 15.3 Beechview 15.1 East Liberty 15.1 Carrick 15.0 Bedford Dwellings 14.9 East Hills 14.8 Perry South 14.7 Regent Square 14.7 Mount Washington 14.4 Hazelwood 14.3 Point Breeze 14.1 Spring Garden 14.0
Crafton Heights 14.0 St. Clair 13.9 Manchester 13.8 Point Breeze North 13.7 East Allegheny 13.6 Homewood North 13.1 Lower Lawrenceville 13.0 Northview Heights 13.0 Central Northside 12.9 Elliott 12.9 Garfield 12.7 Southside Slopes 12.3 Bloomfield 12.3 Troy Hill 12.2 Sheraden 12.0 Central Business District 12.0 Highland Park 11.9 Southside Flats 11.8 East Carnegie 11.6 Squirrel Hill North 11.6 Arlington 11.5 Perry North 11.4 Fineview 11.0 North Oakland 10.8 South Oakland 10.7 Mt. Oliver 10.6 Shadyside 10.6 Esplen 10.3 Knoxville 10.2 Arlington Heights 10.2 Upper Lawrenceville 9.9 Allentown 9.8 Allegheny West 9.7 California-Kirkbride 9.6 West End 9.4 Marshall-Shadeland 8.5 Friendship 8.2 Terrace Village 7.7 Strip District 7.1 West Oakland 6.9 Fairywood 5.4 South Shore 5.3 North Shore 5.0 Central Oakland 3.8 Bluff 1.6

City of Pittsburgh Neighborhood Profiles – Census 2010 Summary File 1 (SF1) Data
University Center for Social and Urban Research – University of Pittsburgh
104
City of Pittsburgh Neighborhoods – Total Population Black Alone Census 2010 SF1 Data
East Liberty 3,976 Lincoln-Lemington-Belmar 3,876 Homewood North 3,060 East Hills 2,953 Garfield 2,943 Perry South 2,849 Terrace Village 2,839 Marshall-Shadeland 2,618 Homewood South 2,220 Sheraden 2,186 Bluff 2,057 Knoxville 1,930 Crawford-Roberts 1,861 Stanton Heights 1,843 Hazelwood 1,771 Manchester 1,707 Highland Park 1,684 Middle Hill 1,610 Beltzhoover 1,604 Upper Hill 1,593 Brighton Heights 1,583 Larimer 1,483 Central Northside 1,347 Perry North 1,310 Point Breeze North 1,137 Bedford Dwellings 1,106 Northview Heights 1,099 Crafton Heights 1,093 Carrick 972 Beechview 963 Mount Washington 906 Allentown 878 North Oakland 857 Homewood West 782 Spring Hill-City View 754 Shadyside 751 Upper Lawrenceville 751 Bloomfield 739 Elliott 704 Fineview 665 East Allegheny 643 South Oakland 633 Brookline 608 Central Business District 580 California-Kirkbride 578
Morningside 552 Lower Lawrenceville 546 Glen Hazel 488 Squirrel Hill South 487 Windgap 476 Allegheny Center 453 Central Lawrenceville 422 Arlington 371 Squirrel Hill North 368 Friendship 362 West Oakland 346 Troy Hill 331 Chartiers City 325 Central Oakland 321 Greenfield 320 Southside Slopes 316 Fairywood 284 Westwood 250 Point Breeze 247 Arlington Heights 205 Southside Flats 196 Mt. Oliver 192 Banksville 169 Summer Hill 160 Polish Hill 155 Spring Garden 134 Overbrook 129 St. Clair 98 Strip District 96 West End 95 East Carnegie 92 Esplen 90 New Homestead 88 Allegheny West 84 Duquesne Heights 69 Oakwood 60 Swisshelm Park 57 Lincoln Place 48 Bon Air 35 Ridgemont 31 Hays 26 Regent Square 17 North Shore 14 Chateau 3 South Shore 0

City of Pittsburgh Neighborhood Profiles – Census 2010 Summary File 1 (SF1) Data
University Center for Social and Urban Research – University of Pittsburgh
105
City of Pittsburgh Neighborhoods – Total Population Asian Alone Census 2010 SF1 Data
Shadyside 2,764 Squirrel Hill North 1,935 Squirrel Hill South 1,723 North Oakland 1,607 Bloomfield 542 Central Oakland 518 Greenfield 312 Friendship 226 Highland Park 218 Banksville 211 East Liberty 190 South Oakland 183 Point Breeze 178 Westwood 174 Central Business District 171 West Oakland 153 Brookline 152 Southside Flats 143 Sheraden 128 Beechview 125 Carrick 113 Troy Hill 108 Garfield 97 Terrace Village 93 Lincoln-Lemington-Belmar 83 Central Lawrenceville 78 Bluff 73 Hazelwood 66 Point Breeze North 64 Mount Washington 63 Lower Lawrenceville 59 Allegheny Center 56 Duquesne Heights 53 Brighton Heights 47 Swisshelm Park 43 Southside Slopes 42 Stanton Heights 40 Strip District 39 Upper Lawrenceville 37 Perry North 36 Morningside 33 Knoxville 33 Overbrook 33 Regent Square 29 Crafton Heights 28
Crawford-Roberts 24 East Allegheny 23 Central Northside 23 Upper Hill 21 Perry South 21 Larimer 20 Fairywood 18 Spring Hill-City View 18 North Shore 17 Polish Hill 16 Elliott 16 Marshall-Shadeland 15 East Hills 14 Manchester 13 Bon Air 12 Oakwood 11 Spring Garden 8 Allegheny West 7 Homewood North 7 Windgap 7 Homewood South 7 Lincoln Place 7 Hays 6 Ridgemont 6 New Homestead 5 East Carnegie 3 Beltzhoover 3 Bedford Dwellings 3 Arlington 3 Mt. Oliver 2 Esplen 2 Middle Hill 2 West End 2 Allentown 1 Northview Heights 1 Fineview 1 Homewood West 1 Summer Hill 0 Glen Hazel 0 Arlington Heights 0 California-Kirkbride 0 St. Clair 0 Chartiers City 0 South Shore 0 Chateau 0

City of Pittsburgh Neighborhood Profiles – Census 2010 Summary File 1 (SF1) Data
University Center for Social and Urban Research – University of Pittsburgh
106
City of Pittsburgh Neighborhoods – Percentage of Population Black Alone Census 2010 SF1 Data
Homewood West 95.6 Homewood South 94.7 Middle Hill 94.3 Homewood North 93.3 East Hills 93.2 Bedford Dwellings 92.0 Northview Heights 90.5 Larimer 85.8 Arlington Heights 84.0 Beltzhoover 83.3 Crawford-Roberts 82.5 Manchester 80.1 Garfield 80.1 Lincoln-Lemington-Belmar 79.4 Upper Hill 77.4 California-Kirkbride 76.0 Terrace Village 69.9 Perry South 68.7 Glen Hazel 68.2 Chartiers City 68.1 East Liberty 67.7 Point Breeze North 55.4 Fineview 51.8 Knoxville 51.5 Allegheny Center 48.6 St. Clair 46.9 Central Northside 46.1 Marshall-Shadeland 43.3 Sheraden 41.3 Hazelwood 41.0 Stanton Heights 40.1 Mt. Oliver 37.7 West End 37.4 Allentown 35.1 Windgap 34.8 Perry North 32.3 Bluff 31.2 East Allegheny 30.1 Esplen 29.9 Elliott 29.6 Crafton Heights 28.7 Spring Hill-City View 28.5 Fairywood 28.3 Upper Lawrenceville 28.1 Chateau 27.3
Highland Park 26.3 Lower Lawrenceville 23.3 Brighton Heights 21.8 South Oakland 21.3 Friendship 20.3 Arlington 19.9 West Oakland 19.5 Allegheny West 18.2 Morningside 16.5 East Carnegie 16.1 Central Business District 16.0 Strip District 15.6 Summer Hill 15.2 Spring Garden 15.2 Troy Hill 12.2 Polish Hill 12.2 Beechview 12.1 Mount Washington 10.3 Carrick 9.6 Central Lawrenceville 9.4 New Homestead 8.9 Bloomfield 8.8 Westwood 8.2 North Oakland 8.1 Hays 7.2 Southside Slopes 7.1 Ridgemont 6.4 Oakwood 5.8 Shadyside 5.4 Central Oakland 5.3 Point Breeze 4.6 North Shore 4.6 Brookline 4.6 Greenfield 4.4 Bon Air 4.3 Swisshelm Park 4.2 Banksville 4.1 Overbrook 3.5 Squirrel Hill North 3.2 Squirrel Hill South 3.2 Southside Flats 3.0 Duquesne Heights 2.8 Regent Square 1.8 Lincoln Place 1.5 South Shore 0.0

City of Pittsburgh Neighborhood Profiles – Census 2010 Summary File 1 (SF1) Data
University Center for Social and Urban Research – University of Pittsburgh
107
City of Pittsburgh Neighborhoods – Percentage of Population Asian Alone Census 2010 SF1 Data
Shadyside 19.9 Squirrel Hill North 17.0 North Oakland 15.2 Friendship 12.7 Squirrel Hill South 11.4 West Oakland 8.6 Central Oakland 8.5 Bloomfield 6.4 Strip District 6.3 South Oakland 6.2 Allegheny Center 6.0 Westwood 5.7 North Shore 5.6 Banksville 5.1 Central Business District 4.7 Greenfield 4.3 Troy Hill 4.0 Highland Park 3.4 Point Breeze 3.3 East Liberty 3.2 Swisshelm Park 3.2 Regent Square 3.1 Point Breeze North 3.1 Garfield 2.6 Lower Lawrenceville 2.5 Sheraden 2.4 Terrace Village 2.3 Duquesne Heights 2.2 Southside Flats 2.2 Fairywood 1.8 Central Lawrenceville 1.7 Lincoln-Lemington-Belmar 1.7 Hays 1.7 Beechview 1.6 Hazelwood 1.5 Allegheny West 1.5 Bon Air 1.5 Upper Lawrenceville 1.4 Polish Hill 1.3 Ridgemont 1.2 Larimer 1.2 Brookline 1.2 Carrick 1.1 Bluff 1.1 East Allegheny 1.1
Oakwood 1.1 Crawford-Roberts 1.1 Upper Hill 1.0 Morningside 1.0 Southside Slopes 0.9 Overbrook 0.9 Spring Garden 0.9 Perry North 0.9 Knoxville 0.9 Stanton Heights 0.9 West End 0.8 Central Northside 0.8 Crafton Heights 0.7 Mount Washington 0.7 Spring Hill-City View 0.7 Elliott 0.7 Esplen 0.7 Brighton Heights 0.6 Manchester 0.6 East Carnegie 0.5 Windgap 0.5 Perry South 0.5 New Homestead 0.5 East Hills 0.4 Mt. Oliver 0.4 Homewood South 0.3 Bedford Dwellings 0.2 Marshall-Shadeland 0.2 Lincoln Place 0.2 Homewood North 0.2 Arlington 0.2 Beltzhoover 0.2 Homewood West 0.1 Middle Hill 0.1 Northview Heights 0.1 Fineview 0.1 Allentown 0.0 Summer Hill 0.0 Glen Hazel 0.0 Arlington Heights 0.0 California-Kirkbride 0.0 St. Clair 0.0 Chartiers City 0.0 South Shore 0.0 Chateau 0.0

City of Pittsburgh Neighborhood Profiles – Census 2010 Summary File 1 (SF1) Data
University Center for Social and Urban Research – University of Pittsburgh
108
City of Pittsburgh Neighborhoods – Total Population Hispanic or Latino Census 2010 SF1 Data
Squirrel Hill South 488 Squirrel Hill North 469 Shadyside 458 Beechview 444 North Oakland 284 Bloomfield 219 Brookline 211 Greenfield 209 Highland Park 188 Marshall-Shadeland 176 Carrick 166 Southside Flats 162 Bluff 161 Central Oakland 157 East Liberty 142 Mount Washington 140 Point Breeze 137 Central Business District 119 Brighton Heights 115 Southside Slopes 92 Hazelwood 87 East Allegheny 86 South Oakland 86 Sheraden 84 Upper Lawrenceville 83 Central Northside 80 Central Lawrenceville 78 Friendship 76 Perry North 71 Point Breeze North 69 Stanton Heights 66 Homewood North 61 Lincoln-Lemington-Belmar 59 Allentown 58 Crafton Heights 58 Banksville 56 Morningside 52 Garfield 51 West Oakland 50 Troy Hill 50 Knoxville 49 Fairywood 48 Terrace Village 46 Westwood 44 Perry South 44
Spring Hill-City View 42 Beltzhoover 39 Overbrook 39 Elliott 37 East Hills 37 Larimer 32 Crawford-Roberts 32 Swisshelm Park 31 Lower Lawrenceville 30 Duquesne Heights 30 Upper Hill 29 Manchester 29 Polish Hill 28 Allegheny Center 27 Arlington 27 East Carnegie 25 Northview Heights 25 Fineview 25 Regent Square 23 Homewood South 21 Spring Garden 20 Bedford Dwellings 19 Lincoln Place 19 New Homestead 17 Windgap 16 Middle Hill 15 Hays 13 Allegheny West 13 North Shore 11 Oakwood 11 Summer Hill 11 Strip District 10 Mt. Oliver 9 Ridgemont 7 Glen Hazel 7 Bon Air 7 Homewood West 7 California-Kirkbride 5 Esplen 4 Arlington Heights 2 Chartiers City 2 St. Clair 1 West End 1 South Shore 0 Chateau 0

City of Pittsburgh Neighborhood Profiles – Census 2010 Summary File 1 (SF1) Data
University Center for Social and Urban Research – University of Pittsburgh
109
City of Pittsburgh Neighborhoods – Percentage of Population Hispanic or Latino Census 2010 SF1 Data
Beechview 5.6 Fairywood 4.8 East Carnegie 4.4 Friendship 4.3 Squirrel Hill North 4.1 East Allegheny 4.0 North Shore 3.6 Hays 3.6 Point Breeze North 3.4 Shadyside 3.3 Central Business District 3.3 Squirrel Hill South 3.2 Upper Lawrenceville 3.1 Highland Park 2.9 Marshall-Shadeland 2.9 South Oakland 2.9 Allegheny Center 2.9 Greenfield 2.9 West Oakland 2.8 Allegheny West 2.8 Central Northside 2.7 North Oakland 2.7 Bloomfield 2.6 Central Oakland 2.6 Point Breeze 2.6 Regent Square 2.5 Southside Flats 2.5 Bluff 2.4 East Liberty 2.4 Allentown 2.3 Swisshelm Park 2.3 Spring Garden 2.3 Polish Hill 2.2 Southside Slopes 2.1 Northview Heights 2.1 Beltzhoover 2.0 Hazelwood 2.0 Fineview 1.9 Homewood North 1.9 Larimer 1.9 Troy Hill 1.8 Mt. Oliver 1.8 Perry North 1.8 Central Lawrenceville 1.7 Carrick 1.6
Strip District 1.6 Brookline 1.6 Mount Washington 1.6 Brighton Heights 1.6 Spring Hill-City View 1.6 Sheraden 1.6 Bedford Dwellings 1.6 Morningside 1.6 Elliott 1.6 Crafton Heights 1.5 Ridgemont 1.4 Arlington 1.4 Westwood 1.4 Stanton Heights 1.4 Crawford-Roberts 1.4 Upper Hill 1.4 Garfield 1.4 Manchester 1.4 Banksville 1.4 Esplen 1.3 Knoxville 1.3 Lower Lawrenceville 1.3 Duquesne Heights 1.2 Lincoln-Lemington-Belmar 1.2 Windgap 1.2 East Hills 1.2 Terrace Village 1.1 Oakwood 1.1 Overbrook 1.1 Perry South 1.1 Summer Hill 1.0 Glen Hazel 1.0 Homewood South 0.9 Middle Hill 0.9 Bon Air 0.9 Homewood West 0.9 Arlington Heights 0.8 California-Kirkbride 0.7 Lincoln Place 0.6 St. Clair 0.5 Chartiers City 0.4 West End 0.4 South Shore 0.0 South Shore 0.0 Chateau 0.0

City of Pittsburgh Neighborhood Profiles – Census 2010 Summary File 1 (SF1) Data
University Center for Social and Urban Research – University of Pittsburgh
110
City of Pittsburgh Neighborhoods – Percentage of Housing Units that are Vacant Census 2010 SF1 Data
St. Clair 49.7 Allegheny Center 48.5 Northview Heights 36.4 South Shore 33.3 Homewood South 28.4 Homewood North 28.4 Bluff 27.3 Beltzhoover 26.5 Larimer 25.8 West End 25.5 Spring Garden 25.4 Allegheny West 25.1 Perry South 23.5 Garfield 23.1 Homewood West 22.2 Manchester 21.5 Knoxville 21.4 Esplen 21.1 California-Kirkbride 20.6 East Allegheny 20.6 Lincoln-Lemington-Belmar 20.3 Hazelwood 20.2 Allentown 20.0 Central Northside 19.5 Fineview 19.5 Elliott 19.1 Upper Lawrenceville 19.0 Marshall-Shadeland 18.9 Central Business District 18.6 Hays 18.2 Upper Hill 18.1 Polish Hill 17.9 Middle Hill 17.9 Southside Slopes 16.5 Mt. Oliver 16.4 Troy Hill 16.1 Terrace Village 15.3 Sheraden 15.0 West Oakland 15.0 Lower Lawrenceville 14.9 Strip District 14.8 North Shore 14.5 Central Lawrenceville 14.1 Fairywood 13.9 Mount Washington 13.7
Arlington 13.4 East Hills 13.4 East Liberty 13.2 Perry North 13.0 Southside Flats 12.7 Bedford Dwellings 12.7 Spring Hill-City View 12.5 Carrick 11.8 Crafton Heights 11.5 Duquesne Heights 11.3 Bloomfield 11.0 Point Breeze North 11.0 East Carnegie 10.8 Beechview 10.7 South Oakland 10.1 Brighton Heights 9.8 Chartiers City 9.7 Crawford-Roberts 9.1 Arlington Heights 8.8 Greenfield 8.6 Highland Park 8.3 Friendship 7.9 Lincoln Place 7.3 Morningside 7.1 Overbrook 7.1 Squirrel Hill North 7.0 Shadyside 6.7 Brookline 6.5 Windgap 6.4 Westwood 6.2 New Homestead 6.1 Bon Air 5.9 Central Oakland 5.8 Summer Hill 5.7 Stanton Heights 5.7 North Oakland 5.5 Squirrel Hill South 5.4 Glen Hazel 5.2 Point Breeze 4.9 Regent Square 4.8 Banksville 4.6 Oakwood 4.6 Ridgemont 4.1 Swisshelm Park 3.7 Chateau 0.0

City of Pittsburgh Neighborhood Profiles – Census 2010 Summary File 1 (SF1) Data
University Center for Social and Urban Research – University of Pittsburgh
111
City of Pittsburgh Neighborhoods – Percentage of Housing Units that are Renter‐Occupied Census 2010 SF1 Data
North Shore 98.5 Northview Heights 96.3 Arlington Heights 96.3 Bedford Dwellings 91.9 Allegheny Center 91.7 Central Oakland 91.6 Glen Hazel 91.5 Terrace Village 91.1 Strip District 90.8 Friendship 85.3 East Liberty 83.9 Central Business District 82.6 Fairywood 82.2 South Shore 80.0 Crawford-Roberts 77.2 West End 75.6 North Oakland 75.2 Shadyside 74.0 East Allegheny 71.2 Middle Hill 69.7 California-Kirkbride 67.3 Allegheny West 66.9 Southside Flats 66.8 Bloomfield 66.2 Bluff 65.6 South Oakland 64.8 Central Northside 64.5 Point Breeze North 64.5 Homewood West 62.1 Lower Lawrenceville 62.0 Homewood South 61.7 Manchester 57.1 Allentown 56.8 Squirrel Hill South 56.4 East Hills 56.1 Garfield 54.9 Upper Lawrenceville 54.9 Larimer 54.8 Fineview 54.1 Troy Hill 54.0 Perry South 53.8 Central Lawrenceville 53.4 Homewood North 53.3 Mount Washington 52.4 Oakwood 52.1
Lincoln-Lemington-Belmar 50.1 Chateau 50.0 Polish Hill 49.9 Highland Park 49.8 West Oakland 49.7 Banksville 47.8 Upper Hill 47.7 Knoxville 47.5 Southside Slopes 47.2 Hazelwood 45.1 Squirrel Hill North 43.0 Elliott 42.5 East Carnegie 42.4 Spring Hill-City View 42.0 Duquesne Heights 41.7 Sheraden 41.2 Beltzhoover 40.9 Esplen 40.5 Marshall-Shadeland 39.7 Beechview 39.6 Greenfield 38.2 Carrick 37.5 Crafton Heights 37.1 Spring Garden 36.9 Perry North 35.2 Morningside 35.0 Brighton Heights 34.8 Mt. Oliver 34.5 Hays 34.3 Arlington 32.5 St. Clair 31.3 Westwood 30.4 Regent Square 28.5 Point Breeze 28.4 Brookline 26.0 Windgap 20.2 Summer Hill 19.5 Stanton Heights 19.4 Overbrook 19.1 Chartiers City 17.4 Lincoln Place 15.9 Swisshelm Park 14.5 Bon Air 12.9 Ridgemont 10.5 New Homestead 9.2
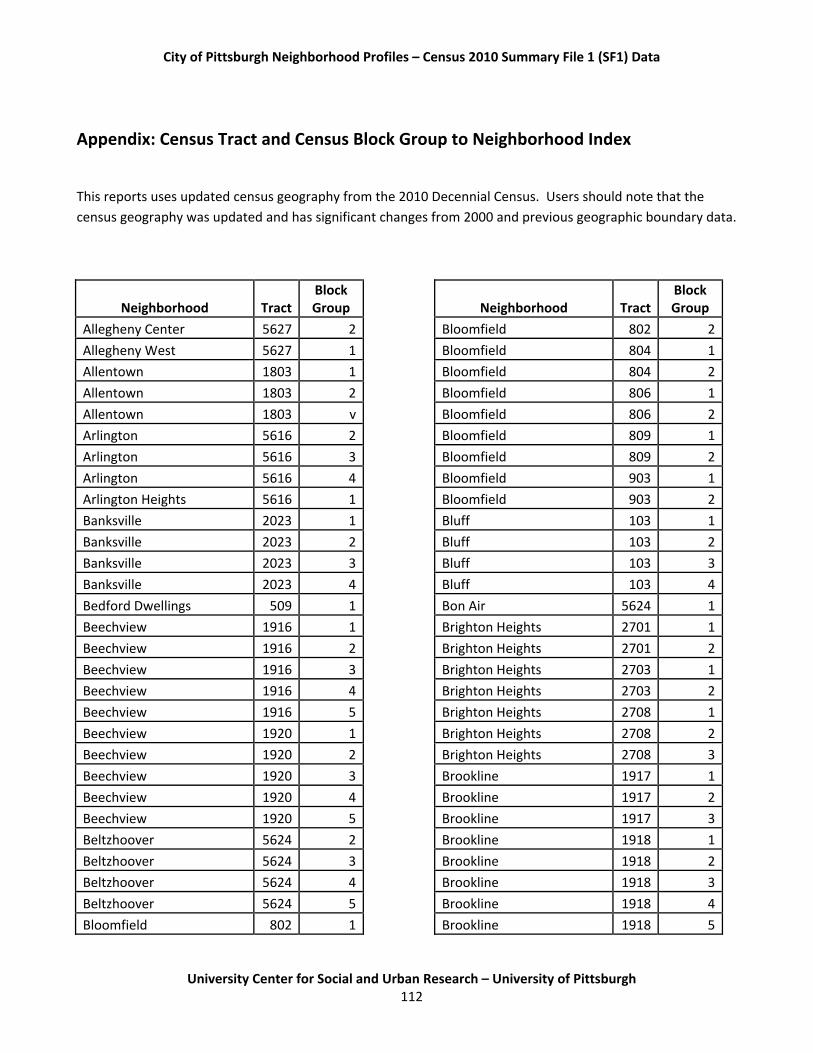
City of Pittsburgh Neighborhood Profiles – Census 2010 Summary File 1 (SF1) Data
University Center for Social and Urban Research – University of Pittsburgh
112
Appendix: Census Tract and Census Block Group to Neighborhood Index
This reports uses updated census geography from the 2010 Decennial Census. Users should note that the
census geography was updated and has significant changes from 2000 and previous geographic boundary data.
Neighborhood Tract Block Group
Allegheny Center 5627 2
Allegheny West 5627 1
Allentown 1803 1
Allentown 1803 2
Allentown 1803 v
Arlington 5616 2
Arlington 5616 3
Arlington 5616 4
Arlington Heights 5616 1
Banksville 2023 1
Banksville 2023 2
Banksville 2023 3
Banksville 2023 4
Bedford Dwellings 509 1
Beechview 1916 1
Beechview 1916 2
Beechview 1916 3
Beechview 1916 4
Beechview 1916 5
Beechview 1920 1
Beechview 1920 2
Beechview 1920 3
Beechview 1920 4
Beechview 1920 5
Beltzhoover 5624 2
Beltzhoover 5624 3
Beltzhoover 5624 4
Beltzhoover 5624 5
Bloomfield 802 1
Neighborhood Tract Block Group
Bloomfield 802 2
Bloomfield 804 1
Bloomfield 804 2
Bloomfield 806 1
Bloomfield 806 2
Bloomfield 809 1
Bloomfield 809 2
Bloomfield 903 1
Bloomfield 903 2
Bluff 103 1
Bluff 103 2
Bluff 103 3
Bluff 103 4
Bon Air 5624 1
Brighton Heights 2701 1
Brighton Heights 2701 2
Brighton Heights 2703 1
Brighton Heights 2703 2
Brighton Heights 2708 1
Brighton Heights 2708 2
Brighton Heights 2708 3
Brookline 1917 1
Brookline 1917 2
Brookline 1917 3
Brookline 1918 1
Brookline 1918 2
Brookline 1918 3
Brookline 1918 4
Brookline 1918 5
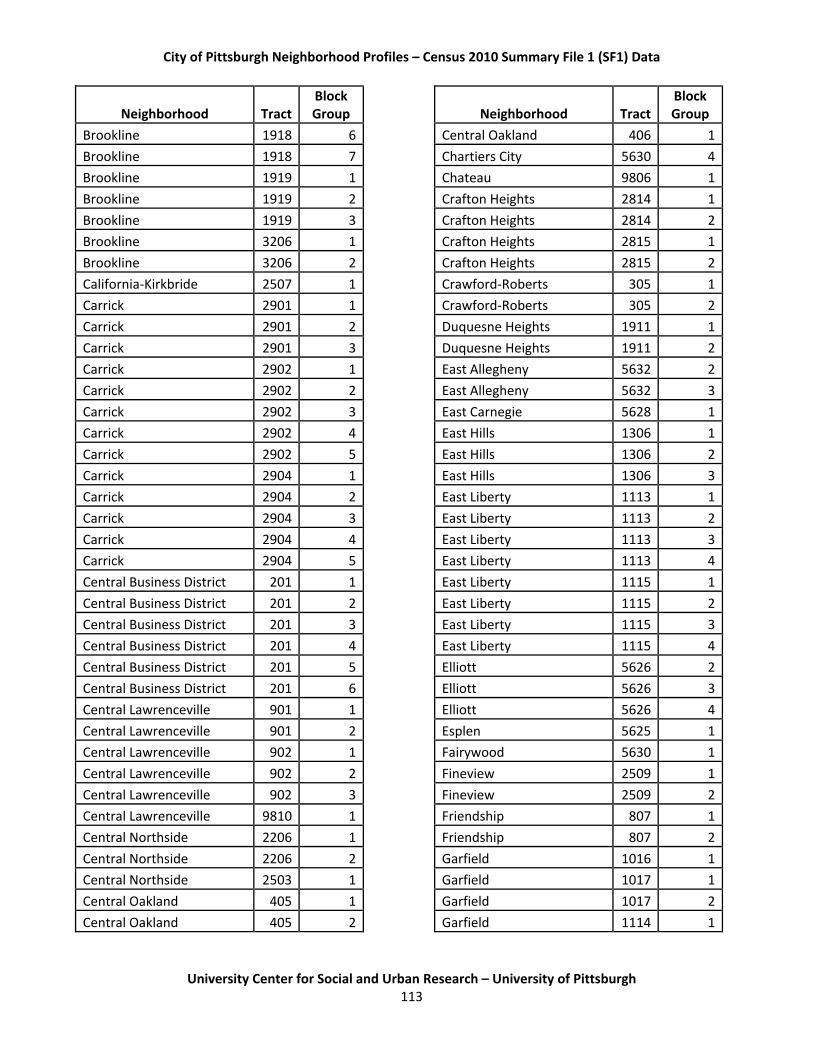
City of Pittsburgh Neighborhood Profiles – Census 2010 Summary File 1 (SF1) Data
University Center for Social and Urban Research – University of Pittsburgh
113
Neighborhood Tract Block Group
Brookline 1918 6
Brookline 1918 7
Brookline 1919 1
Brookline 1919 2
Brookline 1919 3
Brookline 3206 1
Brookline 3206 2
California‐Kirkbride 2507 1
Carrick 2901 1
Carrick 2901 2
Carrick 2901 3
Carrick 2902 1
Carrick 2902 2
Carrick 2902 3
Carrick 2902 4
Carrick 2902 5
Carrick 2904 1
Carrick 2904 2
Carrick 2904 3
Carrick 2904 4
Carrick 2904 5
Central Business District 201 1
Central Business District 201 2
Central Business District 201 3
Central Business District 201 4
Central Business District 201 5
Central Business District 201 6
Central Lawrenceville 901 1
Central Lawrenceville 901 2
Central Lawrenceville 902 1
Central Lawrenceville 902 2
Central Lawrenceville 902 3
Central Lawrenceville 9810 1
Central Northside 2206 1
Central Northside 2206 2
Central Northside 2503 1
Central Oakland 405 1
Central Oakland 405 2
Neighborhood Tract Block Group
Central Oakland 406 1
Chartiers City 5630 4
Chateau 9806 1
Crafton Heights 2814 1
Crafton Heights 2814 2
Crafton Heights 2815 1
Crafton Heights 2815 2
Crawford‐Roberts 305 1
Crawford‐Roberts 305 2
Duquesne Heights 1911 1
Duquesne Heights 1911 2
East Allegheny 5632 2
East Allegheny 5632 3
East Carnegie 5628 1
East Hills 1306 1
East Hills 1306 2
East Hills 1306 3
East Liberty 1113 1
East Liberty 1113 2
East Liberty 1113 3
East Liberty 1113 4
East Liberty 1115 1
East Liberty 1115 2
East Liberty 1115 3
East Liberty 1115 4
Elliott 5626 2
Elliott 5626 3
Elliott 5626 4
Esplen 5625 1
Fairywood 5630 1
Fineview 2509 1
Fineview 2509 2
Friendship 807 1
Friendship 807 2
Garfield 1016 1
Garfield 1017 1
Garfield 1017 2
Garfield 1114 1
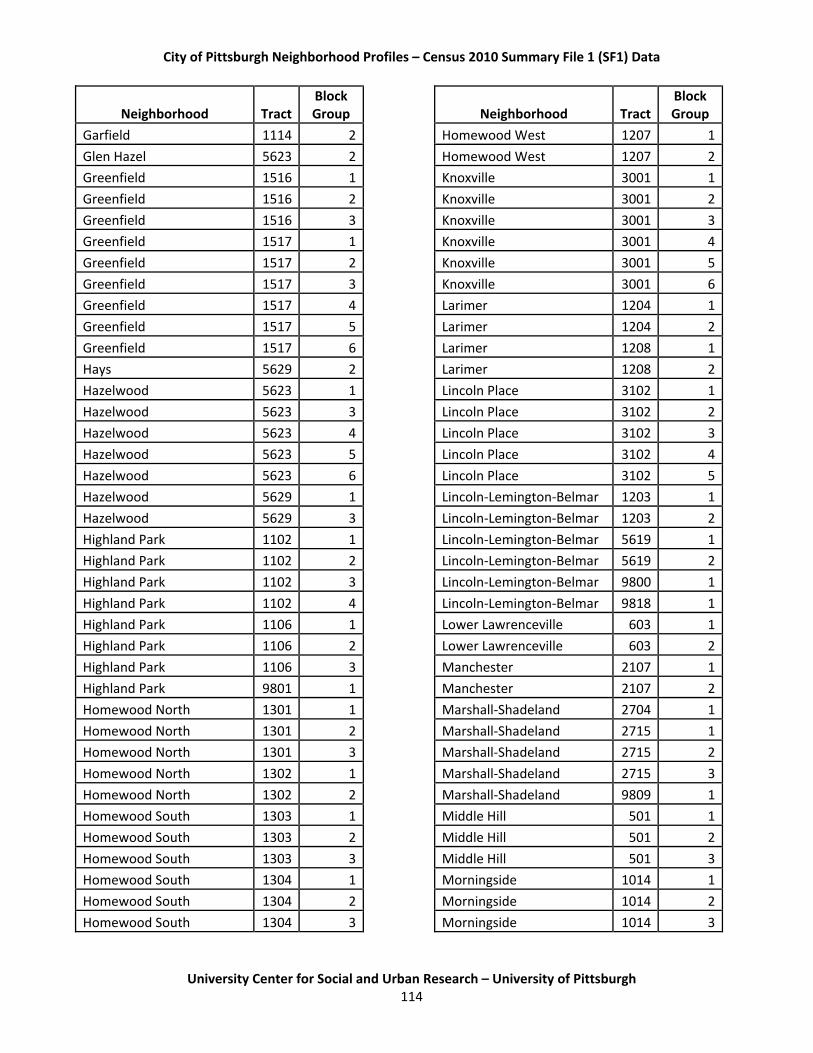
City of Pittsburgh Neighborhood Profiles – Census 2010 Summary File 1 (SF1) Data
University Center for Social and Urban Research – University of Pittsburgh
114
Neighborhood Tract Block Group
Garfield 1114 2
Glen Hazel 5623 2
Greenfield 1516 1
Greenfield 1516 2
Greenfield 1516 3
Greenfield 1517 1
Greenfield 1517 2
Greenfield 1517 3
Greenfield 1517 4
Greenfield 1517 5
Greenfield 1517 6
Hays 5629 2
Hazelwood 5623 1
Hazelwood 5623 3
Hazelwood 5623 4
Hazelwood 5623 5
Hazelwood 5623 6
Hazelwood 5629 1
Hazelwood 5629 3
Highland Park 1102 1
Highland Park 1102 2
Highland Park 1102 3
Highland Park 1102 4
Highland Park 1106 1
Highland Park 1106 2
Highland Park 1106 3
Highland Park 9801 1
Homewood North 1301 1
Homewood North 1301 2
Homewood North 1301 3
Homewood North 1302 1
Homewood North 1302 2
Homewood South 1303 1
Homewood South 1303 2
Homewood South 1303 3
Homewood South 1304 1
Homewood South 1304 2
Homewood South 1304 3
Neighborhood Tract Block Group
Homewood West 1207 1
Homewood West 1207 2
Knoxville 3001 1
Knoxville 3001 2
Knoxville 3001 3
Knoxville 3001 4
Knoxville 3001 5
Knoxville 3001 6
Larimer 1204 1
Larimer 1204 2
Larimer 1208 1
Larimer 1208 2
Lincoln Place 3102 1
Lincoln Place 3102 2
Lincoln Place 3102 3
Lincoln Place 3102 4
Lincoln Place 3102 5
Lincoln‐Lemington‐Belmar 1203 1
Lincoln‐Lemington‐Belmar 1203 2
Lincoln‐Lemington‐Belmar 5619 1
Lincoln‐Lemington‐Belmar 5619 2
Lincoln‐Lemington‐Belmar 9800 1
Lincoln‐Lemington‐Belmar 9818 1
Lower Lawrenceville 603 1
Lower Lawrenceville 603 2
Manchester 2107 1
Manchester 2107 2
Marshall‐Shadeland 2704 1
Marshall‐Shadeland 2715 1
Marshall‐Shadeland 2715 2
Marshall‐Shadeland 2715 3
Marshall‐Shadeland 9809 1
Middle Hill 501 1
Middle Hill 501 2
Middle Hill 501 3
Morningside 1014 1
Morningside 1014 2
Morningside 1014 3

City of Pittsburgh Neighborhood Profiles – Census 2010 Summary File 1 (SF1) Data
University Center for Social and Urban Research – University of Pittsburgh
115
Neighborhood Tract Block Group
Morningside 1014 4
Mount Washington 1807 1
Mount Washington 1807 2
Mount Washington 1807 3
Mount Washington 1903 1
Mount Washington 1903 2
Mount Washington 1914 1
Mount Washington 1914 2
Mount Washington 1915 1
Mount Washington 1915 2
Mt. Oliver 5617 2
New Homestead 3103 1
North Oakland 404 1
North Oakland 404 2
North Oakland 5620 1
North Oakland 5620 2
North Oakland 5620 3
North Oakland 9822 1
North Shore 5632 1
North Shore 9812 1
Northview Heights 2609 1
Oakwood 5628 2
Overbrook 3204 1
Overbrook 3204 2
Overbrook 3204 3
Overbrook 3207 1
Overbrook 3207 2
Perry North 2602 1
Perry North 2602 2
Perry North 2602 3
Perry North 2607 1
Perry North 2607 2
Perry North 9804 1
Perry South 2614 1
Perry South 2614 2
Perry South 2614 3
Perry South 2614 4
Perry South 2615 1
Neighborhood Tract Block Group
Perry South 2615 2
Point Breeze 1404 1
Point Breeze 1404 2
Point Breeze 1404 3
Point Breeze 1406 1
Point Breeze 1406 2
Point Breeze 1406 3
Point Breeze 9811 1
Point Breeze North 1405 1
Point Breeze North 1405 2
Point Breeze North 1405 3
Polish Hill 605 1
Polish Hill 605 2
Regent Square 1410 1
Ridgemont 5631 3
Shadyside 703 1
Shadyside 703 2
Shadyside 703 3
Shadyside 705 1
Shadyside 705 2
Shadyside 705 3
Shadyside 706 1
Shadyside 706 2
Shadyside 708 1
Shadyside 708 2
Shadyside 709 1
Shadyside 709 2
Shadyside 709 3
Shadyside 709 4
Sheraden 2022 1
Sheraden 2022 2
Sheraden 2022 3
Sheraden 5625 2
Sheraden 5625 3
Sheraden 5625 4
South Oakland 409 1
South Oakland 409 2
South Oakland 409 3
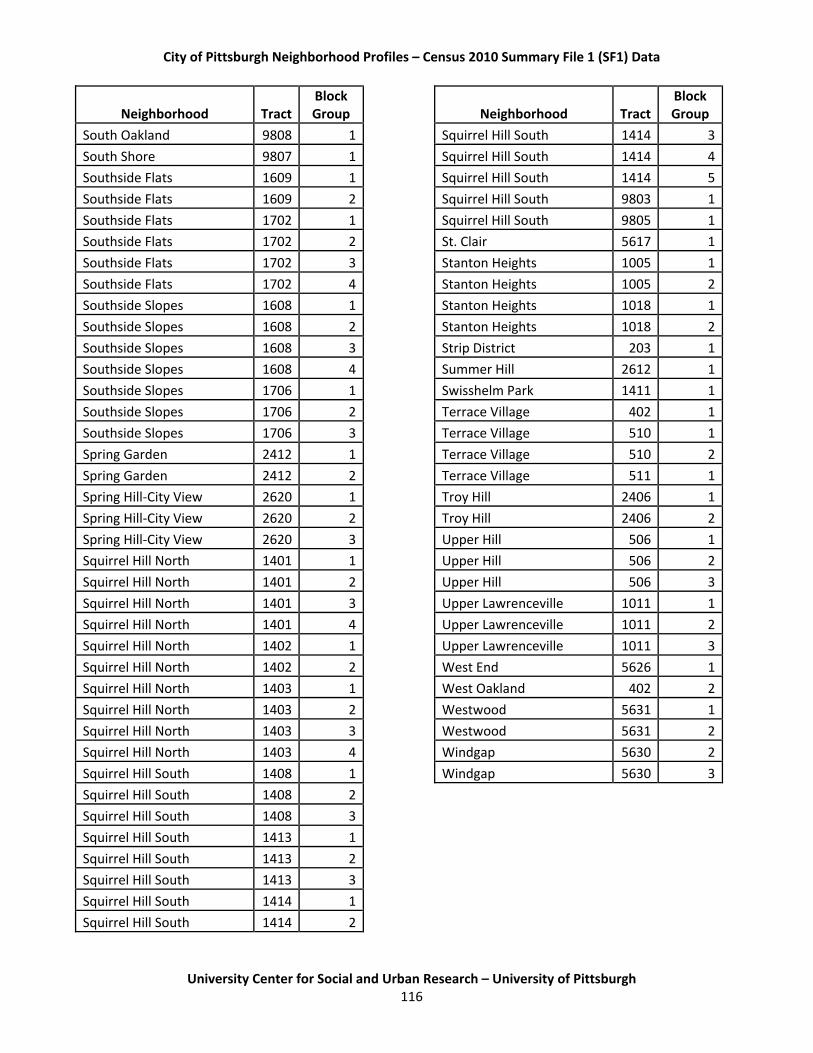
City of Pittsburgh Neighborhood Profiles – Census 2010 Summary File 1 (SF1) Data
University Center for Social and Urban Research – University of Pittsburgh
116
Neighborhood Tract Block Group
South Oakland 9808 1
South Shore 9807 1
Southside Flats 1609 1
Southside Flats 1609 2
Southside Flats 1702 1
Southside Flats 1702 2
Southside Flats 1702 3
Southside Flats 1702 4
Southside Slopes 1608 1
Southside Slopes 1608 2
Southside Slopes 1608 3
Southside Slopes 1608 4
Southside Slopes 1706 1
Southside Slopes 1706 2
Southside Slopes 1706 3
Spring Garden 2412 1
Spring Garden 2412 2
Spring Hill‐City View 2620 1
Spring Hill‐City View 2620 2
Spring Hill‐City View 2620 3
Squirrel Hill North 1401 1
Squirrel Hill North 1401 2
Squirrel Hill North 1401 3
Squirrel Hill North 1401 4
Squirrel Hill North 1402 1
Squirrel Hill North 1402 2
Squirrel Hill North 1403 1
Squirrel Hill North 1403 2
Squirrel Hill North 1403 3
Squirrel Hill North 1403 4
Squirrel Hill South 1408 1
Squirrel Hill South 1408 2
Squirrel Hill South 1408 3
Squirrel Hill South 1413 1
Squirrel Hill South 1413 2
Squirrel Hill South 1413 3
Squirrel Hill South 1414 1
Squirrel Hill South 1414 2
Neighborhood Tract Block Group
Squirrel Hill South 1414 3
Squirrel Hill South 1414 4
Squirrel Hill South 1414 5
Squirrel Hill South 9803 1
Squirrel Hill South 9805 1
St. Clair 5617 1
Stanton Heights 1005 1
Stanton Heights 1005 2
Stanton Heights 1018 1
Stanton Heights 1018 2
Strip District 203 1
Summer Hill 2612 1
Swisshelm Park 1411 1
Terrace Village 402 1
Terrace Village 510 1
Terrace Village 510 2
Terrace Village 511 1
Troy Hill 2406 1
Troy Hill 2406 2
Upper Hill 506 1
Upper Hill 506 2
Upper Hill 506 3
Upper Lawrenceville 1011 1
Upper Lawrenceville 1011 2
Upper Lawrenceville 1011 3
West End 5626 1
West Oakland 402 2
Westwood 5631 1
Westwood 5631 2
Windgap 5630 2
Windgap 5630 3