City of Philadelphia Municipal Retirement System Actuarial Valuation.pdf$65,000 (including DC 33...
147
City of Philadelphia Municipal Retirement System Actuarial Valuation Report as of July 1, 2018 Produced by Cheiron April 2019
Transcript of City of Philadelphia Municipal Retirement System Actuarial Valuation.pdf$65,000 (including DC 33...

City of Philadelphia
Municipal Retirement System
Actuarial Valuation Report
as of July 1, 2018
Produced by Cheiron
April 2019

TABLE OF CONTENTS
Section Page
Letter of Transmittal ........................................................................................................................ i
Section I Board Summary ........................................................................................................1
Section II Assessment and Disclosure of Risk ........................................................................20
Section III Assets ......................................................................................................................35
Section IV Liabilities ...............................................................................................................45
Section V Contributions and Minimal Municipal Obligation ................................................50
Appendices
Appendix A Membership Information .......................................................................................67
Appendix B Support Tables for City’s Funding Policy .............................................................90
Appendix C Summary of Actuarial Assumptions and Methods ..............................................100
Appendix D Summary of Plan Provisions ...............................................................................111
Appendix E Glossary of Terms ................................................................................................143

LETTER OF TRANSMITTAL
April 11, 2019
City of Philadelphia Municipal Retirement System
Two Penn Center Plaza – 16th
Floor
Philadelphia, Pennsylvania 19102-1721
Dear Board Members:
At your request, we have performed the July 1, 2018 Actuarial Valuation of the City of
Philadelphia Municipal Retirement System (the System).
In preparing our report, we relied on information (some oral and some written) supplied by the
System’s staff. This information includes, but is not limited to, plan provisions, employee data,
and financial information. We performed an informal examination of the obvious characteristics
of the data for reasonableness and consistency in accordance with Actuarial Standard of Practice
No. 23. The results of this report are only applicable to the System’s contribution for Fiscal Year
Ending 2020. Future results may differ significantly from the current results presented in this
report due to such factors as the following: plan experience differing from that anticipated by the
assumptions; changes in assumptions; and changes in plan provisions or applicable law.
This report has been prepared in accordance with generally recognized and accepted actuarial
principles and practices and our understanding of the Code of Professional Conduct and
applicable Actuarial Standards of Practice set out by the Actuarial Standards Board as well as
applicable laws and regulations. Furthermore, as credentialed actuaries we meet the Qualification
Standards, as defined by the American Academy of Actuaries, to render the opinion contained in
this report. This report does not address any contractual or legal issues. We are not attorneys, and
our firm does not provide any legal services or advice.
This actuarial valuation report was prepared exclusively for the City of Philadelphia Municipal
Retirement System for the purposes described herein and for the Plan auditor in completing an
audit related to the matters herein. Other users of this report are not intended users as defined in
the Actuarial Standards of Practice, and Cheiron assumes no duty or liability to such other users.
Finally, in preparation of this report, we have accepted the assumptions and methodologies as
adopted by the Board of Pensions and Retirement for the City of Philadelphia Municipal
Retirement System.
Sincerely,
Cheiron
Kenneth A. Kent, FSA, FCA, MAAA, EA Anu Patel, FSA, MAAA, EA
Principal Consulting Actuary Principal Consulting Actuary

CITY OF PHILADELPHIA MUNICIPAL RETIREMENT SYSTEM
JULY 1, 2018 ACTUARIAL VALUATION
SECTION I – BOARD SUMMARY
1
The primary purpose of the actuarial valuation and this report is to disclose the following as of
the valuation date:
The financial condition of the City of Philadelphia Municipal Retirement System
(the System),
Past and expected future trends and risks to the Retirement System’s financial condition,
The City’s Minimum Municipal Obligation (MMO) representing the required contribution in
accordance with Act 205 of Pennsylvania Law for Fiscal Year End (FYE) 2020,
The Revenue Recognition Policy (RRP) contribution amount requested by the City, and
The Retirement Board’s Funding Policy recommended City contribution.
Cheiron has issued a separate report containing the information required by the Governmental
Accounting Standards Board (GASB) and therefore that accounting information is not included
in this valuation report.
In this Section, we present a summary of the principal valuation results. This includes the basis
upon which the July 1, 2018 valuation was completed and an examination of the current financial
condition of the System. In addition, we present a review of the key historical trends followed by
the System’s projected financial outlook.

CITY OF PHILADELPHIA MUNICIPAL RETIREMENT SYSTEM
JULY 1, 2018 ACTUARIAL VALUATION
SECTION I – BOARD SUMMARY
2
A. Valuation Basis
The June 30, 2018 valuation results are based on the same actuarial methods used in the June 30, 2017
valuation. The actuarial assumptions have been updated to reflect the new assumptions approved
by the Retirement Board, as presented in the Experience Study Results for July 1, 2012 -
June 30, 2017 in March 2018. The following outlines the basic assumption changes. For a
detailed description of the methods and assumptions, refer to Appendix C of this report.
Interest Rate: The interest rate was decreased from 7.65% to 7.60% as of July 1, 2018 as
adopted by the Board in February 2018.
Mortality Rates: Mortality base tables were updated to use the RP-2014 tables projected to
2021 using mortality improvement scale MP-2017 to reflect projected improvements in
mortality over time until the next required experience analysis.
Salary Increase Rate: There were increases in the Municipal salary assumptions by age.
Other Demographic Actuarial Assumptions: Other demographic assumptions such as the
retirement rates, termination rates, disability rates, service-connected disability rates, and
marriage assumption for non-active members were updated to better reflect actual
experience. A detailed list of these assumption changes is located in Appendix C of this
report.
Council Bill No. 180557 and No. 180559 passed in June 2018, provide for two changes in Plan
provisions for employees represented by Municipal groups:
All Municipal members (except elected officials) hired or rehired on or after January 1, 2019
will participate in a Stacked Hybrid Plan – Plan 16. Benefits under Plan 16 are similar to
Plan 87 except that the compensation used in determining the benefit is capped at
$65,000 (including DC 33 whose current pay cap is $50,000).
Current and new Municipal members will pay additional contributions that are tiered to
increase based on the level of compensation effective January 1, 2019. New Municipal
members will be covered by the Stacked Hybrid Plan such that tiered member
contributions are only applied up to the $65,000 compensation cap.
Council Bill No. 180557 passed in June 2018 reflects the final arbitrations for Police Officers
and Firefighters and made the following changes to member contributions:
Member contributions for current Police Officers and Firefighters in Plan 87 and Plan ‘10
were increased by 0.92% effective July 1, 2017, and an additional 0.92% effective July 1, 2018.
For new Police Officers and Firefighters hired or rehired on or after July 1, 2017 member
contributions rate is increased by 2.5% over the rate which would otherwise be in effect
as of July 1, 2017.
No changes in member contributions will be made for Police Officers and Firefighters in
Plan 67.
CITY OF PHILADELPHIA MUNICIPAL RETIREMENT SYSTEM
JULY 1, 2018 ACTUARIAL VALUATION
SECTION I – BOARD SUMMARY
3
There are three sources of anticipated additional revenue that will be received by the System:
A portion of the sales tax revenue according to the State Legislation,
Additional tiered member contributions based on salary level for current and future
Municipal members, and
Additional member contributions for current and future members in Plan 87 Police and Fire.
Typically, as additional contributions are received, the following years’ MMOs are reduced as a
function of the additional assets. However, the objective for these additional revenue sources is
to dedicate them toward paying down the unfunded liability and not to reduce future City costs.
This is referred to as the Revenue Recognition Policy (RRP) whereby the additional revenue
coming into the System is tracked and accumulated in a notional account which is then deducted
from the Actuarial Asset Value to determine the City’s contribution. These amounts will be paid
in addition to the Minimum Municipal Obligation (MMO).
At the same time, we calculate the MMO based on all assets including additional revenue
sources for state reporting purposes under Act 205 and representation of the Actuarially
Determined Contribution (ADC) under Governmental Accounting Standards.
This report was prepared using census data and financial information as of July 1, 2018 and does
not reflect any subsequent changes in the membership or the assets.
Below we highlight significant results of this valuation:
Financial Performance: The return on market value of assets at 9.01% for the year ending
June 30, 2018, was higher than the expected 7.65% assumed return rate benchmarked. For
funding purposes, the System applies an asset smoothing method to determine the Actuarial
Value of Assets which phases in actuarial investment gains and losses over ten years. On an
actuarial asset value basis the return as of June 30, 2018 was 5.11% resulting in an
experience loss when compared to the 7.65% assumption.
o The smoothing method also limits the actuarial asset method to not be greater than
120% nor less than 80% of the underlying market value of assets. The ratio of
actuarial assets to market assets decreased from 104.8% in the prior year to 101.1%
for the current year.
Pension Adjustment Fund (PAF): As defined in the Philadelphia Code the PAF provides for
additional benefits to current retirees through the use of excess earnings. Excess earnings are
defined as returns in excess of the assumed return rate plus 1%. The asset return for the
adjusted market value which is based on five-year smoothing of asset gains and losses was
6.47%. Because the return is below 8.65% (the assumed prior year rate of return of 7.65%
plus 1.00%), there are no additional amounts transferred into the PAF as of June 30, 2018.

CITY OF PHILADELPHIA MUNICIPAL RETIREMENT SYSTEM
JULY 1, 2018 ACTUARIAL VALUATION
SECTION I – BOARD SUMMARY
4
Unfunded Actuarial Liability (UAL): The UAL is the excess of the System’s actuarial
liability (AL) over the actuarial value of assets (AVA). The UAL decreased from $6.167
billion as of July 1, 2017 to $6.124 billion as of July 1, 2018 reflecting the effect of contributions
toward paying down the unfunded offset by asset and liability losses from July 1, 2017 through
June 30, 2018 as well as the changes in actuarial assumptions as of July 1, 2018.
o The UAL decrease of $43.5 million is comprised of liability losses of $3.6 million from
participants in transition from active to non-active status and mortality experience on
retirees plus asset return losses of $117.0 million. Assumption changes increasing the
UAL by $60.3 million from the experience study and the decrease in interest rate.
These values are offset by contributions towards paying down the unfunded,
differences in benefit accrual rates and interest on payment timing of $224.5 million.
Funding Ratio: This is the ratio of the System’s AVA to AL. The funding ratio increased
from 45.3% as of July 1, 2017 to 46.8% as of July 1, 2018, mainly due to underlying growth
in assets and slower liability growth. While this ratio may appear to show slow progress in
funding, the decrease in the assumed rate of return represents improvement of System’s risk
profile increasing the likelihood of achieving this assumption in the future. The funding ratio
on market assets to liability basis increased from 43.2% to 46.4%.
Plan Changes: The change in plan provisions for Stacked Hybrid Plan for new hires and tier
member contributions for Municipal members as well as increased member contributions for
Firefighters impact future costs and do not have an impact on the AVA or AL as of July 1, 2018.
Minimum Municipal Obligation (MMO): The MMO is the required minimum amount the
City must contribute under Pennsylvania State Law. The MMO increased from $668.3
million for FYE 2019 to $675.8 million for FYE 2020.
Revenue Recognition Policy (RRP): The contribution based on the RRP increased from
$680.8 million for FYE 2019 to $704.6 million for FYE 2020. The balance of the notional
account removed from the assets in calculating this contribution increased from $30.0 million
as of July 1, 2017 to $63.1 million as of July 1, 2018.
Contribution under the City’s Funding Policy: The beginning-of-year contribution under
the City’s Funding Policy decreased from $1,052.5 million for FYE 2019 based upon actual
FYE 2018 payroll to an estimated $804.8 million for FYE 2020.
Table I-1 summarizes the comparative UAL and fiscal year funding amounts discussed above.
CITY OF PHILADELPHIA MUNICIPAL RETIREMENT SYSTEM
JULY 1, 2018 ACTUARIAL VALUATION
SECTION I – BOARD SUMMARY
5
Valuation Date 7/1/2018 7/1/2017
Unfunded Actuarial Liability 6,123,546$ 6,167,057$
Funding Ratio 46.8% 45.3%
Fiscal Year 2020 Fiscal Year 2019
Minimum Municipal Obligation 675,751$ 668,281$
Revenue Recognition Policy Contribution 704,589$ 680,808$
City's Funding Policy Contribution* 804,822$ 1,052,481$
*The City’s funding policy contribution for FYE 2019 was updated based upon the actual payroll of $1,805.4 million (provided as
pay rates in the data) as of July 1, 2018. In the July 1, 2017 actuarial valuation report, the estimated FYE 2019 payroll was $1,802.3
million based on July 1, 2017 pay rates and increased with the payroll assumption.
Table I-1
($ thousands)
Key Results
CITY OF PHILADELPHIA MUNICIPAL RETIREMENT SYSTEM
JULY 1, 2018 ACTUARIAL VALUATION
SECTION I – BOARD SUMMARY
6
B. Current Financial Condition
On the following pages, we summarize the key results of the July 1, 2018 valuation and how
they compare to the results from the July 1, 2017 valuation.
1. City Membership:
As shown in Table I-2 below, total membership in the Retirement System increased by 0.4%
from 2017 to 2018.
July 1, 2018 July 1, 2017 % Change
Actives 28,845 28,615 0.8%
Terminated Vesteds 1,074 1,157 -7.2%
Disabled 3,890 3,942 -1.3%
Retirees 22,275 22,288 -0.1%
Beneficiaries 8,547 8,552 -0.1%
DROP 1,944 1,767 10.0%
Total City Members 66,575 66,321 0.4%
Annual Salaries 1,805,400,096$ 1,744,728,288$ 3.5%
Average Salary per Active Member 62,590$ 60,973$ 2.7%
Annual Retirement Allowances 761,946,574$ 750,204,529$ 1.6%
Average Retirement Allowance 21,951$ 21,569$ 1.8%
Membership Total
Table I-2
The active participant population increased by 0.8% during the 2017-2018 plan year.
Deferred Retirement Option Plan (DROP) participants increased 10.0% from 2017 to 2018 as
more members enrolled in DROP than retired from DROP. The average salary per active
member increased by 2.7% during the plan year. The result of increased active membership
paired with the salary growth produced a total payroll growth of 3.5% versus the expected
3.3% payroll growth assumption.
Annual retirement allowances increased by 1.6% in aggregate with the average benefits
increasing 1.8%. The total number of participants in pay status decreased 0.2% which is a
reflection of the maturity of the System.

CITY OF PHILADELPHIA MUNICIPAL RETIREMENT SYSTEM
JULY 1, 2018 ACTUARIAL VALUATION
SECTION I – BOARD SUMMARY
7
2. City Assets and Liabilities:
Table I-3 presents a comparison between the July 1, 2018 and July 1, 2017 system assets,
liabilities, UAL, and funding ratios. The AVA Funding Ratio increased from 45.3% as of
July 1, 2017 to 46.8% as of July 1, 2018 despite the asset losses, liability losses, and changes
in actuarial assumptions. Prior to the assumption changes the funded ratio would have been
47.1%.
July 1, 2018 July 1, 2017 % Change
Actuarial Liabilities by Membership:
Actives 3,924,324$ 3,900,095$ 0.6%
Terminated Vesteds 104,765 111,367 -5.9%
Disabled 782,082 758,314 3.1%
Retirees 5,119,142 5,038,627 1.6%
Beneficiaries 672,900 651,804 3.2%
DROP 909,297 807,195 12.6%
Non-Vested Refunds 8,470 8,274 2.4%
Total Actuarial Liability (AL) 11,520,980$ 11,275,676$ 2.2%
Market Value of Assets (MVA net of PAF)* 5,340,125$ 4,872,977$ 9.6%
Actuarial Value of Assets (AVA net of PAF)* 5,397,434$ 5,108,619$ 5.7%
Actuarial Assets minus Market Assets 57,309$ 235,642$ -75.7%
Unfunded Actuarial Liability 6,123,546$ 6,167,057$ -0.7%
Funding Ratio (AVA ÷ AL) 46.8% 45.3% 1.5%
Funding Ratio (MVA ÷ AL) 46.4% 43.2% 3.2%
Table I-3
($ thousands)
Assets and Liabilities
*The PAF is available for distribution under title §22-311 of the Philadelphia Code. In general, the PAF provides for enhanced benefit distribution to
retirees and beneficiaries through the use of excess earnings. For more details on the PAF, see Section II – E
The market asset value average return is 9.01% compared to the 7.65% assumption for the
previous year. For the actuarial value of assets, the investment gains and losses are smoothed
over future years, which yielded a rate of return of 5.11%.
CITY OF PHILADELPHIA MUNICIPAL RETIREMENT SYSTEM
JULY 1, 2018 ACTUARIAL VALUATION
SECTION I – BOARD SUMMARY
8
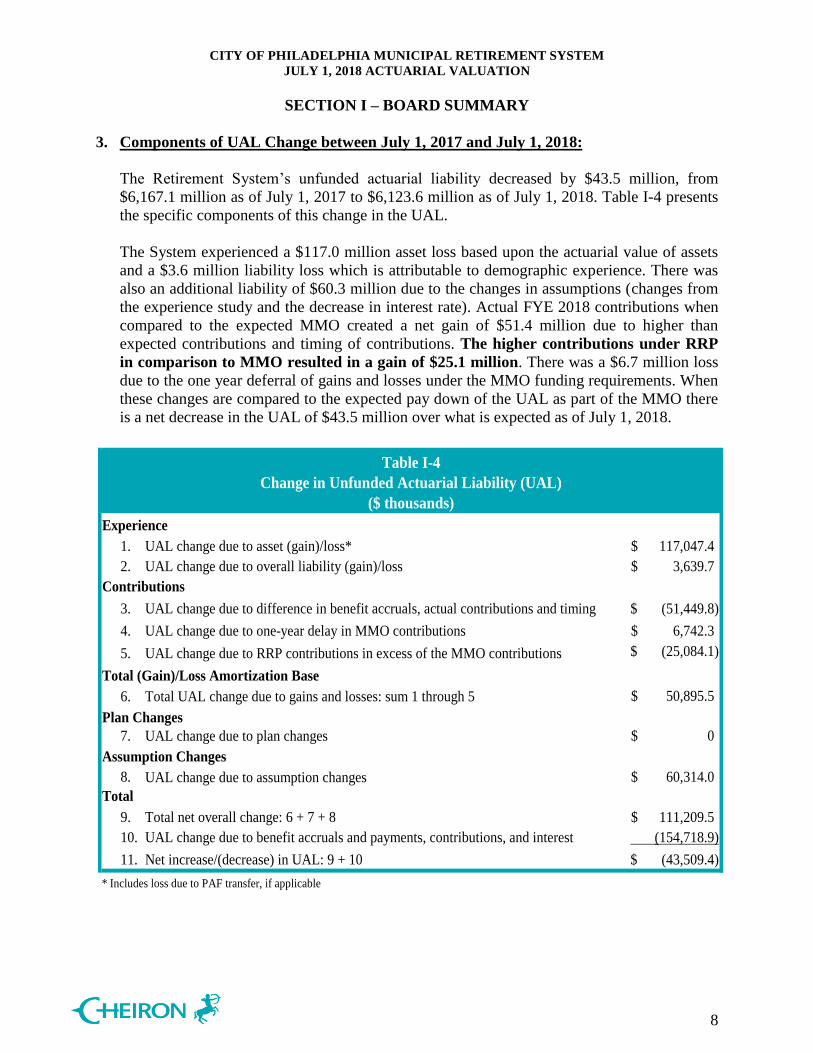
3. Components of UAL Change between July 1, 2017 and July 1, 2018:
The Retirement System’s unfunded actuarial liability decreased by $43.5 million, from
$6,167.1 million as of July 1, 2017 to $6,123.6 million as of July 1, 2018. Table I-4 presents
the specific components of this change in the UAL.
The System experienced a $117.0 million asset loss based upon the actuarial value of assets
and a $3.6 million liability loss which is attributable to demographic experience. There was
also an additional liability of $60.3 million due to the changes in assumptions (changes from
the experience study and the decrease in interest rate). Actual FYE 2018 contributions when
compared to the expected MMO created a net gain of $51.4 million due to higher than
expected contributions and timing of contributions. The higher contributions under RRP
in comparison to MMO resulted in a gain of $25.1 million. There was a $6.7 million loss
due to the one year deferral of gains and losses under the MMO funding requirements. When
these changes are compared to the expected pay down of the UAL as part of the MMO there
is a net decrease in the UAL of $43.5 million over what is expected as of July 1, 2018.
Experience Fiscal Year Ending in Year:
1. UAL change due to asset (gain)/loss* 117,047.4$
2. UAL change due to overall liability (gain)/loss 3,639.7$
Contributions
3. UAL change due to difference in benefit accruals, actual contributions and timing (51,449.8)$
4. UAL change due to one-year delay in MMO contributions 6,742.3$
5. UAL change due to RRP contributions in excess of the MMO contributions (25,084.1)$
Total (Gain)/Loss Amortization Base
6. Total UAL change due to gains and losses: sum 1 through 5 50,895.5$
Plan Changes
7. UAL change due to plan changes 0$
Assumption Changes
8. UAL change due to assumption changes 60,314.0$
Total
9. Total net overall change: 6 + 7 + 8 111,209.5$
10. UAL change due to benefit accruals and payments, contributions, and interest (154,718.9)
11. Net increase/(decrease) in UAL: 9 + 10 (43,509.4)$
* Includes loss due to PAF transfer, if applicable
Table I-4
Change in Unfunded Actuarial Liability (UAL)
($ thousands)

CITY OF PHILADELPHIA MUNICIPAL RETIREMENT SYSTEM
JULY 1, 2018 ACTUARIAL VALUATION
SECTION I – BOARD SUMMARY
9
4. Contributions:
Table I-5 below summarizes the City contribution amounts. The Minimum Municipal
Obligation for FYE 2020 measured as of the beginning of the year decreased by 0.85% of
payroll, from 37.08% to 36.23%. In dollar terms, the required beginning of year contribution
increased from $668.3 million to $675.8 million, a $7.5 million increase. Though the MMO
increased in dollar amounts, it decreased as a percent of pay because total payroll increased
more than the increase in MMO over the last year. This is because the amortization of
experience losses and assumption changes had less of a relative impact than the increase in
active members and salary increases coupled with an increase in employee contribution rates.
So while growth in active membership will result in the dollar normal cost increasing, the
new employee contribution rates and higher payroll over which the unfunded liability is paid
down as a level payment amount will result in lower costs as a percent of pay.
The contribution under the Revenue Recognition Policy increased by 0.01% as a percent of
payroll, from 37.77% to 37.78% for FYE 2020. The contribution in dollar amount increased
from $680.8 million in the prior year to $704.6 million for FYE 2020. The RRP contribution
is higher than the MMO due to excluding accumulated sales tax revenue and additional
member contributions received, from the assets when determining the RRP contributions.
For Fiscal Year 2020, the City Funding Policy contributions decreased by 15.15% of
payroll, from 58.30% to 43.15%. In dollar terms, the contributions under the City’s Funding
Policy decreased from $1,052.5 million to $804.8 million, a $247.7 million decrease. The decrease
in the funding policy is attributable to the expected payment in full of the initial July 1, 1984
unfunded liability base which was amortized over 34 years ending FYE 2019. All
contributions for the City’s Funding Policy are provided as of the beginning of the year.
In Section IV of this report, we provide more detail on the development of these
contributions.

CITY OF PHILADELPHIA MUNICIPAL RETIREMENT SYSTEM
JULY 1, 2018 ACTUARIAL VALUATION
SECTION I – BOARD SUMMARY
10
Fiscal Year Ending in Year: 2020 % of Pay 2019 % of Pay
Minimum Municipal Obligation 1
Estimated FY Payroll 1,864,978$ 1,802,304$
Normal Cost (with Expenses) 188,203$ 10.09% 170,096$ 9.44%
Regular Employee Contributions (80,734) 4.33% (74,053) 4.11%
Extra Employee Contributions for Funding 3 (22,956) 1.23% (9,740) 0.54%
City Normal Cost 84,513$ 4.53% 86,303$ 4.79%
Amortization Payment 591,238 31.70% 581,978 32.29%
Minimum Municipal Obligation 675,751$ 36.23% 668,281$ 37.08%
Revenue Recognition Policy 2
Estimated FY Payroll 1,864,978$ 1,802,304$
Normal Cost (with Expenses) 188,203$ 10.09% 170,096$ 9.44%
Regular Employee Contributions (80,734) 4.33% (74,053) 4.11%
Extra Employee Contributions for Funding 3
(0) 0.00% (0) 0.00%
City Normal Cost 107,469$ 5.76% 96,043$ 5.33%
Amortization Payment 597,120 32.02% 584,765 32.45%
Revenue Recognition Policy 704,589$ 37.78% 680,808$ 37.77%
City's Funding Policy 4
Estimated FY Payroll 1,864,978$ 1,805,400$ 5
Normal Cost (with Expenses) 188,203$ 10.09% 169,190$ 9.37%
Regular Employee Contributions (80,734) 4.33% (72,450) 4.01%
Extra Employee Contributions for Funding 3 (22,956) 1.23% (9,740) 0.54%
City Normal Cost 84,513$ 4.53% 87,001$ 4.82%
Amortization Payment 720,309 38.62% 965,480 53.48%
City's Funding Policy 804,822$ 43.15% 1,052,481$ 58.30%1 The MMO does not include Quasi-Agency contributions.
2 Revenue Recognition Policy (RRP) is based on the calculation of MMO without including accumulated sales tax revenue and additional member
contribution amounts received.3 Additional tier member contributions under Municipal Plans 67, 87, and 16 and the 2017 Police and Fire Arbitration for Plan 87 are specifically dedicated
to paying down the unfunded liability and are recognized as employee contributions under MMO and Funding Policy but not under the RRP contribution.4
Assuming beginning-of-year payment.5
FY 2019 Payroll for the City's Funding Policy is based upon the 7/1/2018 pay rates and will be finalized when the FYE 2019 payroll is available. All other
payroll is estimated based upon the prior year's data used for the actuarial valuation.
($ thousands)
Table I-5
Contributions

CITY OF PHILADELPHIA MUNICIPAL RETIREMENT SYSTEM
JULY 1, 2018 ACTUARIAL VALUATION
SECTION I – BOARD SUMMARY
11
C. Historical Trends
Although most of the attention given to the valuation reflects the most recently computed
unfunded actuarial liability, funding ratio, and contribution amounts, it is important to remember
that each valuation is merely a snapshot of the long-term progress of a pension fund. It is equally
important to judge a current year’s valuation result relative to historical trends, as well as trends
expected into the future.
In the chart below, we present the historical trends for the market and actuarial value of assets
compared to the actuarial liabilities and present value of future benefits; we also show the
progress of the Retirement System’s funding ratios on an actuarial value of asset basis (provided
above each bar) since 2009.
City of Philadelphia Assets* and Liabilities – 2009 to 2018
45.0%47.0%
49.7% 48.1%47.4%
45.8% 45.0% 44.8%45.3%
46.8%
$0
$2
$4
$6
$8
$10
$12
$14
$16
2009 2010 2011 2012 2013 2014 2015 2016 2017 2018
Bil
lio
ns
Plan Year Beginning July 1
Actuarial Liability Present Value of Future Benefits
Market Value of Assets Actuarial Value of Assets
* Market value of assets includes the PAF, which is not available for funding purposes.

CITY OF PHILADELPHIA MUNICIPAL RETIREMENT SYSTEM
JULY 1, 2018 ACTUARIAL VALUATION
SECTION I – BOARD SUMMARY
12
The System’s funding ratio has remained relatively stable since 2009. It is important to note that
the assumed interest rate assumption has been decreased during this period from 8.25% to 7.60%
which has lowered the funding ratio but has improved the System’s risk profile. Besides the
regular reductions of the interest rate assumption during this period the changes in the ratio are
also due to the volatility of the markets. In 2018, the funding ratio increased by 1.5%.
This historic trend emphasizing the relatively low funding status highlights the potential risk of
running out of assets to pay benefits. However, as long as the City adheres to the continued
policy of contributing at least the Minimum Municipal Obligation this risk will be avoided.
Another observation is that assets have remained relatively flat over the projection period. This is
a function of the negative cash flow as contributions and investment income have to keep pace
with benefit payouts and expenses before the absolute value of assets can grow. However, the
steps taken by the City and participants in providing additional contributions to the System has
reduced this cash flow risk significantly. This is demonstrated later in the summary section.
In the chart on the next page, we present historical trends for the Minimum Municipal Obligation
(MMO), the contributions under the City’s Funding Policy, the Revenue Recognition Policy
(RRP) beginning in 2018, and the actual City contributions made for fiscal years since 2011.
Because there is a two-year lag in the determination of the City Funding Policy, RRP and MMO
requirements, we show the contributions to date and the estimated amounts for fiscal years 2019
and 2020. The FYE 2011 City contributions include the $80 million deferred contributions which
have been fully paid during FYE 2013. The deferred contributions are subsequently included in
the asset value as if they were made when due in accordance with special funding provisions
under Act 205, and treated as if they are short-term investments and therefore not reflected in the
actual City contributions received during FYE 2013. The City contributions include sales tax
revenue amounts contributed to the System by the City. FYE 2018 was the third year sales tax
revenue was received in the amount of $24.2 million.

CITY OF PHILADELPHIA MUNICIPAL RETIREMENT SYSTEM
JULY 1, 2018 ACTUARIAL VALUATION
SECTION I – BOARD SUMMARY
13
City of Philadelphia Contributions for Fiscal Years 2011-2020
$0
$200
$400
$600
$800
$1,000
$1,200
2011 2012 2013 2014 2015 2016 2017 2018 2019 2020
Mil
lion
s
Fiscal Year Ending June 30
MMO City Funding Policy
Revenue Recognition Policy City Contributions
The key trend illustrated in this chart is the continuous growth in all measures since
FYE 2011 due in part to ten-year smoothing of historical investment losses, assumption changes
and the City’s decision to fund based on the MMO instead of the funding policy. This has slowed
the funding progress in maintaining the funding policy and has resulted in losses under the
funding policy due to contribution amounts being lower than what the policy calls for. These
losses result in the increasing gap between the funding policy amount and the MMO. However,
with the full payment of the initial funding policy base in FYE 2019, the funding policy has
decreased significantly and is closer to the MMO in FYE 2020.
The RRP is shown in the green bars starting FYE 2018. In FYE 2020, the RRP is approximately
$28.8 million higher than the MMO. In future years, as the tax revenue and tiered and additional
member contributions paid in excess of the MMO accumulate, the gap between the MMO and
the RRP will continue to grow.
CITY OF PHILADELPHIA MUNICIPAL RETIREMENT SYSTEM
JULY 1, 2018 ACTUARIAL VALUATION
SECTION I – BOARD SUMMARY
14
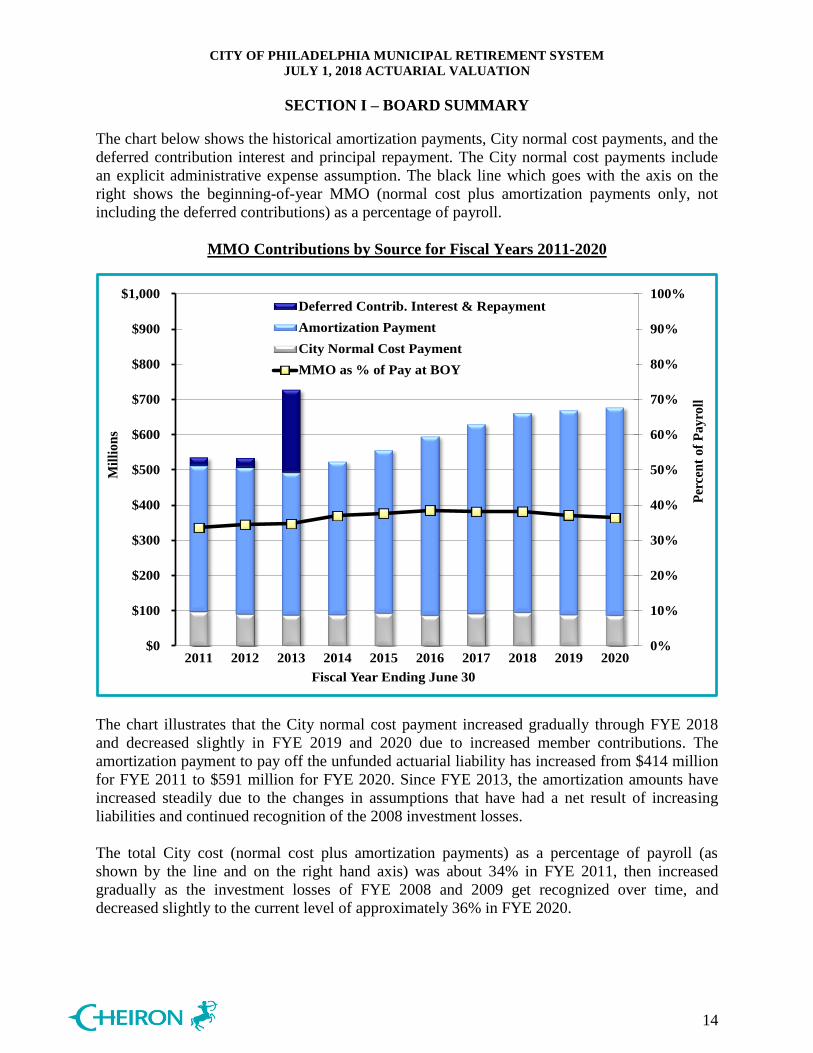
The chart below shows the historical amortization payments, City normal cost payments, and the
deferred contribution interest and principal repayment. The City normal cost payments include
an explicit administrative expense assumption. The black line which goes with the axis on the
right shows the beginning-of-year MMO (normal cost plus amortization payments only, not
including the deferred contributions) as a percentage of payroll.
MMO Contributions by Source for Fiscal Years 2011-2020
0%
10%
20%
30%
40%
50%
60%
70%
80%
90%
100%
$0
$100
$200
$300
$400
$500
$600
$700
$800
$900
$1,000
2011 2012 2013 2014 2015 2016 2017 2018 2019 2020
Per
cen
t o
f P
ay
roll
Mil
lio
ns
Fiscal Year Ending June 30
Deferred Contrib. Interest & Repayment
Amortization Payment
City Normal Cost Payment
MMO as % of Pay at BOY
The chart illustrates that the City normal cost payment increased gradually through FYE 2018
and decreased slightly in FYE 2019 and 2020 due to increased member contributions. The
amortization payment to pay off the unfunded actuarial liability has increased from $414 million
for FYE 2011 to $591 million for FYE 2020. Since FYE 2013, the amortization amounts have
increased steadily due to the changes in assumptions that have had a net result of increasing
liabilities and continued recognition of the 2008 investment losses.
The total City cost (normal cost plus amortization payments) as a percentage of payroll (as
shown by the line and on the right hand axis) was about 34% in FYE 2011, then increased
gradually as the investment losses of FYE 2008 and 2009 get recognized over time, and
decreased slightly to the current level of approximately 36% in FYE 2020.

CITY OF PHILADELPHIA MUNICIPAL RETIREMENT SYSTEM
JULY 1, 2018 ACTUARIAL VALUATION
SECTION I – BOARD SUMMARY
15
D. Projected Financial Trends
Our analysis of the City of Philadelphia Municipal Retirement System’s projected financial
trends is an important part of this valuation. In this section, we present our assessment of the
implications of the July 1, 2018 valuation results on the future outlook in terms of benefit
security (assets over liabilities) and the City’s expected cost progression.
In the charts that follow, we project the Retirement System’s assets and liabilities, and the City’s
contributions. Our illustrations assume the provisions of Act 205 as amended by Act 44 remain
in force during the projection period. The projections are based on the assumptions of the July 1, 2018
valuation and additionally reflect the decrease in interest rate assumption from 7.60% to 7.55%
as of July 1, 2019 as adopted by the Board.
These projections assume that new Police and Fire employees who have the option to elect out of
Plan 10 and into Plan 87 will choose to participate in Plan 87 and pay higher member
contributions. All projections also reflect future new hires in all Municipal groups who will
participate in the Stacked Hybrid Plan - Plan 16. Stacked plan benefits and contributions are
based on pay up to a cap of $65,000 resulting in lower future costs for this group.
All projections include expected additional funds from sales tax revenue and additional member
contributions for current and future Municipal members and members of 1987 Plans Police and
Fire. The amounts of expected sales tax provided to us by the City (as shown in the table below).
The treatment of the sales tax and tiered and additional member contributions varies based on
whether or not these amounts are used to reduce future City costs. Typically, as additional
contributions are received, the following years MMOs are reduced as a function of the additional
assets. However, under the RRP the benefit from the sales tax revenue and additional member
contributions are dedicated to fund the unfunded liability over reducing the City’s contribution
obligation such that this revenue is in addition to what the MMO would be without these
additional assets. Charts shown based on the RRP funding methodology set these assets aside in
a notional account which is deducted from actuarial asset value in determining the contributions
under the RRP. We show three sets of projections for contributions based on MMO calculated in
accordance with Act 205 compared to RRP and finally the Funding Policy.
The following chart reflects the expected projected sales tax revenue provided to us by the City
for our analysis.
2019 2020 2021 2022 2023
45,202,397$ 51,462,969$ 56,829,345$ 62,151,195$ 67,560,424$
2024 2025 2026 2027 2028
72,203,932$ 77,009,031$ 81,934,256$ 86,982,613$ 92,157,178$
2029 2030 2031 2032 2033
97,461,108$ 102,897,635$ 108,470,076$ 114,181,828$ 120,036,374$
2034 2035 2036 2037 2038
126,037,283$ 132,188,215$ 138,492,921$ 144,955,244$ 151,579,125$
Fiscal Year Ending
Expected Sales Tax
Fiscal Year Ending
Expected Sales Tax
Fiscal Year Ending
Expected Sales Tax
Fiscal Year Ending
Expected Sales Tax

CITY OF PHILADELPHIA MUNICIPAL RETIREMENT SYSTEM
JULY 1, 2018 ACTUARIAL VALUATION
SECTION I – BOARD SUMMARY
16
The following projections reflect the change in discount rate assumption from 7.60% to 7.55% as
of July 1, 2019 as adopted by the Board and are baseline projections assuming all actuarial
assumptions are met. We show three sets of projections for each of the three funding policies.
For each set of projections, we show two graphs covering the historical period from 2008 to
2018 and the projected period from 2019 to 2038 assuming all assumptions are met.
The top graph shows asset measures (green and blue lines) compared to liabilities (grey bars). At
the top of the graph is the progression of the System’s funding ratio which compares the actuarial
value of assets (blue lines) to the actuarial liability (grey bars). The bars for the historical period
are lighter shaded.
The bottom graph shows the MMO (red bars) including the impact on MMO reductions as a
function of expected sales tax revenue (blue bars) and expected tiered and member contributions
(black bars). The blue line shows the Funding Policy and the green line shows the expected City
contributions under the RRP which includes the sales tax revenue and additional member
contributions that are expected to be contributed on top of the MMO.
We show stress testing to illustrate the impact of varying returns on the System in Section II –
Assessment and Disclosure of Risk of this report. We do this because the System’s asset return
will never be level from year to year and the System must anticipate the implications of asset
return volatility to the funded status and contribution requirements.
In reviewing each of these projections, it is the future trends, not necessarily the actual values
that are important to observe in consideration of the risks of the System and the potential
volatility of future funding ratios and City contribution levels.
We note that when the System becomes 70% funded or greater, the unfunded liability may be
amortized on a rolling 10-year basis. We have not shown the implications of this alternative
funding method provided for in Act 205.

CITY OF PHILADELPHIA MUNICIPAL RETIREMENT SYSTEM
JULY 1, 2018 ACTUARIAL VALUATION
SECTION I – BOARD SUMMARY
17
Baseline Projection Set 1: City Makes Contributions based on MMO
If the City was to contribute based on the MMO the System is expected to reach 80% in 2031 and 100% funded by 2037. The
projections demonstrate a number of issues. Funding at the MMO level with the current ten-year asset smoothing method and the 2009,
30-year fresh start amortization method on a level-dollar basis, would result in a relatively slow improvement of funding.
$0
$2
$4
$6
$8
$10
$12
$14
$16
$18
2008 2010 2012 2014 2016 2018 2020 2022 2024 2026 2028 2030 2032 2034 2036 2038
Actuarial Liability Present Value All Benefits Actuarial Assets Market Assets
Bill
ions
Plan Year Beginning July 1
Bill
ions
Plan Year Beginning July 1
2008 2010 2012 2014 2016 2018 2020 2022 2024 2026 2028 2030 2032 2034 2036 2038
Mil
lion
s
Municipal Tier & Police/Fire Contributions Sales Tax MMO Funding Policy Revenue Recognition Policy
Fiscal Year Ending June 30 The decrease in FYE 2020 for the City’s Funding Policy (blue line) is due to the expected payment in full of the initial unfunded
liability.

CITY OF PHILADELPHIA MUNICIPAL RETIREMENT SYSTEM
JULY 1, 2018 ACTUARIAL VALUATION
SECTION I – BOARD SUMMARY
18
Baseline Projection Set 2: City Makes Contributions based on RRP
This chart illustrates the impact on the funded status when the additional revenue from sales tax and additional member contributions is
specifically used to pay down the unfunded liability under the Revenue Recognition Policy as opposed to reducing future costs. The
System is projected to be 80% funded by 2029 and 100% funded by 2033, four years earlier than under the MMO projections. By the
end of the projection period, the System is expected to be funded at 110.6% compared to 103.8% when MMO contributions are made.
$0
$2
$4
$6
$8
$10
$12
$14
$16
$18
2008 2010 2012 2014 2016 2018 2020 2022 2024 2026 2028 2030 2032 2034 2036 2038
Actuarial Liability Present Value All Benefits Actuarial Assets Market Assets
Bill
ions
Plan Year Beginning July 1
Bill
ions
Plan Year Beginning July 1
2008 2010 2012 2014 2016 2018 2020 2022 2024 2026 2028 2030 2032 2034 2036 2038
Mil
lion
s
Municipal Tier & Police/Fire Contributions Sales Tax MMO Funding Policy Revenue Recognition Policy
Fiscal Year Ending June 30
Sales tax revenue and additional member contributions are included in the green line which shows the RRP contributions. The RRP
contribution is higher than the MMO until the System reaches 100% funded in FYE 2034 at which time it drops to the normal cost rate.

CITY OF PHILADELPHIA MUNICIPAL RETIREMENT SYSTEM
JULY 1, 2018 ACTUARIAL VALUATION
SECTION I – BOARD SUMMARY
19
Baseline Projection Set 3: City Makes Contributions based on the Funding Policy
If the City’s Funding Policy is contributed every year going forward, the System reaches a funded ratio of 97.0% by 2038. In this
projection, we have assumed that the City may use sales tax revenue and additional member contributions to meet the requirements of
the Funding Policy. Over time the contributions under the Funding Policy are lower than the RRP, therefore, resulting in a lower funded
ratio by the end of the projection period.
$0
$2
$4
$6
$8
$10
$12
$14
$16
$18
2008 2010 2012 2014 2016 2018 2020 2022 2024 2026 2028 2030 2032 2034 2036 2038
Actuarial Liability Present Value All Benefits Actuarial Assets Market Assets
Bill
ions
Plan Year Beginning July 1
Bill
ions
Plan Year Beginning July 1
2008 2010 2012 2014 2016 2018 2020 2022 2024 2026 2028 2030 2032 2034 2036 2038
Mil
lion
s
Municipal Tier & Police/Fire Contributions Sales Tax MMO Funding Policy Revenue Recognition Policy
Fiscal Year Ending June 30 Significantly larger contributions are assumed through FYE 2020 when projected contributions decline more rapidly after the initial
funded base is expected to be paid off in FYE 2020.

CITY OF PHILADELPHIA MUNICIPAL RETIREMENT SYSTEM
JULY 1, 2018 ACTUARIAL VALUATION
SECTION II – ASSESSMENT AND DISCLOSURE OF RISK
20
Actuarial valuations are based on a set of assumptions about future economic and demographic
experience. These assumptions represent a reasonable estimate of future experience, but actual
future experience will undoubtedly be different and may be significantly different. This section
of the report is intended to identify the primary risks to the plan, provide some background
information about those risks, and provide an assessment of those risks.
Identification of Risks
The fundamental risk to the System is that the contributions needed to pay the benefits become
unaffordable. While there are a number of factors that could lead to contribution amounts
becoming unaffordable, we believe the primary risks are:
• Investment risk,
• Longevity and other demographic risks, and
• Assumption change risk.
Investment Risk is the potential for investment returns to be different than expected. Lower
investment returns than anticipated will increase the unfunded actuarial liability necessitating
higher contributions in the future unless there are other gains that offset these investment losses.
The potential volatility of future investment returns is determined by the System’s asset
allocation and the affordability of the investment risk is determined by the amount of assets
invested relative to the size of the plan sponsor or other contribution base.
Longevity and other demographic risks are the potential for mortality or other demographic
experience to be different than expected. Our mortality assumption has consistently used a
mortality improvement scale to project rates past the valuation date to reflect projected
improvements in mortality over time. In addition, there is the requirement to measure actual
experience against the assumptions every four years. Currently, the System pays out over $800
million in benefit payments each year which is a cash flow risk as members continue to live
longer. Generally, longevity and other demographic risks emerge slowly over time.
Assumption change risk is the potential for the environment to change such that future valuation
assumptions are different than the current assumptions. For example, declines in interest rates
over the last three decades resulted in higher investment returns for fixed income investments,
but lower expected future returns necessitating either a change in investment policy, a reduction
in discount rate, or some combination of the two. Assumption change risk is an extension of the
other risks identified, but rather than capturing the risk as it is experienced, it captures the cost of
recognizing a change in environment when the current assumption is no longer reasonable.
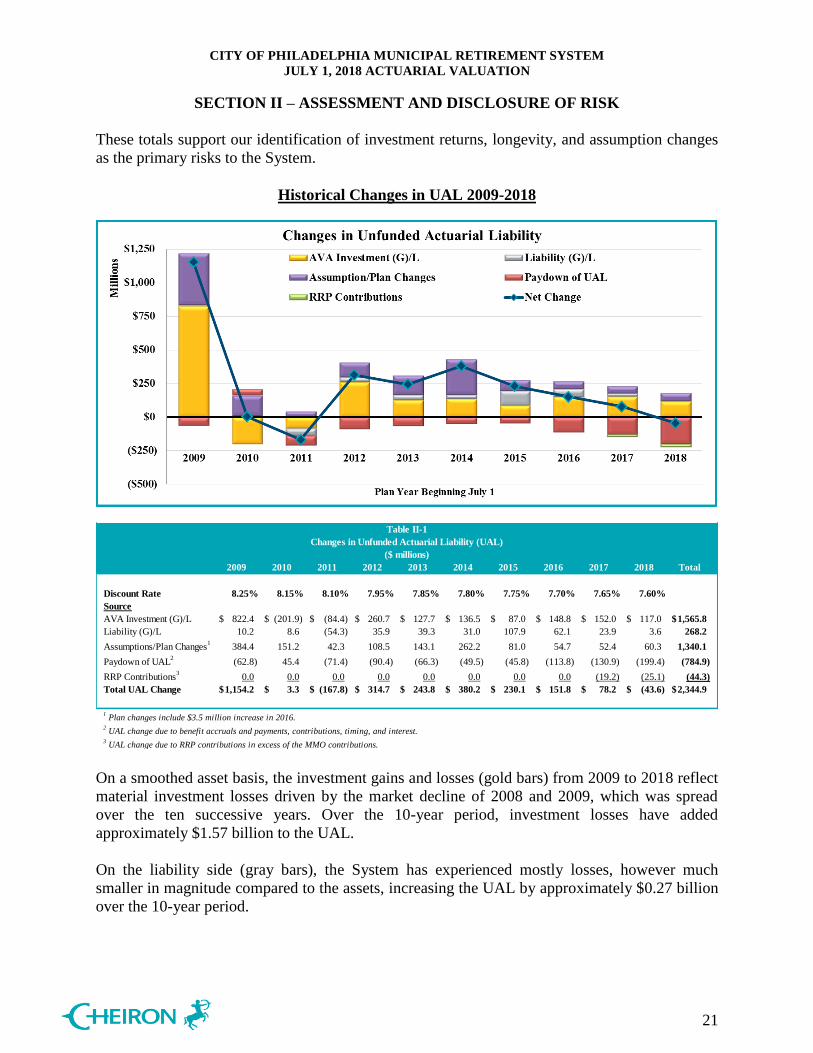
The chart below shows the components of changes in the Unfunded Actuarial Liability (UAL)
for the System over the last 10 years, including investment gains and losses on the Actuarial
Value of Assets, liability gains and losses, assumption and benefit changes, paying down of the
UAL, and RRP contributions in excess of the MMO. The net UAL change is shown by the dark
blue line. Table II-1 below the chart summarizes the changes in the UAL over the last 10 years.
CITY OF PHILADELPHIA MUNICIPAL RETIREMENT SYSTEM
JULY 1, 2018 ACTUARIAL VALUATION
SECTION II – ASSESSMENT AND DISCLOSURE OF RISK
21
These totals support our identification of investment returns, longevity, and assumption changes
as the primary risks to the System.
Historical Changes in UAL 2009-2018
Table II-1
Changes in Unfunded Actuarial Liability (UAL)
($ millions)
2009 2010 2011 2012 2013 2014 2015 2016 2017 2018 Total
Discount Rate 8.25% 8.15% 8.10% 7.95% 7.85% 7.80% 7.75% 7.70% 7.65% 7.60%
Source
AVA Investment (G)/L 822.4$ (201.9)$ (84.4)$ 260.7$ 127.7$ 136.5$ 87.0$ 148.8$ 152.0$ 117.0$ 1,565.8$
Liability (G)/L 10.2 8.6 (54.3) 35.9 39.3 31.0 107.9 62.1 23.9 3.6 268.2
Assumptions/Plan Changes1
384.4 151.2 42.3 108.5 143.1 262.2 81.0 54.7 52.4 60.3 1,340.1
Paydown of UAL2
(62.8) 45.4 (71.4) (90.4) (66.3) (49.5) (45.8) (113.8) (130.9) (199.4) (784.9)
RRP Contributions3
0.0 0.0 0.0 0.0 0.0 0.0 0.0 0.0 (19.2) (25.1) (44.3)
Total UAL Change 1,154.2$ 3.3$ (167.8)$ 314.7$ 243.8$ 380.2$ 230.1$ 151.8$ 78.2$ (43.6)$ 2,344.9$
1 Plan changes include $3.5 million increase in 2016.
2 UAL change due to benefit accruals and payments, contributions, timing, and interest.
3 UAL change due to RRP contributions in excess of the MMO contributions.
On a smoothed asset basis, the investment gains and losses (gold bars) from 2009 to 2018 reflect
material investment losses driven by the market decline of 2008 and 2009, which was spread
over the ten successive years. Over the 10-year period, investment losses have added
approximately $1.57 billion to the UAL.
On the liability side (gray bars), the System has experienced mostly losses, however much
smaller in magnitude compared to the assets, increasing the UAL by approximately $0.27 billion
over the 10-year period.

CITY OF PHILADELPHIA MUNICIPAL RETIREMENT SYSTEM
JULY 1, 2018 ACTUARIAL VALUATION
SECTION II – ASSESSMENT AND DISCLOSURE OF RISK
22
Assumption and plan changes (purple bars) over the last 10 years have increased the UAL by
about $1.34 billion. As a note, the only plan change during the period occurred in 2016 which
increased the UAL by about $3 million. The significant assumption changes have included
reductions in the discount rate from 8.25% to 7.60% as well as experience studies in 2010, 2014,
and 2018. It is important to note that investment return changes simply reflect a downward
revision to the estimate of future investment earnings and ultimately costs will be determined by
actual investment earnings. With the continued low-interest rate environment, we are continuing
to see investment consultants reduce their capital market assumptions. As a result, future
expectations of investment returns may continue to decline necessitating further reductions in the
discount rate.
In addition, increases in UAL due to the experience studies have been primarily driven by
decreasing mortality rates and projecting mortality improvement. This accounts for members
living longer and the longevity risk for the System.
Each year, the UAL is expected to decrease due to paying down of the UAL from the
contributions coming into the System. Changes due to paying down the UAL (red bars), related
to benefit accruals and payments, contributions, and timing, have decreased the UAL by about
$0.78 billion over the last 10 years.
Finally, starting in 2016, the City has started contributing at higher amounts under the RRP in
comparison to MMO. In the last two years, RRP contributions (green bars) in excess of the
MMO contributions have decreased the UAL by about $44 million. In future years, as the tax
revenue and tiered and additional member contributions paid in excess of the MMO accumulate,
this amount will continue to increase.
Plan Maturity Measures
The future financial condition of a mature pension plan is more sensitive to each of the risks
identified above than a less mature plan. Before assessing each of these risks, it is important to
understand the maturity of the plan compared to other plans and how the maturity has changed
over time.
Plan maturity can be measured in a variety of ways, but they all get at one basic dynamic - the
larger the plan is compared to the contribution or revenue base that supports it; the more
sensitive the plan will be to risk. The measures below have been selected as the most important
in understanding the primary risks identified for the System.
Inactives per Active (Support Ratio)
One simple measure of plan maturity is the ratio of the number of inactive members (those
receiving benefits or entitled to a deferred benefit) to the number of active members. We refer to
this ratio as the support ratio. The revenue base supporting the plan is usually proportional to the
number of active members, so a relatively high number of inactives compared to actives indicate
a larger plan relative to its revenue base as well.

CITY OF PHILADELPHIA MUNICIPAL RETIREMENT SYSTEM
JULY 1, 2018 ACTUARIAL VALUATION
SECTION II – ASSESSMENT AND DISCLOSURE OF RISK
23
The chart above shows the distribution from the 5th
to 95th
percentile of support ratios for the
plans in the Public Plans Database. The black diamond shows how the System compares. What
this shows is that the System was already in a relatively mature status in 2001 while the other
systems over this historic period grew more mature resulting in the System actually becoming
more the norm. So as the average support ratio for other public plans has gradually increased
over time, the support ratio for the System has been decreasing since 2012 and currently has a
similar support ratio in 2018 as compared to 2001.
Net Cash Flow
The net cash flow of the plan as a percentage of the beginning of year assets indicates the
sensitivity of the plan to short-term investment returns. Net cash flow is equal to contributions
less benefit payments and administrative expenses. Mature plans can have large amounts of
benefit payments compared to contributions, particularly if they are well funded. Investment
losses in the short-term are compounded by the net withdrawal from the plan leaving a smaller
asset base to try to recover from the investment losses. Large negative cash flows can also create
liquidity issues.

CITY OF PHILADELPHIA MUNICIPAL RETIREMENT SYSTEM
JULY 1, 2018 ACTUARIAL VALUATION
SECTION II – ASSESSMENT AND DISCLOSURE OF RISK
24
The chart above shows the distribution from the 5th
to 95th
percentile of net cash flow for the
plans in the Public Plans Database. The black diamond shows how the System compares. Up
until 2006, the System was consistently below the 5th
percentile compared to the database of
other public plans in terms of negative cash flow as a percentage of assets. In 2004, the net cash
flow decreased down to -10.2% due to a PAF distribution. The decrease in 2010 was a result of
the deferred contributions which were subsequently repaid in 2013, causing a positive net cash
flow for that year. The steps taken by the City and participants in providing additional
contributions to the System has reduced this cash flow risk significantly. In 2018, there was a
positive cash flow which would likely put the System on the other side of the spectrum in the
95th
percentile.
Assessing Costs and Risks
The fundamental risk to the System is that the contributions needed to fund the benefits become
unaffordable. Assessing this risk, however, is complex because there is no bright line of what is
unaffordable and the contribution amounts themselves are affected not just by the experience of
the System, but also by the interaction of that experience and decisions by the Board related to
assumptions, asset smoothing methods, and amortization periods.
Deterministic Scenarios/Stress Testing
This section illustrates stress testing of the investment return assumption and is an extension of
the baseline results provided in the baseline projections in the Summary section. Under the
baseline results, we assumed the ultimate 7.55% investment return assumption each and every
year beginning July 1, 2019.

CITY OF PHILADELPHIA MUNICIPAL RETIREMENT SYSTEM
JULY 1, 2018 ACTUARIAL VALUATION
SECTION II – ASSESSMENT AND DISCLOSURE OF RISK
25
For stress testing purposes, we developed six hypothetical scenarios to illustrate the impact
actual investment returns may have on future funded status and contribution rates. The scenarios
are balanced between positive and negative scenarios and are based on a normal distribution of
one and five year expected returns as shown in the table below using the 10-year capital market
assumptions from the System’s investment consultant as of February 2019 (Geometric return of
7.66%, standard deviation of 11.11%).
Percentile 1 Year 5 Year
5% -10.6% -0.5%
25% 0.2% 4.3%
50% 7.7% 7.7%
75% 15.2% 11.0%
95% 25.9% 15.8%
Distribution of Expected Average Annual Returns
The scenarios include: a one-year shock using the 5th and 95th percentile returns for one year; a
5-year moderate scenario using the 25th and 75th percentile returns for five years; and a 5-year
significant scenario using the 5th and 95th percentile returns for five years. A two-standard
deviation event may seem like a very remote possibility, but the risk actually accumulates from
year to year. The table below summarizes the theoretical scenarios.
FYE Neg Pos Neg Pos Neg Pos
2019 -10.6% 25.9% 4.3% 11.0% -0.5% 15.8%
2020 7.55% 7.55% 4.3% 11.0% -0.5% 15.8%
2021 7.55% 7.55% 4.3% 11.0% -0.5% 15.8%
2022 7.55% 7.55% 4.3% 11.0% -0.5% 15.8%
2023 7.55% 7.55% 4.3% 11.0% -0.5% 15.8%
2024+ 7.55% 7.55% 7.55% 7.55% 7.55% 7.55%
1-Yr Shock 5-Yr Moderate 5-Yr Significant
Theoretical Scenarios
The charts on the following pages show the projections over the next 20 years under each of
these theoretical scenarios assuming the City makes contributions on the RRP basis. For each
scenario we show two charts.
The top chart shows asset measures (green and blue lines) compared to liabilities (grey bars). At
the top of each chart is the progression of the System’s funding ratio which compares the
actuarial value of assets (blue lines) to the actuarial liability (grey bars).
Under the baseline RRP scenario assuming a 7.55% return assumption each and every year from
the prior section, the System achieved fully funded by 2033. The stress testing of return
expectations reveals insight from these charts as to how varying investment returns impact the
System’s funding ratio.

CITY OF PHILADELPHIA MUNICIPAL RETIREMENT SYSTEM
JULY 1, 2018 ACTUARIAL VALUATION
SECTION II – ASSESSMENT AND DISCLOSURE OF RISK
26
It is worth noting the 10-year asset smoothing method has significant influence on the smoothing
of assets against market value volatility as well as the relatively slow funding progress. A single
year or a couple of years of lower than expected returns can delay the System from becoming
fully funded. While some of these losses are made up through required increased contribution
payments, these scenarios also demonstrate the implications of negative cash flow.
When a mature system pays out more than it receives in a year and returns are below the
assumption, the assets that get paid out are no longer in the system during subsequent years of
market recovery. So a system with significant negative cash flow coupled with investment return
volatility will grow at a slower rate than the investment return assumption.
The bottom chart shows the MMO (red bars) including the impact on MMO reductions as a
function of expected sales tax revenue (blue bars) and expected tiered and member contributions
(black bars). The green line shows the expected City contributions under the RRP which includes
the sales tax revenue and additional member contributions that are expected to be contributed on
top of the MMO. Prior to 2016, the RRP is equal to the MMO. The dashed green line represents
the expected RRP under the baseline projections to facilitate the comparison between the
particular scenario and the baseline projections assuming all assumptions are met.

CITY OF PHILADELPHIA MUNICIPAL RETIREMENT SYSTEM
JULY 1, 2018 ACTUARIAL VALUATION
SECTION II – ASSESSMENT AND DISCLOSURE OF RISK
27
One-Year Negative Shock Scenario: -10.6% return FYE 2019, 7.55% after

CITY OF PHILADELPHIA MUNICIPAL RETIREMENT SYSTEM
JULY 1, 2018 ACTUARIAL VALUATION
SECTION II – ASSESSMENT AND DISCLOSURE OF RISK
28
One-Year Positive Shock Scenario: 25.9% return FYE 2019, 7.55% after

CITY OF PHILADELPHIA MUNICIPAL RETIREMENT SYSTEM
JULY 1, 2018 ACTUARIAL VALUATION
SECTION II – ASSESSMENT AND DISCLOSURE OF RISK
29
Five-Year Moderate Negative Scenario: 4.3% return FYE 2019-2023, 7.55% after

CITY OF PHILADELPHIA MUNICIPAL RETIREMENT SYSTEM
JULY 1, 2018 ACTUARIAL VALUATION
SECTION II – ASSESSMENT AND DISCLOSURE OF RISK
30
Five-Year Moderate Positive Scenario: 11.0% return FYE 2019-2023, 7.55% after

CITY OF PHILADELPHIA MUNICIPAL RETIREMENT SYSTEM
JULY 1, 2018 ACTUARIAL VALUATION
SECTION II – ASSESSMENT AND DISCLOSURE OF RISK
31
Five-Year Significant Negative Scenario: -0.5% return FYE 2019–2023, 7.55% after

CITY OF PHILADELPHIA MUNICIPAL RETIREMENT SYSTEM
JULY 1, 2018 ACTUARIAL VALUATION
SECTION II – ASSESSMENT AND DISCLOSURE OF RISK
32
Five-Year Significant Positive Scenario: 15.8% return FYE 2019-2023, 7.55% after

CITY OF PHILADELPHIA MUNICIPAL RETIREMENT SYSTEM
JULY 1, 2018 ACTUARIAL VALUATION
SECTION II – ASSESSMENT AND DISCLOSURE OF RISK
33
As illustrated in the charts above, varying returns have an impact on the computed City
contributions, especially in the later projection years when the System is fully funded. However,
the volatility is mitigated for two reasons, the 10-year smoothing of assets and 20-year
amortization of experience gains and losses. This illustrates that the future contributions should
be anticipated to be higher to adjust for the market volatility. Thus, the market volatility can
prolong the period of paying down the unfunded when coupled with the impact of negative cash
flows in down markets.
The investment returns used in the projections above were selected solely to illustrate the
impact of investment volatility on the pattern of funded status and City contributions. They
are not intended to be predictive of actual future contributions or funded status or even to
represent a realistic pattern of investment returns.
Stochastic Projections
Stochastic Projections are used to provide a more realistic picture of what the likely future
outcomes might be. Instead of a single projection, we use the expected long term average return
allowing for the returns for each year to vary according to the expected volatility of asset returns
based on the current asset allocation. The returns are determined randomly within acceptable
ranges; we then perform 10,000 such projections over a 15 year period and accumulate the
results. Accumulating this information allows us to present ranges of likely results.
The charts on the next page show the stochastic projection of the actuarial funded ratio and City
contribution amounts under RRP. The blue line represents the most likely or average of the range
of outcomes. The colored ranges represent potential results reflecting future asset return
volatility. So the yellow bar around the blue line shows there is a 20% probability the actual ratio
will fall within the range. The dark green and dark blue bars show that there is a 50% probability
the actual results will fall within the ranges (25th
-40th
and 60th
-75th
). Finally, the light green and
the light blue bars show that there is a 90% chance the actual results will fall within those ranges
(5th
-25th
and 75th
-95th
). Another way to say this is there is a 10% chance the ratio could be above
or below the projected range of ratios shown. There is increasing uncertainty in the actuarial
funded ratio and level of City contributions depending on investment returns over time reflected
in how broad the range gets.

CITY OF PHILADELPHIA MUNICIPAL RETIREMENT SYSTEM
JULY 1, 2018 ACTUARIAL VALUATION
SECTION II – ASSESSMENT AND DISCLOSURE OF RISK
34
Stochastic Projection of Actuarial Funded Ratio and City Contributions
In the worst scenarios, the System’s actuarial funded ratio is just over 70% by 2032 based on
poor investment retuns. In the best scenarios, the System’s actuarial funded ratio reaches 120%
by 2032.
In a similar process, we show the projected volatility of future City contributions.
In the worst scenarios, the City’s contribution amount could exceed $1 billion by 2032. In the
best scenarios, the City’s contribution could drop below $150 million as early as 2030 which
represents the System reaching 100% funded or greater at which time it drops to the normal cost
rate. The significant cost reduction shows the potential when there are no more payments to fund
the unfunded liability.

CITY OF PHILADELPHIA MUNICIPAL RETIREMENT SYSTEM
JULY 1, 2018 ACTUARIAL VALUATION
SECTION III – ASSETS
35
The Retirement System uses and discloses two different asset measurements for funding, which
are presented in this section of the report: market value and actuarial value of assets. The market
value represents the value of the assets if they were liquidated on the valuation date and, unless
explicitly stated otherwise, this value includes the Pension Adjustment Fund (PAF) which is not
available for funding purposes. The actuarial value of assets is a value that smooths annual
investment returns over ten years beginning in 2008 (five years before 2008) to reduce annual
investment volatility and is used in determining contribution levels. This smoothing method also
requires that the actuarial value of assets may not be more than 120% or less than 80% of the
market value of assets. By definition, the actuarial value of assets does not include the PAF.
On the following pages, we present detailed information on the Retirement System’s assets:
Disclosure of assets at July 1, 2017 and July 1, 2018,
Statement of cash flows during the year,
Development of the actuarial value of assets,
Apportionment of assets between plans for valuation purposes,
Development of the Pension Adjustment Fund as of July 1, 2018,
Development of the actuarial value of assets for Revenue Recognition Policy, and
Disclosure of investment performance for the year.
A. Disclosure
The market value of assets represents a “snap-shot” value as of the last day of the fiscal year that
provides the principal basis for measuring financial performance from one year to the next.
Market values, however, can fluctuate widely with corresponding swings in the value of the
investments. Because these fluctuations would cause volatility in employer contributions, an
actuarial value of assets is developed. Table III-1 on the following page presents the market
value by asset class as of July 1, 2017 and July 1, 2018. Table III-2 presents the System’s net
cash flows for the plan year beginning July 1, 2017 and ending June 30, 2018. Table III-3
presents Fiscal 2018 contributions received from the City and members of the System.

CITY OF PHILADELPHIA MUNICIPAL RETIREMENT SYSTEM
JULY 1, 2018 ACTUARIAL VALUATION
SECTION III – ASSETS
36
Table III-2
Statement of Assets at Market Value* Changes in Market Values1
7/1/2018 7/1/2017
Assets
Cash 14,542,295$ 15,077,026$
Investments 5,208,327,049 4,812,767,551
Securities Lending 411,318,769 369,223,924
Accrued Interest and Other Receivables 238,879,825 193,774,643
Due from Other Governmental Units 9,225,655 8,538,650
Total Assets 5,882,293,593$ 5,399,381,794$
Liabilities
Due on Securities Lending 411,286,925$ 369,181,268$
Accrued Expenses and Other Liabilities 129,721,140 156,125,700
Total Liabilities 541,008,065$ 525,306,968$
Net Assets 5,341,285,527$ 4,874,074,826$
* Includes the PAF which is not available for funding purposes.
Table III-1

CITY OF PHILADELPHIA MUNICIPAL RETIREMENT SYSTEM
JULY 1, 2018 ACTUARIAL VALUATION
SECTION III – ASSETS
37
B. System Cash Flows for the Year July 1, 2017 through July 1, 2018
Table III-2 Table III-3
Changes in Market Values1
Contributions for the Plan Year Ending June 30, 2018
Value of Assets – July 1, 2017 4,874,074,826$
Additions
Contributions:
Employer Contributions 781,984,326$
Employee Contributions 83,288,635
Total Contributions 865,272,961$
Investment Income: Appreciation in FV of Investments 318,229,513$
Interest and Dividends 127,784,903
Total Investment Income 446,014,416$
Investment Activity Expenses:
Investment Expenses (7,500,394)
Total Investment Activity Expenses (7,500,394)$
Securities Lending Activities:
Securities Lending Income 1,836,151$
Securities Lending Expenses (274,649)
Net Income from Securities Lending Activities 1,561,502$
Miscellaneous Operating Revenues 251,264$
Net Investment Income 440,326,788
Total Additions 1,305,599,749$
Deductions
Administrative Expenses (10,123,004)$
Withdrawal Refunds (8,498,915)
Benefit Payments (819,732,525)
PAF Distributions (34,604)
Total Deductions (838,389,048)
Total
Net Increase (Decrease) 467,210,701
Value of Assets – July 1, 2018 5,341,285,527$ 1 Includes the PAF which is not available for funding purposes

CITY OF PHILADELPHIA MUNICIPAL RETIREMENT SYSTEM
JULY 1, 2018 ACTUARIAL VALUATION
SECTION III – ASSETS
38
Table III-3 Table III-4
Contributions for the Plan Year Ending June 30, 2018 Development of Actuarial Value of Assets
City Contributions as of July 1, 2018
Cash Received from City during Fiscal Year 2018 731,864,934$
Sales Tax Revenue 24,202,319
Cash Received from Quasi-Agencies 25,917,073
Total Cash Received from City during Fiscal Year 2018 781,984,326$
Member Contributions
Regular Member Contributions 77,378,509$
Tier Member Contributions (Municipal and Elected) 1,538,576
Additional Member Contributions (Police and Fire) 4,371,550
83,288,635$ Total Member Contributions Received during
Fiscal Year 2018

CITY OF PHILADELPHIA MUNICIPAL RETIREMENT SYSTEM
JULY 1, 2018 ACTUARIAL VALUATION
SECTION III – ASSETS
39
C. Actuarial Value of Assets
To determine on-going funding requirements, most pension systems utilize an actuarial value of
assets that differs from the market value of assets. The actuarial value of assets represents an
asset value based on averaging or smoothing year-to-year market value returns for purposes of
reducing contribution volatility. Beginning with investment losses as of Fiscal Year End 2009,
gains and losses are prospectively distributed in equal amounts over a ten-year period. The
resulting asset value may not be more or less than 20% of the MVA.
Table III-4
Development of Actuarial Value of Assets
as of July 1, 2018
1. Market Value of Assets as of July 1, 2018 5,341,285,527$
2. Pension Adjustment Fund (PAF) as of July 1, 2018
Before Additional Transfers 1,160,247$
3. Market Value of Assets Net of Original PAF* 5,340,125,281$
4. Deferred Asset Gains/(Losses)
Fiscal Year Investment Percent Percent Amount
Ending Gains / (Losses) Recognized Deferred Deferred
2009 (1,235,073,412)$ 100% 0% 0$
2010 200,524,637 90% 10% 20,052,464
2011 414,187,915 80% 20% 82,837,583
2012 (328,486,968) 70% 30% (98,546,090)
2013 127,718,278 60% 40% 51,087,311
2014 347,082,935 50% 50% 173,541,468
2015 (349,020,722) 40% 60% (209,412,433)
2016 (489,127,035) 30% 70% (342,388,924)
2017 242,673,428 20% 80% 194,138,743
2018 79,312,820 10% 90% 71,381,538
Total (57,308,340)$
5. Preliminary Actuarial Value as of July 1, 2018 (5 = 3 - 4) 5,397,433,621$
6. Corridor for Actuarial Value
a. 80% of Market Value Net of PAF 4,272,100,225$
b. 120% of Market Value Net of PAF 6,408,150,337$
7. Additional PAF Transfer as of July 1, 2018 0$
8. Actuarial Value of Assets Net of Final PAF as of July 1, 2018 5,397,433,621$
8 = max( (min of 5 or 6b) and 6a), minus 7
9. As a percent of Market Value Net of Final PAF 101.1%
10. Market Value of Assets Net of Final PAF 5,340,125,281$
* Market value of assets net of original PAF before the determination of the final PAF amount. See section
III - E for more details on the development of the total PAF and the additional PAF transfer, if applicable.

CITY OF PHILADELPHIA MUNICIPAL RETIREMENT SYSTEM
JULY 1, 2018 ACTUARIAL VALUATION
SECTION III – ASSETS
40
D. Apportionment of Actuarial Value of Assets
The asset allocation reflects the actual cash flows for each plan and proportional allocation of investment earnings.
Plan '10 Plan '16
Municipal Police Fire Municipal Elected Police Fire Municipal Municipal Total
1. Actuarial Value of Assets
as of July 1, 2017 1,425,691$ 522,495$ 179,058$ 1,349,865$ 12,909$ 1,252,508$ 361,344$ 3,905$ 844$ 5,108,619$
2. Transactions During Plan Year
July 1, 2017 to June 30, 2018
a. Contributions
City and Commonwealth 334,348$ 174,088$ 73,093$ 88,333$ 1,543$ 61,366$ 20,867$ 935$ 1,495$ 756,067$
Employees 4,614 1,598 526 33,503 418 29,554 9,312 2,123 1,640 83,289
Quasi-Public Agencies 21,544 0 0 4,085 0 0 0 61 227 25,917
b. Benefit Payments (422,657) (211,572) (86,483) (54,027) (1,647) (34,687) (8,661) 0 0 (819,733)
c. Withdrawals (1,565) (542) (204) (3,869) (12) (1,957) (316) 0 (35) (8,499)
d. Administrative Expenses (3,225) (1,401) (480) (3,270) (7) (1,062) (386) (200) (92) (10,123)
e. Net Transactions (66,941)$ (37,829)$ (13,548)$ 64,755$ 295$ 53,214$ 20,816$ 2,919$ 3,235$ 26,918$
3. Total Fund Balance Prior to Allocation
of Investment Income [1. + 2e.] 1,358,750$ 484,666$ 165,510$ 1,414,620$ 13,204$ 1,305,722$ 382,160$ 6,824$ 4,079$ 5,135,537$
4. Investment Income During Plan Year
July 1, 2017 to June 30, 2018 69,292$ 24,716$ 8,441$ 72,141$ 673$ 66,588$ 19,489$ 348$ 208$ 261,896$
5. Preliminary Actuarial Value of Assets
as of July 1, 2018 [3. + 4.] 1,428,042$ 509,384$ 173,951$ 1,486,760$ 13,878$ 1,372,310$ 401,650$ 7,171$ 4,287$ 5,397,434$
6. Allocation of PAF Transfer 0$ 0$ 0$ 0$ 0$ 0$ 0$ 0$ 0$ 0$
7. Final Actuarial Value of Assets
With Corridor as of July 1, 2018 1,428,042$ 509,384$ 173,951$ 1,486,760$ 13,878$ 1,372,310$ 401,650$ 7,171$ 4,287$ 5,397,434$
8. Final Actuarial Value of Assets
Less RRP Additional Revenue Account 1,411,344$ 503,428$ 171,917$ 1,469,376$ 13,716$ 1,356,264$ 396,954$ 7,087$ 4,236$ 5,334,322$
Note: Numbers may not add due to rounding
1967 Plan 1987 Plan
Table III-5
Allocation of Assets for Valuation Purposes Between Plans as of July 1, 2018
($ thousands)

CITY OF PHILADELPHIA MUNICIPAL RETIREMENT SYSTEM
JULY 1, 2018 ACTUARIAL VALUATION
SECTION III – ASSETS
41
E. Development of the Pension Adjustment Fund as of July 1, 2018
This table provides the funds available for distribution consideration under title §22-311 of the
Philadelphia Code. In general, the Pension Adjustment Fund (PAF) provides for additional
benefit distributions to retirees and beneficiaries through the use of excess earnings. This may
include a lump-sum bonus payment, monthly pension increases, ad-hoc cost of living
adjustments, or other increases determined by the Board. The adjusted market value of assets
reflects a five-year smoothing of asset gains and losses, as described in the Philadelphia Code.
Table III-6 Table III-7
Development of the Pension Adjustment Fund Actuarial Value of Assets for Revenue Recognition Policy
as of July 1, 2018 as of July 1, 2018
1. PAF on July 1, 2017 1,097,499$
2. PAF Distribution (34,604)
3. Market Value Asset Return Through June 30, 2018 * 9.01%
4. PAF on July 1, 2018 Before Additional Transfers** 1,160,247$
=(1) x [1 + (3)] + (2)
5. Adjusted Market Value of Assets Through June 30, 2018 5,396,525,926$
6. Adjusted Market Value of Assets Return Through June 30, 2018 *** 6.47%
7. Return in Excess of Investment Assumption Plus 1.0%, Limited to 5.0% 0.00%
=(6) - [7.65% + 1.00%]
8. Additional Transfer as of July 1, 2018 0$
=50% of (7) x (5)
9. Total PAF as of July 1, 2018 1,160,247$
= (4) + (8)
* Market Value Asset Return including the PAF
** Calculations are based upon the unrounded percents for items (3) and (7)
*** Asset Return based upon the Adjusted Market Value of Assets using a 5 year smoothing of
the gains/losses as outlined in Title 22-311

CITY OF PHILADELPHIA MUNICIPAL RETIREMENT SYSTEM
JULY 1, 2018 ACTUARIAL VALUATION
SECTION III – ASSETS
42
F. Actuarial Value of Assets for Revenue Recognition Policy
The System is expected to receive additional revenue from sales tax, tier member contributions
and additional member contributions, which is anticipated to be contributed over and above the
City’s contribution of the MMO. These additional sources of revenue are tracked separately and
accumulated in a notional account. For determining the actuarial value of assets for the RRP, the
additional revenue account is excluded from the assets. Below is the development of the assets
used for the RRP.
Table III-7 Table III-8
Actuarial Value of Assets for Revenue Recognition Policy Annual Rates of Return
as of July 1, 2018
1. Additional Revenue Account on July 1, 2017 $30,032,925
2. Sales Tax Revenue Received During FYE June 30, 2018 $24,202,319
3. Tier and Additional Member Contributions Received During FYE June 30, 2018* 5,910,126
4. Market Value Asset Return Through June 30, 2018 9.01%
5. Interest Through June 30, 2018 2,966,218
6. Additional Revenue Account on July 1, 2018 $63,111,588
=(1) + (2) + (3) +(5)
7. Actuarial Value of Assets on June 30, 2018 $5,397,433,621
8. Actuarial Value of Assets Net of Additional Revenue on June 30, 2018** $5,334,322,033
=(7) - (6)
* Tier and additional member contributions are assumed to be received mid-year.
Actual date of receipt is used for sales tax revenue contribution
** Actuarial Value of Assets used in calculation of the RRP contribution is net of accumulated sales
tax revenue and tier and additional member contributions

CITY OF PHILADELPHIA MUNICIPAL RETIREMENT SYSTEM
JULY 1, 2018 ACTUARIAL VALUATION
SECTION III – ASSETS
43
G. Investment Performance
The market value of assets internal rate of return was 9.01% for the year ending June 30, 2018. This is compared to an assumed return
of 7.65% for the same period. This return produced an overall investment gain of $79.3 million for the year ending June 30, 2018. On
an actuarial value of assets basis (net of PAF), the return for FYE 2018 was 5.11%. In the table below, we also provide returns from
two broad asset classes for comparison.
Table III-8 Table III-9
Annual Rates of Return Calculation of Asset Gain/(Loss)
Investment Total Return Barclays
Year Ending Return Market Actuarial Standard & Poor's Aggregate
June 30, Assumption Value Value * 500 Index Bond Index**
1995 9.00% 11.70% 7.80% 26.10% 12.80%
1996 9.00% 15.10% 10.10% 26.00% 4.70%
1997 9.00% 18.30% 12.20% 34.60% 8.20%
1998 9.00% 14.30% 13.10% 30.20% 10.50%
1999 9.00% 10.00% 13.10% 22.70% 3.10%
2000 9.00% 9.60% 11.10% 7.30% 4.60%2001 9.00% -6.00% 8.30% -14.80% 11.20%
2002 9.00% -5.80% 3.40% -18.00% 8.60%
2003 9.00% 1.80% -2.20% 0.30% 10.40%
2004 9.00% 16.60% 4.60% 19.10% 0.30%
2005 8.75% 9.90% 1.80% 6.31% 6.81%
2006 8.75% 11.30% 6.10% 8.60% -0.80%
2007 8.75% 16.98% 10.71% 20.60% 6.10%
2008 8.75% -4.53% 10.13% -13.10% 7.10%
2009 8.75% -19.87% -9.28% -26.21% 5.98%
2010 8.25% 13.81% 12.89% 14.40% 9.19%
2011 8.15% 19.40% 9.90% 28.13% 3.56%
2012 8.10% 0.18% 2.42% 3.14% 7.30%
2013 7.95% 10.94% 5.08% 17.91% -0.85%
2014 7.85% 15.70% 4.81% 22.04% 4.36%
2015 7.80% 0.29% 5.80% 5.25% 1.86%
2016 7.75% -3.17% 4.45% 1.73% 6.00%
2017 7.70% 13.08% 4.40% 15.46% -0.31%
2018 7.65% 9.01% 5.11% 12.17% -0.39%
* Net of PAF

CITY OF PHILADELPHIA MUNICIPAL RETIREMENT SYSTEM
JULY 1, 2018 ACTUARIAL VALUATION
SECTION III – ASSETS
44
H. Asset Gain/(Loss)
There was a $79.3 million investment gain on market value of assets when compared to the
expected as of July 1, 2018. Table III-9 reconciles the 2018 asset gain (expected versus actual)
for the market value of assets both net of the PAF and in total. This investment gain is smoothed
over a ten-year period to determine the actuarial value of assets (see Table III – 4). Also provided
below is a reconciliation of the PAF.
Table III-9
Calculation of Asset Gain/(Loss)
Market Value PAF Total Market
(Net of PAF) Value
1. Market Value of Assets
as of July 1, 2017 4,872,977,327$ 1,097,499$ 4,874,074,826$
2. Transactions During Plan Year
July 1, 2017 to June 30, 2018
a. Contributions
City and Commonwealth 756,067,253$ 0$ 756,067,253$
Employees 83,288,635 0 83,288,635
Quasi-Public Agencies 25,917,073 0 25,917,073
b. Benefit Payments (819,732,525) (34,604) (819,767,129)
c. Withdrawals (8,498,915) 0 (8,498,915)
d. Administrative Expenses (10,123,004) 0 (10,123,004)
e. Net Transactions 26,918,517$ (34,604)$ 26,883,913$
3. Expected Investment Income from
July 1, 2017 to June 30, 2018 360,916,618$ 97,351$ * 361,013,969$
4. PAF transfer at July 1, 2018 0$ 0$ 0$
5. Expected Market Value of Assets
as of July 1, 2018 [1. + 2.e. + 3. + 4] 5,260,812,461$ 1,160,247$ 5,261,972,708$
6. Market Value of Assets
as of July 1, 2018 5,340,125,281$ 1,160,247$ 5,341,285,528$
7. Investment Gain/(Loss) [6. - 5.] 79,312,820$ 0$ 79,312,820$ *
The PAF is credited with investment income at the market rate of return earned by plan assets.

CITY OF PHILADELPHIA MUNICIPAL RETIREMENT SYSTEM
JULY 1, 2018 ACTUARIAL VALUATION
SECTION IV – LIABILITIES
45
In this section, we present detailed information on liabilities for the City of Philadelphia
Municipal Retirement System, including:
Disclosure of liabilities at July 1, 2017 and July 1, 2018,
Statement of changes in these liabilities and the unfunded liabilities during the year,
Development of the normal cost rates by plan, and
The reconciliation of the changes in the unfunded liability by plan as well as the expected
unfunded liability as of July 1, 2019.
Disclosure
Two types of liabilities are calculated and presented in this report. Each type is distinguished by
the purpose for which the figures are ultimately used.
Present Value of all Future Benefits: Used for measuring all future obligations, this
represents the amount of money needed today to fully fund all benefits both earned as of the
valuation date and those to be earned in the future by current plan participants, under the
current plan provisions and assumptions.
Actuarial Liability: Used for determining employer contributions and GASB accounting
disclosures. This liability is calculated by subtracting the present value of future member
contributions and future employer normal cost contributions as determined under the Entry
Age Normal Cost (EAN) actuarial funding method from the present value of all future
benefits.
These liabilities are for funding purposes and are not appropriate for measuring the cost of
settling plan liabilities by purchasing annuities or paying lump sums.

CITY OF PHILADELPHIA MUNICIPAL RETIREMENT SYSTEM
JULY 1, 2018 ACTUARIAL VALUATION
SECTION IV – LIABILITIES
46
Table III-1 shows the present value of future benefits, actuarial liability, and unfunded actuarial
liability as of July 1, 2018, and July 1, 2017, for the Retirement System.
Table IV-1 Table IV-2
Disclosure of Liabilities Liabilities Detail as of July 1, 2018
($ thousands) ($ thousands)
July 1, 2018 July 1, 2017
Present Value of Future Benefits
Actives 5,516,023$ 5,149,988$
Terminated Vesteds 104,765 111,367
Disabled 782,082 758,314
Retirees 5,119,142 5,038,627
Beneficiaries 672,900 651,804
DROP Account plus Deferred Annuities 909,297 807,195
Non-Vested Refunds 8,470 8,274
Total City PVFB 13,112,679$ 12,525,569$
Market Value of Assets (Net of PAF) (5,340,125) (4,872,977)
Present Value Future Member Contrib. (872,893) (602,656)
City's Unfunded Future Obligation 6,899,661$ 7,049,936$
Actuarial Liability
Actives 3,924,324$ 3,900,095$
Terminated Vesteds 104,765 111,367
Disabled 782,082 758,314
Retirees 5,119,142 5,038,627
Beneficiaries 672,900 651,804
DROP 909,297 807,195
Non-Vested Refunds 8,470 8,274
Total City AL 11,520,980$ 11,275,676$
Actuarial Value of Assets (5,397,434) (5,108,619)
Unfunded Actuarial Liability 6,123,546$ 6,167,057$

CITY OF PHILADELPHIA MUNICIPAL RETIREMENT SYSTEM
JULY 1, 2018 ACTUARIAL VALUATION
SECTION IV – LIABILITIES
47
Table IV-2 shows the present value of future benefits, actuarial liability, and unfunded actuarial liability for each Plan in the Retirement
System.
Table IV-2 Table IV-3
Liabilities Detail as of July 1, 2018 Derivation of the Normal Cost as of July 1, 2018
($ thousands) ($ thousands)
Plan '10 Plan '16
Municipal Police Fire Municipal Elected Police Fire Municipal Municipal Total
Present Value of Future Benefits
Actives 552,250$ 182,291$ 56,917$ 2,178,390$ 18,421$ 1,834,919$ 623,824$ 38,287$ 30,723$ 5,516,023$
Terminated Vesteds 33,861 139 0 56,580 0 12,180 2,005 0 0 104,765
Disabled 219,090 184,260 42,466 103,143 0 198,926 34,197 0 0 782,082
Retirees 2,726,960 1,305,366 569,414 329,414 10,784 136,134 41,071 0 0 5,119,142
Beneficiaries 338,734 178,986 77,361 39,851 631 27,112 10,226 0 0 672,900
DROP 439,465 139,754 53,585 141,272 1,503 105,170 28,548 0 0 909,297
Non-Vested Refunds 1,605 156 72 5,460 10 905 262 0 0 8,470
Total PVFB 4,311,965$ 1,990,952$ 799,815$ 2,854,110$ 31,350$ 2,315,346$ 740,133$ 38,287$ 30,723$ 13,112,679$
Actuarial Liability
Actives 521,106$ 168,292$ 52,735$ 1,589,016$ 15,408$ 1,193,853$ 372,620$ 8,015$ 3,280$ 3,924,324$
Terminated Vesteds 33,861 139 0 56,580 0 12,180 2,005 0 0 104,765
Disabled 219,090 184,260 42,466 103,143 0 198,926 34,197 0 0 782,082
Retirees 2,726,960 1,305,366 569,414 329,414 10,784 136,134 41,071 0 0 5,119,142
Beneficiaries 338,734 178,986 77,361 39,851 631 27,112 10,226 0 0 672,900
DROP 439,465 139,754 53,585 141,272 1,503 105,170 28,548 0 0 909,297
Non-Vested Refunds 1,605 156 72 5,460 10 905 262 0 0 8,470
Total AL 4,280,821$ 1,976,953$ 795,633$ 2,264,736$ 28,337$ 1,674,280$ 488,929$ 8,015$ 3,280$ 11,520,980$
Actuarial Value of Assets (1,428,042) (509,384) (173,951) (1,486,760) (13,878) (1,372,310) (401,650) (7,171) (4,287) (5,397,434)
Unfunded Actuarial Liability 2,852,779$ 1,467,569$ 621,682$ 777,976$ 14,459$ 301,970$ 87,279$ 844$ (1,007)$ 6,123,546$
Funding Percent 33.4% 25.8% 21.9% 65.6% 49.0% 82.0% 82.1% 89.5% 130.7% 46.8%
Note: Numbers may not add due to rounding.
1967 Plan 1987 Plan

CITY OF PHILADELPHIA MUNICIPAL RETIREMENT SYSTEM
JULY 1, 2018 ACTUARIAL VALUATION
SECTION IV – LIABILITIES
48
Table IV-3 shows the derivation of the City normal cost as a percent of pay for each Plan in the System under the MMO basis.
Table IV-3 Table IV-4
Derivation of the Normal Cost as of July 1, 2018 Expected Unfunded Actuarial Liability for the Plan Year Ending June 30, 2019
($ thousands) ($ thousands)
Plan '10 Plan '16
Municipal Police Fire Municipal Elected Police Fire Municipal Municipal Total
Retirement 3,267$ 2,806$ 887$ 41,078$ 310$ 41,537$ 16,209$ 1,706$ 1,837$ 109,638$
Death 157 96 32 2,706 20 2,118 876 139 153 6,297
Disability 439 507 156 6,788 33 10,511 4,056 472 354 23,315
Termination 3,565 284 83 22,600 161 4,505 1,554 960 1,058 34,772
Administrative Expenses 2,992 1,307 447 3,092 7 1,065 380 213 230 9,734
Total Normal Cost (with Expenses) 10,420$ 5,000$ 1,605$ 76,264$ 532$ 59,737$ 23,075$ 3,490$ 3,633$ 183,756$
Expected Employee Contributions 5,059$ 1,388$ 437$ 41,546$ 438$ 32,959$ 12,479$ 1,743$ 2,207$ 98,256$
City Normal Cost 5,361$ 3,612$ 1,168$ 34,718$ 94$ 26,777$ 10,595$ 1,747$ 1,425$ 85,497$
Current Annual Payroll 83,618$ 23,134$ 7,288$ 917,941$ 3,298$ 467,223$ 173,915$ 74,811$ 54,172$ 1,805,400$
City Normal Cost as % of Pay,
Beginning of Year Payment 6.412% 15.613% 16.026% 3.782% 2.849% 5.731% 6.092% 2.335% 2.631% 4.736%
City Normal Cost as % of Pay,
End of Year Payment 6.899% 16.800% 17.244% 4.070% 3.065% 6.167% 6.555% 2.512% 2.831% 5.096%
Note: Numbers may not add due to rounding.
1967 Plan 1987 Plan
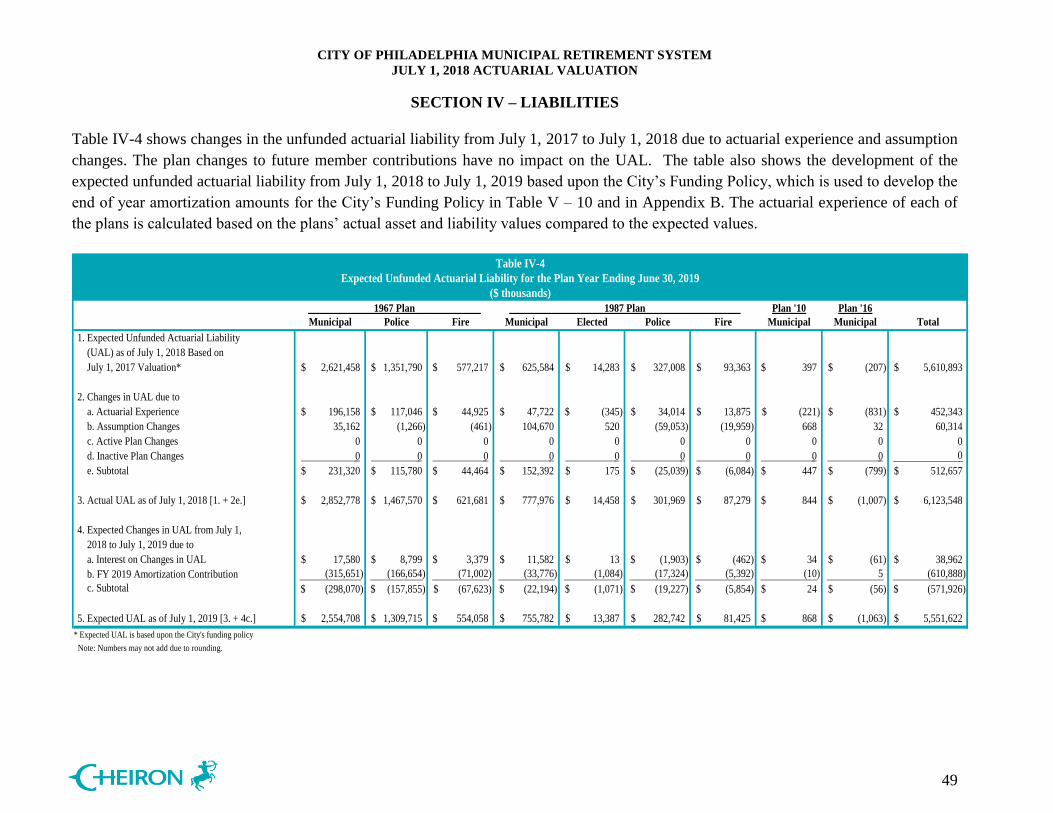
CITY OF PHILADELPHIA MUNICIPAL RETIREMENT SYSTEM
JULY 1, 2018 ACTUARIAL VALUATION
SECTION IV – LIABILITIES
49
Table IV-4 shows changes in the unfunded actuarial liability from July 1, 2017 to July 1, 2018 due to actuarial experience and assumption
changes. The plan changes to future member contributions have no impact on the UAL. The table also shows the development of the
expected unfunded actuarial liability from July 1, 2018 to July 1, 2019 based upon the City’s Funding Policy, which is used to develop the
end of year amortization amounts for the City’s Funding Policy in Table V – 10 and in Appendix B. The actuarial experience of each of
the plans is calculated based on the plans’ actual asset and liability values compared to the expected values.
Table IV-4
Expected Unfunded Actuarial Liability for the Plan Year Ending June 30, 2019
($ thousands)
Plan '10 Plan '16
Municipal Police Fire Municipal Elected Police Fire Municipal Municipal Total
1. Expected Unfunded Actuarial Liability
(UAL) as of July 1, 2018 Based on
July 1, 2017 Valuation* 2,621,458$ 1,351,790$ 577,217$ 625,584$ 14,283$ 327,008$ 93,363$ 397$ (207)$ 5,610,893$
2. Changes in UAL due to
a. Actuarial Experience 196,158$ 117,046$ 44,925$ 47,722$ (345)$ 34,014$ 13,875$ (221)$ (831)$ 452,343$
b. Assumption Changes 35,162 (1,266) (461) 104,670 520 (59,053) (19,959) 668 32 60,314
c. Active Plan Changes 0 0 0 0 0 0 0 0 0 0
d. Inactive Plan Changes 0 0 0 0 0 0 0 0 0 0
e. Subtotal 231,320$ 115,780$ 44,464$ 152,392$ 175$ (25,039)$ (6,084)$ 447$ (799)$ 512,657$
3. Actual UAL as of July 1, 2018 [1. + 2e.] 2,852,778$ 1,467,570$ 621,681$ 777,976$ 14,458$ 301,969$ 87,279$ 844$ (1,007)$ 6,123,548$
4. Expected Changes in UAL from July 1,
2018 to July 1, 2019 due to
a. Interest on Changes in UAL 17,580$ 8,799$ 3,379$ 11,582$ 13$ (1,903)$ (462)$ 34$ (61)$ 38,962$
b. FY 2019 Amortization Contribution (315,651) (166,654) (71,002) (33,776) (1,084) (17,324) (5,392) (10) 5 (610,888)
c. Subtotal (298,070)$ (157,855)$ (67,623)$ (22,194)$ (1,071)$ (19,227)$ (5,854)$ 24$ (56)$ (571,926)$
5. Expected UAL as of July 1, 2019 [3. + 4c.] 2,554,708$ 1,309,715$ 554,058$ 755,782$ 13,387$ 282,742$ 81,425$ 868$ (1,063)$ 5,551,622$
* Expected UAL is based upon the City's funding policy
Note: Numbers may not add due to rounding.
1987 Plan 1967 Plan

CITY OF PHILADELPHIA MUNICIPAL RETIREMENT SYSTEM
JULY 1, 2018 ACTUARIAL VALUATION
SECTION V – CONTRIBUTIONS AND MINIMUM MUNICIPAL OBLIGATION
50
In the process of evaluating the financial condition of any pension system, the actuary analyzes
the assets and liabilities to determine what level (if any) of contributions are needed based on the
funding methods either required by law or adopted by the plan sponsor. For an actuarial funding
method to be effective, it should result in a pattern of contributions that are both stable and
predictable as well as systematically fund the plan obligations.
The actuarial funding method used to determine the normal cost and the unfunded actuarial
liability is the Entry Age Normal (EAN) cost method. The normal cost is based on taking the
value, as of entry age into the plan, of each member’s projected future benefits. This value is
then divided by the value, also at entry age, of each member’s expected future salary producing a
normal cost rate as a percent of salary that should remain relatively constant over a participant’s
career. The normal cost rate is multiplied by current salary to determine each member’s normal
cost which is then all summed to get the total normal cost for all members. Finally, the total
normal cost is reduced by the member contribution to produce the employer normal cost. The
normal cost also includes an explicit administrative expense assumption to account for
anticipated administrative expenses. The unfunded actuarial liability is the difference between
the EAN actuarial liability and the actuarial value of assets.
Within this section of the report, three contribution amounts are determined based on three
different sets of funding policies for determining the way the unfunded actuarial liability is
funded. The first policy is defined in accordance with Act 205 and defines the Minimum
Municipal Obligation (MMO), which is the City’s minimum required contribution under
Pennsylvania State law. The second approach is the Revenue Recognition Policy (RRP), which
is similar to the MMO calculations except the assets used for determining the contributions
exclude the accumulated value of sales tax revenue and tier and additional member contributions
received by the System. The third approach is in accordance with the City’s Funding Policy
implemented in 1984, which predates the Act 205 rules and calls for contributions that are
greater than the MMO until the initial unfunded liability determined in 1984 is fully funded.
Under all funding methods there are two components: the normal cost and the amortized
unfunded actuarial liability. The amortized unfunded actuarial liability is the amount of the
unfunded actuarial liability that is paid each year based upon the given or defined amortization
periods. The amortization periods are different under the MMO/RRP and the City’s Funding
Policy. These amortization periods are outlined in more detail in Appendix C, Section B.
As of July 1, 2010, gains and losses are recognized annually to determine the amortization base
used to calculate the MMO, as opposed to biennially. This change is implemented in accordance
with section 1002 of Act 205 and has been continued since then to provide greater transparency
in the determination of the period and amount of such amounts.
In addition, the MMO, excluding the Pension Obligation Bond (POB), is also provided in this
section, as required for reporting purposes under Act 205.

CITY OF PHILADELPHIA MUNICIPAL RETIREMENT SYSTEM
JULY 1, 2018 ACTUARIAL VALUATION
SECTION V – CONTRIBUTIONS AND MINIMUM MUNICIPAL OBLIGATION
51
In Table V-1 we provide the employee contribution rates as a percent of pay effective for the
plan year starting July 1, 2019. The rates shown include the 1% increase in contributions for certain
municipal employees and elected officials as required by legislation in 2015 as well as the additional
1% for new employees in these groups entering Plan 87 Municipal prime. This year we also included a
new rate for Plan 16 participants eligible for accelerated vesting. The rates shown for Police
Officers and Firefighters in Plan 87 and 87 Prime and Plan 10 include the increases effective
July 1, 2017 resulting from the Pension Award.
Table V-1 Table V-2a
Employee Contribution Rates Quasi Agency Funding Rate as a
for the Plan Year Beginning July 1, 2019 Percent of Payroll (Based on Funding Policy)
Municipal1
Elected2
Police Fire
Plan 67 7.00% N/A 6.00% 6.00%
Plan 87 3.49% 10.75% 6.84% 6.84%
Plan 87- 50% of Aggregate NC 3
4.15% N/A N/A N/A
Plan 87 - Accelerated Vesting
44.25% 12.78% N/A N/A
Plan 87 Prime 5 4.49% 11.75% 7.84% 7.84%
Plan '10 2.33% N/A 7.34% 7.34%
Plan '10 - Accelerated Vesting 2.75% N/A N/A N/A
Plan '16 6 4.04% N/A N/A N/A
Plan '16 - Accelerated Vesting 7 4.53% N/A N/A N/A
1 For Municipal Plan 67 members who participate in the Social Security System, employee contributions are 4.75% of
compensation up to the social security wage base and 7% above it. 2
The employee contribution rate is based upon the normal cost of $532,080 under Plan 87 Elected, normal cost of
$300,735 under Plan 87 Municipal and current annual payroll of $3,298,255.3
This represents 50% of Aggregate Normal Cost for all members in Plan Y and applies to Deputy Sheriffs hired
between 1/1/2012 and 6/20/2018.4
Member rate for Municipal Plan 87 (Y5) members eligible to vest in 5 years and Elected Officials (L8) eligible to be
vested in 8 years instead of 10 years.5
Plan 87 Prime refers to new hires who have the option to elect Plan '10 but have elected to stay in Plan '87. New hires
after 7/1/2017 in Police and Fire Plan 87 Prime pay 8.50%6
Beginning January 1, 2019, all Municipal groups (except elected officials) will particpate in Plan '16. Because there
are no members in this group, the employee contribution rate is based on recent new hires and is phased in over 10
years beginning in 2018 with the employee contribution rate calculated for all Municipal members from Plan 87 valued
under Plan 16.7
Member rate for Municipal Plan 16 members eligible to vest in 7 years instead of 10 years.
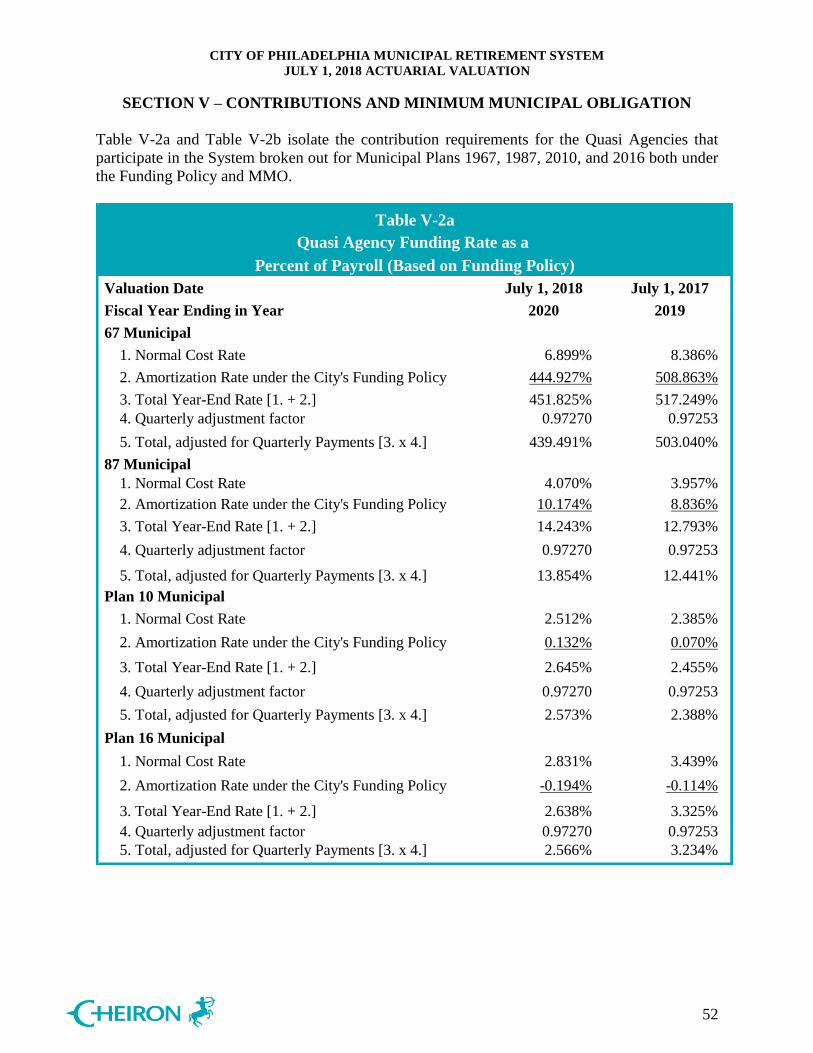
CITY OF PHILADELPHIA MUNICIPAL RETIREMENT SYSTEM
JULY 1, 2018 ACTUARIAL VALUATION
SECTION V – CONTRIBUTIONS AND MINIMUM MUNICIPAL OBLIGATION
52
Table V-2a and Table V-2b isolate the contribution requirements for the Quasi Agencies that
participate in the System broken out for Municipal Plans 1967, 1987, 2010, and 2016 both under
the Funding Policy and MMO.
Table V-2a Table V-2b
Quasi Agency Funding Rate as a Quasi Agency Funding Rate as a
Percent of Payroll (Based on Funding Policy) Percent of Payroll (Based on MMO)
Valuation Date July 1, 2018 July 1, 2017
Fiscal Year Ending in Year 2020 2019
67 Municipal
1. Normal Cost Rate 6.899% 8.386%
2. Amortization Rate under the City's Funding Policy 444.927% 508.863%
3. Total Year-End Rate [1. + 2.] 451.825% 517.249%
4. Quarterly adjustment factor 0.97270 0.97253
5. Total, adjusted for Quarterly Payments [3. x 4.] 439.491% 503.040%
87 Municipal
1. Normal Cost Rate 4.070% 3.957%
2. Amortization Rate under the City's Funding Policy 10.174% 8.836%
3. Total Year-End Rate [1. + 2.] 14.243% 12.793%
4. Quarterly adjustment factor 0.97270 0.97253
5. Total, adjusted for Quarterly Payments [3. x 4.] 13.854% 12.441%
Plan 10 Municipal
1. Normal Cost Rate 2.512% 2.385%
2. Amortization Rate under the City's Funding Policy 0.132% 0.070%
3. Total Year-End Rate [1. + 2.] 2.645% 2.455%
4. Quarterly adjustment factor 0.97270 0.97253
5. Total, adjusted for Quarterly Payments [3. x 4.] 2.573% 2.388%
Plan 16 Municipal
1. Normal Cost Rate 2.831% 3.439%
2. Amortization Rate under the City's Funding Policy -0.194% -0.114%
3. Total Year-End Rate [1. + 2.] 2.638% 3.325%
4. Quarterly adjustment factor 0.97270 0.97253
5. Total, adjusted for Quarterly Payments [3. x 4.] 2.566% 3.234%

CITY OF PHILADELPHIA MUNICIPAL RETIREMENT SYSTEM
JULY 1, 2018 ACTUARIAL VALUATION
SECTION V – CONTRIBUTIONS AND MINIMUM MUNICIPAL OBLIGATION
53
Table V-2b Table V-3a
Quasi Agency Funding Rate as a Development of the Minimum Municipal Obligation for Fiscal Year End 2020
Percent of Payroll (Based on MMO) ($ thousands)
Valuation Date July 1, 2018 July 1, 2017
Fiscal Year Ending in Year 2020 2019
67 Municipal
1. Normal Cost Rate 6.899% 8.386%
2. Amortization Rate under MMO* 358.231% 294.232%
3. Total Year-End Rate [1. + 2.] 365.130% 302.619%
4. Quarterly adjustment factor 0.97270 0.97253
5. Total, adjusted for Quarterly Payments [3. x 4.] 355.162% 294.306%
87 Municipal
1. Normal Cost Rate 4.070% 3.957%
2. Amortization Rate under MMO* 8.899% 7.206%
3. Total Year-End Rate [1. + 2.] 12.969% 11.163%
4. Quarterly adjustment factor 0.97270 0.97253
5. Total, adjusted for Quarterly Payments [3. x 4.] 12.615% 10.856%
Plan 10 Municipal
1. Normal Cost Rate 2.512% 2.385%
2. Amortization Rate under MMO* 0.118% 0.068%
3. Total Year-End Rate [1. + 2.] 2.631% 2.453%
4. Quarterly adjustment factor 0.97270 0.97253
5. Total, adjusted for Quarterly Payments [3. x 4.] 2.559% 2.386%
Plan 16 Municipal
1. Normal Cost Rate 2.831% 3.439%
2. Amortization Rate under MMO* -0.195% -0.110%
3. Total Year-End Rate [1. + 2.] 2.636% 3.330%
4. Quarterly adjustment factor 0.97270 0.97253
5. Total, adjusted for Quarterly Payments [3. x 4.] 2.564% 3.238%
* The amortization amounts were derived based on the proportional share of the Unfunded Actuarial Liability.

CITY OF PHILADELPHIA MUNICIPAL RETIREMENT SYSTEM
JULY 1, 2018 ACTUARIAL VALUATION
SECTION V – CONTRIBUTIONS AND MINIMUM MUNICIPAL OBLIGATION
54
Table V-3a shows the development of the FYE 2020 Minimum Municipal Obligation (MMO)
and Table V-3b shows the Revenue Recognition Policy (RRP) for each division. Table V-4 on
the following page shows a schedule of amortization payments toward the MMO.
Table V-3a Table V-3b
Development of the Minimum Municipal Obligation for Fiscal Year End 2020 Development of the Revenue Recognition Policy for Fiscal Year End 2020
($ thousands) ($ thousands)
Non-Uniformed Police Fire Total
Estimated FY 2019-2020 Payroll 1,171,257$ 506,539$ 187,182$ 1,864,978$
Normal Cost % 7.744% 12.718% 13.164% 9.639%
Normal Cost 89,292$ 64,263$ 24,592$ 178,147$
Amortization Payment 355,703 167,395 68,141 591,238
Administrative Expenses 6,750 2,451 854 10,055
Subtotal 451,745$ 234,109$ 93,587$ 779,440$
Expected Employee Contributions* (54,401) (35,831) (13,457) (103,689)
Minimum Municipal Obligation 397,344$ 198,277$ 80,130$ 675,751$
* Includes additional expected member contributions from Police and Fire Plans 87 and Tier Contributions from Municipal Plans
Table V-3b
Development of the Revenue Recognition Policy for Fiscal Year End 2020
($ thousands)
Non-Uniformed Police Fire Total
Estimated FY 2019-2020 Payroll 1,171,257$ 506,539$ 187,182$ 1,864,978$
Normal Cost % 7.744% 12.718% 13.164% 9.639%
Normal Cost 89,292$ 64,263$ 24,592$ 178,147$
Amortization Payment 358,907 169,445 68,768 597,120
Administrative Expenses 6,750 2,451 854 10,055
Subtotal 454,949$ 236,159$ 94,214$ 785,322$
Expected Employee Contributions * (44,048) (26,634) (10,051) (80,734)
Revenue Recognition Policy 410,900$ 209,526$ 84,163$ 704,589$
* Does not include additional expected member contributions from Police and Fire Plans 87 and Tier Contributions from Municipal Plans
Note: Numbers may not add due to rounding.

CITY OF PHILADELPHIA MUNICIPAL RETIREMENT SYSTEM
JULY 1, 2018 ACTUARIAL VALUATION
SECTION V – CONTRIBUTIONS AND MINIMUM MUNICIPAL OBLIGATION
55
Type of Base 7/1/2018 Years FY 2020 7/1/2018 Years FY 2020 7/1/2018 Years FY 2020 7/1/2018 Years FY 2020
Balance Left Payment Balance Left Payment Balance Left Payment Balance Left Payment
Fresh Start Base
est. July 1, 2009 2,459,512$ 21 221,230$ 1,384,421$ 21 124,527$ 536,489$ 21 48,257$ 4,380,422$ 21 394,014$
Gain/Loss Base
est. July 1, 2010 (46,074)$ 12 (5,565)$ (32,853)$ 12 (3,968)$ (2,459)$ 12 (297)$ (81,386)$ 12 (9,830)$
Assumption Change
est. July 1, 2010 51,837$ 7 9,127$ 20,799$ 7 3,662$ 18,982$ 7 3,342$ 91,619$ 7 16,131$
Gain/Loss
est. July 1, 2011 (92,148)$ 13 (10,598)$ (18,672)$ 13 (2,148)$ (18,362)$ 13 (2,112)$ (129,182)$ 13 (14,857)$
Assumption Change
est. July 1, 2011 15,665$ 8 2,495$ 9,419$ 8 1,500$ 3,176$ 8 506$ 28,261$ 8 4,501$
Gain/Loss
est. July 1, 2012 129,437$ 14 14,254$ 68,459$ 14 7,539$ 17,729$ 14 1,952$ 215,624$ 14 23,745$
Assumption Change
est. July 1, 2012 44,517$ 9 6,513$ 25,433$ 9 3,721$ 8,887$ 9 1,300$ 78,837$ 9 11,534$
Gain/Loss
est. July 1, 2013 116,378$ 15 12,329$ 33,900$ 15 3,591$ (4,785)$ 15 (507)$ 145,493$ 15 15,414$
Assumption Change
est. July 1, 2013 62,061$ 10 8,441$ 37,215$ 10 5,062$ 12,413$ 10 1,688$ 111,689$ 10 15,191$
Gain/Loss
est. July 1, 2014 95,336$ 16 9,756$ 39,045$ 16 3,995$ 45,316$ 16 4,637$ 179,696$ 16 18,388$
Assumption Change
est. July 1, 2014 216,754$ 11 27,672$ (7,592)$ 11 (969)$ 8,717$ 11 1,113$ 217,880$ 11 27,816$
Gain/Loss
est. July 1, 2015 161,774$ 17 16,045$ 36,732$ 17 3,643$ 35,394$ 17 3,511$ 233,900$ 17 23,199$
Assumption Change
est. July 1, 2015 24,469$ 12 2,955$ 35,362$ 12 4,271$ 11,291$ 12 1,364$ 71,122$ 12 8,590$
Gain/Loss
est. July 1, 2016 112,375$ 18 10,836$ 74,281$ 18 7,163$ 20,666$ 18 1,993$ 207,322$ 18 19,992$
Assumption Change
est. July 1, 2016 26,288$ 13 3,023$ 15,680$ 13 1,803$ 5,198$ 13 598$ 47,166$ 13 5,425$
Gain/Loss
est. July 1, 2017 81,618$ 19 7,673$ 65,772$ 19 6,183$ 16,036$ 19 1,507$ 163,426$ 19 15,363$ Assumption Change
est. July 1, 2017 27,991$ 14 3,083$ 16,868$ 14 1,858$ 5,589$ 14 616$ 50,449$ 14 5,556$
Gain/Loss
est. July 1, 2018 16,204$ 20 1,489$ 25,589$ 20 2,351$ 9,102$ 20 836$ 50,896$ 20 4,675$
Assumption Change
est. July 1, 2018 141,052$ 15 14,943$ (60,319)$ 15 (6,390)$ (20,419)$ 15 (2,163)$ 60,314$ 15 6,390$
Total 3,645,050$ 355,703$ 1,769,539$ 167,395$ 708,959$ 68,141$ 6,123,548$ 591,238$
Note: Numbers may not add due to rounding.
Unfunded Liability Payments toward the MMO for Fiscal Year 2020
Table V-4
Municipal Police Fire Total
($ thousands)
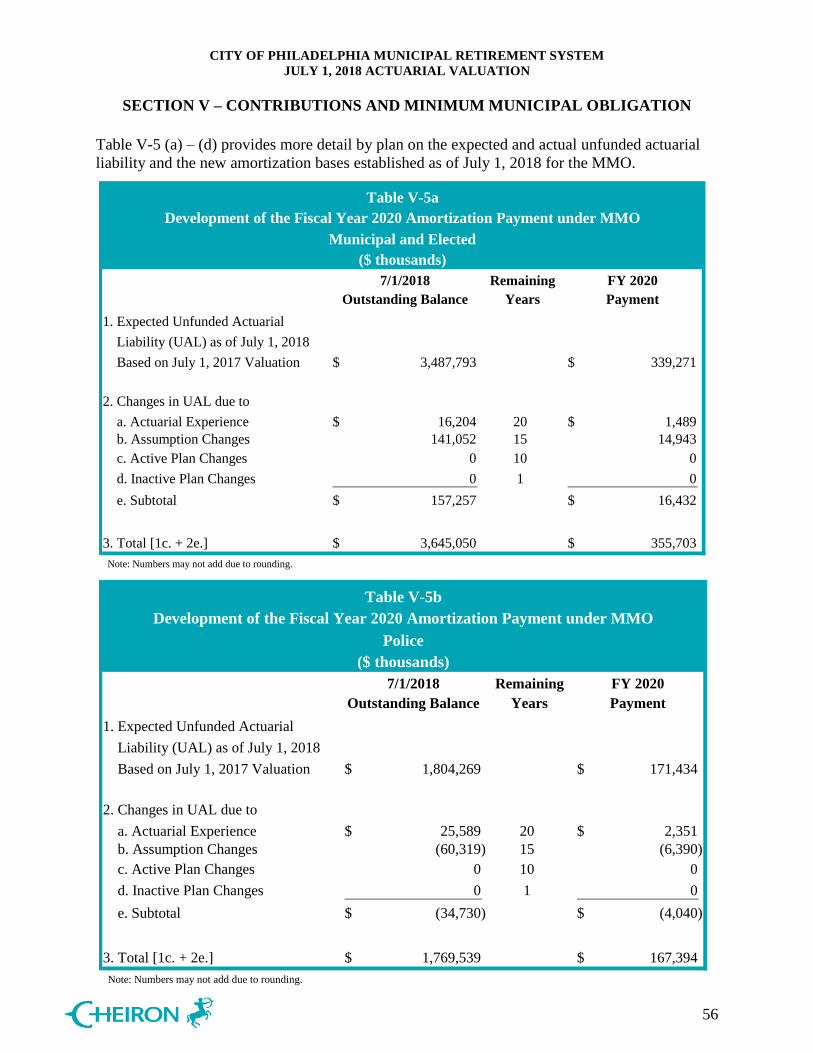
CITY OF PHILADELPHIA MUNICIPAL RETIREMENT SYSTEM
JULY 1, 2018 ACTUARIAL VALUATION
SECTION V – CONTRIBUTIONS AND MINIMUM MUNICIPAL OBLIGATION
56
Table V-5 (a) – (d) provides more detail by plan on the expected and actual unfunded actuarial
liability and the new amortization bases established as of July 1, 2018 for the MMO.
Table V-5a Table V-5b
Development of the Fiscal Year 2020 Amortization Payment under MMO Development of the Fiscal Year 2020 Amortization Payment under MMO
Municipal and Elected Police
($ thousands) ($ thousands)
7/1/2018 Remaining FY 2020
Outstanding Balance Years Payment
1. Expected Unfunded Actuarial
Liability (UAL) as of July 1, 2018
Based on July 1, 2017 Valuation 3,487,793$ 339,271$
2. Changes in UAL due to
a. Actuarial Experience 16,204$ 20 1,489$
b. Assumption Changes 141,052 15 14,943
c. Active Plan Changes 0 10 0
d. Inactive Plan Changes 0 1 0
e. Subtotal 157,257$ 16,432$
3. Total [1c. + 2e.] 3,645,050$ 355,703$
Note: Numbers may not add due to rounding.
Table V-5b Table V-5c
Development of the Fiscal Year 2020 Amortization Payment under MMO Development of the Fiscal Year 2020 Amortization Payment under MMO
Police Fire
($ thousands) ($ thousands)
7/1/2018 Remaining FY 2020
Outstanding Balance Years Payment
1. Expected Unfunded Actuarial
Liability (UAL) as of July 1, 2018
Based on July 1, 2017 Valuation 1,804,269$ 171,434$
2. Changes in UAL due to
a. Actuarial Experience 25,589$ 20 2,351$
b. Assumption Changes (60,319) 15 (6,390)
c. Active Plan Changes 0 10 0
d. Inactive Plan Changes 0 1 0
e. Subtotal (34,730)$ (4,040)$
3. Total [1c. + 2e.] 1,769,539$ 167,394$
Note: Numbers may not add due to rounding.
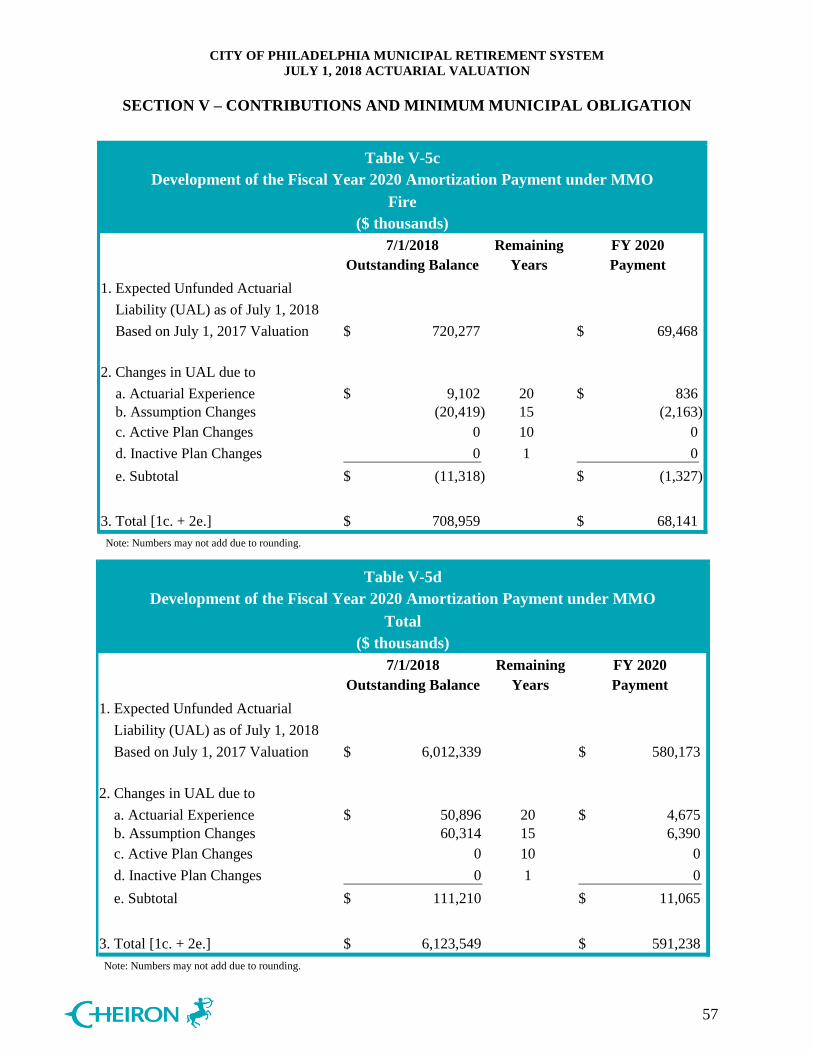
CITY OF PHILADELPHIA MUNICIPAL RETIREMENT SYSTEM
JULY 1, 2018 ACTUARIAL VALUATION
SECTION V – CONTRIBUTIONS AND MINIMUM MUNICIPAL OBLIGATION
57
Table V-5c Table V-5d
Development of the Fiscal Year 2020 Amortization Payment under MMO Development of the Fiscal Year 2020 Amortization Payment under MMO
Fire Total
($ thousands) ($ thousands)
7/1/2018 Remaining FY 2020
Outstanding Balance Years Payment
1. Expected Unfunded Actuarial
Liability (UAL) as of July 1, 2018
Based on July 1, 2017 Valuation 720,277$ 69,468$
2. Changes in UAL due to
a. Actuarial Experience 9,102$ 20 836$
b. Assumption Changes (20,419) 15 (2,163)
c. Active Plan Changes 0 10 0
d. Inactive Plan Changes 0 1 0
e. Subtotal (11,318)$ (1,327)$
3. Total [1c. + 2e.] 708,959$ 68,141$
Note: Numbers may not add due to rounding.
Table V-5d Table V-6
Development of the Fiscal Year 2020 Amortization Payment under MMO Summary of Modified Actuarial Data
Total ($ thousands)
($ thousands)
7/1/2018 Remaining FY 2020
Outstanding Balance Years Payment
1. Expected Unfunded Actuarial
Liability (UAL) as of July 1, 2018
Based on July 1, 2017 Valuation 6,012,339$ 580,173$
2. Changes in UAL due to
a. Actuarial Experience 50,896$ 20 4,675$
b. Assumption Changes 60,314 15 6,390
c. Active Plan Changes 0 10 0
d. Inactive Plan Changes 0 1 0
e. Subtotal 111,210$ 11,065$
3. Total [1c. + 2e.] 6,123,549$ 591,238$
Note: Numbers may not add due to rounding.

CITY OF PHILADELPHIA MUNICIPAL RETIREMENT SYSTEM
JULY 1, 2018 ACTUARIAL VALUATION
SECTION V – CONTRIBUTIONS AND MINIMUM MUNICIPAL OBLIGATION
58
The tables on the following pages support Exhibit I of the Act 205 filings.
Table V-6 is a summary of assets, liabilities, and amortization contributions under the
assumption that the Pension Obligation Bond (POB) was never contributed.
Table V-7 is a schedule of modified amortization payments under the assumption that the
proceeds from the POB were never contributed.
Table V-8a, V-8b, and V-8c are debt service schedules for the POB, allocated for the
Municipal, Police, and Fire divisions.
Tables V-9a and V-9b are statements of receipts and disbursements for each division
excluding and including bond issue assets, respectively, excluding the PAF.
Table V-6 Table V-7
Summary of Modified Actuarial Data Modified Unfunded Liability Payments toward the MMO for Fiscal Year 2020
($ thousands) ($ thousands)
Municipal Police Fire Total
Actuarial Liability 6,585,188$ 3,651,233$ 1,284,561$ 11,520,980$
Market Value of Assets (less POB) 2,669,064$ 1,782,192$ 471,687$ 4,922,943$
Actuarial Value of Assets (less POB) 2,566,305$ 1,672,081$ 464,077$ 4,702,463$
Unfunded Actuarial Liability (AL - AVA) 4,018,883$ 1,979,152$ 820,484$ 6,818,519$
Amortization Contributions
Total Amortization Amount 389,782$ 186,959$ 78,427$ 655,168$
Remaining Years 18 19 18 18
Note: Numbers may not add due to rounding.

CITY OF PHILADELPHIA MUNICIPAL RETIREMENT SYSTEM
JULY 1, 2018 ACTUARIAL VALUATION
SECTION V – CONTRIBUTIONS AND MINIMUM MUNICIPAL OBLIGATION
59
Table V-7 Table V-8a
Modified Unfunded Liability Payments toward the MMO for Fiscal Year 2020 TOTAL DEBT SERVICE REQUIREMENTS: MUNICIPAL
($ thousands)
Type of Base 7/1/2018 Remaining FY 2020 7/1/2018 Remaining FY 2020 7/1/2018 Remaining FY 2020 7/1/2018 Remaining FY 2020
Balance Years Payment Balance Years Payment Balance Years Payment Balance Years Payment
Fresh Start UAL Base
est. July 1, 2009 2,884,156$ 21 259,427$ 1,562,204$ 21 140,519$ 661,818$ 21 59,530$ 5,108,178$ 21 459,475$
July 1, 2010 Charges
Experience (Gain)/Loss (40,807)$ 12 (4,929)$ (28,545)$ 12 (3,448)$ 1,401$ 12 169$ (67,950)$ 12 (8,207)$
Assumption Change 51,837 7 9,127 20,799 7 3,662 18,982 7 3,342 91,619 7 16,131
July 1, 2011 Charges
Experience (Gain)/Loss (72,094)$ 13 (8,292)$ (7,267)$ 13 (836)$ (9,732)$ 13 (1,119)$ (89,094)$ 13 (10,247)$
Assumption Change 15,665$ 8 2,495$ 9,419$ 8 1,500$ 3,176$ 8 506$ 28,261$ 8 4,501$
July 1, 2012 Charges
Experience (Gain)/Loss 130,036$ 14 14,320$ 72,187$ 14 7,950$ 18,512$ 14 2,039$ 220,734$ 14 24,308$
Assumption Change 44,517$ 9 6,513$ 25,433$ 9 3,721$ 8,887$ 9 1,300$ 78,837$ 9 11,534$
July 1, 2013 Charges
Experience (Gain)/Loss 124,792$ 15 13,221$ 42,276$ 15 4,479$ (2,887)$ 15 (306)$ 164,181$ 15 17,393$
Assumption Change 62,061$ 10 8,441$ 37,215$ 10 5,062$ 12,413$ 10 1,688$ 111,689$ 10 15,191$
July 1, 2014 Charges
Experience (Gain)/Loss 95,831$ 16 9,806$ 43,673$ 16 4,469$ 44,829$ 16 4,587$ 184,334$ 16 18,862$
Assumption Change 216,754$ 11 27,672$ (7,592)$ 11 (969)$ 8,717$ 11 1,113$ 217,880$ 11 27,816$
July 1, 2015 Charges
Experience (Gain)/Loss 157,707$ 17 15,642$ 40,394$ 17 4,006$ 34,340$ 17 3,406$ 232,441$ 17 23,054$
Assumption Change 24,469$ 12 2,955$ 35,362$ 12 4,271$ 11,291$ 12 1,364$ 71,122$ 12 8,590$
July 1, 2016 Charges
Experience (Gain)/Loss 88,560$ 18 8,540$ 75,056$ 18 7,238$ 12,475$ 18 1,203$ 176,090$ 18 16,980$
Assumption Change 26,288$ 13 3,023$ 15,680$ 13 1,803$ 5,198$ 13 598$ 47,166$ 13 5,425$
July 1, 2018 Charges
Experience (Gain)/Loss 52,517$ 19 4,937$ 63,553$ 19 5,974$ 6,192$ 19 582$ 122,261$ 19 11,493$
Assumption Change 27,991$ 14 3,083$ 16,868$ 14 1,858$ 5,589$ 14 616$ 50,449$ 14 5,556$
July 1, 2018 Charges
Experience (Gain)/Loss (12,452)$ 20 (1,144)$ 22,756$ 20 2,090$ (297)$ 20 (27)$ 10,006$ 20 919$
Assumption Change 141,052$ 15 14,943$ (60,319)$ 15 (6,390)$ (20,419)$ 15 (2,163)$ 60,314$ 15 6,390$
Total 4,018,882$ 389,782$ 1,979,152$ 186,959$ 820,484$ 78,427$ 6,818,518$ 655,167$
Note: Numbers may not add due to rounding.
Police Total Fire Municipal

CITY OF PHILADELPHIA MUNICIPAL RETIREMENT SYSTEM
JULY 1, 2018 ACTUARIAL VALUATION
SECTION V – CONTRIBUTIONS AND MINIMUM MUNICIPAL OBLIGATION
60
Table V-8a Table V-8b
TOTAL DEBT SERVICE REQUIREMENTS: MUNICIPAL TOTAL DEBT SERVICE REQUIREMENTS: POLICE
Required Required Premium or Principal Balance
Plan Year Principal Payment Interest Payment Discount Amortized at Valuation Date
1999 0$ 7,041,525.30$ 0$ 727,185,593.15$
2000 9,917,857.50 29,825,175.27 0 717,267,735.65
2001 4,567,730.63 29,324,323.46 0 712,700,005.02
2002 0 29,087,715.02 0 712,700,005.02
2003 6,422,403.75 29,087,715.02 0 706,277,601.27
2004 8,884,981.88 28,728,336.25 0 697,392,619.39
2005 15,161,038.13 28,250,550.75 0 682,231,581.26
2006 18,743,737.50 27,403,048.72 0 663,487,843.76
2007 22,526,257.50 26,345,901.92 0 640,961,586.26
2008 26,486,083.13 25,064,157.87 0 614,475,503.13
2009 30,870,879.38 23,543,856.70 0 583,604,623.75
2010 40,000,711.88 21,756,432.78 0 543,603,911.87
2011 45,151,018.13 19,420,391.21 0 498,452,893.74
2012 22,154,721.72 45,234,066.39 0 476,298,172.02
2013 21,786,233.75 48,416,929.37 0 454,511,938.27
2014 20,545,516.84 50,378,126.28 0 433,966,421.43
2015 20,088,811.07 53,652,021.42 0 413,877,610.36
2016 19,364,886.72 56,464,212.02 0 394,512,723.64
2017 18,085,471.62 57,743,627.12 0 376,427,252.02
2018 16,915,332.51 58,913,766.23 0 359,511,919.51
2019 15,787,131.76 60,041,966.99 0 343,724,787.75
2020 14,758,165.41 61,070,933.33 0 328,966,622.34
2021 13,823,708.03 62,005,390.71 0 315,142,914.31
2022 12,919,375.38 62,909,723.36 0 302,223,538.93
2023 12,071,748.11 63,757,350.63 0 290,151,790.82
2024 11,250,110.80 64,578,987.94 0 278,901,680.02
2025 10,560,195.36 65,268,903.38 0 268,341,484.66
2026 17,271,090.90 58,558,007.84 0 251,070,393.76
2027 60,297,984.38 16,196,263.75 0 190,772,409.38
2028 64,125,534.38 12,367,341.75 0 126,646,875.00
2029 126,646,875.00 4,147,685.16 0 0
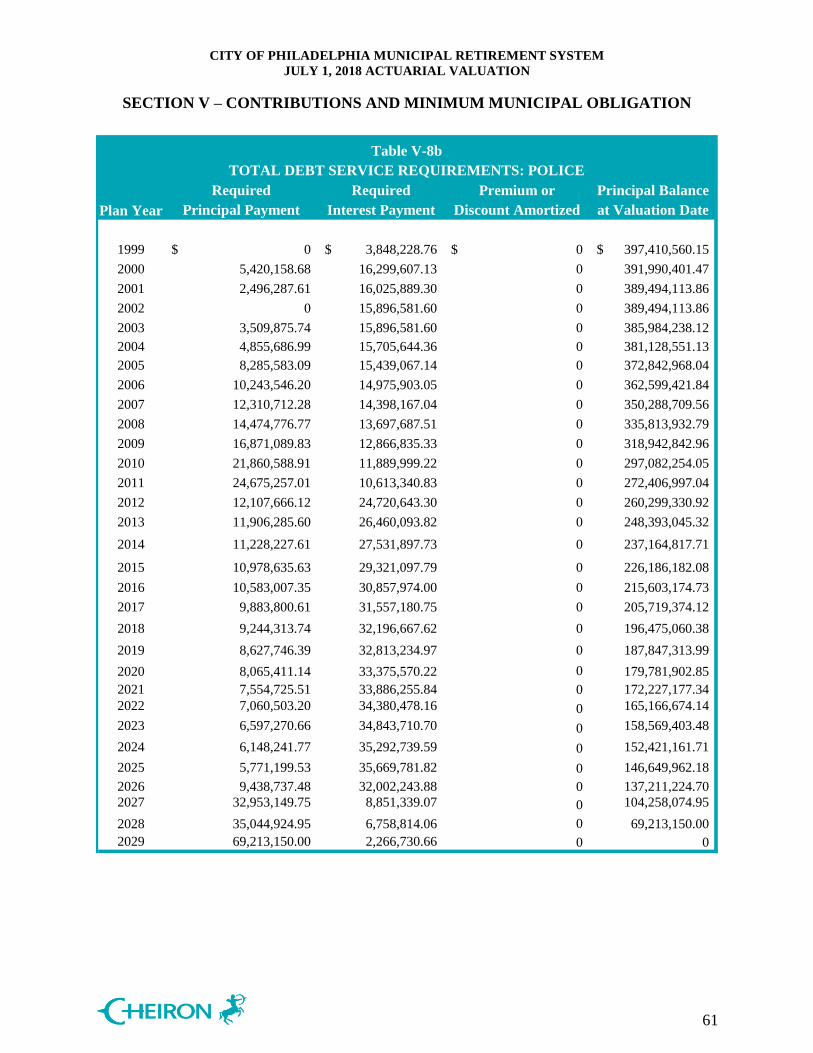
CITY OF PHILADELPHIA MUNICIPAL RETIREMENT SYSTEM
JULY 1, 2018 ACTUARIAL VALUATION
SECTION V – CONTRIBUTIONS AND MINIMUM MUNICIPAL OBLIGATION
61
Table V-8b Table V-8c
TOTAL DEBT SERVICE REQUIREMENTS: POLICE TOTAL DEBT SERVICE REQUIREMENTS: FIRE
Required Required Premium or Principal Balance
Plan Year Principal Payment Interest Payment Discount Amortized at Valuation Date
1999 0$ 3,848,228.76$ 0$ 397,410,560.15$
2000 5,420,158.68 16,299,607.13 0 391,990,401.47
2001 2,496,287.61 16,025,889.30 0 389,494,113.86
2002 0 15,896,581.60 0 389,494,113.86
2003 3,509,875.74 15,896,581.60 0 385,984,238.12
2004 4,855,686.99 15,705,644.36 0 381,128,551.13
2005 8,285,583.09 15,439,067.14 0 372,842,968.04
2006 10,243,546.20 14,975,903.05 0 362,599,421.84
2007 12,310,712.28 14,398,167.04 0 350,288,709.56
2008 14,474,776.77 13,697,687.51 0 335,813,932.79
2009 16,871,089.83 12,866,835.33 0 318,942,842.96
2010 21,860,588.91 11,889,999.22 0 297,082,254.05
2011 24,675,257.01 10,613,340.83 0 272,406,997.04
2012 12,107,666.12 24,720,643.30 0 260,299,330.92
2013 11,906,285.60 26,460,093.82 0 248,393,045.32
2014 11,228,227.61 27,531,897.73 0 237,164,817.71
2015 10,978,635.63 29,321,097.79 0 226,186,182.08
2016 10,583,007.35 30,857,974.00 0 215,603,174.73
2017 9,883,800.61 31,557,180.75 0 205,719,374.12
2018 9,244,313.74 32,196,667.62 0 196,475,060.38
2019 8,627,746.39 32,813,234.97 0 187,847,313.99
2020 8,065,411.14 33,375,570.22 0 179,781,902.85
2021 7,554,725.51 33,886,255.84 0 172,227,177.34
2022 7,060,503.20 34,380,478.16 0 165,166,674.14
2023 6,597,270.66 34,843,710.70 0 158,569,403.48
2024 6,148,241.77 35,292,739.59 0 152,421,161.71
2025 5,771,199.53 35,669,781.82 0 146,649,962.18
2026 9,438,737.48 32,002,243.88 0 137,211,224.70
2027 32,953,149.75 8,851,339.07 0 104,258,074.95
2028 35,044,924.95 6,758,814.06 0 69,213,150.00
2029 69,213,150.00 2,266,730.66 0 0

CITY OF PHILADELPHIA MUNICIPAL RETIREMENT SYSTEM
JULY 1, 2018 ACTUARIAL VALUATION
SECTION V – CONTRIBUTIONS AND MINIMUM MUNICIPAL OBLIGATION
62
Table V-8c Table V-9a
TOTAL DEBT SERVICE REQUIREMENTS: FIRE Receipts and Disbursements Excluding Bond Issue Assets
Required Required Premium or Principal Balance
Plan Year Principal Payment Interest Payment Discount Amortized at Valuation Date
1999 0$ 1,620,185.70$ 0$ 167,318,251.01$
2000 2,282,001.44 6,862,479.41 0 165,036,249.57
2001 1,050,989.88 6,747,238.34 0 163,985,259.69
2002 0 6,692,797.06 0 163,985,259.69
2003 1,477,731.92 6,692,797.06 0 162,507,527.77
2004 2,044,346.92 6,612,408.45 0 160,463,180.85
2005 3,488,405.72 6,500,173.80 0 156,974,775.13
2006 4,312,749.60 6,305,171.92 0 152,662,025.53
2007 5,183,070.24 6,061,932.84 0 147,478,955.29
2008 6,094,187.16 5,767,016.15 0 141,384,768.13
2009 7,103,085.64 5,417,209.80 0 134,281,682.49
2010 9,203,770.28 5,005,941.15 0 125,077,912.21
2011 10,388,805.08 4,468,440.96 0 114,689,107.13
2012 5,097,583.51 10,407,913.67 0 109,591,523.62
2013 5,012,798.05 11,140,259.13 0 104,578,725.57
2014 4,727,321.30 11,591,511.24 0 99,851,404.27
2015 4,622,237.80 12,344,802.31 0 95,229,166.47
2016 4,455,669.93 12,991,859.70 0 90,773,496.54
2017 4,161,289.10 13,286,240.52 0 86,612,207.44
2018 3,892,051.60 13,555,478.02 0 82,720,155.84
2019 3,632,463.70 13,815,065.92 0 79,087,692.14
2020 3,395,708.67 14,051,820.95 0 75,691,983.47
2021 3,180,699.22 14,266,830.40 0 72,511,284.25
2022 2,972,621.18 14,474,908.45 0 69,538,663.07
2023 2,777,590.48 14,669,939.14 0 66,761,072.59
2024 2,588,539.82 14,858,989.80 0 64,172,532.77
2025 2,429,797.06 15,017,732.56 0 61,742,735.71
2026 3,973,908.11 13,473,621.52 0 57,768,827.60
2027 13,873,973.00 3,726,600.95 0 43,894,854.60
2028 14,754,654.60 2,845,603.67 0 29,140,200.00
2029 29,140,200.00 954,341.55 0 0

CITY OF PHILADELPHIA MUNICIPAL RETIREMENT SYSTEM
JULY 1, 2018 ACTUARIAL VALUATION
SECTION V – CONTRIBUTIONS AND MINIMUM MUNICIPAL OBLIGATION
63
Table V- 9a provides the receipts and disbursements of assets excluding the Bond issue assets
and excluding the PAF.
Table V-9a Table V-9b
Receipts and Disbursements Excluding Bond Issue Assets Receipts and Disbursements Including Bond Issue Assets
Municipal Police Fire Total
Assets as of July 1, 2017 2,401,441,680$ 1,607,509,041$ 410,938,367$ 4,419,889,088$
Receipts
Employer Contributions 456,372,098$ 225,622,309$ 100,391,343$ 782,385,750$
Employee Contributions 42,297,743 31,152,452 9,838,440 83,288,635
State Aid 40,882,658 22,561,596 9,003,408 72,447,662
Supplemental State Assistance 0 0 0 0
Investment Income
(includes investment expenses) 218,676,927 146,565,892 38,044,487 403,287,306
Other Receipts 0 0 0 0
Total Receipts 758,229,426$ 425,902,248$ 157,277,678$ 1,341,409,352$
Disbursements
Benefit Payments 478,330,856$ 246,258,126$ 95,143,542$ 819,732,524$
Refund of Contributions 5,480,790 2,498,375 519,749 8,498,914
Administrative Expenses 6,795,071 2,462,484 865,449 10,123,004
PAF Transfer at Year End 0 0 0 0
Other Disbursements 0 0 0 0
Total Disbursements 490,606,717$ 251,218,985$ 96,528,740$ 838,354,442$
Assets as of July 1, 2018 2,669,064,389$ 1,782,192,304$ 471,687,306$ 4,922,943,998$
Note: Numbers may not add due to rounding.
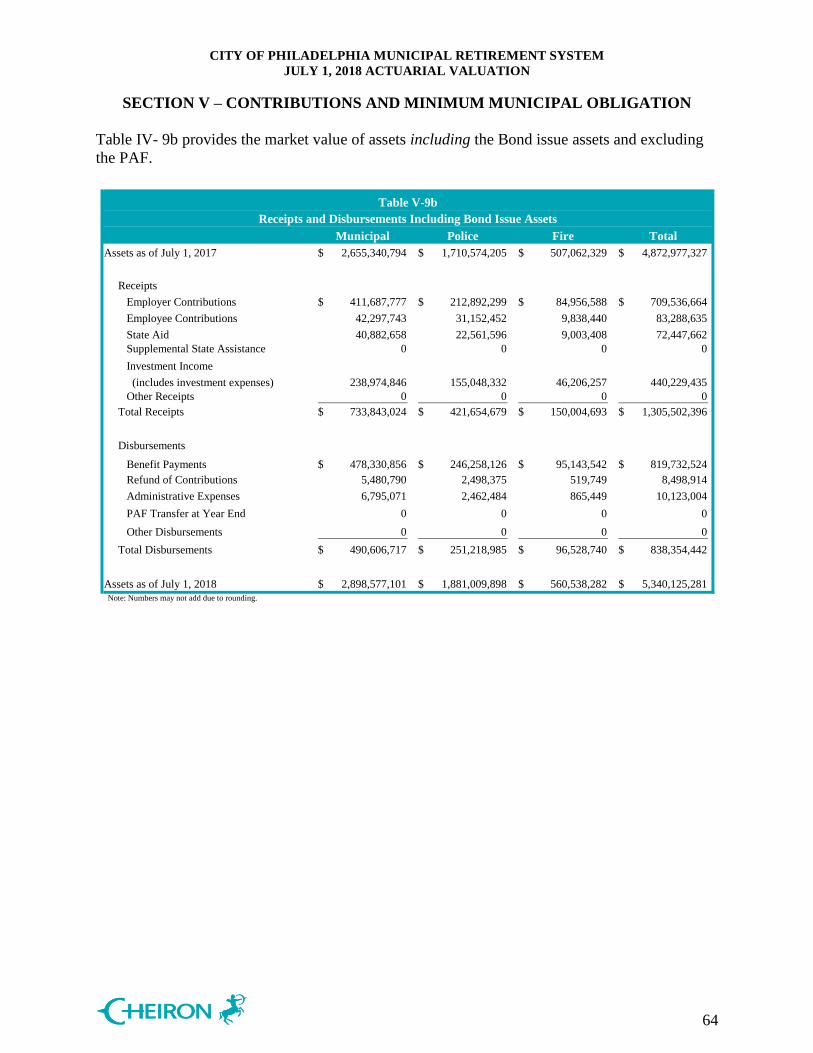
CITY OF PHILADELPHIA MUNICIPAL RETIREMENT SYSTEM
JULY 1, 2018 ACTUARIAL VALUATION
SECTION V – CONTRIBUTIONS AND MINIMUM MUNICIPAL OBLIGATION
64
Table IV- 9b provides the market value of assets including the Bond issue assets and excluding
the PAF.
Table V-9b Table V-10
Receipts and Disbursements Including Bond Issue Assets Development of the Fiscal Year 2020 Amortization Payment under the City's Funding Policy
Municipal Police Fire Total Total
Assets as of July 1, 2017 2,655,340,794$ 1,710,574,205$ 507,062,329$ 4,872,977,327$ ($ thousands)
Receipts
Employer Contributions 411,687,777$ 212,892,299$ 84,956,588$ 709,536,664$
Employee Contributions 42,297,743 31,152,452 9,838,440 83,288,635
State Aid 40,882,658 22,561,596 9,003,408 72,447,662
Supplemental State Assistance 0 0 0 0
Investment Income
(includes investment expenses) 238,974,846 155,048,332 46,206,257 440,229,435
Other Receipts 0 0 0 0
Total Receipts 733,843,024$ 421,654,679$ 150,004,693$ 1,305,502,396$
Disbursements
Benefit Payments 478,330,856$ 246,258,126$ 95,143,542$ 819,732,524$
Refund of Contributions 5,480,790 2,498,375 519,749 8,498,914
Administrative Expenses 6,795,071 2,462,484 865,449 10,123,004
PAF Transfer at Year End 0 0 0 0
Other Disbursements 0 0 0 0
Total Disbursements 490,606,717$ 251,218,985$ 96,528,740$ 838,354,442$
Assets as of July 1, 2018 2,898,577,101$ 1,881,009,898$ 560,538,282$ 5,340,125,281$
Note: Numbers may not add due to rounding.

CITY OF PHILADELPHIA MUNICIPAL RETIREMENT SYSTEM
JULY 1, 2018 ACTUARIAL VALUATION
SECTION V – CONTRIBUTIONS AND MINIMUM MUNICIPAL OBLIGATION
65
Table V – 10 and Table V – 11 provide information on the City’s Funding Policy for FYE 2018
and FYE 2019. The differences between the MMO and the City’s Funding Policy are:
The City’s Funding Policy amortizes the initial July 1, 1985 unfunded actuarial liability over
34 years. Chapter 10 under Act 44 allowed for the amortization of the entire unfunded
actuarial liability as of July 1, 2009 to be “fresh started” over a 30-year period for MMO
purposes.
The normal cost portion of the City’s Funding Policy payment is based on actual fiscal year
payroll, whereas the MMO is based on the prior year’s estimated payroll for that year.
Interest does not accumulate on the MMO, as long as the payment is made by the end of
the fiscal year. This has the impact of creating systematic losses each year which get offset
by assumed interest on contributions received before year-end.
Both the City’s Funding Policy and the MMO utilize valuation results developed in the
previous year (e.g., the July 1, 2018 valuation report will determine FYE 2020 contribution
amounts). However, no interest is added to the MMO for this delay.
The MMO reflects amortization of prior years’ City contributions above past MMOs as
actuarial gains.
Starting with FYE 2007-2008, the MMO recognized actuarial gains and losses every other year,
in order to coincide with the filing of the Act 205 forms. Beginning for FYE 2012, gains and
losses are recognized annually. The City’s Funding Policy recognizes actuarial gains and losses
on an annual basis.
Table V – 10 develops the amortized amounts for the current year under the City’s Funding
Policy. For additional details on the amortized amounts by plan, refer to Appendix B.
Table V – 11 provides the estimated FYE 2020 and updated FYE 2019 contribution amount
under the City’s Funding Policy. The estimated FYE 2020 contribution will be updated in next
year’s actuarial valuation report based upon the July 1, 2019 payroll.

CITY OF PHILADELPHIA MUNICIPAL RETIREMENT SYSTEM
JULY 1, 2018 ACTUARIAL VALUATION
SECTION V – CONTRIBUTIONS AND MINIMUM MUNICIPAL OBLIGATION
66
Table V-10
Development of the Fiscal Year 2020 Amortization Payment under the City's Funding Policy
Total
($ thousands)
7/1/2018 7/1/2019 Remaining FY 2020 Payment FY 2020 Payment
Outstanding Balance Expected Balance Years Beginning-of-Year End-of-Year
1. Expected Unfunded Actuarial
Liability (UAL) as of July 1, 2018
Based on July 1, 2017 Valuation
Remaining 5,610,891$ 5,000,003$ 668,724$ 719,547$
2. Changes in UAL due to
a. Actuarial Experience 452,343$ 486,721$ 20 44,709$ 48,107$
b. Assumption Changes 60,314 64,898 15 6,875 7,398
c. Active Plan Changes 0 0 10 0 0
d. Inactive Plan Changes 0 0 1 0 0
e. Subtotal 512,657$ 551,619$ 51,585$ 55,505$
3. Total [1c. + 2e.] 6,123,548$ 5,551,622$ 720,309$ 775,053$
Fiscal Year 2020 % of Pay 2019 % of Pay
Estimated FY Payroll 1,864,978$ 1,805,400$ **
Normal Cost (with Expenses) 188,203$ 10.09% 169,190$ 9.37%
Employee Contributions (103,689) 5.56% (82,189) 4.55%
City Normal Cost 84,513$ 4.53% 87,001$ 4.82%
Amortization Payment 720,309 38.62% 965,480 53.48%
City's Funding Policy 804,822$ 43.15% 1,052,481$ 58.30%
* Assuming beginning-of-year payment.
** FY 2018 Payroll for the City's Funding Policy is the final payroll for the prior year. All other payroll is
estimated based upon the prior year's data used for the actuarial valuation.
Table V-11
City's Funding Policy Contributions*

CITY OF PHILADELPHIA MUNICIPAL RETIREMENT SYSTEM
JULY 1, 2018 ACTUARIAL VALUATION
APPENDIX A – MEMBERSHIP INFORMATION
67
The data for this valuation was provided by the Board of Pensions as of July 1, 2018. Cheiron
did not audit any of the data. However, we did perform an informal examination of the obvious
characteristics of the data for reasonableness and consistency in accordance with Actuarial
Standard of Practice No. 23. The following is a list of data charts contained in this section:
A-1: Active Member Data by Plan
A-2: Non-Active Member Data, Counts, by Plan
A-3: Non-Active Member Data, Total Annual Benefits, by Plan
A-4: Non-Active Member Data, Average Annual Benefits, by Plan
A-5 through A-24: Age/Service Distribution for Active Participants, Counts and Average
Salary for all Plans
A-25: Reconciliation of Plan Membership
A-26 through A-30: Age and Benefit Distributions for Non-Active Member Data
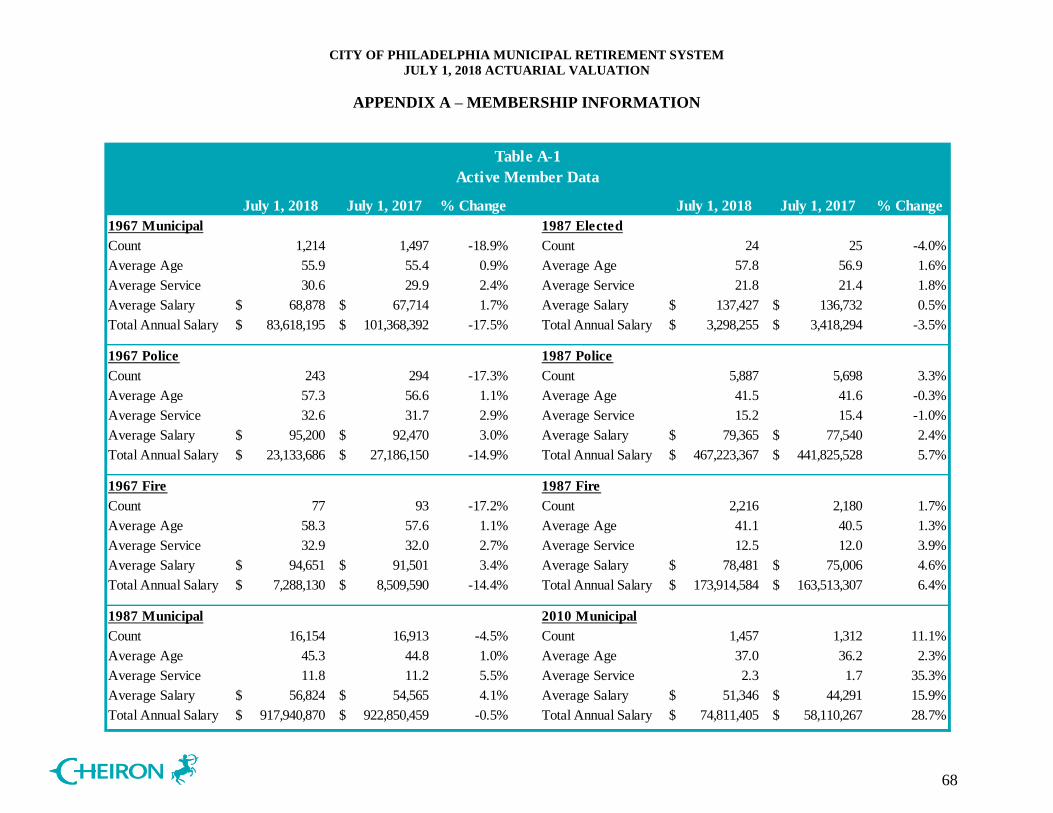
CITY OF PHILADELPHIA MUNICIPAL RETIREMENT SYSTEM
JULY 1, 2018 ACTUARIAL VALUATION
APPENDIX A – MEMBERSHIP INFORMATION
68
Table A-1
July 1, 2018 July 1, 2017 % Change July 1, 2018 July 1, 2017 % Change
1967 Municipal 1987 Elected
Count 1,214 1,497 -18.9% Count 24 25 -4.0%
Average Age 55.9 55.4 0.9% Average Age 57.8 56.9 1.6%
Average Service 30.6 29.9 2.4% Average Service 21.8 21.4 1.8%
Average Salary 68,878$ 67,714$ 1.7% Average Salary 137,427$ 136,732$ 0.5%
Total Annual Salary 83,618,195$ 101,368,392$ -17.5% Total Annual Salary 3,298,255$ 3,418,294$ -3.5%
1967 Police 1987 Police
Count 243 294 -17.3% Count 5,887 5,698 3.3%
Average Age 57.3 56.6 1.1% Average Age 41.5 41.6 -0.3%
Average Service 32.6 31.7 2.9% Average Service 15.2 15.4 -1.0%
Average Salary 95,200$ 92,470$ 3.0% Average Salary 79,365$ 77,540$ 2.4%
Total Annual Salary 23,133,686$ 27,186,150$ -14.9% Total Annual Salary 467,223,367$ 441,825,528$ 5.7%
1967 Fire 1987 Fire
Count 77 93 -17.2% Count 2,216 2,180 1.7%
Average Age 58.3 57.6 1.1% Average Age 41.1 40.5 1.3%
Average Service 32.9 32.0 2.7% Average Service 12.5 12.0 3.9%
Average Salary 94,651$ 91,501$ 3.4% Average Salary 78,481$ 75,006$ 4.6%
Total Annual Salary 7,288,130$ 8,509,590$ -14.4% Total Annual Salary 173,914,584$ 163,513,307$ 6.4%
1987 Municipal 2010 Municipal
Count 16,154 16,913 -4.5% Count 1,457 1,312 11.1%
Average Age 45.3 44.8 1.0% Average Age 37.0 36.2 2.3%
Average Service 11.8 11.2 5.5% Average Service 2.3 1.7 35.3%
Average Salary 56,824$ 54,565$ 4.1% Average Salary 51,346$ 44,291$ 15.9%
Total Annual Salary 917,940,870$ 922,850,459$ -0.5% Total Annual Salary 74,811,405$ 58,110,267$ 28.7%
Active Member Data
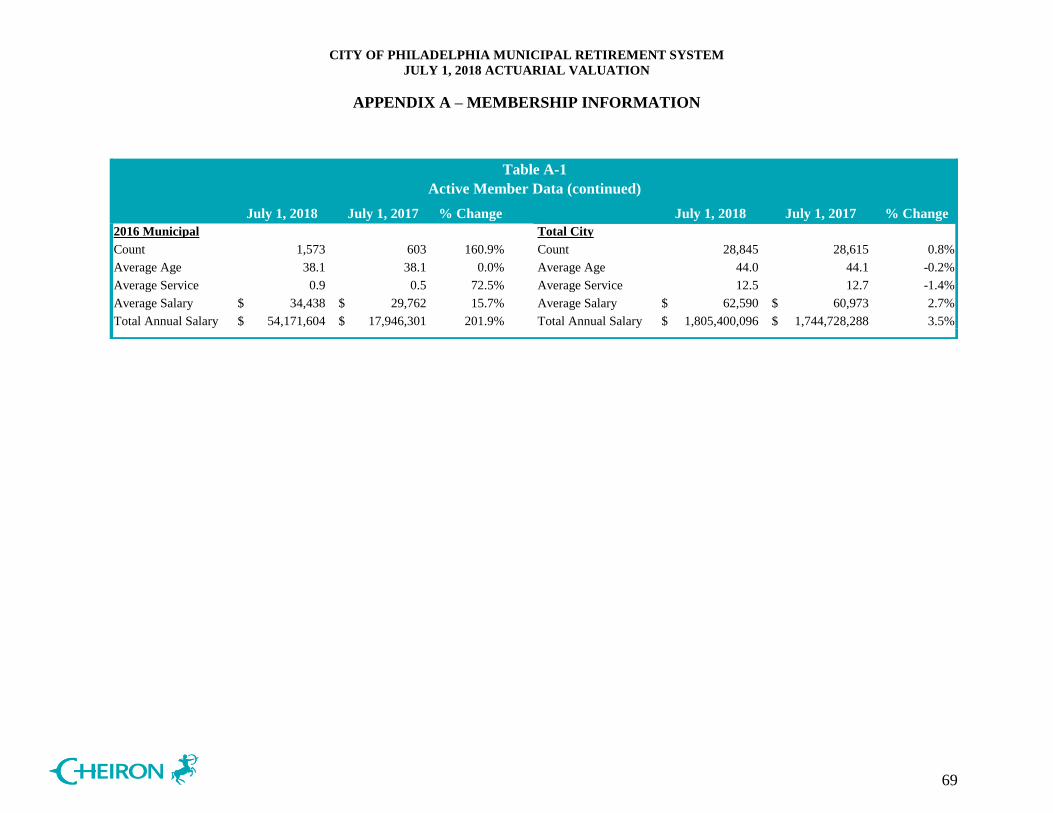
CITY OF PHILADELPHIA MUNICIPAL RETIREMENT SYSTEM
JULY 1, 2018 ACTUARIAL VALUATION
APPENDIX A – MEMBERSHIP INFORMATION
69
July 1, 2018 July 1, 2017 % Change July 1, 2018 July 1, 2017 % Change
2016 Municipal Total City
Count 1,573 603 160.9% Count 28,845 28,615 0.8%
Average Age 38.1 38.1 0.0% Average Age 44.0 44.1 -0.2%
Average Service 0.9 0.5 72.5% Average Service 12.5 12.7 -1.4%
Average Salary 34,438$ 29,762$ 15.7% Average Salary 62,590$ 60,973$ 2.7%
Total Annual Salary 54,171,604$ 17,946,301$ 201.9% Total Annual Salary 1,805,400,096$ 1,744,728,288$ 3.5%
Table A-1
Active Member Data (continued)

CITY OF PHILADELPHIA MUNICIPAL RETIREMENT SYSTEM
JULY 1, 2018 ACTUARIAL VALUATION
APPENDIX A – MEMBERSHIP INFORMATION
70
Table A-2
Non-Active Member Data
Count
July 1, 2018 July 1, 2017 % Change July 1, 2018 July 1, 2017 % Change
Total City 1987 Municipal Plan
Retired 22,275 22,288 -0.1% Retired 2,585 2,293 12.7%
Disabled 3,890 3,942 -1.3% Disabled 528 488 8.2%
Beneficiary 8,547 8,552 -0.1% Beneficiary 458 419 9.3%
In Pay Status Total 34,712 34,782 -0.2% In Pay Status Total 3,571 3,200 11.6%
DROP 1,944 1,767 10.0% DROP 669 532 25.8%
Deferred Vested 1,074 1,157 -7.2% Deferred Vested 752 781 -3.7%
1967 Municipal Plan 1987 Elected Plan
Retired 12,134 12,367 -1.9% Retired 19 19 0.0%
Disabled 1,345 1,401 -4.0% Disabled 0 0 0.0%
Beneficiary 4,788 4,837 -1.0% Beneficiary 4 4 0.0%
In Pay Status Total 18,267 18,605 -1.8% In Pay Status Total 23 23 0.0%
DROP 758 761 -0.4% DROP 1 1 0.0%
Deferred Vested 227 265 -14.3% Deferred Vested 0 0 0.0%
1967 Police Plan 1987 Police Plan
Retired 5,034 5,150 -2.3% Retired 473 398 18.8%
Disabled 1,201 1,258 -4.5% Disabled 461 431 7.0%
Beneficiary 2,291 2,290 0.0% Beneficiary 164 152 7.9%
In Pay Status Total 8,526 8,698 -2.0% In Pay Status Total 1,098 981 11.9%
DROP 172 185 -7.0% DROP 219 180 21.7%
Deferred Vested 1 1 0.0% Deferred Vested 82 96 -14.6%
1967 Fire Plan 1987 Fire Plan
Retired 1,870 1,912 -2.2% Retired 160 149 7.4%
Disabled 275 288 -4.5% Disabled 80 76 5.3%
Beneficiary 774 789 -1.9% Beneficiary 68 61 11.5%
In Pay Status Total 2,919 2,989 -2.3% In Pay Status Total 308 286 7.7%
DROP 64 60 6.7% DROP 61 48 27.1%
Deferred Vested 0 0 0.0% Deferred Vested 12 14 -14.3%

CITY OF PHILADELPHIA MUNICIPAL RETIREMENT SYSTEM
JULY 1, 2018 ACTUARIAL VALUATION
APPENDIX A – MEMBERSHIP INFORMATION
71
Table A-3 Table A-4
Non-Active Member Data Non-Active Member Data
Total Annual Benefit Average Annual Benefit
July 1, 2018 July 1, 2017 % Change July 1, 2018 July 1, 2017 % Change
Total City 1987 Municipal Plan
Retired 592,834,017$ 583,810,766$ 1.5% Retired 36,207,868$ 30,931,382$ 17.1%
Disabled 86,537,158 85,745,773 0.9% Disabled 10,094,621 9,183,040 9.9%
Beneficiary 82,575,399 80,647,990 2.4% Beneficiary 3,708,401 3,299,584 12.4%
In Pay Status Total 761,946,574$ 750,204,529$ 1.6% In Pay Status Total 50,010,890$ 43,414,006$ 15.2%
DROP (pension) 73,818,616$ 65,134,550$ 13.3% DROP (pension) 12,531,856$ 9,304,348$ 34.7%
DROP (account balance) 135,355,386 121,206,906 11.7% DROP (account balance) 19,351,949 14,749,860 31.2%
Deferred Vested 15,009,883$ 16,192,404$ -7.3% Deferred Vested 9,979,581$ 10,251,830$ -2.7%
1967 Municipal Plan 1987 Elected Plan
Retired 320,623,599$ 318,569,625$ 0.6% Retired 1,465,458$ 1,438,184$ 1.9%
Disabled 25,968,955 26,760,190 -3.0% Disabled 0 0 0.0%
Beneficiary 42,749,179 42,053,622 1.7% Beneficiary 118,681 118,681 0.0%
In Pay Status Total 389,341,733$ 387,383,437$ 0.5% In Pay Status Total 1,584,139$ 1,556,865$ 1.8%
DROP (pension) 34,775,116$ 32,883,171$ 5.8% DROP (pension) 123,864$ 123,864$ 0.0%
DROP (account balance) 66,982,573 61,113,537 9.6% DROP (account balance) 229,440 104,203 120.2%
Deferred Vested 3,514,551$ 4,130,746$ -14.9% Deferred Vested 0$ 0$ 0.0%
1967 Police Plan 1987 Police Plan
Retired 150,900,151$ 151,005,013$ -0.1% Retired 12,493,408$ 10,010,578$ 24.8%
Disabled 23,323,793 24,192,415 -3.6% Disabled 18,419,429 16,889,302 9.1%
Beneficiary 23,202,009 22,813,021 1.7% Beneficiary 2,305,333 2,052,179 12.3%
In Pay Status Total 197,425,953$ 198,010,449$ -0.3% In Pay Status Total 33,218,170$ 28,952,059$ 14.7%
DROP (pension) 11,221,305$ 11,024,522$ 1.8% DROP (pension) 8,608,618$ 6,530,256$ 31.8%
DROP (account balance) 21,423,807 23,371,785 -8.3% DROP (account balance) 14,003,888 11,502,400 21.7%
Deferred Vested 13,436$ 13,436$ 0.0% Deferred Vested 1,311,234$ 1,559,797$ -15.9%
1967 Fire Plan 1987 Fire Plan
Retired 67,256,132$ 68,348,211$ -1.6% Retired 3,887,401$ 3,507,773$ 10.8%
Disabled 5,534,778 5,825,027 -5.0% Disabled 3,195,582 2,895,799 10.4%
Beneficiary 9,574,914 9,535,456 0.4% Beneficiary 916,882 775,447 18.2%
In Pay Status Total 82,365,824$ 83,708,694$ -1.6% In Pay Status Total 7,999,865$ 7,179,019$ 11.4%
DROP (pension) 4,264,257$ 3,692,244$ 15.5% DROP (pension) 2,293,600$ 1,576,145$ 45.5%
DROP (account balance) 9,370,441 7,737,467 21.1% DROP (account balance) 3,993,287 2,627,653 52.0%
Deferred Vested 0$ 0$ 0.0% Deferred Vested 191,081$ 236,595$ -19.2%

CITY OF PHILADELPHIA MUNICIPAL RETIREMENT SYSTEM
JULY 1, 2018 ACTUARIAL VALUATION
APPENDIX A – MEMBERSHIP INFORMATION
72
Table A-4
Non-Active Member Data
Average Annual Benefit
July 1, 2018 July 1, 2017 % Change July 1, 2018 July 1, 2017 % Change
Total City 1987 Municipal Plan
Retired 26,614$ 26,194$ 1.6% Retired 14,007$ 13,489$ 3.8%
Disabled 22,246 21,752 2.3% Disabled 19,119 18,818 1.6%
Beneficiary 9,661 9,430 2.4% Beneficiary 8,097 7,875 2.8%
In Pay Status Total 21,951$ 21,569$ 1.8% In Pay Status Total 14,005$ 13,567$ 3.2%
DROP (pension) 37,973$ 36,862$ 3.0% DROP (pension) 18,732$ 17,489$ 7.1%
DROP (account balance) 69,627 68,595 1.5% DROP (account balance) 28,927 27,725 4.3%
Deferred Vested 13,976$ 13,995$ -0.1% Deferred Vested 13,271$ 13,127$ 1.1%
1967 Municipal Plan 1987 Elected Plan
Retired 26,424$ 25,760$ 2.6% Retired 77,129$ 75,694$ 1.9%
Disabled 19,308 19,101 1.1% Disabled 0 0 0.0%
Beneficiary 8,928 8,694 2.7% Beneficiary 29,670 29,670 0.0%
In Pay Status Total 21,314$ 20,821$ 2.4% In Pay Status Total 68,876$ 67,690$ 1.8%
DROP (pension) 45,877$ 43,210$ 6.2% DROP (pension) 123,864$ 123,864$ 0.0%
DROP (account balance) 88,368 80,307 10.0% DROP (account balance) 229,440 104,203 120.2%
Deferred Vested 15,483$ 15,588$ -0.7% Deferred Vested 0$ 0$ 0.0%
1967 Police Plan 1987 Police Plan
Retired 29,976$ 29,321$ 2.2% Retired 26,413$ 25,152$ 5.0%
Disabled 19,420 19,231 1.0% Disabled 39,955 39,186 2.0%
Beneficiary 10,127 9,962 1.7% Beneficiary 14,057 13,501 4.1%
In Pay Status Total 23,156$ 22,765$ 1.7% In Pay Status Total 30,253$ 29,513$ 2.5%
DROP (pension) 65,240$ 59,592$ 9.5% DROP (pension) 39,309$ 36,279$ 8.4%
DROP (account balance) 124,557 126,334 -1.4% DROP (account balance) 63,945 63,902 0.1%
Deferred Vested 13,436$ 13,436$ 0.0% Deferred Vested 15,991$ 16,248$ -1.6%
1967 Fire Plan 1987 Fire Plan
Retired 35,966$ 35,747$ 0.6% Retired 24,296$ 23,542$ 3.2%
Disabled 20,126 20,226 -0.5% Disabled 39,945 38,103 4.8%
Beneficiary 12,371 12,085 2.4% Beneficiary 13,484 12,712 6.1%
In Pay Status Total 28,217$ 28,006$ 0.8% In Pay Status Total 25,974$ 25,101$ 3.5%
DROP (pension) 66,629$ 61,537$ 8.3% DROP (pension) 37,600$ 32,836$ 14.5%
DROP (account balance) 146,413 128,958 13.5% DROP (account balance) 65,464 54,743 19.6%
Deferred Vested 0$ 0$ 0.0% Deferred Vested 15,923$ 16,900$ -5.8%
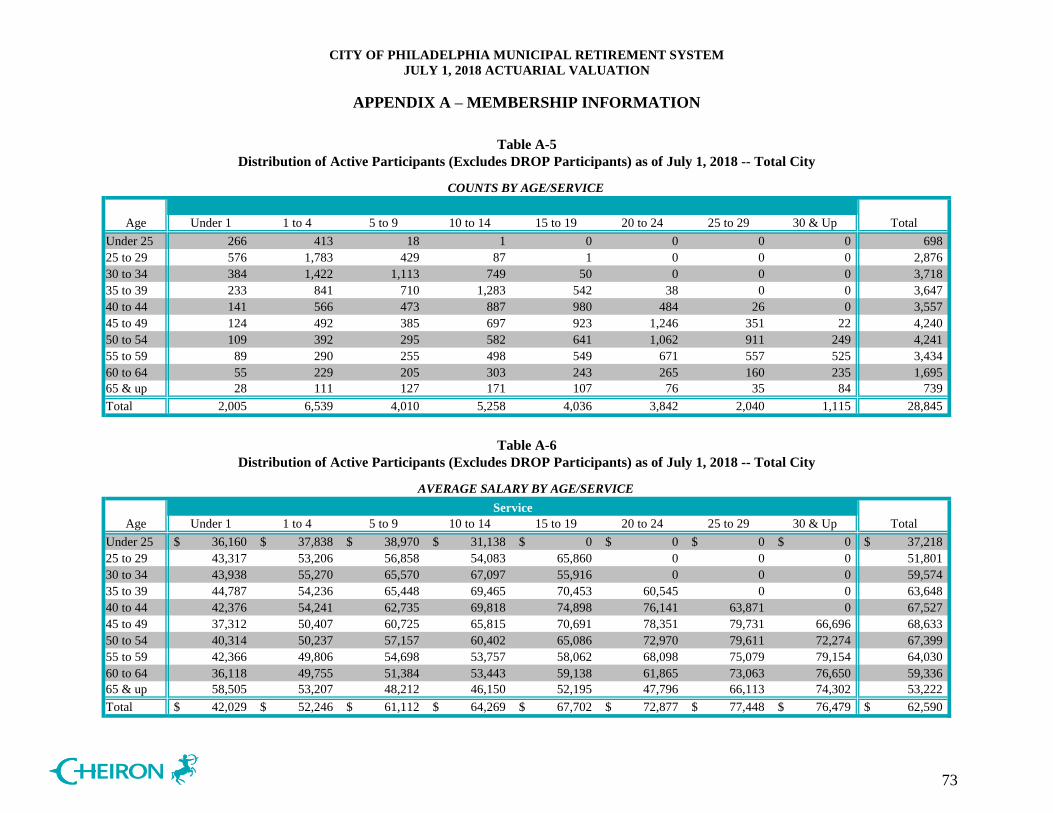
CITY OF PHILADELPHIA MUNICIPAL RETIREMENT SYSTEM
JULY 1, 2018 ACTUARIAL VALUATION
APPENDIX A – MEMBERSHIP INFORMATION
73
COUNTS BY AGE/SERVICE COUNTS BY AGE/SERVICE
Service Service
Age Under 1 1 to 4 5 to 9 10 to 14 15 to 19 20 to 24 25 to 29 30 & Up Total
Under 25 266 413 18 1 0 0 0 0 698
25 to 29 576 1,783 429 87 1 0 0 0 2,876
30 to 34 384 1,422 1,113 749 50 0 0 0 3,718
35 to 39 233 841 710 1,283 542 38 0 0 3,647
40 to 44 141 566 473 887 980 484 26 0 3,557
45 to 49 124 492 385 697 923 1,246 351 22 4,240
50 to 54 109 392 295 582 641 1,062 911 249 4,241
55 to 59 89 290 255 498 549 671 557 525 3,434
60 to 64 55 229 205 303 243 265 160 235 1,695
65 & up 28 111 127 171 107 76 35 84 739
Total 2,005 6,539 4,010 5,258 4,036 3,842 2,040 1,115 28,845
AVERAGE SALARY BY AGE/SERVICE AVERAGE SALARY BY AGE/SERVICE
Service Service
Age Under 1 1 to 4 5 to 9 10 to 14 15 to 19 20 to 24 25 to 29 30 & Up Total
Under 25 36,160$ 37,838$ 38,970$ 31,138$ 0$ 0$ 0$ 0$ 37,218$
25 to 29 43,317 53,206 56,858 54,083 65,860 0 0 0 51,801
30 to 34 43,938 55,270 65,570 67,097 55,916 0 0 0 59,574
35 to 39 44,787 54,236 65,448 69,465 70,453 60,545 0 0 63,648
40 to 44 42,376 54,241 62,735 69,818 74,898 76,141 63,871 0 67,527
45 to 49 37,312 50,407 60,725 65,815 70,691 78,351 79,731 66,696 68,633
50 to 54 40,314 50,237 57,157 60,402 65,086 72,970 79,611 72,274 67,399
55 to 59 42,366 49,806 54,698 53,757 58,062 68,098 75,079 79,154 64,030
60 to 64 36,118 49,755 51,384 53,443 59,138 61,865 73,063 76,650 59,336
65 & up 58,505 53,207 48,212 46,150 52,195 47,796 66,113 74,302 53,222
Total 42,029$ 52,246$ 61,112$ 64,269$ 67,702$ 72,877$ 77,448$ 76,479$ 62,590$
Table A-5
Distribution of Active Participants (Excludes DROP Participants) as of July 1, 2018 -- Total City
Table A-6
Distribution of Active Participants (Excludes DROP Participants) as of July 1, 2018 -- Total City

CITY OF PHILADELPHIA MUNICIPAL RETIREMENT SYSTEM
JULY 1, 2018 ACTUARIAL VALUATION
APPENDIX A – MEMBERSHIP INFORMATION
74
COUNTS BY AGE/SERVICE COUNTS BY AGE/SERVICE
Service Service
Age Under 1 1 to 4 5 to 9 10 to 14 15 to 19 20 to 24 25 to 29 30 & Up Total
Under 25 0 0 0 0 0 0 0 0 0
25 to 29 0 0 0 0 0 0 0 0 0
30 to 34 0 0 1 0 0 0 0 0 1
35 to 39 0 0 0 0 0 0 0 0 0
40 to 44 0 1 1 0 0 0 1 0 3
45 to 49 0 0 0 0 0 5 56 7 68
50 to 54 0 0 0 0 3 9 260 166 438
55 to 59 0 1 2 0 1 4 191 280 479
60 to 64 0 0 0 0 2 1 48 112 163
65 & up 0 0 0 0 0 0 17 45 62
Total 0 2 4 0 6 19 573 610 1,214
AVERAGE SALARY BY AGE/SERVICE AVERAGE SALARY BY AGE/SERVICE
Service Service
Age Under 1 1 to 4 5 to 9 10 to 14 15 to 19 20 to 24 25 to 29 30 & Up Total
Under 25 0$ 0$ 0$ 0$ 0$ 0$ 0$ 0$ 0$
25 to 29 0 0 0 0 0 0 0 0 0
30 to 34 0 0 73,942 0 0 0 0 0 73,942
35 to 39 0 0 0 0 0 0 0 0 0
40 to 44 0 48,184 61,775 0 0 0 51,991 0 53,983
45 to 49 0 0 0 0 0 56,579 72,049 62,542 69,933
50 to 54 0 0 0 0 40,951 61,550 68,023 68,513 67,890
55 to 59 0 55,867 77,567 0 38,589 49,832 66,229 74,413 70,844
60 to 64 0 0 0 0 90,057 58,036 65,360 68,443 67,736
65 & up 0 0 0 0 0 0 52,351 67,237 63,155
Total 0$ 52,026$ 72,713$ -$ 56,926$ 57,590$ 67,102$ 71,046$ 68,878$
Table A-7
Distribution of Active Participants (Excludes DROP Participants) as of July 1, 2018 -- Municipal (Plan 67)
Table A-8
Distribution of Active Participants (Excludes DROP Participants) as of July 1, 2018 -- Municipal (Plan 67)
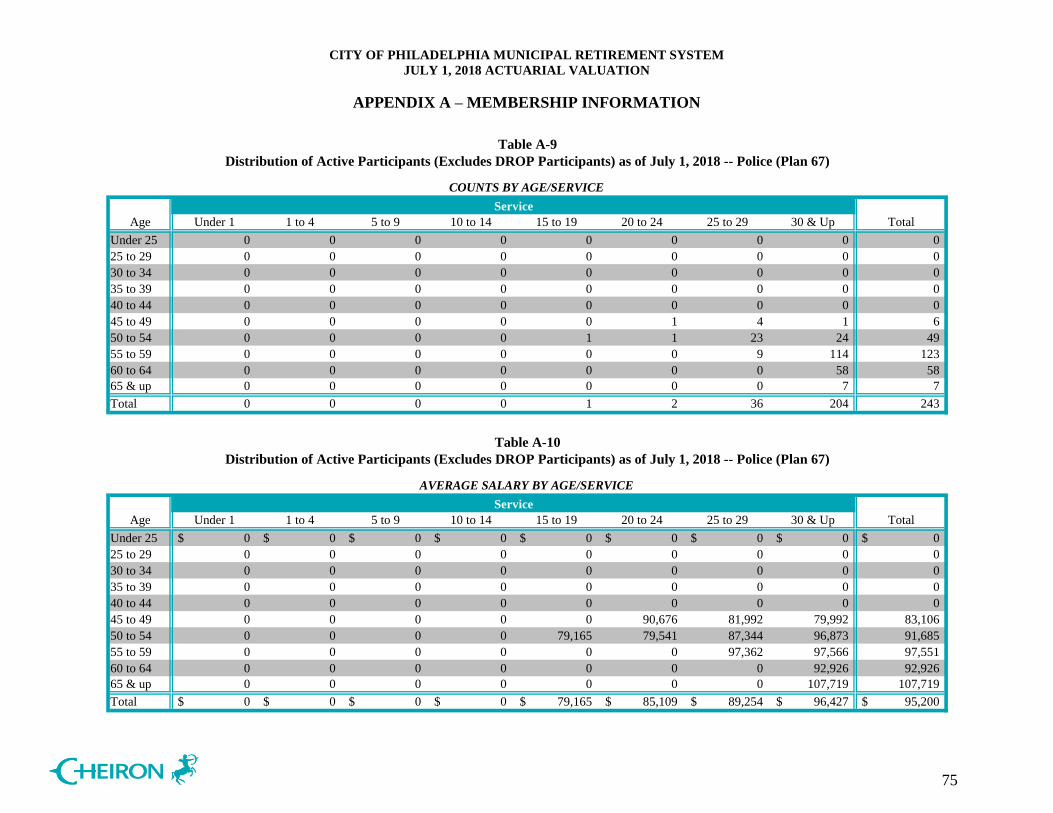
CITY OF PHILADELPHIA MUNICIPAL RETIREMENT SYSTEM
JULY 1, 2018 ACTUARIAL VALUATION
APPENDIX A – MEMBERSHIP INFORMATION
75
COUNTS BY AGE/SERVICE COUNTS BY AGE/SERVICE
Service Service
Age Under 1 1 to 4 5 to 9 10 to 14 15 to 19 20 to 24 25 to 29 30 & Up Total
Under 25 0 0 0 0 0 0 0 0 0
25 to 29 0 0 0 0 0 0 0 0 0
30 to 34 0 0 0 0 0 0 0 0 0
35 to 39 0 0 0 0 0 0 0 0 0
40 to 44 0 0 0 0 0 0 0 0 0
45 to 49 0 0 0 0 0 1 4 1 6
50 to 54 0 0 0 0 1 1 23 24 49
55 to 59 0 0 0 0 0 0 9 114 123
60 to 64 0 0 0 0 0 0 0 58 58
65 & up 0 0 0 0 0 0 0 7 7
Total 0 0 0 0 1 2 36 204 243
AVERAGE SALARY BY AGE/SERVICE AVERAGE SALARY BY AGE/SERVICE
Service Service
Age Under 1 1 to 4 5 to 9 10 to 14 15 to 19 20 to 24 25 to 29 30 & Up Total
Under 25 0$ 0$ 0$ 0$ 0$ 0$ 0$ 0$ 0$
25 to 29 0 0 0 0 0 0 0 0 0
30 to 34 0 0 0 0 0 0 0 0 0
35 to 39 0 0 0 0 0 0 0 0 0
40 to 44 0 0 0 0 0 0 0 0 0
45 to 49 0 0 0 0 0 90,676 81,992 79,992 83,106
50 to 54 0 0 0 0 79,165 79,541 87,344 96,873 91,685
55 to 59 0 0 0 0 0 0 97,362 97,566 97,551
60 to 64 0 0 0 0 0 0 0 92,926 92,926
65 & up 0 0 0 0 0 0 0 107,719 107,719
Total 0$ 0$ 0$ 0$ 79,165$ 85,109$ 89,254$ 96,427$ 95,200$
Table A-9
Distribution of Active Participants (Excludes DROP Participants) as of July 1, 2018 -- Police (Plan 67)
Table A-10
Distribution of Active Participants (Excludes DROP Participants) as of July 1, 2018 -- Police (Plan 67)

CITY OF PHILADELPHIA MUNICIPAL RETIREMENT SYSTEM
JULY 1, 2018 ACTUARIAL VALUATION
APPENDIX A – MEMBERSHIP INFORMATION
76
COUNTS BY AGE/SERVICE COUNTS BY AGE/SERVICE
Service Service
Age Under 1 1 to 4 5 to 9 10 to 14 15 to 19 20 to 24 25 to 29 30 & Up Total
Under 25 0 0 0 0 0 0 0 0 0
25 to 29 0 0 0 0 0 0 0 0 0
30 to 34 0 0 0 0 0 0 0 0 0
35 to 39 0 0 0 0 0 0 0 0 0
40 to 44 0 0 0 0 0 0 0 0 0
45 to 49 0 0 0 0 0 0 0 1 1
50 to 54 0 0 0 0 0 0 7 6 13
55 to 59 0 0 0 0 0 0 3 35 38
60 to 64 0 0 0 0 0 0 0 20 20
65 & up 0 0 0 0 0 0 0 5 5
Total 0 0 0 0 0 0 10 67 77
AVERAGE SALARY BY AGE/SERVICE AVERAGE SALARY BY AGE/SERVICE
Service Service
Age Under 1 1 to 4 5 to 9 10 to 14 15 to 19 20 to 24 25 to 29 30 & Up Total
Under 25 0$ 0$ 0$ 0$ 0$ 0$ 0$ 0$ 0$
25 to 29 0 0 0 0 0 0 0 0 0
30 to 34 0 0 0 0 0 0 0 0 0
35 to 39 0 0 0 0 0 0 0 0 0
40 to 44 0 0 0 0 0 0 0 0 0
45 to 49 0 0 0 0 0 0 0 104,385 104,385
50 to 54 0 0 0 0 0 0 86,565 80,183 83,619
55 to 59 0 0 0 0 0 0 79,945 99,440 97,901
60 to 64 0 0 0 0 0 0 0 91,813 91,813
65 & up 0 0 0 0 0 0 0 108,044 108,044
Total 0$ 0$ 0$ 0$ 0$ 0$ 84,579$ 96,154$ 94,651$
Table A-11
Distribution of Active Participants (Excludes DROP Participants) as of July 1, 2018 -- Fire (Plan 67)
Table A-12
Distribution of Active Participants (Excludes DROP Participants) as of July 1, 2018 -- Fire (Plan 67)

CITY OF PHILADELPHIA MUNICIPAL RETIREMENT SYSTEM
JULY 1, 2018 ACTUARIAL VALUATION
APPENDIX A – MEMBERSHIP INFORMATION
77
COUNTS BY AGE/SERVICE COUNTS BY AGE/SERVICE
Service Service
Age Under 1 1 to 4 5 to 9 10 to 14 15 to 19 20 to 24 25 to 29 30 & Up Total
Under 25 88 190 16 1 0 0 0 0 295
25 to 29 142 692 315 69 1 0 0 0 1,219
30 to 34 98 663 767 414 39 0 0 0 1,981
35 to 39 66 443 520 734 294 30 0 0 2,087
40 to 44 29 308 385 584 489 175 24 0 1,994
45 to 49 33 270 341 497 591 492 88 11 2,323
50 to 54 31 250 283 512 484 557 129 48 2,294
55 to 59 19 177 248 489 500 492 129 90 2,144
60 to 64 10 160 204 300 230 232 47 43 1,226
65 & up 10 77 126 170 104 72 12 20 591
Total 526 3,230 3,205 3,770 2,732 2,050 429 212 16,154
AVERAGE SALARY BY AGE/SERVICE AVERAGE SALARY BY AGE/SERVICE
Service Service
Age Under 1 1 to 4 5 to 9 10 to 14 15 to 19 20 to 24 25 to 29 30 & Up Total
Under 25 23,071$ 27,254$ 36,700$ 31,138$ 0$ 0$ 0$ 0$ 26,532$
25 to 29 41,334 47,186 49,870 49,599 65,860 0 0 0 47,350
30 to 34 49,957 51,815 59,589 56,404 49,683 0 0 0 55,650
35 to 39 57,926 52,054 60,425 60,620 59,543 55,809 0 0 58,447
40 to 44 58,351 53,608 59,027 64,200 66,457 61,849 63,714 0 61,821
45 to 49 46,984 51,139 57,992 60,120 63,809 67,291 65,801 61,645 61,257
50 to 54 60,919 51,238 55,817 57,709 59,715 63,293 65,281 69,245 59,260
55 to 59 56,503 51,539 53,834 53,285 55,789 62,181 63,697 61,840 56,844
60 to 64 40,359 48,535 51,223 52,984 57,784 58,866 59,729 68,701 54,831
65 & up 93,107 55,053 48,104 45,895 51,341 46,033 76,065 48,205 50,024
Total 45,928$ 49,381$ 56,655$ 57,818$ 60,448$ 62,646$ 64,517$ 63,612$ 56,824$
Table A-13
Distribution of Active Participants (Excludes DROP Participants) as of July 1, 2018 -- Municipal (Plan 87)
Table A-14
Distribution of Active Participants (Excludes DROP Participants) as of July 1, 2018 -- Municipal (Plan 87)

CITY OF PHILADELPHIA MUNICIPAL RETIREMENT SYSTEM
JULY 1, 2018 ACTUARIAL VALUATION
APPENDIX A – MEMBERSHIP INFORMATION
78
COUNTS BY AGE/SERVICE COUNTS BY AGE/SERVICE
Service Service
Age Under 1 1 to 4 5 to 9 10 to 14 15 to 19 20 to 24 25 to 29 30 & Up Total
Under 25 0 0 0 0 0 0 0 0 0
25 to 29 0 0 0 0 0 0 0 0 0
30 to 34 0 0 0 0 0 0 0 0 0
35 to 39 0 0 0 0 0 0 0 0 0
40 to 44 0 0 0 0 0 0 0 0 0
45 to 49 0 0 3 0 1 1 0 0 5
50 to 54 0 1 2 0 1 0 0 1 5
55 to 59 1 0 1 0 0 0 0 1 3
60 to 64 0 0 0 1 0 1 1 0 3
65 & up 0 0 0 0 0 0 1 7 8
Total 1 1 6 1 2 2 2 9 24
AVERAGE SALARY BY AGE/SERVICE AVERAGE SALARY BY AGE/SERVICE
Service Service
Age Under 1 1 to 4 5 to 9 10 to 14 15 to 19 20 to 24 25 to 29 30 & Up Total
Under 25 0$ 0$ 0$ 0$ 0$ 0$ 0$ 0$ 0$
25 to 29 0 0 0 0 0 0 0 0 0
30 to 34 0 0 0 0 0 0 0 0 0
35 to 39 0 0 0 0 0 0 0 0 0
40 to 44 0 0 0 0 0 0 0 0 0
45 to 49 0 0 132,850 0 129,760 129,760 0 0 131,614
50 to 54 0 129,760 134,395 0 135,000 0 0 129,760 132,662
55 to 59 179,299 0 129,760 0 0 0 0 132,408 147,156
60 to 64 0 0 0 129,760 0 129,760 218,474 0 159,331
65 & up 0 0 0 0 0 0 100,104 136,759 132,177
Total 179,299$ 129,760$ 132,850$ 129,760$ 132,380$ 129,760$ 159,289$ 135,498$ 137,427$
Table A-15
Distribution of Active Participants (Excludes DROP Participants) as of July 1, 2018 -- Elected (Plan 87)
Table A-16
Distribution of Active Participants (Excludes DROP Participants) as of July 1, 2018 -- Elected (Plan 87)
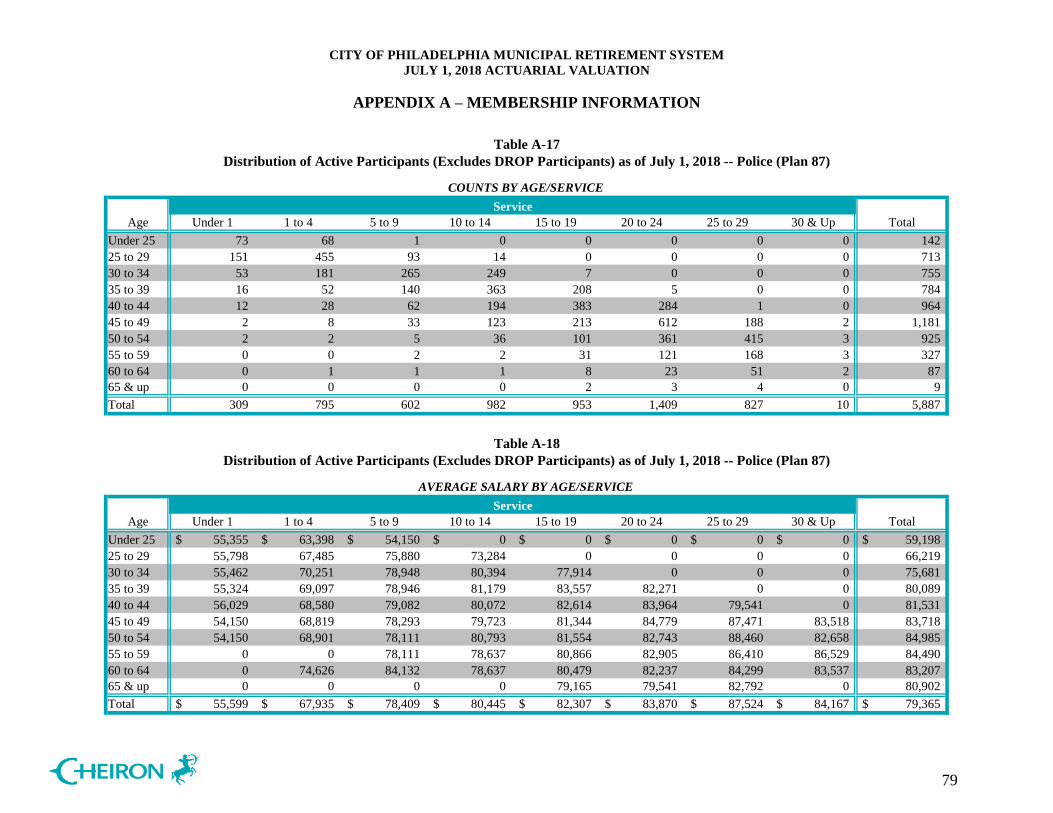
CITY OF PHILADELPHIA MUNICIPAL RETIREMENT SYSTEM
JULY 1, 2018 ACTUARIAL VALUATION
APPENDIX A – MEMBERSHIP INFORMATION
79
COUNTS BY AGE/SERVICE COUNTS BY AGE/SERVICE
Service Service
Age Under 1 1 to 4 5 to 9 10 to 14 15 to 19 20 to 24 25 to 29 30 & Up Total
Under 25 73 68 1 0 0 0 0 0 142
25 to 29 151 455 93 14 0 0 0 0 713
30 to 34 53 181 265 249 7 0 0 0 755
35 to 39 16 52 140 363 208 5 0 0 784
40 to 44 12 28 62 194 383 284 1 0 964
45 to 49 2 8 33 123 213 612 188 2 1,181
50 to 54 2 2 5 36 101 361 415 3 925
55 to 59 0 0 2 2 31 121 168 3 327
60 to 64 0 1 1 1 8 23 51 2 87
65 & up 0 0 0 0 2 3 4 0 9
Total 309 795 602 982 953 1,409 827 10 5,887
AVERAGE SALARY BY AGE/SERVICE AVERAGE SALARY BY AGE/SERVICE
Service Service
Age Under 1 1 to 4 5 to 9 10 to 14 15 to 19 20 to 24 25 to 29 30 & Up Total
Under 25 55,355$ 63,398$ 54,150$ 0$ 0$ 0$ 0$ 0$ 59,198$
25 to 29 55,798 67,485 75,880 73,284 0 0 0 0 66,219
30 to 34 55,462 70,251 78,948 80,394 77,914 0 0 0 75,681
35 to 39 55,324 69,097 78,946 81,179 83,557 82,271 0 0 80,089
40 to 44 56,029 68,580 79,082 80,072 82,614 83,964 79,541 0 81,531
45 to 49 54,150 68,819 78,293 79,723 81,344 84,779 87,471 83,518 83,718
50 to 54 54,150 68,901 78,111 80,793 81,554 82,743 88,460 82,658 84,985
55 to 59 0 0 78,111 78,637 80,866 82,905 86,410 86,529 84,490
60 to 64 0 74,626 84,132 78,637 80,479 82,237 84,299 83,537 83,207
65 & up 0 0 0 0 79,165 79,541 82,792 0 80,902
Total 55,599$ 67,935$ 78,409$ 80,445$ 82,307$ 83,870$ 87,524$ 84,167$ 79,365$
Table A-17
Distribution of Active Participants (Excludes DROP Participants) as of July 1, 2018 -- Police (Plan 87)
Table A-18
Distribution of Active Participants (Excludes DROP Participants) as of July 1, 2018 -- Police (Plan 87)
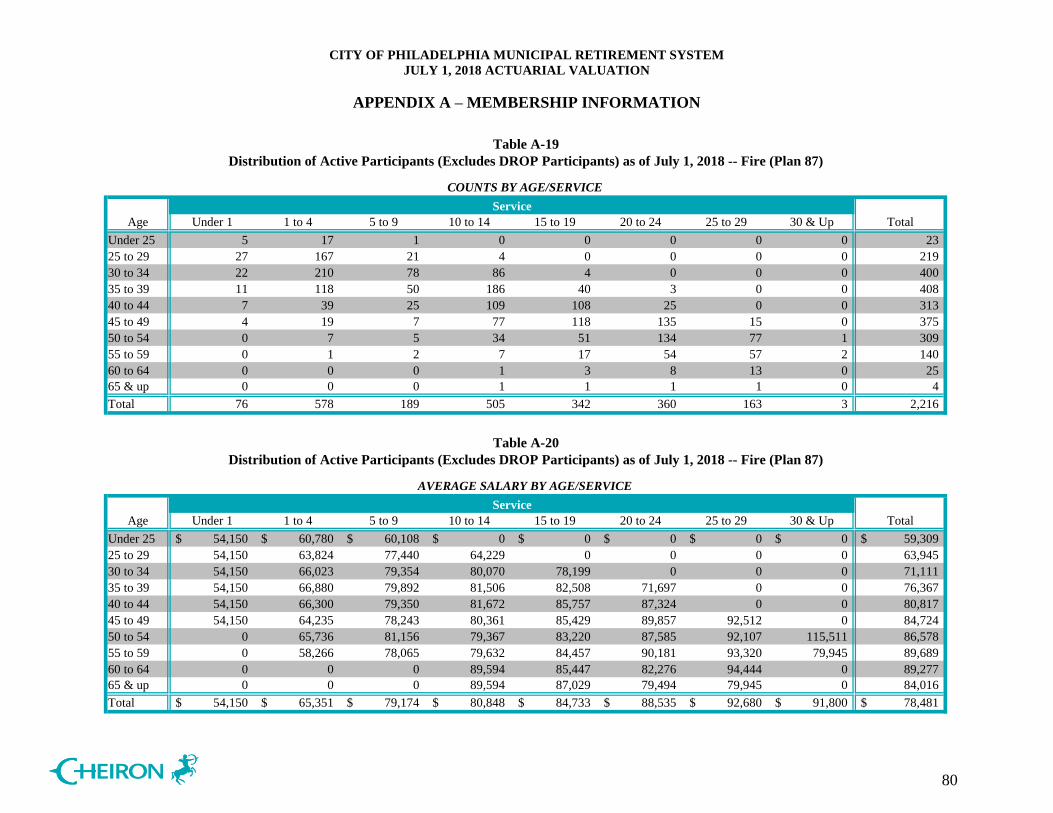
CITY OF PHILADELPHIA MUNICIPAL RETIREMENT SYSTEM
JULY 1, 2018 ACTUARIAL VALUATION
APPENDIX A – MEMBERSHIP INFORMATION
80
COUNTS BY AGE/SERVICE COUNTS BY AGE/SERVICE
Service Service
Age Under 1 1 to 4 5 to 9 10 to 14 15 to 19 20 to 24 25 to 29 30 & Up Total
Under 25 5 17 1 0 0 0 0 0 23
25 to 29 27 167 21 4 0 0 0 0 219
30 to 34 22 210 78 86 4 0 0 0 400
35 to 39 11 118 50 186 40 3 0 0 408
40 to 44 7 39 25 109 108 25 0 0 313
45 to 49 4 19 7 77 118 135 15 0 375
50 to 54 0 7 5 34 51 134 77 1 309
55 to 59 0 1 2 7 17 54 57 2 140
60 to 64 0 0 0 1 3 8 13 0 25
65 & up 0 0 0 1 1 1 1 0 4
Total 76 578 189 505 342 360 163 3 2,216
AVERAGE SALARY BY AGE/SERVICE AVERAGE SALARY BY AGE/SERVICE
Service Service
Age Under 1 1 to 4 5 to 9 10 to 14 15 to 19 20 to 24 25 to 29 30 & Up Total
Under 25 54,150$ 60,780$ 60,108$ 0$ 0$ 0$ 0$ 0$ 59,309$
25 to 29 54,150 63,824 77,440 64,229 0 0 0 0 63,945
30 to 34 54,150 66,023 79,354 80,070 78,199 0 0 0 71,111
35 to 39 54,150 66,880 79,892 81,506 82,508 71,697 0 0 76,367
40 to 44 54,150 66,300 79,350 81,672 85,757 87,324 0 0 80,817
45 to 49 54,150 64,235 78,243 80,361 85,429 89,857 92,512 0 84,724
50 to 54 0 65,736 81,156 79,367 83,220 87,585 92,107 115,511 86,578
55 to 59 0 58,266 78,065 79,632 84,457 90,181 93,320 79,945 89,689
60 to 64 0 0 0 89,594 85,447 82,276 94,444 0 89,277
65 & up 0 0 0 89,594 87,029 79,494 79,945 0 84,016
Total 54,150$ 65,351$ 79,174$ 80,848$ 84,733$ 88,535$ 92,680$ 91,800$ 78,481$
Table A-19
Distribution of Active Participants (Excludes DROP Participants) as of July 1, 2018 -- Fire (Plan 87)
Table A-20
Distribution of Active Participants (Excludes DROP Participants) as of July 1, 2018 -- Fire (Plan 87)

CITY OF PHILADELPHIA MUNICIPAL RETIREMENT SYSTEM
JULY 1, 2018 ACTUARIAL VALUATION
APPENDIX A – MEMBERSHIP INFORMATION
81
COUNTS BY AGE/SERVICE COUNTS BY AGE/SERVICE
Service Service
Age Under 1 1 to 4 5 to 9 10 to 14 15 to 19 20 to 24 25 to 29 30 & Up Total
Under 25 16 79 0 0 0 0 0 0 95
25 to 29 58 331 0 0 0 0 0 0 389
30 to 34 48 257 2 0 0 0 0 0 307
35 to 39 18 156 0 0 0 0 0 0 174
40 to 44 11 118 0 0 0 0 0 0 129
45 to 49 11 99 1 0 0 0 0 0 111
50 to 54 6 84 0 0 0 0 0 0 90
55 to 59 12 76 0 0 0 0 0 0 88
60 to 64 8 41 0 0 0 0 0 0 49
65 & up 5 19 1 0 0 0 0 0 25
Total 193 1,260 4 0 0 0 0 0 1,457
AVERAGE SALARY BY AGE/SERVICE AVERAGE SALARY BY AGE/SERVICE
Service Service
Age Under 1 1 to 4 5 to 9 10 to 14 15 to 19 20 to 24 25 to 29 30 & Up Total
Under 25 33,011$ 39,525$ 0$ 0$ 0$ 0$ 0$ 0$ 38,428$
25 to 29 39,891 46,723 0 0 0 0 0 0 45,705
30 to 34 49,781 52,475 45,169 0 0 0 0 0 52,006
35 to 39 62,326 53,903 0 0 0 0 0 0 54,774
40 to 44 54,900 58,382 0 0 0 0 0 0 58,085
45 to 49 51,334 56,164 73,679 0 0 0 0 0 55,844
50 to 54 43,674 50,546 0 0 0 0 0 0 50,088
55 to 59 81,809 51,483 0 0 0 0 0 0 55,618
60 to 64 77,709 63,182 0 0 0 0 0 0 65,554
65 & up 80,131 58,758 61,800 0 0 0 0 0 63,155
Total 50,715$ 51,427$ 56,454$ 0$ 0$ 0$ 0$ 0$ 51,346$
Table A-22
Distribution of Active Participants (Excludes DROP Participants) as of July 1, 2018 -- Municipal (Plan 10)
Table A-21
Distribution of Active Participants (Excludes DROP Participants) as of July 1, 2018 -- Municipal (Plan 10)

CITY OF PHILADELPHIA MUNICIPAL RETIREMENT SYSTEM
JULY 1, 2018 ACTUARIAL VALUATION
APPENDIX A – MEMBERSHIP INFORMATION
82
COUNTS BY AGE/SERVICE
Service
Age Under 1 1 to 4 5 to 9 10 to 14 15 to 19 20 to 24 25 to 29 30 & Up Total
Under 25 84 59 0 0 0 0 0 0 143
25 to 29 198 138 0 0 0 0 0 0 336
30 to 34 163 111 0 0 0 0 0 0 274
35 to 39 122 72 0 0 0 0 0 0 194
40 to 44 82 72 0 0 0 0 0 0 154
45 to 49 74 96 0 0 0 0 0 0 170
50 to 54 70 48 0 0 0 0 0 0 118
55 to 59 57 35 0 0 0 0 0 0 92
60 to 64 37 27 0 0 0 0 0 0 64
65 & up 13 15 0 0 0 0 0 0 28
Total 900 673 0 0 0 0 0 0 1,573
AVERAGE SALARY BY AGE/SERVICE
Service
Age Under 1 1 to 4 5 to 9 10 to 14 15 to 19 20 to 24 25 to 29 30 & Up Total
Under 25 32,720$ 33,592$ 0$ 0$ 0$ 0$ 0$ 0$ 33,079$
25 to 29 34,747 39,011 0 0 0 0 0 0 36,498
30 to 34 33,474 37,609 0 0 0 0 0 0 35,149
35 to 39 32,865 36,922 0 0 0 0 0 0 34,371
40 to 44 32,043 38,141 0 0 0 0 0 0 34,894
45 to 49 29,549 38,141 0 0 0 0 0 0 34,401
50 to 54 30,506 39,788 0 0 0 0 0 0 34,282
55 to 59 26,948 36,986 0 0 0 0 0 0 30,767
60 to 64 25,979 35,676 0 0 0 0 0 0 30,070
65 & up 23,571 36,701 0 0 0 0 0 0 30,605
Total 32,053$ 37,629$ 0$ 0$ 0$ 0$ 0$ 0$ 34,438$
Table A-23
Distribution of Active Participants (Excludes DROP Participants) as of July 1, 2018 -- Municipal (Plan 16)
Table A-24
Distribution of Active Participants (Excludes DROP Participants) as of July 1, 2018 -- Municipal (Plan 16)
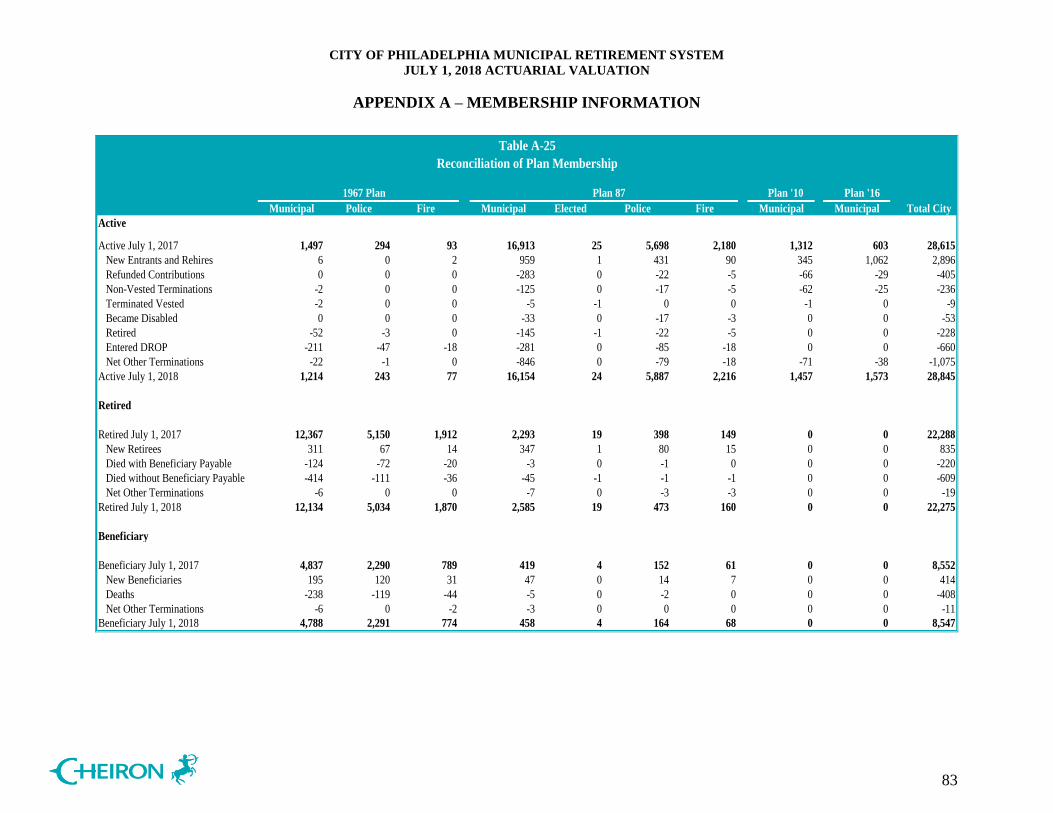
CITY OF PHILADELPHIA MUNICIPAL RETIREMENT SYSTEM
JULY 1, 2018 ACTUARIAL VALUATION
APPENDIX A – MEMBERSHIP INFORMATION
83
Table A-25
Reconciliation of Plan Membership
1967 Plan Plan 87 Plan '10 Plan '16 1967 Plan
Municipal Police Fire Municipal Elected Police Fire Municipal Municipal Total City
Active
Active July 1, 2017 1,497 294 93 16,913 25 5,698 2,180 1,312 603 28,615
New Entrants and Rehires 6 0 2 959 1 431 90 345 1,062 2,896
Refunded Contributions 0 0 0 -283 0 -22 -5 -66 -29 -405
Non-Vested Terminations -2 0 0 -125 0 -17 -5 -62 -25 -236
Terminated Vested -2 0 0 -5 -1 0 0 -1 0 -9
Became Disabled 0 0 0 -33 0 -17 -3 0 0 -53
Retired -52 -3 0 -145 -1 -22 -5 0 0 -228
Entered DROP -211 -47 -18 -281 0 -85 -18 0 0 -660
Net Other Terminations -22 -1 0 -846 0 -79 -18 -71 -38 -1,075
Active July 1, 2018 1,214 243 77 16,154 24 5,887 2,216 1,457 1,573 28,845
Retired
Retired July 1, 2017 12,367 5,150 1,912 2,293 19 398 149 0 0 22,288
New Retirees 311 67 14 347 1 80 15 0 0 835
Died with Beneficiary Payable -124 -72 -20 -3 0 -1 0 0 0 -220
Died without Beneficiary Payable -414 -111 -36 -45 -1 -1 -1 0 0 -609
Net Other Terminations -6 0 0 -7 0 -3 -3 0 0 -19
Retired July 1, 2018 12,134 5,034 1,870 2,585 19 473 160 0 0 22,275
Beneficiary
Beneficiary July 1, 2017 4,837 2,290 789 419 4 152 61 0 0 8,552
New Beneficiaries 195 120 31 47 0 14 7 0 0 414
Deaths -238 -119 -44 -5 0 -2 0 0 0 -408
Net Other Terminations -6 0 -2 -3 0 0 0 0 0 -11
Beneficiary July 1, 2018 4,788 2,291 774 458 4 164 68 0 0 8,547

CITY OF PHILADELPHIA MUNICIPAL RETIREMENT SYSTEM
JULY 1, 2018 ACTUARIAL VALUATION
APPENDIX A – MEMBERSHIP INFORMATION
84
Table A-25
Reconciliation of Plan Membership (continued)
1967 Plan Plan 87 Plan '10 Plan '16 1967 Plan
Municipal Police Fire Municipal Elected Police Fire Municipal Municipal Total City
Disabled
Disabled July 1, 2017 1,401 1,258 288 488 0 431 76 0 0 3,942
New Disabilities 5 1 0 52 0 33 7 0 0 98
Died with Beneficiary Payable -6 -17 -1 -2 0 -2 -1 0 0 -29
Died without Beneficiary Payable -55 -39 -12 -10 0 0 0 0 0 -116
Net Other Terminations 0 -2 0 0 0 -1 -2 0 0 -5
Disabled July 1, 2018 1,345 1,201 275 528 0 461 80 0 0 3,890
Terminated Vested
Terminated Vested July 1, 2017 265 1 0 781 0 96 14 0 0 1,157
New Vested Terminations 3 0 0 8 0 0 0 0 0 11
Retired -34 0 0 -27 0 -14 -1 0 0 -76
Net Other Terminations -7 0 0 -10 0 0 -1 0 0 -18
Terminated Vested July 1, 2018 227 1 0 752 0 82 12 0 0 1,074
DROP
DROP July 1, 2017 761 185 60 532 1 180 48 0 0 1,767
New DROP Participants 211 47 17 281 0 85 19 0 0 660
Retired -213 -60 -13 -140 0 -42 -6 0 0 -474
Net Other Terminations -1 0 0 -4 0 -4 0 0 0 -9
DROP July 1, 2018 758 172 64 669 1 219 61 0 0 1,944

CITY OF PHILADELPHIA MUNICIPAL RETIREMENT SYSTEM
JULY 1, 2018 ACTUARIAL VALUATION
APPENDIX A – MEMBERSHIP INFORMATION
85
Table A-26 Table A-27
Age Distribution of Retired Members as of July 1, 2018 Age Distribution of Disabled Members as of July 1, 2018
Municipal Police Fire
Age Count Annual Pensions Count Annual Pensions Count Annual Pensions
Under 40 0 0$ 0 0$ 0 0$
40-44 0 0 3 71,365 2 19,123
45-49 1 9,206 42 1,229,364 2 22,527
50-54 35 795,486 150 4,346,862 31 858,008
55-59 594 17,221,492 470 16,675,732 116 4,064,830
60-64 2,375 71,917,572 895 33,685,738 256 10,125,939
65-69 3,565 98,983,101 1,184 38,277,507 536 22,367,785
70-74 3,166 76,877,536 1,165 32,847,060 526 18,050,401
75-79 2,083 44,904,454 886 21,593,398 331 10,179,722
80-84 1,435 26,639,293 440 9,192,786 153 3,853,129
Over 84 1,484 20,948,785 272 5,473,747 77 1,602,069
Total 14,738 358,296,925 5,507 163,393,559 2,030 71,143,533
0
500
1000
1500
2000
2500
3000
3500
4000
Count
Count Distribution
Municipal Police Fire
$0
$10
$20
$30
$40
$50
$60
$70
$80
$90
$100
$110
Ben
efit i
n M
illio
ns
Benefit Distribution
Municipal Police Fire

CITY OF PHILADELPHIA MUNICIPAL RETIREMENT SYSTEM
JULY 1, 2018 ACTUARIAL VALUATION
APPENDIX A – MEMBERSHIP INFORMATION
86
Table A-27 Table A-28
Age Distribution of Disabled Members as of July 1, 2018 Age Distribution of Beneficiaries as of July 1, 2018
Municipal Police Fire
Age Count Annual Pensions Count Annual Pensions Count Annual Pensions
Under 40 19 418,123$ 40 1,849,020$ 4 171,657$
40-44 30 657,682 69 2,795,387 16 704,315
45-49 59 1,355,838 121 5,038,797 18 682,241
50-54 167 3,410,614 123 4,768,079 11 471,939
55-59 280 5,932,353 143 4,718,546 25 932,117
60-64 407 8,498,574 182 4,925,343 26 744,941
65-69 347 6,734,507 247 5,263,963 57 1,296,440
70-74 225 4,238,869 325 6,249,186 84 1,622,543
75-79 158 2,557,020 223 3,627,706 73 1,344,610
80-84 103 1,485,283 92 1,272,983 28 542,620
Over 84 78 774,713 97 1,234,212 13 216,937
Total 1,873 36,063,576 1,662 41,743,222 355 8,730,360
0
50
100
150
200
250
300
350
400
450
Cou
nt
Count Distribution
Municipal Police Fire
$0
$1
$2
$3
$4
$5
$6
$7
$8
$9
Ben
efit
in M
illio
ns
Benefit Distribution
Municipal Police Fire

CITY OF PHILADELPHIA MUNICIPAL RETIREMENT SYSTEM
JULY 1, 2018 ACTUARIAL VALUATION
APPENDIX A – MEMBERSHIP INFORMATION
87
Table A-28 Table A-29
Age Distribution of Beneficiaries as of July 1, 2018 Age Distribution of DROP Participants as of July 1, 2018
Municipal Police Fire
Age Count Annual Pensions Count Annual Pensions Count Annual Pensions
Under 40 434 3,357,423$ 129 1,249,220$ 52 539,215$
40-44 140 927,092 46 619,420 22 222,860
45-49 165 1,215,865 56 603,351 16 203,786
50-54 248 1,880,614 56 755,580 15 225,133
55-59 321 3,291,152 76 1,250,454 34 553,380
60-64 457 4,883,710 151 2,216,882 73 1,404,018
65-69 483 5,519,165 261 3,497,660 123 2,152,811
70-74 545 5,732,506 429 4,654,815 117 1,584,888
75-79 656 6,616,899 454 4,472,145 127 1,503,895
80-84 676 5,510,380 369 3,112,135 102 925,960
Over 84 1,125 7,641,455 428 3,075,680 161 1,175,850
Total 5,250 46,576,261 2,455 25,507,342 842 10,491,796
0
200
400
600
800
1000
1200
Count
Count Distribution
Municipal Police Fire
$0
$1
$2
$3
$4
$5
$6
$7
$8
Ben
efit i
n M
illio
ns
Benefit Distribution
Municipal Police Fire

CITY OF PHILADELPHIA MUNICIPAL RETIREMENT SYSTEM
JULY 1, 2018 ACTUARIAL VALUATION
APPENDIX A – MEMBERSHIP INFORMATION
88
Table A-29 Table A-30
Age Distribution of DROP Participants as of July 1, 2018 Age Distribution of Terminated Vested Members as of July 1, 2018
Municipal Police Fire
Age Count Annual Pensions Count Annual Pensions Count Annual Pensions
Under 40 0 0$ 0 0$ 0 0$
40-44 0 0 0 0 0 0
45-49 0 0 0 0 0 0
50-54 0 0 87 3,821,164 9 453,528
55-59 466 21,157,659 158 8,123,615 64 3,046,433
60-64 691 20,532,538 123 6,564,550 45 2,626,424
65-69 230 5,003,425 23 1,320,594 7 431,472
70-74 34 628,158 0 0 0 0
75-79 6 102,504 0 0 0 0
80-84 1 6,552 0 0 0 0
Over 84 0 0 0 0 0 0
Total 1,428 47,430,836 391 19,829,923 125 6,557,857
0
100
200
300
400
500
600
700
Count
Count Distribution
Municipal Police Fire
$0
$5
$10
$15
$20
$25
Ben
efit
in M
illio
ns
Benefit Distribution
Municipal Police Fire

CITY OF PHILADELPHIA MUNICIPAL RETIREMENT SYSTEM
JULY 1, 2018 ACTUARIAL VALUATION
APPENDIX A – MEMBERSHIP INFORMATION
89
Table A-30
Age Distribution of Terminated Vested Members as of July 1, 2018
Municipal Police Fire
Age Count Annual Pensions Count Annual Pensions Count Annual Pensions
Under 40 59 467,708$ 4 60,689$ 0 0$
40-44 116 1,470,239 19 291,966 0 0
45-49 223 3,057,345 51 823,866 11 180,394
50-54 285 4,467,895 7 119,449 0 0
55-59 197 2,933,979 1 15,264 1 10,687
60-64 63 737,559 1 13,436 0 0
Over 64 36 359,407 0 0 0 0
Total 979 13,494,132 83 1,324,670 12 191,081
0
50
100
150
200
250
300
350
400
Count
Count Distribution
Municipal Police Fire
$0
$1
$2
$3
$4
$5
$6
$7
Ben
efit
in M
illio
ns
Benefit Distribution
Municipal Police Fire

CITY OF PHILADELPHIA MUNICIPAL RETIREMENT SYSTEM
JULY 1, 2018 ACTUARIAL VALUATION
APPENDIX B – SUPPORTING TABLES FOR CITY’S FUNDING POLICY
90
Appendix B provides supporting information on the amortization payments under the City’s Funding Policy by each plan.
Table B-1a Table B-1b
Development of the Fiscal Year 2020 Amortization Payment under the City's Funding Policy Development of the Fiscal Year 2020 Amortization Payment under the City's Funding Policy
1967 Plan - Municipal 1967 Plan - Police
($ thousands) ($ thousands)
7/1/2018 7/1/2019 Remaining FY 2020 Payment FY 2020 Payment
Outstanding Balance Expected Balance Years Beginning-of-Year End-of-Year
1. Expected Unfunded Actuarial
Liability (UAL) as of July 1, 2018
Based on July 1, 2017 Valuation
a. Remaining 2,621,458$ 2,305,807$ 322,365$ 346,865$
2. Changes in UAL due to
a. Actuarial Experience 196,158$ 211,066$ 20 19,388$ 20,862$
b. Assumption Changes 35,162 37,835 15 4,008 4,313
c. Active Plan Changes 0 0 10 0 0
d. Inactive Plan Changes 0 0 1 0 0
e. Subtotal 231,321$ 248,901$ 23,396$ 25,175$
3. Total [1c. + 2e.] 2,852,778$ 2,554,708$ 345,762$ 372,040$

CITY OF PHILADELPHIA MUNICIPAL RETIREMENT SYSTEM
JULY 1, 2018 ACTUARIAL VALUATION
APPENDIX B – SUPPORTING TABLES FOR CITY’S FUNDING POLICY
91
Table B-1b Table B-1c
Development of the Fiscal Year 2020 Amortization Payment under the City's Funding Policy Development of the Fiscal Year 2020 Amortization Payment under the City's Funding Policy
1967 Plan - Police 1967 Plan - Fire
($ thousands) ($ thousands)
7/1/2018 7/1/2019 Remaining FY 2020 Payment FY 2020 Payment
Outstanding Balance Expected Balance Years Beginning-of-Year End-of-Year
1. Expected Unfunded Actuarial
Liability (UAL) as of July 1, 2018
Based on July 1, 2017 Valuation
a. Remaining 1,351,790$ 1,185,136$ 159,466$ 171,586$
2. Changes in UAL due to
a. Actuarial Experience 117,046$ 125,942$ 20 11,569$ 12,448$
b. Assumption Changes (1,266) (1,362) 15 (144) (155)
c. Active Plan Changes 0 0 10 0 0
d. Inactive Plan Changes 0 0 1 0 0
e. Subtotal 115,780$ 124,579$ 11,424$ 12,293$
3. Total [1c. + 2e.] 1,467,570$ 1,309,716$ 170,891$ 183,878$

CITY OF PHILADELPHIA MUNICIPAL RETIREMENT SYSTEM
JULY 1, 2018 ACTUARIAL VALUATION
APPENDIX B – SUPPORTING TABLES FOR CITY’S FUNDING POLICY
92
Table B-1c Table B-1d
Development of the Fiscal Year 2020 Amortization Payment under the City's Funding Policy Development of the Fiscal Year 2020 Amortization Payment under the City's Funding Policy
1967 Plan - Fire Plan 87 - Municipal
($ thousands) ($ thousands)
7/1/2018 7/1/2019 Remaining FY 2020 Payment FY 2020 Payment
Outstanding Balance Expected Balance Years Beginning-of-Year End-of-Year
1. Expected Unfunded Actuarial
Liability (UAL) as of July 1, 2018
Based on July 1, 2017 Valuation
a. Remaining 577,217$ 506,215$ 68,724$ 73,947$
2. Changes in UAL due to
a. Actuarial Experience 44,925$ 48,339$ 20 4,440$ 4,778$
b. Assumption Changes (461) (496) 15 (53) (57)
c. Active Plan Changes 0 0 10 0 0
d. Inactive Plan Changes 0 0 1 0 0
e. Subtotal 44,464$ 47,843$ 4,388$ 4,721$
3. Total [1c. + 2e.] 621,681$ 554,058$ 73,112$ 78,669$

CITY OF PHILADELPHIA MUNICIPAL RETIREMENT SYSTEM
JULY 1, 2018 ACTUARIAL VALUATION
APPENDIX B – SUPPORTING TABLES FOR CITY’S FUNDING POLICY
93
Table B-1d Table B-1e
Development of the Fiscal Year 2020 Amortization Payment under the City's Funding Policy Development of the Fiscal Year 2020 Amortization Payment under the City's Funding Policy
Plan 87 - Municipal Plan 87 - Elected
($ thousands) ($ thousands)
7/1/2018 7/1/2019 Remaining FY 2020 Payment FY 2020 Payment
Outstanding Balance Expected Balance Years Beginning-of-Year End-of-Year
1. Expected Unfunded Actuarial
Liability (UAL) as of July 1, 2018
Based on July 1, 2017 Valuation
a. Remaining 625,584$ 591,807$ 70,142$ 75,473$
2. Changes in UAL due to
a. Actuarial Experience 47,722$ 51,349$ 20 4,717$ 5,075$
b. Assumption Changes 104,670 112,625 15 11,932 12,838
c. Active Plan Changes 0 0 10 0 0
d. Inactive Plan Changes 0 0 1 0 0
e. Subtotal 152,392$ 163,974$ 16,648$ 17,914$
3. Total [1c. + 2e.] 777,976$ 755,782$ 86,791$ 93,387$

CITY OF PHILADELPHIA MUNICIPAL RETIREMENT SYSTEM
JULY 1, 2018 ACTUARIAL VALUATION
APPENDIX B – SUPPORTING TABLES FOR CITY’S FUNDING POLICY
94
Table B-1e Table B-1f
Development of the Fiscal Year 2020 Amortization Payment under the City's Funding Policy Development of the Fiscal Year 2020 Amortization Payment under the City's Funding Policy
Plan 87 - Elected Plan 87 - Police
($ thousands) ($ thousands)
7/1/2018 7/1/2019 Remaining FY 2020 Payment FY 2020 Payment
Outstanding Balance Expected Balance Years Beginning-of-Year End-of-Year
1. Expected Unfunded Actuarial
Liability (UAL) as of July 1, 2018
Based on July 1, 2017 Valuation
a. Remaining 14,283$ 13,199$ 1,841$ 1,981$
2. Changes in UAL due to
a. Actuarial Experience (345)$ (371)$ 20 (34)$ (37)$
b. Assumption Changes 520 559 15 59 64
c. Active Plan Changes 0 0 10 0 0
d. Inactive Plan Changes 0 0 1 0 0
e. Subtotal 175$ 188$ 25$ 27$
3. Total [1c. + 2e.] 14,458$ 13,387$ 1,866$ 2,008$

CITY OF PHILADELPHIA MUNICIPAL RETIREMENT SYSTEM
JULY 1, 2018 ACTUARIAL VALUATION
APPENDIX B – SUPPORTING TABLES FOR CITY’S FUNDING POLICY
95
Table B-1f Table B-1g
Development of the Fiscal Year 2020 Amortization Payment under the City's Funding Policy Development of the Fiscal Year 2020 Amortization Payment under the City's Funding Policy
Plan 87 - Police Plan 87 - Fire
($ thousands) ($ thousands)
7/1/2018 7/1/2019 Remaining FY 2020 Payment FY 2020 Payment
Outstanding Balance Expected Balance Years Beginning-of-Year End-of-Year
1. Expected Unfunded Actuarial
Liability (UAL) as of July 1, 2018
Based on July 1, 2017 Valuation
a. Remaining 327,008$ 309,684$ 35,588$ 38,293$
2. Changes in UAL due to
a. Actuarial Experience 34,014$ 36,599$ 20 3,362$ 3,617$
b. Assumption Changes (59,053) (63,541) 15 (6,732) (7,243)
c. Active Plan Changes 0 0 10 0 0
d. Inactive Plan Changes 0 0 1 0 0
e. Subtotal (25,039)$ (26,942)$ (3,370)$ (3,626)$
3. Total [1c. + 2e.] 301,969$ 282,742$ 32,218$ 34,667$

CITY OF PHILADELPHIA MUNICIPAL RETIREMENT SYSTEM
JULY 1, 2018 ACTUARIAL VALUATION
APPENDIX B – SUPPORTING TABLES FOR CITY’S FUNDING POLICY
96
Table B-1g Table B-1h
Development of the Fiscal Year 2020 Amortization Payment under the City's Funding Policy Development of the Fiscal Year 2020 Amortization Payment under the City's Funding Policy
Plan 87 - Fire Plan 10 - Municipal
($ thousands) ($ thousands)
7/1/2018 7/1/2019 Remaining FY 2020 Payment FY 2020 Payment
Outstanding Balance Expected Balance Years Beginning-of-Year End-of-Year
1. Expected Unfunded Actuarial
Liability (UAL) as of July 1, 2018
Based on July 1, 2017 Valuation
a. Remaining 93,363$ 87,971$ 10,579$ 11,382$
2. Changes in UAL due to
a. Actuarial Experience 13,875$ 14,930$ 20 1,371$ 1,476$
b. Assumption Changes (19,959) (21,476) 15 (2,275) (2,448)
c. Active Plan Changes 0 0 10 0 0
d. Inactive Plan Changes 0 0 1 0 0
e. Subtotal (6,084)$ (6,546)$ (904)$ (972)$
3. Total [1c. + 2e.] 87,279$ 81,425$ 9,675$ 10,410$

CITY OF PHILADELPHIA MUNICIPAL RETIREMENT SYSTEM
JULY 1, 2018 ACTUARIAL VALUATION
APPENDIX B – SUPPORTING TABLES FOR CITY’S FUNDING POLICY
97
Table B-1h Table B-1i
Development of the Fiscal Year 2020 Amortization Payment under the City's Funding Policy Development of the Fiscal Year 2020 Amortization Payment under the City's Funding Policy
Plan 10 - Municipal Plan 16 - Municipal
($ thousands) ($ thousands)
7/1/2018 7/1/2019 Remaining FY 2020 Payment FY 2020 Payment
Outstanding Balance Expected Balance Years Beginning-of-Year End-of-Year
1. Expected Unfunded Actuarial
Liability (UAL) as of July 1, 2018
Based on July 1, 2017 Valuation
a. Remaining 397$ 386$ 38$ 41$
2. Changes in UAL due to
a. Actuarial Experience (221)$ (237)$ 20 (22)$ (23)$
b. Assumption Changes 668 719 15 76 82
c. Active Plan Changes 0 0 10 0 0
d. Inactive Plan Changes 0 0 1 0 0
e. Subtotal 447$ 481$ 54$ 58$
3. Total [1c. + 2e.] 844$ 868$ 92$ 99$

CITY OF PHILADELPHIA MUNICIPAL RETIREMENT SYSTEM
JULY 1, 2018 ACTUARIAL VALUATION
APPENDIX B – SUPPORTING TABLES FOR CITY’S FUNDING POLICY
98
Table B-1i Table B-1j
Development of the Fiscal Year 2020 Amortization Payment under the City's Funding Policy Development of the Fiscal Year 2020 Amortization Payment under the City's Funding Policy
Plan 16 - Municipal Total - All Divisions
($ thousands) ($ thousands)
7/1/2018 7/1/2019 Remaining FY 2020 Payment FY 2020 Payment
Outstanding Balance Expected Balance Years Beginning-of-Year End-of-Year
1. Expected Unfunded Actuarial
Liability (UAL) as of July 1, 2018
Based on July 1, 2017 Valuation
a. Remaining (207)$ (203)$ (19)$ (20)$
2. Changes in UAL due to
a. Actuarial Experience (831)$ (895)$ 20 (82)$ (88)$
b. Assumption Changes 32 35 15 4 4
c. Active Plan Changes 0 0 10 0 0
d. Inactive Plan Changes 0 0 1 0 0
e. Subtotal (799)$ (860)$ (79)$ (84)$
3. Total [1c. + 2e.] (1,007)$ (1,063)$ (97)$ (105)$

CITY OF PHILADELPHIA MUNICIPAL RETIREMENT SYSTEM
JULY 1, 2018 ACTUARIAL VALUATION
APPENDIX B – SUPPORTING TABLES FOR CITY’S FUNDING POLICY
99
Table B-1j
Development of the Fiscal Year 2020 Amortization Payment under the City's Funding Policy
Total - All Divisions
($ thousands)
7/1/2018 7/1/2019 Remaining FY 2020 Payment FY 2020 Payment
Outstanding Balance Expected Balance Years Beginning-of-Year End-of-Year
1. Expected Unfunded Actuarial
Liability (UAL) as of July 1, 2018
Based on July 1, 2017 Valuation
a. Remaining 5,610,891$ 5,000,003$ 668,724$ 719,547$
2. Changes in UAL due to
a. Actuarial Experience 452,343$ 486,721$ 20 44,709$ 48,107$
b. Assumption Changes 60,314 64,898 15 6,875 7,398
c. Active Plan Changes 0 0 10 0 0
d. Inactive Plan Changes 0 0 1 0 0
e. Subtotal 512,657$ 551,619$ 51,585$ 55,505$
3. Total [1c. + 2e.] 6,123,548$ 5,551,622$ 720,309$ 775,053$
CITY OF PHILADELPHIA MUNICIPAL RETIREMENT SYSTEM
JULY 1, 2018 ACTUARIAL VALUATION
APPENDIX C – SUMMARY OF ACTUARIAL ASSUMPTIONS AND METHODS
100
Data Assumptions and Practices
In preparing our data, we relied on information supplied by the City of Philadelphia Municipal
Retirement System staff. The data was reviewed to ensure that it complies with generally
accepted actuarial standards. This information includes, but is not limited to, plan provisions,
employee data, and financial information. Our methodology for obtaining the data used for the
valuation is based upon the following assumptions and practices:
We exclude raw active records with dates of hire after the valuation date.
We include terminated vested records in the valuation data, regardless of whether they have
enough service for vesting.
We exclude terminated vested and retired records with values of zero in the benefit field.
If a participant is found in multiple data files (e.g., both the active and retired data files),
based on a match of both employee number and Social Security Number, we first attempt to
identify the record with the most recent status change and keep only that record. If it is not
apparent which record is the most recent, we keep the record that generates the highest
liability in our valuation system.
If a participant is found multiple times in the same data file, based on a match of both
employee number and Social Security Number, we keep the record that generates the highest
liability in our valuation system, except where one of the records is in the recorded death file
in which case we check for a survivor record or delete the record.
Valuation pay reflects a load of 6% of pay for Police (stress pay) and Firefighters (premium
pay).
The date of retirement for a terminated vested participant was set to the valuation date, if the
given date was earlier.
If the payment form field for pensioners is missing, we assume that 1967 Plan members
receive a 50% J&S annuity with a return of contributions in excess of payments received
upon death of the member, and we assume that Plan 87 members receive a life annuity, also
with a return of contributions. However, if the pensioner is a beneficiary or survivor, we
assume that they receive a life annuity only.
For pensioners under the form of payment 50% J&S annuity with return of contributions,
50% are assumed to be married based upon data provided by the City. All other forms of
payment are explicitly valued.
Records with missing dates of birth have their data filled in based on the average for their
plan.
We assumed that all changes in participant data from last year to this year were valid unless
indicated otherwise by System staff.
We use the dates of hire and service credit provided in the data to calculate actuarial liability.
We understand from the System staff that the service credit data provided does not include
adjustments for breaks in service so to the extent that some members may have had breaks in
service the actuarial liability is overstated.

CITY OF PHILADELPHIA MUNICIPAL RETIREMENT SYSTEM
JULY 1, 2018 ACTUARIAL VALUATION
APPENDIX C – SUMMARY OF ACTUARIAL ASSUMPTIONS AND METHODS
101
DROP participants are assumed to begin payments immediately.
For Municipal Plan 1967 participants, pay was assumed to be below the Social Security
Taxable Wage Base for purposes of determining the aggregate member contribution amount.
We assumed that any participant who was active last year, missing this year is now a
terminated non-vested participant.
We assumed that any participant who was inactive last year and missing from this year
without a clear reason is now deceased.

CITY OF PHILADELPHIA MUNICIPAL RETIREMENT SYSTEM
JULY 1, 2018 ACTUARIAL VALUATION
APPENDIX C – SUMMARY OF ACTUARIAL ASSUMPTIONS AND METHODS
102
A. Actuarial Assumptions
1. Investment Return Assumption
7.60% compounded annually, net of expenses.
2. Salary Increase Rate
3. Total Annual Payroll Growth
3.30% per year.
4. Administrative Expenses
Annual expected expenses included in this report are $9,733,963 and assumed to increase by
3.30% per year. This amount is included in the normal cost as an explicit assumption for
purposes of determining the contribution amounts.
5. Funding of the Pension Adjustment Fund
To recognize the expense of the benefits payable under the Pension Adjustment Fund, the
actuarial liabilities have been increased by 0.54%. This estimate is based on the statistical
average expected value of the benefits.

CITY OF PHILADELPHIA MUNICIPAL RETIREMENT SYSTEM
JULY 1, 2018 ACTUARIAL VALUATION
APPENDIX C – SUMMARY OF ACTUARIAL ASSUMPTIONS AND METHODS
103
6. Rates of Termination
Termination rates are based on Division and age, sample rates shown below.
We assume that a vested employee who terminates will elect a pension deferred to service
retirement age as long as their age plus years of service at termination are greater than or
equal to 55 (45 for police and fire employees in the 1967 Plan). Otherwise, we assume they
elect a refund of member contributions.
7. Rates of Disability
Disability rates are based on Division and age and split between gender for Municipal and
Elected Officials, sample rates shown below.
*For municipal and elected members, we assume that 65% of all disabilities are ordinary and 35% are service-
connected. For police and fire members, we assume that 25% are ordinary and 75% are service-connected.

CITY OF PHILADELPHIA MUNICIPAL RETIREMENT SYSTEM
JULY 1, 2018 ACTUARIAL VALUATION
APPENDIX C – SUMMARY OF ACTUARIAL ASSUMPTIONS AND METHODS
104
8. Rates of Pre-Retirement Mortality
Municipal and Elected Officials: 110% and 115%, for males and females, respectively, of the
RP-2014 Employee Table projected from base year of 2006 to 2021 using mortality
improvement scale MP-2017.
Uniformed: 85% of the RP-2014 Blue Collar Employee Table projected from base year of
2006 to 2021 using mortality improvement scale MP-2017.
Experience studies are performed every four years as required by State law which requires
regular and detailed experience and analysis of the mortality trends such that improvements
are addressed incrementally with assumption changes as a result of these studies. This
mandatory process allows for periodic recognition of mortality improvements which are
sufficient in addressing the potential trend. The most recent experience study was conducted
for the period between July 1, 2012 and June 30, 2017.
* For municipal and elected members, we assume that 98.5% of all deaths are ordinary, with 1.5% service-
connected. For police and fire members, 92% are assumed to be ordinary and 8% service-connected.

CITY OF PHILADELPHIA MUNICIPAL RETIREMENT SYSTEM
JULY 1, 2018 ACTUARIAL VALUATION
APPENDIX C – SUMMARY OF ACTUARIAL ASSUMPTIONS AND METHODS
105
9. Rates of Post-Retirement Mortality
Municipal and Elected Officials: 127% and 119% for males and females, respectively, of the
RP-2014 Healthy Annuitant Table projected from base year 2006 to 2021 using mortality
improvement scale MP-2017.
Uniformed: 115% of the RP-2014 Blue Collar Healthy Annuitant Table projected from base
year of 2006 to 2021 using mortality improvement scale MP-2017.
10. Rates of Post-Disability Mortality
Municipal and Elected Officials: 95% of the RP-2014 Disabled Retiree Table projected from
base year 2006 to 2021 using mortality improvement scale MP-2017.
Uniformed: 80% of the RP-2014 Disabled Retiree Table projected from base year 2006 to
2021 using mortality improvement scale MP-2017.
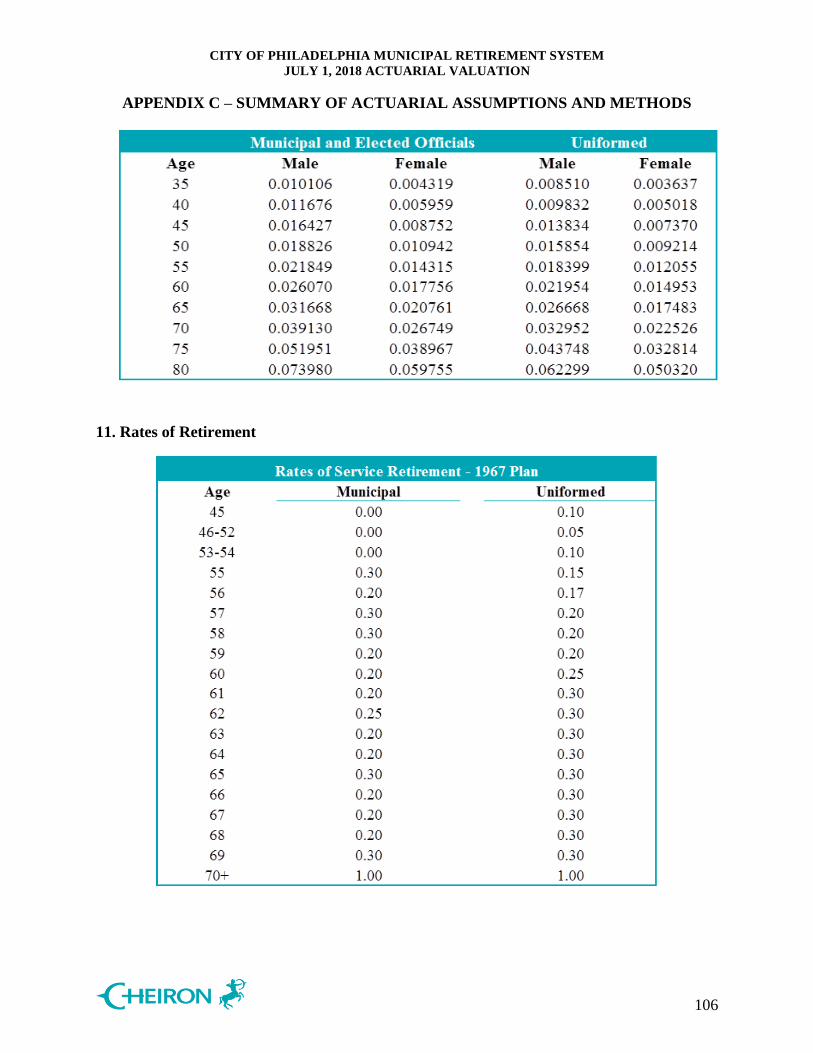
CITY OF PHILADELPHIA MUNICIPAL RETIREMENT SYSTEM
JULY 1, 2018 ACTUARIAL VALUATION
APPENDIX C – SUMMARY OF ACTUARIAL ASSUMPTIONS AND METHODS
106
11. Rates of Retirement

CITY OF PHILADELPHIA MUNICIPAL RETIREMENT SYSTEM
JULY 1, 2018 ACTUARIAL VALUATION
APPENDIX C – SUMMARY OF ACTUARIAL ASSUMPTIONS AND METHODS
107
Retirements under DROP are included in the rates above.
12. Family Composition Assumptions
70% of active members and 50% of non-active members are assumed to be married for
retirees with the 50% J&S with return on contribution form of payment only. Male spouses
are assumed to be four-years older than female spouses.
13. Service-connected disability benefit
Service-connected disability benefits are increased by 2.9% to account for the periodic
adjustment.

CITY OF PHILADELPHIA MUNICIPAL RETIREMENT SYSTEM
JULY 1, 2018 ACTUARIAL VALUATION
APPENDIX C – SUMMARY OF ACTUARIAL ASSUMPTIONS AND METHODS
108
14. Rationale for Assumptions
The assumptions used in this report reflect the results of an Experience Study performed by
Cheiron covering the five year period from July 1, 2012 through June 30, 2017 and adopted
by the Board. More details on the rationale for the demographic and economic assumptions
can be found in the Experience Study Report dated March 28, 2018.
15. Changes Since Last Valuation
Demographic assumptions (mortality rates, retirement rates, termination rates, disability
rates, service-connected disability rates, and marriage assumption for non-active
members) and economic assumptions (salary increases) were updated to reflect the most
recent experience study.
The interest rate assumption was decreased from 7.65% to 7.60%.
The administrative expenses assumption was changed from $9,166,488 to $9,733,963 to
better reflect actual experience.

CITY OF PHILADELPHIA MUNICIPAL RETIREMENT SYSTEM
JULY 1, 2018 ACTUARIAL VALUATION
APPENDIX C – SUMMARY OF ACTUARIAL ASSUMPTIONS AND METHODS
109
B. Actuarial Methods
1. Actuarial Funding Method
The Entry Age Normal actuarial funding method was used for active employees, whereby the
normal cost is computed as the level annual percentage of pay required to fund the retirement
benefits between each member’s date of hire and assumed retirement. The actuarial liability
is the difference between the present value of future benefits and the present value of future
normal cost. The unfunded actuarial liability is the difference between the actuarial liability
and the actuarial value of assets.
2. Funding Methods
City’s Funding Policy:
The initial July 1, 1985 UAL is amortized over 34 years ending June 30, 2019, with
payments increasing at 3.3% per year, the assumed payroll growth. Other changes in the
actuarial liability are amortized in level-dollar payments as follows:
Actuarial gains and losses – 20 years beginning July 1, 2009. Prior to July 1, 2009, gains
and losses were amortized over 15 years
Assumption changes – 15 years beginning July 1, 2010. Prior to July 1, 2010, assumption
changes were amortized over 20 years
Plan changes for active members – 10 years
Plan changes for inactive members – 1 year
Plan changes mandated by the State – 20 years
Tiered and additional Police Officer and Firefighter member contributions offset the City’s
portion of the normal cost.
MMO:
For the purposes of the MMO under Act 205 reflecting the fresh start amortization schedule,
the July 1, 2009 UAL was “fresh started” to be amortized over 30 years ending June 30, 2039.
This is a level dollar amortization of the UAL. All future amortization periods will follow the
City’s Funding Policy as outlined above.
Tier and additional Police Officer and Firefighter member contributions offset the City’s
portion of the normal cost in accordance with Act 205. Sales tax revenue is contributed in
addition to the MMO resulting in gains under the funding method.

CITY OF PHILADELPHIA MUNICIPAL RETIREMENT SYSTEM
JULY 1, 2018 ACTUARIAL VALUATION
APPENDIX C – SUMMARY OF ACTUARIAL ASSUMPTIONS AND METHODS
110
Revenue Recognition Policy:
This calculation is similar to the MMO except that the assets used to determine the unfunded
liability do not include the accumulated value of sales tax revenue and tier and additional
Police and Fire member contributions received by the System. These sources of income are
contributed over and above the City’s contribution of the MMO and will be in addition to the
MMO. Therefore under this funding method, the additional revenue amounts are separately
tracked and accumulated in a notional account which is then subtracted from the assets
before calculating the contribution amounts due under the Minimum Municipal Obligation
(MMO) methodology. We accumulate these amounts in a notional account and deduct them
from the Actuarial Asset Value before the MMO is determined. These amounts are
accumulated at the Actuarial Asset Value return rates to preserve the funding methodology
objective.
Tier and additional Police Officer and Firefighter member contributions do not offset the
City’s portion of the normal cost.
3. Asset Valuation Method
The actuarial value of assets (AVA) is determined using an adjusted market value. Under this
method, a preliminary AVA is determined as the market value of assets on the valuation date,
minus the existing balance of the Pension Adjustment Fund (PAF) rolled forward at the
current year’s market rate of return, minus a decreasing fraction (9/10, 8/10, 7/10, etc.) of the
investment gains or losses in each of the preceding nine years. Gains and losses prior to FYE
June 30, 2008 were smoothed over a five-year period and have now all been fully
recognized. The gain or loss for a given year is the difference between the actual investment
return (on a market-to-market basis) and the assumed investment return based on the market
value of assets at the beginning of the year and actual cash flow. The AVA is adjusted, if
necessary, to remain between 80% and 120% of the market value net of the PAF. The final
AVA is determined by subtracting the additional transfer amount (if any) to the PAF. The
additional transfer amount to the PAF remains to be calculated based on the five-year
smoothing method.
4. Changes Since Last Valuation
None
CITY OF PHILADELPHIA MUNICIPAL RETIREMENT SYSTEM
JULY 1, 2018 ACTUARIAL VALUATION
APPENDIX D – SUMMARY OF PLAN PROVISIONS – 1967 PLAN
111
This summary of plan provisions provides an overview of the major provisions of the pension
plans used in the actuarial valuation. It is not intended to replace the more precise language of
the retirement code, and if there is any difference between the description of the plans herein and
the actual text of the retirement code, the retirement code will govern.
1. Participation
Municipal (Plan J):
Fulltime employees participate on their date of employment. Temporary employees
participate after completing six months of employment. Participation is limited to employees
hired before January 8, 1987. District Council 47 (Local 2186 or 2187) and 33 members
hired between January 8, 1987 and October 1, 1992 were switched from Plan 87 to 1967 Plan
effective on their hire dates, provided such employees contributed the difference between
what they paid to the Plan and the amount they would have paid under Plan J.
Uniformed (Plans D and X):
Same as municipal.
2. Credited Service
Municipal (Plan J):
Credited service means the period of employment with the City during which the employee
makes contributions to the Retirement System. Certain leaves of absence may also be
credited.
Uniformed (Plans D and X):
Same as municipal.
3. Total Compensation
Municipal (Plan J):
Total compensation means the base rate of pay, longevity payments, and overtime received
during a 12month period.
Uniformed (Plans D and X):
Total compensation means the base rate of pay, longevity payments, and stress or premium
pay (up to 6% of base pay) received during a 12month period.
4. Final Compensation
Municipal (Plan J):
Final compensation means whichever is greater: annual base rate of pay at the time of
termination or the total compensation received during the 12 months immediately preceding
termination, including supplementary compensation received under Civil Service Regulation
No. 32.
Uniformed (Plans D and X):
Same as municipal.

CITY OF PHILADELPHIA MUNICIPAL RETIREMENT SYSTEM
JULY 1, 2018 ACTUARIAL VALUATION
APPENDIX D – SUMMARY OF PLAN PROVISIONS – 1967 PLAN
112
5. Average Final Compensation
Municipal (Plan J):
Average final compensation means the arithmetic average of the total compensation received
during the three calendar or anniversary years that produce the highest average.
Uniformed (Plans D and X):
Average final compensation means the highest of:
The total compensation received during the 12month period; or
The annual base rate of pay, excluding longevity payments, calculated from the final pay
period; or
The arithmetic average of the total compensation received during five calendar years of
employment.
6. Employee Contributions
Municipal (Plan J):
Employees who participate in the Social Security System contribute 3¾% of total
compensation up to the taxable wage base ($127,200 in 2017, and $128,400 in 2018) and 6%
of total compensation above the taxable wage base to the Retirement System.
Each employee who does not participate in the Social Security System contributes 6% of his
total compensation to the Retirement System.
All employees pay an additional 0.5% of compensation for the period between January 1,
2015 through December 31, 2015, and 1.0% of compensation January 1, 2016 onwards.
Effective January 1, 2019 current employees with annual salary (excluding overtime) in
excess of $45,000 will pay additional tier contributions on their total compensation over their
base rates as follows: +0.50% for annual salary between $45,000-$55,000; +1.50% for
annual salary between $55,000-$75,000; +2.00% for annual salary between $75,000-
$100,000; and +2.75% for annual salary greater than 100,000.
Uniformed (Plans D and X):
6% of total compensation to the Retirement System.
7. Service Retirement
Eligibility
Municipal (Plan J):
Each municipal employee is eligible to retire and receive a service pension at age 55 with one
year of service.
Uniformed (Plans D and X):
Each uniformed employee is eligible to retire and receive a service pension at age 45.

CITY OF PHILADELPHIA MUNICIPAL RETIREMENT SYSTEM
JULY 1, 2018 ACTUARIAL VALUATION
APPENDIX D – SUMMARY OF PLAN PROVISIONS – 1967 PLAN
113
Benefit Amount
Municipal (Plan J):
The service pension equals 2 1/2% of the employee’s average final compensation multiplied
by credited service to a maximum of 20 years plus 2% of the employee’s average final
compensation multiplied by credited service above 20, to a maximum of 80% of the
employee’s average final compensation.
Uniformed (Plans D and X):
The service pension equals 2 1/2% of the employee’s average final compensation multiplied
by credited service, subject to a maximum of 100% of average final compensation. A
minimum of $1,000 per month is provided for those who retired with 20 or more years of
service.
8. Early Retirement
Eligibility
Municipal (Plan J):
Each municipal employee is eligible to retire and receive a reduced service pension at age 52
if he has 10 or more years of credited service.
Uniformed (Plans D and X):
Each uniformed employee is eligible to retire and receive a reduced service pension at age 40
if he or she has 10 or more years of credited service.
Benefit Amount
Municipal (Plan J):
The annual amount is calculated the same as service retirement, reduced by 1/2 of 1% for
each month the employee is younger than minimum retirement age.
Uniformed (Plans D and X):
Same as municipal.
9. Deferred Vested Retirement
Eligibility
Municipal (Plan J):
A terminating employee who has completed 10 or more years of credited service is eligible
for a deferred vested retirement benefit.
Uniformed (Plans D and X):
Same as municipal.

CITY OF PHILADELPHIA MUNICIPAL RETIREMENT SYSTEM
JULY 1, 2018 ACTUARIAL VALUATION
APPENDIX D – SUMMARY OF PLAN PROVISIONS – 1967 PLAN
114
Benefit Amount
Municipal (Plan J):
The annual deferred vested benefit is determined the same as service pensions, using average
final compensation and credited service at termination. This benefit begins at service
retirement date. If the member dies before the deferred vested benefit begins, an ordinary
death benefit is payable (see Ordinary Death below). As an alternative before benefits begin,
a plan member who is terminating employment may ask to have employee contributions
returned (without interest) instead of receiving the deferred vested benefit.
Uniformed (Plans D and X):
Same as municipal.
10. Withdrawal Benefit
Municipal (Plan J):
Each employee terminating who has completed less than 10 years of credited service will
receive a withdrawal benefit equal to his or her employee contributions (without interest).
Uniformed (Plans D and X):
Same as municipal.
11. Service-Connected Death
Eligibility
Municipal (Plan J):
The beneficiary of each active employee who dies solely from the performance of duties of
the employee’s position with the City is eligible for an immediate death benefit.
Uniformed (Plans D and X):
Same as municipal.
Benefit Amount
Municipal (Plan J):
The death benefit equals total employee contributions paid to the Retirement System, plus a
yearly payment of 60% of the employee’s final compensation reduced by any death benefits
payable under the Worker’s Compensation Act.
This benefit is payable to the spouse until his or her death. Dependent children are entitled to
an additional yearly payment of 10% of final compensation for each dependent child (up to
two children) until the child reaches age 18. If there is no spouse, or if the spouse dies or
remarries, each dependent child (up to three children) is entitled to receive a yearly payment
of 25% of final compensation until the child reaches age 18.

CITY OF PHILADELPHIA MUNICIPAL RETIREMENT SYSTEM
JULY 1, 2018 ACTUARIAL VALUATION
APPENDIX D – SUMMARY OF PLAN PROVISIONS – 1967 PLAN
115
If there are no spouse or dependent children, each dependent parent is entitled to receive a
yearly payment of 15% of final compensation for life.
Uniformed (Plans D and X):
Same as municipal.
12. Ordinary Death
Eligibility
Municipal (Plan J):
The beneficiary of an active employee (or a terminated vested employee who did not
withdraw employee contributions) who dies after completing 10 years of credited service or
reaches age 55 is eligible for an immediate death benefit equal to a yearly pension or a lump
sum payment. The beneficiary of an active employee who dies before completing 10 years of
credited service and reaches age 55 is eligible for a lump sum payment.
The beneficiary may be any relative by blood or marriage.
Uniformed (Plans D and X):
The beneficiary of any employee who dies while actively employed (or a terminated vested
employee who did not withdraw employee contributions) is eligible for a death benefit equal
to a yearly pension or a lump sum payment.
The beneficiary may be any relative by blood or marriage.
Annual Pension
Municipal (Plan J):
The annual ordinary death pension, payable for life, is equal to the regular service pension
the employee would have received if eligible to retire on the day before he died and had
elected Option 2, joint and 100% contingent annuitant (see Survivor Benefits below).
Uniformed (Plans D and X):
The annual ordinary death pension, payable for life, is equal to the regular service pension
the employee would have received (based on a minimum of 10 years of service) had the
person been eligible to retire on the day before dying and had elected Option 2, joint and
100% contingent annuitant (see Survivor Benefits below).
Lump Sum Payment
Municipal (Plan J):
The lump sum payment is equal to 10% of the deceased employee’s average final
compensation multiplied by years of credited service to a maximum of 10, plus the deceased
employee’s contributions to the Retirement System, minus the total amount of the deceased
employee’s City paid life insurance.
Uniformed (Plans D and X):
Same as municipal.

CITY OF PHILADELPHIA MUNICIPAL RETIREMENT SYSTEM
JULY 1, 2018 ACTUARIAL VALUATION
APPENDIX D – SUMMARY OF PLAN PROVISIONS – 1967 PLAN
116
13. Service-Connected Disability
Eligibility
Municipal (Plan J):
An active employee found by the Board of Pensions and Retirement to be mentally or
physically permanently incapacitated (unable to perform duties) solely as the result of
accident or injury during the performance of duties is eligible for an immediate
serviceconnected disability pension.
Uniformed (Plans D and X):
Same as municipal. A minimum of $1,000 per month is provided for Uniformed members.
Benefit Amount
Municipal (Plan J):
The serviceconnected disability benefit is equal to the Employee's Retirement System
contributions, plus a yearly benefit of 70% of the employee’s final compensation, reduced by
any disability benefits payable under the Worker’s Compensation Act. If he or she withdraws
contributions, the benefit is payable for his or her lifetime only.
If the employee leaves employee contributions with the Retirement System, he or she may
choose a survivor benefit option (see Survivor Benefit below) and the beneficiary will
continue receiving benefit payments after his or her death.
Uniformed (Plans D and X):
Same as municipal.
14. ServiceConnected Disability Periodic Adjustment
Eligibility
Municipal (Plan J):
An employee who is receiving a serviceconnected disability benefit who is totally disabled
and does not collect Social Security disability insurance benefits is eligible for a periodic
adjustment.
Uniformed (Plans D and X):
Same as municipal, but only applies to police employees.
Benefit Amount
Municipal (Plan J):
The disabled employee’s pension will be increased in the eighth year after separation by the
percentage raise given in the previous year to active employees in his or her job class. The
adjustment will continue each year thereafter until the employee’s 65th birthday.
Uniformed (Plans D and X):
Same as municipal.

CITY OF PHILADELPHIA MUNICIPAL RETIREMENT SYSTEM
JULY 1, 2018 ACTUARIAL VALUATION
APPENDIX D – SUMMARY OF PLAN PROVISIONS – 1967 PLAN
117
15. Ordinary Disability
Eligibility
Municipal (Plan J):
An active employee found by the Board to be mentally or physically permanently
incapacitated from the further performance of duties due to an accident or illness not caused
by the performance of duties is eligible for an immediate ordinary disability benefit after
completing 10 years of credited service.
Uniformed (Plans D and X):
Same as municipal, except that fire employees only need five years of credited service and
police employees have no service requirement if the disability is permanent and total. Police
employees with permanent and partial disability need 10 years of credited service.
Benefit Amount
Municipal (Plan J):
The annual ordinary disability benefit is equal to the benefit determined under the service
pension formula using average final compensation and credited service as of the date of
disablement. If the employee is eligible for or receiving workers’ compensation, no benefit is
payable. Such employee may apply for benefits at retirement age.
Uniformed (Plans D and X):
Same as municipal, except police employees that have no service requirement are credited
with a minimum of 10 years of credited service. Same as municipal.
16. Survivor Benefit
Municipal (Plan J):
Service pensions, deferred vested benefits, serviceconnected disability benefits (if employee
contributions are left on deposit), and ordinary disability benefits are payable under five
optional forms. Options 1, 2, 3, and 5 provide benefits actuarially equivalent to a lifetime
only pension while Option 4 has no reduction.
Option 1 – A benefit is payable to the employee with the provision that upon death, the
beneficiary will receive a lump sum equal to the excess, if any, of the employee’s
contributions over the sum of the payments received.
Option 2 – A reduced benefit payable to the employee with the provision that 100% of the
reduced benefit will be paid to the designated beneficiary for life after the death of the
employee.
Option 3 – Same as Option 2 except only 50% of the reduced benefit is continued to the
designated beneficiary.
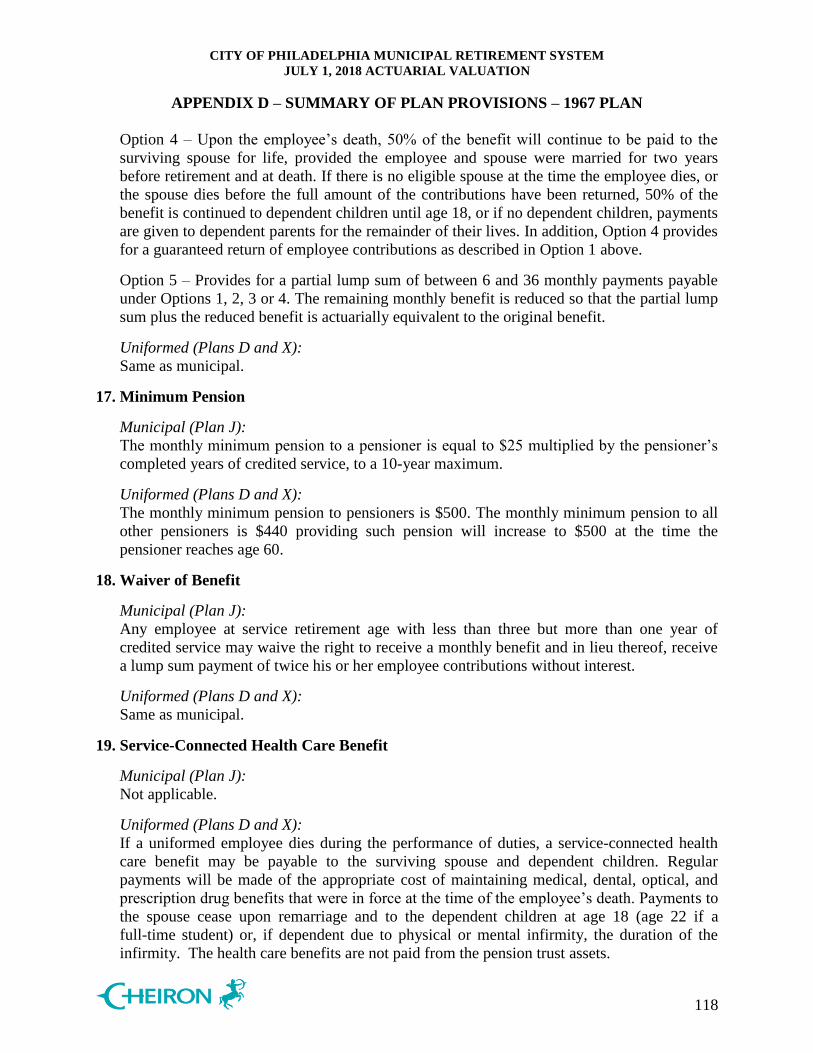
CITY OF PHILADELPHIA MUNICIPAL RETIREMENT SYSTEM
JULY 1, 2018 ACTUARIAL VALUATION
APPENDIX D – SUMMARY OF PLAN PROVISIONS – 1967 PLAN
118
Option 4 – Upon the employee’s death, 50% of the benefit will continue to be paid to the
surviving spouse for life, provided the employee and spouse were married for two years
before retirement and at death. If there is no eligible spouse at the time the employee dies, or
the spouse dies before the full amount of the contributions have been returned, 50% of the
benefit is continued to dependent children until age 18, or if no dependent children, payments
are given to dependent parents for the remainder of their lives. In addition, Option 4 provides
for a guaranteed return of employee contributions as described in Option 1 above.
Option 5 – Provides for a partial lump sum of between 6 and 36 monthly payments payable
under Options 1, 2, 3 or 4. The remaining monthly benefit is reduced so that the partial lump
sum plus the reduced benefit is actuarially equivalent to the original benefit.
Uniformed (Plans D and X):
Same as municipal.
17. Minimum Pension
Municipal (Plan J):
The monthly minimum pension to a pensioner is equal to $25 multiplied by the pensioner’s
completed years of credited service, to a 10-year maximum.
Uniformed (Plans D and X):
The monthly minimum pension to pensioners is $500. The monthly minimum pension to all
other pensioners is $440 providing such pension will increase to $500 at the time the
pensioner reaches age 60.
18. Waiver of Benefit
Municipal (Plan J):
Any employee at service retirement age with less than three but more than one year of
credited service may waive the right to receive a monthly benefit and in lieu thereof, receive
a lump sum payment of twice his or her employee contributions without interest.
Uniformed (Plans D and X):
Same as municipal.
19. ServiceConnected Health Care Benefit
Municipal (Plan J):
Not applicable.
Uniformed (Plans D and X):
If a uniformed employee dies during the performance of duties, a serviceconnected health
care benefit may be payable to the surviving spouse and dependent children. Regular
payments will be made of the appropriate cost of maintaining medical, dental, optical, and
prescription drug benefits that were in force at the time of the employee’s death. Payments to
the spouse cease upon remarriage and to the dependent children at age 18 (age 22 if a
fulltime student) or, if dependent due to physical or mental infirmity, the duration of the
infirmity. The health care benefits are not paid from the pension trust assets.
CITY OF PHILADELPHIA MUNICIPAL RETIREMENT SYSTEM
JULY 1, 2018 ACTUARIAL VALUATION
APPENDIX D – SUMMARY OF PLAN PROVISIONS – 1967 PLAN
119
20. Deferred Retirement Option Plan (DROP)
Municipal (Plan J):
Employees that have ten years of service and have reached two years past the minimum
retirement age may elect to participate in the DROP. During this time, their accrued benefit
will go into a DROP account and will earn interest at a specified rate. The rate is calculated
each year on January 1 and is equal to the lesser of the yield on 1-year treasury bonds and
half of the valuation interest rate as of that date. The benefit is calculated as of the date they
entered the DROP. At the end of the DROP, the employees’ accrued monthly benefit will
commence, plus they will receive the accumulated amount of the accrued benefit paid to the
DROP, as well as the interest earned on such benefit.
Uniformed (Plans D and X):
Same as municipal except that employees are eligible as soon as they have ten years of
service and have reached minimum retirement age.

CITY OF PHILADELPHIA MUNICIPAL RETIREMENT SYSTEM
JULY 1, 2018 ACTUARIAL VALUATION
APPENDIX D – SUMMARY OF PLAN PROVISIONS – 1987 PLAN
120
1. Participation
Municipal (Plan Y):
Full-time employees participate on their date of employment. Temporary employees
participate after completing six months of employment. Participation is limited to employees
hired on or after January 8, 1987. Any member of the 1967 Plan may irrevocably elect to
participate in Plan 87. All employees hired after their Plan ‘10 effective date become
members of Plan ‘10 with some groups having the option to elect into Plan 87. Employees
first hired or rehired after their Plan 16 effective date become members of Plan 16.
Uniformed (Plans A and B):
Same as municipal except Police employees hired after January 1, 2010 and Fire employees
hired on or after October 15, 2010 must make an election to participate in Plan 87.
Elected (Plan L):
Any City employee on or after January 8, 1987, in any general, municipal, or special
election, participates in this Plan. Effective November 11, 2014, elected officials become
members of Plan ‘10 upon employment or taking office unless they elect to participate in
Plan 87.
2. Credited Service
Municipal (Plan Y):
Credited service means the period of employment with the City during which the employee
makes contributions to the Retirement System. Certain leaves of absence may also be
credited.
Uniformed (Plans A and B):
Same as municipal.
Elected (Plan L):
Same as municipal.
3. Total Compensation
Municipal (Plan Y):
Total compensation means the base rate of pay, overtime, and longevity payments received
during a 12month period.
Uniformed (Plans A and B):
Total compensation means the base rate of pay, longevity payments, and stress or premium
pay (up to 6% of base pay) received during a 12month period.

CITY OF PHILADELPHIA MUNICIPAL RETIREMENT SYSTEM
JULY 1, 2018 ACTUARIAL VALUATION
APPENDIX D – SUMMARY OF PLAN PROVISIONS – 1987 PLAN
121
Elected (Plan L):
Total compensation means the base rate of pay and longevity payments received during a
12-month period.
4. Final Compensation
Municipal (Plan Y):
Final compensation means whichever is greater: annual base rate of pay at the time of
termination or the total compensation received during the 12 months immediately preceding
termination, including supplementary compensation received under Civil Service Regulation
No. 32.
Uniformed (Plans A and B):
Same as municipal.
Elected (Plan L):
Same as municipal.
5. Average Final Compensation
Municipal (Plan Y):
Average final compensation means the arithmetic average of the total compensation received
during the three calendar or anniversary years producing the highest average.
Uniformed (Plans A and B):
Average final compensation means the arithmetic average of the total compensation received
during the two calendar or anniversary years producing the highest average.
Elected (Plan L):
Same as municipal.
6. Employee Contributions
Municipal (Plan Y):
Total employee contributions equal 30% of the gross normal cost for all members in the
municipal division. For employees of the Sheriff’s Office represented by Lodge 5 of the F.O.P
hired after January 1, 2012 and prior to August 20, 2018, who elect to participate in Plan Y
employee contributions equal 50% of gross normal cost. Exempt and nonrepresented employees
hired after January 13, 1999 and prior to January 1, 2019 (and current employees as of January 13,
1999 that elect to do so) will contribute an additional amount to become vested in five years.
Employees hired after their Plan ‘10 date who elect the option to participate in Plan 87 prime
will pay an additional 1.0% of compensation.
All employees will pay an additional 0.5% of compensation for the period between January
1, 2015 through December 31, 2015 and 1.0% of compensation January 1, 2016 onwards.
CITY OF PHILADELPHIA MUNICIPAL RETIREMENT SYSTEM
JULY 1, 2018 ACTUARIAL VALUATION
APPENDIX D – SUMMARY OF PLAN PROVISIONS – 1987 PLAN
122
Effective January 1, 2019 current employees with annual salary (excluding overtime) in
excess of $45,000 will pay additional tier contributions on their total compensation over their
base rates as follows: +0.50% for annual salary between $45,000-$55,000; +1.50% for
annual salary between $55,000-$75,000; +2.00% for annual salary between $75,000-
$100,000; and +2.75% for annual salary greater than 100,000.
Uniformed (Plans A and B):
Total employee contributions equal 5% of total compensation, but not less than 30% or
greater than 50% of gross normal cost for members in the uniformed division. Police
employees hired after January 1, 2010 and Fire Fighters hired after October 15, 2010, who
elect to participate in the 1987 Plan, will contribute 6% of total compensation.
Member contributions for current employees are increased by 0.92% effective July 1, 2017 and an
additional 0.92% effective July 1, 2018. For new employees hired or rehired on or after July
1, 2017 member contribution rate shall be increased by 2.5% over the current rate of 6%.
Elected (Plan L):
Total employee contributions equal 30% of the gross normal cost for all members in the
elected division calculated under the Municipal Plan plus 100% of the gross normal cost that
exceeds the cost for the municipal plan. Employees hired after January 13, 1999 (and current
employees as of January 13, 1999 that elect to do so) will contribute an additional amount to
become vested in the lesser of two-full terms or eight years. Elected officials that are elected
into Office after November 14, 2014 pay an additional 1% of compensation to participate in
Plan L instead of Plan ‘10. All employees will also pay an additional 0.5% of compensation
for the period between January 1, 2015 through December 31, 2015 and 1.0% of
compensation January 1, 2016 onwards.
Effective January 1, 2019 current and future employees with annual salary (excluding
overtime) in excess of $45,000 will pay additional tier contributions on their total
compensation over their base rates as follows: +0.50% for annual salary between $45,000-
$55,000; +1.50% for annual salary between $55,000-$75,000; +2.00% for annual salary
between $75,000-$100,000; and +2.75% for annual salary greater than 100,000.
7. Service Retirement
Eligibility
Municipal (Plan Y):
Each municipal employee is eligible to retire and receive a service pension at age 60 if he or
she has 10 or more years of credited service or, if the employee made additional
contributions to become vested in five years, five years of credited service.

CITY OF PHILADELPHIA MUNICIPAL RETIREMENT SYSTEM
JULY 1, 2018 ACTUARIAL VALUATION
APPENDIX D – SUMMARY OF PLAN PROVISIONS – 1987 PLAN
123
Uniformed (Plans A and B):
Each uniformed employee is eligible to retire and receive a service pension upon reaching
age 50 and 10 or more years of credited service, or, if the employee made additional
contributions to become vested in five years, five years of credited service.
Elected (Plan L):
Each elected official is eligible to retire and receive a service pension at age 55 if he or she
has 10 or more years of credited service, or, if the employee made additional contributions to
become vested in the lesser or two full terms or eight years, the lesser of two full terms or
eight years of credited service.
Benefit Amount
Municipal (Plan Y):
The service pension equals 2.2% of the employee’s average final compensation multiplied by
years of credited service to a maximum of 10 years, plus 2% of the employee’s average final
compensation multiplied by years of service over 10, subject to a maximum of 100% of
average final compensation.
Uniformed (Plans A and B):
The service pension equals 2.2% of the employee’s average final compensation multiplied by
years of credited service to a maximum of 20 years, plus 2% of the employee’s average final
compensation multiplied by years of credited service over 20, subject to a maximum of 100%
of average final compensation.
Elected (Plan L):
The service pension equals 3.5% of the employee’s average final compensation multiplied by
years of credited service, subject to a maximum of 100% of average final compensation.
8. Early Retirement
Eligibility
Municipal (Plan Y):
Each municipal employee is eligible to retire and receive a reduced service pension at age 52
if he has 10 or more years of credited service. As an alternative, a member is eligible if he or
she has at least 33 years of credited service, regardless of age.
Uniformed (Plans A and B):
Each uniformed employee is eligible to retire and receive a reduced service pension at age 40
if he or she has 10 or more years of credited service. Alternatively, a member is eligible if he
has at least 25 years of credited service, regardless of age.

CITY OF PHILADELPHIA MUNICIPAL RETIREMENT SYSTEM
JULY 1, 2018 ACTUARIAL VALUATION
APPENDIX D – SUMMARY OF PLAN PROVISIONS – 1987 PLAN
124
Benefit Amount
Municipal (Plan Y):
The annual amount is calculated the same as service retirement, reduced by 1/2 of 1% for
each month the employee is younger than minimum retirement age. Benefits are not reduced
if the employee has 33 or more years of credited service.
Uniformed (Plans A and B):
The annual amount is calculated the same as service retirement, reduced by 1/2 of 1% for
each month the employee is younger than minimum retirement age. Benefits are not reduced
if the employee has 25 or more years of credited service.
Elected (Plan L):
The annual amount is calculated the same as service retirement, reduced by 1/2 of 1% for
each month the employee is younger than minimum retirement age.
9. Deferred Vested Retirement
Eligibility
Municipal (Plan Y):
An employee who terminates employment after completing 10 or more years of credited
service or, if the employee made additional contributions to become vested in five years, five
years of credited service, is eligible for a deferred vested retirement if his or her contributions
have not been withdrawn.
Uniformed (Plans A and B):
Same as municipal.
Elected (Plan L):
A person terminating employment and who has completed 10 or more years of credited
service, or if the employee made additional contributions to become vested in the lesser of
two full terms or eight years, two full terms or eight years of credited service is eligible for a
deferred vested retirement benefit provided he or she has not withdrawn contributions.
Benefit
Municipal (Plan Y):
The annual deferred vested benefit is determined the same as service pensions, based on
average final compensation and credited service at termination. This benefit begins at the
service retirement date. If a member dies before the deferred vested benefit begins, an
ordinary death benefit is payable (see Ordinary Death below). As an alternative, the person
terminating employment may request at any time before benefits begin a return of employee
contributions (without interest) instead of the deferred vested benefit.

CITY OF PHILADELPHIA MUNICIPAL RETIREMENT SYSTEM
JULY 1, 2018 ACTUARIAL VALUATION
APPENDIX D – SUMMARY OF PLAN PROVISIONS – 1987 PLAN
125
Uniformed (Plans A and B):
Same as municipal.
Elected (Plan L):
Same as municipal.
10. Withdrawal Benefit
Eligibility
Municipal (Plan Y):
Each terminating employee who has completed fewer than 10 years of credited service (or, if
the employee made additional contributions to become vested in five years, fewer than five
years of credited service) will receive a withdrawal benefit equal to employee contributions
(without interest).
Uniformed (Plans A and B):
Same as municipal.
Elected (Plan L):
Each terminating employee who completed fewer than 10 years of credited service will
receive a withdrawal benefit equal to employee contributions (without interest).
11. Service Connected Death
Eligibility
Municipal (Plan Y):
The beneficiary of each active employee who dies solely from the performance of duties of
the employee’s position with the City is eligible for an immediate death benefit.
Uniformed (Plans A and B):
Same as municipal.
Elected (Plan L):
Same as municipal.
Benefit Amount
Municipal (Plan Y):
The death benefit equals the sum of the total employee contributions paid to the Retirement
System (without interest), plus a yearly payment of 60% of the employee’s final
compensation reduced by any death benefits payable under the Workers’ Compensation Act.
This benefit is payable to the spouse until his or her death or remarriage, whichever occurs
first. Dependent children are entitled to an additional 10% of final compensation yearly
CITY OF PHILADELPHIA MUNICIPAL RETIREMENT SYSTEM
JULY 1, 2018 ACTUARIAL VALUATION
APPENDIX D – SUMMARY OF PLAN PROVISIONS – 1987 PLAN
126
payment for each dependent child (up to two children) until the child reaches 18. This total
benefit shall not exceed 80% of final compensation.
If there is no spouse, or if the spouse dies or remarries, each dependent child (up to three
children) is eligible for a yearly payment of 25% of final compensation until the child
reaches age 18. If there is no spouse or dependent children, each dependent parent is entitled
to a 15% of final compensation yearly payment for life.
Uniformed (Plans A and B):
Same as municipal.
Elected (Plan L):
Same as municipal.
12. Ordinary Death
Eligibility
Municipal (Plan Y):
The beneficiary of an active employee (or a terminated vested employee who did not
withdraw his employee contributions) who dies after completing 10 years of credited service
(or five years of credited service if additional contributions were made) or who has reached
age 60 is eligible for an immediate death benefit equal to an annual pension or a lump sum
payment, whichever the beneficiary chooses.
The beneficiary of an active employee who dies before completing 10 years of credited
service (or five years of credited service if additional contributions were made) or reaching
age 60 is eligible for a lump sum payment.
The beneficiary may be any relative by blood or marriage.
Uniformed (Plans A and B):
The beneficiary of any employee who dies while actively employed (or a terminated vested
employee who did not withdraw employee contributions) is eligible for a death benefit equal
to an annual pension or a lump sum payment, whichever the beneficiary chooses.
The beneficiary may be any relative by blood or marriage.
Elected (Plan L):
The beneficiary of an active employee (or a terminated vested employee who did not
withdraw contributions) who dies after completing 10 years of credited service or reaching
age 55 is eligible for an immediate death benefit equal to an annual pension or a lump sum
payment, whichever the beneficiary chooses.

CITY OF PHILADELPHIA MUNICIPAL RETIREMENT SYSTEM
JULY 1, 2018 ACTUARIAL VALUATION
APPENDIX D – SUMMARY OF PLAN PROVISIONS – 1987 PLAN
127
The beneficiary of an active employee who dies before completing 10 years of credited
service or reaching age 55 is eligible for a lump sum payment. The beneficiary may be any
relative by blood or marriage.
Annual Pension
Municipal (Plan Y):
The annual ordinary death pension, payable for life, is equal to the regular service pension
the employee would have received had he or she been eligible to retire on the day before
death and had elected Option 2, joint and 100% contingent annuitant (see Survivor Benefits
below).
Uniformed (Plans A and B):
The annual ordinary death pension, payable for life, is equal to the regular service pension
the employee would have received (based on a minimum of 10 years of service) had he been
eligible to retire on the day before death and had elected Option 2, joint and 100% contingent
annuitant (see Survivor Benefits below).
Elected (Plan L):
Same as municipal.
Lump Sum Payment
Municipal (Plan Y):
The lump sum payment is equal to the deceased employee’s average final compensation
multiplied by years of credited service (not to exceed the service in the denominator) and
divided by the number of years of credited service needed to become vested, plus the
deceased employee’s contribution to the Retirement System (without interest) minus the total
amount of the deceased employee’s life insurance which was paid by the City.
Uniformed (Plans A and B):
Same as municipal.
Elected (Plan L):
Same as municipal.
13. Service-Connected Disability
Eligibility
Municipal (Plan Y):
An active employee found by the Board of Pensions and Retirement to be mentally or
physically permanently incapacitated from any further performance of duties due solely to
the result of the performance of duties is eligible for an immediate service-connected

CITY OF PHILADELPHIA MUNICIPAL RETIREMENT SYSTEM
JULY 1, 2018 ACTUARIAL VALUATION
APPENDIX D – SUMMARY OF PLAN PROVISIONS – 1987 PLAN
128
disability pension. The application for benefit must be made within one year after termination
of employment.
Uniformed (Plans A and B):
Same as municipal.
Elected (Plan L):
An active employee found by the Board of Pensions and Retirement to be mentally or
physically permanently incapacitated from any further performance of duties due solely to
the result of the performance of duties is eligible for an immediate service-connected
disability pension.
Benefit Amount
Municipal (Plan Y):
The service-connected disability benefit is equal to the employee’s contributions to the
Retirement System, plus a yearly benefit of 70% of the employee’s final compensation,
reduced by any disability benefits payable under the Worker’s Compensation Act.
If he or she withdraws contributions, the benefit is payable for his or her lifetime only. If the
employee leaves employee contributions with the Retirement System, he or she may choose a
survivor benefit option (see Survivor benefit below) and the beneficiary will continue
receiving benefit payments after his or her death.
Uniformed (Plans A and B)
Same as municipal.
Elected (Plan L):
Same as municipal.
14. ServiceConnected Disability Periodic Adjustment
Eligibility
Municipal (Plan Y):
An employee who is receiving a serviceconnected disability benefit who is totally disabled
and does not collect Social Security disability insurance benefits is eligible for a periodic
adjustment.
Uniformed (Plans A and B):
Same as municipal, but only applies to police employees.
Elected (Plan L):
Same as municipal.
CITY OF PHILADELPHIA MUNICIPAL RETIREMENT SYSTEM
JULY 1, 2018 ACTUARIAL VALUATION
APPENDIX D – SUMMARY OF PLAN PROVISIONS – 1987 PLAN
129
Benefit Amount
Municipal (Plan Y):
The disabled employee’s pension will be increased in the eighth year after separation by the
percentage raise given in the previous year to active employees in his or her job class. The
adjustment will continue each year until the employee’s 65th birthday.
Uniformed (Plans A and B):
Same as municipal.
Elected (Plan L):
Same as municipal.
15. Ordinary Disability
Eligibility
Municipal (Plan Y):
An active employee found by the Board to be mentally or physically permanently
incapacitated from the further performance of duties due to an accident or illness not caused
by the performance of duties is eligible for an immediate ordinary disability benefit provided
he or she has at least 10 years of credited service (or five years of credited service, if
additional contributions were made). The application for benefits must be made within one
year after termination.
Uniformed (Plans A and B):
Same as municipal, except that fire employees only need five years of credited service and
police employees have no service requirement if the disability is permanent and total. Police
employees with permanent and partial disability need 10 years of credited service (or five
years of credited service, if additional contributions were made).
Elected (Plan L):
An active employee found by the Board to be mentally or physically permanently
incapacitated from the further performance of duties due to an accident or illness not caused
by the performance of duties is eligible for an immediate ordinary disability benefit provided
he or she has completed at least 10 years of credited service, or eight years if additional
contributions were made.
Benefit Amount
Municipal (Plan Y):
The annual ordinary disability benefit is equal to the benefit determined under the service
pension formula using average final compensation and credited service as of the date of
disablement.

CITY OF PHILADELPHIA MUNICIPAL RETIREMENT SYSTEM
JULY 1, 2018 ACTUARIAL VALUATION
APPENDIX D – SUMMARY OF PLAN PROVISIONS – 1987 PLAN
130
If the employee is eligible for or receiving workers compensation, no benefit is payable.
Such employee may apply for benefits at retirement age.
Uniformed (Plans A and B):
Same as municipal, except each eligible employee is automatically credited with a minimum
of 10 years of service to calculate the annual benefit.
Elected (Plan L):
The annual ordinary disability benefit is equal to the benefit determined under the service
pension formula using average final compensation and credited service as of the date of
disablement.
16. Survivor Benefits
Municipal (Plan Y):
Service pensions, deferred vested benefits, serviceconnected disability benefits, and ordinary
disability benefits are payable under five optional forms. Options 2 and 3 provide benefits
actuarially equivalent to a lifetime only pension while Option 1 has no reduction.
Option 1 A benefit is payable to the employee providing on his death, the beneficiary will
receive a lump sum equal to the excess, if any, of the employee’s contributions over the sum
of the payments received.
Option 2 A reduced benefit payable to the employee with the provision that 100% of the
reduced benefit will continue to be paid to the designated beneficiary for life after the death
of the employee.
Option 3 The same as Option 2 except only 50% of the reduced benefit is continued to the
designated beneficiary.
Option 5 – Provides for a partial lump sum of between 6 and 36 monthly payments payable
under Options 1, 2, 3 or 4. The remaining monthly benefit is reduced so that the partial lump
sum plus the reduced benefit is actuarially equivalent to the original benefit.
Uniformed (Plans A and B):
Same as municipal, except that police and fire employees may also elect Option 4:
Option 4 Upon the employee’s death, 50% of the benefit will continue to be paid to the
surviving spouse for life, provided the employee and spouse were married for two years
before retirement and at death. If there is no eligible spouse at the time the employee dies, or
the spouse dies before the full amount of the contributions have been returned, 50% of the
benefit is continued to dependent children until age 18, or if no dependent children, payments
are given to dependent parents for the remainder of their lives. In addition, Option 4 provides
for a guaranteed return of employee contributions as described in Option 1 above.
Elected (Plan L):
Same as municipal.

CITY OF PHILADELPHIA MUNICIPAL RETIREMENT SYSTEM
JULY 1, 2018 ACTUARIAL VALUATION
APPENDIX D – SUMMARY OF PLAN PROVISIONS – 1987 PLAN
131
17. ServiceConnected Health Care Benefit
Eligibility
Municipal (Plan Y):
Not applicable.
Uniformed (Plans A and B):
In the event of the death of a uniformed employee during the performance of his or her
duties, a serviceconnected health care benefit may be payable to the surviving spouse and
dependent children. Regular payments will be made of the appropriate cost of maintaining
medical, dental, optical and pharmaceutical prescription benefits in force at the time of the
employee’s death. Payments to the spouse cease upon remarriage and to the dependent
children at age 18 (age 22 if a fulltime student) or if dependent due to physical or mental
infirmity, the duration of the infirmity. The health care benefits are not paid from the
pension trust assets.
Elected (Plan L):
Not applicable.
18. Deferred Retirement Option Plan (DROP)
Eligibility
Municipal (Plan Y):
Employees that have 10 years of service and have reached two years after the minimum
retirement age may elect to participate in the DROP. During this time, their accrued benefit
will go into a DROP account and will earn interest at a specified rate. The rate is calculated
each year on January 1 and is equal to the lesser of the yield on 1-year treasury bonds and
half of the valuation interest rate as of that date. The benefit is calculated as of the date they
entered the DROP. At the end of the DROP, the employees’ accrued monthly benefit will
commence, plus they will receive the accumulated amount of the accrued benefit paid to the
DROP, as well as the interest earned on such benefit.
Uniformed (Plans A and B):
Same as municipal except that employees are eligible as soon as they have ten years of
service and have reached minimum retirement age.
Elected (Plan L):
Officials elected to Office after September 18, 2009 are not eligible to participate in the
DROP.

CITY OF PHILADELPHIA MUNICIPAL RETIREMENT SYSTEM
JULY 1, 2018 ACTUARIAL VALUATION
APPENDIX D – SUMMARY OF PLAN PROVISIONS – PLAN ‘10
132
1. Participation
Municipal:
Municipal employees hired or rehired after the Plan ‘10 effective date (as shown below)
become members in Plan ‘10 immediately upon employment. All Municipal employees
except Elected Officials hired or rehired after their Plan 16 effective date become members
of Plan 16.
Employees of the Sheriffs’ Office or Register of Wills: January 1, 2012
Employees represented by AFSCME, District Council 47: March 5, 2014
Municipal employees in the civil service not represented by a union: May 14, 2014
Employees represented by AFSCME, District Council 33, other than guards: September 2014
Guards represented by DC 33: November 11, 2014
Municipal employees not in the civil service and not represented by a union:
November 11, 2014
Elected Officials: November 11, 2014
All employees except Register of wills and guards represented by DC 33 have the option
within 30 days to elect to participate in Plan 87 Municipal.
Uniformed:
Police employees hired or rehired on or after January 1, 2010 and Fire employees hired or
rehired on or after October 15, 2010 are members in Plan ‘10 immediately upon employment.
Employees have the option within 30 days to elect to participate in Plans A or B.
Existing Plan A, Plan B, and Plan Y participants had the option, for a period of ninety (90)
days, to make an irrevocable election to enter the Plan ‘10. Employees who elected do so
would have their benefits in the existing pension plan frozen, and their future earnings and
service will count only toward benefits under Plan ‘10.
2. Credited Service
Municipal:
Credited service means the period of employment with the City during which the employee
makes contributions to the Retirement System. Certain leaves of absence may also be
credited.
Uniformed:
Same as municipal.
3. Total Compensation
Municipal:
Total compensation means the base rate of pay, overtime, and longevity payments received
during a 12month period.

CITY OF PHILADELPHIA MUNICIPAL RETIREMENT SYSTEM
JULY 1, 2018 ACTUARIAL VALUATION
APPENDIX D – SUMMARY OF PLAN PROVISIONS – PLAN ‘10
133
Uniformed:
Total compensation means the base rate of pay, longevity payments, and stress or premium
pay (up to 6% of base pay) received during a 12month period.
4. Final Compensation
Municipal:
Final compensation means whichever is greater: annual base rate of pay at the time of
termination or the total compensation received during the 12 months immediately preceding
termination, including supplementary compensation received under Civil Service Regulation
No. 32.
Uniformed:
Same as municipal.
5. Average Final Compensation
Municipal:
Average final compensation means the arithmetic average of the total compensation received
during the five calendar or anniversary years producing the highest average.
Uniformed:
Same as municipal.
6. Employee Contributions
Municipal:
Total employee contributions equal 50% of the gross normal cost for members in the
municipal division.
Effective January 1, 2019, current employees with annual salary (excluding overtime) in
excess of $45,000 will pay additional tier contributions on their total compensation over their
base rates as follows: +0.50% for annual salary between $45,000-$55,000; +1.50% for
annual salary between $55,000-$75,000; +2.00% for annual salary between $75,000-
$100,000; and +2.75% for annual salary greater than 100,000.
Uniformed:
Total employee contributions equal 5.5% of total compensation up to twenty years of
credited service.
Member contributions for current employees are increased by 0.92% effective July 1, 2017
and an additional 0.92% effective July 1, 2018. For new employees hired or rehired on or
after July 1, 2017 employee contributions rate shall be increased by 2.5% over the current
rate of 5.5%.

CITY OF PHILADELPHIA MUNICIPAL RETIREMENT SYSTEM
JULY 1, 2018 ACTUARIAL VALUATION
APPENDIX D – SUMMARY OF PLAN PROVISIONS – PLAN ‘10
134
7. Service Retirement
Eligibility
Municipal:
Each municipal employee is eligible to retire and receive a service pension at age 60 if he or
she has 10 or more years of credited service.
Uniformed:
Each uniformed employee is eligible to retire and receive a service pension upon reaching
age 50 and 10 or more years of credited service.
Benefit Amount
Municipal:
The service pension equals 1.25% of the employee’s average final compensation multiplied
by years of credited service up to a maximum of 20 years.
Uniformed:
The service pension equals 1.75% of the employee’s average final compensation multiplied
by years of credited service up to a maximum of 20 years.
8. Early Retirement
Eligibility
Municipal:
Each municipal employee is eligible to retire and receive a reduced service pension at age 52
if he has 10 or more years of credited service.
Uniformed:
Each uniformed employee is eligible to retire and receive a reduced service pension at age 40
if he or she has 10 or more years of credited service.
Benefit Amount
Municipal:
The annual amount is calculated the same as service retirement, reduced by 1/2 of 1% for
each month the employee is younger than minimum retirement age.
Uniformed:
Same as municipal.

CITY OF PHILADELPHIA MUNICIPAL RETIREMENT SYSTEM
JULY 1, 2018 ACTUARIAL VALUATION
APPENDIX D – SUMMARY OF PLAN PROVISIONS – PLAN ‘10
135
9. Deferred Vested Retirement
Eligibility
Municipal:
An employee who terminates employment after completing 10 or more years of credited
service is eligible for a deferred vested retirement if his or her contributions have not been
withdrawn.
Uniformed:
Same as municipal.
Benefit Amount
Municipal:
The annual deferred vested benefit is determined the same as service pensions, based on
average final compensation and credited service at termination. This benefit begins at the
service retirement date. If a member dies before the deferred vested benefit begins, an
ordinary death benefit is payable (see Ordinary Death below). As an alternative, the person
terminating employment may request at any time before benefits begin a return of employee
contributions (without interest) instead of the deferred vested benefit.
Uniformed:
Same as municipal.
10. Withdrawal Benefit
Eligibility
Municipal:
Each terminating employee who has completed fewer than 10 years of credited service will
receive a withdrawal benefit equal to employee contributions (without interest).
Uniformed:
Same as municipal.
11. Service Connected Death
Eligibility
Municipal:
The beneficiary of each active employee who dies solely from the performance of duties of
the employee’s position with the City is eligible for an immediate death benefit.
CITY OF PHILADELPHIA MUNICIPAL RETIREMENT SYSTEM
JULY 1, 2018 ACTUARIAL VALUATION
APPENDIX D – SUMMARY OF PLAN PROVISIONS – PLAN ‘10
136
Uniformed:
Same as municipal.
Benefit Amount
Municipal:
The death benefit equals the sum of the total employee contributions paid to the Retirement
System (without interest), plus a yearly payment of 60% of the employee’s final
compensation reduced by any death benefits payable under the Workers’ Compensation Act.
This benefit is payable to the spouse until his or her death or remarriage, whichever occurs
first. Dependent children are entitled to an additional 10% of final compensation yearly
payment for each dependent child (up to two children) until the child reaches 18. This total
benefit shall not exceed 80% of final compensation.
If there is no spouse, or if the spouse dies or remarries, each dependent child (up to three
children) is eligible for a yearly payment of 25% of final compensation until the child
reaches age 18. If there is no spouse or dependent children, each dependent parent is entitled
to a 15% of final compensation yearly payment for life.
Uniformed:
Same as municipal.
12. Ordinary Death
Eligibility
Municipal:
The beneficiary of an active employee (or a terminated vested employee who did not
withdraw his employee contributions) who dies after completing 10 years of credited service
or who has reached age 60 is eligible for an immediate death benefit equal to an annual
pension or a lump sum payment, whichever the beneficiary chooses.
The beneficiary of an active employee who dies before completing 10 years of credited
service or reaching age 60 is eligible for a lump sum payment.
The beneficiary may be any relative by blood or marriage.
Uniformed:
The beneficiary of any employee who dies while actively employed (or a terminated vested
employee who did not withdraw employee contributions) is eligible for a death benefit equal
to an annual pension or a lump sum payment, whichever the beneficiary chooses.
The beneficiary may be any relative by blood or marriage.

CITY OF PHILADELPHIA MUNICIPAL RETIREMENT SYSTEM
JULY 1, 2018 ACTUARIAL VALUATION
APPENDIX D – SUMMARY OF PLAN PROVISIONS – PLAN ‘10
137
Annual Pension
Municipal:
The annual ordinary death pension, payable for life, is equal to the regular service pension
the employee would have received had he or she been eligible to retire on the day before
death and had elected Option 2, joint and 100% contingent annuitant (see Survivor Benefits
below).
Uniformed:
The annual ordinary death pension, payable for life, is equal to the regular service pension
the employee would have received (based on a minimum of 10 years of service) had he been
eligible to retire on the day before death and had elected Option 2, joint and 100% contingent
annuitant (see Survivor Benefits below).
Lump Sum Payment
Municipal:
The lump sum payment is equal to the deceased employee’s average final compensation
multiplied by years of credited service (not to exceed the service in the denominator) and
divided by the number of years of credited service needed to become vested, plus the
deceased employee’s contribution to the Retirement System (without interest) minus the total
amount of the deceased employee’s life insurance which was paid by the City.
Uniformed:
Same as municipal.
13. Service-Connected Disability
Eligibility
Municipal:
An active employee found by the Board of Pensions and Retirement to be mentally or
physically permanently incapacitated from any further performance of duties due solely to
the result of the performance of duties is eligible for an immediate service-connected
disability pension. The application for benefit must be made within one year after termination
of employment.
Uniformed:
Same as municipal.

CITY OF PHILADELPHIA MUNICIPAL RETIREMENT SYSTEM
JULY 1, 2018 ACTUARIAL VALUATION
APPENDIX D – SUMMARY OF PLAN PROVISIONS – PLAN ‘10
138
Benefit Amount
Municipal:
The service-connected disability benefit is equal to the employee’s contributions to the
Retirement System, plus a yearly benefit of 70% of the employee’s final compensation,
reduced by any disability benefits payable under the Worker’s Compensation Act.
If he or she withdraws contributions, the benefit is payable for his or her lifetime only.
If the employee leaves employee contributions with the Retirement System, he or she may
choose a survivor benefit option (see Survivor benefit below) and the beneficiary will
continue receiving benefit payments after his or her death.
Uniformed:
Same as municipal.
14. ServiceConnected Disability Periodic Adjustment
Eligibility
Municipal:
An employee who is receiving a serviceconnected disability benefit who is totally disabled
and does not collect Social Security disability insurance benefits is eligible for a periodic
adjustment.
Uniformed:
Same as municipal, but only applies to police employees.
Benefit Amount
Municipal:
The disabled employee’s pension will be increased in the eighth year after separation by the
percentage raise given in the previous year to active employees in his or her job class. The
adjustment will continue each year until the employee’s 65th birthday.
Uniformed:
Same as municipal.
15. Ordinary Disability
Eligibility
Municipal:
An active employee found by the Board to be mentally or physically permanently
incapacitated from the further performance of duties due to an accident or illness not caused
by the performance of duties is eligible for an immediate ordinary disability benefit provided

CITY OF PHILADELPHIA MUNICIPAL RETIREMENT SYSTEM
JULY 1, 2018 ACTUARIAL VALUATION
APPENDIX D – SUMMARY OF PLAN PROVISIONS – PLAN ‘10
139
he or she has at least 10 years of credited service. The application for benefits must be made
within one year after termination.
Uniformed:
Same as municipal, except that fire employees only need five years of credited service and
police employees have no service requirement if the disability is permanent and total. Police
employees with permanent and partial disability need 10 years of credited service.
Benefit Amount
Municipal:
The annual ordinary disability benefit is equal to the benefit determined under the service
pension formula using average final compensation and credited service as of the date of
disablement.
If the employee is eligible for or receiving workers compensation, no benefit is payable.
Such employee may apply for benefits at retirement age.
Uniformed (Plans A and B):
Same as municipal, except each eligible employee is automatically credited with a minimum
of 10 years of service to calculate the annual benefit.
16. Survivor Benefits
Eligibility
Municipal:
Service pensions, deferred vested benefits, serviceconnected disability benefits, and ordinary
disability benefits are payable under five optional forms. Options 2 and 3 provide benefits
actuarially equivalent to a lifetime only pension while Option 1 has no reduction.
Option 1 A benefit is payable to the employee providing on his death, the beneficiary will
receive a lump sum equal to the excess, if any, of the employee’s contributions over the sum
of the payments received.
Option 2 A reduced benefit payable to the employee with the provision that 100% of the
reduced benefit will continue to be paid to the designated beneficiary for life after the death
of the employee.
Option 3 The same as Option 2 except only 50% of the reduced benefit is continued to the
designated beneficiary.
Option 5 – Provides for a partial lump sum of between 6 and 36 monthly payments payable
under Options 1, 2, 3 or 4. The remaining monthly benefit is reduced so that the partial lump
sum plus the reduced benefit is actuarially equivalent to the original benefit.

CITY OF PHILADELPHIA MUNICIPAL RETIREMENT SYSTEM
JULY 1, 2018 ACTUARIAL VALUATION
APPENDIX D – SUMMARY OF PLAN PROVISIONS – PLAN ‘10
140
Uniformed:
Same as municipal, except that police and fire employees may also elect Option 4:
Option 4 Upon the employee’s death, 50% of the benefit will continue to be paid to the
surviving spouse for life, provided the employee and spouse were married for two years
before retirement and at death. If there is no eligible spouse at the time the employee dies, or
the spouse dies before the full amount of the contributions have been returned, 50% of the
benefit is continued to dependent children until age 18, or if no dependent children, payments
are given to dependent parents for the remainder of their lives. In addition, Option 4
provides for a guaranteed return of employee contributions as described in Option 1 above.
17. ServiceConnected Health Care Benefit
Eligibility
Municipal:
Not applicable.
Uniformed:
In the event of the death of a uniformed employee during the performance of his or her
duties, a serviceconnected health care benefit may be payable to the surviving spouse and
dependent children. Regular payments will be made of the appropriate cost of maintaining
medical, dental, optical and pharmaceutical prescription benefits in force at the time of the
employee’s death. Payments to the spouse cease upon remarriage and to the dependent
children at age 18 (age 22 if a fulltime student) or if dependent due to physical or mental
infirmity, the duration of the infirmity. The health care benefits are not paid from the pension
trust assets.
18. Deferred Retirement Option Plan (DROP)
Eligibility
Municipal:
Employees that have 10 years of service and have reached two years after the minimum
retirement age may elect to participate in the DROP. During this time, their accrued benefit
will go into a DROP account and will earn interest at a specified rate. The rate is calculated
each year on January 1 and is equal to the lesser of the yield on 1-year treasury bonds and
half of the valuation interest rate as of that date. The benefit is calculated as of the date they
entered the DROP. At the end of the DROP, the employees’ accrued monthly benefit will
commence, plus they will receive the accumulated amount of the accrued benefit paid to the
DROP, as well as the interest earned on such benefit.
Uniformed:
Same as municipal except that employees are eligible as soon as they have ten years of
service and have reached minimum retirement age.

CITY OF PHILADELPHIA MUNICIPAL RETIREMENT SYSTEM
JULY 1, 2018 ACTUARIAL VALUATION
APPENDIX D – SUMMARY OF PLAN PROVISIONS – PLAN ‘16
141
Employees in all Municipal groups (except elected officials) hired or rehired on or after the
Plan 16 effective date (as shown below) are required to participate in the new Stacked Hybrid
Plan – Plan 16.
Employees of the Sheriffs’ Office or Register of Wills: June 21, 2018
Employees represented by AFSCME, District Council 33: August 20, 2016
Employees represented by AFSCME, District Council 47: January 1, 2019
Municipal employees not represented by a union: January 1, 2019
Plan 16 benefits are similar to Plan 87, except that the average final compensation used in
calculating benefits is limited by the Stacked Hybrid Cap of $65,000. For DC 33 Plan 16
members, effective January 1, 2019 the Stacked Hybrid Cap is increased from $50,000 to
$65,000.
Member contributions for Plan 16 members will also be based on compensation capped at
$65,000. Additionally, employees with annual salary (excluding overtime) in excess of
$45,000 will pay additional tier contributions on their total compensation over their base
rates as follows: +0.50% for annual salary between $45,000-$55,000 and +1.50% for annual
salary between $55,000-$65,000.
Municipal employee members of Plan 16 who are both not in the civil service and not
represented by a union will contribute an additional amount to become vested in seven years
instead of ten years.
Plan 16 members will have the option to participate in the Deferred Compensation Plan (DC
Plan). For members whose benefits are capped under the retirement plan, the City will match
50% of the members’ contribution up to a maximum of 1.5% of the member’s annual
compensation.
SUMMARY OF LEGISLATIVE CHANGES
The following table summarizes member contribution rates by Plan and by bargaining group
where applicable. This information has been provided by the Staff and has been applied where
effective as of the valuation date.

CITY OF PHILADELPHIA MUNICIPAL RETIREMENT SYSTEM
JULY 1, 2018 ACTUARIAL VALUATION
APPENDIX D – SUMMARY OF PLAN PROVISIONS – MEMBER CONTRIBUTIONS
142
Member Contribution Rates by Membership Class Effective 7/1/2019
Plan D (Police) 6.00%
Plan X (Fire) 6.00%
Plan J-(OHCD) 6.00% Add on for Tier
Plan J1 (Non Reps; Exempts) 7.00% Add on for Tier
Plan J2 (DC 47, DC 33 and OHCD) 7.00% Add on for Tier
4.75% Add on for Tier
Plan J4 (DC 47, DC 33) 4.75% Add on for Tier
Plan J6 (Non Civil Service-Auditing Dept EE) 4.75% Add on for Tier
Plan A (Fire) 6.84%
Plan B (Police) 6.84%
Plan L (Elected) 10.75% Add on for Tier
Plan Y 3.49% Add on for Tier
Plan Y (Deputy Sheriffs and Register of Wills) 3.49% Add on for Tier
Plan Y5 4.25% Add on for Tier
Plan L8 12.78% Add on for Tier
Plan Y2 (Non Reps-Exempts:excl Auditing EEs) 3.49% Add on for Tier
Plan Y3 (DC 47, DC 33 and OHCD) 3.49% Add on for Tier
Plan Y4 (Exempts-Auditing/Controller Dept Ees 3.49% Add on for Tier
Plan Y1 (Deputy Sheriff)
DOH>=1/1/2012 and < 6/20/2018
Plan Y4 (Non Reps) DOH>=5/14/2014 +1% 4.49% Add on for Tier
Plan Y6 (DC 47) DOH>=3/5/2014 +1% 4.49% Add on for Tier
Plan Y9 (DC33-excluding Guards and OHCD) +1%
DOH>=9/9/2014
Plan Y12 (DC33: Guards) DOH>= 9/9/2014 and < 11/14/2014 +1% 4.49% Add on for Tier
Plan Y11 (Exempts) DOH>=11/14/2014 +1% 4.49% Add on for Tier
Plan Y5.1 (5 yr vesting-Exempts) +1%
DOH>=11/14/2014
Plan L1 (Elected) DOH>=11/14/2014 +1% 11.75% Add on for Tier
Plan L8.1 (Elected) DOH>=11/14/2014 +1% 13.78% Add on for Tier
Plan B6 (Police) DOH>=1/1/2010 and < 7/1/2017 +1.84% 7.84%
Plan B6 (Police) DOH>=7/1/2017 +2.50% 8.50%
Plan A6 (Fire) DOH>=10/15/2010 and < 7/1/2017 +1.84% 7.84%
Plan A6 (Fire) DOH>=7/1/2017 +2.50% 8.50%
Plan B10 (Police) DOH< 7/1/2017 +1.84% 7.34%
Plan B10 (Police) DOH>=7/1/2017 +2.50% 8.00%
Plan A10 (Fire) DOH< 7/1/2017 +1.84% 7.34%
Plan A10 (Fire) DOH>=7/1/2017 +2.50% 8.00%
Plan Y10
Deputy Sheriff DOH >=1/1/2012 and < 6/20/2018 2.33% Add on for Tier
Register of Wills-MANDATORY DOH >=1/1/2012 and < 6/20/2018 2.33% Add on for Tier
DC33-Guards-MANDATORY DOH>=11/14/2014 and < 8/19/2016 2.33% Add on for Tier
DC 33 DOH < 8/19/2016
Non-Reps, DC 47 2.33% Add on for Tier
Elected 2.33% Add on for Tier
Exempts (5 yr vesting-Exempts) 2.75% Add on for Tier
Plan S16
Deputy Sheriffs and Register of Wills DOH >= 6/21/2018 4.04% Add on for Tier
DC 33 DOH >= 8/20/2016 4.04% Add on for Tier
Non-Reps, DC 47 DOH >= 1/1/2019 4.04% Add on for Tier
Exempts (7 yr vesting-Exempts) DOH >= 1/1/2019 4.53% Add on for Tier
Plan J3 (Non Reps-Exempts: excluding Auditing (Controller) Department who are not in Civil Service)
Pla
n 8
7
No
SS
A C
ov
era
ge
Pla
n 6
7
SS
A
4.15% Add on for Tier
4.49% Add on for Tier
5.25% Add on for Tier
Pla
n 8
7 P
rim
e
Op
ted
ou
t o
f P
lan
10
50% of Agregate Normal Cost
of all members in Plan Y
Pla
n 1
0
50
% o
f N
orm
al
Co
st f
or
mem
bers
of
Pla
n 1
0
Pensionable Earnings up to
$65,000
Pla
n 1
6

CITY OF PHILADELPHIA MUNICIPAL RETIREMENT SYSTEM
JULY 1, 2018 ACTUARIAL VALUATION
APPENDIX E – GLOSSARY OF TERMS
143
1. Actuarial Liability
The Actuarial Liability is the difference between the present value of all future system
benefits and the present value of total future normal costs. This is also referred to by some
actuaries as the “accrued liability” or “actuarial accrued liability.”
2. Actuarial Assumptions
Estimates of future experience with respect to rates of mortality, disability, turnover,
retirement rate or rates of investment income and salary increases. Actuarial assumptions
(rates of mortality, disability, turnover, and retirement) are generally based on past
experience, often modified for projected changes in conditions. Economic assumptions
(salary increases and investment income) consist of an underlying rate in an inflation-free
environment plus a provision for a long-term average rate of inflation.
3. Accrued Service
Service credited under the System which was rendered before the date of the actuarial
valuation.
4. Actuarial Equivalent
A single amount or series of amounts of equal actuarial value to another single amount or
series of amounts computed on the basis of appropriate actuarial assumptions.
5. Actuarial Funding Method
A mathematical budgeting procedure for allocating the dollar amount of the actuarial present
value of a retirement system benefit between future normal cost and actuarial accrued
liability. Sometimes this is referred to as the “actuarial cost method.”
6. Actuarial Gain/(Loss)
The difference between actual experience and actuarial assumption anticipated experience
during the period between two actuarial valuation dates.
7. Actuarial Present Value
The amount of funds currently required to provide a payment or series of payments in the
future. It is determined by discounting future payments at predetermined rates of interest, and
by probabilities of payment.

CITY OF PHILADELPHIA MUNICIPAL RETIREMENT SYSTEM
JULY 1, 2018 ACTUARIAL VALUATION
APPENDIX E – GLOSSARY OF TERMS
144
8. Adjusted Market Value of Assets
An asset value reflecting a five-year smoothing of asset gains and losses, as described in the
Philadelphia Municipal Code Title 22-311.
9. Amortization
This term represents the paying off an interest-discounted amount with periodic payments of
interest and principal—as opposed to paying off with a lump sum payment.
10. Normal Cost
The actuarial present value of retirement system benefits allocated to the current year by the
actuarial funding method.
11. Unfunded Actuarial Liability (UAL)
The difference between actuarial liability and valuation assets. This is sometimes referred to
as “unfunded actuarial accrued liability.”
Most retirement systems have unfunded actuarial liabilities. They typically arise each time
new benefits are added and each time experience gains/losses are realized.
The existence of unfunded actuarial accrued liability is not in itself an indicator of poor
funding. Also, unfunded actuarial liabilities do not represent a debt that is payable today.
What is important is the ability of the plan sponsor to contribute the annual amortized cost to
fund down the unfunded actuarial liability and the trend in unfunded actuarial liability
amount.


