City of Miami General Employees’ and Sanitation … EQUITY PERF REPORT.pdfEmployees’ and...
38
City of Miami General Employees’ and Sanitation Employees’ Retirement Trust Q2 2016
Transcript of City of Miami General Employees’ and Sanitation … EQUITY PERF REPORT.pdfEmployees’ and...

City of Miami General Employees’ and
Sanitation Employees’ Retirement Trust
Q2 2016

FIRM OVERVIEW PHILOSOPHY& PROCESS
INVESTMENT GUIDELINES
PERFORMANCE RESULTS
BOND MARKET REVIEW
INVESTMENT STRATEGY
PORTFOLIO REVIEW
APPENDIX 2
Introduction to Chicago Equity Partners
Experience More than 25 years of institutionally-focused investment management across equities and fixed income
Total of 39 employees with an average professional-level tenure at Chicago Equity Partners of 15 years
$9.6 billion in assets under management for more than 100 institutional clients around the world*
Discipline Focus on clearly-defined and process-oriented strategies which are repeatable and scalable
Deliberate approach to taking investment risks for which we believe our clients will be appropriately compensated
Long-standing commitment to continued innovation in our investment approach
Partnership Entire business platform built around delivering targeted solutions for sophisticated investors: we work with our clients to meet their investment objectives
Exceptional level of client service
Robust operational platform following industry best practices is the cornerstone of our long-term stability
*Assets under management as of June 30, 2016

FIRM OVERVIEW PHILOSOPHY& PROCESS
INVESTMENT GUIDELINES
PERFORMANCE RESULTS
BOND MARKET REVIEW
INVESTMENT STRATEGY
PORTFOLIO REVIEW
APPENDIX 3
Clients are our Top Priority
• AAA Allied Group, Inc.• Advocate Health Care• Bryan Health System• CHS Insurance, Ltd.• Consolidated Edison• The Dow Chemical Company• DTE Energy• Island Insurance Company, Ltd.• Marriott International, Inc.• NAMIC (National Association of Mutual Insurance
Companies)• The Sherwin Williams Company• Tempel Steel• ThedaCare Operating Fund• United Airlines• United Technologies Corporation• University Hospitals Health System• Walgreen Company• The Wooster Brush Company
• The Batchelor Foundation• Catholic Theological Union• Children’s Care Foundation• Diocese of Joliet• Diocese of Saginaw• The Diocese of St. Petersburgh• Dominican Sisters of Kenosha• Elks National Foundation• Friends Fiduciary Corporation• Gottlieb Memorial Foundation• The Hall-Perrine Foundation• Iowa Board of Regents• LaRabida Children’s Hospital• Lloyd A. Fry Foundation• Mennonite Education Agency• Misericordia Home Endowment• Missionary Servants of the Most Blessed Trinity• Moose Foundation
• Northwest Women’s Religious Investment Trust• Oklahoma Medical Research Foundation• Purdue University• The Regents of the University of Colorado• Rosalind Franklin University of Medicine and Science• Rush University Medical Center• Schoenstatt Sisters of Mary• Sisters of Charity of Saint Elizabeth New Jersey• Sisters of St. Casimir• Sisters of Saint Dominic• Sisters of Saint Francis of Assisi• The Smith Center for the Performing Arts• SSM International Finance• St. Procopius Abbey• Virginia Mennonite Retirement Community• Wallace H. Coulter Foundation
• Association of Washington Cities • California State Teachers’ Retirement System• The Chicago Housing Authority• City of Miami General Employees' and Sanitation
Employees' Retirement Trust• City of Springfield Police Pension Fund• Commonwealth of Massachusetts Deferred
Compensation Plan• Cook County Employees’ Annuity and Benefit Fund• Firemen’s Annuity and Benefit Fund of Chicago• Illinois State Board of Investment• Intergovernmental Risk Management Agency• Knox County Retirement System• Lake Forest Police Pension Fund• Los Angeles Fire & Police Pension System• Nevada Higher Education Pre-paid Tuition Program• Nevada State Treasurer• New Orleans (LA) Sewerage & Water Board Pension• Park Employees' Annuity & Benefit Fund of Chicago• Puerto Rico Government Employees and Judiciary
Retirement Systems
• Public School Retirement System of the City of St. Louis
• Retirement Plan for CTA Employees• State Universities Retirement System of Illinois• WorkSafeNB
• Bakery Drivers & Salesman Local 194& Industry Pension Fund
• Chicago Area I.B. Of T. Benefit Trust Funds • Chicago Regional Council of Carpenters Millmen
Pension Fund• Des Moines Iron Workers Local 67• District #9 I.A.M.A.W. Pension Trust• I.B.E.W. Local #9 and Outside Contractors Pension
Fund• Midwest Operating Engineers’ Welfare Fund• North Central Illinois Laborers Health & Welfare Fund• NYC Local 237 International Brotherhood of
Teamsters• Painters and Allied Trades District Council #35 Trust
Funds• Southern States Savings and Retirement Plan Trust• Teamsters Local #705 Pension and
Health & Welfare Funds• Uniformed Firefighter's Association (NYC)
• AMG Funds • Bank of Hawaii• Jackson National Asset Management, LLC
The above client list is a representative sample of clients with assetsof $5 million or greater under management who have given CEPpermission to use their name as of June 30, 2016. It is not knownwhether the listed clients approve or disapprove of Chicago EquityPartners or the advisory services provided.
Corporations
Endowments & Foundations
Public Funds
Taft-Hartley
Mutual Funds / Subadvisory
FIRM OVERVIEW PHILOSOPHY& PROCESS
INVESTMENT GUIDELINES
PERFORMANCE RESULTS
BOND MARKET REVIEW
INVESTMENT STRATEGY
PORTFOLIO REVIEW
APPENDIX 4
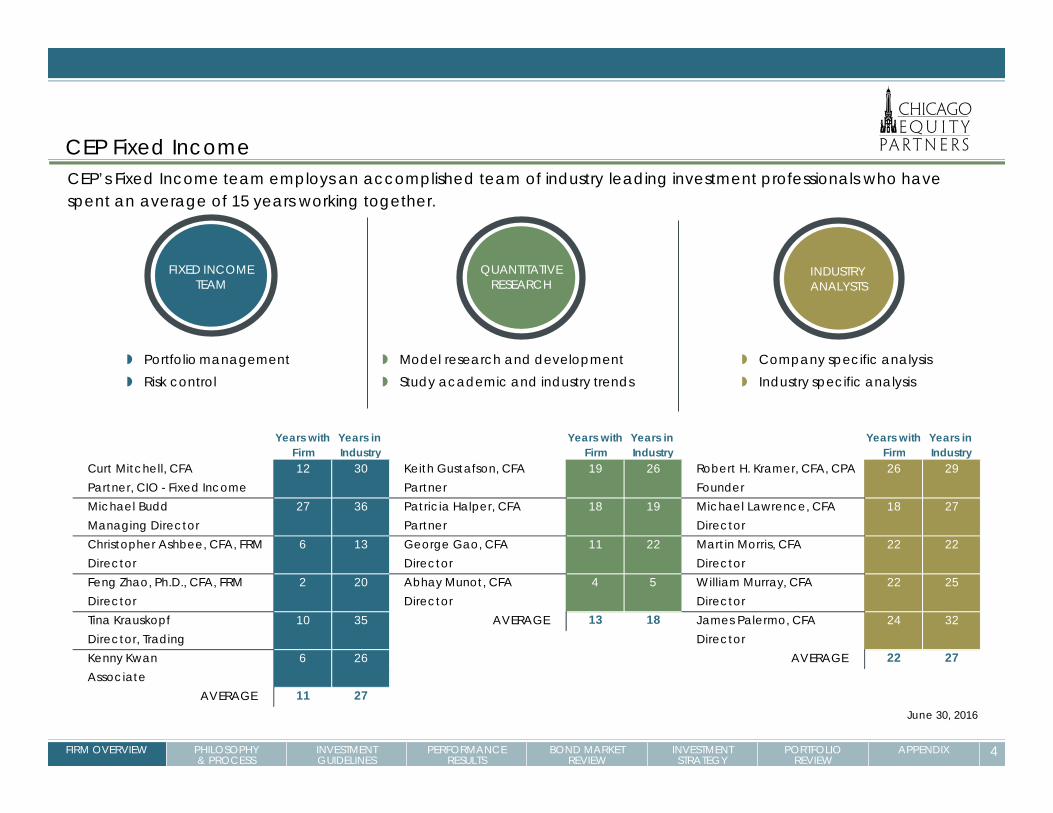
CEP Fixed IncomeCEP’s Fixed Income team employs an accomplished team of industry leading investment professionals who have spent an average of 15 years working together.
FIXED INCOMETEAM
QUANTITATIVERESEARCH
INDUSTRY ANALYSTS
Portfolio management Risk control
Model research and development Study academic and industry trends
Company specific analysis Industry specific analysis
Years with Years in Years with Years in Years with Years in Firm Industry Firm Industry Firm Industry
Curt Mitchell, CFA 12 30 Keith Gustafson, CFA 19 26 Robert H. Kramer, CFA, CPA 26 29Partner, CIO - Fixed Income Partner FounderMichael Budd 27 36 Patricia Halper, CFA 18 19 Michael Lawrence, CFA 18 27Managing Director Partner DirectorChristopher Ashbee, CFA, FRM 6 13 George Gao, CFA 11 22 Martin Morris, CFA 22 22Director Director DirectorFeng Zhao, Ph.D., CFA, FRM 2 20 Abhay Munot, CFA 4 5 William Murray, CFA 22 25Director Director DirectorTina Krauskopf 10 35 AVERAGE 13 18 James Palermo, CFA 24 32Director, Trading DirectorKenny Kwan 6 26 AVERAGE 22 27Associate
AVERAGE 11 27June 30, 2016
FIRM OVERVIEW PHILOSOPHY& PROCESS
INVESTMENT GUIDELINES
PERFORMANCE RESULTS
BOND MARKET REVIEW
INVESTMENT STRATEGY
PORTFOLIO REVIEW
APPENDIX 5
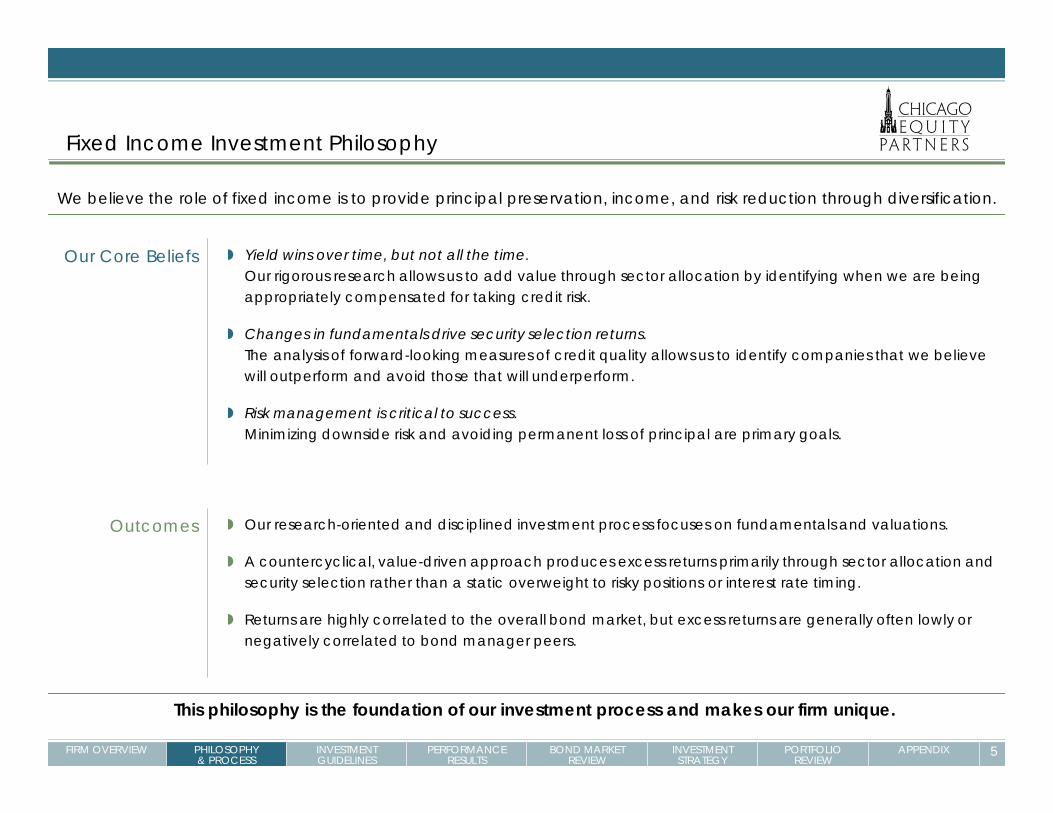
Fixed Income Investment Philosophy
Our Core Beliefs Yield wins over time, but not all the time.Our rigorous research allows us to add value through sector allocation by identifying when we are being appropriately compensated for taking credit risk.
Changes in fundamentals drive security selection returns.The analysis of forward-looking measures of credit quality allows us to identify companies that we believe will outperform and avoid those that will underperform.
Risk management is critical to success.Minimizing downside risk and avoiding permanent loss of principal are primary goals.
Outcomes Our research-oriented and disciplined investment process focuses on fundamentals and valuations.
A countercyclical, value-driven approach produces excess returns primarily through sector allocation and security selection rather than a static overweight to risky positions or interest rate timing.
Returns are highly correlated to the overall bond market, but excess returns are generally often lowly or negatively correlated to bond manager peers.
We believe the role of fixed income is to provide principal preservation, income, and risk reduction through diversification.
This philosophy is the foundation of our investment process and makes our firm unique.
FIRM OVERVIEW PHILOSOPHY& PROCESS
INVESTMENT GUIDELINES
PERFORMANCE RESULTS
BOND MARKET REVIEW
INVESTMENT STRATEGY
PORTFOLIO REVIEW
APPENDIX 6
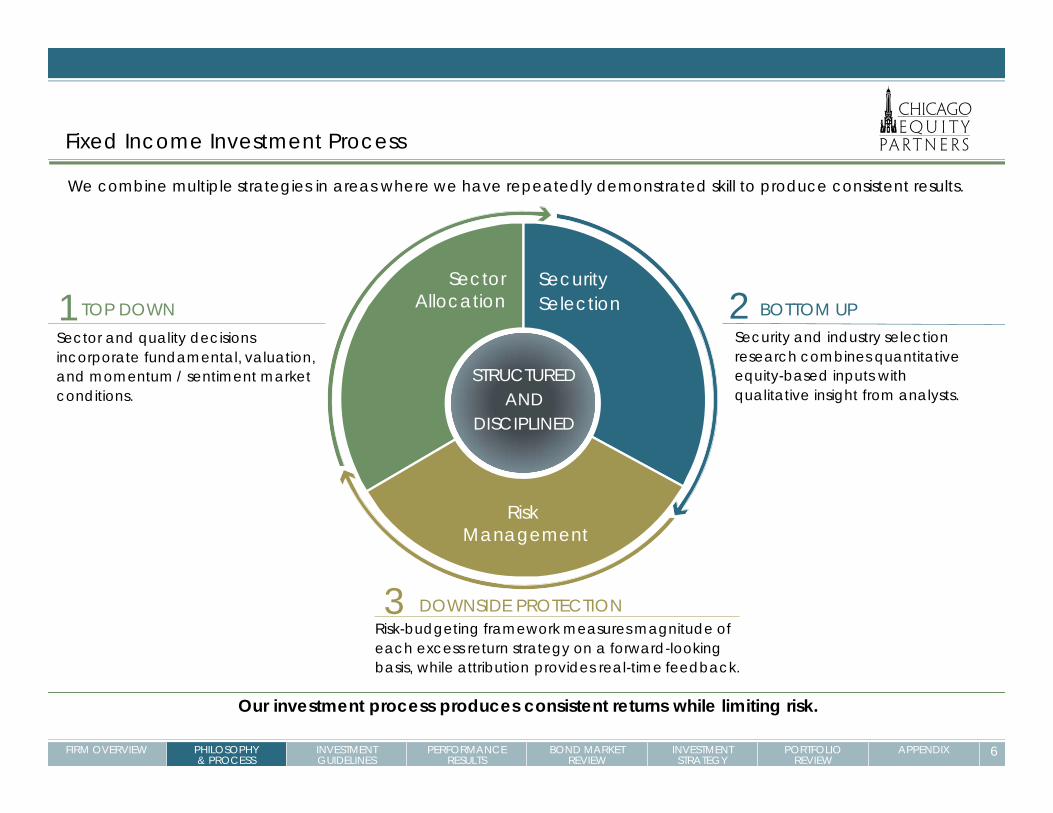
Fixed Income Investment Process
SectorAllocation
Sector and quality decisions incorporate fundamental, valuation, and momentum / sentiment market conditions.
Security Selection
Risk-budgeting framework measures magnitude of each excess return strategy on a forward-looking basis, while attribution provides real-time feedback.
2
Risk Management
3
1STRUCTURED
ANDDISCIPLINED
Security and industry selection research combines quantitative equity-based inputs with qualitative insight from analysts.
We combine multiple strategies in areas where we have repeatedly demonstrated skill to produce consistent results.
TOP DOWN BOTTOM UP
DOWNSIDE PROTECTION
Our investment process produces consistent returns while limiting risk.

FIRM OVERVIEW PHILOSOPHY& PROCESS
INVESTMENT GUIDELINES
PERFORMANCE RESULTS
BOND MARKET REVIEW
INVESTMENT STRATEGY
PORTFOLIO REVIEW
APPENDIX 7
Investment Guidelines
High Quality Intermediate Fixed Income
Benchmark Barclays Intermediate Government Credit Index
Fixed Income Securities
The fixed income portion of the Trust shall be invested in marketable, fixed income securities. Corporate bond issues shall be diversified by industry and in number so that no investment in the securities of a single issue shall exceed 7% (at market) of the value of the portfolio. Single industry weightings will be a maximum of 25%, except US Government and agency securities.
Fixed income investments are expected to preserve capital and provide a high level of income on a consistent basis.
The fixed income investments shall be appropriately diversified although the investment manager may engage in "active" bond management. It is therefore anticipated that there may be turnover as shifts are made between and within sectors, quality and maturity.
Average duration of the fixed income asset class will be targeted within a range of three to ten years. Each manager is expected to keep duration at +/- one year of the benchmark duration.
Permissible Direct Investments:
Commercial Paper of only the highest quality shall be used when invested on an individual basis Certificates of Deposit of the top 100 national banks, so long as they are stated on the Controller's list Bankers Acceptances United States Treasury Bonds, Notes and Bills

FIRM OVERVIEW PHILOSOPHY& PROCESS
INVESTMENT GUIDELINES
PERFORMANCE RESULTS
BOND MARKET REVIEW
INVESTMENT STRATEGY
PORTFOLIO REVIEW
APPENDIX 8
Investment Guidelines
Permissible Direct Investments:
Repurchase agreements with U.S. Treasury Securities and agencies of the U.S. Government as collateral (marking to the market daily). The investment policy shall require all approved institutions and dealers transacting repurchase agreements to execute and perform as stated in the Master Repurchase Agreement. All repurchase agreement transactions shall adhere to the requirements of the Master Repurchase Agreement.
Debt instruments issued or backed by agencies of/or guaranteed by the U.S. Government All investment grade corporate debt issues including those rated Baa3/BBB- better by Moody's Investors
Services and/or Standard and Poors Corporation. In the case of a split rating, the higher rating shall apply. Securities downgraded subsequent to purchase resulting in violations of quality guidelines may be held at the manager's discretion subject to the high yield limitations indicated below.
Mortgages, including agency, non-agency, commercial backed securities and CMO’s (as long as all other provisions are met).
Futures (but must not exceed 15% without prior approval by the Board) and Options. However, these securities may not be used to leverage or hedge the portfolio.
Preferred Stock Municipal Bonds Asset backed securities Yankee bonds/foreign credits Commingled and mutual funds Eurodollar bonds 20% maximum of each manager’s portfolio may be invested in aggregate to Yankee bonds, Foreign credits,
Eurodollar bonds and Rule 144A Securities. 20% maximum of each manager’s portfolio may be invested in high yield securities (with ratings of CCC or
better).
FIRM OVERVIEW PHILOSOPHY& PROCESS
INVESTMENT GUIDELINES
PERFORMANCE RESULTS
BOND MARKET REVIEW
INVESTMENT STRATEGY
PORTFOLIO REVIEW
APPENDIX 9
Investment Guidelines
Excluded Direct Investments:Private Placements
Debt to Equity exchanges
Investment managers are not authorized to use derivative securities, or strategies that do not comply with the basic investment objectives of this policy, i.e., an emphasis on the preservation of principal consistent with conservative growth of assets. Managers are specifically prohibited from using derivative or synthetic securities whose characteristics as implemented by the manager include potentially high price volatility and whose returns are speculative or leveraged (when considered together with liquid/short-term securities positions) or whose marketability may be severely limited, without written authority from the Board.
10FIRM OVERVIEW PHILOSOPHY& PROCESS
INVESTMENT GUIDELINES
PERFORMANCE RESULTS
BOND MARKET REVIEW
INVESTMENT STRATEGY
PORTFOLIO REVIEW
APPENDIX 10
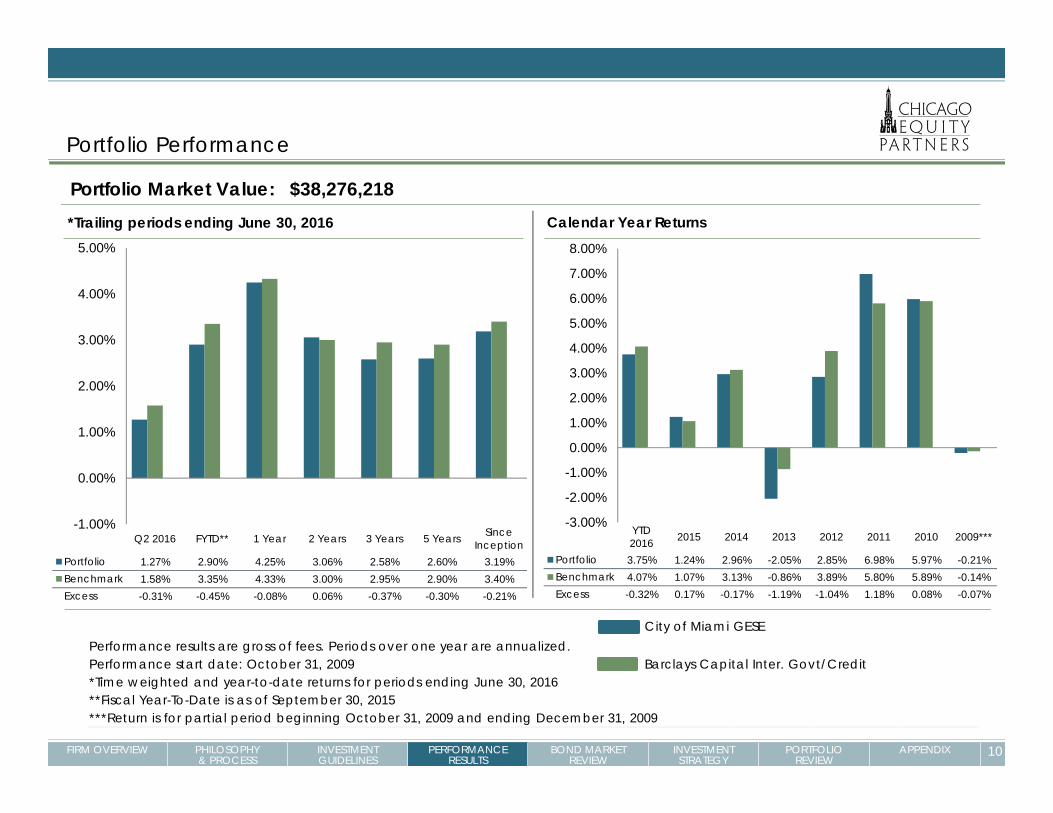
Portfolio Performance
*Trailing periods ending June 30, 2016
-1.00%
0.00%
1.00%
2.00%
3.00%
4.00%
5.00%
Q2 2016 FYTD** 1 Year 2 Years 3 Years 5 Years SinceInception
Portfolio 1.27% 2.90% 4.25% 3.06% 2.58% 2.60% 3.19%Benchmark 1.58% 3.35% 4.33% 3.00% 2.95% 2.90% 3.40%Excess -0.31% -0.45% -0.08% 0.06% -0.37% -0.30% -0.21%
-3.00%
-2.00%
-1.00%
0.00%
1.00%
2.00%
3.00%
4.00%
5.00%
6.00%
7.00%
8.00%
YTD2016 2015 2014 2013 2012 2011 2010 2009***
Portfolio 3.75% 1.24% 2.96% -2.05% 2.85% 6.98% 5.97% -0.21%Benchmark 4.07% 1.07% 3.13% -0.86% 3.89% 5.80% 5.89% -0.14%Excess -0.32% 0.17% -0.17% -1.19% -1.04% 1.18% 0.08% -0.07%
Calendar Year Returns
Portfolio Market Value: $38,276,218
Performance results are gross of fees. Periods over one year are annualized.Performance start date: October 31, 2009*Time weighted and year-to-date returns for periods ending June 30, 2016**Fiscal Year-To-Date is as of September 30, 2015***Return is for partial period beginning October 31, 2009 and ending December 31, 2009
Barclays Capital Inter. Govt/Credit
City of Miami GESE
11FIRM OVERVIEW PHILOSOPHY& PROCESS
INVESTMENT GUIDELINES
PERFORMANCE RESULTS
BOND MARKET REVIEW
INVESTMENT STRATEGY
PORTFOLIO REVIEW
APPENDIX 11
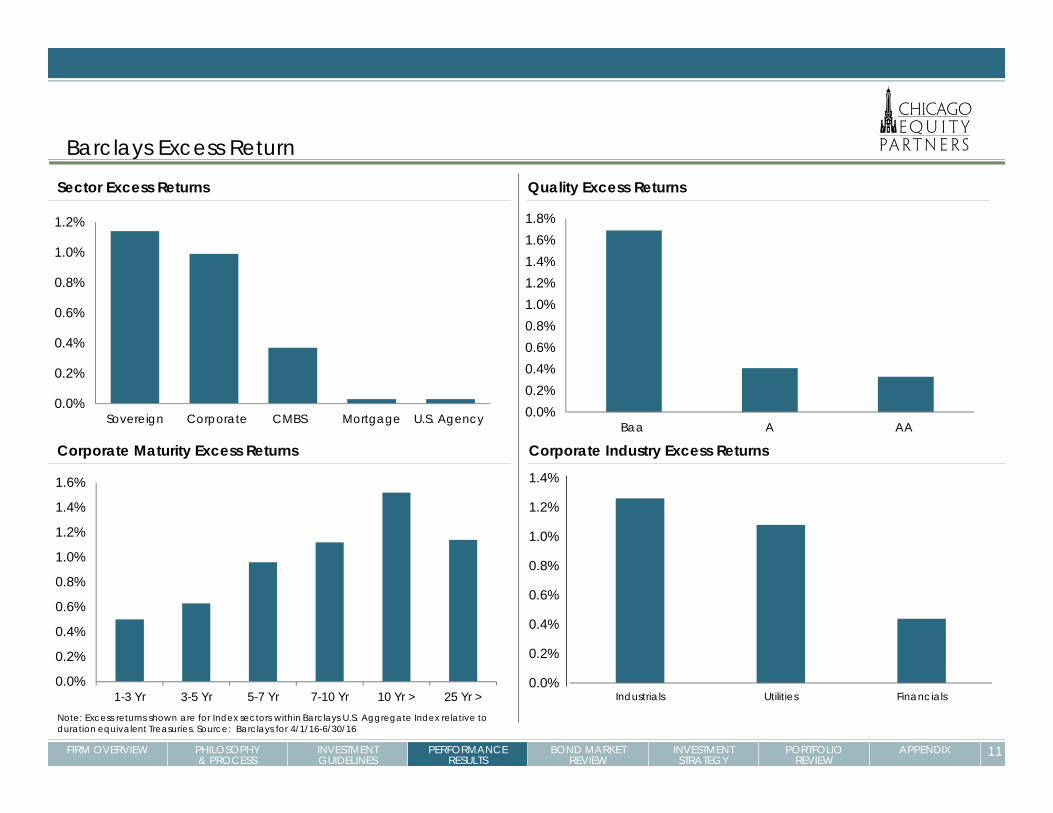
Barclays Excess Return
Sector Excess Returns
0.0%
0.2%
0.4%
0.6%
0.8%
1.0%
1.2%
Sovereign Corporate CMBS Mortgage U.S. Agency
Corporate Maturity Excess Returns
0.0%
0.2%
0.4%
0.6%
0.8%
1.0%
1.2%
1.4%
1.6%
1-3 Yr 3-5 Yr 5-7 Yr 7-10 Yr 10 Yr > 25 Yr >
Corporate Industry Excess Returns
0.0%
0.2%
0.4%
0.6%
0.8%
1.0%
1.2%
1.4%
FinancialsUtilitiesIndustrials
Quality Excess Returns
0.0%0.2%0.4%0.6%0.8%1.0%1.2%1.4%1.6%1.8%
Baa A AA
Note: Excess returns shown are for Index sectors within Barclays U.S. Aggregate Index relative to duration equivalent Treasuries. Source: Barclays for 4/1/16-6/30/16

12FIRM OVERVIEW PHILOSOPHY& PROCESS
INVESTMENT GUIDELINES
PERFORMANCE RESULTS
BOND MARKET REVIEW
INVESTMENT STRATEGY
PORTFOLIO REVIEW
APPENDIX 12
High Quality Intermediate Fixed Income Excess Return
Outperformance
Underperformance
High Quality Intermediate Vs. Barclays Intermediate Government/Credit IndexRolling 5 year gross returns since inception (Q1 1996)*
See attached disclosure in the Appendix. Supplemental information offered is in addition to our performance presentation data and disclosures. Past performance is not indicative of future results. * Data is based on quarterly five year rolling annualized returns since inception through 6.30.16.
2.0%
3.0%
4.0%
5.0%
6.0%
7.0%
8.0%
9.0%
2.0% 3.0% 4.0% 5.0% 6.0% 7.0% 8.0%
High
Qua
lity
Inte
rmed
iate
Barclays Capital Int Govt/Credit
FIRM OVERVIEW PHILOSOPHY& PROCESS
INVESTMENT GUIDELINES
PERFORMANCE RESULTS
BOND MARKET REVIEW
INVESTMENT STRATEGY
PORTFOLIO REVIEW
APPENDIX 13
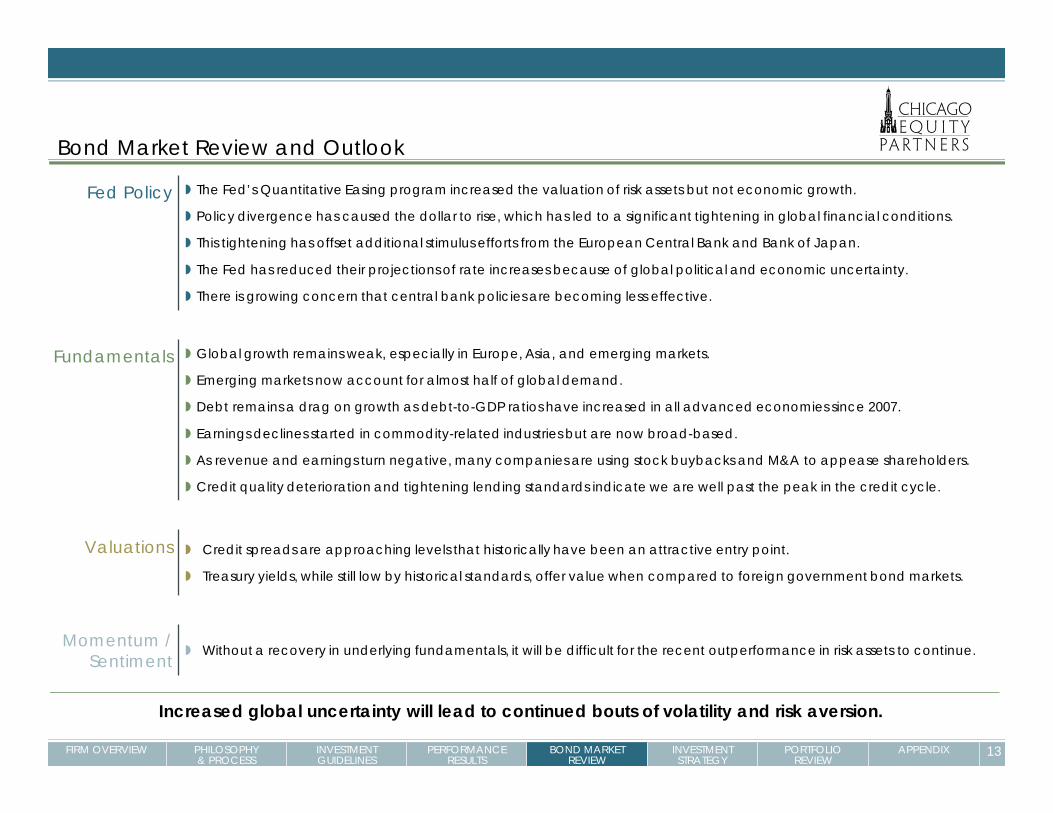
Bond Market Review and Outlook
Fed Policy The Fed’s Quantitative Easing program increased the valuation of risk assets but not economic growth.
Policy divergence has caused the dollar to rise, which has led to a significant tightening in global financial conditions.
This tightening has offset additional stimulus efforts from the European Central Bank and Bank of Japan.
The Fed has reduced their projections of rate increases because of global political and economic uncertainty.
There is growing concern that central bank policies are becoming less effective.
Fundamentals Global growth remains weak, especially in Europe, Asia, and emerging markets.
Emerging markets now account for almost half of global demand.
Debt remains a drag on growth as debt-to-GDP ratios have increased in all advanced economies since 2007.
Earnings declines started in commodity-related industries but are now broad-based.
As revenue and earnings turn negative, many companies are using stock buybacks and M&A to appease shareholders.
Credit quality deterioration and tightening lending standards indicate we are well past the peak in the credit cycle.
Valuations Credit spreads are approaching levels that historically have been an attractive entry point.
Treasury yields, while still low by historical standards, offer value when compared to foreign government bond markets.
Momentum /Sentiment
Without a recovery in underlying fundamentals, it will be difficult for the recent outperformance in risk assets to continue.
Increased global uncertainty will lead to continued bouts of volatility and risk aversion.

FIRM OVERVIEW PHILOSOPHY& PROCESS
INVESTMENT GUIDELINES
PERFORMANCE RESULTS
BOND MARKET REVIEW
INVESTMENT STRATEGY
PORTFOLIO REVIEW
APPENDIX 14
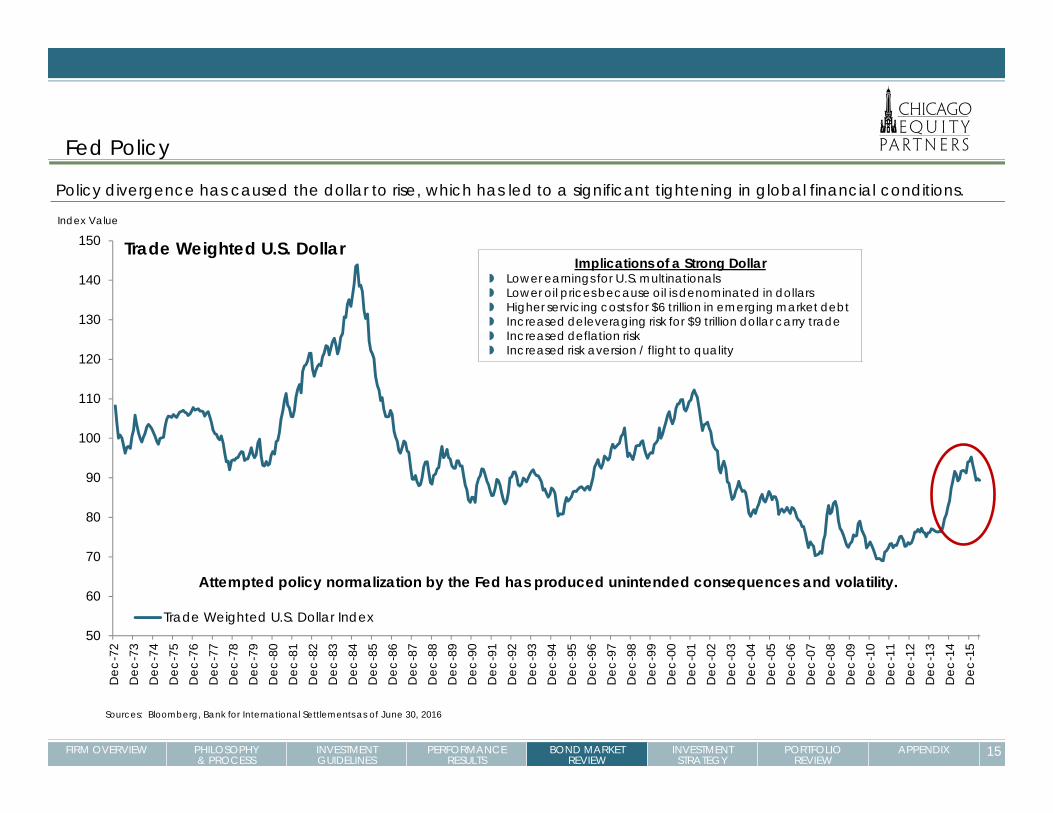
Fed Policy
Fed estimates for rate increases have come down this year but are still higher than market expectations.
0.3%
0.5%
0.7%
0.9%
1.1%
1.3%
1.5%
Jun-15 Jul-15 Aug-15 Sep-15 Oct-15 Nov-15 Dec-15 Jan-16 Feb-16 Mar-16 Apr-16 May-16 Jun-16
Fed Funds Futures December 2016
Market Implied Fed Funds Rate by December 2016
Federal Reserve Median Projections of Fed Funds Rate by December 2016
Source: Bloomberg as of July 1, 2016
0.9%
0.4%
1.4%On 12/31/15
On 3/31/16 & 6/30/16
FIRM OVERVIEW PHILOSOPHY& PROCESS
INVESTMENT GUIDELINES
PERFORMANCE RESULTS
BOND MARKET REVIEW
INVESTMENT STRATEGY
PORTFOLIO REVIEW
APPENDIX 15
Policy divergence has caused the dollar to rise, which has led to a significant tightening in global financial conditions.
50
60
70
80
90
100
110
120
130
140
150
Dec
-72
Dec
-73
Dec
-74
Dec
-75
Dec
-76
Dec
-77
Dec
-78
Dec
-79
Dec
-80
Dec
-81
Dec
-82
Dec
-83
Dec
-84
Dec
-85
Dec
-86
Dec
-87
Dec
-88
Dec
-89
Dec
-90
Dec
-91
Dec
-92
Dec
-93
Dec
-94
Dec
-95
Dec
-96
Dec
-97
Dec
-98
Dec
-99
Dec
-00
Dec
-01
Dec
-02
Dec
-03
Dec
-04
Dec
-05
Dec
-06
Dec
-07
Dec
-08
Dec
-09
Dec
-10
Dec
-11
Dec
-12
Dec
-13
Dec
-14
Dec
-15
Trade Weighted U.S. Dollar Index
Implications of a Strong Dollar Lower earnings for U.S. multinationals Lower oil prices because oil is denominated in dollars Higher servicing costs for $6 trillion in emerging market debt Increased deleveraging risk for $9 trillion dollar carry trade Increased deflation risk Increased risk aversion / flight to quality
Sources: Bloomberg, Bank for International Settlements as of June 30, 2016
Attempted policy normalization by the Fed has produced unintended consequences and volatility.
Index Value
Trade Weighted U.S. Dollar
Fed Policy

FIRM OVERVIEW PHILOSOPHY& PROCESS
INVESTMENT GUIDELINES
PERFORMANCE RESULTS
BOND MARKET REVIEW
INVESTMENT STRATEGY
PORTFOLIO REVIEW
APPENDIX 16
Fundamentals
Growth in government and nonfinancial corporate debt has offset deleveraging in the financial and household sectors.
0
2,000
4,000
6,000
8,000
10,000
12,000
14,000
16,000
18,000
20,000
Dec
-90
Dec
-92
Dec
-94
Dec
-96
Dec
-98
Dec
-00
Dec
-02
Dec
-04
Dec
-06
Dec
-08
Dec
-10
Dec
-12
Dec
-14
Government Debt
Financial Corporate DebtHousehold Debt
Non-Financial Corporate Debt
Sources: Federal Reserve, Bloomberg as of March 31, 2016
$Billions
Leverage

FIRM OVERVIEW PHILOSOPHY& PROCESS
INVESTMENT GUIDELINES
PERFORMANCE RESULTS
BOND MARKET REVIEW
INVESTMENT STRATEGY
PORTFOLIO REVIEW
APPENDIX 17
FundamentalsOutside of recessions, significant earnings declines in the S&P 500 are rare.
Source: Standard & Poor’s, NBER, and FactSet as of June 30, 2016
-11.6%
-80% -70% -60% -50% -40% -30% -20% -10% 0% 10%
TelecomConsumer Disc
UtilitiesHealthcare
Consumer StaplesIndustrialsFinancials
S&P 500Info TechMaterials
Energy
Earnings declines started with commodity-related industries but are now broad-based.S&P 500 Q2 2016 Earnings Estimates
S&P 500 12-Month Operating EPS Year-over-Year Percent Change
Shaded areas represent recessions-50%
-25%
0%
25%
50%
75%
100%
Dec-89 Dec-91 Dec-93 Dec-95 Dec-97 Dec-99 Dec-01 Dec-03 Dec-05 Dec-07 Dec-09 Dec-11 Dec-13 Dec-15

FIRM OVERVIEW PHILOSOPHY& PROCESS
INVESTMENT GUIDELINES
PERFORMANCE RESULTS
BOND MARKET REVIEW
INVESTMENT STRATEGY
PORTFOLIO REVIEW
APPENDIX 18
Fundamentals
-1.0
-0.8
-0.6
-0.4
-0.2
0.0
0.2
0.4
0.6
0.8
1.0
Jun-
81
Jun-
82
Jun-
83
Jun-
84
Jun-
85
Jun-
86
Jun-
87
Jun-
88
Jun-
89
Jun-
90
Jun-
91
Jun-
92
Jun-
93
Jun-
94
Jun-
95
Jun-
96
Jun-
97
Jun-
98
Jun-
99
Jun-
00
Jun-
01
Jun-
02
Jun-
03
Jun-
04
Jun-
05
Jun-
06
Jun-
07
Jun-
08
Jun-
09
Jun-
10
Jun-
11
Jun-
12
Jun-
13
Jun-
14
Jun-
15
Jun-
16
Chicago Fed National Activity Diffusion Index
Given where we are in the current business cycle, it is prudent to be cautious in the near-term but looking for opportunities over the intermediate-term.
Source: Bloomberg as of June 30, 2016
Mid-Cycle Slowdown Mid-Cycle Slowdown
Mid-Cycle Slowdown
Mid-Cycle Slowdown
RECESSION RECESSION
RECESSION
RECESSION
Recession Threshold

FIRM OVERVIEW PHILOSOPHY& PROCESS
INVESTMENT GUIDELINES
PERFORMANCE RESULTS
BOND MARKET REVIEW
INVESTMENT STRATEGY
PORTFOLIO REVIEW
APPENDIX 19
Stock buybacks are at the highest level since 2007.
17%
15%13%
16% 16%
23%
29%30%
34%
23%
13%
21%
24%
22%
25%26%
30%
0%
10%
20%
30%
40%
1999
2000
2001
2002
2003
2004
2005
2006
2007
2008
2009
2010
2011
2012
2013
2014
2015
Source: Goldman Sachs
0.8
1.1
1.5
2.3
3.1
3.5
1.8
1.31.4
2.1
2.9
3.9
4.6
3.3
2.3
2.7
5.0
2.72.8
3.6
0.0
1.0
2.0
3.0
4.0
5.0
1995
1996
1997
1998
1999
2000
2001
2002
2003
2004
2005
2006
2007
2008
2009
2010
2011
2012
2013
2014
2015
Sources: CreditSights, Dealogic
$Trillions
Deal activity, which has been mostly financed with cheap debt, is at historical highs as earnings growth falters.
Share Buybacks Percent of Total Cash Use M&A Volumes
Fundamentals
FIRM OVERVIEW PHILOSOPHY& PROCESS
INVESTMENT GUIDELINES
PERFORMANCE RESULTS
BOND MARKET REVIEW
INVESTMENT STRATEGY
PORTFOLIO REVIEW
APPENDIX 20
Fundamentals
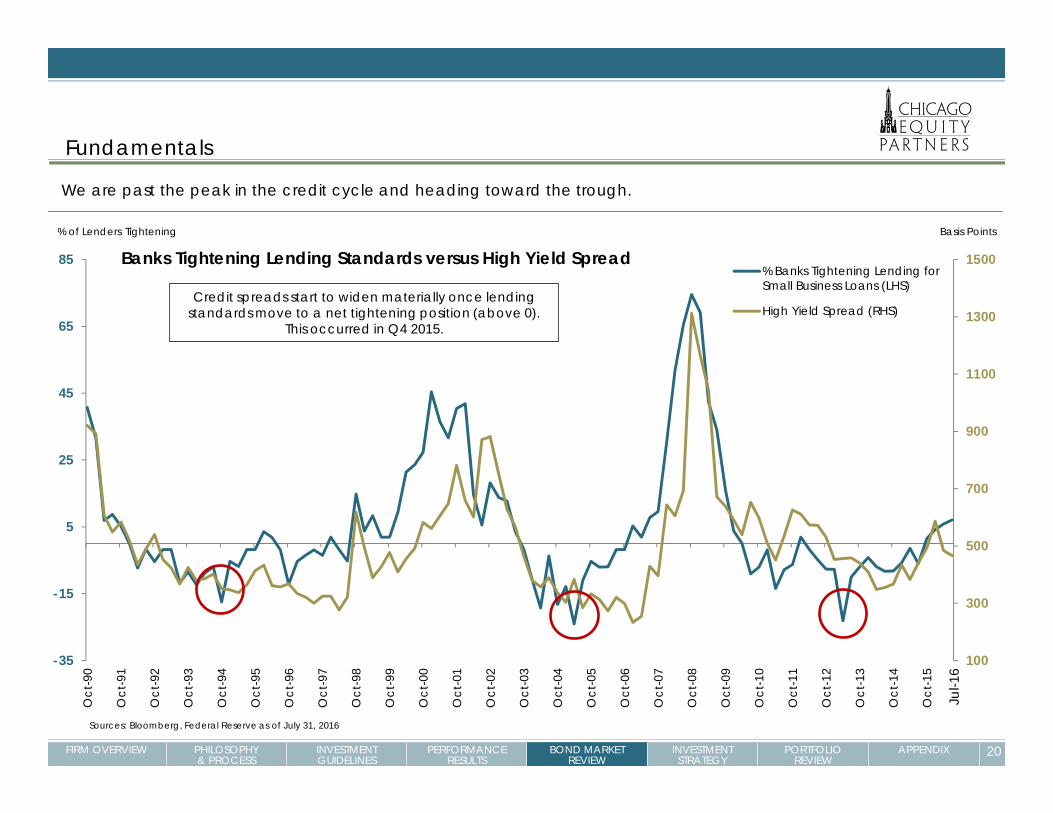
We are past the peak in the credit cycle and heading toward the trough.
Sources: Bloomberg, Federal Reserve as of July 31, 2016
100
300
500
700
900
1100
1300
1500
-35
-15
5
25
45
65
85
Oct
-90
Oct
-91
Oct
-92
Oct
-93
Oct
-94
Oct
-95
Oct
-96
Oct
-97
Oct
-98
Oct
-99
Oct
-00
Oct
-01
Oct
-02
Oct
-03
Oct
-04
Oct
-05
Oct
-06
Oct
-07
Oct
-08
Oct
-09
Oct
-10
Oct
-11
Oct
-12
Oct
-13
Oct
-14
Oct
-15
% Banks Tightening Lending forSmall Business Loans (LHS)
High Yield Spread (RHS)
% of Lenders Tightening Basis Points
Banks Tightening Lending Standards versus High Yield Spread
Credit spreads start to widen materially once lending standards move to a net tightening position (above 0).
This occurred in Q4 2015.
Jul-1
6

FIRM OVERVIEW PHILOSOPHY& PROCESS
INVESTMENT GUIDELINES
PERFORMANCE RESULTS
BOND MARKET REVIEW
INVESTMENT STRATEGY
PORTFOLIO REVIEW
APPENDIX 21
Valuations
0
100
200
300
400
500
600
700
Dec
-89
Dec
-90
Dec
-91
Dec
-92
Dec
-93
Dec
-94
Dec
-95
Dec
-96
Dec
-97
Dec
-98
Dec
-99
Dec
-00
Dec
-01
Dec
-02
Dec
-03
Dec
-04
Dec
-05
Dec
-06
Dec
-07
Dec
-08
Dec
-09
Dec
-10
Dec
-11
Dec
-12
Dec
-13
Dec
-14
Dec
-15
Barclays Corporate Spread Index
Investment grade corporate spreads do not adequately compensate investors for global risks.
Basis Points
Stock Market Crash
QE1
Source: Barclays as of June 30, 2016
Recession
Subprime Crisis
Worldcom
Recession
LTCMS&L CrisisQE29/11
QE3
GM/Ford Downgrades
Current Spread 156 bpsAverage Since 6/30/07 195 bpsLong Term Average 135 bps
QE3 Ends
0
100
200
300
Dec
-11
Jun-
12
Dec
-12
Jun-
13
Dec
-13
Jun-
14
Dec
-14
Jun-
15
Dec
-15
Jun-
16
AAAAAABAA

FIRM OVERVIEW PHILOSOPHY& PROCESS
INVESTMENT GUIDELINES
PERFORMANCE RESULTS
BOND MARKET REVIEW
INVESTMENT STRATEGY
PORTFOLIO REVIEW
APPENDIX 22
ValuationsU.S. Treasury yields, while low by historical standards, remain attractive relative to global peers.
Source: Bloomberg as of June 30, 2016Note: Swedish 3Y Bond Yield is interpolated because no bond with that maturity exists
1 Year 3 Year 5 Year 10 Year 30 Year
12/31/15 0.60% 1.31% 1.76% 2.27% 3.02%
6/30/16 0.44% 0.69% 1.00% 1.47% 2.29%
Change in YTD Yields -0.17% -0.61% -0.76% -0.80% -0.73%
0.0%
1.0%
2.0%
3.0%
Dec
-06
Dec
-07
Dec
-08
Dec
-09
Dec
-10
Dec
-11
Dec
-12
Dec
-13
Dec
-14
Dec
-15
PCE Core Price Index (YOY% Change)Fed Inflation Target
Global Government Bond Yields PCE Core Price Index
As of 6/30/16 2Y 3Y 5Y 10Y
Switzerland -1.186 -1.171 -1.051 -0.613
Germany -0.663 -0.663 -0.569 -0.131
Netherlands -0.599 -0.576 -0.422 0.083
Japan -0.300 -0.290 -0.312 -0.222
Sweden -0.632 -0.519 -0.292 0.249
France -0.548 -0.520 -0.356 0.181
Italy -0.114 -0.043 0.291 1.256
Spain -0.202 -0.123 0.179 1.160
UK 0.091 0.160 0.346 0.864
United States 0.584 0.694 1.000 1.471
U.S. Treasury Yield Curve
FIRM OVERVIEW PHILOSOPHY& PROCESS
INVESTMENT GUIDELINES
PERFORMANCE RESULTS
BOND MARKET REVIEW
INVESTMENT STRATEGY
PORTFOLIO REVIEW
APPENDIX 23
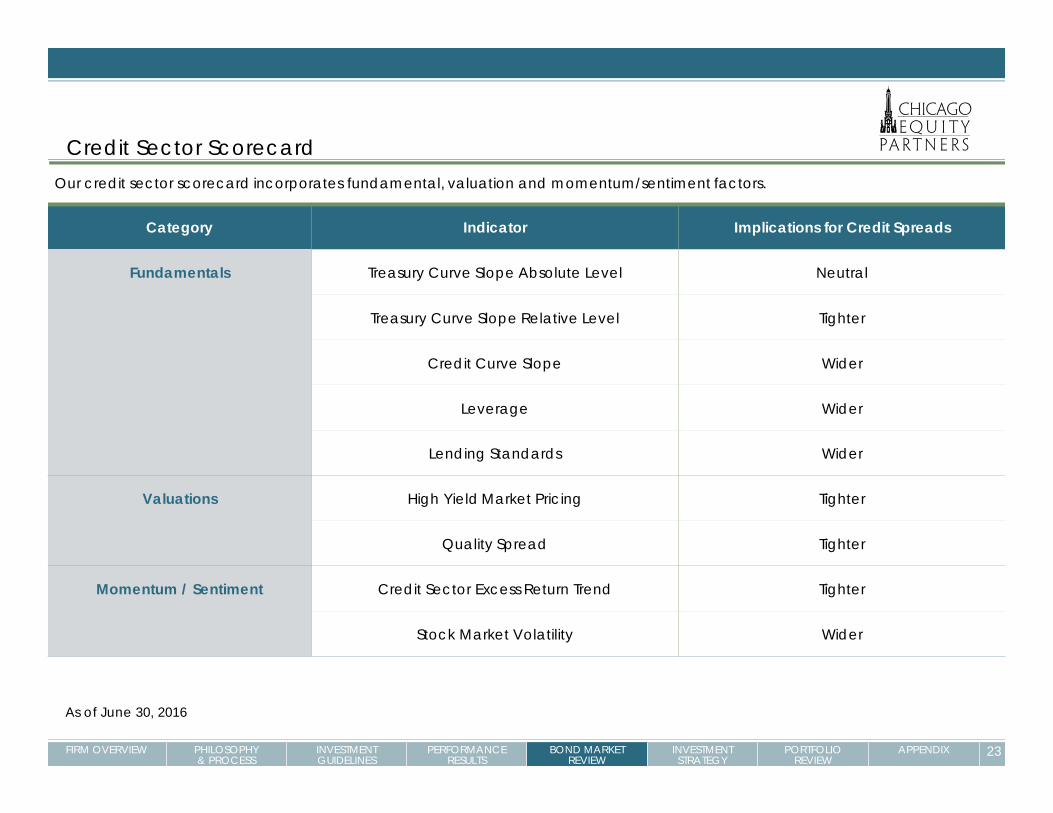
Credit Sector Scorecard
Category Indicator Implications for Credit Spreads
Fundamentals Treasury Curve Slope Absolute Level Neutral
Treasury Curve Slope Relative Level Tighter
Credit Curve Slope Wider
Leverage Wider
Lending Standards Wider
Valuations High Yield Market Pricing Tighter
Quality Spread Tighter
Momentum / Sentiment Credit Sector Excess Return Trend Tighter
Stock Market Volatility Wider
Our credit sector scorecard incorporates fundamental, valuation and momentum/sentiment factors.
As of June 30, 2016

FIRM OVERVIEW PHILOSOPHY& PROCESS
INVESTMENT GUIDELINES
PERFORMANCE RESULTS
BOND MARKET REVIEW
INVESTMENT STRATEGY
PORTFOLIO REVIEW
APPENDIX 24
Credit Sector Allocation Decisions: 2006-Present
0
100
200
300
400
500
600
700
Dec
-06
Dec
-07
Dec
-08
Dec
-09
Dec
-10
Dec
-11
Dec
-12
Dec
-13
Dec
-14
Dec
-15
Barclays Investment Grade Corporate Spread
Our disciplined sector allocation process has been successful over full market cycles.
Trend Reversal as Market Reacts to
End of QE
Beginning of Central Bank “whatever it
takes” policies
Our only periods of underperformance
are when investors are “reaching for yield.”
UNDERWEIGHT OVERWEIGHT UNDERWEIGHT
Source: Barclays as of June 30, 2016
FIRM OVERVIEW PHILOSOPHY& PROCESS
INVESTMENT GUIDELINES
PERFORMANCE RESULTS
BOND MARKET REVIEW
INVESTMENT STRATEGY
PORTFOLIO REVIEW
APPENDIX 25
Investment Strategy and Portfolio Positioning
We are selectively adding to credit
Uncertainty remains over the sustainability of an economic recovery without continued government support.
QE distorted the valuation of risk assets and spread levels are now moving wider to better reflect weak fundamentals.
We will monitor inputs to our investment process for indications of improving conditions and opportunities.
Corporate holdings are focused on high quality, liquid issues
Energy has been underweighted and holdings emphasize the major integrated issuers.
Negative event risk from shareholder enhancement and M&A activity continues to be a headwind for credit investors.
Large capitalization issuers have been emphasized.
Underweights include banks, foreign/sovereign, lower quality, and illiquid issuers.
Governments provide liquidity and stability
Governments are overweighted to provide liquidity for opportunities in credit.
This will serve us well in an environment of greatly reduced liquidity.
Duration / Yield Curve
Increased interest rate volatility due to uncertainty regarding the Fed’s actions is likely.
This has led us to maintain duration and maturity distributions close to the benchmark.
We believe we are well-positioned to increase our credit exposure opportunistically in coming months.
FIRM OVERVIEW PHILOSOPHY& PROCESS
INVESTMENT GUIDELINES
PERFORMANCE RESULTS
BOND MARKET REVIEW
INVESTMENT STRATEGY
PORTFOLIO REVIEW
APPENDIX 26
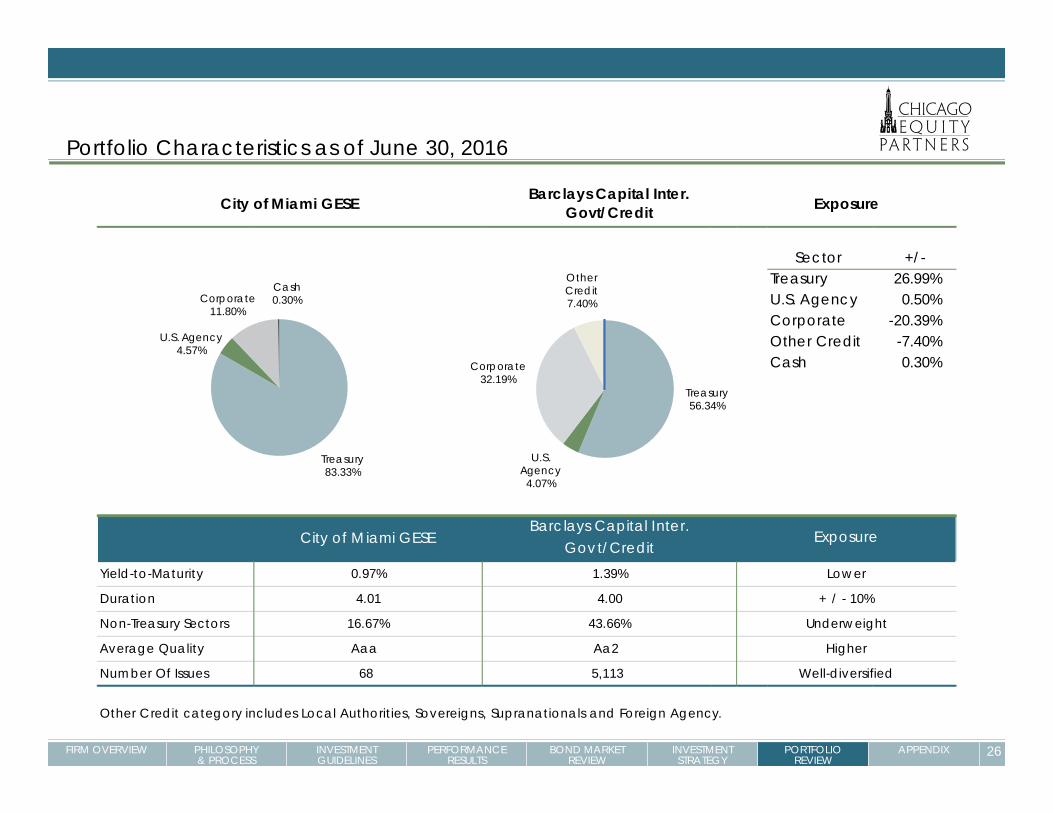
Portfolio Characteristics as of June 30, 2016
Sector +/-Treasury 26.99%U.S. Agency 0.50%Corporate -20.39%Other Credit -7.40%Cash 0.30%
City of Miami GESE
Yield-to-Maturity 0.97%
Duration 4.01
Non-Treasury Sectors 16.67%
Average Quality Aaa
Number Of Issues 68 Other Credit category includes Local Authorities, Sovereigns, Supranationals and Foreign Agency.
Well-diversified
Barclays Capital Inter. Govt/Credit
Barclays Capital Inter. Govt/Credit
+ / - 10%
City of Miami GESE Exposure
Exposure
Lower
Underweight
Higher
1.39%
4.00
43.66%
Aa2
5,113
Treasury83.33%
U.S. Agency4.57%
Corporate11.80%
Cash0.30%
Treasury56.34%
U.S. Agency4.07%
Corporate32.19%
Other Credit7.40%

FIRM OVERVIEW PHILOSOPHY& PROCESS
INVESTMENT GUIDELINES
PERFORMANCE RESULTS
BOND MARKET REVIEW
INVESTMENT STRATEGY
PORTFOLIO REVIEW
APPENDIX 27
Portfolio Characteristics as of June 30, 2016
*U.S. Government and Agency securities are currently classified as AAA.
City of Miami GESE
Barclays Capital Inter. Govt/Credit
8.78%
2.29%0.73%
18.68%
11.80%
1.71%
0%2%4%6%8%
10%12%14%16%18%20%
Industrials Finance Utilities
Corporate Distribution
2.28%
35.86% 32.94%
9.91%
19.01%
1.78%
36.09%27.91%
17.36% 16.86%
0.00%
20.00%
40.00%
60.00%
80.00%
100.00%
<1 year 1 to 3 years 3 to 5 years 5 to 7 years 7 to 10 years
Maturity Distribution
89.03%
4.41% 5.03% 1.53%
65.14%
7.49%16.17%
11.20%
0.00%
20.00%
40.00%
60.00%
80.00%
100.00%
AAA AA A BBB
Quality Distribution*
FIRM OVERVIEW PHILOSOPHY& PROCESS
INVESTMENT GUIDELINES
PERFORMANCE RESULTS
BOND MARKET REVIEW
INVESTMENT STRATEGY
PORTFOLIO REVIEW
APPENDIX 28
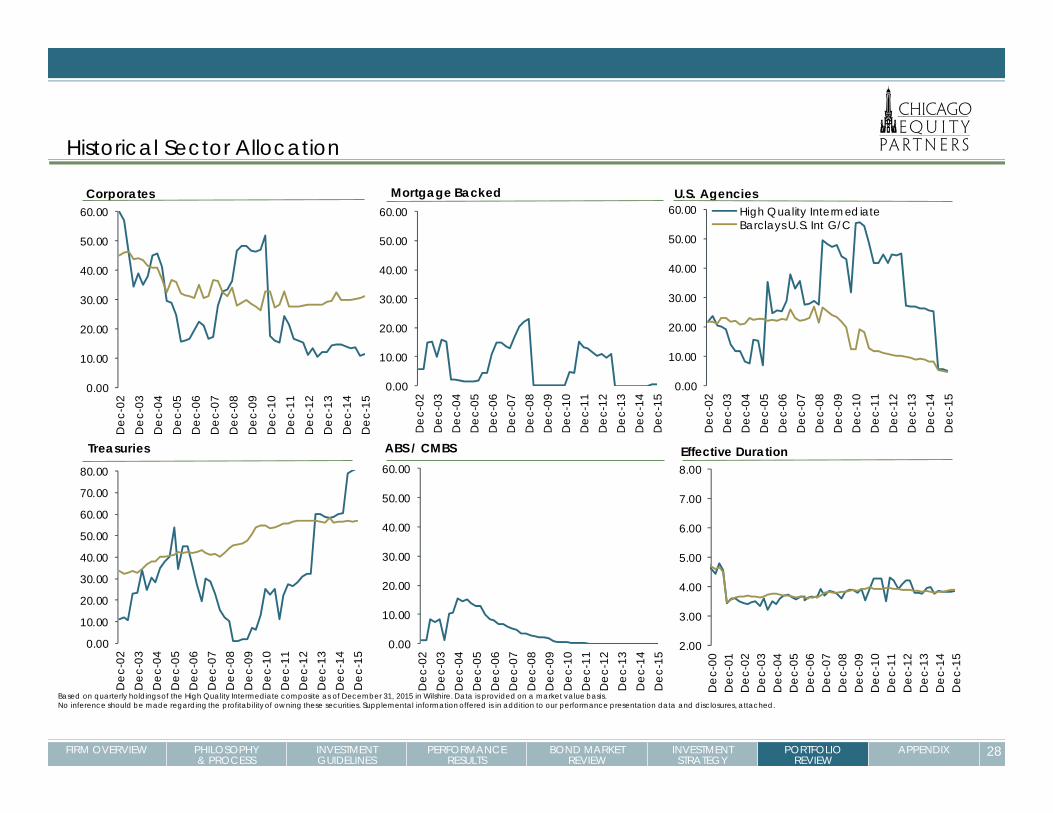
Historical Sector Allocation
Based on quarterly holdings of the High Quality Intermediate composite as of December 31, 2015 in Wilshire. Data is provided on a market value basis.No inference should be made regarding the profitabilityof owning these securities. Supplemental information offered is in addition to our performance presentation data and disclosures, attached.
0.00
10.00
20.00
30.00
40.00
50.00
60.00
Dec
-02
Dec
-03
Dec
-04
Dec
-05
Dec
-06
Dec
-07
Dec
-08
Dec
-09
Dec
-10
Dec
-11
Dec
-12
Dec
-13
Dec
-14
Dec
-15
Corporates
0.00
10.00
20.00
30.00
40.00
50.00
60.00
Dec
-02
Dec
-03
Dec
-04
Dec
-05
Dec
-06
Dec
-07
Dec
-08
Dec
-09
Dec
-10
Dec
-11
Dec
-12
Dec
-13
Dec
-14
Dec
-15
Mortgage Backed
0.00
10.00
20.00
30.00
40.00
50.00
60.00
Dec
-02
Dec
-03
Dec
-04
Dec
-05
Dec
-06
Dec
-07
Dec
-08
Dec
-09
Dec
-10
Dec
-11
Dec
-12
Dec
-13
Dec
-14
Dec
-15
U.S. AgenciesHigh Quality IntermediateBarclays U.S. Int G/C
0.00
10.00
20.00
30.00
40.00
50.00
60.00
70.00
80.00
Dec
-02
Dec
-03
Dec
-04
Dec
-05
Dec
-06
Dec
-07
Dec
-08
Dec
-09
Dec
-10
Dec
-11
Dec
-12
Dec
-13
Dec
-14
Dec
-15
Treasuries
0.00
10.00
20.00
30.00
40.00
50.00
60.00
Dec
-02
Dec
-03
Dec
-04
Dec
-05
Dec
-06
Dec
-07
Dec
-08
Dec
-09
Dec
-10
Dec
-11
Dec
-12
Dec
-13
Dec
-14
Dec
-15
ABS / CMBS
2.00
3.00
4.00
5.00
6.00
7.00
8.00
Dec
-00
Dec
-01
Dec
-02
Dec
-03
Dec
-04
Dec
-05
Dec
-06
Dec
-07
Dec
-08
Dec
-09
Dec
-10
Dec
-11
Dec
-12
Dec
-13
Dec
-14
Dec
-15
Effective Duration

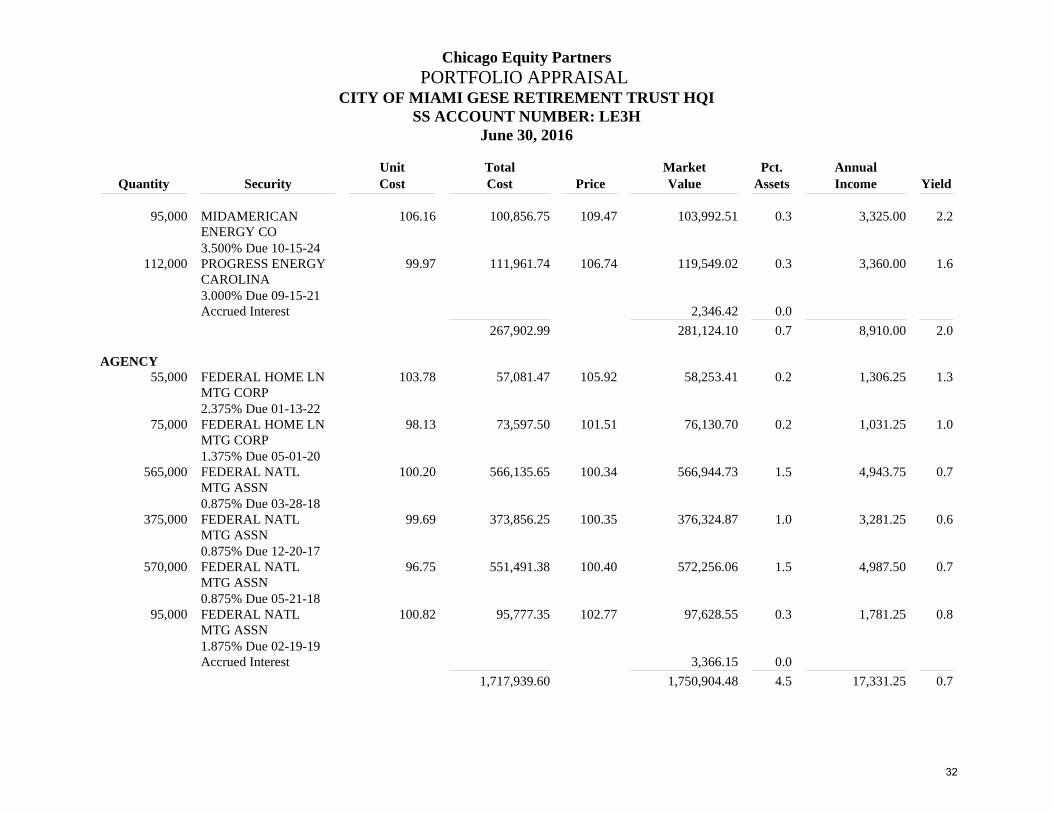
Chicago Equity PartnersPORTFOLIO APPRAISAL
CITY OF MIAMI GESE RETIREMENT TRUST HQISS ACCOUNT NUMBER: LE3H
June 30, 2016
Unit Total Market Pct. AnnualQuantity Security Cost Cost Price Value Assets Income Yield
CORPORATE FINANCIAL120,000 BANK NEW YORK
MTN BK ENT100.02 120,026.40 102.89 123,463.68 0.3 2,940.00 1.8
2.450% Due 11-27-20205,000 CHUBB CORP 122.64 251,409.95 108.48 222,387.69 0.6 11,787.50 1.2
5.750% Due 05-15-18105,000 GENERAL ELEC CAP
CORP MTN BE104.74 109,972.80 101.10 106,155.73 0.3 3,045.00 0.8
2.900% Due 01-09-1745,000 TORONTO
DOMINION BANK101.65 45,740.70 102.62 46,178.14 0.1 1,012.50 1.4
2.250% Due 11-05-19125,000 VISA INC 99.91 124,893.75 103.11 128,885.12 0.3 2,750.00 1.5
2.200% Due 12-14-20300,000 WELLS FARGO & CO
NEW99.98 299,931.00 102.54 307,630.80 0.8 7,500.00 1.9
2.500% Due 03-04-21170,000 WELLS FARGO CO
MTN BE102.00 173,405.10 100.84 171,425.28 0.4 4,462.50 0.8
2.625% Due 12-15-16Accrued Interest 6,161.87 0.0
1,125,379.70 1,112,288.33 2.9 33,497.50 1.4
CORPORATE INDUSTRIAL60,000 3M CO 98.06 58,834.20 102.44 61,464.42 0.2 1,200.00 1.6
2.000% Due 06-26-2285,000 ALTRIA GROUP INC 102.91 87,471.80 103.95 88,361.41 0.2 2,231.25 1.5
2.625% Due 01-14-20110,000 BOEING CO 98.79 108,669.05 103.61 113,970.67 0.3 2,585.00 1.6
2.350% Due 10-30-21
29

Chicago Equity PartnersPORTFOLIO APPRAISAL
CITY OF MIAMI GESE RETIREMENT TRUST HQISS ACCOUNT NUMBER: LE3H
June 30, 2016
Unit Total Market Pct. AnnualQuantity Security Cost Cost Price Value Assets Income Yield
120,000 CATERPILLAR FINL SVCS MTNS BE
100.58 120,699.60 100.05 120,060.96 0.3 1,200.00 0.9
1.000% Due 11-25-16100,000 DISNEY WALT CO
MTNS BE101.71 101,708.00 100.10 100,103.70 0.3 1,350.00 0.5
1.350% Due 08-16-16145,000 EXXON MOBIL CORP 101.16 146,684.90 101.62 147,355.81 0.4 2,476.60 1.1
1.708% Due 03-01-19140,000 GENERAL ELECTRIC
CO106.32 148,845.20 105.94 148,321.74 0.4 7,350.00 1.1
5.250% Due 12-06-17110,000 GENERAL MLS INC 119.94 131,934.00 111.15 122,265.11 0.3 6,215.00 1.3
5.650% Due 02-15-19100,000 HOME DEPOT INC 102.80 102,798.00 102.97 102,974.50 0.3 2,250.00 0.9
2.250% Due 09-10-18170,000 JOHNSON &
JOHNSON100.33 170,557.60 99.93 169,882.87 0.4 1,190.00 0.9
0.700% Due 11-28-16125,000 KIMBERLY CLARK
CORP115.50 144,375.00 105.62 132,030.50 0.3 7,656.25 0.9
6.125% Due 08-01-17170,000 LOCKHEED MARTIN
CORP101.05 171,790.10 101.36 172,306.22 0.4 3,145.00 1.3
1.850% Due 11-23-18205,000 MCDONALDS CORP
MED TERM NT BE107.05 219,460.70 106.94 219,224.54 0.6 10,967.50 1.1
5.350% Due 03-01-1890,000 MEDTRONIC INC 99.88 89,894.70 99.97 89,976.06 0.2 787.50 0.9
0.875% Due 02-27-17225,000 MERCK & CO INC
NEW99.60 224,104.50 100.40 225,905.17 0.6 2,475.00 0.8
1.100% Due 01-31-18
30

Chicago Equity PartnersPORTFOLIO APPRAISAL
CITY OF MIAMI GESE RETIREMENT TRUST HQISS ACCOUNT NUMBER: LE3H
June 30, 2016
Unit Total Market Pct. AnnualQuantity Security Cost Cost Price Value Assets Income Yield
105,000 PFIZER INC 125.08 131,339.25 112.94 118,588.47 0.3 6,510.00 1.36.200% Due 03-15-19
120,000 PHILIP MORRIS INTL INC
119.85 143,820.00 108.63 130,359.12 0.3 6,780.00 1.0
5.650% Due 05-16-1860,000 SHELL
INTERNATIONAL FIN BV
99.45 59,673.00 100.53 60,317.94 0.2 1,125.00 1.8
1.875% Due 05-10-2195,000 SHERWIN
WILLIAMS CO100.16 95,156.75 100.19 95,177.17 0.2 1,282.50 1.2
1.350% Due 12-15-17170,000 SYSCO CORP 106.09 180,346.20 106.18 180,506.17 0.5 8,925.00 1.4
5.250% Due 02-12-18130,000 TYSON FOODS INC 102.38 133,094.00 102.73 133,554.72 0.3 3,445.00 1.7
2.650% Due 08-15-1980,000 UNION PAC CORP 99.78 79,820.80 110.57 88,454.32 0.2 2,916.80 2.1
3.646% Due 02-15-2480,000 UNITED PARCEL
SERVICE INC106.20 84,962.40 107.20 85,759.28 0.2 2,500.00 1.5
3.125% Due 01-15-21186,000 VERIZON
COMMUNICATIONS INC
100.31 186,568.01 103.49 192,484.89 0.5 4,882.50 1.6
2.625% Due 02-21-20Accrued Interest 26,822.18 0.1
3,122,607.76 3,126,227.96 8.1 91,445.90 1.2
CORPORATE UTILITY50,000 DOMINION RES INC
VA NEW110.17 55,084.50 110.47 55,236.15 0.1 2,225.00 2.1
4.450% Due 03-15-21
31
Chicago Equity PartnersPORTFOLIO APPRAISAL
CITY OF MIAMI GESE RETIREMENT TRUST HQISS ACCOUNT NUMBER: LE3H
June 30, 2016
Unit Total Market Pct. AnnualQuantity Security Cost Cost Price Value Assets Income Yield
95,000 MIDAMERICAN ENERGY CO
106.16 100,856.75 109.47 103,992.51 0.3 3,325.00 2.2
3.500% Due 10-15-24112,000 PROGRESS ENERGY
CAROLINA99.97 111,961.74 106.74 119,549.02 0.3 3,360.00 1.6
3.000% Due 09-15-21Accrued Interest 2,346.42 0.0
267,902.99 281,124.10 0.7 8,910.00 2.0
AGENCY55,000 FEDERAL HOME LN
MTG CORP103.78 57,081.47 105.92 58,253.41 0.2 1,306.25 1.3
2.375% Due 01-13-2275,000 FEDERAL HOME LN
MTG CORP98.13 73,597.50 101.51 76,130.70 0.2 1,031.25 1.0
1.375% Due 05-01-20565,000 FEDERAL NATL
MTG ASSN100.20 566,135.65 100.34 566,944.73 1.5 4,943.75 0.7
0.875% Due 03-28-18375,000 FEDERAL NATL
MTG ASSN99.69 373,856.25 100.35 376,324.87 1.0 3,281.25 0.6
0.875% Due 12-20-17570,000 FEDERAL NATL
MTG ASSN96.75 551,491.38 100.40 572,256.06 1.5 4,987.50 0.7
0.875% Due 05-21-1895,000 FEDERAL NATL
MTG ASSN100.82 95,777.35 102.77 97,628.55 0.3 1,781.25 0.8
1.875% Due 02-19-19Accrued Interest 3,366.15 0.0
1,717,939.60 1,750,904.48 4.5 17,331.25 0.7
32

Chicago Equity PartnersPORTFOLIO APPRAISAL
CITY OF MIAMI GESE RETIREMENT TRUST HQISS ACCOUNT NUMBER: LE3H
June 30, 2016
Unit Total Market Pct. AnnualQuantity Security Cost Cost Price Value Assets Income Yield
TREASURY925,000 UNITED STATES
TREAS NTS100.60 930,531.42 102.14 944,800.55 2.4 13,875.00 0.7
1.500% Due 02-28-191,480,000 UNITED STATES
TREAS NTS101.73 1,505,559.60 102.55 1,517,809.56 3.9 24,050.00 0.7
1.625% Due 04-30-191,860,000 UNITED STATES
TREAS NTS101.75 1,892,614.68 104.13 1,936,870.08 5.0 34,875.00 1.1
1.875% Due 11-30-211,250,000 UNITED STATES
TREAS NTS99.76 1,246,996.41 104.62 1,307,812.50 3.4 25,000.00 1.4
2.000% Due 02-15-251,130,000 UNITED STATES
TREAS NTS99.39 1,123,127.85 101.83 1,150,701.60 3.0 15,537.50 0.9
1.375% Due 08-31-20250,000 UNITED STATES
TREAS NTS100.70 251,758.81 103.17 257,920.00 0.7 4,375.00 1.2
1.750% Due 09-30-22600,000 UNITED STATES
TREAS NTS99.20 595,173.89 100.54 603,211.20 1.6 5,250.00 0.6
0.875% Due 10-15-182,060,000 UNITED STATES
TREAS NTS99.92 2,058,317.05 101.77 2,096,451.70 5.4 28,325.00 1.0
1.375% Due 01-31-211,920,000 UNITED STATES
TREAS NTS97.67 1,875,232.68 101.12 1,941,600.00 5.0 31,200.00 1.5
1.625% Due 02-15-262,040,000 UNITED STATES
TREAS NTS98.79 2,015,383.39 100.70 2,054,343.24 5.3 22,950.00 1.0
1.125% Due 02-28-21
33

Chicago Equity PartnersPORTFOLIO APPRAISAL
CITY OF MIAMI GESE RETIREMENT TRUST HQISS ACCOUNT NUMBER: LE3H
June 30, 2016
Unit Total Market Pct. AnnualQuantity Security Cost Cost Price Value Assets Income Yield
280,000 UNITED STATES TREAS NTS
98.34 275,363.62 103.33 289,329.60 0.8 4,900.00 1.2
1.750% Due 05-15-22270,000 UNITED STATES
TREAS NTS99.57 268,851.29 99.97 269,915.76 0.7 1,350.00 0.5
0.500% Due 07-31-171,330,000 UNITED STATES
TREAS NTS99.84 1,327,822.42 100.41 1,335,455.66 3.5 11,637.50 0.7
0.875% Due 07-31-191,125,000 UNITED STATES
TREAS NTS99.79 1,122,624.91 100.09 1,126,010.25 2.9 7,031.25 0.5
0.625% Due 08-31-171,365,000 UNITED STATES
TREAS NTS100.17 1,367,266.88 100.75 1,375,184.26 3.6 13,650.00 0.8
1.000% Due 09-30-19245,000 UNITED STATES
TREAS NTS99.90 244,752.15 102.36 250,780.53 0.7 3,981.25 1.2
1.625% Due 11-15-222,085,000 UNITED STATES
TREAS NTS100.01 2,085,169.88 100.65 2,098,600.45 5.4 20,850.00 0.8
1.000% Due 11-30-191,130,000 UNITED STATES
TREAS NTS98.24 1,110,159.88 100.26 1,132,957.21 2.9 8,475.00 0.6
0.750% Due 12-31-17800,000 UNITED STATES
TREAS NTS97.61 780,875.00 100.27 802,187.20 2.1 6,000.00 0.6
0.750% Due 03-31-18675,000 UNITED STATES
TREAS NTS93.06 628,178.56 103.16 696,331.35 1.8 11,812.50 1.3
1.750% Due 05-15-23
34

Chicago Equity PartnersPORTFOLIO APPRAISAL
CITY OF MIAMI GESE RETIREMENT TRUST HQISS ACCOUNT NUMBER: LE3H
June 30, 2016
Unit Total Market Pct. AnnualQuantity Security Cost Cost Price Value Assets Income Yield
800,000 UNITED STATES TREAS NTS
99.63 797,033.93 101.52 812,156.00 2.1 11,000.00 0.6
1.375% Due 06-30-18970,000 UNITED STATES
TREAS NTS100.02 970,231.99 108.33 1,050,820.40 2.7 24,250.00 1.3
2.500% Due 08-15-231,795,000 UNITED STATES
TREAS NTS104.78 1,880,857.81 110.23 1,978,707.48 5.1 49,362.50 1.3
2.750% Due 11-15-23705,000 UNITED STATES
TREAS NTS101.78 717,579.67 108.61 765,723.76 2.0 17,625.00 1.3
2.500% Due 05-15-241,850,000 UNITED STATES
TREAS NTS100.10 1,851,843.99 102.26 1,891,769.30 4.9 27,750.00 0.7
1.500% Due 05-31-19945,000 UNITED STATES
TREAS NTS99.62 941,364.47 100.54 950,094.49 2.5 8,268.75 0.6
0.875% Due 07-15-181,115,000 UNITED STATES
TREAS NTS100.52 1,120,840.54 102.83 1,146,576.80 3.0 18,118.75 0.9
1.625% Due 07-31-20Accrued Interest 108,454.95 0.3
30,985,512.76 31,892,575.90 82.7 451,500.00 0.9
CASH AND EQUIVALENTSGeneral Classification
MONEY MARKET FUND
113,096.96 113,096.96 0.3 22.62 0.0
113,096.96 113,096.96 0.3 22.62 0.0
35
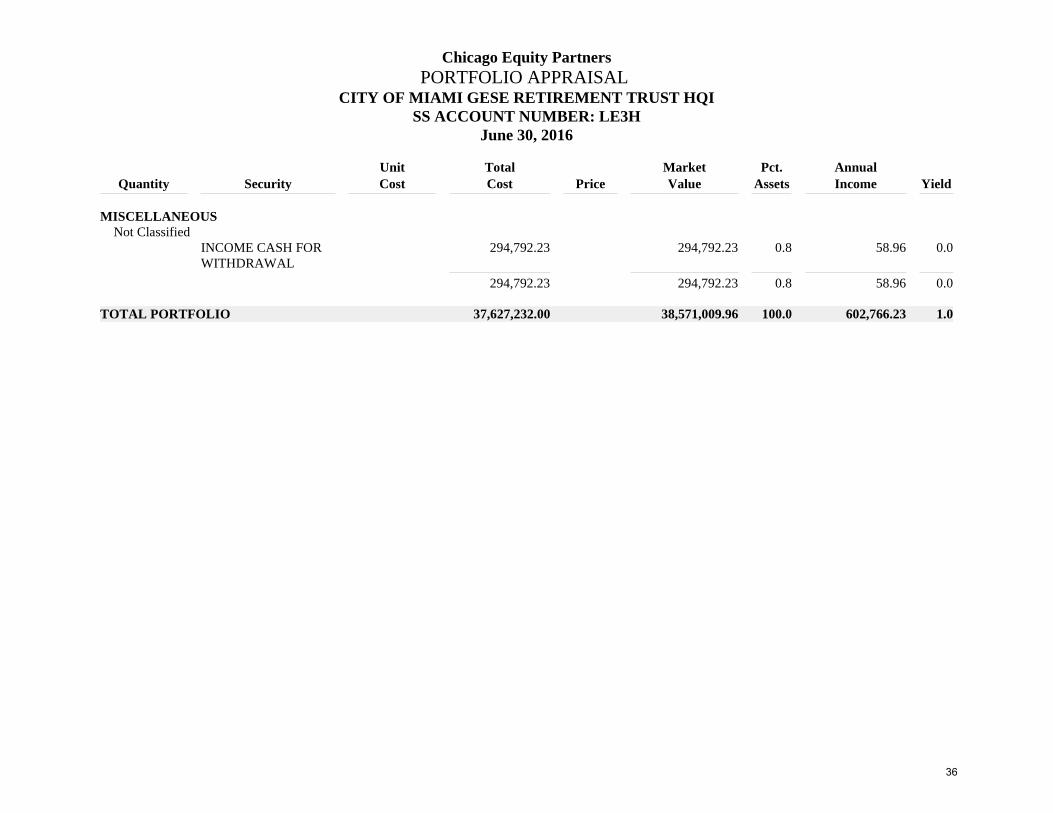
Chicago Equity PartnersPORTFOLIO APPRAISAL
CITY OF MIAMI GESE RETIREMENT TRUST HQISS ACCOUNT NUMBER: LE3H
June 30, 2016
Unit Total Market Pct. AnnualQuantity Security Cost Cost Price Value Assets Income Yield
MISCELLANEOUSNot Classified
INCOME CASH FOR WITHDRAWAL
294,792.23 294,792.23 0.8 58.96 0.0
294,792.23 294,792.23 0.8 58.96 0.0
TOTAL PORTFOLIO 37,627,232.00 38,571,009.96 100.0 602,766.23 1.0
36

FIRM OVERVIEW PHILOSOPHY& PROCESS
INVESTMENT GUIDELINES
PERFORMANCE RESULTS
BOND MARKET REVIEW
INVESTMENT STRATEGY
PORTFOLIO REVIEW
APPENDIX
Annual Performance Disclosure

FIRM OVERVIEW PHILOSOPHY& PROCESS
INVESTMENT GUIDELINES
PERFORMANCE RESULTS
BOND MARKET REVIEW
INVESTMENT STRATEGY
PORTFOLIO REVIEW
APPENDIX
Contact Information
Today’s Presenters
Chicago Equity Partners180 N. LaSalle Street, Suite 3800
Chicago, Illinois
Mike Budd
Managing Director
p: 312.629.8506
James A. DeZellar, CFA
Managing Director
p: 312.629.5725