CITY OF LAKE SAINT LOUIS1C3DDF92-5482-4DB6-9D09... · Prioritization System Background ... distance...
37
CITY OF LAKE SAINT LOUIS SIDEWALK PRIORITIZATION MODEL
Transcript of CITY OF LAKE SAINT LOUIS1C3DDF92-5482-4DB6-9D09... · Prioritization System Background ... distance...

CITY OF LAKE SAINT LOUIS
SIDEWALK PRIORITIZATION MODEL

SIDEWALK PRIORITIZATION MODEL
October 28, 2015
Page 2
TABLE OF CONTENTS
Introduction and Background ............................................................................................................ 3
History of the sidewalk Program .....................................................................................................................3
Design Requirements .....................................................................................................................................3
The Americans with Disabilities Act (ADA) .................................................................................................................................. 3
ADA Standards for ACCESSIBLE Design (2010) ............................................................................................................................. 3
DOT ADA Standards for Transportation FACILITIES (2006) .......................................................................................................... 3
Prioritization System Background ...................................................................................................................3
Inventory and Scoring System ........................................................................................................... 4
Inventory Process ..........................................................................................................................................4
Scoring System...............................................................................................................................................4
Destination Score ......................................................................................................................................................................... 5
Parking ......................................................................................................................................................................................... 6
Right-of-way ................................................................................................................................................................................ 6
Sidewalk Status ............................................................................................................................................................................ 6
Street Classification ..................................................................................................................................................................... 6
Cost Estimate ............................................................................................................................................................................... 7
Scoring matrix ................................................................................................................................................8
Implimentation ................................................................................................................................. 9
Use and Maintenance of Project List ...............................................................................................................9
Funding .........................................................................................................................................................9
Sidewalk Priority List .................................................................................................................................... 10
Project Rating Sheets ........................................................................................... Error! Bookmark not defined.
Figure 1 Sidewalk Routes ............................................................................................................................................................ 4
Figure 2 Sidewalk Demand Model .............................................................................................................................................. 5
Figure 3 Sidewalk Demand Generation Properties ...................................................................................................................... 6

SIDEWALK PRIORITIZATION MODEL
October 28, 2015
Page 3
INTRODUCTION AND BACKGROUND
HISTORY OF THE SIDEWALK PROGRAM
Construction of new sidewalks are a reoccurring request from residents, and while the City has constructed a small
number of sidewalk projects in recent years, Lake Saint Louis does not have a comprehensive system for analyzing need
and prioritizing sidewalks. Previous planning documents referenced in the development of this plan include:
Bikeable/Walkable Communities Plan and the Gateway Bike Plan. These plans had more focus on bike facilities, and
attempted to create a list of viable projects, but did not assess the benefits of one route over another.
DESIGN REQUIREMENTS
The City of Lake Saint Louis “Engineering and Plan Preparation Manuel for Public Facilities” provides comprehensive
standards for designs and construction of sidewalks by inclusion, and by reference to other documents. These standards
conform to the following federal guidelines:
THE AMERICANS WITH DISABILITIES ACT (ADA)
Signed into law on in 1990, by President George H.W. Bush, the ADA is comprehensive legislation addressing
discrimination and public accommodation for disabled persons.
ADA STANDARDS FOR ACCESSIBLE DESIGN (2010)
The 2010 Standards for Accessible Design were published in the Federal Register on September 15, 2010. The compliance
deadline for these standards was March 15, 2012. The 2010 ADA Standards for Accessible Design are the most current
edition of the Justice Department’s regulations for Titles II and III of the ADA. They apply to all facilities except
transportation facilities.
DOT ADA STANDARDS FOR TRANSPORTATION FACILITIES (2006)
The Department of Transportation (DOT) ADA Standards apply to facilities used by state and local governments to provide
designated public transportation services. Generally sidewalks within the right-of-way fall into this category.
PRIORITIZATION SYSTEM BACKGROUND
The Sidewalk Prioritization System (System) was established in order to provide a data driven and efficient procedure for
the prioritization of specific sidewalk projects throughout the City. Due to limited yearly funding, personnel, and materials,
it is necessary to develop a logical system that organizes data in an efficient way to prioritize sidewalk projects.
The System provides a numerical score for each sidewalk location. The scores are based on several factors discussed later
in this report. Methodology for development of the model is loosely based on a similar system implemented by the City of
Fort Collins in their Sidewalk Prioritization model1.
1 (City of Fort Collins Sidewalk Prioritization Model, 2014)

SIDEWALK PRIORITIZATION MODEL
October 28, 2015
Page 4
INVENTORY AND SCORING SYSTEM
INVENTORY PROCESS
Members of the city of Lake Saint Louis Public Works Department have prepared a detailed record of the City’s sidewalks.
Using GIS mapping software and existing data, maps were created containing information about the locations of sidewalks
within the city limits, pedestrian destinations and street classifications.
Figure 1 Sidewalk Routes
SCORING SYSTEM
Every member of the community at some point uses the city sidewalks to move from one point to another. Walking is the
most basic form transportation and sidewalks are the infrastructure that supports this activity. The goals of the system is
to balance a complete sidewalk network with cost efficiency. To address this goal, construction cost, functional
classification, and other factors are considered in the scoring system. The most important factor in the system are
pedestrian demand generators. These includes:
Uptown Business District
Schools
Hospitals
Parks

SIDEWALK PRIORITIZATION MODEL
October 28, 2015
Page 5
Trails
Docks and Marinas
Community Service Centers
Commercial Developments
DESTINATION SCORE
As early as the 1920’s the five minute walk was used as the definition for a neighborhood and maximum desirable walking
distance to a destination. Clarence Perry, used a quarter mile circle to depict the five minute walk and suggested cities
should be planned around these 160 acre areas. Since this time cars have become common, and communities are no
longer commonly planned around compact neighborhoods, but planners still look to the quarter mile circle or some
derivation of it when deciding if a person is likely to make a trip by foot or use a car.
This plan takes this concept and assigns scores to particular land uses. These scores are based on anticipated pedestrian
volume generated by each use and broken down into distances of 1000 ft and 1500 ft. A score was plotted on the map
surrounding each demand generator based on these distances. Nearby demand generators create overlapping scores that
are additive. The closer a pedestrian is to a demand generator; the more likely that individual is going to want to use a
sidewalk. Having more options for nearby walking destinations further increases the likelihood a person will want to walk
to a destination. Destinations were broken down into high, medium, and low generators. The highest score was given to
areas that would see the most pedestrian traffic, with a descending score for medium and low. The highest score along a
proposed sidewalk route was recorded as the destination score for the project.
Figure 2 Sidewalk Demand Model

SIDEWALK PRIORITIZATION MODEL
October 28, 2015
Page 6
Figure 3 Sidewalk Demand Generation Properties
PARKING
When considering a potential project, a site with on-street parking received a higher score than locations without on
street parking. Parked cars make it more difficult to walk along the edge of a roadway, and a parked car is a pedestrian
destination.
RIGHT-OF-WAY
Projects with adequate existing right of way or easement for construction receive a higher score. Because temporary
construction easements will be necessary for most projects this is an opportunity for residents who desire a sidewalk to
increase the score of a project in their neighborhood by donating easements.
SIDEWALK STATUS
Filling in gaps or removing barriers within the existing sidewalk network is prioritized over creating entirely new sidewalks.
Finishing an incomplete sidewalk is typically a lower cost effort and can be completed in less time than constructing an
entirely new sidewalk segment. Deficient sidewalks are prioritized under nonexistent sidewalks because even if they don’t
meet today’s standards they at least provide some pedestrian mobility.
STREET CLASSIFICATION
SIDEWALK PRIORITIZATION MODEL
October 28, 2015
Page 7
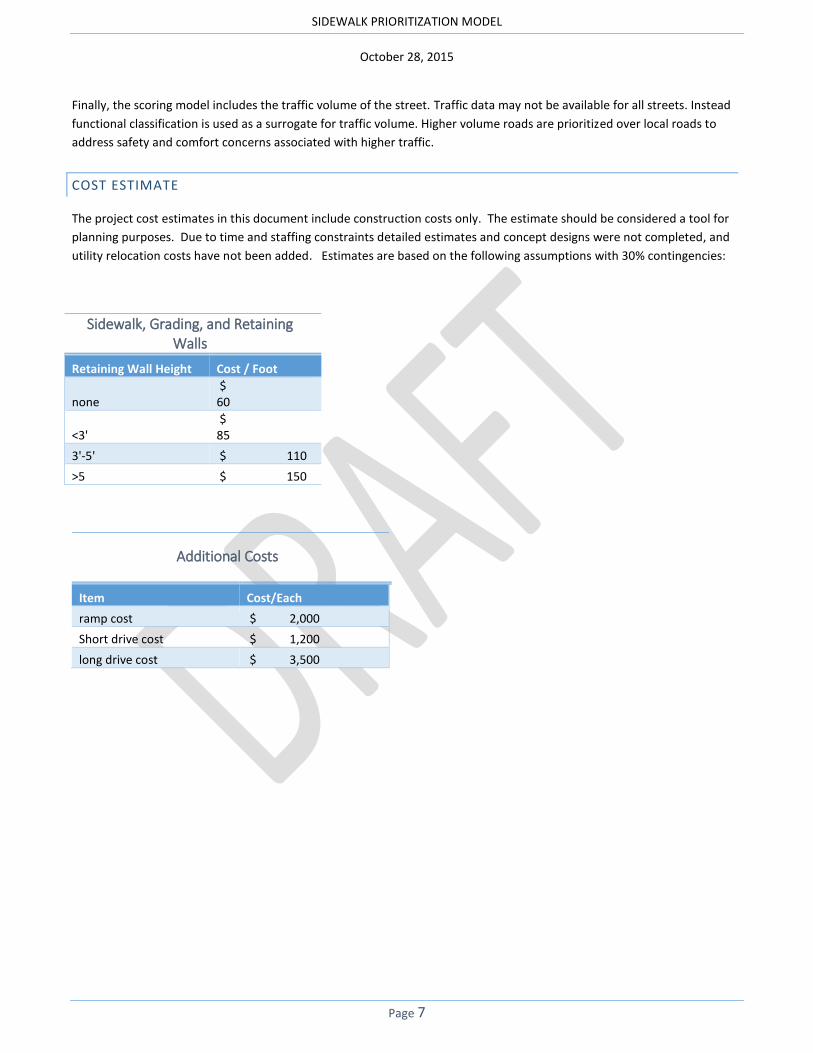
Finally, the scoring model includes the traffic volume of the street. Traffic data may not be available for all streets. Instead
functional classification is used as a surrogate for traffic volume. Higher volume roads are prioritized over local roads to
address safety and comfort concerns associated with higher traffic.
COST ESTIMATE
The project cost estimates in this document include construction costs only. The estimate should be considered a tool for
planning purposes. Due to time and staffing constraints detailed estimates and concept designs were not completed, and
utility relocation costs have not been added. Estimates are based on the following assumptions with 30% contingencies:
Sidewalk, Grading, and Retaining Walls
Retaining Wall Height Cost / Foot
none $ 60
<3' $ 85
3'-5' $ 110
>5 $ 150
Additional Costs
Item Cost/Each
ramp cost $ 2,000
Short drive cost $ 1,200
long drive cost $ 3,500
SIDEWALK PRIORITIZATION MODEL
October 28, 2015
Page 8
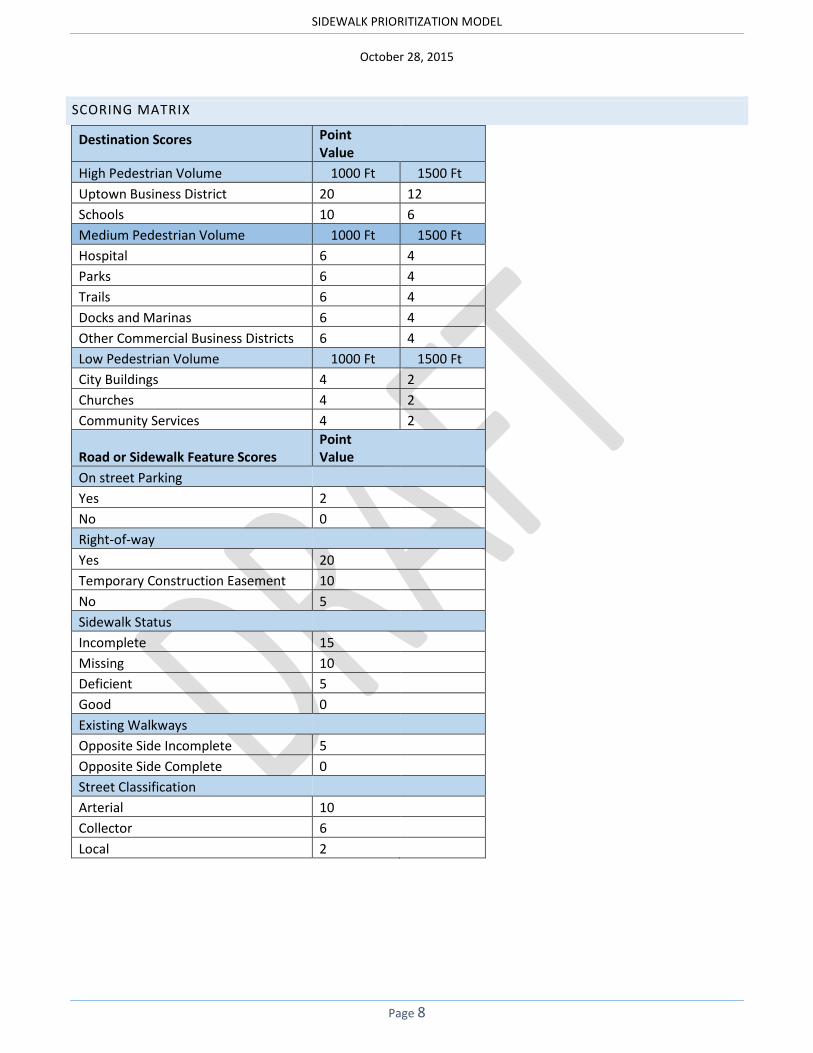
SCORING MATRIX
Destination Scores Point Value
High Pedestrian Volume 1000 Ft 1500 Ft
Uptown Business District 20 12
Schools 10 6
Medium Pedestrian Volume 1000 Ft 1500 Ft
Hospital 6 4
Parks 6 4
Trails 6 4
Docks and Marinas 6 4
Other Commercial Business Districts 6 4
Low Pedestrian Volume 1000 Ft 1500 Ft
City Buildings 4 2
Churches 4 2
Community Services 4 2
Road or Sidewalk Feature Scores Point Value
On street Parking
Yes 2
No 0
Right-of-way
Yes 20
Temporary Construction Easement 10
No 5
Sidewalk Status
Incomplete 15
Missing 10
Deficient 5
Good 0
Existing Walkways
Opposite Side Incomplete 5
Opposite Side Complete 0
Street Classification
Arterial 10
Collector 6
Local 2

SIDEWALK PRIORITIZATION MODEL
October 28, 2015
Page 9
IMPLIMENTATION
USE AND MAINTENANCE OF PROJECT LIST
The Project list included in this document should be considered a planning tool. The project cost estimate is a major
component of the ranking score, and due to time and staffing limitations a detailed concept plan and estimate was not
performed for each project. This is recognized as a limitation of the sidewalk plan.
A detailed budget and strategy for design, property acquisition and construction will be completed for top ranked projects.
The results of this effort will be used to insert sidewalk projects in to the annual Project Capital Improvement Plan (CIP).
Each project proposed in the CIP plan will be evaluated as any other project by the Board of Alderman before the project is
actually budgeted.
FUNDING
This plan uses project construction cost for evaluation purposes. Additional funding for design and property acquisition
will be need for each project and included in the CIP.
The plan does not consider source of funding. The primary reason for this is uncertainty associated with grant programs
for sidewalks. The federal government is the primary source of funding for sidewalk grants. The programs that include
sidewalks as a qualifying project type have seen significant change in recent years, and there is no federal long range
transportation bill currently in place.
Completing every project in this plan including design and property acquisition costs will likely exceed $8,000,000, but it
should be noted that many projects in this plan have previously been evaluated and deemed too costly. Projects such as
those along Lake Saint Louis Boulevard south of the Uptown District and north of South Henke Road will require drainage
improvements, and Rue Grand will require significant driveway modifications. It should be assumed many of these
projects will be skipped or reevaluated in subsequent versions of this plan. These projects could be moved to a separate
list of projects that are impractical to build as standalone sidewalk projects, but should be included in future
reconstruction projects or as part of developments or other opportunities for sidewalk construction.

SIDEWALK PRIORITIZATION MODEL
October 28, 2015
Page 10
SIDEWALK PRIORITY LIST
Project Name Stage Length (Ft) Estimated Cost Score Rank Score
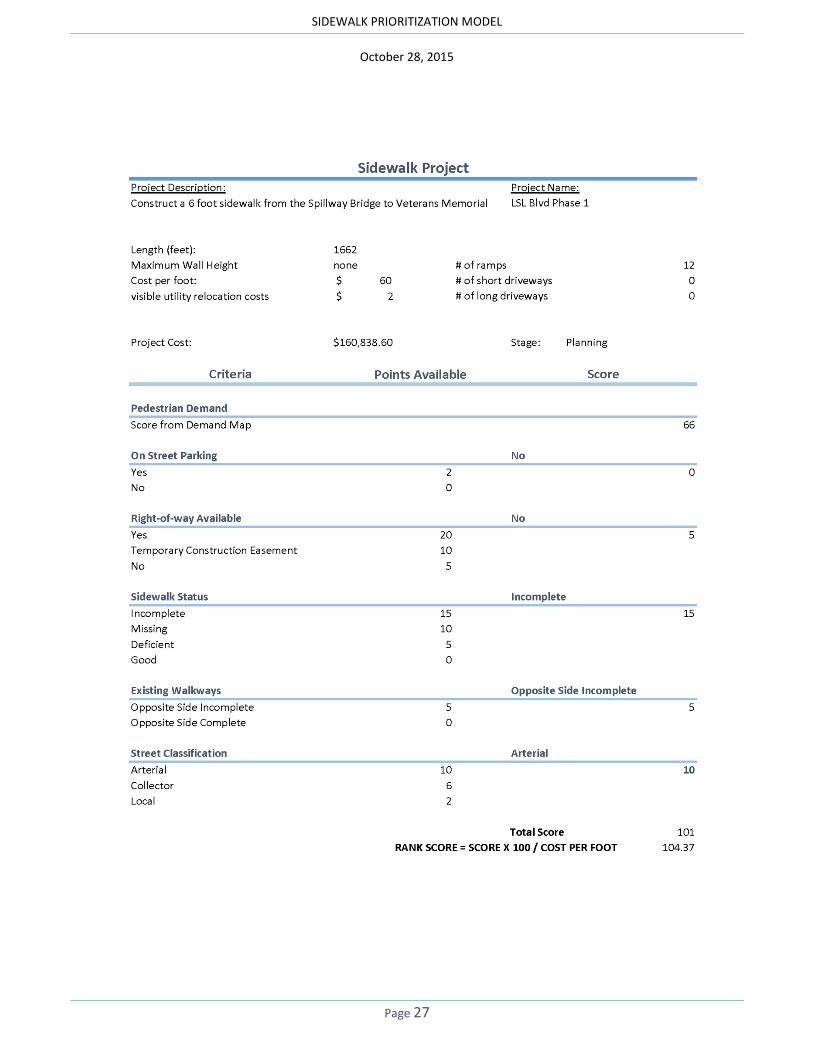
LSL Blvd Phase 1 - Bus Dist. Planning 1662 $ 160,838.60 101 104.37
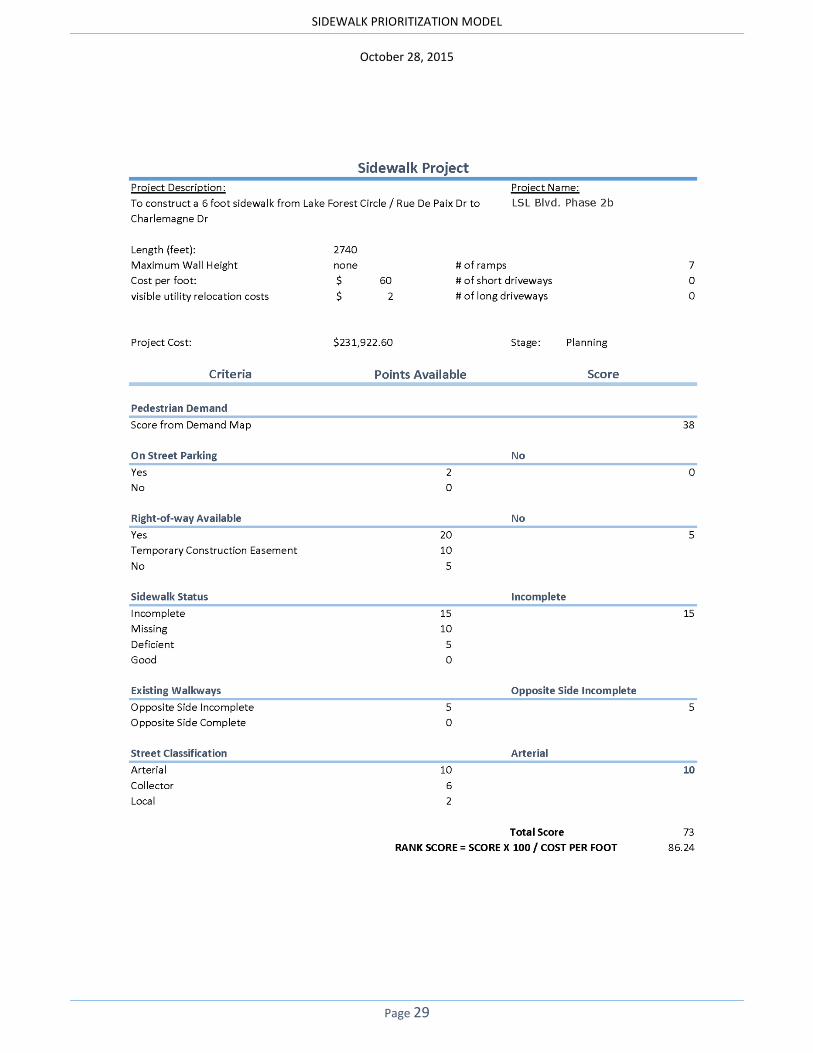
LSL Blvd Phase 2b Planning 2740 $ 231,922.60 73 86.24
LSL Blvd Phase 2a Planning 2100 $ 244,532.60 83 71.28
Hospital/Bus District Planning 753 $ 123,281.60 96 58.64
Savoy Phase 2 Planning 2505 $ 263,770.00 60 56.98
LSL Blvd Phase 2c Planning 4335 $ 366,732.60 47 55.56
Savoy Phase 1 Planning 2016 $ 189,360.60 52 55.36
LSL Blvd Phase 3 Planning 3920 $ 448,762.60 61 53.28
Rue Grand Phase 3 Planning 2251 $ 239,150.60 56 52.71
Locksley Manor Planning 1374 $ 144,614.60 55 52.26
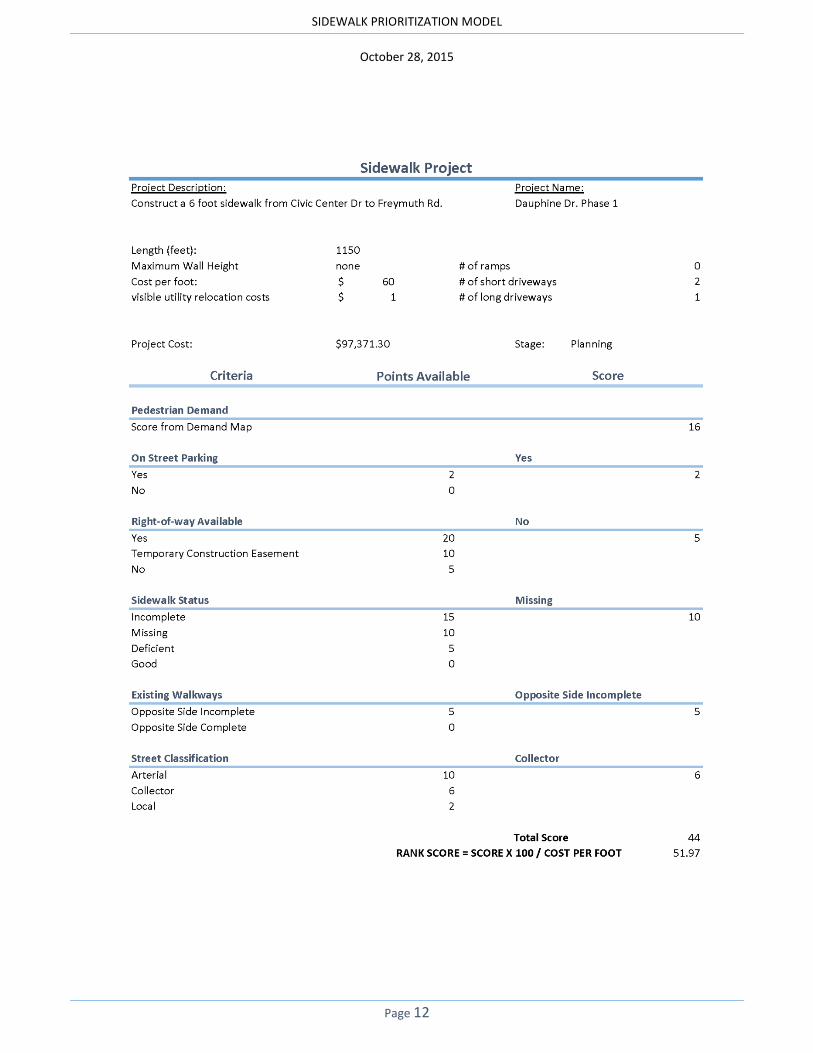
Dauphine Dr. Phase 1 Planning 1150 $ 97,371.30 44 51.97
Rue Grand Phase 4 Planning 1351 $ 146,590.60 56 51.61
Civic Center Dr. Phase 2 Planning 2321 $ 269,473.10 58 49.96
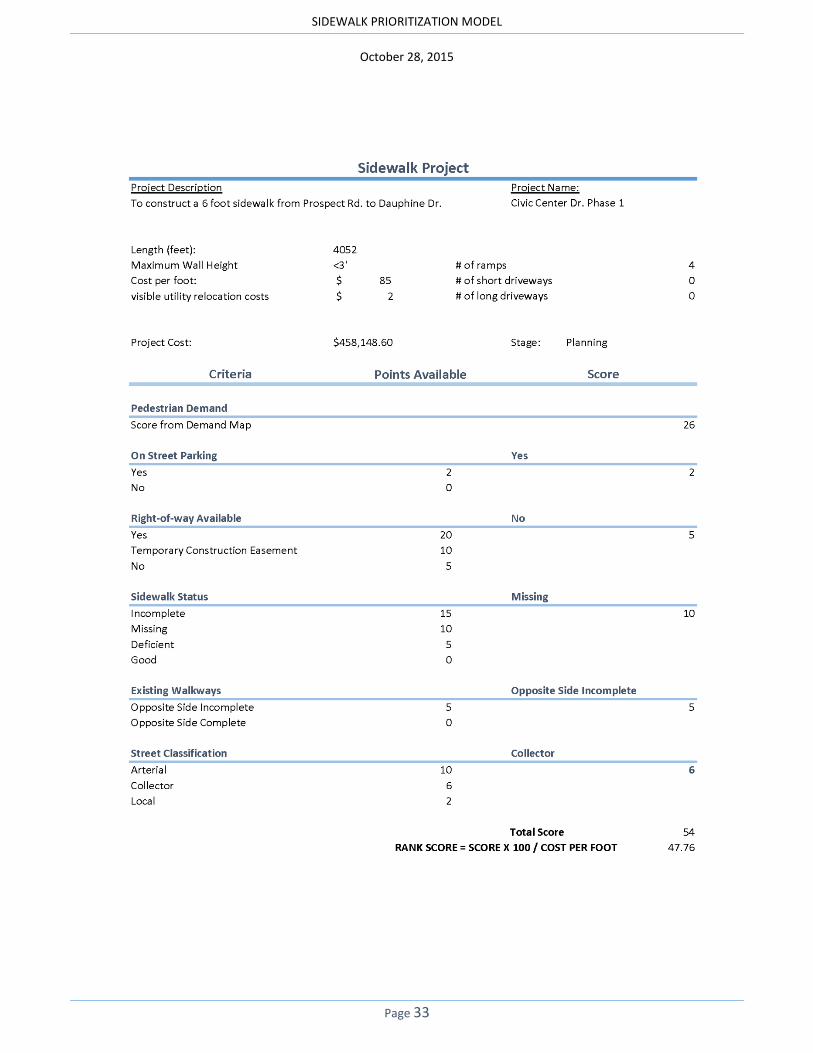
Civic Center Dr. Phase 1 Planning 4052 $ 458,148.60 54 47.76
Fox Trail Phase 2 Planning 2326 $ 273,535.60 54 45.92
Fox Trail Phase 3 Planning 1638 $ 194,001.60 54 45.59
Technology Dr. Phase 1 Planning 5171 $ 590,118.10 52 45.57
Technology Dr. Phase 2 Planning 854 $ 79,614.60 42 45.05
Savoy Phase 3 Planning 1581 $ 185,103.10 48 41.00
Dauphine Dr. Phase 3 Planning 2440 $ 350,612.60 58 40.36
Fox Trail Phase 1 Planning 531 $ 32 38.60

SIDEWALK PRIORITIZATION MODEL
October 28, 2015
Page 11
44,020.60
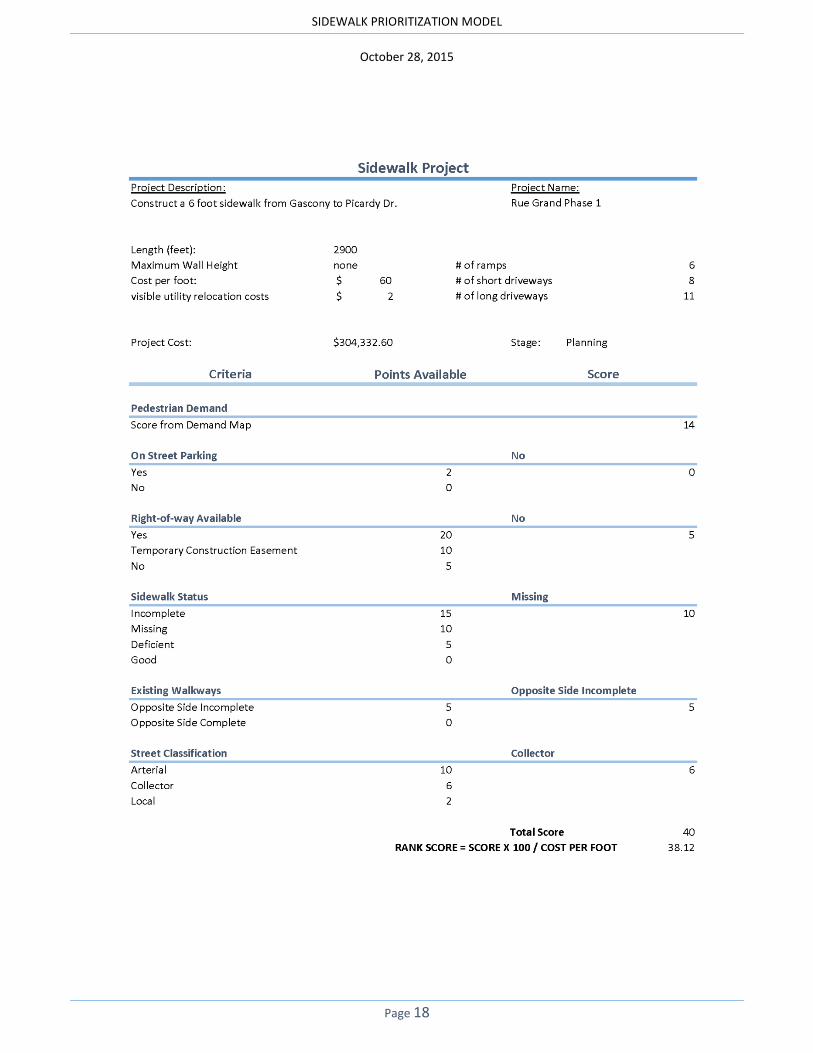
Rue Grand Phase 1 Planning 2900 $ 304,332.60 40 38.12
Dauphine Dr. Phase 2 Planning 2961 $ 382,311.80 48 37.18
LSL Blvd Phase 4 Planning 1771 $ 179,740.60 37 36.46
Oak Bluff - Freymuth Planning 5393 $ 779,521.60 50 34.59
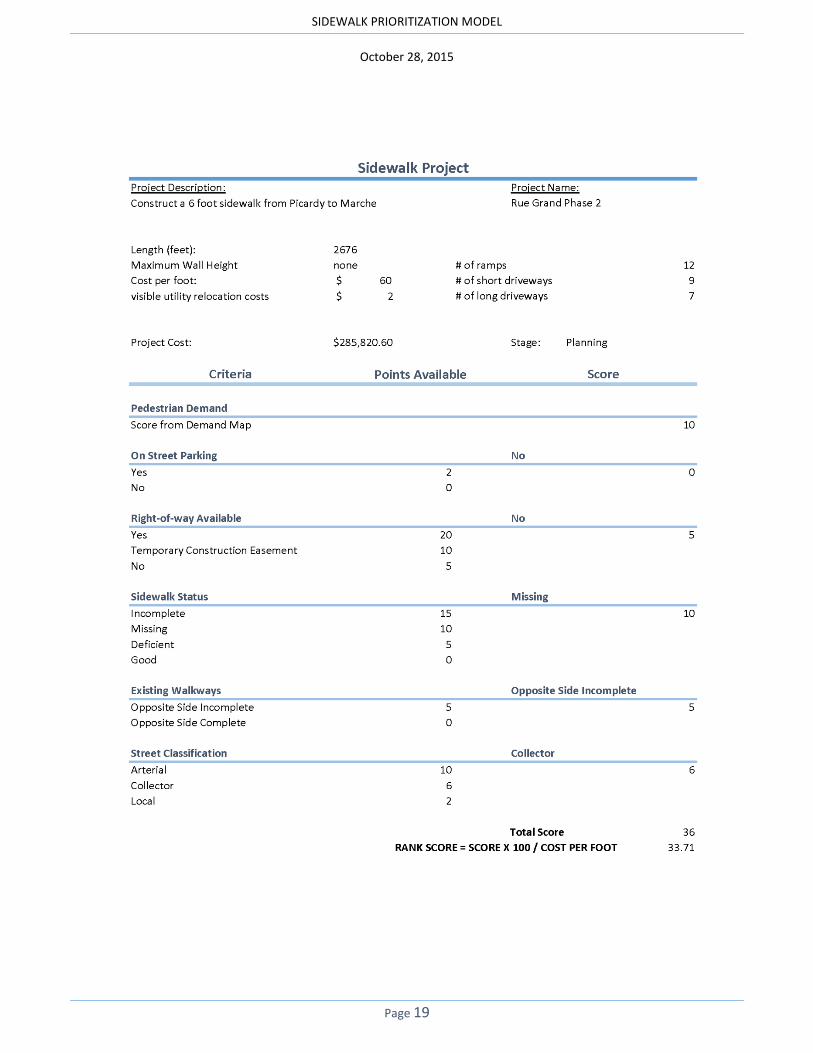
Rue Grand Phase 2 Planning 2676 $ 285,820.60 36 33.71
Project Name Stage Length (Ft) Estimated Cost Score
Rank Score
LSL Blvd Phase 1 - Bus Dist. Planning 1662 $ 160,838.60 101 104.37
LSL Blvd Phase 2b Planning 2740 $ 231,922.60 73 86.24
LSL Blvd Phase 2a Planning 2100 $ 244,532.60 83 71.28
Hospital/Bus District Planning 753 $ 123,281.60 96 58.64
Savoy Phase 2 Planning 2505 $ 263,770.00 60 56.98
LSL Blvd Phase 2c Planning 4335 $ 366,732.60 47 55.56
Savoy Phase 1 Planning 2016 $ 189,360.60 52 55.36
LSL Blvd Phase 3 Planning 3920 $ 448,762.60 61 53.28
Rue Grand Phase 3 Planning 2251 $ 239,150.60 56 52.71
Locksley Manor Planning 1374 $ 144,614.60 55 52.26
Dauphine Dr. Phase 1 Planning 1150 $ 97,371.30 44 51.97
Rue Grand Phase 4 Planning 1351 $ 146,590.60 56 51.61
Civic Center Dr. Phase 2 Planning 2321 $ 269,473.10 58 49.96
Civic Center Dr. Phase 1 Planning 4052 $ 458,148.60 54 47.76
Fox Trail Phase 2 Planning 2326 $ 273,535.60 54 45.92
Fox Trail Phase 3 Planning 1638 $ 194,001.60 54 45.59
Technology Dr. Phase 1 Planning 5171 $ 590,118.10 52 45.57
Technology Dr. Phase 2 Planning 854 $ 79,614.60 42 45.05
Savoy Phase 3 Planning 1581 $ 185,103.10 48 41.00
Dauphine Dr. Phase 3 Planning 2440 $ 350,612.60 58 40.36
Fox Trail Phase 1 Planning 531 $ 44,020.60 32 38.60
Rue Grand Phase 1 Planning 2900 $ 304,332.60 40 38.12
Dauphine Dr. Phase 2 Planning 2961 $ 382,311.80 48 37.18
LSL Blvd Phase 4 Planning 1771 $ 179,740.60 37 36.46
Oak Bluff - Freymuth Planning 5393 $ 779,521.60 50 34.59
Rue Grand Phase 2 Planning 2676 $ 285,820.60 36 33.71
SIDEWALK PRIORITIZATION MODEL
October 28, 2015
Page 12

SIDEWALK PRIORITIZATION MODEL
October 28, 2015
Page 13

SIDEWALK PRIORITIZATION MODEL
October 28, 2015
Page 14

SIDEWALK PRIORITIZATION MODEL
October 28, 2015
Page 15

SIDEWALK PRIORITIZATION MODEL
October 28, 2015
Page 16

SIDEWALK PRIORITIZATION MODEL
October 28, 2015
Page 17
SIDEWALK PRIORITIZATION MODEL
October 28, 2015
Page 18
SIDEWALK PRIORITIZATION MODEL
October 28, 2015
Page 19

SIDEWALK PRIORITIZATION MODEL
October 28, 2015
Page 20

SIDEWALK PRIORITIZATION MODEL
October 28, 2015
Page 21

SIDEWALK PRIORITIZATION MODEL
October 28, 2015
Page 22

SIDEWALK PRIORITIZATION MODEL
October 28, 2015
Page 23

SIDEWALK PRIORITIZATION MODEL
October 28, 2015
Page 24

SIDEWALK PRIORITIZATION MODEL
October 28, 2015
Page 25

SIDEWALK PRIORITIZATION MODEL
October 28, 2015
Page 26
SIDEWALK PRIORITIZATION MODEL
October 28, 2015
Page 27

SIDEWALK PRIORITIZATION MODEL
October 28, 2015
Page 28
SIDEWALK PRIORITIZATION MODEL
October 28, 2015
Page 29

SIDEWALK PRIORITIZATION MODEL
October 28, 2015
Page 30

SIDEWALK PRIORITIZATION MODEL
October 28, 2015
Page 31

SIDEWALK PRIORITIZATION MODEL
October 28, 2015
Page 32
SIDEWALK PRIORITIZATION MODEL
October 28, 2015
Page 33

SIDEWALK PRIORITIZATION MODEL
October 28, 2015
Page 34

SIDEWALK PRIORITIZATION MODEL
October 28, 2015
Page 35

SIDEWALK PRIORITIZATION MODEL
October 28, 2015
Page 36

SIDEWALK PRIORITIZATION MODEL
October 28, 2015
Page 37