CITY OF FERGUSON, MISSOURI COMPREHENSIVE ANNUAL FINANCIAL...
104
CITY OF FERGUSON, MISSOURI COMPREHENSIVE ANNUAL FINANCIAL REPORT FOR THE YEAR ENDED JUNE 30, 2013 Report prepared and submitted by the Department of Finance
Transcript of CITY OF FERGUSON, MISSOURI COMPREHENSIVE ANNUAL FINANCIAL...

CITY OF FERGUSON, MISSOURI COMPREHENSIVE ANNUAL
FINANCIAL REPORT FOR THE YEAR ENDED JUNE 30, 2013
Report prepared and submitted by the Department of Finance

This page intentionally left blank
Contents
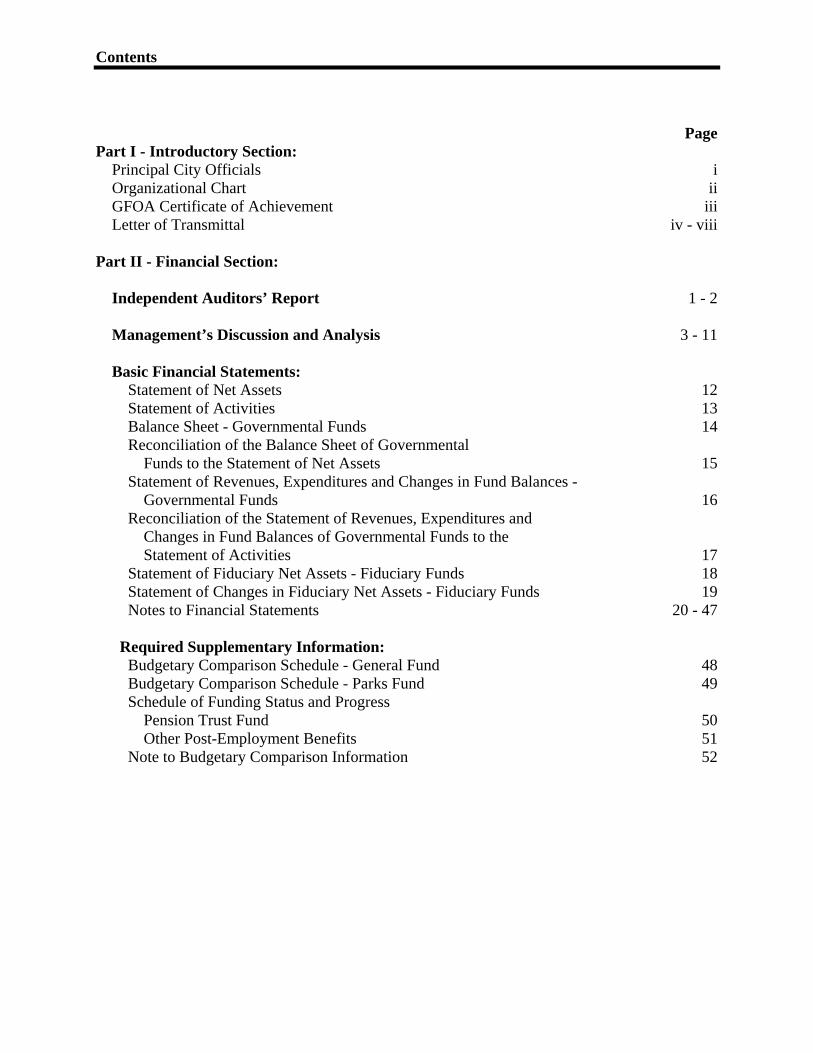
Page Part I - Introductory Section:
Principal City Officials i Organizational Chart ii GFOA Certificate of Achievement iii Letter of Transmittal iv - viii
Part II - Financial Section: Independent Auditors’ Report 1 - 2 Management’s Discussion and Analysis 3 - 11 Basic Financial Statements: Statement of Net Assets 12 Statement of Activities 13 Balance Sheet - Governmental Funds 14 Reconciliation of the Balance Sheet of Governmental Funds to the Statement of Net Assets 15 Statement of Revenues, Expenditures and Changes in Fund Balances - Governmental Funds 16 Reconciliation of the Statement of Revenues, Expenditures and Changes in Fund Balances of Governmental Funds to the Statement of Activities 17 Statement of Fiduciary Net Assets - Fiduciary Funds 18 Statement of Changes in Fiduciary Net Assets - Fiduciary Funds 19 Notes to Financial Statements 20 - 47
Required Supplementary Information:
Budgetary Comparison Schedule - General Fund 48 Budgetary Comparison Schedule - Parks Fund 49 Schedule of Funding Status and Progress Pension Trust Fund 50 Other Post-Employment Benefits 51 Note to Budgetary Comparison Information 52

Contents
Page Other Supplementary Information:
Combining Balance Sheet - Non Major Governmental Funds 53 Combining Statement of Revenues, Expenditures and
Changes in Fund Balances - Non Major Governmental Funds 54 Schedule of Revenues, Expenditures and Changes in Fund Balance - Budget and Actual:
Capital Improvement Sales Tax Capital Projects Fund 55 Special Business District Special Revenue Fund 56 Downtown TIF Redevelopment Special Revenue Fund 57 Sewer Lateral Special Revenue Fund 58 Local Improvement Capital Projects Fund 59 Halls Ferry TIF Debt Service Fund 60 Certificates of Participation Debt Service Fund 61
General Obligation Bonds Debt Service Fund 62 Statement of Changes in Assets and Liability - Agency Fund 63
Part III - Statistical Section:
Net Assets 64 Changes in Net Assets 65 Fund Balances, Governmental Funds 66 Changes in Fund Balances, Governmental Funds 67 Assessed and Estimated Actual Value of Taxable Property 68 Property Tax Rates - Direct and Overlapping Governments 69 Principal Property Taxpayers 70 Property Tax Levies and Collections 71 Special Assessment Collections 72 Ratio of Outstanding Debt by Type 73 Computation of Direct and Overlapping Debt - General Obligation Bonded Debt 74 Legal Debt Margin Information 75 Pledged Revenue Coverage 76 Demographic and Economic Statistics 77 Principal Employers 78 Full-Time Equivalent City Government Employees by Function/Program 79 Operating Indicators by Function 80 Capital Asset Statistics by Function/Program 81

Introductory Section

- i -
PRINCIPAL OFFICIALS
MAYOR James W. Knowles III
COUNCIL MEMBERS Mark Byrne
Kim Tihen
Dwayne T. James
Timothy A. Larson
David Conway
Keith Kallstrom
CITY MANAGER John Shaw
ASSISTANT CITY MANAGER Pamela Hylton
DIRECTOR OF FINANCE Jeffrey Blume
DIRECTOR OF PARKS & RECREATION Stan Kreitler
CHIEF OF POLICE Thomas Jackson
CHIEF OF FIRE DEPARTMENT Steven Rosenthal
DIRECTOR OF PUBLIC WORKS Matthew Unrein
CITY CLERK Megan Asikainen

- ii -
Assistant City Manager
Chief of Police Chief of Fire Department
Director of Finance Director of Public
Works
Director of Parks and Recreation
Personnel
Patrol
Fire Suppression
General Accounting
Facility Maintenance
General Recreation
Public Relations Investigation Fire Prevention Revenue Collection Street Maintenance Swimming Pool
Planning and Zoning Records Emergency Medical Services Operations
Cash Management Municipal Garage Concessions
Economic Development
Communications Emergency Preparedness
Purchasing Engineering Special Events
Information Technology
Juvenile Payroll Park Maintenance Senior Citizens Activities
Community Development
Detention Municipal Courts
Code Enforcement Community Center
ADMINISTRATIVE ORGANIZATIONAL CHART
City Clerk City Attorney
City Council
Citizens of Ferguson, Missouri
City Manager
Boards and Commissions

- iii -

- v -
December 5, 2013
To the Honorable Mayor, Members of the City Council, and Citizens of the City of Ferguson, Missouri: State law and local ordinances require that all general-purpose local governments publish a complete set of financial statements presented in conformance with accounting principles generally accepted in the United States of America (GAAP) and audited in accordance with generally accepted auditing standards by a firm of licensed certified public accountants. Pursuant to that requirement, we hereby issue the comprehensive annual financial report of the City of Ferguson, Missouri for the fiscal year ended June 30, 2013. This year’s comprehensive annual financial report (CAFR) is the ninth year that the City has presented its financial statements under the reporting model required by Governmental Accounting Standards Board Statement No. 34 (GASB 34), Basic Financial Statements - and Management’s Discussion and Analysis - for State and Local Governments. The format and the purpose of these changes are addressed in Management’s Discussion and Analysis (MD&A). This report consists of management’s representations concerning the finances of the City of Ferguson, Missouri. Consequently, management assumes full responsibility for the completeness and reliability of all information presented in this report. To the best of our knowledge and belief, the enclosed data are accurate in all material respects and are reported in a manner designed to present fairly the financial position and results of operations of the various activities of the City. All disclosures necessary to enable the reader to gain an understanding of the City’s financial activities have been included. The City of Ferguson, Missouri’s financial statements have been audited by Botz, Deal & Co., P.C., a firm of licensed certified public accountants. The goal of the independent audit was to provide reasonable assurance that the basic financial statements of the City of Ferguson, Missouri, for the year ended June 30, 2013, are free of material misstatement. The independent audit involved examining, on a test basis, evidence supporting the amounts and disclosures in the basic financial statements; assessing the accounting principles used and significant estimates made by management; and evaluating the overall basic financial statement presentation. The independent auditor concluded, based upon the audit, that there was a reasonable basis for rendering an unqualified opinion that the City of Ferguson, Missouri’s financial statements for the fiscal year ended June 30, 2013, are fairly presented in conformity with GAAP. The independent auditor’s report is presented as the first component of the financial section of this report. GAAP requires that management provide a narrative introduction, overview, and analysis to accompany the basic financial statements in the form of MD&A. This letter of transmittal is designed to complement MD&A and should be read in conjunction with it. The City of

- v -
Ferguson, Missouri’s MD&A can be found immediately following the Independent Auditors’ Report.
THE FINANCIAL REPORTING ENTITY
The City of Ferguson, Missouri, initially incorporated in 1894, is a suburban community located in North St. Louis County between two major interstate highways. Since 1954, the City has operated under the Council-Manager form of government. Policy-making and legislative authority are vested in a governing council consisting of the Mayor and six City Council Members. The City Council is responsible for, among other things, passing ordinances, adopting the budget, appointing committees and hiring the City Manager, City Clerk, and appointing the Municipal Judge. The City Manager is responsible for carrying out the policies and ordinances of the City Council, overseeing the day-to-day operations of the City and appointing the heads of the various departments. The City Council is elected on a non-partisan basis. Council members serve three-year staggered terms, with three Council members elected in each of two years. The Mayor is elected, at large, to serve a three-year term, in the third year of the three-year cycle. The City of Ferguson, Missouri provides a full range of municipal services. These services include legislative, administrative, judicial, police and fire protection, street maintenance and improvements, planning and zoning, public improvements, cultural and recreational services. The Ferguson Special Business District (FSBD) is a political subdivision created by ordinance to maintain and improve the City’s downtown business district and is included as a special revenue fund. The Ferguson Neighborhood Improvement Program (FNIP) is a not-for-profit corporation. It was established to assist in the rehabilitation and restoration of housing and residential properties in the City. The FNIP Board of Directors is appointed by the City Council. However, the City cannot “impose its will” on FNIP. It is not a component unit. Complete financial statements of FNIP may be obtained from their administrative offices at 110 Church Street, Ferguson, Missouri 63135.
ECONOMIC CONDITION AND OUTLOOK
The City of Ferguson, Missouri, occupies a land area of about 7 square miles and serves a population of 21,203 residents, who are ideally located to commute to employment in downtown St. Louis or to any of the many nearby commercial areas. The world headquarters of Emerson Electric is located within the City. The City of Ferguson is a mature city that has experienced considerable commercial and residential growth in past years. However, City development has slowed in recent years as the City has limited space for commercial growth. However, the Downtown Business District still has great potential in offering additional business growth, goods and services and sales tax revenues. Commercial redevelopment can produce some of the additional revenues necessary to address resident concerns, such as infrastructure needs and quality services. The City has two main retail bases, North County Festival and the Crossings at Halls Ferry. North County Festival includes Wal-Mart, Sam’s Club, Toys ‘R Us and a variety of smaller stores, while the Crossings at Halls Ferry is anchored by Home Depot and Shop ‘n Save, with many other smaller stores. A number of restaurants are also located in the area.

- vi -
Efforts are well underway to redevelop the City’s historic downtown business district. A pay-as-you-go Tax Increment Financing (TIF) district was established in September, 2002 to assist with redevelopment of the downtown business district. TIF assistance is useful in attracting major development as well as assisting local business owners with improvements to new or existing businesses. A joint redevelopment effort by St. Louis County and the Cities of Ferguson, Berkeley, and Kinloch is in the process of transforming over 600 acres of vacant property adjacent to Lambert International Airport into a major industrial park. The project is planned to include medium and low rise industrial, commercial and office uses. It is projected to create up to 12,000 jobs over a period of 20 years and have a cumulative, regional economic impact of at least $7 billion. Although only a small portion of the redevelopment area lies within Ferguson, the economic benefits created by the new jobs and the increased business traffic are expected to be significant. The development is already home to Express Scripts, Staples, Vatterott College and a Hilton Garden Inn.
FINANCIAL CONTROLS Management of the City is responsible for establishing and maintaining an internal control framework that is designed to protect the City’s assets from loss, theft, or misuse. City anagement must also ensure that adequate accounting data is compiled to allow for the preparation of accurate financial statements in conformance with generally accepted accounting principles. Because the cost of internal controls should not outweigh their benefits, the City of Ferguson, Missouri’s comprehensive framework of internal controls has been designed to provide reasonable rather than absolute assurance that the financial statement will be free from material misstatement. Accounting records for the City’s general governmental operations are maintained on a modified accrual basis. As such, revenues are recorded when measurable and available, and expenditures are recorded when the liability is incurred. The annual operating budget serves as the foundation for the City of Ferguson, Missouri’s financial planning and control. All departments of the City of Ferguson are required to submit requests for appropriation to the Director of Finance each year. The Director of Finance uses these requests as the starting point for development of a proposed budget. After review, the City Manager then presents this proposed budget to the City Council for review. The City Council is required to hold a public hearing on the proposed budget and to adopt a final budget no later than June 30th, the close of the City of Ferguson’s fiscal year. The appropriated budget is prepared by fund, function (e.g., public safety), and department (e.g., police). The City Manager may make transfers of appropriations within a department. Transfers of appropriations between departments, however, require the approval of the City Council. All governmental funds are appropriated. The single exception to this statement is the North Park Redevelopment TIF Fund (North Park) which earns less than $1,000 per year in revenue and has no expenditures. Budget-to-actual comparisons are provided in this report for each individual governmental fund. For the General Fund and Parks Fund, this comparison is presented as required supplementary information. For all other governmental funds, except North Park, budget-to-actual comparisons are found in other supplementary information. Budgets are prepared on a basis consistent with GAAP.

- vii -
Single Audit - As a recipient of federal, state and county financial assistance, the City is responsible for ensuring that adequate internal controls are in place to ensure compliance with applicable laws and regulations related to those programs. These internal controls are subject to periodic evaluation by the City’s management and staff. The City is required to undergo an audit in conformity with the provisions of the Single Audit Act as amended in 1996 and the United States Office of Management and Budget Circular A-133. For the fiscal year ended June 30, 2013, the City met the minimum threshold of the Single Audit Act. Accordingly, an audit was performed.
Capital Projects - It is a priority of the City to maintain and improve existing infrastructure. A vital element for managing both of these priorities is the development and maintenance of the City’s infrastructure through capital improvements. The management of the City’s Capital Improvements Program is controlled through the use of a long-range plan approved in concept by the Mayor and City Council. The Capital Improvement Program projects the City’s capital improvement needs for a five-year period and is reviewed and updated annually. The management and accounting of this plan is controlled through the use of capital project funds. The primary sources of financing for these improvements include capital improvement sales tax, park sales taxes, City budgeted funds, tax increment financing and revenue from federal, state and county grants.
OTHER INFORMATION
Cash Management Policies and Practices - Temporarily idle cash in the governmental funds during the year was invested in certificates of deposit obligations of the U.S. Treasury and other US Agencies. The maturities of the investments range from overnight to up to ten years. The City’s investment policy is to minimize credit and market risks while maintaining a competitive yield on its portfolio. Accordingly, all of the City’s deposits were either insured by federal depository insurance or collateralized. All collateral on deposits was held either by the City’s agent, the Federal Reserve Bank, or a financial institution’s trust department in the City’s name. Risk Management - The City is a member of the St. Louis Area Insurance Trust (SLAIT), a public entity risk pool comprised of various municipalities in St. Louis County, Missouri. This pool covers workers’ compensation and liability exposures. The purpose of this pool is to share the cost of self-insurance with other similar, professionally managed cities. The Daniel & Henry Company provides claims administration for the trust. Additional information on the City of Ferguson, Missouri’s risk management activity can be found in the notes to the financial statements. Debt Administration - At year end, the City had five debt issues outstanding. These issues and original issue amounts include (1) $2,960,000 in certificates of participation related to the City’s capital lease obligation for the construction of the Splash at Wabash aquatic facility, which were defeased in April 2012 and refinanced in the amount of $2,065,000, (2) $6,185,000 in TIF revenue bonds related to the Crossings at Halls Ferry redevelopment project, (3) $5,000,000 in variable rate bonds for infrastructure improvements, (4) $8,000,000 in general obligation bonds related to land purchase and construction of a replacement of Firehouse 1, and (5) $9,500,000 in certificates of participation bonds issued to purchase land and remodel existing buildings. In addition, at year end, the City had two capital lease obligations outstanding. The first of these is for the lease of two fire trucks with an original issue cost of $1,172,000. The second is for the lease of certain lighting equipment, with an original issue cost of $507,000. Under the terms of each lease agreement, it is the City’s intent to purchase the leased assets at the end of the lease.

- viii -
Pension - The City of Ferguson sponsors a single-employer defined benefit pension plan (the Plan) for substantially all full-time employees. Plan governance is the responsibility of an independent Pension Board. Each year, an independent actuary, engaged by the Pension Board, calculates the amount of the annual contribution the City must make to the pension plan to ensure the plan will be able to fully meet its obligations to retired employees on a timely basis. As a matter of policy, the City fully funds each year’s annual required plan contribution. In each of the last five fiscal years, the City has made its actuarially required payments. Additional information on the City of Ferguson, Missouri’s pension arrangements can be found in the notes to the financial statements and the City’s website (www.fergusoncity.com).
AWARDS AND ACKNOWLEDGEMENTS The Government Finance Officers Association of the United States and Canada (GFOA) awarded a Certificate of Achievement for Excellence in Financial Reporting (Certificate of Achievement) to the City of Ferguson, Missouri for its comprehensive annual financial report (CAFR) for the fiscal year ended June 30, 2012. This was the twenty-seventh consecutive year the City has received this prestigious award. In order to be awarded a Certificate of Achievement, the City published an easily readable and efficiently organized CAFR. This report satisfied both U.S. generally accepted accounting principles and applicable legal requirements. A Certificate of Achievement is valid for a period of one year. We believe that our current CAFR continues to meet the Certificate of Achievement Program’s requirements and we will submit it for GFOA certification. The preparation of this report would not have been possible without the dedicated service of the entire staff of the finance department and various other departments of the City. An expression of gratitude is also extended to the Mayor and the City Council for their leadership and on-going concern for the financial well-being of the City. Finally, we would like to acknowledge the assistance of our independent auditors, Botz, Deal & Company, P.C. Their assistance and recommendations, both in the preparation of this report, as well as their consultations and interim reviews, are sincerely appreciated. Respectfully submitted,
John Shaw Jeffrey B. Blume City Manager Director of Finance

Page vage v
This page intentionally left blank

Page viage vi
Financial Section

Page viiage vii
This page intentionally left blank

Page 1
INDEPENDENT AUDITORS’ REPORT The Honorable Mayor and Members of the City Council of the CITY OF FERGUSON, MISSOURI Report on the Financial Statements We have audited the accompanying financial statements of the governmental activities, each major fund, and the aggregate remaining fund information of the City of Ferguson, Missouri, as of and for the year ended June 30, 2013, which collectively comprise the City’s basic financial statements as listed in the table of contents, and the related notes to the financial statements. Management’s Responsibility for the Financial Statements Management is responsible for the preparation and fair presentation of these financial statements in accordance with accounting principles generally accepted in the United States of America; this includes the design, implementation, and maintenance of internal control relevant to the preparation and fair presentation of financial statements that are free from material misstatement, whether due to fraud or error. Auditors’ Responsibility Our responsibility is to express opinions on these financial statements based on our audit. We conducted our audit in accordance with auditing standards generally accepted in the United States of America and the standards applicable to financial audits contained in Government Audit Standards, issued by the Comptroller General of the United States. Those standards require that we plan and perform the audit to obtain reasonable assurance about whether the financial statements are free of material misstatement. An audit involves performing procedures to obtain audit evidence about the amounts and disclosures in the financial statements. The procedures selected depend on the auditors’ judgment, including the assessment of the risks of material misstatement of the financial statements, whether due to fraud or error. In making those risk assessments, the auditor considers internal control relevant to the entity’s preparation and fair presentation of the financial statements in order to design audit procedures that are appropriate in the circumstances, but not for the purpose of expressing an opinion on the effectiveness of the entity’s internal control. Accordingly, we express no such opinion. An audit also includes evaluating the appropriateness of accounting policies used and the reasonableness of significant accounting estimates made by management, as well as evaluating the overall presentation of the financial statements. We believe that the audit evidence we have obtained is sufficient and appropriate to provide a basis for our audit opinions. Opinions In our opinion the financial statements referred to above present fairly, in all material respects, the respective financial position of the governmental activities, each major fund, and the aggregate remaining fund information of the City of Ferguson, Missouri, as of June 30, 2013, and the respective changes in the financial position for the year then ended in accordance with accounting principles generally accepted in the United States of America.

Page 2age 2
Other-Matter Accounting principles generally accepted in the United States of America require that the management’s discussion and analysis, schedule of funding progress and budgetary comparison information on pages 3 through 11 and 48 through 52 be presented to supplement the basic financial statements. Such information, although not a part of the basic financial statements, is required by the Governmental Accounting Standards Board who considers it to be an essential part of financial reporting for placing the basic financial statements in an appropriate operational, economic, or historical context. We have applied certain limited procedures to the required supplementary information in accordance with auditing standards generally accepted in the United States of America, which consisted of inquiries of management about the methods of preparing the information and comparing the information for consistency with management’s responses to our inquiries, the basic financial statements, and other knowledge we obtained during our audit of the basic financial statements. We do not express an opinion or provide any assurance on the information because the limited procedures do not provide us with sufficient evidence to express an opinion or provide any assurance. Our audit was conducted for the purpose of forming an opinion on the financial statements that collectively comprise the City of Ferguson, Missouri’s financial statements as a whole. The introductory section, other supplemental information and the statistical section are presented for purposes of additional analysis and are not a required part of the basic financial statements. The combining nonmajor fund financial statements and the budgetary comparison schedules included in the supplemental information section are the responsibility of management and were derived from and relate directly to the underlying accounting and other records used to prepare the financial statements. The information has been subjected to the auditing procedures applied in the audit of the financial statements and certain additional procedures, including comparing and reconciling such information directly to the underlying accounting and other records used to prepare the financial statements or to the financial statements themselves, and other additional procedures in accordance with auditing standards generally accepted in the United States of America. In our opinion, the information is fairly stated in all material respects in relation to the financial statements as a whole. The introductory and statistical sections have not been subjected to the auditing procedures applied in the audit of the basic financial statements and, accordingly, we do not express an opinion or provide any assurance on them. Other Reporting Required by Government Auditing Standards In accordance with Government Auditing Standards, we have also issued our report dated December 5, 2013, on our consideration of the City of Ferguson, Missouri’s internal control over financial reporting and on our tests of its compliance with certain provisions of laws, regulations, contracts, and grant agreements and other matters. The purpose of that report is to describe the scope of our testing of internal control over financial reporting and compliance and the results of that testing, and not to provide an opinion on internal control over financial reporting or on compliance. That report is an integral part of an audit performed in accordance with Government Auditing Standards in considering City of Ferguson, Missouri’s internal control over financial reporting and compliance.
December 5, 2013

CITY OF FERGUSON, MISSOURI
Page 3
MANAGEMENT’S DISCUSSION AND ANALYSIS
JUNE 30, 2013
As management of the City of Ferguson, Missouri (the “City”), we offer readers of the City's financial statements, this narrative overview and analysis of the financial activities of the City for the fiscal year ended June 30, 2013. We encourage readers to consider the information presented here in conjunction with additional information we have furnished in our letter of transmittal, which can be found within this report. Financial Highlights
On a government-wide basis, at the end of the current fiscal year, the City's assets exceeded its liabilities by $28,461,568. This represents an increase of $2,297,613 compared to the prior year.
As of the close of the current fiscal year, the City's governmental funds reported combined ending fund balances of $25,345,003. This represents an increase of $4,632,918 in comparison to the prior year.
The City's long-term debt increased by $7,209,763 (net) during the current fiscal year to $23,933,000. This increase is due to the issue of $9,055,000 of general obligation debt offset by repayments on existing debt issues.
Overview of the Financial Statements This discussion and analysis is intended to serve as an introduction to the City's basic financial statements. The City's basic financial statements comprise three components: 1) government-wide financial statements, 2) fund financial statements, and 3) notes to the basic financial statements. This report also contains required supplemental information, other supplemental information, and statistical information in addition to the basic financial statements. Government-Wide Financial Statements The government-wide financial statements are designed to provide readers with a broad overview of the City's finances, in a manner similar to a private-sector business. Note that the government-wide financial statements exclude fiduciary fund activities. The statement of net position presents information on all of the City's assets, deferred outflows and liabilities, with the reported as net position. Over time, increases or decreases in net position may serve as a useful indicator of whether the financial position of the City is improving or deteriorating. The statement of activities presents information showing how the City's net position changed during the most recent fiscal year. All changes in net position are reported as soon as the underlying event giving rise to the change occurs, regardless of the timing of related cash flows. Thus, revenues and expenses are reported in this statement for some items that will only result in cash flows in future fiscal periods (e.g., uncollected taxes).

CITY OF FERGUSON, MISSOURI Management’s Discussion and Analysis (continued)
Page 4
The government-wide financial statements distinguish functions of the City that are principally supported by taxes and intergovernmental revenues (governmental activities) from other functions that are intended to recover all or a significant portion of their costs through user fees and charges (business-type activities). The governmental activities of the City include general government, public safety, highways and streets, community development, and culture and recreation. The City does not have any business-type activities. Fund Financial Statements A fund is a grouping of related accounts that is used to maintain control over resources that have been segregated for specific activities or objectives. The City of Ferguson, Missouri, like other state and local governments, uses fund accounting to ensure and demonstrate compliance with finance-related legal requirements. All of the funds of the City of Ferguson, Missouri can be divided into two categories: governmental funds and fiduciary funds. Governmental funds. Governmental funds are used to account for essentially the same function reported as governmental activities in the government-wide financial statements. However, unlike the government-wide financial statements, governmental fund financial statements focus on near-term inflows and outflows of expendable resources, as well as on balances of expendable resources available at the end of the fiscal year. Such information may be useful in evaluating a government's near-term financing requirements. Because the focus of governmental funds is narrower than that of the government-wide financial statements, it is useful to compare the information presented for the governmental funds with similar information presented for governmental activities in the government-wide financial statements. By doing so, readers may better understand the long-term impact of the government's near-term financial decisions. Both the governmental fund balance sheet and the governmental fund statement of revenues, expenditures, and changes in fund balance provide a reconciliation to facilitate this comparison between governmental funds and the government-wide governmental activities. The City maintains several individual governmental funds. Information is presented separately in the governmental fund balance sheet and in the governmental fund statement of revenues, expenditures, and changes in fund balances for the General Fund, Parks Fund and Capital Improvements Sales Tax Fund all of which are considered major funds. Data from the other governmental funds are combined into a single, aggregated presentation called "other non-major funds." Individual fund data for each of these non-major governmental funds is provided in the form of combining statements in the other supplementary information section of this report. The City adopts an annual appropriated budget for its General Fund, Parks [Special Revenue] Fund, Capital Improvements Sales Tax [Capital Projects] Fund, Halls Ferry TIF Bonds [Debt Service] Fund, Special Business District [Special Revenue] Fund, Sewer Lateral [Special Revenue] Fund, Downtown TIF Redevelopment [Capital Projects] Fund, Certificates of Participation [Debt Service] Fund, General Obligation Bonds [Debt Service] Fund and Local Improvement [Capital Projects] Fund. Budgetary comparison statements have been provided for all budgeted funds to demonstrate legal compliance with the respective adopted budget. As of June 30, 2013, Local Improvements [Capital Projects] Fund has been liquidated and its assets transferred to Capital Improvements Sales Tax Fund.

CITY OF FERGUSON, MISSOURI Management’s Discussion and Analysis (continued)
Page 5
Fiduciary funds. Fiduciary funds are used to account for resources held for the benefit of parties outside the government. Fiduciary funds are not reflected in the government-wide financial statements because the resources of those funds are not available to support the City of Ferguson, Missouri's own programs. The accounting used for fiduciary funds is much like that used for proprietary funds. Notes to the Financial Statements. The notes provide additional information that is essential to a full understanding of the data provided in the government-wide and fund financial statements. Required Supplemental information. In addition to the basic financial statements and accompanying notes, this report also presents certain required supplemental information. Other Supplemental Information The combining and individual fund statements referred to earlier in connection with non-major governmental funds are presented immediately following the required supplemental information. Government-Wide Financial Analysis - Financial Analysis of the City as a Whole As noted earlier, net position may serve over time as a useful indicator of a government's financial position. In the case of the City, assets and deferred outflows exceeded liabilities by $28,461,568 at June 30, 2013. The largest portion of the City's net position reflects its investment in capital assets (e.g., land, buildings, machinery and equipment and infrastructure) less any related debt used to acquire those assets that is still outstanding. The City uses these capital assets to provide services to citizens; consequently, these assets are not available for future spending. Although the City's investment in its capital assets is reported net of related debt, it should be noted that the resources needed to repay this debt must be provided from other sources, since the capital assets themselves cannot be used to liquidate these liabilities.
2013 2012
AssetsCurrent and other assets 28,552,966$ 23,602,841$ Capital assets, net 26,843,375 21,813,253
Total Assets 55,396,341 45,416,094
Deferred Outflows 613,226 -
LiabilitiesOther liabilities 2,969,234 2,258,258 Long-term liabilities 24,578,765 16,798,287
Total Liabilities 27,547,999 19,056,545
Net PostionInvested in capital assets, net of related debt 10,525,807 7,962,476 Restricted 7,376,914 9,566,443 Unrestricted 10,558,847 8,830,630
Total Net Position 28,461,568$ 26,359,549$
Statement of Net PositionGovernmental Activities

CITY OF FERGUSON, MISSOURI Management’s Discussion and Analysis (continued)
Page 6age 6
Governmental Activities As a result of continued challenging economic circumstances, the City strongly attempts to budget and spend at a “break-even” or on a “balanced budget” basis at the governmental fund level, as evidenced by its fund balance statements on page 16 and its published budget. As previously described, on a government-wide basis, the City’s governmental activities include its transactions treated in a manner similar to a private sector business. A listing of these items is included on page 17. On a government-wide basis, governmental activities resulted in the City’s net position increasing by $2,297,613, difference in end of year net position, minus prior period adjustment. This increase arises principally from the recognition of repayment of debt principal of approximately $1,845,000. On the whole, on a government-wide basis, the increase in net position from governmental activities of $2,297,613 for the fiscal year ended June 30, 2013 exceeded that of the prior fiscal year of $2,265,522. The table on the following page and the following narrative illustrate key elements of this increase in net position as a result of governmental activities.
The increase in total revenues of $1,949,616 is due largely to the following: Capital and operating grant revenues increased as a result of – Substantial completion of the Forestwood road project Completing about 50% of the Suburban Avenue flood plain home buyout
program underwritten by FEMA and Community Development Block Grants (CDBG)
Completion of two years of road repair projects underwritten by CDBG FEMA disaster recovery grants resulting from tornado damage
Charges for services increased largely on the strength of greater traffic enforcement collections being offset by fewer fees in other areas such as contract dispatching, permitting and Parks Fund’s cultural excursions
Increased property tax receipts in the City’s General Fund authorized by the City’s voters in August 2012 being offset by lower than anticipated sales tax collections
Market holding losses of over $250,000 in June 2013 as a result of informational disclosures made by the Federal Reserve Bank and lower rates of returns on the City’s investment portfolios
Collection of insurance proceeds and trust insurance rebates recorded as Other Revenue
Expenses increased by $1,917,000 as a result of the following: Personnel costs as a whole rose by over $400,000 largely as a result of both wage
rate and health and workers compensation insurance increases The aforementioned home buyout program contributed over $450,000 of
uncapitalized expenditures

CITY OF FERGUSON, MISSOURI Management’s Discussion and Analysis (continued)
Page 7age 7
Tornado related disaster recovery expenditures were over $480,000 which were offset at a rate of 85% by previously mentioned FEMA grant
Uncapitalized street replacement costs accounted for almost $490,000 of additional expenditures
Change in Net Position The moderate Change in Net Position of $32,091 is the result of revenues increasing at about the same rate as expenditures. In some cases, like the uncapitalized street replacement program, home buyout program and disaster recovery, the expense and related revenue move in tandem. In other cases, increased expenses were offset by commensurate increases in unrelated revenues.
2013 2012 Difference
RevenuesProgram revenues:
Charges for services 3,935,010$ 3,826,295$ 108,715$ Capital and operating grants 1,971,665 498,989 1,472,676
General revenues:Taxes 13,416,319 12,817,755 598,564 Investment income (66,290) 245,779 (312,069) Other revenue 124,487 42,757 81,730
Total Revenues 19,381,191 17,431,575 1,949,616
ExpensesGeneral government 1,657,963 1,490,297 167,666 Public safety 8,454,328 8,068,845 385,483 Highways and streets 3,472,835 2,783,537 689,298 Community development 1,032,783 539,542 493,241 Culture and recreation 1,669,835 1,604,340 65,495 Interest on long-term debt 795,834 679,492 116,342
Total Expenses 17,083,578 15,166,053 1,917,525
Change in net position 2,297,613 2,265,522 32,091
Net PositionBeginning of year, as previously stated 26,359,549 24,094,027 2,265,522 Correction for prior period adjustment (195,594) - (195,594) Beginning of year, as restated 26,163,955 24,094,027 2,069,928
Total Net Position 28,461,568$ 26,359,549$ 2,102,019$
Statement of Net PositionGovernmental Activities

CITY OF FERGUSON, MISSOURI Management’s Discussion and Analysis (continued)
Page 8age 8
Financial Analysis of the City of Ferguson, Missouri's Funds
As noted earlier, the City uses fund accounting to ensure and demonstrate compliance with finance-related legal requirements. Governmental Funds The focus of the City's governmental funds is to provide information on inflows, outflows, and balances of available spendable resources. Such information is useful in assessing the City's financing requirements. In particular, unassigned fund balance may serve as a useful measure of a government's net resources available for spending at the end of the fiscal year. The General Fund is the main operating fund of the City. At June 30, 2013, the unassigned fund balance of the General Fund was $10,308,718, and the total fund balance was $10,500,066. The difference of $191,348 represents non-spendable fund balance (prepaid items and inventory). As a measure of the General Fund's liquidity, it may be useful to compare unassigned fund balance to total fund expenditures. Unassigned fund balance represents 81% of total General Fund expenditures of $12,724,930 as compared to 79% in Fiscal Year 2012. As a result of the City's operations, the total fund balance of the General Fund increased by $838,132 or 8.6% from Fiscal Year 2012 to 2013, as compared with 8.9% in the previous year. This change in the current year's fund balance is mainly attributable to:
Moderate revenue growth in charges for services and significantly increased property tax collections made in anticipation of future increased operating costs and debt service costs related to its new Community Center
Continued, strong expenditure containment. Absent unbudgeted, unanticipated disaster recovery expenditures, expenses would have been below final budget by almost $100,000.
Changes in fund balances for other governmental funds are described as follows:
The total fund balance of the Capital Improvements Sales Tax Fund increased by almost $3.7 million entirely as a result of unspent bond issue proceeds. This is in addition to the approximately $4.6 million fund balance increase in the prior fiscal year. This outcome will reverse in the next fiscal year as renovation of the Community Center and Police Department should be substantially completed.
The fund balance of the Sewer Lateral Fund increased by slightly less than 6%. This represents an approximately 40% reduction in the anticipated rate of increase. This decrease was the result of stronger than anticipated consumer utilization late in the fiscal year and a slight fall off in revenue collections.
The Downtown TIF Fund’s experienced a slightly less than 10% increase in fund balance largely as a result of slightly stronger than anticipated tax collections.
The fund balance of the General Obligation Bond Fund increased by $163,000 to $414,000 as the fund continues to build a debt service reserve

CITY OF FERGUSON, MISSOURI Management’s Discussion and Analysis (continued)
Page 9age 9
As previously disclosed in its annual budget, the Local Improvements Fund was eliminated and its assets were transferred to the Capital Improvements Sales Tax Fund.
Fiduciary Funds The City maintains trust and agency funds to account for monies received and held for the benefit of others for the following purposes:
Assets of the Pension Plan accumulated to provide benefits for all vested
participants. Bond deposits held to ensure a defendant's appearance in court.
Capital Assets The City has invested $26,843,375, net of depreciation, in a broad range of capital assets as of June 30, 2013. This investment in capital assets is summarized as follows.
Additional information regarding the City's capital assets may be found in Note 5 of the Notes to Financial Statements. Long-Term Debt The City’s outstanding long-term debt obligations for governmental activities increased by slightly more than $7.2 million to $23,933,000 at June 30, 2013 compared to $16,723,237 in 2012. The net increase in the City's long-term debt obligations is the result of the City’s issuance of $9,055,000 of certificates of participation bonds January 2013 which were offset by principal payments of about $1,845,000.
2013 2012
Land 3,606,442$ 2,668,542$ Construction in progress 1,429,621 2,569,374 Buildings and other improvements 13,566,434 8,051,237 Machinery and equipment 611,459 657,380 Motor vehicles 2,219,412 2,233,157 Infrastructure 5,410,008 5,633,563
Total 26,843,375$ 21,813,253$
Capital Assets, Net ofDepreciation

CITY OF FERGUSON, MISSOURI Management’s Discussion and Analysis (continued)
Page 10age 10
The following summarizes the City's governmental activities debt:
Additional information regarding the City's long-term debt may be found in Note 6 of the Notes to Financial Statements. Significant Variances between Budgets and Actual Results The following represent the most significant variances between final budget and actual results -
In the General Fund, the FEMA disaster recovery grant and the underlying expenditures In the Parks Fund, a fall-off in (a) excursion revenue and corresponding expenses and (b)
certain grant program operating expenses and the corresponding operating grant revenue In the Capital Improvements Sales Tax Fund, capital outlay expenditures lagged budget
only as a timing difference, as they will be incurred in the following fiscal year. In addition, because fewer dollars were spent, fewer capital grant revenues dollars were included in revenues.
As previously indicated, unanticipated last half year activities occurred in the following funds -
o Downtown TIF Fund, revenues were stronger than anticipated o Sewer Lateral Fund, service demand was stronger than anticipated
In the Certificates of Participation Fund, Series 2013 issuance costs were greater than anticipated
In the General Obligation Bond Fund, additional revenues were collected to build a reserve
All funds (i.e., General, Capital Improvements Sales Tax, Sewer Lateral and Halls Ferry TIF) holding investment portfolios, experienced significant unanticipated market holding losses in June as a result of Federal Reserve Bank actions.
Economic Factors and Next Year's Budget Reviewing fiscal year 2012-2013, while looking ahead to fiscal year 2013-2014, the City of Ferguson has continued to strengthen its position with conservative budgeting, a heightened focus on necessary capital improvements to the City's physical infrastructure and efforts to
2013 2012
Tax Increment Revenue Bonds, Series 2005 1,810,000$ 2,545,000$ Variable Rate Capital Improvement Bonds 2005 3,189,950 3,549,950 Certificates of Participation, Series 2012 1,870,000 2,065,000 Certificates of Participation, Series 2013 9,055,000 - General Obligation Bonds, Series 2011 7,345,000 7,670,000 Capital leases 663,050 893,287
Total 23,933,000$ 16,723,237$
Outstanding Long-Term DebtObligations

CITY OF FERGUSON, MISSOURI Management’s Discussion and Analysis (continued)
Page 11age 11
modernize critical City equipment and processes. These efforts have been and continue to be done, while maintaining a constant focus on economic development and the benefits it brings to the City. The financial condition of the City of Ferguson continues to be extremely strong andpresently stable. This will prove helpful as the country and local economy continue to suffer from an extremely slow and anemic economic recovery. The theme of the proposed fiscal year 2013-2014 budget can best be described as continued strategic action. This strategic action is built upon extensive efforts by the City Council and City administration to fully review the City's operations and to develop departmental action plans that will be implemented throughout this and future fiscal years. Expenditures, efforts and investments are being focused on areas deemed most important to the current and long term operational and fiscal health of the City and its residents. These strategic investments will call upon focused, open and communicative financial management efforts by all City departments and officials. These efforts will focus on economic development, while simultaneously maintaining personnel and, accordingly, service levels. In the face of static revenue sources, these efforts will undoubtedly result in some reserve consumption. Requests for Information This financial report is designed to provide a general overview of the City of Ferguson, Missouri's finances for all those with an interest in the government's finances. Questions concerning any of the information provided in this report or requests for additional financial information should be addressed to the Office of the Director of Finance, City of Ferguson, Missouri, 110 Church Street, Ferguson, MO 63135.

This page intentionally left blank

Basic Financial Statements

CITY OF FERGUSON, MISSOURI
The accompanying notes are an integral part of these financial statements Page 12
STATEMENT OF NET POSITION JUNE 30, 2013
Governmental Activities
ASSETS
Cash and investments 15,800,432$
Taxes receivable:
Sales taxes 1,050,868
Other taxes 380,232
Property Taxes 451,166
Accounts receivables 2,004,461
Prepaid expenses 58,651
Inventories 132,697
Cash and investments - restricted 8,674,459
Capital assets - net:
Nondepreciable 5,036,063
Depreciable 21,807,312
TOTAL ASSETS 55,396,341
DEFERRED OUTFLOWS OF RESOURCES
Bond refunding 325,358
Accumulated decrease in fair value of hedging derivatives 287,868
TOTAL DEFERRED OUTFLOWS OF RESOURCES 613,226
LIABILITIES
Accounts payable 1,746,932
Wages and benefits payable 341,139
Other liabilities 198,274
Accrued interest payable 241,741
Unearned revenue 153,280
Derivative instruments liability - interest rate swap 287,868
Noncurrent liabilities:
Due within one year 2,207,467
Due in more than one year 22,371,298
TOTAL LIABILITIES 27,547,999
NET POSITION
Net investment in capital assets 10,525,807
Restricted for:
Parks 1,386,661
Capital Projects 2,382,253
Debt Service 1,552,654
Downtown TIF 1,188,820
Sewer Lateral 866,526
Unrestricted 10,558,847
TOTAL NET POSITION 28,461,568$

CITY OF FERGUSON, MISSOURI
The accompanying notes are an integral part of these financial statements Page 13
STATEMENT OF ACTIVITIES FOR THE YEAR ENDED JUNE 30, 2013
ExpensesCharges for
Services
Operating Grants and Contribu-
tions
Capital Grants and Contribu-
tionsGovernmental
Activities
Functions/Programs
Governmental Activities
General government 1,657,963 772,859 472,520 (412,584)$
Public safety 8,454,328 2,619,331 61,090 (5,773,907)
Highway and streets 3,472,835 231,883 918,702 (2,322,250)
Community development 1,032,783 381,875 (650,908)
Culture and recreation 1,669,835 310,937 109,741 27,737 (1,221,420)
Interest and fiscal charges 795,834 (795,834)
TOTAL GOVERNMENTAL
ACTIVITIES 17,083,578$ 3,935,010$ 170,831$ 1,800,834$ (11,176,903)
7,483,584
3,421,789
2,453,095
57,851
(66,290)
124,487
13,474,516
2,297,613
26,163,955
28,461,568$
Other revenue
TOTAL GENERAL REVENUES
CHANGE IN NET POSITION
NET POSITION - BEGINNING OF YEAR
NET POSITION - END OF YEAR
Investment income
Net (Expense) Revenue and
Changes in Net Position
Program Revenues
Taxes:
Sales tax
Property tax
Utility tax
Other taxes

CITY OF FERGUSON, MISSOURI
The accompanying notes are an integral part of these financial statements Page 14
BALANCE SHEET - GOVERNMENTAL FUNDS JUNE 30, 2013
Nonmajor
Funds
General Fund Parks Fund
Capital Improve-
ments Sales Tax Fund
Other Govern- mental Funds
Total Governmental
Funds
ASSETS
Cash and investments 7,439,551$ 1,918,706$ 5,306,314$ 1,135,861$ 15,800,432$
Taxes receivable:
Sales 558,210 178,030 169,255 145,373 1,050,868
Property 223,538 72,065 - 155,563 451,166
Other 380,232 - - - 380,232
Accounts receivable 1,095,688 11,858 896,915 - 2,004,461
Due from (to) other funds 2,419,229 (745,386) (2,950,305) 1,276,462 -
Prepaid items 58,651 - - - 58,651
Inventory 132,697 - - - 132,697
Restricted: -
Cash and investments - - 7,760,000 914,459 8,674,459
TOTAL ASSETS 12,307,796$ 1,435,273$ 11,182,179$ 3,627,718$ 28,552,966$
LIABILITIES
Accounts payable 665,500$ 23,396$ 1,039,926$ 18,110$ 1,746,932$
Wages and benefits payable 315,923 25,216 - - 341,139
Deferred Revenue 50,077 103,204 - - 153,281
Other liabilities 198,274 - - - 198,274
TOTAL LIABILITIES 1,229,774 151,816 1,039,926 18,110 2,439,626
DEFERRED INFLOWS
OF RESOURCES
Unavailable revenue:
Property taxes 188,931 60,909 - 129,472 379,311
Assessments 389,026 - - - 389,026
TOTAL 577,957 60,909 - 129,472 768,337
FUND BALANCES:
Nonspendable 191,348 - - - 191,348
Restricted for:
Parks - 1,222,548 - - 1,222,548
Capital Projects - - 10,142,253 536 10,142,789
Debt Service - - - 1,475,907 1,475,907
Downtown TIF - - - 1,136,095 1,136,095
Sewer Lateral - - - 866,526 866,526
Assigned to:
Special Business District - - - 1,072 1,072
Capital Projects - - - - -
Unassigned 10,308,718 - - - 10,308,718
TOTAL FUND BALANCES 10,500,066 1,222,548 10,142,253 3,480,136 25,345,003
TOTAL LIABILITIES AND
DEFERRED INFLOWS
OF RESOURCES, AND
FUND BALANCES 12,307,796$ 1,435,273$ 11,182,179$ 3,627,718$ 28,552,966$
Major Funds

CITY OF FERGUSON, MISSOURI
The accompanying notes are an integral part of these financial statements Page 15
RECONCILIATION OF THE BALANCE SHEET OF GOVERNMENTAL FUNDS TO THE STATEMENT OF NET POSITION
JUNE 30, 2013
Total Fund Balance - Governmental Funds 25,345,003$
Amounts reported for governmental activities in the statement of net position are
different because:
Capital assets used in governmental activities are not financial resources and,
therefore, are not reported in the governmental funds. 26,843,375
Receivables not collected in the current period are not available to pay
current expenditures and, therefore, are deferred in the funds. 768,338
Deferred amounts from refunding of debt are not
reported in governmental funds. 325,358
Interest on long-term debt is accrued as a liability in the government-wide
statement, but is not recognized in the governmental funds until due. (241,741)
Certain long-term liabilities are not due and payable in the current period
and, therefore, are not reported as liabilities in the governmental funds.
Long-term liabilities at year-end consisted of:
Net other post-employment benefit obligation (39,612)
Accrued compensated absences (487,295)
Outstanding debt (24,051,858)
Total Net Position - Governmental Activities 28,461,568$
CITY OF FERGUSON, MISSOURI
The accompanying notes are an integral part of these financial statements Page 16
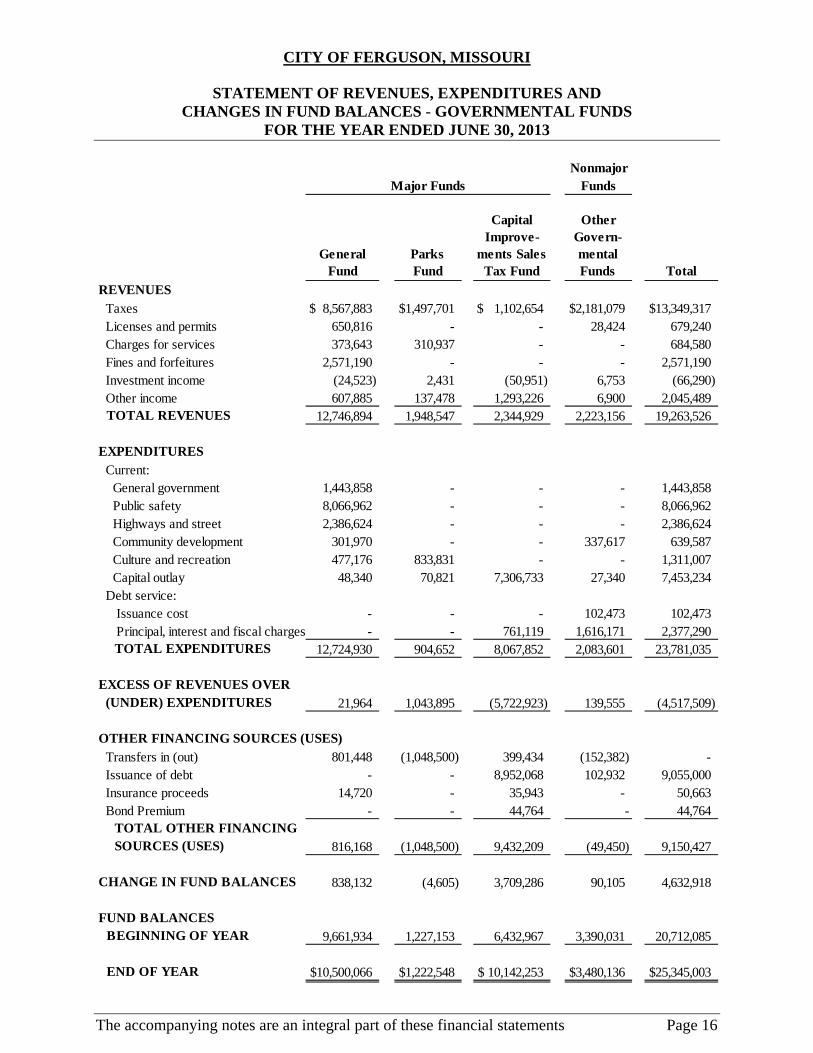
STATEMENT OF REVENUES, EXPENDITURES AND CHANGES IN FUND BALANCES - GOVERNMENTAL FUNDS
FOR THE YEAR ENDED JUNE 30, 2013
NonmajorFunds
General Fund
Parks Fund
Capital Improve-
ments Sales Tax Fund
Other Govern- mental Funds Total
REVENUES Taxes 8,567,883$ 1,497,701$ 1,102,654$ 2,181,079$ 13,349,317$ Licenses and permits 650,816 - - 28,424 679,240 Charges for services 373,643 310,937 - - 684,580 Fines and forfeitures 2,571,190 - - - 2,571,190 Investment income (24,523) 2,431 (50,951) 6,753 (66,290) Other income 607,885 137,478 1,293,226 6,900 2,045,489
TOTAL REVENUES 12,746,894 1,948,547 2,344,929 2,223,156 19,263,526
EXPENDITURES Current: General government 1,443,858 - - - 1,443,858 Public safety 8,066,962 - - - 8,066,962 Highways and street 2,386,624 - - - 2,386,624 Community development 301,970 - - 337,617 639,587 Culture and recreation 477,176 833,831 - - 1,311,007 Capital outlay 48,340 70,821 7,306,733 27,340 7,453,234 Debt service: Issuance cost - - - 102,473 102,473 Principal, interest and fiscal charges - - 761,119 1,616,171 2,377,290
TOTAL EXPENDITURES 12,724,930 904,652 8,067,852 2,083,601 23,781,035
EXCESS OF REVENUES OVER (UNDER) EXPENDITURES 21,964 1,043,895 (5,722,923) 139,555 (4,517,509)
OTHER FINANCING SOURCES (USES)
Transfers in (out) 801,448 (1,048,500) 399,434 (152,382) - Issuance of debt - - 8,952,068 102,932 9,055,000 Insurance proceeds 14,720 - 35,943 - 50,663 Bond Premium - - 44,764 - 44,764
TOTAL OTHER FINANCING SOURCES (USES) 816,168 (1,048,500) 9,432,209 (49,450) 9,150,427
CHANGE IN FUND BALANCES 838,132 (4,605) 3,709,286 90,105 4,632,918
FUND BALANCESBEGINNING OF YEAR 9,661,934 1,227,153 6,432,967 3,390,031 20,712,085
END OF YEAR 10,500,066$ 1,222,548$ 10,142,253$ 3,480,136$ 25,345,003$
Major Funds

CITY OF FERGUSON, MISSOURI
The accompanying notes are an integral part of these financial statements Page 17
RECONCILIATION OF THE STATEMENT OF REVENUES, EXPENDITURES AND CHANGES IN FUND BALANCES OF GOVERNMENTAL
FUNDS TO THE STATEMENT OF ACTIVITIES FOR THE YEAR ENDED JUNE 30, 2013
Net Change in Fund Balances - Governmental Funds 4,632,918$
Amounts reported for governmental activities in the statement of activities
are different because:
Revenues that do not provide current financial resources are not
included in the fund financial statements. 67,002
Acquisition of capital assets requires the use of current financial
resources but has no effect on net position. 6,400,962
The cost of capital assets is allocated over their estimated useful lives
and is reported as depreciation in the statement of activities. (1,370,835)
Governmental funds report cost of debt issuance, premiums and discounts.
These amounts are deferred and amortized in the statement of activities. (44,763)
Some expenses will not be satisfied using current
financial resources and, therefore, are not recorded as expenditures
in the fund statements.
Net other post-employment benefits obligations (6,110)
Accrued interest (85,116)
Accrued compensated absences (10,485)
Deferred amounts from bond refundings are reported in the
statement of net position and amortized over the lives of the bonds (78,059)
Repayment of principal on bonds and capital leases are expenditures in
the governmental funds and reduce long-term liabilities
in the statement of net assets.
Principal paid on debt and capitalized leases 1,845,237
Amortization of refunding
Amortization of premium 1,862
Government funds report, proceeds from issuance of debt as other financing source. However, in the statement of net position, these amounts are included as long-term liabilities. (9,055,000)
Change in Net Position - Governmental Activities 2,297,613$

CITY OF FERGUSON, MISSOURI
The accompanying notes are an integral part of these financial statements Page 18
STATEMENT OF FIDUCIARY NET POSITION - FIDUCIARY FUNDS JUNE 30, 2013
Pension Agency
Trust Fund Fund
ASSETS
Cash and cash equivalents -$ 153,305$
Accrued Interest 45,846
Investments:
Common Stock 10,153,643 -
Equity mutual funds 4,822,935 -
Money market mutual funds 289,834 -
Corporate obligations 2,755,548 -
U. S. Agency securities 2,439,923 -
U. S. Treasury notes 777,112
Municipal bonds 142,308 -
TOTAL ASSETS 21,427,149 153,305
LIABILITIES
Accounts payable 14,313 153,305
NET POSITION
Held in trust for pension benefits 21,412,846$ -$

CITY OF FERGUSON, MISSOURI
The accompanying notes are an integral part of these financial statements Page 19
STATEMENT OF CHANGES IN FIDUCIARY NET POSITION - FIDUCIARY FUNDS
FOR THE YEAR ENDED JUNE 30, 2013
Pension Trust
Fund
ADDITIONS
Contributions 496,313$
Interest and dividends 594,733
Net Appreciation in fair value of investments 1,739,211
TOTAL ADDITIONS 2,830,257
DEDUCTIONS
Benefits paid 1,181,669
Administrative fees 64,886
TOTAL DEDUCTIONS 1,246,555
CHANGE IN NET POSITION 1,583,702
NET POSITION HELD IN TRUST FOR BENEFITS -
BEGINNING OF YEAR 19,829,144
END OF YEAR 21,412,846$

CITY OF FERGUSON, MISSOURI
Page 20
NOTES TO FINANCIAL STATEMENTS JUNE 30, 2013
1. SUMMARY OF SIGNIFICANT ACCOUNTING POLICIES
The financial statements of the City of Ferguson, Missouri (the “City”) have been prepared in conformity with U.S. generally accepted accounting principles (GAAP) as applied to government units. The Governmental Accounting Standards Board (GASB) is the accepted standard-setting body for establishing governmental accounting and financial reporting principles. The more significant of the City's accounting policies are described below:
A. REPORTING ENTITY
The City was incorporated on November 12, 1894. The City operates under a City Manager/Council, home rule charter form of government. The present Charter of the City was adopted on February 3, 1998. Services provided by the City to its residents include public safety (police and fire protection), street maintenance and improvements, sanitation, culture and recreation, public improvements, planning and zoning, and general governmental services. The City defines its financial reporting entity in accordance with provisions established by GASB. GASB requirements for inclusion of component units are primarily based upon whether the City's governing body has any significant amount of financial accountability for potential component units (PCU). The City is financially accountable if it appoints a voting majority of a PCU's governing body and is able to impose its will on that PCU, or there is a potential for the PCU to provide specific financial benefits to, or impose specific financial burdens on, the City. Based on these criteria, the City has determined that its financial reporting entity consists of the City (the primary government) and no component units.
Related Organizations
The City provides limited services to the Ferguson Municipal Public Library District (the “District”). In addition, the City Council appoints all of the members of the District's Board of Directors. The City's accountability for this entity does not extend beyond these responsibilities.
The Ferguson Neighborhood Improvement Program (“FNIP”), a not-for-profit corporation established to assist in the rehabilitation and restoration of housing and residential properties in the City, is considered a related party. The FNIP Board of Directors is appointed by the City Council. The City's accountability for this entity does not extend beyond these responsibilities. Neither organization is included as a component unit within the City's financial reporting entity.

CITY OF FERGUSON, MISSOURI Notes to Financial Statements (continued)
Page 21
Government-Wide and Fund Financial Statements
The government-wide financial statements (i.e., the statement of net position and the statement of activities) report information on all of the non-fiduciary activities of the City. The effect of interfund activity has been removed from these statements.
The statement of activities demonstrates the degree to which the direct expenses of a given function or segment are offset by program revenues. Direct expenses are those which are clearly identifiable with a specific function or segment. Program revenues include 1) charges to customers or applicants who purchase, use, or directly benefit from goods, services, or privileges provided, 2) operating grants and contributions, and 3) capital grants and contributions. Taxes and other items not properly included among program revenues are reported instead as general revenues.
Separate financial statements are provided for governmental funds and fiduciary funds, even though the latter are excluded from the government-wide financial statements. Major individual governmental funds are reported as separate columns in the fund financial statements. All other governmental funds are reported in one column.
B. MEASUREMENT FOCUS, BASIS OF ACCOUNTING AND FINANCIAL STATEMENT PRESENTATION
The government-wide financial statements are reported using the economic resources measurement focus and the accrual basis of accounting. Fiduciary fund financial statements use the accrual basis of accounting. Revenues are recorded when earned and expenses are recorded when a liability is incurred, regardless of the timing of related cash flows. Property taxes are recognized as revenues in the year for which they are levied. Grants and similar items are recognized as revenues as soon as all eligibility requirements imposed by the provider have been met.
Governmental fund financial statements are reported using the current financial resources measurement focus and the modified accrual basis of accounting.
Revenues are recognized as soon as they are both measurable and available. Revenues are considered to be available when they are collected within the current period, or soon enough thereafter to pay liabilities of the current period. For this purpose, the City considers revenues to be available if they are collected within 60 days of the end of the current fiscal period.
Expenditures are recorded when a liability is incurred, as under accrual accounting. However, debt service expenditures, as well as expenditures related to claims and judgments and compensated absences, are recorded only when payment is due (i.e., matured).
CITY OF FERGUSON, MISSOURI Notes to Financial Statements (continued)
Page 22
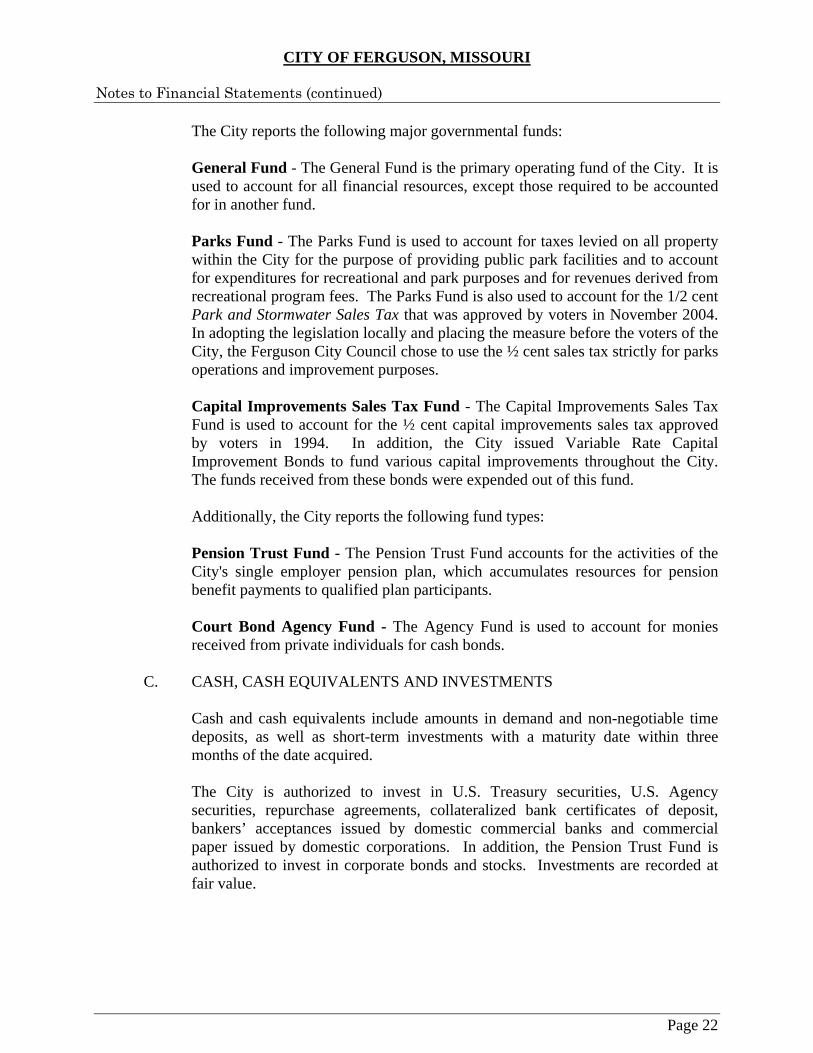
The City reports the following major governmental funds:
General Fund - The General Fund is the primary operating fund of the City. It is used to account for all financial resources, except those required to be accounted for in another fund.
Parks Fund - The Parks Fund is used to account for taxes levied on all property within the City for the purpose of providing public park facilities and to account for expenditures for recreational and park purposes and for revenues derived from recreational program fees. The Parks Fund is also used to account for the 1/2 cent Park and Stormwater Sales Tax that was approved by voters in November 2004. In adopting the legislation locally and placing the measure before the voters of the City, the Ferguson City Council chose to use the ½ cent sales tax strictly for parks operations and improvement purposes.
Capital Improvements Sales Tax Fund - The Capital Improvements Sales Tax Fund is used to account for the ½ cent capital improvements sales tax approved by voters in 1994. In addition, the City issued Variable Rate Capital Improvement Bonds to fund various capital improvements throughout the City. The funds received from these bonds were expended out of this fund.
Additionally, the City reports the following fund types:
Pension Trust Fund - The Pension Trust Fund accounts for the activities of the City's single employer pension plan, which accumulates resources for pension benefit payments to qualified plan participants.
Court Bond Agency Fund - The Agency Fund is used to account for monies received from private individuals for cash bonds.
C. CASH, CASH EQUIVALENTS AND INVESTMENTS
Cash and cash equivalents include amounts in demand and non-negotiable time deposits, as well as short-term investments with a maturity date within three months of the date acquired.
The City is authorized to invest in U.S. Treasury securities, U.S. Agency securities, repurchase agreements, collateralized bank certificates of deposit, bankers’ acceptances issued by domestic commercial banks and commercial paper issued by domestic corporations. In addition, the Pension Trust Fund is authorized to invest in corporate bonds and stocks. Investments are recorded at fair value.

CITY OF FERGUSON, MISSOURI Notes to Financial Statements (continued)
Page 23
D. RESTRICTED CASH AND INVESTMENTS
Cash and investments that are restricted for debt service payment and future capital expenditures are classified as restricted assets on the balance sheet because their use is limited by applicable debt covenants. In addition, unspent proceeds from the issuance of bonds are reported as restricted assets on the balance sheet.
E. CAPITAL ASSETS
Capital assets, which include property, equipment, and infrastructure (e.g., roads, bridges, sidewalks, and similar items), are reported in the government-wide financial statements. In general, capital assets are defined by the City as assets with an initial cost of more than $5,000 and an estimated useful life in excess of one year. Such assets are recorded at historical cost if purchased or constructed. Donated capital assets are recorded at the estimated fair market value at the date of donation. Infrastructure acquired prior to implementation of GASB 34 is not been reported in the financial statements.
The cost of normal maintenance and repairs that do not add to the value of the asset or materially extend the life of an asset or group of assets are not capitalized.
Depreciation is computed on the straight-line method, using the following asset lives:
Assets Years
Buildings 20 - 40 Improvements other than buildings 10 - 15 Machinery and equipment 5 - 10 Motor vehicles 3 - 20 Infrastructure 15 - 30
F. INVENTORIES AND PREPAID ITEMS
Inventories consist of expendable supplies held for consumption and are recorded as assets when purchased and expended when consumed. These inventories are stated at cost using the first-in, first out method.
Certain payments to vendors reflect costs applicable to future accounting periods and are recorded as prepaid items in both the government-wide and fund financial statements. The City has adopted the consumption method of accounting for prepaid items. That is, the asset is recorded when the payments to vendors are made, and the expenses are amortized in the appropriate accounting period.

CITY OF FERGUSON, MISSOURI Notes to Financial Statements (continued)
Page 24
G. COMPENSATED ABSENCES
Under terms of the City's personnel policy, employees are granted vacations based on length of service. Vacations accrue on January 1 of each year and must be taken within the same year as accrued. Compensatory time is available to all non-exempt employees at the rate of 1.5 hours for each overtime hour worked. Accrual of compensatory time is limited to a maximum of 240 hours, except that public safety, emergency response and seasonal employees are limited to a maximum of 480 hours. Upon termination, employees are paid for unused vacation and compensatory time. Sick leave is accumulated based upon length of service and is available only to provide compensation during periods of illness. No portion of accrued sick leave is payable to the employee upon termination and, therefore, is not reflected as a liability. Employees had accumulated earned vacation and compensatory time aggregating $487,295 at June 30, 2013, which has been recorded as a liability in the statement of net position. Based on City policies, it is assumed this balance will be liquidated within 12 months and any un-liquidated balance beyond that date will not misstate long-term liabilities.
H. DEFERRED REVENUE
Deferred revenue arises when assets are received before revenue recognition criteria have been satisfied. Certain grants received before eligibility criteria have been met and payments received in advance for recreational activities are reported as deferred revenue. In governmental fund financial statements, receivables that will not be collected within the available period have also been reported as deferred revenue.
I. LONG-TERM LIABILITIES
In the government-wide financial statements, long-term debt and other long-term obligations are reported as liabilities in the statement of net position. Debt premiums and discounts are deferred and amortized over the life of the debt using the straight-line method. Long-term debt is reported net of the applicable debt premium or discount and deferred amounts on refunding. In the fund financial statements, governmental fund types recognize debt premiums and discounts, as well as debt issuance costs, during the current period. The face amount of debt issued is reported as other financing sources. Premiums received on debt issuances are reported as other financing sources while discounts on debt issuances are reported as other financing uses. Issuance costs, whether or not withheld from the actual debt proceeds received, are reported as debt service expenditures.
CITY OF FERGUSON, MISSOURI Notes to Financial Statements (continued)
Page 25
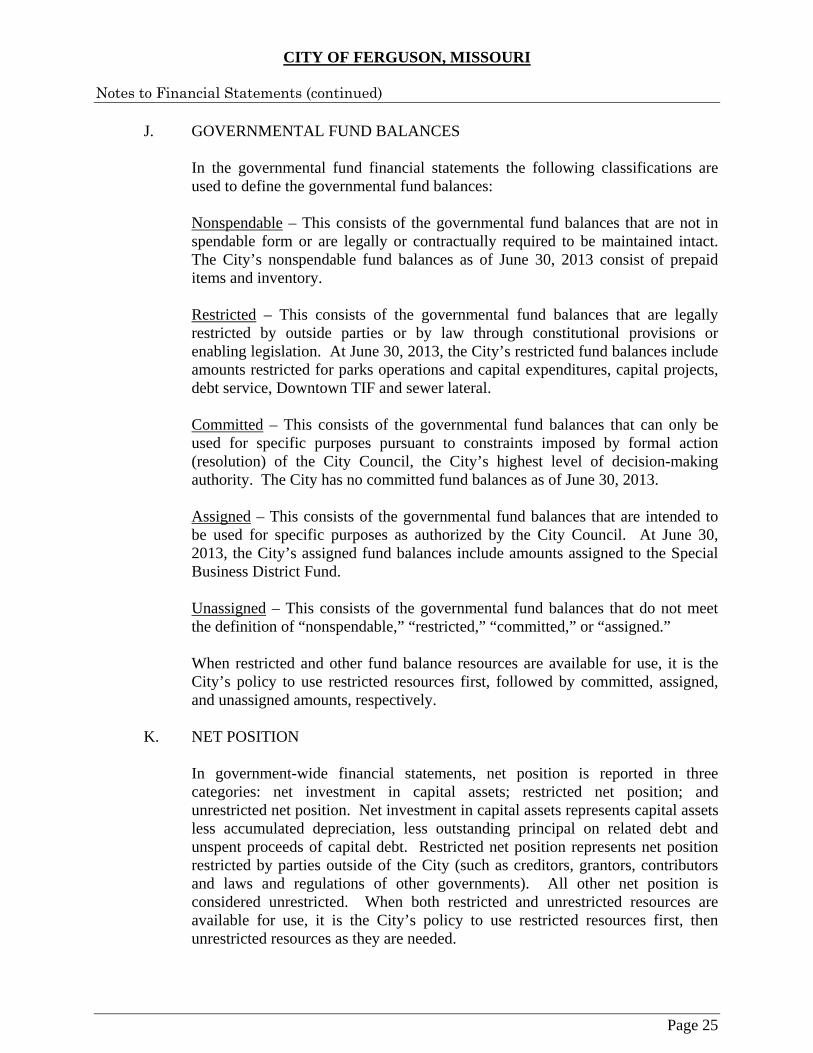
J. GOVERNMENTAL FUND BALANCES
In the governmental fund financial statements the following classifications are used to define the governmental fund balances: Nonspendable – This consists of the governmental fund balances that are not in spendable form or are legally or contractually required to be maintained intact. The City’s nonspendable fund balances as of June 30, 2013 consist of prepaid items and inventory. Restricted – This consists of the governmental fund balances that are legally restricted by outside parties or by law through constitutional provisions or enabling legislation. At June 30, 2013, the City’s restricted fund balances include amounts restricted for parks operations and capital expenditures, capital projects, debt service, Downtown TIF and sewer lateral. Committed – This consists of the governmental fund balances that can only be used for specific purposes pursuant to constraints imposed by formal action (resolution) of the City Council, the City’s highest level of decision-making authority. The City has no committed fund balances as of June 30, 2013. Assigned – This consists of the governmental fund balances that are intended to be used for specific purposes as authorized by the City Council. At June 30, 2013, the City’s assigned fund balances include amounts assigned to the Special Business District Fund. Unassigned – This consists of the governmental fund balances that do not meet the definition of “nonspendable,” “restricted,” “committed,” or “assigned.”
When restricted and other fund balance resources are available for use, it is the City’s policy to use restricted resources first, followed by committed, assigned, and unassigned amounts, respectively.
K. NET POSITION
In government-wide financial statements, net position is reported in three categories: net investment in capital assets; restricted net position; and unrestricted net position. Net investment in capital assets represents capital assets less accumulated depreciation, less outstanding principal on related debt and unspent proceeds of capital debt. Restricted net position represents net position restricted by parties outside of the City (such as creditors, grantors, contributors and laws and regulations of other governments). All other net position is considered unrestricted. When both restricted and unrestricted resources are available for use, it is the City’s policy to use restricted resources first, then unrestricted resources as they are needed.

CITY OF FERGUSON, MISSOURI Notes to Financial Statements (continued)
Page 26
L. INTERFUND TRANSACTIONS
Interfund transfers were used to 1) move revenues from the fund that ordinance or budget requires to collect them to the fund that ordinance or budget requires to expend them, or 2) reimburse other funds for debt service payments or services. Activities between funds that are representative of 1ending/borrowing arrangements outstanding at the end of the fiscal year are referred to as "due (to) from other funds" in the governmental fund financial statements.
M. USE OF ESTIMATES
The preparation of basic financial statements in conformity with U.S. generally accepted accounting principles requires management to make estimates and assumptions that affect the reported amounts in the basic financial statements and the accompanying notes. Actual results could differ from those estimates.
N. ALLOWANCE FOR UNCOLLECTIBLE ACCOUNTS
Based on management’s analysis, it believes the City has made sufficient allowances for uncollectable accounts receivable totaling approximately $109,000.

CITY OF FERGUSON, MISSOURI Notes to Financial Statements (continued)
Page 27
2. CASH AND INVESTMENTS
Cash and investments as of June 30, 2013 consist of the following:
Amount
Deposits:Cash on hand 1,060$ Demand deposits 14,348,546
14,349,606
Investments:Negotiable certificates of deposit 9,210,825 Money market mutual funds 366,441 U.S. Agency securities 548,019
10,125,285
Pension Trust and Agency Fund:Deposits:
Demand deposits 153,305 Investments:
Common stock 10,153,643 Equity mutual funds 4,822,935 Money market mutual funds 289,834 Corporate notes and bonds 2,801,394 Municipal bonds 142,308 U.S. Agency securities 2,439,923 U.S. Treasury notes 777,112
21,580,454
Total Deposits and Investments 46,055,345$
Reconciliation to the Financial Statements:Statement of Net Assets:
Cash and investments 15,800,432$ Cash and investments - restricted 8,674,459
Statement of Fiduciary Net Assets:Cash and investments - held by trustees 21,427,149 Cash and investments - restricted 153,305
46,055,345$
Type

CITY OF FERGUSON, MISSOURI Notes to Financial Statements (continued)
Page 28
Investments Authorized by the City’s Investment Policy
The table below identifies the investment types that are authorized by the City’s investment policy. Debt proceeds held by bond trustees are invested in accordance with the provisions of the trust indentures.
Interest Rate Risk
The City’s investment policy states that the City will minimize interest rate risk, the risk that the market value of securities in the portfolio will fail due to changes in general interest rates, by:
1. Structuring the investment portfolio so that securities mature to meet cash
requirements for ongoing operations, thereby avoiding the need to sell securities on the open market prior to maturity.
2. Investing operating funds primarily in shorter-term securities.
City PolicyAuthorized Investments Legal LimitUnited States Treasury securities NoneUnited States Agency securities 60%United States Agency callable securities 30%Repurchase agreements 50%Money market mutual funds NoneCertificates of deposit NoneCommercial paper 30%Bankers' acceptances 30%

CITY OF FERGUSON, MISSOURI Notes to Financial Statements (continued)
Page 29
Maturities of investments held at June 30, 2013 are as follows:
Credit Risk The City’s investment policy states that the City will minimize credit risk, the risk of loss due to the failure of the security issuer or backer, by: 1. Pre-qualifying the financial institutions, broker/dealers, intermediaries and advisors
with which the City will do business. 2. Diversifying the portfolio so that potential losses on individual securities will be
minimized. The credit quality ratings, as established by nationally recognized statistical rating organizations, of the City’s investments as of June 30, 2013, are provided in the table above.
Fair Less Than 1 - 5 6 - 10 Greater Than CreditValue One Year Years Years 10 Years Risk
Governmental ActivitiesNegotiable certificates of deposit 9,210,825$ 21,421$ 6,437,883$ 2,751,521$ -$ N/AMoney market mutual funds 366,441 366,441 - - - AAAFederal National Mortgage
Association securities 548,019 - 548,019 - - Total Governmental Activities 10,125,285$ 387,862$ 6,985,902$ 2,751,521$ -$
Pension Trust FundCommon stock 10,153,643$ 10,153,643$ -$ -$ -$ N/AEquity mutual funds 4,822,935 4,822,935 - - - N/AMoney market mutual funds 289,834 289,834 - - - AAACorporate notes and bonds 347,377 - 153,483 193,895 - ACorporate notes and bonds 139,478 - 139,478 - - AA+Corporate notes and bonds 1,020,229 - 655,353 364,876 - A-Corporate notes and bonds 190,162 - 190,162 - - BBBCorporate notes and bonds 280,797 - 280,797 - - BBB-Corporate notes and bonds 102,059 - 102,059 - - BBB+Corporate notes and bonds 169,769 - 169,769 - - BB+Fixed Income Funds 505,677 505,677 - - - Municipal bonds 142,308 142,308 Fannie MaeFederal Home Loan Bank securities 239,727 - 19,007 - 220,720 Federal Farm Credit Bank securities 109,393 - 109,393 - - Federal National Mortgage 689,278 - 167,150 208,724 313,403
Association securitiesGovernment National Mortgage 1,401,526 - 8,540 265,269 1,127,717
Association poolUnited States Treasury notes 777,112 - 693,447 83,666 -
Total Pension Trust Fund 21,381,303$ 15,914,397$ 2,688,636$ 1,116,430$ 1,661,840$

CITY OF FERGUSON, MISSOURI Notes to Financial Statements (continued)
Page 30
Custodial Credit Risk
For investments, custodial credit risk is the risk that in the event of the failure of the counterparty to a transaction, the City will not be able to recover the value of the investments or collateral securities that are in the possession of an outside party. In accordance with its policy, the City addresses custodial credit risk by prequalifying institutions with which the City places investments, diversifying the investment portfolio and maintaining a standard of quality for investments.
For deposits, custodial credit risk is the risk that in the event of bank failure, the City’s deposits may not be returned to it. Protection of the City’s deposits is provided by the Federal Deposit Insurance Corporation, by eligible securities pledged by the financial institution or by a single collateral pool established by the financial institution. The City’s policy requires a depository contract with each safekeeping bank that complies with the Financial Institutions Reform, Recovery and Enforcement Act of 1989. This will ensure the City’s security interest in collateral pledged to secure deposits is enforceable against the receiver of a failed institution.
Concentration of Credit Risk
According to the City’s investment policy, the City’s investments will be diversified to eliminate the risk of loss resulting from over concentration of assets in a specific maturity, a specific issuer or a specified class of security. Concentration of credit risk is required to be disclosed by the City for investments in any one issuer that represent 5% or more of total investments (excluding investments issued by or explicitly guaranteed by the U.S. Government, investments in mutual funds, investments in external investment pools and investments in other pooled investments). At June 30, 2013, the Pension Trust Fund did not have any investments subject to this disclosure. Of the investments in governmental activities, the City held investments in the following issuers that were over 5% of total investments at the government-wide level:
% of Total Investments Issuer Amount
Negotiable certificates of deposit
$9,210,825 91.0%
Federal National Mortgage
548,019 5.4 Association securities
3. PROPERTY TAX
Property taxes are levied in November of each year based on the assessed value of all real and personal property located within the City’s corporate boundaries, as of the previous January 1. Property taxes are due and collectible on December 31 and attach as an

CITY OF FERGUSON, MISSOURI Notes to Financial Statements (continued)
Page 31
enforceable lien on property as of the following January 1. Assessed values are established by the St. Louis County Assessor, subject to review by the County's Board of Equalization. The total assessed valuation of the City at September 15, 2012, upon which the 2012 tax levy was based, for real, personal, and public utility property was $198,062,436. The 2012 tax levy is collected in the City's 2013 fiscal year. The City is permitted by Missouri state statutes to levy taxes up to $1.00 per $100 of assessed valuation for general governmental services other than the payment of principal and interest on long-term debt, and in unlimited amounts for the payment of principal and interest on long-term debt. As authorized by the voters in passage of Proposition C in August 2012, City ordinances limit the tax levy for general governmental services other than the payment of principal and interest on long-term debt to $0.80 per $100 of assessed valuation. In April 2011, the City’s voters approved Proposition S. This proposition authorized the sale of general obligation bonds to provide funds for the construction of a replacement for the City’s Firehouse No. 1 and the levy of an ad valorem tax for the retirement of these bonds. The 2012 tax rates per $100 of assessed value are as follows:
Property Type General Fund Parks Fund GO Bond Fund Residential $ 0.8000 $ 0.1960 $ 0.3640 Agricultural 0.8000 0.1950 0.3640 Commercial 0.8000 0.1950 0.3640 Personal Property 0.8000 0.1980 0.3640
Property taxes are billed, collected and remitted to the City by the St. Louis County Collector of Revenue.
4. INTERFUND BALANCES
Due (to) from other funds as of June 30, 2013 are as follows:
Fund Due From Due To Net Due (To) From
General 6,556,829$ 4,137,598$ 2,419,231$ Parks 4,000 749,386 (745,386) Capital Improvements Sales Tax 2,890,140 5,840,446 (2,950,306) Nonmajor Governmental 7,983,836 6,707,375 1,276,461 Total 17,434,805$ 17,434,805$ -$
Interfund balances are the result of short-term advances between funds due to the timing of receipts and disbursements.

CITY OF FERGUSON, MISSOURI Notes to Financial Statements (continued)
Page 32
The following transfers were made during the fiscal year ended June 30, 2013
Transfers were made for the following purposes:
Expending Fund Recipient Fund Purpose
Parks, Sewer Lateral and Halls Ferry TIF
GeneralCost of goods and services provided by the receipient
Parks, General and Downtown TIF
Certificates of Participation
Debt Service
Downtown TIF and General
Special Business DistrictCost of goods and services provided by the receipient
Parks and Downtown TIF
Capital Improvements Sales Tax Fund
Cost of common fleet or other capital expenditures
Local ImprovementsCapital Improvements Sales Tax Fund
Reallocation of assets for common purpose
Fund Out In Net, In(Out)
General 3,296$ 804,744$ 801,448$ Parks 1,052,500 4,000 (1,048,500) Capital Improvements Sales Tax - 399,434 399,434 Nonmajor Governmental 502,166 349,784 (152,382) Total 1,557,962$ 1,557,962$ -$
Transfers

CITY OF FERGUSON, MISSOURI Notes to Financial Statements (continued)
Page 33
5. CAPITAL ASSETS
For the year ended June 30, 2013, capital asset activity was as follows:
BALANCE, BALANCE,BEGINNING ADDI- DEDUC- END
OF YEAR TIONS TIONS OF YEAR
Governmental activities:Capital assets, not being depreciated
Land 2,668,542$ 937,900$ -$ 3,606,442$ Construction in process 2,569,374 1,392,474 2,532,227 1,429,621
Total capital assets Not Being Depreciated 5,237,916 2,330,374 2,532,227 5,036,063
Capital assets being depreciated:Buildings and improvements 14,756,268 6,160,165 - 20,916,433Machinery and equipment 1,745,077 124,075 - 1,869,152Motor Vehicles 5,054,076 318,575 45,168 5,327,482Infrastructure 10,351,124 - - 10,351,124
Total Capital Assets, Being Depreciated 31,906,545 6,602,815 45,168 38,464,191
Less accumulated depreciation for:Buildings and improvements 6,705,035 644,963 - 7,349,998Machinery and equipment 1,087,697 169,996 - 1,257,693Motor Vehicles 2,820,920 332,320 45,168 3,108,072Infrastructure 4,717,561 223,556 - 4,941,117
Total Accumulated Depreciation 15,331,213 1,370,835 45,168 16,656,880
Total Capital Assets,Being Depreciated, Net 16,575,332 5,231,980 - 21,807,311
Total Governmental Activities 21,813,248$ 7,562,354$ 2,532,227$ 26,843,375$
Depreciation expense was charged to functions/programs of the Primary Government as follows:Governmental activities:
General governments 182,098$ Public safety 351,256Highways and streets 476,666Culture and recreation 360,815 Total depreciation expense - governmental activities 1,370,835$

CITY OF FERGUSON, MISSOURI Notes to Financial Statements (continued)
Page 34
6. LONG·TERM DEBT
Changes in the City's long-term debt, for the year ended June 30, 2013, are as follows: Balance, Balance, Amounts
Beginning End Due Withinof Year Additions Reductions of Year One Year
Governmental Activities:Tax Increment Revenue Bonds 2,545,000$ -$ (735,000)$ 1,810,000$ 800,000$ Variable Rate Capital
Improvement Bonds 3,549,950 - (360,000) 3,189,950 370,000 Certificates of Participation,
Series 2012 2,065,000 - (195,000) 1,870,000 195,000 Series 2013 9,055,000 - 9,055,000 325,000
General Obligation Bonds 7,670,000 - (325,000) 7,345,000 335,000 Issuance premiums, net 75,957 44,763 (1,862) 118,858 -
Total Bonds and Certificates 15,905,907 9,099,763 (1,616,862) 23,388,808 2,025,000 Capital leases payable 893,287 - (230,237) 663,050 182,467 Net OPEB obligation 33,502 6,110 - 39,612 - Compensated absences payable 476,810 508,165 (497,680) 487,295 -
Total Governmental Activities 17,309,506$ 9,614,038$ (2,344,780)$ 24,578,765$ 2,207,467$
Debt Issue Payer Fund Tax Increment Revenue Bonds Halls Ferry TIF Fund Variable Rate Capital Improvement Bonds and Capital Leases
Capital Improvement Sales Tax Fund
Certificates of Participation Certificates of Participation Fund Series 2012 by Parks Fund Series 2013 by Downtown TIF and General
General Obligations Bonds General Obligations Bond Fund
Compensated absences are payable from the fund to which the employee is assigned; approximately 80% through the General Fund with balance from the Parks Fund. Variable Rate Capital Improvement Bonds - Series 2005 and 2006 On September 1, 2005, the City issued $2,250,000 in Variable Rate Capital Improvement Bonds, Series 2005. On September 1, 2006, the City issued $2,750,000 in Variable Rate Capital Improvement Bonds, Series 2006. The purpose of the bonds was to finance the costs of acquiring, constructing, rehabilitating, equipping, and improving certain capital improvement projects. At the same time the bonds were issued, the City executed an interest rate swap agreement, which fixed the City's interest rate at 3.995%. See “Derivative Instrument – Interest Rate Swap” for more information.

CITY OF FERGUSON, MISSOURI Notes to Financial Statements (continued)
Page 35
Maturities required on these bonds as of June 30, 2013 are as follows:
Tax Increment Revenue Bonds - Series 2005 On September 12, 1997, the City issued $8,385,000 in Tax Increment Revenue Bonds, Series 1997, to finance necessary public improvements for the Crossings at Halls Ferry Redevelopment Project. The bonds were issued pursuant to the Real Property Tax Increment Allocation Redevelopment Act, Section 99.800 of the Revised Statutes of Missouri. Interest and principal on the bonds were originally scheduled to be paid annually beginning April 1, 2000, with a final maturity date of April 1, 2018. On March 1, 2005, the City issued $7,370,000 in Tax Increment Revenue Bonds, Series 2005, to refund the Series 1997 bonds. The proceeds (after underwriting fees and issuance costs) were used to purchase securities for deposit in an irrevocable trust with an escrow agent to provide for future debt service payments on the Series 2002 bonds. As a result, the 1997 Tax Increment Revenue Bonds are considered defeased and the liability for this debt has been removed from the City's financial statements. Interest on the bonds is paid semiannually on April 1 and October l with principal paid annually on October 1. The bonds and the interest thereon are special, limited obligations of the City, payable solely from appropriated funds. The bonds do not constitute a general obligation of the City. Currently, interest rates range from 5.0% to 5.5%. The trust indenture requires a reserve balance of $737,000. The actual balance of the reserve fund was $730,591 at June 30, 2013.
Maturities required on these bonds as of June 30, 2013 are as follows:
Principal Interest Total
2014 370,000$ 125,494$ 495,494$ 2015 390,000 110,306 500,306 2016 405,000 94,656 499,656 2017 420,000 77,904 497,904 2018 435,000 60,691 495,691 2019 455,000 42,871 497,871 2020 470,000 24,293 494,293 2021 244,950 5,003 249,953
Total 3,189,950$ 541,218$ 3,731,168$
Principal Interest Total
2014 800,000$ 166,800$ 966,800$ 2015 645,000 133,250 778,250 2016 365,000 101,000 466,000
Total 1,810,000$ 401,050$ 2,211,050$

CITY OF FERGUSON, MISSOURI Notes to Financial Statements (continued)
Page 36
Certificates of Participation - Series 2012 On October 1, 2002, the City issued $3,480,000 in Certificates of Participation - Series 2002, to finance the construction of its new aquatic facility, "Splash at Wabash." On April 4, 2012, the City issued $2,065,000 in Certificates of Participation Bonds - Series 2012 to refund Series 2002. The proceeds (after underwriting fees and issuance costs) were used to purchase securities for deposit in an irrevocable trust with an escrow agent to provide for future debt service payments on the Series 2002 bonds. As a result, the 2002 Certificates of Participation Bonds are considered defeased and the liability for this debt has been removed from the City's financial statements. Interest on the bonds is paid semiannually on April 1 and October l with principal paid annually on October 1. The bonds and the interest thereon are special, limited obligations of the City, payable solely from appropriated funds. The bonds do not constitute a general obligation of the City. Interest rates range from 0.70% to 2.45%. Maturities required on outstanding certificates as of June 30, 2013 are as follows:
Principal Interest Total
2014 195,000$ 29,075$ 224,075$ 2015 200,000 27,395 227,395 2016 200,000 25,345 225,345 2017 215,000 22,744 237,744 2018 205,000 19,704 224,704 2019 205,000 16,321 221,321 2020 215,000 12,378 227,378 2021 215,000 7,809 222,809 2022 220,000 2,695 222,695
Total 1,870,000$ 163,465$ 2,033,465$

CITY OF FERGUSON, MISSOURI Notes to Financial Statements (continued)
Page 37
General Obligation Bonds On September 15, 2011, the City issued $8,000,000 of general obligation bonds, Series 2011. The bonds were issued for the purpose of acquiring land and for constructing, furnishing, and equipping a new fire station which will serve as a replacement for its existing Firehouse No. 1. Interest rates range from 2.000% to 3.375%. Interest is paid semi-annually on March 1 and September 1 with principal paid annually on March 1. Debt service on the bonds is paid from an ad valorem tax levy and supported by the full faith and credit of the City. Maturities required on these bonds as of June 30, 2013 are as follows:
Certificates of Participation – Series 2013 On January 30, 2013, the City issued $9,055,000 of certificates of participation bonds - Series 2013. The bonds were issued for the purpose of acquiring land and buildings for a new community center and the renovation of these buildings and for renovation and additions to the building currently housing the police department. Interest rates range from 2.000% to 3.125%. Interest is paid semi-annually on March 1 and September 1 with principal paid annually on March 1. Debt service on the bonds is paid from “earmarked” revenues of both the General and Downtown TIF Funds. The bonds and the
Principal Interest Total
2014 335,000$ 191,275$ 526,275$ 2015 340,000 184,575 524,575 2016 345,000 177,775 522,775 2017 355,000 170,875 525,875 2018 360,000 163,775 523,775 2019 370,000 156,575 526,575 2020 375,000 149,175 524,175 2021 385,000 140,738 525,738 2022 395,000 132,075 527,075 2023 405,000 122,200 527,200 2024 415,000 112,075 527,075 2025 425,000 101,700 526,700 2026 440,000 88,950 528,950 2027 450,000 75,750 525,750 2028 465,000 62,250 527,250 2029 480,000 48,300 528,300 2030 495,000 33,300 528,300 2031 510,000 17,213 527,213
Total 7,345,000$ 2,128,575$ 9,473,575$

CITY OF FERGUSON, MISSOURI Notes to Financial Statements (continued)
Page 38
interest thereon are special, limited obligations of the City, payable solely from appropriated funds. The bonds do not constitute a general obligation of the City. Maturities required on these bonds as of June 30, 2013 are as follows:
Capital Leases In April 2008, the City entered into a lease/purchase agreement with First Municipal Leasing Corporation (FMLC) to finance the purchase of two fire trucks. The equipment was recorded as a capital asset in the Governmental Activities at a cost of $1,171,967 and has accumulated depreciation of $263,692 as of June 30, 2013. The lease is recorded in the government-wide statement of net assets and is serviced by the Capital Improvement Sales Tax Fund. Payments are made quarterly and include principal and interest. In September 2008, the City entered into a lease/purchase agreement with Cafco Leasing (Cafco) to finance the purchase of streetlights. The equipment was recorded as a capital asset in the Governmental Activities at a cost of $506,500 and has accumulated
Principal Interest Total
2014 325,000$ 278,126$ 603,126$ 2015 370,000 231,328 601,328 2016 375,000 223,928 598,928 2017 385,000 216,428 601,428 2018 390,000 208,728 598,728 2019 400,000 200,928 600,928 2020 410,000 192,928 602,928 2021 415,000 184,728 599,728 2022 425,000 175,390 600,390 2023 435,000 164,765 599,765 2024 450,000 153,346 603,346 2025 460,000 140,971 600,971 2026 475,000 127,746 602,746 2027 490,000 113,496 603,496 2028 500,000 98,796 598,796 2029 515,000 83,796 598,796 2030 535,000 68,346 603,346 2031 550,000 52,296 602,296 2032 565,000 35,796 600,796 2033 585,000 18,281 603,281
Total 9,055,000$ 2,970,147$ 12,025,147$

CITY OF FERGUSON, MISSOURI Notes to Financial Statements (continued)
Page 39
depreciation of $151,950 as of June 30, 2013. The lease is recorded in the government-wide statement of net assets and is serviced by the Capital Improvement Sales Tax Fund. Payments are made semi-annually and include principal and interest. The following is a summary of the City’s capital lease agreements as of June 30, 2013:
Interest Annual
Lessor Rate Maturity Payment Balance
FMLC 3.55% December 2017 146,624$ 607,322$ Cafco 4.38% September 2013 113,898$ 55,728$
As of June 30, 2013, future minimum lease payments under the capital leases described above are as follows:
Derivative Instrument – Interest Rate Swap
The City has entered into a pay-fixed, receive-variable interest rate swap.
(1) Objective of the swap. In an effort to fix its borrowing costs, the City entered into an interest rate swap in connection with the $5,000,000 Series 2005 and Series 2006 variable rate capital improvement bonds. The swap is intended to hedge exposure to interest rate risk.
Classification Amount Classification Amount
Governmental ActivitiesCash Flow Hedge Derivative
Pay-Fixed Interest Deferred Instrument Rate Swap Outflows 114,642$ Liability (287,868)$
Changes in Fair Value Fair Value at June 30, 2013
Year Ending June 30, Amount2014 203,573$ 2015 146,624 2016 146,624 2017 146,624 2018 73,312
Total minimum lease payments 716,757$ Portion representing interest (53,707) Net present value 663,049$

CITY OF FERGUSON, MISSOURI Notes to Financial Statements (continued)
Page 40
(2) Terms, fair values, and credit risk. The objective and terms, including the fair
values and credit ratings, of the City’s hedging derivative instrument outstanding as of June 30, 2013, are as shown below. The notional amount of the swap matches the principal amounts of the associated debt. The City’s swap agreement contains scheduled reductions to outstanding notional amounts that are expected to approximately follow scheduled or anticipated reductions in the associated bonds payable category. Under the swap, the City pays the counterparty a fixed payment and receives a variable payment computed according to the London Interbank Offered Rate (LIBOR).
(3) Credit Risk. At June 30, 2013, the City is not exposed to credit risk on the interest rate swap because it is in a negative fair value or liability position. However, if interest rates change and the fair value becomes positive, the government would have exposure to credit risk in the amount of the derivative’s positive fair value.
(4) Basis Risk. The City is not exposed to basis risk on the pay-fixed, receivable-
variable interest rate swap because the variable-rate interest payments received by the City from the counterparty and the City’s variable-rate bonds interest payment are both based on the LIBOR index.
(5) Interest Rate Risk. The City is exposed to interest rate risk on the interest rate
swap. In regards to the pay-fixed, receive-variable swap, as the LIBOR swap index decreases, the City’s net payment on the swap increases.
(6) Termination Risk. The City or the counterparty may terminate the swap if the
other party fails to perform under the terms of the contract. If terminated, the variable rate bonds’ interest rate risk would no longer be effectively hedged. In addition, if at the time of the termination, the swap has a negative fair value (i.e., in a liability position), the City would be liable to the counterparty for a payment equal to the swap’s fair value or liability amount.
(7) Rollover risk. The City is not exposed to rollover risk because the maturity dates
for the hedged variable-rate bonds and the interest rate swap agreement are the same.
Associated Bond Issue Hedging Instruments - Governmental ActivitiesNotional Amounts $3,189,950EffectiveDate September 1, 2005Terms Pay 3.995%; Receive 60.938% of LIBOR plus 1%Fair Value ($287,868)Termination Date September 1, 2020Counter Party Credit Rating A2

CITY OF FERGUSON, MISSOURI Notes to Financial Statements (continued)
Page 41
7. DEFERRED COMPENSATION PLAN
The City offers its employees a deferred compensation plan created in accordance with Internal Revenue Code Section 457. This Plan, available to all City employees, permits them to defer payment of a portion of their salary to future years. This deferred compensation is not available to plan participants until termination, retirement, death, or unforeseeable emergency. Investments are managed by the Plan's trustee under one of five investment options, or a combination thereof. The choice of investment options is made by the plan participant. The Plan has been amended to comply with amendments to Section 457 of the Internal Revenue Code. Trust provisions were incorporated so that plan assets are held in trust for the exclusive benefit of plan participants and their beneficiaries.
8. EMPLOYEE RETIREMENT PLAN Plan Description and Provisions - The City of Ferguson Pension Plan (the "Plan”) is a single-employer, defined benefit retirement and disability plan covering all regular, full-time employees of the City, except the City Manager and Assistant City Manager. The Plan is administered by UMB Bank NA. The Plan does not issue a separate stand-alone financial report. The Plan's financial information is included as a Pension Trust Fund in the City's financial statements and is accounted for on the accrual basis of accounting. Investments are reported at fair value. Benefits and refunds are recognized when due and payable in accordance with the terms of the Plan. Employees become eligible for full benefits under the Plan upon retirement following a) the participant's 60th birthday and completion of eight years of credited service with the City or b) the participant's 55th birthday and the sum of the participant's age and years of credited service with the City total at least 82 ½. The Plan permits early retirement when the employee has reached age 55 and completed eight years of credited service, with a benefit reduction of 0.25% for each month that the early retirement date precedes the normal retirement date, which is considered to be when the employee has reached age 60 and completed eight years of credit service. Unused sick leave is added to credited service. Participants are fully vested after eight years of credited service; the Plan does not provide for partial vesting. Benefits under the Plan are established by ordinance. An employee eligible for full benefits is entitled to a monthly payment of 1.75% of his or her average monthly salary multiplied by the number of years and fractions thereof of credited service. Average monthly salary, for the purpose of computing benefits, is the employee’s salary during any 60 out of the last 96 calendar months of employment prior to termination or retirement which yield the highest average. For hourly employees, average monthly salary is computed as the employee's regular hourly rate multiplied by the number of established regular work hours in a year divided by 12.

CITY OF FERGUSON, MISSOURI Notes to Financial Statements (continued)
Page 42
A health insurance benefit of $5 per month per year of credited service, up to $150 is provided, until the retiree becomes Medicare eligible. The Plan also provides a disability benefit calculated in the same manner as pension benefits, with a minimum benefit of $450 per month, payable until the earlier of death or recovery. The projected payroll for employees covered by the Plan for the year ended June 30, 2013 was $6,389,000; the City's total payroll was $7,371,000. At July 1, 2012, the date of the last actuarial valuation, the Plan covered the following number of participants: Active participants 131 Retired participants 67 Terminated vested participants 21 Disabled participants 10 Beneficiaries 15 Total Plan Participants 244 Contributions Required and Contributions Made - All contributions to the Plan are made by the City. The City contributes an amount equal to the actuarially determined requirement, designed to provide the Plan with assets sufficient to pay pension benefit obligations as they become due. The Plan has no unfunded prior service cost required to be covered by the annual contribution. Administrative costs are paid with Plan assets. Annual contributions are computed using the entry age normal actuarial cost method, assuming 7.5% rate of return on Plan assets and 3.25% annual salary increases plus longevity/merit increases due to inflation, and using the Retired Pensioners 2000 Mortality Tables. Benefits are not increased for inflation. The unfunded actuarial accrued liability is amortized as a level percentage of pay over an open period of 10 years. The actuarial value of Plan assets is based on a five year smoothed market value. For the year ended June 30, 2013, the annual pension cost of $489,851 was equal to the required and actual contributions. Trend information for the three years ended June 30, 2013 was as follows:
Funded Status - As of July 1, 2012, the most recent actuarial valuation available, the Plan was 100% funded. The actuarial accrued liability (AAL) for benefits was $21,296,785, and the actuarial value of assets was $ 21,267,743, resulting in assets in deficiency of the AAL of $ 29,042. The covered payroll (annual payroll of active employees covered by the plan) was $ 6,187,888 and the unfunded liability as a percent of payroll was 0.5%.
Fiscal AnnualYear Ended Pension Percentage Net Pension
June 30, Cost Contributed Obligation
2013 489,851$ 100% -$ 2012 480,448 100% - 2011 317,969 100% - 2010 107,526 100% -
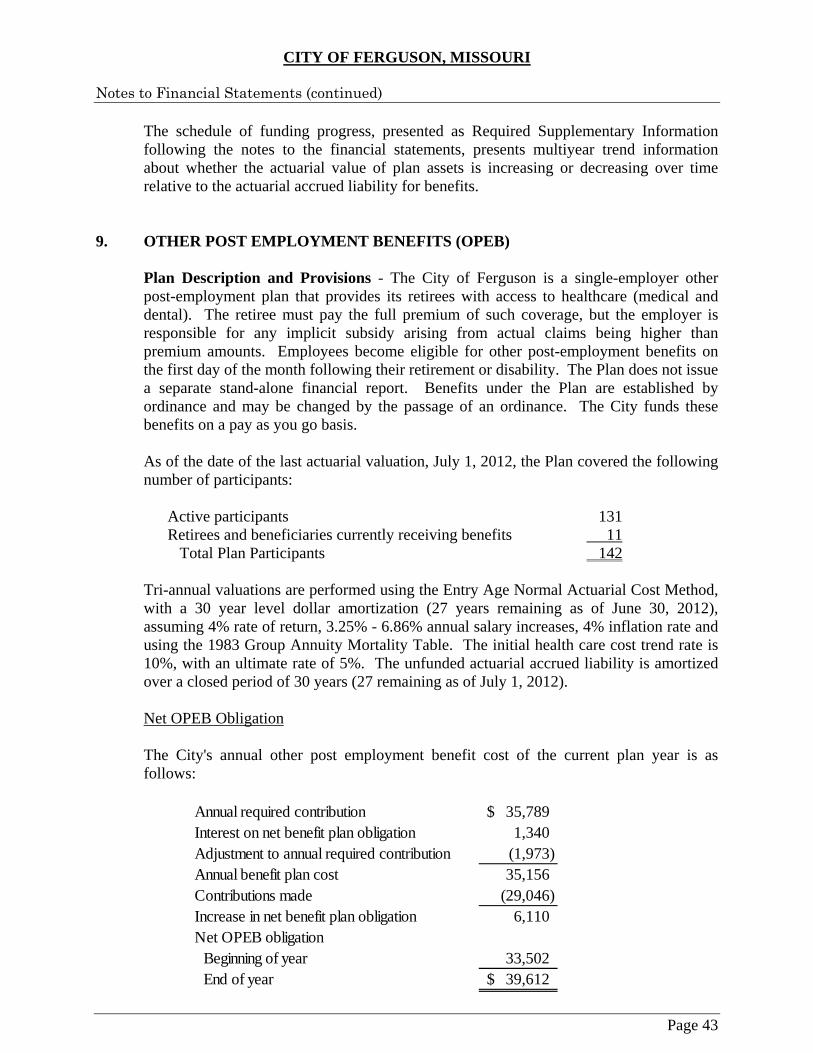
CITY OF FERGUSON, MISSOURI Notes to Financial Statements (continued)
Page 43
The schedule of funding progress, presented as Required Supplementary Information following the notes to the financial statements, presents multiyear trend information about whether the actuarial value of plan assets is increasing or decreasing over time relative to the actuarial accrued liability for benefits.
9. OTHER POST EMPLOYMENT BENEFITS (OPEB)
Plan Description and Provisions - The City of Ferguson is a single-employer other post-employment plan that provides its retirees with access to healthcare (medical and dental). The retiree must pay the full premium of such coverage, but the employer is responsible for any implicit subsidy arising from actual claims being higher than premium amounts. Employees become eligible for other post-employment benefits on the first day of the month following their retirement or disability. The Plan does not issue a separate stand-alone financial report. Benefits under the Plan are established by ordinance and may be changed by the passage of an ordinance. The City funds these benefits on a pay as you go basis. As of the date of the last actuarial valuation, July 1, 2012, the Plan covered the following number of participants:
Active participants 131 Retirees and beneficiaries currently receiving benefits 11 Total Plan Participants 142
Tri-annual valuations are performed using the Entry Age Normal Actuarial Cost Method, with a 30 year level dollar amortization (27 years remaining as of June 30, 2012), assuming 4% rate of return, 3.25% - 6.86% annual salary increases, 4% inflation rate and using the 1983 Group Annuity Mortality Table. The initial health care cost trend rate is 10%, with an ultimate rate of 5%. The unfunded actuarial accrued liability is amortized over a closed period of 30 years (27 remaining as of July 1, 2012). Net OPEB Obligation The City's annual other post employment benefit cost of the current plan year is as follows:
Annual required contribution 35,789$ Interest on net benefit plan obligation 1,340 Adjustment to annual required contribution (1,973) Annual benefit plan cost 35,156 Contributions made (29,046) Increase in net benefit plan obligation 6,110 Net OPEB obligation
Beginning of year 33,502 End of year 39,612$

CITY OF FERGUSON, MISSOURI Notes to Financial Statements (continued)
Page 44
Trend Information - Other Post Employment Benefits The City’s annual OPEB cost, the percentage of OPEB cost contributed to the OPEB plan, and the net OPEB obligation for the three years ended June 30, 2013 are as follows:
Funded Status and Funding Progress - As of July 1, 2012, the most recent actuarial valuation available, the Plan was 0% funded. The actuarial accrued liability for benefits was $365,083, and the actuarial value of assets was $-0-, resulting in an unfunded actuarial accrued liability (UAAL) of $365,083. The covered payroll (annual payroll of active employees covered by the plan) was $6,187,888 and the ratio of the UAAL to the covered payroll was 5.9%. Actuarial valuations of an ongoing plan involve estimates of the value of reported amounts and assumptions about the probability of occurrence of events far into the future. Examples include assumptions about future employment, mortality, and the healthcare cost trend. Amounts determined regarding the funded status of the Plan and the annual required contributions of the employer are subject to continual revision as actual results are compared with past expectations and new estimates are made about the future. The schedule of funding progress is presented as RSI following the notes to the financial statements.
Actuarial Methods and Assumptions - Projections of benefits for financial reporting purposes are based on the substantive plan (the plan as understood by the employer and the plan members) and include the types of benefits provided at the time of each valuation and the historical pattern of sharing of benefit costs between the employer and Plan members to that point. The actuarial methods and assumptions used include techniques that are designed to reduce the effects of short-term volatility in actuarial accrued liabilities and the actuarial value of assets, consistent with the long-term perspective of the calculations.
10. RISK MANAGEMENT The City is exposed to various risks of loss related to torts, theft of, damage to, and destruction of assets, errors and omissions, injuries to employees and natural disasters. The City, along with various other local municipal governments, participates in an insurance trust for health, workers' compensation and general liability matters called St. Louis Area Insurance Trust or SLAIT (the “Trust”). The purpose of the Trust is to
Year Ended Annual Percentage Net OPEBJune 30, OPEB Cost Contribution Obligation
2013 35,156$ 88% 39,612$ 2012 25,610 76 33,502 2011 27,185 64 27,392

CITY OF FERGUSON, MISSOURI Notes to Financial Statements (continued)
Page 45
distribute the cost of self-insurance over similar entities. The Trust requires an annual premium payment to cover estimated claims payable and reserves for claims from each entity. The members of the Trust have no legal interest in the assets, liabilities or fund balances of the Trust. However, the City retains a contingent liability to fund its pro rata share of any deficit incurred by the Trust should it cease operations at some future date. The Trust contracts with Daniel and Henry, Inc. to administer the trust including processing claims filed. The City purchases commercial insurance for all other risks of loss. Settled claims resulting from these risks have not exceeded commercial insurance coverage in any of the past three fiscal years.
11. EXCESS OF EXPENDITURES OVER APPROPRIATIONS
For the year ended June 30, 2013, expenditures exceeded appropriations in the following funds (the legal level of budgetary control). However, final budget amounts do not include appropriations individually authorized by Council, as in the case of the City’s General Fund where individually the Council authorized approximately $480,000 of additional storm recovery expenditures.
ExpendituresExpend- In Excess
Fund Original Final itures of Budget
General 12,563,800$ 12,319,200$ 12,724,930$ (405,730)$ Downtown TIF 43,500 74,600 74,605 (5) Sewer Lateral 110,000 110,000 128,105 (18,105) Halls Ferrry TIF 532,800 860,300 865,299 (4,999) Certificates of Participation 489,000 290,500 329,652 (39,152)
Budgeted Appropriation
12. CONTINGENT LIABILITIES
A. Grants - The City receives financial assistance from numerous federal, state, and local government agencies in the form of grants. The disbursement of funds received under these programs generally requires compliance with terms and conditions specified in the grant agreements and are subject to audit by the grantor agencies. Any disallowed claims resulting from such audits could become a liability of the General Fund or other applicable fund types. However, in the opinion of management, any such disallowed claims would not have a material effect on the financial statements of the City at June 30, 2013.
B. Litigation - Various claims and legal actions involving the City are presently
pending which involve claims made by the City for unpaid tax assessments and other miscellaneous cases. In the opinion of management, the outcome of these

CITY OF FERGUSON, MISSOURI Notes to Financial Statements (continued)
Page 46
legal matters will not have a material effect on the financial statements of the City at June 30, 2013.
13. CHANGE IN ACCOUNTING STANDARD
Recently, with the issuance of pronouncement number 65, Items Previously Reported as Assets and Liabilities, the Governmental Accounting Standards Board eliminated the requirement to capitalize debt issue costs. At June 30, 2012, the City had unamortized debt issue costs of $195,594. This amount was eliminated and recorded as a change in accounting standard.
Governmental Activities: Net Assets, Beginning of Year, as previously reported $ 26,359,549 Record Change in Accounting Standard, write-off unamortized debt issue costs (195,594)Net Assets, Beginning of Year, restated $26,163,955
During the fiscal year ending June 30, 2013, the City adopted GASB 63, Financial Reporting of Deferred Outflows of Resources, Deferred Inflows of Resources, and Net Position. This statement required changes in accounting captions in the statements of net position and the government fund balance sheet.
14. SUBSEQUENT EVENTS
In preparing these financial statements, management has evaluated events and transactions for potential recognition or disclosure through December 5, 2013, the date the financial statements were available to be issued.

CITY OF FERGUSON, MISSOURI Notes to Financial Statements (continued)
Page 47
15. CONTINGENCIES
From time to time, the City is a party to various pending claims and legal actions arising in the ordinary course of its operations. Although the outcome of such matters cannot be forecast with certainty, in the opinion of management, all such maters are adequately covered by insurance, or if not covered, are without merit or involve amounts such that an unfavorable disposition would not have a material effect on the financial statements of the City.
16. RECENT ACCOUNTING PRONOUNCMENTS
The accounting principles governing the reported amounts, presentation and related disclosures are subject to change from time to time based on new pronouncements and/or rules issued by various governing bodies. The Government Accounting Standards Board (GASB) is responsible for establishing generally accepted accounting principles (GAAP) for state and local governments. In March, 2012, the GASB issues Statement No. 66, “Technical Correction – 2012 – an amendment of GASB Statements No. 10 and No. 62.” The objective of this Statement is to improve accounting and financial reporting for a governmental financial reporting entity by resolving conflicting guidance that resulted from the issuance of two pronouncements, Statements No. 54 and No. 62. The requirements in this Statement are effective for periods beginning after December 15, 2012. In June 2012, the GASB issued Statement No. 67 “Financial Reporting for Pension Plans” and Statement No. 68 “Accounting and Reporting for Pensions.” The objective of these statements is to revise existing accounting and financial reporting requirements for most pension plans, and to revise and establish new financial reporting requirements for most governments that provide their employees with pension benefits. The requirements in Statement No. 67 are effective for periods beginning after June 15, 2013, and the requirements in Statement No. 68 are effective for periods beginning after June 15, 2014. The effects on the City’s financial statements as a result of the adoption of these new pronouncements are unknown.

This page intentionally left blank

Required Supplementary Information

CITY OF FERGUSON, MISSOURI
Page 48
REQUIRED SUPPLEMENTARY INFORMATION BUDGETARY COMPARISON SCHEDULE - GENERAL FUND
FOR THE YEAR ENDED JUNE 30, 2013
ORIGINAL FINAL ACTUAL
REVENUES
Taxes 8,280,800$ 8,478,600$ 8,567,883$ 89,283$
Licenses and permits 643,400 628,200 650,816 22,616
Charges for services 440,800 384,600 373,643 (10,957)
Fines and forfeitures 2,214,900 2,635,400 2,571,190 (64,210)
Investment income 60,100 60,900 (24,523) (85,423)
Other income 34,000 104,900 607,885 502,985
TOTAL REVENUES 11,674,000 12,292,600 12,746,894 454,294
EXPENDITURES
Current:
General government:
City council and clerk 130,600 121,100 126,772 (5,672)
City manager's office 266,800 267,900 269,263 (1,363)
Human resources 92,400 93,600 92,330 1,270
City-wide expenses 320,300 317,100 306,904 10,196
Municipal buildings 158,800 194,100 195,435 (1,335)
Information technology 117,200 113,600 108,621 4,979
Finance 357,100 356,800 344,533 12,267
Public safety:
Municipal court 290,700 318,300 313,192 5,108
Code enforcement 381,200 363,900 375,926 (12,026)
Police 4,999,700 5,025,700 4,993,256 32,444
Fire 2,525,500 2,410,700 2,384,588 26,112
Highways and streets:
Streets 923,300 852,900 1,358,843 (505,943)
Municipal garage 961,900 840,100 864,911 (24,811)
Public works administration 193,800 182,600 162,870 19,730
Community development 301,500 295,100 301,970 (6,870)
Culture and recreation 462,000 486,400 477,176 9,224
Capital outlay 81,000 79,300 48,340 30,960
TOTAL EXPENDITURES 12,563,800 12,319,200 12,724,930 (405,730)
EXCESS OF REVENUES OVER
(UNDER) EXPENDITURES (889,800) (26,600) 21,964 48,564
OTHER FINANCING SOURCES
Insurance Proceeds - 7,000 14,720 7,720
Transfers in 784,600 778,750 801,448 22,698
CHANGE IN FUND BALANCE (105,200)$ 759,150$ 838,132 78,982$
FUND BALANCE - BEGINNING OF YEAR 9,661,934
FUND BALANCES - END OF YEAR 10,500,066$
VARIANCE WITH FINAL
BUDGET POSITIVE
(NEGATIVE)
BUDGET
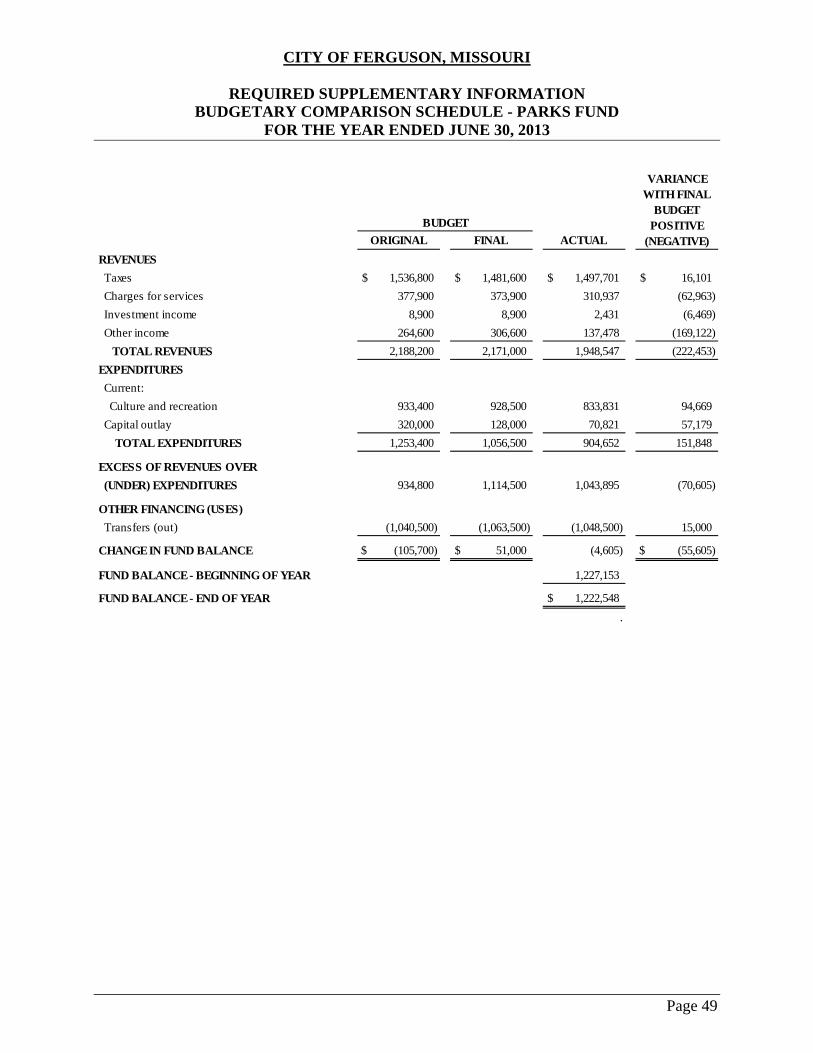
CITY OF FERGUSON, MISSOURI
Page 49
REQUIRED SUPPLEMENTARY INFORMATION BUDGETARY COMPARISON SCHEDULE - PARKS FUND
FOR THE YEAR ENDED JUNE 30, 2013
ORIGINAL FINAL ACTUAL
REVENUES
Taxes 1,536,800$ 1,481,600$ 1,497,701$ 16,101$
Charges for services 377,900 373,900 310,937 (62,963)
Investment income 8,900 8,900 2,431 (6,469)
Other income 264,600 306,600 137,478 (169,122)
TOTAL REVENUES 2,188,200 2,171,000 1,948,547 (222,453)
EXPENDITURES
Current:
Culture and recreation 933,400 928,500 833,831 94,669
Capital outlay 320,000 128,000 70,821 57,179
TOTAL EXPENDITURES 1,253,400 1,056,500 904,652 151,848
EXCESS OF REVENUES OVER
(UNDER) EXPENDITURES 934,800 1,114,500 1,043,895 (70,605)
OTHER FINANCING (USES)
Transfers (out) (1,040,500) (1,063,500) (1,048,500) 15,000
CHANGE IN FUND BALANCE (105,700)$ 51,000$ (4,605) (55,605)$
FUND BALANCE - BEGINNING OF YEAR 1,227,153
FUND BALANCE - END OF YEAR 1,222,548$
.
VARIANCE WITH FINAL
BUDGET POSITIVE
(NEGATIVE)
BUDGET
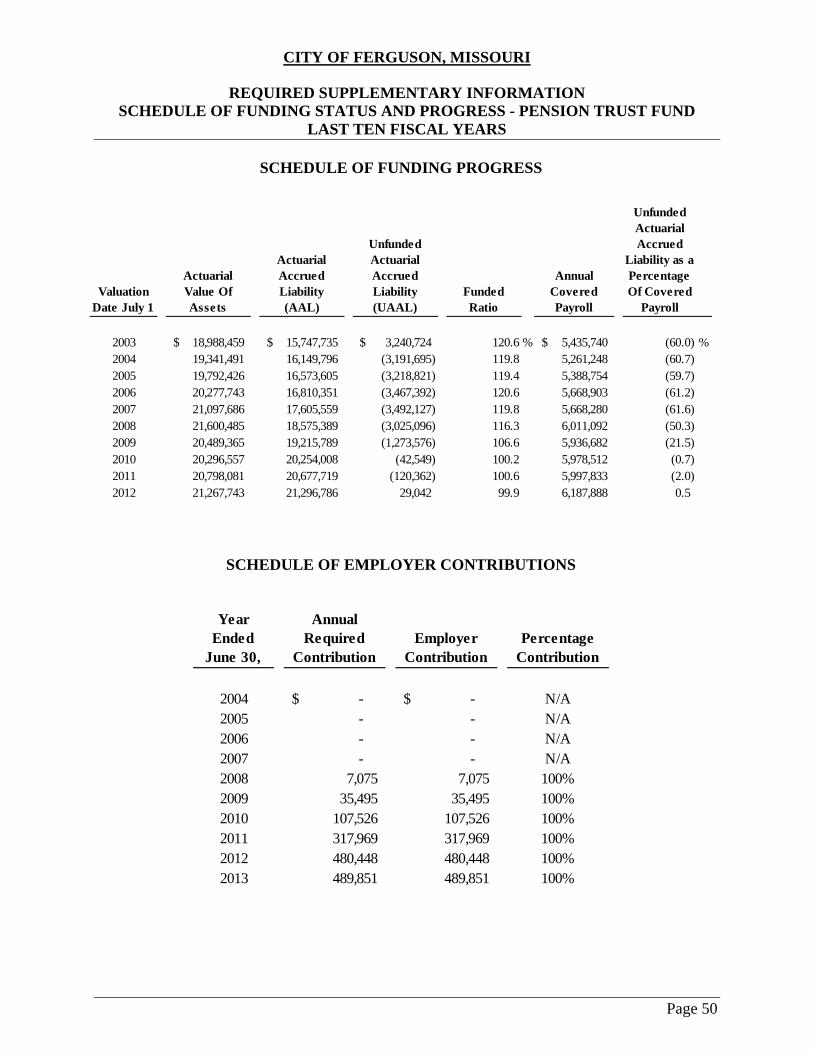
CITY OF FERGUSON, MISSOURI
Page 50
REQUIRED SUPPLEMENTARY INFORMATION SCHEDULE OF FUNDING STATUS AND PROGRESS - PENSION TRUST FUND
LAST TEN FISCAL YEARS
SCHEDULE OF FUNDING PROGRESS
SCHEDULE OF EMPLOYER CONTRIBUTIONS
Valuation Date July 1
Actuarial Value Of Assets
Actuarial Accrued Liability (AAL)
Unfunded Actuarial Accrued Liability (UAAL)
Funded Ratio
Annual Covered Payroll
Unfunded Actuarial Accrued
Liability as a Percentage Of Covered
Payroll
2003 18,988,459$ 15,747,735$ 3,240,724$ 120.6 % 5,435,740$ (60.0) %2004 19,341,491 16,149,796 (3,191,695) 119.8 5,261,248 (60.7)2005 19,792,426 16,573,605 (3,218,821) 119.4 5,388,754 (59.7)2006 20,277,743 16,810,351 (3,467,392) 120.6 5,668,903 (61.2)2007 21,097,686 17,605,559 (3,492,127) 119.8 5,668,280 (61.6)2008 21,600,485 18,575,389 (3,025,096) 116.3 6,011,092 (50.3)2009 20,489,365 19,215,789 (1,273,576) 106.6 5,936,682 (21.5)2010 20,296,557 20,254,008 (42,549) 100.2 5,978,512 (0.7)2011 20,798,081 20,677,719 (120,362) 100.6 5,997,833 (2.0)2012 21,267,743 21,296,786 29,042 99.9 6,187,888 0.5
Year Ended
June 30,
Annual Required
ContributionEmployer
ContributionPercentage
Contribution
2004 -$ -$ N/A2005 - - N/A2006 - - N/A2007 - - N/A2008 7,075 7,075 100%2009 35,495 35,495 100%2010 107,526 107,526 100%2011 317,969 317,969 100%2012 480,448 480,448 100%2013 489,851 489,851 100%

CITY OF FERGUSON, MISSOURI
Page 51
REQUIRED SUPPLEMENTARY INFORMATION SCHEDULE OF FUNDING STATUS AND PROGRESS -
OTHER POST EMPLOYMENT BENEFITS
SCHEDULE OF FUNDING PROGRESS
The historical trend information about the Plan is presented to help the user assess the Plan’s funding status on a going-concern basis, assess progress made in accumulating assets to pay benefits when due and make comparisons with other entities. Note: Fiscal year ending June 30, 2009 was the first year the City implemented GASB Statement No. 45. Information for prior years is not available.
SCHEDULE OF EMPLOYER CONTRIBUTIONS
Note: Since the City does not accumulate assets to pay other post-retirement benefits the Employer contribution is an estimate of the implicit subsidy.
Valuation Date July 1
Actuarial Value Of Assets
Actuarial Accrued Liability (AAL)
Unfunded AAL
Funded Ratio
Annual Covered Payroll
UAAL as a Percentage Of Covered
Payroll
2009 -$ 240,892$ 240,892$ 0.0 % 6,082,657$ 4.0 %2012 - 365,083 365,083 0.0 6,207,000 5.9
Year Ended June 30,
Annual Required
ContributionEmployer
ContributionPercentage
Contribution
2009 23,198$ 13,370$ 57.6 %2010 24,126 16,088 66.72011 27,185 17,484 66.02012 25,610 19,500 74.72013 35,156 29,046 81.2
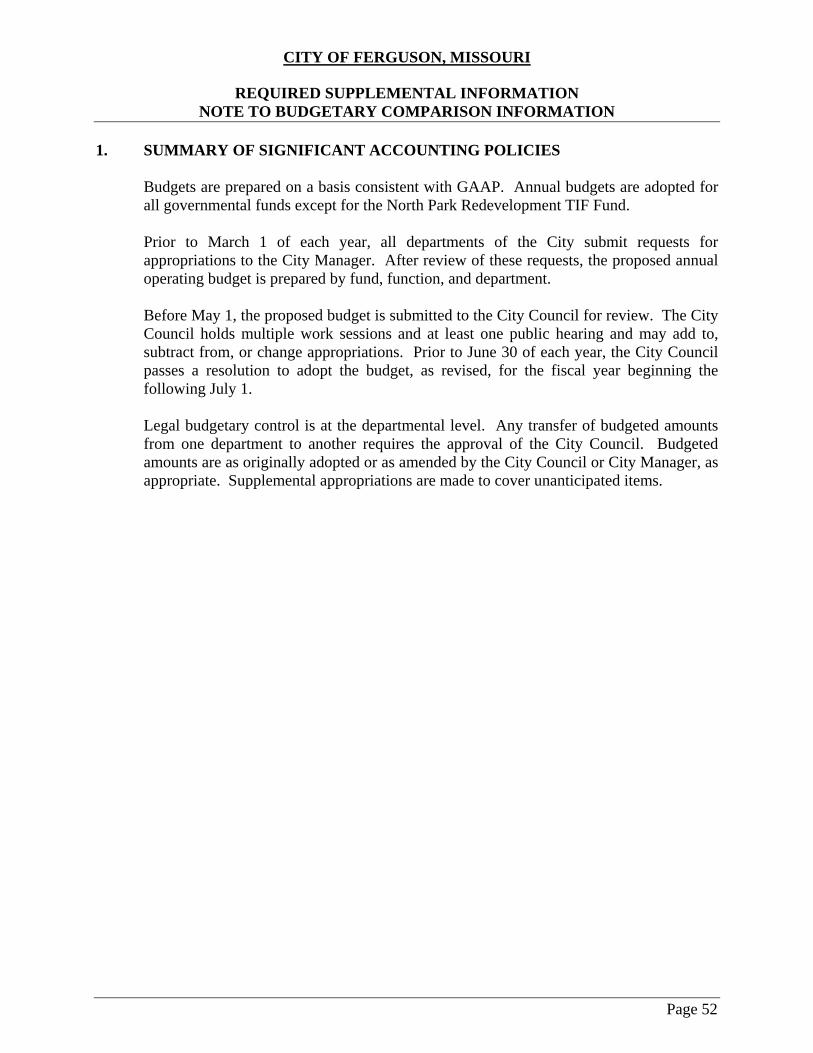
CITY OF FERGUSON, MISSOURI
Page 52
REQUIRED SUPPLEMENTAL INFORMATION NOTE TO BUDGETARY COMPARISON INFORMATION
1. SUMMARY OF SIGNIFICANT ACCOUNTING POLICIES
Budgets are prepared on a basis consistent with GAAP. Annual budgets are adopted for all governmental funds except for the North Park Redevelopment TIF Fund. Prior to March 1 of each year, all departments of the City submit requests for appropriations to the City Manager. After review of these requests, the proposed annual operating budget is prepared by fund, function, and department. Before May 1, the proposed budget is submitted to the City Council for review. The City Council holds multiple work sessions and at least one public hearing and may add to, subtract from, or change appropriations. Prior to June 30 of each year, the City Council passes a resolution to adopt the budget, as revised, for the fiscal year beginning the following July 1. Legal budgetary control is at the departmental level. Any transfer of budgeted amounts from one department to another requires the approval of the City Council. Budgeted amounts are as originally adopted or as amended by the City Council or City Manager, as appropriate. Supplemental appropriations are made to cover unanticipated items.

Other Supplementary Information

CITY OF FERGUSON, MISSOURI
Page 53
COMBINING BALANCE SHEET - NON MAJOR GOVERNMENTAL FUNDS JUNE 30, 2013
Special Business District
Sewer Lateral
Downtown TIF Redevelop-
ment
Local Improve
ment
North Park
Redevelopment TIF
Halls Ferry TIF Bonds
Certifica-tes of
Participa-tion
Bonds
General Obligation
Bonds
Total Non-major
Govern- mental Funds
ASSETS Cash and investments -$ 731,766$ -$ -$ -$ -$ -$ 404,095$ 1,135,861$
Taxes receivable:
Sales - - 31,640 - - 113,733 - - 145,373
Property - 4,292 60,466 - - - - 90,805 155,563 Accounts receivable - - - - - - - - -
Due (to) from other funds 13,182 134,468 1,096,714 - 536 - 35,707 (4,145) 1,276,462 Cash and investments - restricted - - - - - 914,459 - - 914,459
TOTAL ASSETS 13,182$ 870,526$ 1,188,820$ - 536$ 1,028,192$ 35,707$ 490,755$ 3,627,718$
LIABILITIES Accounts payable 12,110$ 4,000$ -$ -$ -$ 2,000$ -$ -$ 18,110$
DEFERRED INFLOWS
OF RESOURCES
Unavailable revenue:
Property taxes - - 52,725 - - - - 76,747 129,472
FUND BALANCES
Restricted for: Debt Service - - - - 536 1,026,192 35,707 414,008 1,476,443 Downtown TIF - - 1,136,095 - - - - - 1,136,095 Sewer Lateral - 866,526 - - - - - - 866,526
Assigned to:
Special Business District 1,072 - - - - - - - 1,072
TOTAL FUND BALANCES 1,072 866,526 1,136,095 - 536 1,026,192 35,707 414,008 3,480,136
TOTAL LIABILITIES ANDDEFERRED INFLOWS
OF RESOURCES
FUND BALANCES 13,182$ 870,526$ 1,188,820$ -$ 536$ 1,028,192$ 35,707$ 490,755$ 3,627,718$
Special Revenue Funds Debt Service FundsCapital Projects Funds

CITY OF FERGUSON, MISSOURI
Page 54
COMBINING STATEMENT OF REVENUES, EXPENDITURES AND CHANGES IN FUND BALANCES - NON MAJOR GOVERNMENTAL FUNDS
FOR THE YEAR ENDED JUNE 30, 2013
Special Business District
Sewer Lateral
Downtown TIF
Redevelop- ment
Local Improve-
ment
North Park
Redevelop-
ment TIF
Halls Ferry TIF Bonds
Certificates of
Participa-tion
Bonds
General Obligation
Bonds
Total Non-major
Govern- mental Funds
REVENUES
Taxes -$ 186,528$ 446,228$ -$ -$ 868,293$ -$ 680,030$ 2,181,079$
Licenses and permits 28,424 - - - - - - - 28,424
Investment income - 2,261 73 - - (5,148) 1,996$ 7,571 6,753
Other income 6,900 - - - - - - - 6,900
TOTAL REVENUES 35,324 188,789 446,301 - - 863,145 1,996 687,601 2,223,156
EXPENDITURES
Current:
Community development 162,247 128,105 47,265 - - - - - 337,617
Capital Outlay - - 27,340 - - - - - 27,340
Debt Services:
Issuance costs - - - - - - 102,473 - 102,473
Principal, interest and fiscal charges - - - - - 865,299 227,179 523,693 1,616,171
TOTAL EXPENDITURES 162,247 128,105 74,605 - - 865,299 329,652 523,693 2,083,601
EXCESS OF REVENUES OVER
(UNDER) EXPENDITURES (126,923) 60,684 371,696 - - (2,154) (327,656) 163,908 139,555
OTHER FINANCING SOURCES (USES)
Issuance of debt - - - - - - 102,932 - 102,932
Transfers in (out) 118,124 (13,000) (270,988) (202,434) - (11,744) 227,660 - (152,382)
TOTAL OTHER 118,124 (13,000) (270,988) (202,434) - (11,744) 330,592 - (49,450)
CHANGE IN FUND BALANCE (8,799) 47,684 100,708 (202,434) - (13,898) 2,936 163,908 90,105
FUND BALANCES -
BEGINNING OF YEAR 9,871 818,842 1,035,387 202,434 536 1,040,090 32,771 250,100 3,390,031
END OF YEAR 1,072$ 866,526$ 1,136,095$ -$ 536$ 1,026,192$ 35,707$ 414,008$ 3,480,136$
Special Revenue Funds Debt Service FundsCapital Projects Funds

CITY OF FERGUSON, MISSOURI
Page 55
SCHEDULE OF REVENUES, EXPENDITURES, AND CHANGES IN FUND BALANCE - BUDGET AND ACTUAL
CAPITAL IMPROVEMENT SALES TAX CAPITAL PROJECTS FUND FOR THE YEAR ENDED JUNE 30, 2013
ORIGINAL FINAL ACTUAL
REVENUES
Taxes 1,112,700$ 1,067,700$ 1,102,654$ 34,954$
Investment income 43,600 49,000 (50,951) (99,951)
Other income 1,390,000 2,453,900 1,293,226 (1,160,674)
TOTAL REVENUES 2,546,300 3,570,600 2,344,929 (1,225,671)
EXPENDITURES
Capital outlay 9,800,000 9,711,500 7,306,733 2,404,767
Debt service:
Principal, interest and fiscal charges 761,000 761,000 761,119 (119)
TOTAL EXPENDITURES 10,561,000 10,472,500 8,067,852 2,404,648
EXCESS OF REVENUES OVER
(UNDER) EXPENDITURES (8,014,700) (6,901,900) (5,722,923) 1,178,977
OTHER FINANCING SOURCES (USES)
Insurance Proceeds - 27,000 35,943 8,943
Issuance of debt - 9,052,000 8,952,068 (99,932)
Premium on debt issuance - - 44,764 44,764
Transfers in (out) 7,648,000 349,400 399,434 50,034
TOTAL OTHER FINANCING
SOURCES (USES) 7,648,000 9,428,400 9,432,209 3,809
CHANGE IN FUND BALANCE (366,700)$ 2,526,500$ 3,709,286 1,182,786$
FUND BALANCES - BEGINNING OF YEAR 6,432,967
FUND BALANCES - END OF YEAR 10,142,253$
VARIANCE WITH FINAL
BUDGET POSITIVE
(NEGATIVE)
BUDGET

CITY OF FERGUSON, MISSOURI
Page 56
SCHEDULE OF REVENUES, EXPENDITURES, AND CHANGES IN FUND BALANCE - BUDGET AND ACTUAL
SPECIAL BUSINESS DISTRICT SPECIAL REVENUE FUND FOR THE YEAR ENDED JUNE 30, 2013
ORIGINAL FINAL ACTUAL
REVENUES
Licenses and permits 24,900$ 23,300$ 28,424$ 5,124$
Other income 3,500 2,000 6,900 4,900
TOTAL REVENUES 28,400 25,300 35,324 10,024
EXPENDITURES
Current:
Community development 181,500 176,850 162,247$ 14,603
TOTAL EXPENDITURES 181,500 176,850 162,247 14,603
EXCESS OF REVENUES OVER
(UNDER) EXPENDITURES (153,100) (151,550) (126,923) 24,627
OTHER FINANCING SOURCES
Transfers in 149,100 142,550 118,124 (24,426)
CHANGE IN FUND BALANCE (4,000)$ (9,000)$ (8,799) 201$
FUND BALANCES - BEGINNING OF YEAR 9,871
FUND BALANCES - END OF YEAR 1,072$
VARIANCE WITH FINAL
BUDGET POSITIVE
(NEGATIVE)
BUDGET

CITY OF FERGUSON, MISSOURI
Page 57
SCHEDULE OF REVENUES, EXPENDITURES, AND CHANGES IN FUND BALANCE - BUDGET AND ACTUAL
DOWNTOWN TIF REDEVELOPMENT SPECIAL REVENUE FUND FOR THE YEAR ENDED JUNE 30, 2013
ORIGINAL FINAL ACTUAL
REVENUES
Taxes 490,600$ 417,100$ 446,228$ 29,128$
Investment income - - 73 73
TOTAL REVENUES 490,600 417,100 446,301 29,201
EXPENDITURES
Current:
Community development 43,500 39,100 47,265 (8,165)
Capital outlay - 35,500 27,340 8,160
TOTAL EXPENDITURES 43,500 74,600 74,605 (5)
EXCESS OF REVENUES OVER
(UNDER) EXPENDITURES 447,100 342,500 371,696 29,196
OTHER FINANCING (USES)
Transfers (out) (446,200) (267,700) (270,988) (3,288)
CHANGE IN FUND BALANCE 900$ 74,800$ 100,708 25,908$
FUND BALANCES - BEGINNING OF YEAR 1,035,387
FUND BALANCES - END OF YEAR 1,136,095$
VARIANCE WITH FINAL
BUDGET POSITIVE
(NEGATIVE)
BUDGET

CITY OF FERGUSON, MISSOURI
Page 58
SCHEDULE OF REVENUES, EXPENDITURES, AND CHANGES IN FUND BALANCE - BUDGET AND ACTUAL SEWER LATERAL SPECIAL REVENUE FUND
FOR THE YEAR ENDED JUNE 30, 2013
ORIGINAL FINAL ACTUAL
REVENUES
Taxes 179,700$ 193,700$ 186,528$ (7,172)$
Investment income 14,800 14,800 2,261 (12,539)
TOTAL REVENUES 194,500 208,500 188,789 (19,711)
EXPENDITURES
Current:
Community development 110,000 110,000 128,105 (18,105)
TOTAL EXPENDITURES 110,000 110,000 128,105 (18,105)
EXCESS OF REVENUES OVER
(UNDER) EXPENDITURES 84,500 98,500 60,684 (37,816)
OTHER FINANCING (USES)
Transfers (out) (10,000) (12,000) (13,000) (1,000)
CHANGE IN FUND BALANCE 74,500$ 86,500$ 47,684 (38,816)$
FUND BALANCES - BEGINNING OF YEAR 818,842
FUND BALANCES - END OF YEAR 866,526$
VARIANCE WITH FINAL
BUDGET POSITIVE
(NEGATIVE)
BUDGET

CITY OF FERGUSON, MISSOURI
Page 59
SCHEDULE OF REVENUES, EXPENDITURES, AND CHANGES IN FUND BALANCE - BUDGET AND ACTUAL
LOCAL IMPROVEMENT CAPITAL PROJECTS FUND FOR THE YEAR ENDED JUNE 30, 2013
ORIGINAL FINAL ACTUAL
REVENUES
Investment income -$ -$ -$ -$
OTHER FINANCING (USES)
Transfers (out) (211,000) (202,400) (202,434) (34)
CHANGE IN FUND BALANCE (211,000)$ (202,400)$ (202,434) (34)$
FUND BALANCES - BEGINNING OF YEAR 202,434
FUND BALANCES - END OF YEAR -$
VARIANCE WITH FINAL
BUDGET POSITIVE
(NEGATIVE)
BUDGET

CITY OF FERGUSON, MISSOURI
Page 60
SCHEDULE OF REVENUES, EXPENDITURES, AND CHANGES IN FUND BALANCE - BUDGET AND ACTUAL
HALLS FERRY TIF DEBT SERVICE FUND FOR THE YEAR ENDED JUNE 30, 2013
ORIGINAL FINAL ACTUAL
REVENUES
Taxes 967,100$ 883,400$ 868,293$ (15,107)$
Investment income 12,800 12,800 (5,148) (17,948)
TOTAL REVENUES 979,900 896,200 863,145 (33,055)
EXPENDITURES
Debt service:
Principal, interest and fiscal charges 532,800 860,300 865,299 (4,999)
TOTAL EXPENDITURES 532,800 860,300 865,299 (4,999)
EXCESS OF REVENUES OVER
(UNDER) EXPENDITURES 447,100 35,900 (2,154) (38,054)
OTHER FINANCING (USES)
Transfers (out) (13,000) (15,600) (11,744) 3,856
CHANGE IN FUND BALANCE 434,100$ 20,300$ (13,898) (34,198)$
FUND BALANCES - BEGINNING OF YEAR 1,040,090
FUND BALANCES - END OF YEAR 1,026,192$
VARIANCE WITH FINAL
BUDGET POSITIVE
(NEGATIVE)
BUDGET

CITY OF FERGUSON, MISSOURI
Page 61
SCHEDULE OF REVENUES, EXPENDITURES, AND CHANGES IN FUND BALANCE - BUDGET AND ACTUAL
CERTIFICATES OF PARTICIPATION DEBT SERVICE FUND FOR THE YEAR ENDED JUNE 30, 2013
ORIGINAL FINAL ACTUAL
REVENUES
Investment income -$ -$ 1,996$ 1,996$
EXPENDITURES
Debt service:
Principal, interest and fiscal charges 429,000 226,500 227,179 (679)
Issuance costs 60,000 64,000 102,473 (38,473)
TOTAL EXPENDITURES 489,000 290,500 329,652 (39,152)
EXCESS OF REVENUES OVER
(UNDER) EXPENDITURES (489,000) (290,500) (327,656) (37,156)
OTHER FINANCING SOURCES (USES)
Transfers in (out) (3,361,000) 290,500 227,660 (62,840)
Issuance of debt 3,850,000 - 102,932 102,932
TOTAL OTHER FINANCING SOURCES (USES) 489,000 290,500 330,592 40,092
CHANGE IN FUND BALANCE -$ -$ 2,936 2,936$
FUND BALANCES - BEGINNING OF YEAR 32,771
FUND BALANCES - END OF YEAR 35,707$
VARIANCE WITH FINAL
BUDGET POSITIVE
(NEGATIVE)
BUDGET

CITY OF FERGUSON, MISSOURI
Page 62
SCHEDULE OF REVENUES, EXPENDITURES, AND CHANGES IN FUND BALANCE - BUDGET AND ACTUAL
GENERAL OBLIGATION BOND DEBT SERVICE FUND FOR THE YEAR ENDED JUNE 30, 2013
ORIGINAL FINAL ACTUAL
REVENUES
Taxes 700,000$ 500,000$ 680,030$ 180,030$
Investment income 600 36,200 7,571 (28,629)
TOTAL REVENUES 700,600 536,200 687,601 151,401
EXPENDITURES
Debt service:
Principal, interest and fiscal charges 526,000 524,000 523,693 307
TOTAL EXPENDITURES 526,000 524,000 523,693 307
EXCESS OF REVENUES OVER
(UNDER) EXPENDITURES 174,600 12,200 163,908 151,708
OTHER FINANCING SOURCES (USES)
Transfers (out) (3,500,000) - - -
CHANGE IN FUND BALANCE (3,325,400)$ 12,200$ 163,908 151,708$
FUND BALANCES - BEGINNING OF YEAR 250,100
FUND BALANCES - END OF YEAR 414,008$
VARIANCE WITH FINAL
BUDGET POSITIVE
(NEGATIVE)
BUDGET

CITY OF FERGUSON, MISSOURI
Page 63
STATEMENT OF CHANGES IN ASSETS AND LIABILITIES - AGENCY FUND
FOR THE YEAR ENDED JUNE 30, 2013
BALANCE BALANCE
July 1, 2012 ADDITIONS DEDUCTIONS June 30, 2013
ASSETS
Cash 129,392$ 481,172$ 484,331$ 153,305
LIABILITIES
Accounts payable 129,392$ 481,172$ 484,331$ 153,305

Statistical Section

CITY OF FERGUSON, MISSOURI
STATISTICAL SECTION
This part of the City of Ferguson, Missouri's comprehensive annual financial report presents detailed information as a context for understanding what the information in the financial statements, note disclosures and required supplementary information says about the City's overall financial health. Financial Trends
These schedules contain trend information to help the reader understand how the City's financial performance and well-being have changed over time.
Revenue Capacity
These schedules contain information to help the reader assess the City's most significant local revenue source, the property tax.
Debt Capacity
These schedules present information to help the reader assess the affordability of the City's current levels of outstanding debt and the City's ability to issue additional debt in the future.
Demographic and Economic information
These schedules offer demographic and economic indicators to help the reader understand the environment within which the City's financial activities take place.
Operating Information
These schedules contain service and infrastructure data to help the reader understand how the information in the City's financial report relates to the services the City provides and the activities it performs.
Sources: Unless otherwise noted, the information in these schedules is derived from the comprehensive annual financial reports for the relevant year.

CITY OF FERGUSON, MISSOURI
Page 64
NET ASSETS
LAST TEN FISCAL YEARS
Governmental Activities:Invested in capital assets,
net of related debt 10,525,807$ 7,962,476$ 9,019,903$ 10,171,824$ 9,961,395$ 10,507,866$ 7,246,484$ 8,533,891$ 8,870,581$ 8,491,905$
Restricted 7,376,914 9,566,443 6,629,112 4,167,465 4,429,985 5,138,047 7,826,907 5,761,966 3,732,212 3,249,387
Unrestricted 10,558,847 8,830,630 8,445,015 8,335,627 6,774,385 4,649,996 (252,954) (1,839,153) (3,229,912) (4,635,077)
Total GovernmentalActivities Net Assets 28,461,568$ 26,359,549$ 24,094,030$ 22,674,916$ 21,165,765$ 20,295,909$ 14,820,437$ 12,456,704$ 9,372,881$ 7,106,215$

CITY OF FERGUSON, MISSOURI
Page 65
CHANGES IN NET ASSETS LAST TEN FISCAL YEARS (Accrual basis of accounting)
2013 2012 2011 2010 2009 2008 2007 2006 2005 2004EXPENSES
Administrative 1,657,963$ 1,490,297$ 1,447,325$ 1,696,105$ 1,644,938$ 1,567,009$ 1,608,651$ 1,376,228$ 1,221,280$ 1,641,523$ Police department 8,454,328 8,068,845 7,956,853 7,397,481 7,786,030 7,531,021 7,219,261 6,674,109 6,432,507 6,417,994 Highway and streets 3,472,835 2,783,537 3,238,956 2,838,959 3,071,497 2,323,528 3,109,783 2,619,592 1,111,778 1,564,795 Community development 1,032,783 539,542 575,041 679,624 408,792 609,187 782,770 302,788 530,793 491,677 Culture and recreation 1,669,835 1,604,340 1,436,866 1,452,228 1,546,383 1,442,340 1,613,879 1,522,714 1,461,715 1,470,433 Interest and fiscal charges 795,834 679,492 587,564 664,269 717,508 680,399 724,694 615,573 411,427 717,441
Total GovernmentalActivities Expenses 17,083,578 15,166,053 15,242,605 14,728,666 15,175,148 14,153,484 15,059,038 13,111,004 11,169,500 12,303,863
PRO GRAM REVENUE
Charges for services:General government 772,859 617,251 667,595 531,126 488,950 439,153 451,320 420,797 439,753 - Public safety 2,619,331 2,339,013 1,653,964 1,601,767 1,535,853 1,694,023 1,611,704 1,446,387 1,336,666 1,379,688 Highways and streets 231,883 507,977 288,168 265,522 274,229 208,710 482,952 491,895 - - Community develoopment - - - - - 30,611 16,342 22,378 198,654 190,824 Culture and recreation 310,937 362,054 361,689 324,800 334,099 368,180 360,424 582,667 554,324 559,256
Operating grants 170,831 195,787 - - - - - - 1,211,287 1,413,984 Capital grants 1,800,834 303,202 860,404 399,529 273,961 2,199,903 320,056 222,109 286,760 130,571
Total Governmental ActivitiesProgram Revenue 5,906,675 4,325,284 3,831,820 3,122,744 2,907,092 4,940,580 3,242,798 3,186,233 4,027,444 3,674,323
NET EXPENSES (11,176,903) (10,840,769) (11,410,785) (11,605,922) (12,268,056) (9,212,904) (11,816,240) (9,924,771) (7,142,056) (8,629,540)
GENERAL REVENUES AND
O THER CHANGES IN NET ASSETSGovernmental activities:
Taxes:Sales 7,483,584 6,583,419 6,441,170 7,730,561 8,292,648 8,687,937 8,894,227 8,870,085 5,820,353 5,350,366 Utility 2,453,095 2,349,542 2,783,666 2,643,673 2,416,369 2,665,470 2,040,890 1,925,685 1,535,947 1,801,120 Property 3,421,789 2,837,325 1,983,472 2,057,148 2,277,332 2,304,983 1,731,106 1,613,335 1,803,756 1,557,673 Other 57,851 1,047,469 1,129,883 65,569 77,778 72,980 75,165 81,919 81,000 84,340
Investment income (66,290) 245,779 140,273 113,766 248,331 551,101 603,169 396,682 70,120 23,014 Gain on disposal of capital assets - - - - - 660,898 18,810 49,996 - Other miscellaneous revenue 124,487 42,757 121,109 443,902 131,401 299,373 174,519 102,078 47,550 110,758
Total Government Activities 13,474,516 13,106,291 12,599,573 13,054,619 13,443,859 14,581,844 14,179,974 13,008,594 9,408,722 8,927,271
CHANGES IN NET ASSETS 2,297,613$ 2,265,522$ 1,188,788$ 1,448,697$ 1,175,803$ 5,368,940$ 2,363,734$ 3,083,823$ 2,266,666$ 297,731$

CITY OF FERGUSON, MISSOURI
Page 66
FUND BALANCES, GOVERNMENTAL FUNDS
LAST TEN FISCAL YEARS
2013 2012 2011 2010 (1) 2009 2008 2007 2006 2005 2004
General Fund:Nonspendable 191,348$ 232,408$ 424,799$ -$ -$ -$ -$ -$ -$ -$
Assigned - 105,200 - - - - - - - - Reserved - - - 397,477 6,800 352,891 78,513 33,104 42,136 24,857 Unreserved - - - 8,092,009 7,760,429 6,772,230 4,967,205 3,920,519 2,688,395 1,905,745
Unassigned 10,308,718 9,324,324 8,445,015 - - - - - - - Total general fund 10,500,066$ 9,661,932$ 8,869,814$ 8,489,486$ 7,767,229$ 7,125,121$ 5,045,718$ 3,953,623$ 2,730,531$ 1,930,602$
All Other Governmental Funds:Nonspendable -$ -$ 57,009$ -$ -$ -$ -$ -$ -$ -$ Restricted 14,843,865 10,837,846 5,737,366 - - - - - - -
Assigned (2) 1,072 212,305 409,938 - - - - - - - Reserved - - - 390,192 298,387 1,219,114 3,897,624 1,481,764 1,471,275 1,859,374 Unreserved reported in:
Special revenue funds - - - 2,112,554 3,023,519 2,760,455 2,047,147 1,400,123 770,405 424,051 Capital projects funds - - - 4,328,542 3,879,649 4,602,995 4,843,409 4,952,065 1,359,238 647,676 Debt service funds - - - - - - - - 248,190 470,443
Total all othergovernmental funds 14,844,937$ 11,050,151$ 6,204,313$ 6,831,288$ 7,201,555$ 8,582,564$ 10,788,180$ 7,833,952$ 3,849,108$ 3,401,544$
(1) In fiscal year 2011, a prior period adjustment was made which increased the fund balance of capital projects funds by $385,405.
(2) In fiscal year 2013, the City reached the conclusion that its Parks Fund’s fund balance is not assigned, but instead, is restricted by statute and, accordingly, was previously incorrectly classified. Restatement of restricted fund balances of for the two fiscal years ended June 30, 2012 has been made. Those amount are $1,227,163/2012 and $1,110,458/2011, respectively.

CITY OF FERGUSON, MISSOURI
Page 67
CHANGES IN FUND BALANCES, GOVERNMENTAL FUNDS LAST TEN FISCAL YEARS
2013 2012 2011 2010 2009 2008 2007 2006 2005 2004Revenues
Taxes (1) 13,349,317$ 12,728,871$ 12,457,272$ 12,482,833$ 12,882,051$ 13,983,386$ 12,577,656$ 12,491,024$ 9,129,162$ 8,645,181$ Licenses and permits 679,240 730,581 681,085 646,245 673,892 594,890 679,974 634,304 439,753 388,487 Intergovernmental (1) - - - - - - - 244,487 1,521,417 1,434,449
Charges for service 684,580 774,429 770,213 682,241 567,693 537,268 696,176 918,193 1,095,380 1,122,359
Fines and forfeitures 2,571,190 2,227,648 1,520,118 1,394,729 1,391,546 1,447,904 1,477,985 1,398,221 1,085,084 1,056,528
Investment income (2) (66,290) 245,779 140,273 113,766 248,331 551,101 603,169 396,682 70,120 -
Other income 2,045,489 542,463 1,096,053 763,131 405,862 2,437,844 510,917 120,888 99,271 300,790
Total Revenues 19,263,526 17,249,771 16,665,014 16,082,945 16,169,375 19,552,393 16,545,877 16,203,799 13,440,187 12,947,794
ExpendituresGeneral government 1,443,858 1,281,211 1,367,131 1,606,737 1,571,405 1,485,407 1,426,782 1,326,238 1,169,794 1,588,424 Public safety 8,066,962 7,756,871 7,640,050 7,172,379 7,511,656 7,308,373 6,973,743 6,418,677 6,248,835 6,295,717 Highways and streets 2,386,624 1,975,865 1,978,700 1,521,058 1,496,604 1,472,053 1,419,157 1,281,617 816,721 1,025,494 Community development 639,587 536,152 559,858 1,652,928 759,865 827,062 592,481 463,065 400,229 300,555 Culture and recreation 1,311,007 1,242,896 1,122,730 1,136,445 1,171,905 1,167,650 1,241,970 1,245,006 1,228,020 1,333,516 Capital outlay 7,453,234 4,196,885 2,334,697 1,217,476 4,225,507 5,688,451 2,738,118 1,623,172 1,171,901 1,406,502 Debt service:
Issuance cost 102,473 155,534 - - - - - - - - Interest and fiscal charges 522,421 926,894 518,757 578,414 612,897 916,235 598,320 529,578 544,113 716,990 Principal 1,854,869 1,435,000 1,389,740 1,291,377 1,539,193 711,228 908,982 565,000 130,000 340,000
Total Expenditures 23,781,035 19,507,308 16,911,663 16,176,814 18,889,032 19,576,459 15,899,553 13,452,353 11,709,613 13,007,198
Excess of Revenues O ver
(Under) Expenditures (4,517,509) (2,257,537) (246,649) (93,869) (2,719,657) (24,066) 646,324 2,751,446 1,730,574 (59,404)
O ther Financing Sources (Uses)
Proceeds from issuance of debt 9,055,000 10,065,000 - - 1,669,205 64,942 2,750,000 2,332,127 7,370,000 -
Insurance Proceeds 50,663 - - - - - - - - -
Payments to escrow agent - (2,280,400) - - - - - - (7,989,575) -
Premium (discount) on bond issue 44,764 110,895 - - - - - - (44,195) -
Sales of capital assets - - - - - - 650,000 - 130,032 -
T ransfers - - - - - - - 124,362 - -
Total O ther Financing
Sources (Uses) 9,150,427 7,895,495 - - 1,669,205 64,942 3,400,000 2,456,489 (533,738) -
Net Change In Fund Balances 4,632,918$ 5,637,958$ (246,649)$ (93,869)$ (1,050,452)$ 40,876$ 4,046,324$ 5,207,935$ 1,196,836$ (59,404)$
Debt service as a percentage
of noncapital expenditures 13.7% 15.2% 12.7% 12.8% 16.5% 11.6% 10.5% 8.9% 6.1% 8.8%
(1) Beginning in 2006, the City included motor fuel sales and cigarette receipts as taxes instead of intergovernmental.
(2) Prior to 2005, the City included investment income in other income.

CITY OF FERGUSON, MISSOURI
Page 68
ASSESSED AND ESTIMATED ACTUAL VALUE OF TAXABLE PROPERTY – GENERAL FUND
LAST TEN FISCAL YEARS
Total EstimatedReal Personal Assessed Direct Actual
Fiscal Year Property Property Value Tax Rate Value
2004 142,837,113 42,824,082 183,015,417 0.634 773,650,784 2005 142,181,034 40,178,304 179,944,094 0.634 763,982,562 2006 151,503,500 37,763,060 200,047,788 0.600 851,195,790 2007 155,931,428 43,042,580 199,605,118 0.600 859,629,879 2008 197,435,766 43,673,690 242,250,098 0.648 1,019,303,012 2009 198,084,849 44,814,332 242,226,159 0.648 1,053,739,213 2010 169,478,310 42,468,940 211,947,250 0.648 950,614,790 2011 169,400,220 35,806,960 205,207,180 0.648 911,715,925 2012 163,979,466 34,082,970 198,062,436 0.080 820,097,810 2013 134,734,400 33,379,110 168,113,510 0.080 100,137,330
Source: St. Louis County Assessor
Residential real property is assessed at 19 percent of estimated value, commercial at 32 percent, and agricultural at 12 percent; personal property is assessed at 33 1/3 percent.
A complete property assessment is made by the Assessor bi-annually in odd-numbered years. Tax rates are per $100 of assessed value.

CITY OF FERGUSON, MISSOURI
Page 69
PROPERTY TAX RATES - DIRECT AND OVERLAPPING GOVERNMENTS
LAST TEN FISCAL YEARS
Fiscal Year 2013 2012 2011 2010 2009 2008 2007 2006 2005 2004
CityGeneral 0.8000$ 0.4500$ 0.4500$ 0.4500$ 0.4500$ 0.4500$ 0.4200$ 0.4200$ * *Parks 0.1920 0.1900 0.2000 0.2000 0.2000 0.2000 0.1800 0.1800 * *GOB 0.3640 0.3800 - - - - - - * *Total 1.3560 1.0200 0.6500 0.6500 0.6500 0.6500 0.6000 0.6000 * *
School District 5.0400 5.0200 5.0200 5.0200 5.0300 4.8400 4.8400 4.8500 5.0400 5.0400 County 0.5230 0.5230 0.5200 0.5200 0.5600 0.5600 0.5600 0.5600 0.5800 0.5800 State 0.0300 0.3000 0.3000 0.3000 0.3000 0.0300 0.0300 0.0300 0.0300 0.0300 Other 1.9682 1.7174 1.6900 1.4400 1.3900 1.8300 1.8300 1.7600 1.8600 1.9600 Total 8.9172$ 8.5804$ 8.1800$ 7.9300$ 7.9300$ 7.9100$ 7.8700$ 7.8000$ 7.5100$ 7.6100$
* Information not available

CITY OF FERGUSON, MISSOURI
Page 70
PRINCIPAL PROPERTY TAXPAYERS
CURRENT YEAR AND TEN YEARS AGO
Property Taxpayer Type of Business
Emerson Electric Manufacturing 8,668,560$ 4.22% 5,069,440$ 2.79%
Sam's/Walmart Real Estate Retail Sales 3,955,330 1.93% 3,288,900 1.81%
Crossings at Halls Ferry LLC Shopping Center 3,250,370 1.58% 2,660,960 1.46%
US Bancorp-Allen Technologies Equipment Leasing 2,003,210 0.98% -
Home Depot USA, Inc. Retail Sales 2,001,420 0.98% 2,488,000 1.37%
NCF LLC Real Estate Holding Co. 1,824,000 0.89% - 0.00%
Lipton Properties Apartment Rental 1,730,520 0.84% 1,623,160 0.89%
Park Ridge Appts/Gannon Ptrship Apartment Rental 1,691,760 0.82% 1,356,490
Ackerman Buick Retail Sales 1,285,410 0.63% 1,489,090 0.82%
Coats Investment Ltd. Real Estate Holding Co. 1,231,360 0.60% - 0.00%
Northwinds Apartments LLP Apartment Rental 917,700 0.45% 1,794,020 0.99%
Newger Materials/Investments Retail Sales 1,151,280 0.56% - 0.00%
Gelco Corporation Equipment Leasing 1,071,100 0.52% - 0.00%
Totals 30,782,020$ 15.00% 19,770,060$ 10.13%
Source: St. Louis County Assessor
2003
Assessed Value
Percent of Total
Assess- ment
2013
Assessed Value
Percent of Total Assess-
ment

CITY OF FERGUSON, MISSOURI
Page 71
PROPERTY TAX LEVIES AND COLLECTIONS
LAST TEN FISCAL YEARS
TotalOriginal Adjusted Current Percent Total Collections
Fiscal Tax Tax Tax Collected Tax As PercentYear Levy Levy (1) Collections As Current Collections of Levy
2004 1,128,168$ 1,133,568$ 1,042,668$ 92.0 % 1,133,568$ 100.0 %2005 1,125,240 1,129,347 965,928 85.5 1,129,347 100.02006 1,172,244 1,177,642 1,087,504 92.3 1,170,752 99.42007 1,192,232 1,197,689 1,104,141 92.2 1,197,689 100.02008 1,208,931 1,208,931 1,083,238 89.6 1,186,971 98.22009 1,264,932 1,210,069 972,588 80.4 1,184,921 97.92010 1,226,175 1,203,638 970,929 80.7 1,206,582 100.22011 1,193,729 1,193,983 937,925 78.6 1,172,891 98.22012 1,190,246 1,193,983 960,575 80.5 1,165,416 97.62013 1,858,710 1,849,680 1,482,937 80.2 1,770,863 95.7

CITY OF FERGUSON, MISSOURI
Page 72
SPECIAL ASSESSMENT COLLECTIONS
LAST TEN FISCAL YEARS
Special Collected Uncollected
Fiscal Assessments as of as of CollectionYear Levied June 30 June 30 Ratio
2004 108,745$ 24,863$ 69,432$ 23 %
2005 70,469 19,377 51,092 272006 67,285 31,069 36,216 462007 49,581 22,502 27,080 452008 59,359 29,810 29,549 502009 67,457 45,450 22,007 672010 80,963 32,456 48,507 402011 75,675 21,760 53,915 292012 116,954 21,943 95,011 19
2013 94,210 20,902 73,308 22

CITY OF FERGUSON, MISSOURI
Page 73
RATIO OF OUTSTANDING DEBT BY TYPE
LAST TEN FISCAL YEARS
Notes: (1) Details regarding the City's outstanding debt can be found in the notes to the financial statements. (2) On September 12, 1997, the City issued tax increment bonds for the Crossings at Halls Ferry Redevelopment Project. These bonds were refunded on March 1, 2005, when the City issued $7,370,000 in TIF bonds to refund the prior bonds. (3) On October 3, 2002, the City issued certificates of participation of $3,480,000 for the new aquatic facility known as the Splash at Wabash. (4) In September 2005, the City issued $2,250,000 in variable rate capital improvement bonds. The purpose of the bonds is to finance the cost of acquiring, constructing, rehabilitating, equipping, and improving certain capital improvement projects. On September 1, 2006, the City issued an additional $2,750,000. (5) Leases with various lessors for fire trucks and infrastructure improvements. (6) In September 2011, the City issued $8,000,000 in general obligation bonds. The purpose of the bonds is to finance the cost of acquiring, constructing, and equipping a new firehouse. (7) See table entitled "Demographic and Economic Statistics" for personal income and population data. (8) On January 30, 2013, the City issued $9,055,000 of certificates of participation bonds - Series 2013. The bonds were issued for the purpose of acquiring land and buildings for a new community center and the renovation of these buildings and for renovation and additions to the building currently housing the police department. (9) All amounts rounded to the nearest $1000, except for percent and per capita.
Fiscal Year
Tax Increment Revenue
Bond(2)
Certifi- cates of
Participa- tion (3)
Variable Rate
Capital Improve-
ments Bonds
(4)
Capital Leases
(5)
General Obligation
Bonds (6)
Certificates of
Participation 2013
Total Primary
Government
Percent of Per- sonal
IncomePer
Capita
2004 7,145$ 3,355$ -$ -$ -$ -$ 10,500$ 0.98 % 440$ 2005 7,370 3,225 - - - - 10,595 0.92 427
2006 6,935 3,095 2,250 78 - - 12,358 1.07 508
2007 6,185 2,960 500 54 - - 9,699 1.37 634
2008 5,510 2,820 4,850 73 - - 13,253 1.37 539 2009 4,600 2,680 4,545 1,558 - - 13,383 1.23 597
2010 4,000 2,535 4,225 1,331 - - 12,091 1.45 540
2011 3,305 2,385 3,895 1,115 - - 10,700 1.28 478
2012 2,545 2,065 3,550 893 7,670 - 16,723 2.00 789
2013 1,810 1,870 3,190 663 7,345 9,055 23,933 0.03 1,129
Governmental Activities

CITY OF FERGUSON, MISSOURI
Page 74
COMPUTATION OF DIRECT AND OVERLAPPING DEBT -
GENERAL OBLIGATION BONDED DEBT JUNE 30, 2013
Percentage AmountApplicable Applicableto City of to City ofFerguson Ferguson
Direct:City of Ferguson 23,933,000$ 100.00% 23,933,000$
Overlapping:St. Louis County 499,400,000$ 2.13% 10,637,220 Ferguson-Florissant RIISchool District 23,000,000$ 25.80% 5,934,000
Total Overlapping Debt: 16,571,220
Total Direct And Overlapping Debt 40,504,220$
Source: Outstanding debt was obtained by contacting the taxing jurisdiction. The percentage applicable to the City is based on the jurisdiction's assessed value within the boundaries of the City.
Name ofGovernmental Unit
Debt Outstanding

CITY OF FERGUSON, MISSOURI
Page 75
LEGAL DEBT MARGIN INFORMATION
JUNE 30, 2013
2013
Net Assessed Value at July 1, 2013 185,682,090$
Debt limit - 10% of assesssed valuation* 18,568,209$
Amount of debt applicable to debt limit:
Total bonded debt 7,345,000$
Less assets in Debt Service Fund 404,095
Total Amount of Debt Applicable to Debt Limit 6,940,905
Legal debt margin 11,627,304$
Prior fiscal year information:
2012Net Assessed Value at July 1, 2012 198,062,436$
Debt limit - 10% of assesssed valuation* 19,806,244$
Amount of debt applicable to debt limit:
Total bonded debt 7,670,000$
Less assets in Debt Service Fund 250,100
Total Amount of Debt Applicable to Debt Limit 7,419,900
Legal debt margin 12,386,344$
Total net debt applicable to the limit
as a percentage of debt limit
* Under Article VI, Sections 26(b) and 26(c) of the Missouri Constitution, the City by vote of 2/3 of the qualified electors thereof, may incur general obligation bonded indebtedness for City purposes in an amount not to exceed 10% of the assessed valuation.

CITY OF FERGUSON, MISSOURI
Page 76
PLEDGED REVENUE COVERAGE
LAST EIGHT FISCAL YEARS
TIF TIF Less Net
Fiscal Sales Property Available Available
Year Tax Tax Revenue Revenue Principal Interest Coverage
2006 616,483$ 452,804$ 34,482$ 1,034,805$ 435,000$ 345,356$ 1.33
2007 628,300 506,052 46,207 1,088,145 750,000 304,610 1.03 2008 628,300 506,052 46,207 1,088,145 675,000 292,480 1.03
2009 540,790 412,512 - 953,302 910,000 254,418 0.82
2010 377,216 495,670 4,053 868,833 600,000 214,115 1.07
2011 464,446 397,236 - 861,682 695,000 188,500 0.98
2012 487,813 386,350 - 874,163 760,000 159,150 0.95
2013 471,134 397,159 - 868,293 735,000 125,570 1.01
Note:
Details regarding the City's outstanding debt can be found in the notes to the financial statements.
Operating expenses do not include interest, depreciation, or amortization expenses.
TIF Refunding and Improvement Bonds (1)
Debt Service
(1) TIF Revenue Bonds debt service is paid by sales and property taxes collected in the Halls Ferry TIF district.

CITY OF FERGUSON, MISSOURI
Page 77
DEMOGRAPHIC AND ECONOMIC STATISTICS
LAST TEN CALENDAR YEARS
PersonalIncome Median
Fiscal (thousands Household UnemploymentYear Population of dollars) Income Rate
2004 22,406$ 1,010,533$ 45,101$ 5.1 %2005 22,406 1,036,815 46,274 5.52006 22,406 1,063,772 47,477 5.12007 22,406 1,040,054 48,838 5.32008 22,406 1,122,715 50,108 5.12009 22,406 1,090,836 48,685 10.12010 22,406 832,719 37,165 9.22011 21,203 782,984 36,928 8.62012 21,203 790,808 37,297 8.22013 21,203 776,984 36,645 8.6
Sources:
Note:
Population and per capita personal income data for the City using the U.S. Census Bureau data for the area and Bureau of Economic Analysis for St. Louis County. Unemployment rate data was located using the U.S. Department of Labor, Bureau of Labor Statistics website.
Per capita personal income for year 2005 used consumer price index for midwest state as a percent of change from 2004.

CITY OF FERGUSON, MISSOURI
Page 78
PRINCIPAL EMPLOYERS
CURRENT YEAR AND SEVEN YEARS AGO
Employer
Ferguson-Florissant School District 1,883 1 18% (1) - 0%
St. Louis Community College 762 2 8% (1) - 0%Emerson Electric 804 3 3% 615 1 3%
Walmart 327 4 2% 334 2 2%Sam's Club 172 5 2% 160 5 1%
Shop N Save - 2 stores 179 6 1% 212 3 1%Home Depot 131 7 1% 150 4 1%
Negwar Materials 100 8 1% 70 6 0%Cracker Barrel 95 9 1% 120 5 1%McDonalds Restaurant 65 10 1% 60 9 0%
McDonalds Restaurant 65 11 0% 55 10 0%Walgreens - 1 store 36 12 0% 120 5 1%
Source: Business License database from Finance Department
Note: Information not accumulated prior to 2005/2006 fiscal year.
2012/13 Fiscal Year 2005/2006 Fiscal Year
Percentage of Total City Employment
Percentage of Total City Employment
(1)
Em- ploy- ees Rank
Em- ploy- ees Rank

CITY OF FERGUSON, MISSOURI
Page 79
FULL-TIME EQUIVALENT CITY GOVERNMENT EMPLOYEES BY FUNCTION/PROGRAM
LAST TEN FISCAL YEARS
Funtion/Program 2013 2012 2011 2010 2009 2008 2007 2006 2005 2004
General government:Legislative Department:
Elected Officials 7 7 7 7 7 7 7 7 7 7City Clerk 1 1 1 1 1 1 1 1 1 1
Administration Department 3 2 2 3 4 4 4 2 2 2Human Resources 1 1 1 1 1 1 1 1 1 1Information Technology 2 1 1 1 1 1 1 - - -Finance Department 4 3 3 3 3 3 3 3 3 5Public Works Administration 2 2 2 2 2 3 3 3 3 3
Community Development:Planning and Development 1 4 4 4 4 4 4 4 3 2
Public Safety:Municipal Court 3 3 3 3 3 3 3 3 3 3Police Department:
Commissioned officers 54 54 54 54 54 54 52 53 52 52Civilians 11 9 9 11 11 11 11 13 10 10
Fire Department 27 27 27 27 27 27 27 24 24 24Code Enforcement 6 6 6 6 6 6 7 5 5 7
Highways and Streets:Municipal Services (Streets) 11 16 16 16 16 16 12 12 12 12Municipal Garage 3 3 3 3 3 3 3 3 3 3
Parks and Recreation 5 4 4 4 4 5 8 10 10 10Total 141 143 143 146 147 149 147 144 139 142

CITY OF FERGUSON, MISSOURI
Page 80
OPERATING INDICATORS BY FUNCTION
LAST TEN FISCAL YEARS
2013 2012 2011 2010 2009 2008 2007 2006 2005 2004
Police Department
Crimes reported 1,509 1,335 1,235 1,100 1,396 1,469 1,236 * * *
Traffic accidents 555 348 417 339 409 445 463 * * *
Tickets issued 14,421 13,412 15,000 14,618 15,510 18,363 14,684 * * *
Camera Enforcement Tickets 5,318 - - - - - - - - -
Dispatched calls 24,520 24,900 20,933 20,291 23,689 24,945 22,506 * * *
Fire Department
Fires 151 122 122 118 131 128 181 * * *
Emergency medical services 1,748 1,808 1,923 1,789 1,873 1,801 1,616 * * *
Assists to other departments 480 566 603 820 847 944 690 * * *
Non-specific calls 482 457 561 556 508 471 682 * * *
Total calls responded to 2,861 2,947 3,209 3,283 3,359 3,344 3,169 * * *
Assists to other departments 352 259 274 404 361 316 248 * * *
Courts
Number of cases initiated 24,054 21,425 13,225 16,038 15,995 19,015 20,249 * * *
Parks and Recreation
Program participation 3,576 3,180 3,147 3,407 3,531 3,600 3,765 * * *
Shuttle passengers 3,171 3,161 3,067 1,406 972 1,444 1,416 * * *
Splash at Wabash 22,487 23,289 25,668 23,266 22,647 26,126 24,945 * * *
Sports Complex at Forestwood 64,421 67,026 68,433 70,012 68,604 70,662 70,616 * * *
Public Works
Occupancy permits 1,583 1,201 1,313 1,504 1,400 1,341 1,529 * * *
Inspections completed 13,867 14,206 13,726 14,665 14,100 12,268 12,268 * * *
Abatements made 2,181 1,837 1,931 2,123 2,245 2,781 2,377 * * *
* Information not available
Source: Various departments of the City of Ferguson, Missouri.
Note: FY2009 is the first year of preparation of this schedule. It is based on accumulated data of the prior calendar year. Statistics are not available prior to FY2006.

CITY OF FERGUSON, MISSOURI
Page 81
CAPITAL ASSET STATISTICS BY FUNCTION/PROGRAM LAST TEN FISCAL YEARS
2013 2012 2011 2010 2009 2008 2007 2006 2005 2004
Highways/Streets:
Miles of streets: paved 69.15 69.15 69.15 69.15 69.15 69.15 69.15 69.15 69.15 69.15
unpaved 9.85 9.85 9.85 9.85 9.85 9.85 9.85 9.85 9.85 9.85
Miles of alleys 0.23 0.23 0.23 0.23 0.23 0.23 0.23 0.23 0.23 0.23
Miles of sidewalks 41.52 41.52 41.52 41.52 41.52 41.52 41.52 41.52 41.52 41.52
Miles of sewers: storm 35.27 35.27 35.27 35.27 35.27 35.27 35.27 35.27 35.27 35.27
sanitary 40.59 40.59 40.59 40.59 40.59 40.59 40.59 40.59 40.59 40.59
1,117 1,117 1,117 1,117 1,117 1,117 1,117 1,117 1,117 1,117
Fire Protection
Number of stations 2 2 2 2 2 2 2 2 2 2
Fire hydrants 598 597 597 597 597 597 597 597 597 597
Vehicles:
Pumpers 3 2 2 3 3 3 3 3 3 3
Ladder Truck - 1 1 - - - - - - -
Pumper/Telesquirt 1 - - 1 1 1 1 1 1 1
Rescue trucks 1 1 1 1 1 1 1 1 1 1
Foam Truck 1 1 1 1 1 1 1 1
Command Vehicles 2 2 2 - - - - - - -
Police Protection:
Number of stations 1 1 1 1 1 1 1 1 1 1
Parks and Recreation:
Acres of parks 108 108 108 108 108 108 108 108 108 108
Number of parks 11 11 11 11 11 11 11 11 11 11
Source: Various departments of the City of Ferguson, Missouri.