City of Edmonton Waste and Drainage Services Annual ... AnnuAl RepoRt / wAste And dRAinAge seRvices...
56
2016 ANNUAL REPORT CITY OF EDMONTON waste & drainage services
-
Upload
nguyenkiet -
Category
Documents
-
view
222 -
download
1
Transcript of City of Edmonton Waste and Drainage Services Annual ... AnnuAl RepoRt / wAste And dRAinAge seRvices...

2016 AnnuAl RepoRt
City of Edmonton
waste & drainage services

The LVSo team (L to R): farid iskandar, Liam devereux, mark demers, tim mikula, Pat Church, Laura Henderson, myles Curry, Connie Boyce, Chris Cook
LVSo stands for Large Volume Set out - this was a project that won the City manager’s Award this year in the innovation category.
message from the manager 1
strategic framework 2
organizational structure 4
strategic direction 7
2016 highlights 10
financial summary 15
table of contents

2016 AnnuAl RepoRt / wAste And dRAinAge seRvices /Page 1
The Waste and Drainage Services branch has accomplished much in 2016.
waste and drainage services experienced a great period of change and transition, and while this can present numerous challenges, i am proud of how accepting and collaborative our team has been in rising to new opportunities, and how their commitment to delivering quality services for residents has remained their top priority.
waste services is continually embracing innovation and technology as a means to increase waste diversion from landfill. in the fall of 2016, we started pilot testing several automated waste collection trucks in various types of edmonton neighbourhoods. Additionally, we signed a contract with Redemptive developments, who have partnered with the city of edmonton, to help us recycle mattresses. Mattresses that are made of wood and metal are recyclable and i am pleased to see a solution in place to ensure they stay out of the landfill. with the city’s goal of landfill diversion in mind, our partners at enerkem are continuing work on their waste to Biofuels and chemicals Facility, turning household garbage into biofuels and biochemicals (e.g. methanol and ethanol) and continue to increase their capacity.
edmonton’s sustainable waste system is a source of pride for many residents. with over 50 per cent of residential waste currently being diverted from landfill and an ambitious goal to increase this diversion to 90 per cent, the participation of residents in our waste reduction programs is essential for the sustainability of our system. we interact with residents on a daily basis, addressing concerns and ensuring that their needs for support and information are met, so we can help them do the right thing for our community. one of our most effective new programs is our large volume set out program, which recently won the city Manager’s Award of excellence for innovation. Through this program, our social marketing team worked with residents at their homes to help them understand what can be recycled, the average volume of waste for a typical resident, and how they can make setting out their waste easier for themselves and their collector.
in the fall of 2016, we implemented a free new app called wastewise in direct response to residents’ requests for more information about proper waste disposal. Residents can download the app, or find it on our website at edmonton.ca/waste. with the app, residents can search any
item and learn how to properly dispose of it. The public was quick to embrace this new resource, and by the end of 2016, we had 5,395 downloads and 52,328 items searched. This popular tool will continue to be available and will be an important platform for future initiatives.
drainage services continues to operate and maintain the city’s stormwater and sanitary sewer systems and remains a sound environmental steward of our river. This past year, our branch found significant efficiencies by fully implementing a proven method of high pressure water flushing to keep our sewer systems clean. in addition to using less water, high pressure flushing is more effective at clearing fats, oils, grease and debris than the low pressure flushing method it replaced. This allows crews to conduct more channel/culvert inspections and repair work.
we continue to invest in the rehabilitation of aging sewer and drainage infrastructure throughout the city. in 2016, we invested $42.5 million in nine neighbourhoods, which included 193 open cut sewer repairs, 253 catch basin lead repairs, 233 service connection repairs, 974 manhole repairs, and 85 kilometres of local sewer relining.
As well as maintaining the sewer system, we are responsible for building new infrastructure to meet the changing demands of our growing city. in 2016, flood mitigation continued to be a priority, receiving $37.5 million of our $158 million drainage capital budget. we also proactively assessed several edmonton neighbourhoods for potential to flood.
Building dry ponds is one of the many drainage solutions that we are looking at city-wide to protect neighbourhoods and reduce the risks of flooding. Recent federal and provincial funding for the Mill woods area’s dry ponds (Malcolm tweddle, edith Rogers, tawa and ekota) have enabled work to be done more quickly.
Although we continue to live in a period of great change, we will keep providing high quality waste and drainage services that are delivered effectively, efficiently, and safely. whatever future challenges lie ahead, i’m certain that our highly capable and dedicated team will continue to help make our city the best it can be.
Thanks and stay safe,
Chris Ward Branch manager, Waste and drainage Services
message from the manager

Page 2 / 2016 AnnuAl RepoRt / wAste And dRAinAge seRvices framew
ork
The utilities’ mission and vision statements provide definition and direction for a future of operational excellence and sustainability.
waste services vision
to be a customer-driven world leader in sustainable and innovative waste management.
waste services builds partnerships that contribute to delivering services that are cost effective, environmentally sustainable and customer focused. As leaders in providing waste management solutions, waste services will continue to be environmental champions and globally recognized as innovative leaders in waste management.
waste services mission
to provide waste management services for the City of Edmonton taking into consideration the needs of residents, the preservation of natural resources, the protection of the environment and the financial capabilities of the City.
waste services is committed to reducing its environmental footprint through using the best economically and financially available means to manage waste and engage citizens to reduce waste through community outreach. waste services provides responsive services by collecting and processing residential and non-residential waste to recover resources and increase landfill diversion rates. These operations are aided by internal and external support services.
strategic framework

2016 AnnuAl RepoRt / wAste And dRAinAge seRvices /Page 3
drainage services vision
Excellence and innovation in wastewater, stormwater and biosolids management through customer service, environmental stewardship, and fiscal responsibility.
drainage services provides high-quality, reliable service to customers in a safe and sustainable manner. Through well-maintained drainage infrastructure, efficient and up-to-date management systems, innovative system planning, and attention to continuous improvement, drainage services contributes to city of edmonton strategic goals in the areas of sustainable growth, quality of life, prosperity, health, and the environment.
drainage services mission
We protect public health and the environment by managing wastewater, stormwater and biosolids through environmentally and financially sustainable practices for the City of Edmonton, the north Saskatchewan River system, and our regional partners.
drainage services minimizes the negative impacts resulting from the disposal of wastewater, stormwater and biosolids on public health, quality of life, and the environment, including the north saskatchewan River, the city of edmonton, and the capital Region. drainage services contributes to edmonton’s vision leading the way in environmental stewardship, innovative design, and cost-efficiency, and by meeting iso 14001 environmental performance expectations.
values
Environmental Stewardship & Public Health
waste and drainage services continue to be a leaders in environmental performance and public health and safety standards. we meet or exceed municipal, provincial and federal requirements for stewardship of the environment, public health, and public safety.
Sustainability
waste and drainage services play a key role in the long-term sustainability of our city. we adopt integrated sustainable practices that benefit citizens and the environment; we repair, replace and build new facilities to achieve sustainable urban development goals; and we enable affordable utility rates for the people of edmonton over the long term.
Excellent Service
waste and drainage services achieve excellence in customer service. we are innovative in finding ways to deliver services that are both efficient and effective. we provide access to our leading edge facilities. we stay current with emerging technologies and best practices to provide valued service to customers, partners and other stakeholders.
Engaged and inspired Employees
waste and drainage services is proud of the expertise of its team. our work environment is innovative, positive, team-oriented and safe. we perform our jobs with integrity and transparency.
Collaboration
waste and drainage services recognize the increasing cross-jurisdictional and cross-functional nature of environmental, asset management, and financial challenges and the need for collaborative processes to find solutions. we work collaboratively within the Branches and with others in the department, the city, our regional partners, epcoR, other orders of government, other municipalities and related organizations to achieve common goals, efficient use of resources, and innovative solutions to challenges.
The following values for Waste and Drainage Services reflect City of Edmonton goals and priorities, our professional values and the nature of our work:

Page 4 / 2016 AnnuAl RepoRt / wAste And dRAinAge seRvices structure
The city of edmonton manages two utilities: waste services and drainage services. The city-owned utilities provide vital services that play an integral role in the day-to-day lives of residents.
Waste Services is a leader in sustainable waste solutions with innovative systems that divert waste from landfill and treat waste as a resource. The city’s integrated waste management system closely aligns with three of city council’s ten-year strategic goals: preserve and sustain edmonton’s environment; improve edmonton’s livability; and ensure edmonton’s financial sustainability.
drainage Services provides sanitary and stormwater drainage services to edmonton residents by planning, building, operating, and maintaining pipes, tunnels, pump stations, and stormwater management facilities that make up the city’s drainage network. it is drainage services’ mission to protect the environment and public health for residents. The drainage planning, design and construction, and project delivery services support other departments within the city. drainage services closely aligns with five of city council’s ten-year strategic goals: preserve and sustain edmonton’s environment; improve edmonton’s livability; diversify edmonton’s economy; ensure edmonton’s financial sustainability; and transform edmonton’s urban form.
organizational structure

2016 AnnuAl RepoRt / wAste And dRAinAge seRvices /Page 5
integrated infrastructure
services
sustainable development
city operations
utility functions within the city of edmonton
city planning branch
waste & drainage services
network integration
utility engineering
drainage operations
waste collection services
community Relations
utilities infrastructure
branch
drainage design
drainage construction
project delivery
sustainable waste processing
Business integration
“ We’d just like to compliment the waste/recycling team that does pick ups in the northeast end of Edmonton. We’ve left out some very large amounts of recycling and some cumbersome (not too heavy) garbage bags, and without fail, it is always picked up promptly and efficiently. Great job! ”
The utilities also help promote city council’s overall vision and long-term strategic objectives through the following organizational structure:

Page 6 / 2016 AnnuAl RepoRt / wAste And dRAinAge seRvices direction

2016 AnnuAl RepoRt / wAste And dRAinAge seRvices /Page 7
The following is the summary of the waste services’ performance measures:
Branch Strategic direction
Performance measures
Actuals targetsCorporate Goals
2014 2015 2016 2016 2017
goal: a healthy community well servedwaste services responds to council’s vision and our community’s changing needs through active engagement and collaboration. we provide a high level of customer satisfaction by delivering timely, seamless and uninterrupted service.
number of users of eco stations and Big Bin events 249,590 287,989 298,496 297,000 305,000
improve Edmonton’s Livability
Preserve & Sustain Edmonton’s Environment
diversify Edmonton’s Economy
number of missed collection stops per 10,000 3 2 2 4 4
percentage of customers satisfied with waste collection services
89% 89% 90% 95% 95%
percentage of households recycling (blue bag program) 92% 93% 91% 95% 95%
goal: environmental stewardshipwaste services is committed to preserving and protecting our environment and biodiversity through continuous improvement, regulatory compliance, and pollution prevention.
compliance with environmental permits and regulations
100% 100% 100% 100% 100%improve Edmonton’s Livability
Preserve & Sustain Edmonton’s Environment
percentage diversion of residential waste from landfill 51% 52% 52%1 65% 75%
tonnes of non-residential waste diverted from landfill 69,000 65,000 55,0002 80,000 80,000
goal: organizational effectivenesswaste services fosters a culture of innovation and a strong sense of purpose through a commitment to people and optimizing systems and resources.
cost per tonne for curbside collection of refuse and recyclables
$140 $143 $142 $151 $153Ensure Edmonton’s financial Sustainability
Preserve & Sustain Edmonton’s Environment
cost per tonne of material processed at the edmonton waste Management centre
$93 $99 $95 $104 $107
goal: fiscal sustainabilitywaste services strives for rates that are fair, equitable and value-driven.
Annual net income $0.24 M $2.75 M $10.50 M $0.95 M $5.04 M Ensure Edmonton’s financial Sustainability
diversify Edmonton’s Economy
percentage Rate increase 5.6% 9.0% 5.7% 5.7% 4.4%
debt to net Asset Ratio 82% 83% 81% 82% 79%
cash position $3.76 M $14.89 M $21.71 M $0.76 M $16.7 M
goal: organizational excellencewaste services fosters a culture of innovation and a strong sense of purpose, through a commitment to people, and by optimizing systems and resources.
employee engagement survey score 71% n/a 68% 65% n/a Ensure Edmonton’s
financial Sustainability
Preserve & Sustain Edmonton’s Environment
percentage turnover per 100 Ftes (excluding retirement) 7% 6% 5.5% 6.0% 6.0%
lost time injury Frequency Rate 2.97 4.88 4.36 4.5 4.0
strategic direction
¹ Residential waste diversion from landfill was lower than the target in 2016 due to the delay in full operation of the waste to Biofuels and chemicals Facility. As part of the diversion rate, compost is produced and stored in stockpile until it can be sold. Historically more compost is stockpiled than sold, creating an accumulated inventory. continuous and focused work is being done to reverse this and eliminate the inventory as well as selling all compost produced. in 2016, 18,400 tonnes were sold and 34,100 tonnes went to stockpile.
² non-residential waste tonnage diverted from landfill was lower than the target in 2016 due to reduced incoming construction and demolition waste impacted by the slower economic climate.
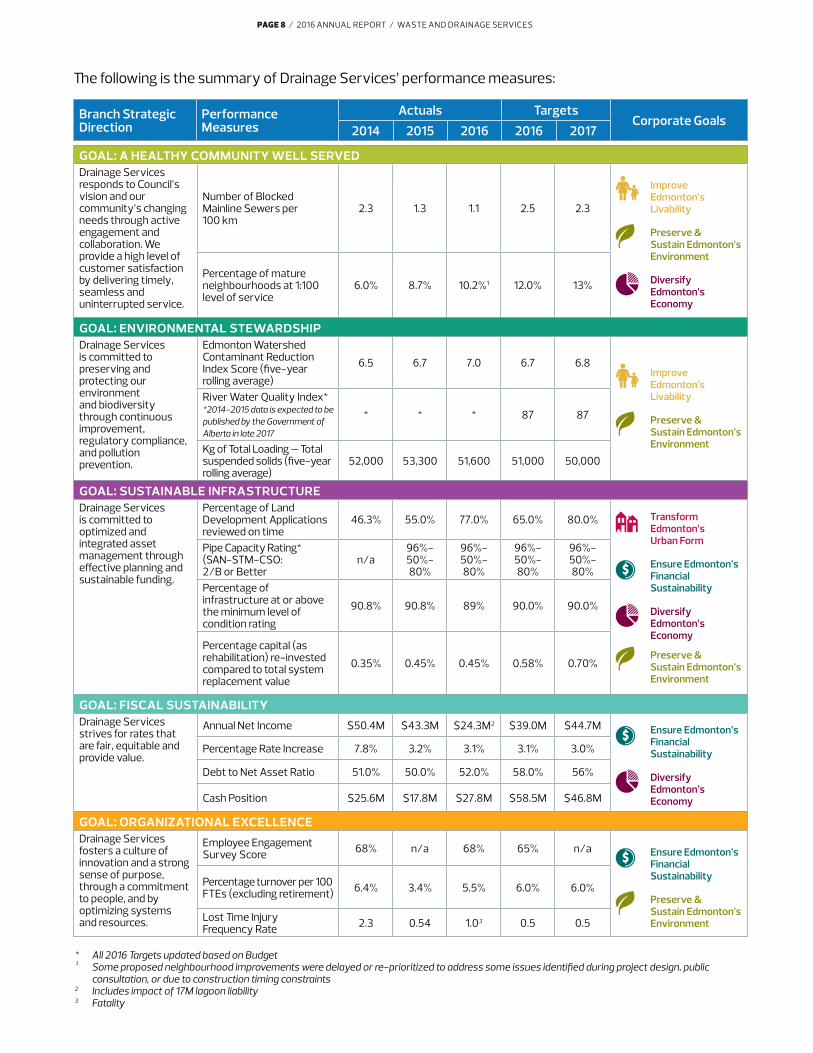
Page 8 / 2016 AnnuAl RepoRt / wAste And dRAinAge seRvices
goal: a healthy community well serveddrainage services responds to council’s vision and our community’s changing needs through active engagement and collaboration. we provide a high level of customer satisfaction by delivering timely, seamless and uninterrupted service.
number of Blocked Mainline sewers per 100 km
2.3 1.3 1.1 2.5 2.3
improve Edmonton’s Livability
Preserve & Sustain Edmonton’s Environment
diversify Edmonton’s Economy
percentage of mature neighbourhoods at 1:100 level of service
6.0% 8.7% 10.2%1 12.0% 13%
goal: environmental stewardshipdrainage services is committed to preserving and protecting our environment and biodiversity through continuous improvement, regulatory compliance, and pollution prevention.
edmonton watershed contaminant Reduction index score (five-year rolling average)
6.5 6.7 7.0 6.7 6.8 improve
Edmonton’s Livability
Preserve & Sustain Edmonton’s Environment
River water Quality index* *2014-2015 data is expected to be published by the Government of Alberta in late 2017
* * * 87 87
Kg of total loading – total suspended solids (five-year rolling average)
52,000 53,300 51,600 51,000 50,000
goal: sustainable infrastructuredrainage services is committed to optimized and integrated asset management through effective planning and sustainable funding.
percentage of land development Applications reviewed on time
46.3% 55.0% 77.0% 65.0% 80.0% transform Edmonton’s Urban form
Ensure Edmonton’s financial Sustainability
diversify Edmonton’s Economy
Preserve & Sustain Edmonton’s Environment
pipe capacity Rating* (sAn-stM-cso: 2/B or Better
n/a96%-50%-80%
96%-50%-80%
96%-50%- 80%
96%- 50%- 80%
percentage of infrastructure at or above the minimum level of condition rating
90.8% 90.8% 89% 90.0% 90.0%
percentage capital (as rehabilitation) re-invested compared to total system replacement value
0.35% 0.45% 0.45% 0.58% 0.70%
goal: fiscal sustainabilitydrainage services strives for rates that are fair, equitable and provide value.
Annual net income $50.4M $43.3M $24.3M2 $39.0M $44.7M Ensure Edmonton’s financial Sustainability
diversify Edmonton’s Economy
percentage Rate increase 7.8% 3.2% 3.1% 3.1% 3.0%
debt to net Asset Ratio 51.0% 50.0% 52.0% 58.0% 56%
cash position $25.6M $17.8M $27.8M $58.5M $46.8M
goal: organizational excellencedrainage services fosters a culture of innovation and a strong sense of purpose, through a commitment to people, and by optimizing systems and resources.
employee engagement survey score 68% n/a 68% 65% n/a Ensure Edmonton’s
financial Sustainability
Preserve & Sustain Edmonton’s Environment
percentage turnover per 100 Ftes (excluding retirement) 6.4% 3.4% 5.5% 6.0% 6.0%
lost time injury Frequency Rate 2.3 0.54 1.03 0.5 0.5
The following is the summary of drainage services’ performance measures:
* All 2016 Targets updated based on Budget ¹ Some proposed neighbourhood improvements were delayed or re-prioritized to address some issues identified during project design, public consultation, or due to construction timing constraints 2 Includes impact of 17M lagoon liability 3 Fatality
Branch Strategic direction
Performance measures
Actuals targetsCorporate Goals
2014 2015 2016 2016 2017

2016 AnnuAl RepoRt / wAste And dRAinAge seRvices /Page 9
“ We are pleased to report that we had excellent service from the drainage operations staff. drainage technicians arrived within a few hours of our call to the City. All the men worked carefully in a confined space and, considering the dirty job, made very little mess. ”

Page 10 / 2016 AnnuAl RepoRt / wAste And dRAinAge seRvices
preserve & sustain edmonton’s environment 1. anaerobic digestion facility Project
2016 marks the beginning of construction on the Anaerobic digestion Facility. This facility will take up to 48,000 tonnes of organic waste per year and anaerobically digest the waste, generating biogas, which will be converted into renewable electricity and heat to be utilized at the edmonton waste Management centre. The project is on schedule for completion and commissioning by the end of the first quarter, 2018.
the following achievements
contribute to city council’s goals
highlights 2016 highlights

2016 AnnuAl RepoRt / wAste And dRAinAge seRvices /Page 11
2. edmonton eco stations win award
The eco stations program received the gold excellence Award in the category of special waste from the solid waste Association of north America (swAnA). This is the first time the city of edmonton has won this award. eco stations provide convenient drop-off facilities for household hazardous waste (such as paint, batteries and electronics) and for large items that are not appropriate for curbside collection. There are four eco stations strategically located in each quarter of the city. since the inception of the program in 1995, more than 2.7 million customers have been served and 16 million litres of household hazardous waste have been diverted from landfill. swAnA’s excellence Awards program recognizes outstanding solid waste programs and facilities that advance the practice of environmentally and economically sound solid waste management.
3. management and Beneficial use of Biosolids
partnerships with the Alberta capital Region wastewater commission and epcoR continue to demonstrate waste and drainage services’ ability to effectively manage biosolids disposal in edmonton. in 2016, approximately 35,000 dry tonnes of biosolids were beneficially used. drainage services partners with waste services to utilize biosolids in the production of compost, and transferred about 11,500 dry tonnes to the edmonton composting Facility in 2016. This partnership also manages the nutrigold program, which beneficially applied 12,000 dry tonnes, exceeding the target of 10,100 dry tonnes.
in 2016, drainage services first full-scale mine reclamation site trial using biosolids commenced, hauling 2,300 dry tonnes out to the mine site with application planned for late spring 2017. These initiatives, along with some additional third party agricultural application, culminated in a grand total of 35,000 dry tonnes of biosolids beneficially used, and a reduction in total inventory levels by almost 10,000 dry tonnes.
4. waste to Biofuels and chemicals
in 2016, enerkem started commercial operation of the waste to Biofuels and chemicals Facility. This facility is the first of its kind and is now in ramp up mode. A methanol product was successfully certified and sold to the market, and construction is well underway for the production of ethanol. Feedstock for conversion into biofuels is prepared from residuals from the city of edmonton’s composting, recycling and processing facilities – waste that would otherwise be landfilled.
The Refuse derived Fuel dryer project will dry the feedstock to optimize for enerkem’s process. The dryer is expected to be operational by the 3rd quarter of 2017.
5. grasscycling
since 2013, waste services has used a social marketing approach to change the way edmontonians deal with grass clippings, which make up almost half of all waste collected in the summer. The approach uses research to identify specific barriers to leaving clippings on the lawn and employs various behavior change tools such as gaining commitments, norm appeals and prompts. The “go Bagless” grasscycling program was further improved in 2016 and bolstered participation in grasscycling from 58 percent to 63 percent.
6. reuse centre
since its opening in 2007, the Reuse centre has continued to grow in popularity. in 2016, an average of 24 tonnes of material per month was diverted from the landfill, while allowing organizations and individuals to find affordable items that can be repurposed or reused.
in 2016, The Reuse centre was awarded the emerald Award in the government institution category. The emerald Awards recognize outstanding environmental achievements in Alberta.
The Reuse centre received 308 tonnes of items from onsite, eco stations, and goodwill donations, with a total of 32,167 customer visits. close to 400 volunteers provided 3,994 hours of volunteer support.
7. community waste reduction
The Master composter Recycler program is a successful learn-and-serve style program that offers classroom training to volunteers who in turn reach out to their own communities. in 2016, the program had 33 new graduates, with a total of 838 volunteers trained to date. in total, 181 Master composter Recyclers volunteered 2,560 hours. As community leaders in waste reduction, they reached 36,647 people through personal conversations and social media, assisting at events, teaching others to compost, and delivering presentations.
8. city manager’s award
in a collaborative effort with community Relations’ social Marketing group, the gis/Mapping group provided a mapping interface to collect waste setout information. This information was used to directly contact and influence residents who had large quantities of waste set out, helping them develop a waste reduction strategy and reduce their total household volume of waste. with an 80 per cent commitment rate from residents, the program made an impact one household at a time and won the city Manager’s Award of excellence in the innovation category.

Page 12 / 2016 AnnuAl RepoRt / wAste And dRAinAge seRvices
9. rain garden in a Box
in 2016 drainage services’ low impact development group developed a ‘how-to’ homeowner manual, illustrating the steps to build a residential rain garden. The group held a series of popular workshops on rain garden design, installation, maintenance, and started a mentorship program to provide help to homeowners. low impact development aims to develop an approach to land development (or re-development) that works with nature to manage stormwater as close to its source as possible.
10. municipal cooperation
waste services separates organic materials from edmonton’s waste stream, and uses the material to create compost. in 2016, waste services partnered with leduc county to utilize this material as a biocover for their landfill. This partnership has benefitted both jurisdictions. leduc county is able to utilize the material to cover and revegetate their landfill. The city of edmonton expects to save approximately $1 million on transportation costs as well as divert organic waste material from landfill. Throughout this project, leduc county will utilize 50,000 cubic metres (approximately 30,000 tonnes) of compost material.
11. continued partnership with the university of alberta
The Regulatory services group supports and assists the university of Alberta with a number of multi-year projects that focus on reducing impact to the environment and finding better disposal of waste.
in 2016, Regulatory services started a project that looks at the development and optimization of engineered reactors that can carry out complex energy recovery and safe nutrient recovery from blackwater. The evaluation of blackwater treatment processes will provide pertinent information on how to move forward with this alternative waste disposal method in the canadian climate context, allowing the city to remain on the forefront of waste disposal methods.
in 2016, Regulatory services moved into the second year of studies with the university of Alberta that focuses on chloramine dissipation in storm sewers. The goal of the study is to develop a model that will determine chloramine dissipation in the storm sewers under different conditions and identify its effects on aquatic life. chloramine, which is used to treat the city’s drinking water, is considered toxic to aquatic life when it reaches the river via the storm system.

2016 AnnuAl RepoRt / wAste And dRAinAge seRvices /Page 13
improve edmonton’s livability 1. flood mitigation
As part of the expanded neighbourhoods Flood Mitigation program, the Kameyosek sanitary improvements project aims to provide flood risk reduction to the northeast Kameyosek neighbourhood for severe storm events, which statistically occur once per century, also known as 1:100 year storm events. This is in response to basement floodings that occurred in Mill woods during 2012.
The construction of ekota dry pond and Menisa storm Relief projects were completed in 2016.
The design of tawa dry pond & storm conveyance improvements was also completed. These projects will reduce the risk of flooding for ekota, Menisa, Hillview, tawa, and weinlos neighbourhoods.
Additionally, engineering assessments geared towards supporting a proactive long-term strategy to provide flood mitigation to at-risk neighbourhoods in edmonton were completed. over 160 mature residential neighbourhoods and 33 industrial parks were examined. The preliminary results from the study, which were made available to residents, reveal neighbourhoods in the city most at risk from flooding.
2. regulatory compliance
Both waste and drainage services are committed to the highest standard in regulatory compliance.
in 2016 waste and drainage services once again achieved 100 per cent compliance with environmental permits and regulations.
drainage services saw 2,258 industrial wastewater surcharge and compliance inspections performed, and over 1,000 water samples collected and tested to meet regulatory reporting requirements, as well as to support drainage environmental planning and watershed planning initiatives.
the following achievements
contribute to city council’s goal
Page 14 / 2016 AnnuAl RepoRt / wAste And dRAinAge seRvices
transform edmonton’s urban form1. Proactive management of trunk sewers
This initiative began as a requirement to collect better quality data for project-specific work and developed into a plan to globally utilize these technologies to produce ongoing quality data for proactive planning and management of the entire sanitary trunk system.
in 2016, a major step in the proactive management of the trunk sewers was taken, using tools such as cctv, lidAR and Multisensor technologies to conduct inspections of the sanitary trunk sewer system. By the end of 2016, ten kilometres of sanitary sewer trunkline was inspected using these technologies, which acted as a jumping-off point for a plan to continue this method in other trunk sewers in the city.
in 2017, contractors will be assigned geographic areas to begin inspecting the sanitary trunk system and delivering the data. compared to the highly reactive nature of trunk inspections in the past, the data collected in these proactive inspections will significantly help minimize risk of unexpected failure by determining repair and renewal needs in advance.
2. wastewise app
wastewise, a free waste sorting app, was launched in october 2016, accompanied by an advertising campaign. By the end of 2016, the app had been downloaded approximately 5,400 times, had received 52,328 item searches, and produced very positive feedback from residents and the media.
The app helps residents learn if specific waste items should be placed in the garbage, recycled or taken to an eco station by searching an up-to-date database. it also allows residents to find their collection schedule and sign up for reminders and important seasonal alerts related to waste.
3. Building efficiencies through innovation
continual work towards increasing operational efficiencies is a top priority for waste and drainage services.
technological innovations such as using telemetry to move from manual to automated data collection, and process improvements including the use of google tools over the past two years, enabled an eight percent increase in capacity from 223 to 240 monitoring sites in 2016, using the same operational resources. Automated data collection and improved processes allowed for more frequent data quality control to ensure sewer flow and level data of better quality with less downtime, and decreased safety risk as workers spend less time at manholes manually collecting data. This rainfall, sewer flow and level, sewer H2s and air pressure data, are used by an increasing number of stakeholder groups to better plan, develop, construct, operate, regulate, analyze and improve edmonton’s sewer and drainage systems.
the following achievements
contribute to city council’s goal

2016 AnnuAl RepoRt / wAste And dRAinAge seRvices /Page 15
statement of Financial position
statement of operations and Accumulated surplus
statement of change in net debt
statement of cash Flows
schedule 1: schedule of tangible capital Assets
schedule 2: tangible capital expenditures statement (supplemental information)
schedule 3: Financial indicators (supplemental information)
financial summ
ary
The 2016 waste and drainage services Annual
Report reflects the financial performance and
significant accounting policies for the waste utility
with the following unaudited financial statements,
schedules, and notes to the financial statements
along with supplemental information:
waste utility
These Financial statements are intended to report on the financial condition as of december 31, 2016 to ensure accountability, demonstrate transparency and assist with both long-term financial and strategic planning. The requirements for municipal financial reporting are standardized across canada based on the public sector Accounting Handbook, which establishes accounting standards for the public sector and provides guidance for financial and other performance information. These financial statements have been prepared in accordance with public sector Accounting standards statements.
Page 16 / 2016 AnnuAl RepoRt / wAste And dRAinAge seRvices
These financial results demonstrate progress towards a sustainable financial position for the Waste Utility through continued efforts to achieve stable and consistent rate increases, meet cash targets and maintain ongoing positive cash balances.
For the third year in a row, the waste utility achieved an excess of revenue over expenses ($10,479). This contributed to increasing the cash position by $6,820 to $21,714. of the total cash position, $10,463 is restricted for specific (appropriated) purposes. The net debt position was improved by $4,534, moving the debt to net asset ratio from 83 per cent in 2015 to 81 per cent in 2016.
The following is intended to be read alongside the unaudited financial statements which are included, beginning with the statement of Financial position.
2016 financial highlights

2016 AnnuAl RepoRt / wAste And dRAinAge seRvices /Page 17
statement of financial position
The financial assets have grown by $9,290 from $33,547 in 2015 to $42,837. The primary cause of this increase is cash and cash equivalents, although it is worth noting $11,251 of this balance is for designated purposes. There is an increase in liabilities of $4,756 from $264,313 in 2015 to $269,069. This increase is mainly attributed to the revaluation of the post closure contingent liability which nets to $2,459. short term liabilities, accounts payable, plus accrued liabilities, increased by $2,170.
in January 201 6 , an external party operating at the edmonton waste Management centre declared bankruptcy with an outstanding liability owing to the city of edmonton . The city of edmonton as the landlord owns the building, machinery and equipment, which are included in the waste utility’s financial assets. The trustee in bankruptcy has released any claim to the external party’s remaining assets . in 2017, the city of edmonton intends to auction off the items owned by the city, and, with the consent of canada Revenue, the remaining assets of the external party.
The landfill closure and post closure contingent liability revaluation increased from the 2015 balance of $19,988 to $22,447, as a result of the requirement of additional areas of land to be capped and revegetated, as well as remediation work required on the north slope of the landfill. The anticipated closure date has not changed from previously reported; however, forecasted timelines are subject to change as work progresses on full closure of the landfill, which will facilitate post closure work.
The waste utility’s accumulated surplus of $67,780 is an increase of $10,627 from 2015. Accumulated surplus is composed of the unrestricted accumulated operating deficit, restricted surplus and equity in tangible capital assets. The major contributor to the 2016 increase is the excess of revenue over expense with a small increase for tangible capital assets transfers from other departments. Additional details on the accumulated surplus are available in note 7 to the Financial statements.
The Statement of Financial Position provides information on the Waste Utility’s ability to finance its activities and meet its obligations. The year ended with a net debt position (financial assets less liabilities) of $226,232. This is a decrease in net debt of $4,534 from 2015. Overall, the financial position of the Waste Utility has improved in 2016, as demonstrated by the decrease in net debt and increase in accumulated surplus.

Page 18 / 2016 AnnuAl RepoRt / wAste And dRAinAge seRvices
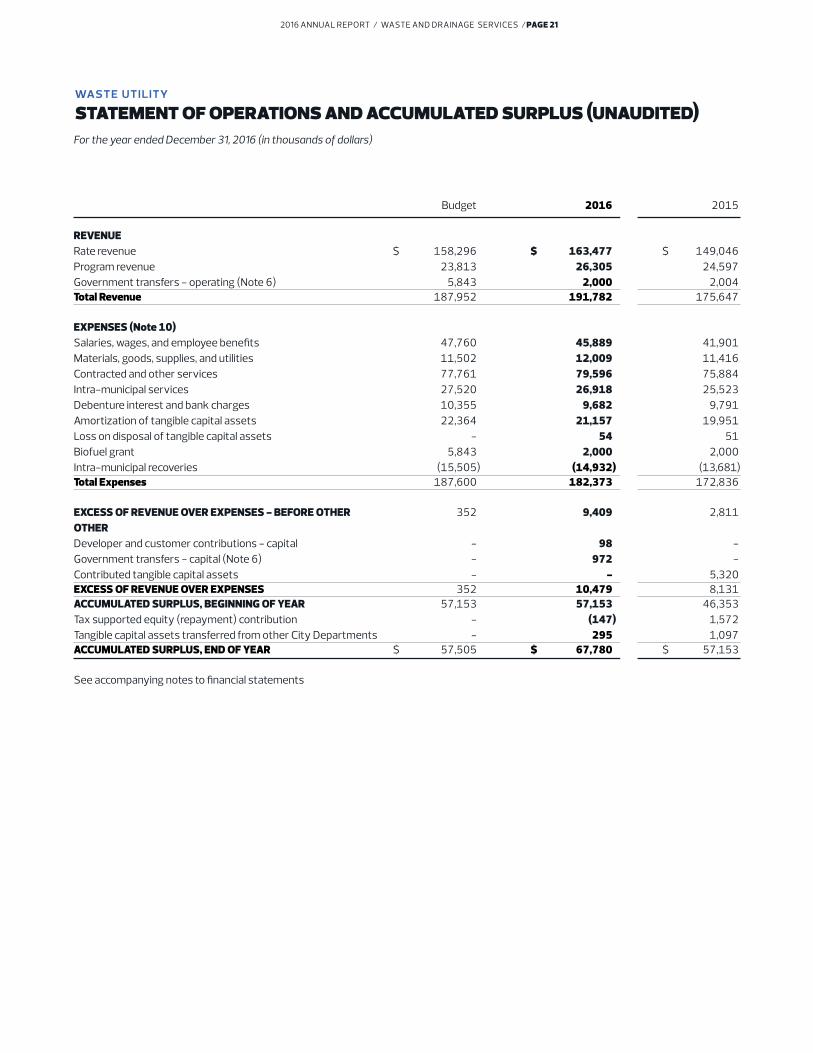
The statement of operations and Accumulated surplus reports on the annual operating revenues, expenses, and the resulting excess or deficit position. The Approved operating Budget for 2016 forecasted an excess of revenue over expenses before other of $352. The actual operating results were an excess of $9,409. This is $9,057 better than the Approved operating Budget and $6,598 better than 2015 results. other sources of revenue in addition to regulated operations include government transfers and partner funding of $1,070, resulting in an excess of revenue over expenses of $10,479.
non-regulated programs ended the year with a positive net position of $339, reversing a trend of net losses since 2012. to address temporary non-regulated program losses and achieve target cash balances, a tax supported short-term loan was approved by council in the 2015 operating Budget process. Annual draws were approved to occur for four years only, from 2015 to 2018. The principal and interest (1.5 per cent) are repaid annually starting after the first draw, which occured in 2015. The annual draws are set to be equal to any non-regulated net deficit plus negative cash balances. during the 2016 calendar year, $171 was paid for principal and interest, related to the prior year’s draw. As a result of the non-regulated net positive position for 2016, a draw on the short-term loan was not required.
The three major categories of revenues for the waste utility are rate revenue, program revenue, and government transfers - operating grants. Rate revenue is generated through fees for residential collection and waste disposal. These revenues account for 85.2 per cent of the waste utility’s revenues. program revenue comprises 13.7 per cent of revenues and include:
• non-residential waste collection • Fees for recycling and disposal services at the edmonton waste Management centre • Revenue from the sale of recyclable materials and eco stations user fees, as well as other partnership revenues and environmental credits
The revenue streams of these activities are highly susceptible to variability. Factors influencing revenue generation which are outside of the waste utility’s control include:
• waste customer collection volume • The extent of private haulers’ use of services at the edmonton waste Management centre; and • global commodity prices for recyclable materials.
Rate revenue was the largest portion of the increase in revenue, ending the year at $5,181 higher than forecast in the approved operating budget and with an increase of $14,431 over 2015. This was a result of the 2016 residential waste service rate increase, as well as growth in the total customer base of 2.8 per cent by december 31, and comprises most of the favourable variance over the approved budget.
program revenues were $2,492 higher than budget. The major contributors for this increase are:
• Retention of commercial collection customers • increased eco station usage; and • increased prices on the commodities market for the sale of marketable recyclables.
These revenue increases were offset by the loss of third party lease revenue, lower usage of the construction and demolition waste program, and decreased compost sales.
interest and government transfers account for the balance of total revenues. The government transfer of $2,000 from the Alberta innovates energy and environment solutions grant, on the revenue side, is offset by a corresponding operating grant payment to an external third party upon the achievement of project milestones.
overall, expenses were $5,227 under the 2016 Approved operating Budget. delays in completion of capital projects resulted in savings to personnel, materials, intra-municipal services, utilities, interest and amortization. This included a delay in the commissioning and start up of the Refuse derived Fuel dryer from 2016 to 2017. The unbudgeted landfill closure and post closure contingent liability revaluation increased operating expenditures by a net $2,459. other operating expenditures increased over the 2016 Approved operating Budget including contracted services and equipment costs resulting from a fire at the edmonton waste Management centre. This year, the edmonton waste Management centre had a fire onsite, which resulted in increased contract services and equipment costs of $1,918 to address this issue.
in summary, the major contributors to the current year costs exceeding prior years included filling positions approved in the 2015 operating budget, revaluation of post-closure contingent liability, and costs associated with the fire at the edmonton waste Management centre.
statement of operations and accumulated surplus
“ i have been thinking about where i have received really great service this year, and the ECo station on 99 Street comes to mind. i have told many people about the experience that i had there. ”

2016 AnnuAl RepoRt / wAste And dRAinAge seRvices /Page 19
The statement of change in net debt is a key indicator of the waste utility’s overall financial health. The net debt balance of $226,232 indicates liabilities are significantly greater than financial assets. A position of total long-term debt exceeding net book value of non-contributed assets is acceptable within the utility as demonstrated by the waste Management utility Fiscal policy c558, a financial indicator setting a target for debt to net assets ratio of 50 to 70 per cent. with focus on other financial indicators, such as stable, consistent rate increases and positive net income, the debt to net asset ratio has historically been above 70 per cent.
net debt for the waste utility decreased by $4,534 in 2016. This contributed to the debt to net asset ratio finishing 2016 at 81 per cent, which is an improvement over the 2015 position which was 83 per cent. lowering the debt to net asset ratio is recognized in the waste utility as a priority, as this is one of the financial indicators set out in the Fiscal policy. This will be addressed in the long-term financial plan. The debt to net asset ratio indicator is forecast to be within the target range of 50 to 70 per cent in 2026.
The statement of cash Flows provides the sources and use of cash for operating, capital or financing activities. The cash position has improved by $6,820 from the prior year. The major contributors to the change in the cash position are the net excess of revenue over expenses of $10,479 and the increase in accounts receivable of $2,470 in 2016.
The cash balance of $21,714 includes $10,463 that is restricted and can only be used for specific purposes.
statement of cash flowsstatement of change in net debt
conclusion
The Waste Utility continued to improve overall operating performance in 2016 as demonstrated with the excess revenues over expenditures of $10,479, a positive cash position of $21,714, and a $4,534 decrease in the net debt position from $230,766 to $226,232.
The Waste Utility will be updating its long term Strategic Plan in 2017. Once finalized and approved, the Strategic Plan will provide the roadmap for critical areas of focus, while balancing the requirement for achievement of financial sustainability.

Page 20 / 2016 AnnuAl RepoRt / wAste And dRAinAge seRvices
WAStE UtiLity
statement of financial position (unaudited)As at December 31, 2016 (in thousands of dollars)
2016 2015 financial assetscash and temporary investments $ 21,714 $ 14,894Accounts receivable 21,123 18,653 42,837 33,547liaBilitiesAccounts payable and accrued liabilities 17,993 16,194deferred revenue 63 55employee benefit obligations 2,959 2,596provision for landfill closure and post-closure costs (note 5) 22,447 19,988long-term debt (note 4) 225,607 225,480 269,069 264,313net deBt (226,232) (230,766)
non-financial assetstangible capital assets (note 3) 293,537 287,758prepaid expenses 280 17inventory of materials and supplies 195 144 294,012 287,919accumulated surPlus (note 7) $ 67,780 $ 57,153
see accompanying notes to financial statements
2016 AnnuAl RepoRt / wAste And dRAinAge seRvices /Page 21
waste utility
statement of operations and accumulated surplus (unaudited)For the year ended December 31, 2016 (in thousands of dollars)
Budget 2016 2015 reVenueRate revenue $ 158,296 $ 163,477 $ 149,046program revenue 23,813 26,305 24,597government transfers - operating (note 6) 5,843 2,000 2,004total revenue 187,952 191,782 175,647
eXPenses (note 10)salaries, wages, and employee benefits 47,760 45,889 41,901Materials, goods, supplies, and utilities 11,502 12,009 11,416contracted and other services 77,761 79,596 75,884intra-municipal services 27,520 26,918 25,523debenture interest and bank charges 10,355 9,682 9,791Amortization of tangible capital assets 22,364 21,157 19,951loss on disposal of tangible capital assets - 54 51Biofuel grant 5,843 2,000 2,000intra-municipal recoveries (15,505) (14,932) (13,681)total expenses 187,600 182,373 172,836
eXcess of reVenue oVer eXPenses - Before other 352 9,409 2,811otherdeveloper and customer contributions - capital - 98 -government transfers - capital (note 6) - 972 -contributed tangible capital assets - - 5,320eXcess of reVenue oVer eXPenses 352 10,479 8,131accumulated surPlus, Beginning of year 57,153 57,153 46,353tax supported equity (repayment) contribution - (147) 1,572tangible capital assets transferred from other city departments - 295 1,097accumulated surPlus, end of year $ 57,505 $ 67,780 $ 57,153
see accompanying notes to financial statements

Page 22 / 2016 AnnuAl RepoRt / wAste And dRAinAge seRvices
WAStE UtiLity
statement of change in net debt (unaudited)For the year ended December 31, 2016 (in thousands of dollars)
Budget 2016 2015 eXcess of reVenues oVer eXPenses $ 352 $ 10,479 $ 8,131Acquisition of tangible capital assets (40,270) (26,695) (22,510)contributed tangible capital assets - - (5,320)proceeds on disposal of tangible capital assets - - 108Amortization of tangible capital assets 22,364 21,157 19,951loss on disposal of tangible capital assets - 54 51 (17,906) (5,484) (7,720)net (increase) decrease in prepaid expenses - (263) 42net increase in inventory of materials and supplies - (51) (144)tax supported equity (repayment) contribution - (147) 1,572 - (461) 1,470(increase) decrease in net deBt (43,230) 4,534 1,881net deBt, Beginning of year (230,766) (230,766) (232,647)net deBt, end of year $ (273,996) $ (226,232) $ (230,766)

2016 AnnuAl RepoRt / wAste And dRAinAge seRvices /Page 23
WAStE UtiLity
statement of cash flows (unaudited)For the year ended December 31, 2016 (in thousands of dollars)
2016 2015 oPeratingexcess of revenues over expenses $ 10,479 $ 8,131non-cash items included in excess of revenues over expenses: Amortization of tangible capital assets 21,157 19,951 contributed tangible capital assets - (5,320) loss on disposal of tangible capital assets 54 51changes in non-cash items: Accounts receivable (2,470) 1,368 Accounts payable and accrued liabilities 1,799 730 deferred revenue 8 1 employee benefit obligations 363 247 landfill closure and post-closure care 2,459 3,024 prepaid expenses (263) 42 inventory of materials and supplies (51) (144)cash provided by operating activities 33,535 28,081
caPitalAcquisition of tangible capital assets (26,695) (22,510)proceeds on disposal of tangible capital assets - 108cash applied to capital activities (26,695) (22,402)
financingdebenture borrowings 18,566 20,682Repayment of long-term debt (18,439) (16,795)tax supported equity (repayment) contribution (147) 1,572cash provided by financing activities (20) 5,459
increase in cash and temPorary inVestments during the year 6,820 11,138
cash and temPorary inVestments, Beginning of year 14,894 3,756
cash and temPorary inVestments, end of year $ 21,714 $ 14,894
cash and temporary investments is comprised of:cash 26 446due from the city of edmonton 21,688 14,448 $ 21,714 $ 14,894
Page 24 / 2016 AnnuAl RepoRt / wAste And dRAinAge seRvices
WAStE UtiLity
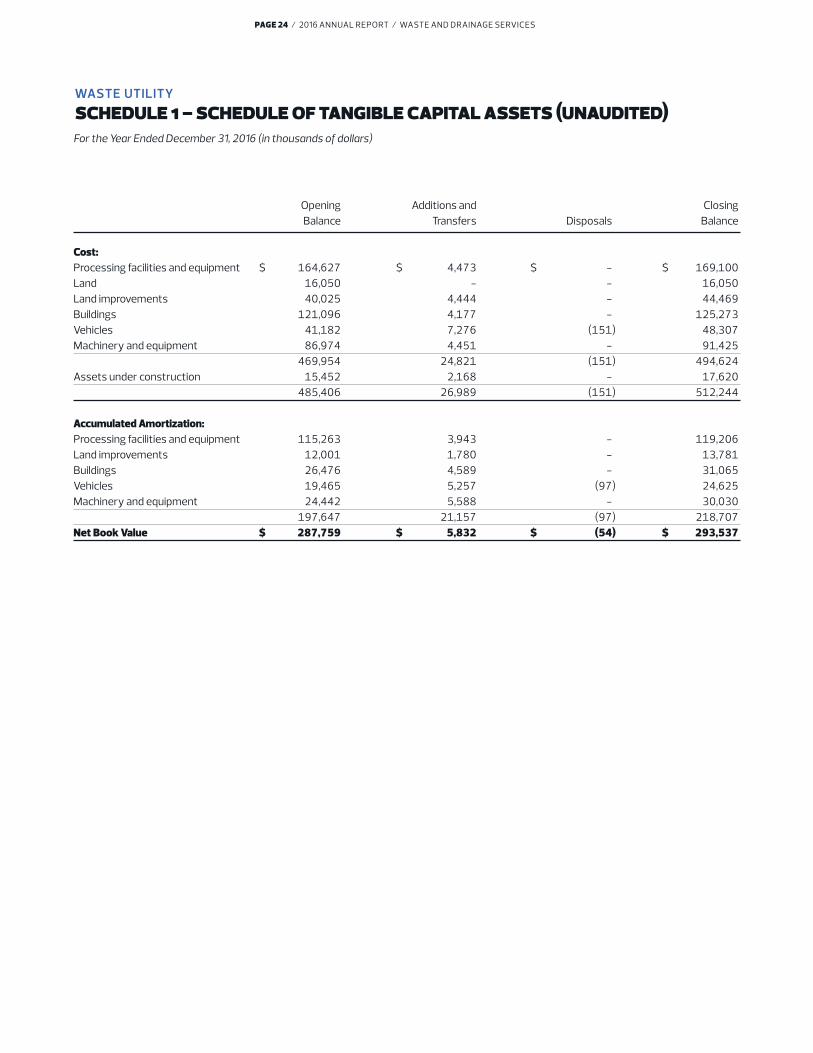
schedule 1 - schedule of tangible capital assets (unaudited)For the Year Ended December 31, 2016 (in thousands of dollars)
opening Additions and closing Balance transfers disposals Balance
cost:processing facilities and equipment $ 164,627 $ 4,473 $ - $ 169,100land 16,050 - - 16,050land improvements 40,025 4,444 - 44,469Buildings 121,096 4,177 - 125,273vehicles 41,182 7,276 (151) 48,307Machinery and equipment 86,974 4,451 - 91,425 469,954 24,821 (151) 494,624Assets under construction 15,452 2,168 - 17,620 485,406 26,989 (151) 512,244
accumulated amortization:processing facilities and equipment 115,263 3,943 - 119,206land improvements 12,001 1,780 - 13,781Buildings 26,476 4,589 - 31,065vehicles 19,465 5,257 (97) 24,625Machinery and equipment 24,442 5,588 - 30,030 197,647 21,157 (97) 218,707net Book Value $ 287,759 $ 5,832 $ (54) $ 293,537
2016 AnnuAl RepoRt / wAste And dRAinAge seRvices /Page 25
WAStE UtiLity
notes to financial statements (unaudited)For the year ended December 31, 2016 (in thousands of dollars)
general
significant accounting Policies
1.
2.
The waste utility, operated by the city of edmonton, provides services for the collection, disposal and recycling of residential solid waste services for the city. on september 23, 2014, the amended waste Management utility Fiscal policy c558A was adopted by city council. The policy includes governance for the utility over such items as:
The financial statements of the waste utility are prepared by management in accordance with canadian public sector Accounting standards (psAs). significant aspects of the accounting policies adopted by the city are as follows:
a) Basis of accounting The financial statements are prepared using the accrual basis of accounting. Revenues are accounted for in the period in which they are earned and measurable. Funds from external parties and earnings thereon restricted by agreement or legislation are accounted for as deferred revenue until used for the purpose specified. expenses are recognized as they are incurred and measurable based upon receipt of goods or services and/or the legal obligation to pay.
b) due from the City of Edmonton Amounts due from the city of edmonton represent cash and
temporary investments managed by the city of edmonton. interest earned is recorded by the waste utility.
c) inventories inventory of materials and supplies is valued at the lower of average cost and replacement cost.
d) Use of estimates The preparation of financial statements in conformity with the psAs requires management to make estimates and assumptions that affect the reported amounts of assets and liabilities and disclosure of contingent assets and liabilities at the date of the financial statements and the reported amounts of revenues and expenses during the period. Actual results could differ from those estimates.
Administration has used estimates to determine useful lives of tangible capital assets, landfill closure and post-closure care obligations and employee benefit obligations.
e) non-financial assets non-financial assets are not available to discharge liabilities and are held for use in the provision of services. They have useful lives extending beyond the current year and are not intended for sale in the normal course of operations. non-financial assets are comprised of tangible capital assets, inventory of materials and supplies, and prepaid expenses.
f) tangible capital assets tangible capital assets are recorded at cost, which includes all amounts that are directly attributable to acquisition, construction, development or betterment of the asset. interest charges during the construction period are not capitalized.
The cost of routine maintenance and repairs and the replacement of minor parts are charged to expense as incurred. certain expenditures relating to replacement of components incurred during major maintenance are capitalized and amortized over the estimated benefit period of such expenditures.
Assets under construction are not amortized until available for productive use. once construction is complete and the asset is placed into service, assets are transferred to the appropriate asset category. The project lifecycle from preliminary design to construction completion may exceed one year.
a) operating in a manner that balances the best possible service at the lowest cost, while employing private sector approaches to rate setting,
b) Accounting for the cost of service under a full cost accounting approach, and,
c) contributing towards achieving the city’s strategic plan.

Page 26 / 2016 AnnuAl RepoRt / wAste And dRAinAge seRvices
WAStE UtiLity
notes to financial statements (unaudited)For the year ended December 31, 2016 (in thousands of dollars)
tangiBle caPital assets3.
g) Amortization The cost, less residual value of the tangible capital assets, is amortized on a straightline basis over the following estimated useful lives of the assets:
asset category useful life amortization rate
processing Facilities & equipment 10 to 40 years 2.50% to 10.00%
land improvements 15 to 25 years 4.00% to 6.67%Buildings 15 to 75 years 1.33% to 6.67%Machinery and equipment 6 to 25 years 4.00% to 16.67%vehicles 5 to 12 years 8.33% to 20.00%
one half of the annual amortization is charged in the year of acquisition and in the year of disposal.
tangible capital assets include non-contributed and contributed assets and consist of the following:
2016 2015 Accumulated net Book net Booktangible capital Asset cost Amortization Value Value
processing Facilities and equipment $ 169,100 $ 119,206 $ 49,894 $ 49,364land 16,050 - 16,050 16,050land improvements 44,469 13,781 30,688 28,025Buildings 125,273 31,065 94,208 94,618vehicles 48,307 24,625 23,682 21,717Machinery and equipment 91,425 30,030 61,395 62,532 494,624 218,707 275,917 272,306capital Assets under construction 17,620 - 17,620 15,452total $ 512,244 $ 218,707 $ 293,537 $ 287,758
tangible capital Assets - non-contributed 495,270 215,364 279,906 273,265tangible capital Assets - contributed $ 16,974 $ 3,343 $ 13,631 $ 14,493 $ 512,244 $ 218,707 $ 293,537 $ 287,758 For additional information, see the schedule of tangible capital Assets (schedule 1).
h) Contributions of tangible capital assets tangible capital assets acquired as contributions are recorded
at their fair value on the date received. equivalent amounts are recorded as contributed tangible capital assets on the statement of operations and Accumulated surplus.
i) Landfill closure and post-closure care pursuant to the Alberta environmental protection and enhancement Act, the city is required to fund the closure of its landfill site and provide for post-closure care of the facility. closure and post-closure activities include the final clay cover, landscaping, surface and groundwater monitoring, leachate control, and visual inspection. The requirement is being provided for over the estimated remaining life of the landfill site based usage.
j) deferred revenue Funds received from external parties that are restricted for use in the conduct of certain programs, or in the completion of specific work, are deferred until used for the purpose specified.

2016 AnnuAl RepoRt / wAste And dRAinAge seRvices /Page 27
long-term deBt
landfill closure and Post-closure liaBility
4.
5.
The waste utility utilizes debt to finance capital expenditures under principles and limits established within the waste Management utility Fiscal policy. The policy is intended to support the waste utility’s long-term capital plans and strategies while maintaining long-term financial affordability, flexibility and sustainability. Borrowing has generally been in the form of amortizing debentures administered through the Alberta capital Finance Authority (AcFA), utilizing the strong debt rating of the government of Alberta and combined borrowing volumes across Alberta. interest rates are established at the time of borrowing and remain constant throughout the term of the debenture, thus eliminating the risk associated with fluctuating interest rates.
under provincial legislation, the city has a liability for closure and post-closure care costs for its landfill sites. The clover Bar landfill site reached full capacity and was closed August 2009. The period for post-closure care is 25 years. The costs to maintain a closed solid waste landfill site are based on estimated future expenses in current dollars by applying a discount rate at the city’s average long-term borrowing rate of 3.8 per cent (2015 – 4.0 per cent) and inflation rate of 3.0 per cent (2015 – 3.0 per cent). An amount of $ 22,447 (2015 - $19,988) has been accrued. The liability was increased by $4,588 (2015 - $4,361) to reflect revised post-closure care cost estimates, offset by $2,129 (2015- $1,337) which was expensed in the year to reflect cash outlays for post-closure care.
existing long term debt matures in 2041. debenture interest is payable at rates ranging from 1.8 per cent to 6.4 per cent. The average rate is 4.3 per cent for 2016 (2015 - 4.4 per cent) with terms of 10, 15, 20 and 25 years. payments are made annually or semi-annually.
The current portion of long-term debt amounts to $19,567 (2015 - $18,169).
principal and interest repayments are as follows:
landfill closure and post-closure care requirements have been defined in accordance with industry standards and include final covering and landscaping of the landfill, pumping of groundwater and leachates from the site, ongoing environmental monitoring, site inspection and maintenance. The reported liability is based on estimates and assumptions with respect to events using the best information available to management. Future events, such as changes to regulatory requirements, may result in significant changes to the estimated total expenses and will be recognized prospectively, as a change in estimate, when applicable.
WAStE UtiLity
notes to financial statements (unaudited)For the year ended December 31, 2016 (in thousands of dollars)
Principal interest total 2017 $ 19,567 $ 9,239 $ 28,8062018 19,002 8,448 27,4502019 16,333 7,701 24,0342020 14,792 7,051 21,8432021 14,471 6,429 20,900Thereafter 141,442 35,268 176,710total $ 225,607 $ 74,136 $ 299,743

Page 28 / 2016 AnnuAl RepoRt / wAste And dRAinAge seRvices
goVernment transfers
accumulated surPlus
6.
7.
2016 2015
operating transfers:Federal $ - $ 4provincial 2,000 2,000capital transfers:provincial 972 - $ 2,972 $ 2,004
The provincial government approved operating funding of $14,500 and $10,000 in 2007 and 2010 respectively, through the Alberta innovates - energy and environment solutions grant, for a solid waste gasification demonstration facility. The waste utility administers the grant on behalf of Alberta innovates. The grant is received for
The waste utility’s total accumulated surplus consists of its accumulated operating position (unrestricted), advances for construction and equity in tangible capital assets as summarized below. total accumulated surplus for the waste utility has also been disclosed as reflected in the audited city of edmonton consolidated Financial statements. differences are due to the elimination of intercompany transactions between the waste utility and other city departments as required for consolidation purposes in the city of edmonton consolidated Financial statements.
future disbursement to a third party upon the completion of identified project milestones. in 2016, $2,000 was recognized as revenue (2015 - $2,000) and $2,000 was paid out to a third party as the Biofuel grant.
The climate change and emissions Management corporation (cceMc) has provided $972 of capital funding in 2016 (2015 - $0) towards the implementation of High solids Anaerobic digestion technology at the edmonton waste Management centre, in partnership with the university of Alberta. This facility will generate renewable energy from biogas produced through organic processing of municipal solid wastes, thereby reducing greenhouse gas emissions and enhancing waste diversion. The cceMc has committed to provide a total of $10,000 grant funds by the completion of the project.
WAStE UtiLity
notes to financial statements (unaudited)For the year ended December 31, 2016 (in thousands of dollars)
Advances for construction represents debt proceeds received in advance of related capital expenses.
2016 2015 Accumulated operating deficit $ (1,914) $ (7,918)tax supported equity loan 1,425 1,572Advances for construction 339 1,220equity in tangible
capital assets 67,930 62,279total accumulated surplus $ 67,780 $ 57,153

2016 AnnuAl RepoRt / wAste And dRAinAge seRvices /Page 29
WAStE UtiLity
notes to financial statements (unaudited)For the year ended December 31, 2016 (in thousands of dollars)
eQuity in tangiBle caPital assets
eXPense By function
8.
9.
2016 2015 tangible capital assets (schedule 1) $ 512,244 $ 485,406Accumulated amortization (schedule 1) (218,707) (197,647)long-term debt (note 4) (225,607) (225,480) $ 67,930 $ 62,279
2016 2015 sustainable waste processing services $ 122,849 $ 106,267collection 59,524 66,569 $ 182,373 $ 172,836
comParatiVe information10.
certain comparative information has been reclassified to conform with the financial statement presentation adopted for the current year.

Page 30 / 2016 AnnuAl RepoRt / wAste And dRAinAge seRvices
WAStE UtiLity
supplemental information - schedule 2: tangible capital expenditures statement (unaudited)For the year ended December 31, 2016 (in thousand of dollars)
2016 2015-2018 Approved Budget Approved Budget nov 29, 2016 2016 nov 29, 2016 (note 1) actuals collection services facilitieseco station Facilities $ 6,829 $ 685 $ 216Kennedale Facility 150 48 44 6,978 733 260
sustainable waste Processing facilitiesAnaerobic digestion Facility 36,799 11,424 9,260integrated processing and transfer Facility expansion 3,477 250 16Refuse derived Fuel dryer 9,950 4,500 1,629cure site land use and development 9,000 250 24landfill capping and Revegetation 5,816 2,088 1,581Material Recovery Facility Renewal (MRF) 2,053 450 199Arterial Roadway Assessment (ARA) - - -equipment storage and Maintenance Facility 607 126 126 67,702 19,088 12,834
collection services and sustainable waste Processing infrastructureewMc infrastructure 29,407 7,670 5,474collection Facilities and infrastructure 3,325 195 32eco station Facilities Rehabilitation 757 - - 33,489 7,865 5,506
Vehicles and equipmentequipment and vehicles 28,323 11,284 7,324waste containers 9,972 1,300 1,016 38,295 12,584 8,340
total capital expenditures $ 146,464 $ 40,270 $ 26,939
capital expenditures by financingnon-contributed Financingself-liquidating debt $ 107,551 $ 30,777 $ 19,447Retained earnings 28,070 8,226 6,422subtotal non-contributed financing $ 135,621 $ 39,003 $ 25,869contributed Financing 10,843 1,267 1,070total capital expenditures $ 146,464 $ 40,270 $ 26,939
note 1: 2016 Approved Budget includes 2015 carryforwards
2016 AnnuAl RepoRt / wAste And dRAinAge seRvices /Page 31
WAStE UtiLity
supplemental information - schedule 3: financial indicators (unaudited)For the year ended December 31, 2016 (in thousand of dollars)
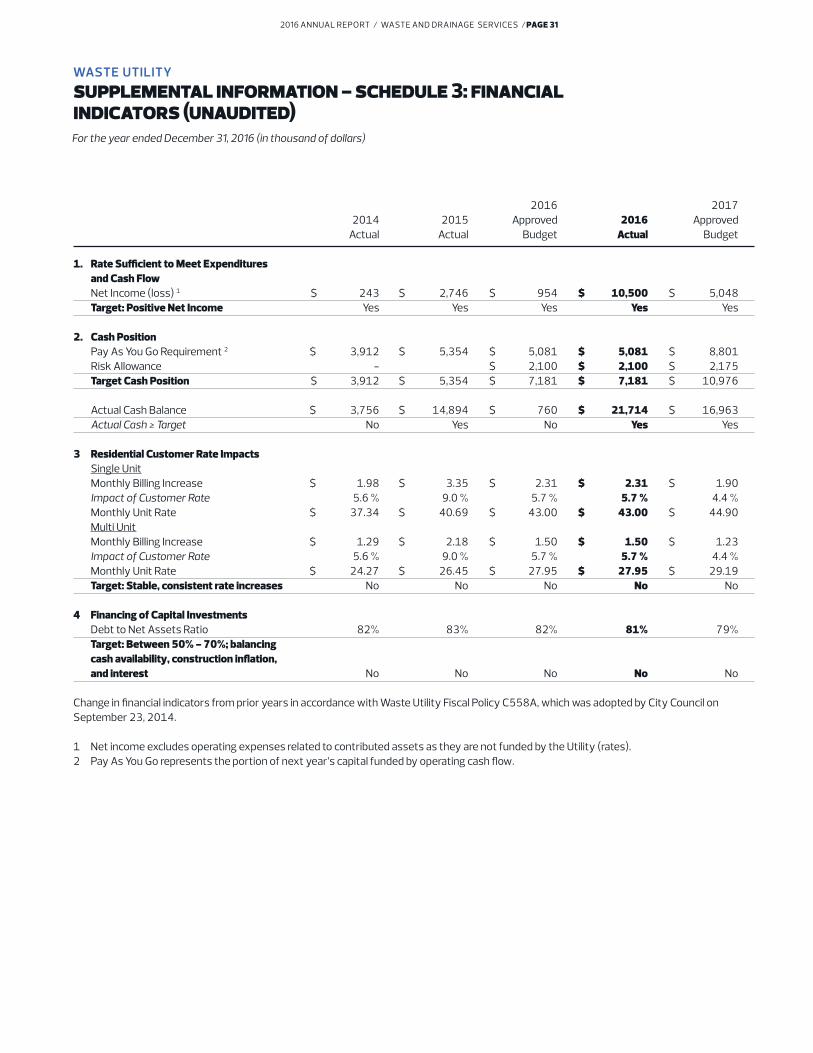
2016 2017 2014 2015 Approved 2016 Approved Actual Actual Budget actual Budget 1. rate sufficient to meet expenditures and cash flow net income (loss) 1 $ 243 $ 2,746 $ 954 $ 10,500 $ 5,048 target: Positive net income Yes Yes Yes yes Yes 2. cash Position pay As You go Requirement 2 $ 3,912 $ 5,354 $ 5,081 $ 5,081 $ 8,801 Risk Allowance - $ 2,100 $ 2,100 $ 2,175 target cash Position $ 3,912 $ 5,354 $ 7,181 $ 7,181 $ 10,976
Actual cash Balance $ 3,756 $ 14,894 $ 760 $ 21,714 $ 16,963 Actual Cash ≥ Target no Yes no yes Yes
3 residential customer rate impacts single unit Monthly Billing increase $ 1.98 $ 3.35 $ 2.31 $ 2.31 $ 1.90 Impact of Customer Rate 5.6 % 9.0 % 5.7 % 5.7 % 4.4 % Monthly unit Rate $ 37.34 $ 40.69 $ 43.00 $ 43.00 $ 44.90 Multi unit Monthly Billing increase $ 1.29 $ 2.18 $ 1.50 $ 1.50 $ 1.23 Impact of Customer Rate 5.6 % 9.0 % 5.7 % 5.7 % 4.4 % Monthly unit Rate $ 24.27 $ 26.45 $ 27.95 $ 27.95 $ 29.19 target: stable, consistent rate increases no no no no no
4 financing of capital investments debt to net Assets Ratio 82% 83% 82% 81% 79% target: Between 50% - 70%; balancing cash availability, construction inflation, and interest no no no no no
change in financial indicators from prior years in accordance with waste utility Fiscal policy c558A, which was adopted by city council on september 23, 2014.
1 net income excludes operating expenses related to contributed assets as they are not funded by the utility (rates). 2 pay As You go represents the portion of next year’s capital funded by operating cash flow.

Page 32 / 2016 AnnuAl RepoRt / wAste And dRAinAge seRvices

2016 AnnuAl RepoRt / wAste And dRAinAge seRvices /Page 33financial summ
arystatement of Financial position
statement of operations and Accumulated surplus
statement of change in net debt
statement of cash Flows
schedule 1: schedule of tangible capital Assets
schedule 2: tangible capital expenditure statement (supplemental information)
schedule 3: Financial indicators ( supplemental information)
The 2016 waste and drainage services Annual Report
reflects the financial performance and significant
accounting policies for drainage services with the
following unaudited financial statements, schedules
and notes to the financial statements along with
supplemental information:
drainage utility
These Financial statements are intended to report on the financial condition as of december 31, 2016 to demonstrate accountability, ensure transparency and assist with both long-term financial and strategic planning. The requirements for municipal financial reporting are standardized across canada based on the public sector Accounting Handbook, establishing accounting standards for the public sector and providing guidance for financial and other performance information. These financial statements have been prepared in accordance with public sector Accounting standards.

Page 34 / 2016 AnnuAl RepoRt / wAste And dRAinAge seRvices
The Drainage Utility is focused on providing rate stability while ensuring sufficient funds to meet ongoing obligations in consideration of the Utility’s mission, values and strategic initiatives. The Drainage Utility is in the second year of the four year 2015-2018 Approved Capital Budget and the first year of the three year 2016-2018 Approved Operating Budget.
The drainage utility had a total of $166.2 million in capital expenditure in 2016, which is the most spent in a given year. investment in the capital program is primarily in the areas of Flood Mitigation, neighbourhood Renewal and systems Rehabilitation. These investments reflect the growing need to address system demands to ensure current and future customer requirements are met.
The financial indicators for the drainage utility are stable rate increases while ensuring long-term financial sustainability. The financial challenges moving forward are to manage the substantial growth of the Flood Mitigation and environmental Quality enhancement programs, which will see a significant annual increase in capital work over the next ten years, while managing potential volatility with its rate setting.
The following is intended to be read alongside the unaudited financial statements, which are included, beginning with the statement of Financial position.
2016 financial highlights
2016 AnnuAl RepoRt / wAste And dRAinAge seRvices /Page 35
statement of financial position
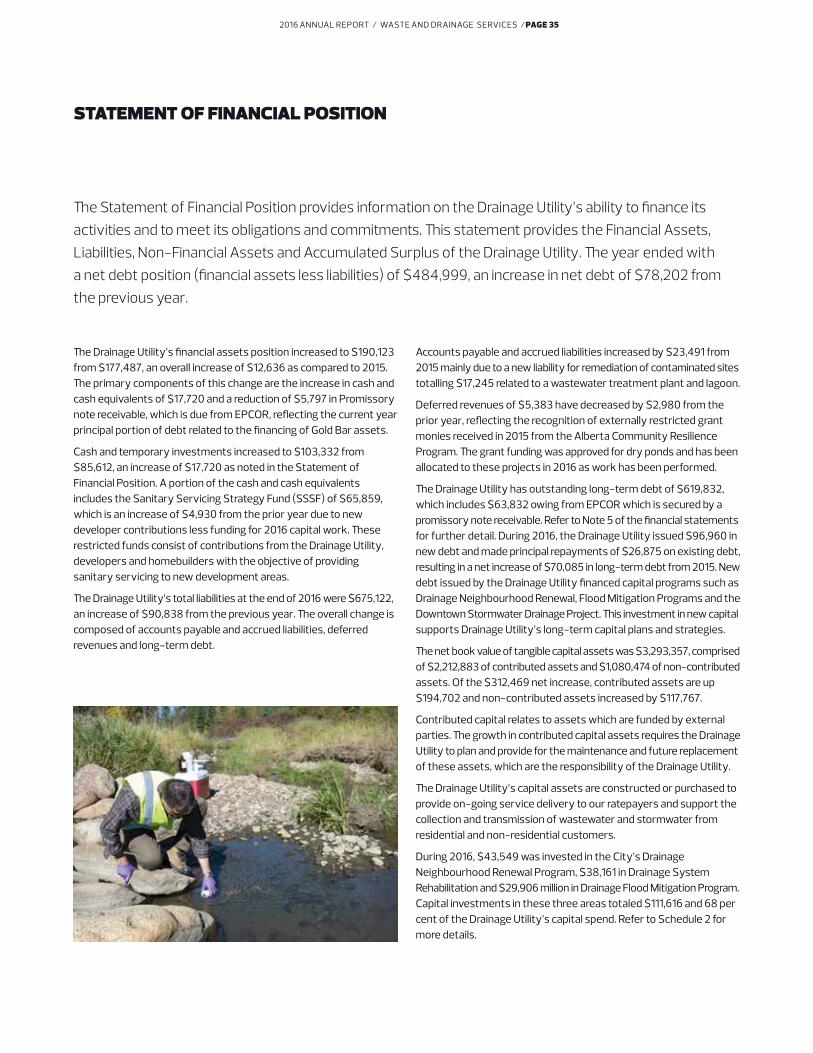
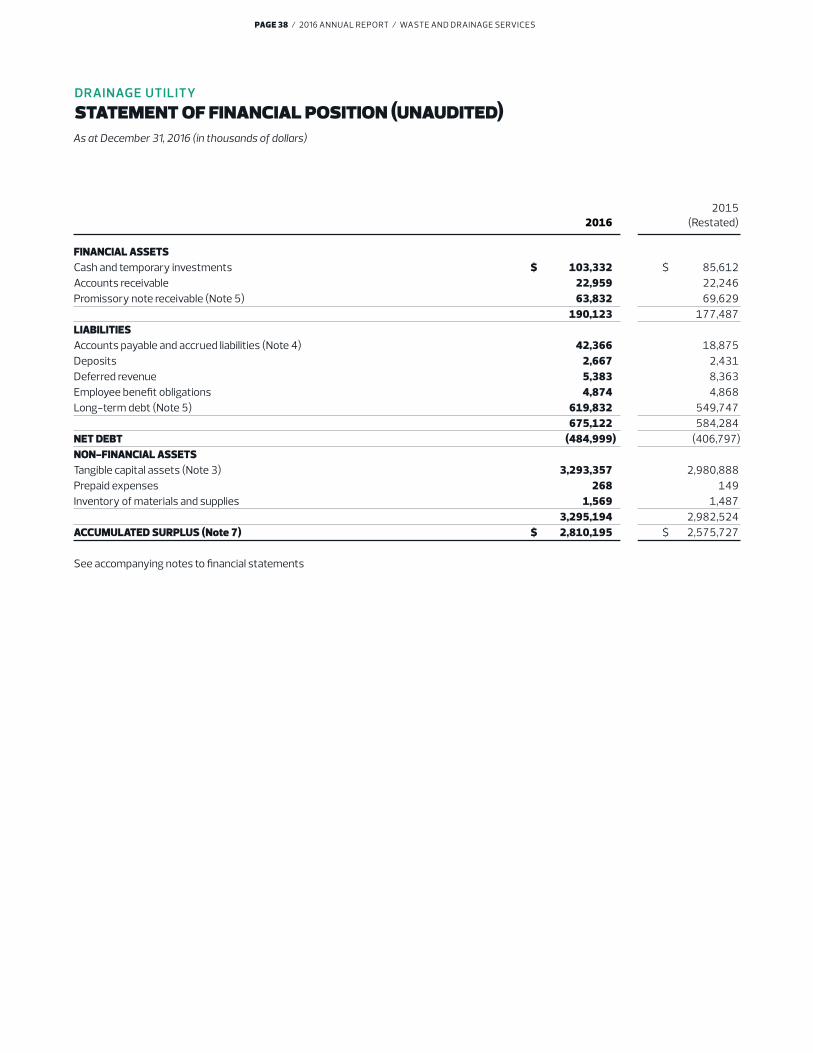
The Statement of Financial Position provides information on the Drainage Utility’s ability to finance its activities and to meet its obligations and commitments. This statement provides the Financial Assets, Liabilities, Non-Financial Assets and Accumulated Surplus of the Drainage Utility. The year ended with a net debt position (financial assets less liabilities) of $484,999, an increase in net debt of $78,202 from the previous year.
The drainage utility’s financial assets position increased to $190,123 from $177,487, an overall increase of $12,636 as compared to 2015. The primary components of this change are the increase in cash and cash equivalents of $17,720 and a reduction of $5,797 in promissory note receivable, which is due from epcoR, reflecting the current year principal portion of debt related to the financing of gold Bar assets.
cash and temporary investments increased to $103,332 from $85,612, an increase of $17,720 as noted in the statement of Financial position. A portion of the cash and cash equivalents includes the sanitary servicing strategy Fund (sssF) of $65,859, which is an increase of $4,930 from the prior year due to new developer contributions less funding for 2016 capital work. These restricted funds consist of contributions from the drainage utility, developers and homebuilders with the objective of providing sanitary servicing to new development areas.
The drainage utility’s total liabilities at the end of 2016 were $675,122, an increase of $90,838 from the previous year. The overall change is composed of accounts payable and accrued liabilities, deferred revenues and long-term debt.
Accounts payable and accrued liabilities increased by $23,491 from 2015 mainly due to a new liability for remediation of contaminated sites totalling $17,245 related to a wastewater treatment plant and lagoon.
deferred revenues of $5,383 have decreased by $2,980 from the prior year, reflecting the recognition of externally restricted grant monies received in 2015 from the Alberta community Resilience program. The grant funding was approved for dry ponds and has been allocated to these projects in 2016 as work has been performed.
The drainage utility has outstanding long-term debt of $619,832, which includes $63,832 owing from epcoR which is secured by a promissory note receivable. Refer to note 5 of the financial statements for further detail. during 2016, the drainage utility issued $96,960 in new debt and made principal repayments of $26,875 on existing debt, resulting in a net increase of $70,085 in long-term debt from 2015. new debt issued by the drainage utility financed capital programs such as drainage neighbourhood Renewal, Flood Mitigation programs and the downtown stormwater drainage project. This investment in new capital supports drainage utility’s long-term capital plans and strategies.
The net book value of tangible capital assets was $3,293,357, comprised of $2,212,883 of contributed assets and $1,080,474 of non-contributed assets. of the $312,469 net increase, contributed assets are up $194,702 and non-contributed assets increased by $117,767.
contributed capital relates to assets which are funded by external parties. The growth in contributed capital assets requires the drainage utility to plan and provide for the maintenance and future replacement of these assets, which are the responsibility of the drainage utility.
The drainage utility’s capital assets are constructed or purchased to provide on-going service delivery to our ratepayers and support the collection and transmission of wastewater and stormwater from residential and non-residential customers.
during 2016, $43,549 was invested in the city’s drainage neighbourhood Renewal program, $38,161 in drainage system Rehabilitation and $29,906 million in drainage Flood Mitigation program. capital investments in these three areas totaled $111,616 and 68 per cent of the drainage utility’s capital spend. Refer to schedule 2 for more details.

Page 36 / 2016 AnnuAl RepoRt / wAste And dRAinAge seRvices
The statement of operations and Accumulated surplus reports the annual operating revenues, expenses and other external contributions as well as the resulting net surplus or deficit position.
shortfall of revenues over expenses was ($5,341) for the current year, which represents a decrease of $24,938 when compared to 2015, which was in a positive position. The change from the prior year is related to an increase of $5,838 in revenue and an increase of $30,777 in expenses.
Revenues from drainage utility’s operations were $175,652 in 2016. Rate Revenues of $165,096 (94 per cent) were earned from utility rates charged to residential and non-residential customers, with the remainder generated from non-rate revenue (e.g. revenue from the regulatory services, service connections, lot grading, external construction projects, regional biosolids disposal and investment earnings). Revenues were higher year-over- year primarily due to increased utility rate revenue from higher customer counts and greater usage.
total expenses of $180,993 were higher when compared to 2015 mainly due to a requirement to recognize a contaminated site liability of $17,245. in addition to the liability, there were less capital recoveries than anticipated, and increased amortization costs as a result of higher capitalization of assets. savings were realized on personnel costs as a result of vacant positions and lower overtime costs.
statement of operations and accumulated surplus
“ Super happy with the great people sent out for this job. The guys were really personable, very careful about cleaning up after they did very professional job.”

2016 AnnuAl RepoRt / wAste And dRAinAge seRvices /Page 37
The statement of cash Flows summarizes the sources and use of cash for the year into three activities – operating, capital, and financing. The cash position for the drainage utility increased by $17,720 in 2016. during the year, cash was increased by $104,073 from operating activities plus $70,085 from net borrowing less $165,200 used in the acquisition of tangible capital assets.
The statement of change in net debt is a key indicator of the financial health of the drainage utility. A net debt balance indicates liabilities are greater than the liquid financial assets available (cash and cash equivalents). The net debt position is not the sole indicator of financial health as the drainage utility is guided by drainage services utility Fiscal policy c304d, which provides guidance on debt financing parameters to ensure the long-term financial goals of the drainage utility are met.
statement of cash flows
statement of change in net debt
conclusion
The Drainage Utility continues to operate with a focus on providing stable and consistent rate increases with overall long-term financial sustainability. The 2015-2024 Drainage Services Master Plan will guide this Utility for the next ten years. The focus will be to provide effective and efficient wastewater and stormwater drainage systems that will protect the environment and public health of our residents. The Drainage Services Master Plan supports the City’s vision and contributes to a growing and vibrant City.
net debt increased by $78,202 to $484,999 in 2016 from $406,797 in 2015. This is primarily an increase in excess revenues over expenses and increases in the acquisition of contributed and non-contributed tangible capital assets. The net debt to assets ratio increased from 50 per cent in 2015 to 52 per cent in 2016, which is within the targeted requirement of 50 per cent to 70 per cent as per the utility Fiscal policy. This was a result of an increase in non-contributed tangible capital asset financing through long-term debt in the current year.
Page 38 / 2016 AnnuAl RepoRt / wAste And dRAinAge seRvices
dRAinAGE UtiLity
statement of financial position (unaudited)As at December 31, 2016 (in thousands of dollars)
2015 2016 (Restated)
financial assetscash and temporary investments $ 103,332 $ 85,612Accounts receivable 22,959 22,246promissory note receivable (note 5) 63,832 69,629 190,123 177,487liaBilitiesAccounts payable and accrued liabilities (note 4) 42,366 18,875deposits 2,667 2,431deferred revenue 5,383 8,363employee benefit obligations 4,874 4,868long-term debt (note 5) 619,832 549,747 675,122 584,284net deBt (484,999) (406,797)non-financial assetstangible capital assets (note 3) 3,293,357 2,980,888prepaid expenses 268 149inventory of materials and supplies 1,569 1,487 3,295,194 2,982,524accumulated surPlus (note 7) $ 2,810,195 $ 2,575,727
see accompanying notes to financial statements

2016 AnnuAl RepoRt / wAste And dRAinAge seRvices /Page 39
dRAinAGE UtiLity
statement of operations and accumulated surplus (unaudited)For the year ended December 31, 2016 (in thousands of dollars)
2015 Budget 2016 (Restated) reVenuesRate revenue $ 162,223 $ 165,096 $ 158,606program revenue 10,668 10,556 11,202gain on disposal of tangible capital assets - - 5total revenues 172,891 175,652 169,813eXPenses (note 9)salaries, wages and employee benefits 64,642 62,284 66,464Materials, goods, supplies and utilities 41,308 11,058 22,199contracted and other services 90,000 79,666 109,480intra-municipal services 46,366 45,096 27,768local access fee 8,762 8,908 8,666debenture interest 21,198 19,872 18,799Amortization of tangible capital assets 54,083 56,536 47,562intra-municipal recoveries (162,885) (102,427) (150,722)total expenses 163,474 180,993 150,216eXcess (shortfall) of reVenues oVer eXPenses - Before other 9,417 (5,341) 19,597othergovernment transfers - capital (note 6) 6,485 2,954 404developer and customer contributions - capital 16,504 24,288 32,985contributed tangible capital assets 70,000 170,979 190,952eXcess of reVenues oVer eXPenses 102,406 192,880 243,938accumulated surPlus, Beginning of year 2,575,727 2,575,727 2,296,607tangible capital assets transferred from other city departments - 32,826 27,683net equity transfer from tax-supported operations 16,587 9,554 6,863local improvements - (792) 636accumulated surPlus, end of year $ 2,694,720 $ 2,810,195 $ 2,575,727
see accompanying notes to financial statements

Page 40 / 2016 AnnuAl RepoRt / wAste And dRAinAge seRvices
dRAinAGE UtiLity
statement of change in net debt (unaudited)For the year ended December 31, 2016 (in thousands of dollars)
2015 Budget 2016 (Restated) eXcess of reVenue oVer eXPenses $ 102,406 $ 192,880 $ 243,938Acquisition of tangible capital assets (223,203) (165,200) (150,857)contributed tangible capital assets (70,000) (170,979) (190,952)proceeds on disposal of tangible capital assets - - 2,909Amortization of tangible capital assets 54,083 56,536 47,562net equity transfer from tax-supported operations 16,587 9,554 6,863local improvements - (792) 636gain on disposal of capital assets - - (5) (222,533) (270,881) (283,844)net (increase) decrease in prepaid expenses - (119) 3net equity transfer from tax-supported operations - - - - (201) 100increase in net deBt (120,127) (78,202) (39,806)net deBt, Beginning of year (406,797) (406,797) (366,991)net deBt, end of year $ (526,924) $ (484,999) $ (406,797)
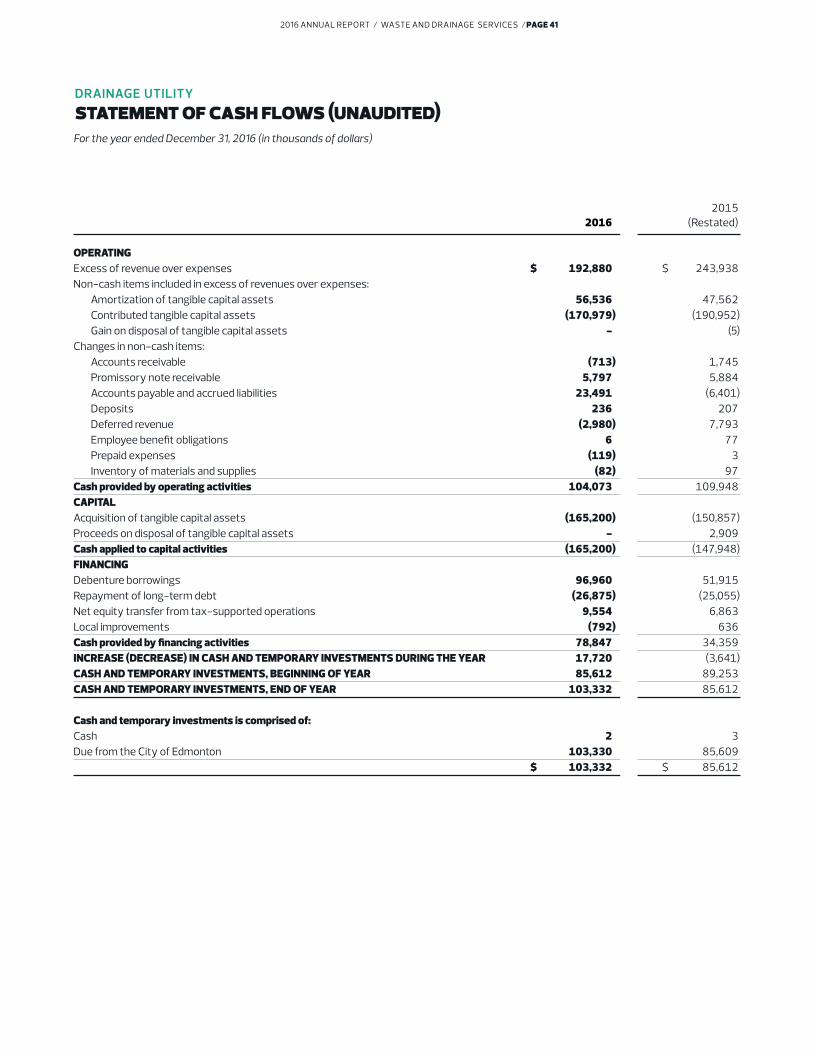
2016 AnnuAl RepoRt / wAste And dRAinAge seRvices /Page 41
dRAinAGE UtiLity
statement of cash flows (unaudited)For the year ended December 31, 2016 (in thousands of dollars)
2015 2016 (Restated) oPeratingexcess of revenue over expenses $ 192,880 $ 243,938non-cash items included in excess of revenues over expenses: Amortization of tangible capital assets 56,536 47,562 contributed tangible capital assets (170,979) (190,952) gain on disposal of tangible capital assets - (5)changes in non-cash items: Accounts receivable (713) 1,745 promissory note receivable 5,797 5,884 Accounts payable and accrued liabilities 23,491 (6,401) deposits 236 207 deferred revenue (2,980) 7,793 employee benefit obligations 6 77 prepaid expenses (119) 3 inventory of materials and supplies (82) 97cash provided by operating activities 104,073 109,948caPitalAcquisition of tangible capital assets (165,200) (150,857)proceeds on disposal of tangible capital assets - 2,909cash applied to capital activities (165,200) (147,948)financingdebenture borrowings 96,960 51,915Repayment of long-term debt (26,875) (25,055)net equity transfer from tax-supported operations 9,554 6,863local improvements (792) 636cash provided by financing activities 78,847 34,359increase (decrease) in cash and temPorary inVestments during the year 17,720 (3,641)cash and temPorary inVestments, Beginning of year 85,612 89,253cash and temPorary inVestments, end of year 103,332 85,612
cash and temporary investments is comprised of:cash 2 3due from the city of edmonton 103,330 85,609 $ 103,332 $ 85,612

Page 42 / 2016 AnnuAl RepoRt / wAste And dRAinAge seRvices
dRAinAGE UtiLity
schedule 1 - schedule of tangible capital assets (unaudited)For the Year Ended December 31, 2016 (in thousands of dollars)
opening Additions closing Balance and transfers Balance costcollection and transmission infrastructure $ 3,215,195 $ 431,548 $ 3,646,743pump/lift stations 72,902 9,977 82,879wastewater treatment infrastructure 5,691 - 5,691land 111,917 10,361 122,278office buildings 3,826 1,844 5,670laboratories/Research and development centers 1,780 - 1,780warehouses 19,507 15,049 34,556office furniture and equipment 175 4,626 4,801vehicles 8,911 5,433 14,344computer equipment 13,503 4,378 17,881construction equipment 39,739 17,038 56,777 3,493,146 500,254 3,993,400Assets under construction 229,170 (131,249) 97,921 3,722,316 369,005 4,091,321accumulated amortization:collection and transmission infrastructure 669,208 46,030 715,238pump/lift stations 17,585 1,770 19,355wastewater treatment infrastructure 3,018 129 3,147land - - -office buildings 1,630 112 1,742laboratories/Research and development centers 557 41 598warehouses 13,677 3,614 17,291office furniture and equipment 155 361 516vehicles 3,239 1,213 4,452computer equipment 12,918 795 13,713construction equipment 19,441 2,471 21,912 741,428 56,536 797,964net Book Value $ 2,980,888 $ 312,469 $ 3,293,357

2016 AnnuAl RepoRt / wAste And dRAinAge seRvices /Page 43
dRAinAGE UtiLity
notes to financial statements (unaudited)For the year ended December 31, 2016 (in thousands of dollars)
general
significant accounting Policies
1.
2.
The drainage utility, operated by the city of edmonton (the city), provides utility services in wastewater, stormwater and biosolids management through environmentally and financially sustainable practices for the city. The utility is governed by the drainage services utility Fiscal policy c304d, which was adopted by city council on september 23, 2014 and includes such items as:
The financial statements of the drainage utility are prepared by management in accordance with canadian public sector Accounting standards (psAs). significant aspects of the accounting policies adopted by the city are as follows:
a) Basis of accounting The financial statements are prepared using the accrual basis of accounting. Revenues are accounted for in the period in which they are earned and measurable. Funds from external parties and earnings thereon restricted by agreement or legislation are accounted for as deferred revenue until used for the purpose specified. expenses are recognized as they are incurred and measurable based upon receipt of goods or services and/or the legal obligation to pay.
b) due from the City of Edmonton Amounts due from the city of edmonton represent cash and
temporary investments managed by the city of edmonton. interest earned is recorded by the drainage utility.
c) Promissory note receivable Amounts that are recoverable from epcoR with respect to
outstanding debentures pursuant to the transfer of the gold Bar wastewater treatment Facility in 2009. The receivable is recorded at a value that equals the offsetting portion of the un-matured long-term debt.
d) inventory of materials and supplies inventory of materials and supplies is valued at the lower of average cost and replacement cost.
e) Use of estimates The preparation of financial statements in conformity with the
psAs requires management to make estimates and assumptions that affect the reported amounts of assets and liabilities and disclosure of contingent assets and liabilities at the date of the financial statements and the reported amounts of revenues and expenses during the period. Actual results could differ from those estimates.
Administration has used estimates to determine useful lives of tangible capital assets, employee benefit obligations and contaminated sites remediation.
f) non-financial assets non-financial assets are not available to discharge liabilities
and are held for use in the provision of services. They have useful lives extending beyond the current year and are not intended for sale in the normal course of operations. non-financial assets are comprised of tangible capital assets, inventory of materials and supplies, and prepaid expenses.
g) tangible capital assets tangible capital assets are recorded at cost which includes all
amounts that are directly attributable to acquisition, construction, development or betterment of the asset. interest charges during the construction period are not capitalized.
The cost of routine maintenance and repairs and the replacement of minor parts are charged to expense as incurred. certain expenditures relating to replacement of components incurred during major maintenance are capitalized and amortized over the estimated benefit period of such expenditures.
a) operating in a manner that balances the best possible service at the lowest cost, while employing private sector approaches to rate setting,
b) Accounting for the cost of service under a full cost accounting approach,
c) The drainage utility will be subject to a local Access Fee, similar to private utilities for the use of public right of ways and in lieu of property taxes. The local access fee will be up to 8 per cent of qualifying revenues, as determined by city council and,
d) contributing towards achieving the city’s strategic plan.

Page 44 / 2016 AnnuAl RepoRt / wAste And dRAinAge seRvices
dRAinAGE UtiLity
notes to financial statements (unaudited)For the year ended December 31, 2016 (in thousands of dollars)
Assets under construction are not amortized until available for productive use. once construction is complete and the asset is placed into service, assets are transferred to the appropriate asset category. The project life-cycle from preliminary design to construction completion may exceed one year.
h) Amortization plant and infrastructure assets are grouped and amortized
over their estimated useful lives on a straight line basis. upon retirement of an asset from the group, the cost of the asset is cleared and fully offset with accumulated amortization. As a result, no gain or loss is recognized upon disposal. These assets comprise the majority of the utility’s asset base (89%).
Amortization rates for these assets are as follows:
asset category useful amortization % of net life rate asset Base
collection and transmission infrastructure 75 years 1.33% 84%
pump/ lift stations 44 years 2.27% 3%clover Bar and
transfer stations 44 years 2.27% 2%
non-core assets cost, less residual value, is amortized on a straight-line basis over the following estimated useful lives of the assets:
asset category useful life amortization rate
office Buildings 44 years 2.27%laboratories/Research and development centers 44 years 2.27%warehouses 10 years 10.00%office Furniture and equipment 6.67 years 15.00%computers 5 years 20.00%Monitoring and
control equipment 10 years 10.00%Machinery and equipment 5 years 20.00%
or usage based
one-half of the annual amortization is charged in the year of acquisition and in the year of disposal.
i) Contributions of tangible capital assets tangible capital assets acquired as contributions are recorded
at their fair value on the date received. equivalent amounts are recorded as contributed tangible capital assets on the statement of operations and Accumulated surplus.
j) deferred revenue Funds received from external parties that are restricted for
use in the conduct of certain programs or in the completion of specific work are deferred until used for the purpose specified.
k) Liability for contaminated sites contaminated sites are the result of a chemical, organic or
radioactive material or live organism in amounts that exceed an environmental standard being introduced into soil, water or sediment. The drainage utility recognizes a liability for remediation of contaminated sites when the following criteria have been met:
- An environmental standard exists, - There is evidence that contamination exceeds
an environmental standard, - The drainage utility is directly responsible or accepts
responsibility for the contamination, - it is expected that future economic benefits will
be given up and, - A reasonable estimate of the amount can be made.
sites that are currently in productive use are only considered contaminated sites if an unexpected event results in remediation. in cases where the drainage utility’s responsibility is not determinable, a contingent liability may be disclosed.
The liability reflects the drainage utility ’s best estimate, as of december 31, of the amount required to remediate non-productive sites to the current minimum standard of use prior to contamination. where possible, provisions for remediation are based on environmental assessments completed on a site complemented with any other pertinent information based on costs to clean up similar sites. The liability is recorded net of any estimated recoveries from third parties. The drainage utility will measure the liability using present value techniques when cash flows are expected to occur over extended future periods.

2016 AnnuAl RepoRt / wAste And dRAinAge seRvices /Page 45
Accumulated 2016 2015tangible capital Asset cost Amortization net Book Value net Book value
collection & transmission infrastructure $ 3,646,743 $ 715,238 $ 2,931,505 $ 2,545,986pump/ lift stations 82,879 19,355 63,524 55,318wastewater treatment infrastructure 5,691 3,147 2,544 2,673land 122,278 - 122,278 111,917office Buildings 5,670 1,742 3,928 2,196laboratories/Research and development centres 1,780 598 1,182 1,223warehouses 34,556 17,291 17,265 5,830office Furniture and equipment 4,801 516 4,285 20vehicles 14,344 4,452 9,892 5,672computer equipment 17,881 13,713 4,168 585construction equipment 56,777 21,912 34,865 20,298 3,993,400 797,964 3,195,436 2,751,718capital Assets under construction 97,921 - 97,921 229,170total $ 4,091,321 $ 797,964 $ 3,293,357 $ 2,980,888
tangible capital Assets - contributed $ 2,637,908 $ 425,025 $ 2,212,883 $ 2,018,181tangible capital Assets - non-contributed 1,453,413 372,939 1,080,474 962,707 $ 4,091,321 $ 797,964 $ 3,293,357 $ 2,980,888
For additional information, see the schedule of tangible capital Assets (schedule 1).
dRAinAGE UtiLity
notes to financial statements (unaudited)For the year ended December 31, 2016 (in thousands of dollars)
tangiBle caPital assets3.
tangible capital assets include contributed and non-contributed assets and consist of the following:
accounts PayaBle and accrued liaBilities4.
2016 2015
trade and other $ 25,121 $ 18,875contaminated sites 17,245 - $ 42,366 $ 18,875

Page 46 / 2016 AnnuAl RepoRt / wAste And dRAinAge seRvices
dRAinAGE UtiLity
notes to financial statements (unaudited)For the year ended December 31, 2016 (in thousands of dollars)
long-term deBt 5.
The drainage utility utilizes debt to finance capital expenditures under principles and limits established within the drainage utility Fiscal policy. The policy is intended to support the drainage utility’s long-term capital plans and strategies while maintaining long-term financial affordability, flexibility and sustainability. Borrowing has generally been in the form of amortizing debentures administered through the Alberta capital Finance Authority (AcFA), utilizing the strong debt rating of the government of Alberta and combined borrowing volumes across Alberta. interest rates are established at the time of borrowing and remain constant throughout the
of the debentures payable to Alberta capital Finance Authority, $63,832 relates to the amount owing to the drainage utility by epcoR through a promissory note receivable. As the debentures were previously issued for gold Bar assets in the name of the city, the debt obligation remains with the city, with an offset of $63,832 as a promissory note receivable from epcoR.
term of the debenture, thus eliminating the risk associated with fluctuating interest rates.
existing long-term debt matures in 2041. debenture interest is payable at rates ranging from 2.8% to 8.0%. The average interest rate is 3.8% for 2016 (2015 - 4.2%) with terms of 10 and 25 years. payments are made annually or semi-annually.
a) long-term debt is comprised of:
b) The current portion of long-term debt amounts to $28,562 (2015 - $26,301).
principal and interest repayments are as follows:
2016 2015 long-term debt $ 556,000 $ 480,118long-term debt, secured through promissory note receivable from epcoR 63,832 69,629debentures payable to Alberta capital Finance Authority $ 619,832 $ 549,747
Principal interest total 2017 $ 28,562 $ 24,362 $ 52,9242018 28,229 23,128 51,3572019 27,152 21,909 49,0612020 27,948 20,713 48,6612021 28,351 19,466 47,817Thereafter 479,590 147,697 627,287total $ 619,832 $ 257,275 $ 877,107

2016 AnnuAl RepoRt / wAste And dRAinAge seRvices /Page 47
goVernment transfers
accumulated surPlus
6.
7.
2016 2015
capital transfers:Alberta community
Resilience program $ 2,954 $ 404
The drainage utility’s total accumulated surplus consists of its accumulated operating position (unrestricted), restricted amounts and equity in tangible capital assets as summarized below.
Restricted surplus consists of the sanitary servicing strategy Fund (sssF) and other developer contributions. These amounts are available to finance future capital projects. The sssF consists of a pool of resources comprised of contributions made by the drainage utility, developers and home builders to provide a framework for future major trunk development in the city over the next 75 years.
Advances for construction represents debt proceeds received in advance of related capital expenses as well as capital expenses to be debt financed at year-end.
in 2016, the drainage utility received $0 (2015 - $8,224) for tawa park, Malcolm tweddle and ekota dry ponds and recorded $2,954 (2015 - $404) as capital government transfers to offset related expenses eligible under the terms of this grant. The remaining amount of $4,866 (2015 - $7,820) has been recorded as deferred revenue at the end of the year.
2016 2015 Accumulated operating
surplus/(deficit) $ 6,197 $ (8,102)Restricted surplus 75,294 68,319Advances for construction/
(capital to be financed) (8,653) 14,740equity in tangible
capital assets 2,737,357 2,500,770total accumulated surplus $ 2,810,195 $ 2,575,727
eQuity in tangiBle caPital assets8.
The drainage utility’s total accumulated surplus consists of its accumulated operating position (unrestricted), restricted amounts and equity in tangible capital assets as summarized below.
2016 2015 tangible capital assets
(schedule 1) $ 4,091,321 $ 3,722,316Accumulated amortization
(schedule 1) (797,964) (741,428)long-term debt (note 5) (619,832) (549,747)promissory note
receivable (note 5) 63,832 69,629 $ 2,737,357 $ 2,500,770
dRAinAGE UtiLity
notes to financial statements (unaudited)For the year ended December 31, 2016 (in thousands of dollars)

Page 48 / 2016 AnnuAl RepoRt / wAste And dRAinAge seRvices
eXPenses By function9.
corporate Administration expenses are mainly comprised of amortization, debt interest and local access fees.
2016 2015 corporate Administration $ 83,346 $ 73,512operation 44,779 27,909systems Management 19,563 3,291program Management 16,324 13,000planning 9,692 24,998design & construction 3,836 3,504strategic services 3,453 4,002 $ 180,993 $ 150,216
dRAinAGE UtiLity
notes to financial statements (unaudited)For the year ended December 31, 2016 (in thousands of dollars)
liaBility for contaminated sites
Prior year restatement
comParatiVe information
10.
11.
12.
As of december 31, 2016, the liability for contaminated sites includes sites associated with former drainage utility operations. The nature of contamination includes chemicals, heavy metals, salt, biosolids and other organic and inorganic contaminants. The sources of contamination include a wastewater treatment plant and lagoon .
in 2015 $6,832 in tangible capital assets were transferred from city tax-supported operations to the drainage utility, but were not recognized appropriately on a psAs basis in the drainage utility financial statements. The prior year financial statement balances have been restated to correct this error. The effect of
comparative figures have been reclassified to conform with the financial statement presentation adopted for the current year.
liability estimates are based on environmental site assessments and costs to remediate similar sites. The drainage utility has recognized a liability of $17,245 (2015 - $0) for remediation of contaminated sites . The liability is reported in Accounts payable and accrued liabilities in the statement of Financial position .
the restatement is that the cash and temporary investments and accumulated surplus (equity in tangible capital assets) prior year balances on the statement of Financial position have each been increased by $6,832, equivalent to the cost of the tangible capital assets transferred to the drainage utility.

2016 AnnuAl RepoRt / wAste And dRAinAge seRvices /Page 49
dRAinAGE UtiLity
supplemental information - schedule 2 - tangible capital expenditures statement (unaudited)For the year ended December 31, 2016 (in thousands of dollars)
2016 2015-2018 Approved Budget Approved Budget (note 1) 2016 nov 29, 2016 nov 29, 2016 actuals drainage neighbourhood renewal drainage neighbourhood Renewal coordination $ 121,400 $ 23,764 $ 43,784 sewer upgrading 4,513 500 (235) service connection Renewal 1,501 (0) 0 127,414 24,264 43,549 drainage system rehabilitation Mill woods double Barrel Replacement/sess sA1 26,607 8,850 947 structures Rehabilitation 26,316 8,139 6,742 sewer Rehabilitation 20,685 3,268 5,273 High priority Repair 49,555 7,197 22,883 creek erosion protection 9,493 2,793 1,761 optimization of 30 Avenue storm trunk overflow 7,741 2,407 347 groat Road trunk sewer Rehabilitation 19,289 9,773 208 159,686 42,426 38,161flood mitigation neighbourhood Flood Mitigation projects - (11,178) (11,178) Flood Mitigation 64,968 20,486 10,787 tweddle place dry pond and sewer upgrades 35,713 17,853 15,213 ekota dry pond and Menisa storm Relief (eK1, Mn1) 11,986 8,343 8,654 tawa dry pond (tw1, Hv1 &wl1) 28,617 8,310 1,437 Malcolm tweddle & edith Rodgers dry ponds 24,209 1,676 1,442 Morris pond 4,830 4,812 3,522 opportunistic Flood Mitigation project 9,006 238 30 179,331 50,540 29,906environmental Quality enhancement enhanced Biosolids dewatering 40 40 40 se edmonton stormwater trunk 41 Ave 752 327 371 River for life 2,746 - - Biosolids Facilities Renewal 8,053 3,382 (331) centrate line Replacement 2,555 2,555 77 Fat, oil and grease Facility - - - environmental & collection system Monitoring 1,698 886 459 Quenelle Basin loading Reduction - - - city wide odour control program 2,636 1,347 594 lid capital demonstration projects 1,142 119 (168) silverberry 4 pond naturalization pilot 1,368 54 32 Mill creek end of pipe treatment Facility 10,959 4,575 2,715 31,949 13,283 3,789combined sewer overflow strategy opportunistic sewer separation 9,950 467 289 combined sewer overflow control projects 6,333 3,243 1,490 16,282 3,710 1,779
(continued)

Page 50 / 2016 AnnuAl RepoRt / wAste And dRAinAge seRvices
dRAinAGE UtiLity
supplemental information - schedule 2 - tangible capital expenditures statement (unaudited)For the year ended December 31, 2016 (in thousand of dollars)
drainage system expansion Review/inspect developer Built sewers 7,409 1,728 1,918 drainage operations equipment and vehicles 8,493 2,379 4,625 utilities infrastructure equipment and vehicles 16,392 5,141 12,366 drainage Facility upgrading 10,646 4,611 2,345 Kennedale Accommodation 5,455 3,263 669 drainage it Assets 4,104 2,307 1,098 Residuals disposal Facility (475) 6 7 interconnection control program 4,309 1,050 673 servicing for downtown intensification 2,403 - - 58,735 20,486 23,701sanitary servicing strategy Projects sanitary servicing strategy projects 96,135 37,086 12,344 wess w12- sAn 582 675 214 96,717 37,761 12,557drainage system expansion initial phase downtown stM drainage services 44,626 16,615 11,253 local improvement 25,791 13,809 43 service connection expansion 13,789 (1,084) 451 creek erosion protection 4,309 1,392 1,007 total capital 88,515 30,732 12,754 other - - (996)total capital expenditures 758,630 223,203 165,200 - - - capital expenditures by financingnon-contributed financingself-liquidating debt 371,974 133,846 120,354Retained earnings 180,817 17,021 13,019subtotal non-contributed financing 552,791 150,867 133,374contributed Financing 205,839 72,336 31,826total capital expenditures $ 758,630 $ 223,203 $ 165,200 - - - note 1: 2016 Approved Budget includes 2015 carryforwards
2016 2015-2018 Approved Budget Approved Budget (note 1) 2016 nov 29, 2016 nov 29, 2016 actuals
(continued)

2016 AnnuAl RepoRt / wAste And dRAinAge seRvices /Page 51
dRAinAGE UtiLity
supplemental information schedule 3 - financial indicators (unaudited)For the year ended December 31, 2016 (in thousands of dollars)
2016 2017 2014 2015 Approved 2016 Approved Financial indicators Actuals Actuals Budget actuals Budget 1. rate sufficient to meet expenses net income 50,424 43,296 38,994 24,333 44,673 target: Positive net income Yes Yes Yes yes Yes
2. cash Position (combined) next Year’s capital Financed by pay As You go 43,550 51,183 54,963 43,597 44,734 Risk Allowance - - 1,860 - 2,040 Rate stabilization - - 1,667 - - cash target 43,550 51,183 58,490 43,597 46,774 cash Position 25,566 17,820 58,490 27,790 46,774 target: cash position at minimum equal to the cash target. no no Yes no Yes
3. rate increase sanitary typical residential monthly Billing increase $ 1.39 $ 0.50 $ 0.50 $ 0.50 $ 0.50 impact of customer Rate 6.8% 2.3% 2.2% 2.2% 2.2% stormwater typical residential monthly Billing increase $ 0.86 $ 0.50 $ 0.50 $ 0.50 $ 0.50 impact of customer Rate 10.3% 5.4% 5.1% 5.1% 4.9% combined typical residential monthly Billing increase $ 2.25 $ 1.00 $ 1.00 $ 1.00 $ 1.00 impact of customer Rate 7.8% 3.2% 3.1% 3.1% 3.0% target: stable, consistent rate increases Yes Yes Yes yes Yes 4. financing of capital investments debt to net Assets Ratio 51% 50% 58% 52% 56% target: Between 50% - 70%; balancing cash availability, interest rates, and construction inflation. Yes Yes Yes yes Yes

“ i would like to thank your drainage Services team for the amazing work that they did. The service was great - everything was explained clearly and promptly. during the hours of them trying to fix the situation, we were provided with regular updates by the team which was a big help as we always felt we were in the loop about what was going on. for a couple of new home buyers, my husband and i felt like we were well taken care of in a difficult situation. ”

2016“ Whatever future challenges lie ahead, i’m certain that our highly capable and dedicated team will continue to help make our city the best it can be”- Chris Ward, Branch manager, Waste and drainage Services
The City of Edmonton Waste and Drainage Services2nd floor, Century Place9803 - 102A Avenue NWEdmonton, Alberta T5J 3A3
Telephone: In Edmonton: 311Outside Edmonton: 780-442-5311
www.edmonton.ca/wastewww.edmonton.ca/drainage
for more information, please visit our websites:
inquires may also be directed to: