The Coastal Arcadian: Beads, Country Store and Fine Art. A New Meeting Point in Dana Point, CA

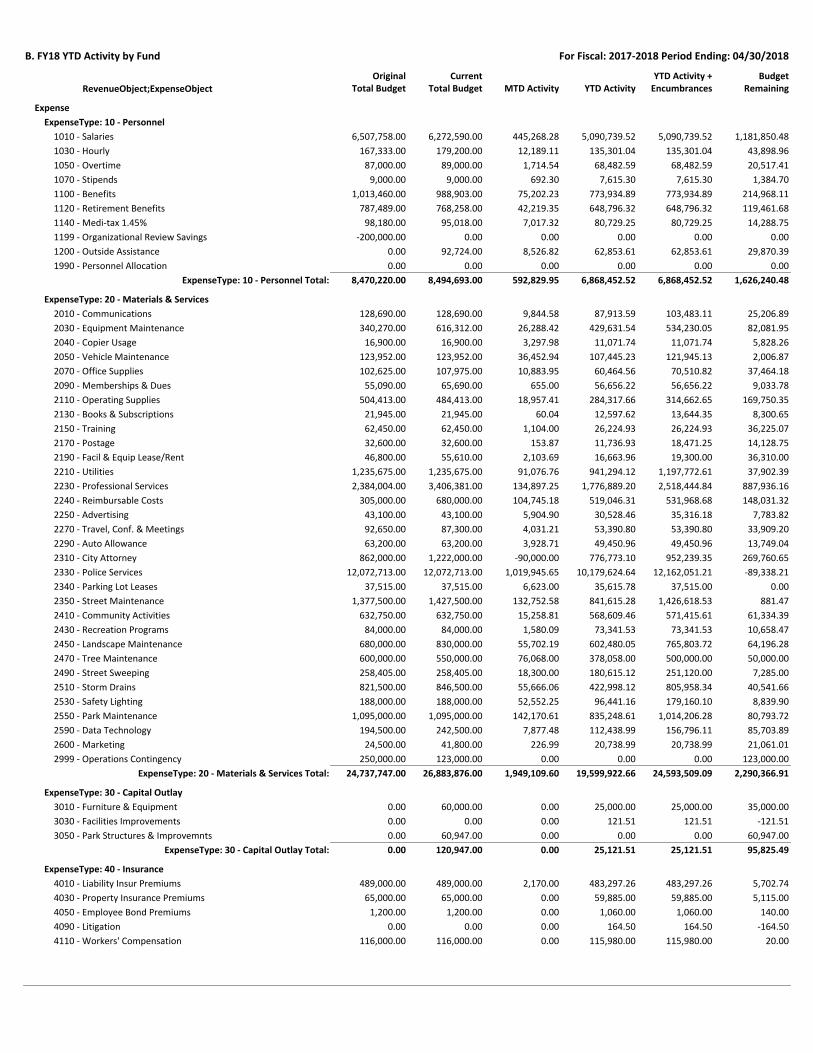
B. FY18 YTD Activity by FundCity of Dana Point, CA Group Summary
For Fiscal: 2017-2018 Period Ending: 04/30/2018
MTD Activity YTD ActivityYTD Activity +
EncumbrancesBudget
RemainingRevenueObject;ExpenseObjectCurrent
Total BudgetOriginal
Total Budget
Fund: 01 - GENERAL
Revenue
RevenueType: 10 - Taxes & Franchises
2,360,490.15 8,186,182.92 8,186,182.92 -86,182.927,750,000.00 8,100,000.006101 - Sec & Unsec Property Taxes
57,573.38 394,424.36 394,424.36 105,575.64600,000.00 500,000.006103 - Property Transfer Tax
80,619.25 736,595.23 736,595.23 538,404.771,250,000.00 1,275,000.006105 - Franchise Fees
0.00 0.00 0.00 0.0010,000.00 0.006106 - PEG Franchise Fees
0.00 23,440.97 23,440.97 26,559.0350,000.00 50,000.006107 - Homeowners Property Tax Relie
1,054,276.57 10,617,872.82 10,617,872.82 1,982,127.1812,325,000.00 12,600,000.006109 - Transient Occupancy Tax
107,351.76 471,357.43 471,357.43 -21,357.43400,000.00 450,000.006110 - Short Term Rental TOT
318,500.00 3,570,693.23 3,570,693.23 1,929,306.775,700,000.00 5,500,000.006111 - Sales & Use Tax
0.00 2,041,161.00 2,041,161.00 2,033,839.003,875,000.00 4,075,000.006113 - In-lieu Property Taxes
3,978,811.11 26,041,727.96 26,041,727.96 6,508,272.0431,960,000.00 32,550,000.00RevenueType: 10 - Taxes & Franchises Total:
RevenueType: 20 - Licenses & Permits
-2,346.00 14,655.00 14,655.00 10,345.0030,000.00 25,000.006201 - Site Development Permit
0.00 5,970.21 5,970.21 14,029.7925,000.00 20,000.006203 - Coastal Development Permit
784.00 5,156.00 5,156.00 2,844.008,000.00 8,000.006205 - Conditional Use Permit
9,775.13 19,837.54 19,837.54 -6,837.5410,000.00 13,000.006207 - Other Planning Permits
69,368.43 807,175.83 807,175.83 192,824.171,000,000.00 1,000,000.006209 - Building Permits
1,415.00 28,499.15 28,499.15 1,500.8530,000.00 30,000.006211 - Plumbing Permits
3,987.50 67,014.60 67,014.60 7,985.4070,000.00 75,000.006215 - Electrical Permits
894.00 16,922.50 16,922.50 3,077.5025,000.00 20,000.006217 - Mechanical Permits
1,200.00 11,550.00 11,550.00 13,450.0030,000.00 25,000.006218 - Short Term Rental Permits
260.31 3,076.64 3,076.64 -576.64500.00 2,500.006219 - Other Building Permits
286.00 1,246.00 1,246.00 -246.001,000.00 1,000.006221 - Transportation Permits
793.00 18,368.70 18,368.70 1,631.3020,000.00 20,000.006223 - Encroachment Permits
82,082.41 297,861.98 297,861.98 52,138.02270,000.00 350,000.006225 - Grading Permit Plan Check
1,686.54 31,126.91 31,126.91 3,873.0915,000.00 35,000.006226 - Licenses & Permits
1,400.00 8,400.00 8,400.00 1,600.009,000.00 10,000.006227 - Other Engineering Permits
171,586.32 1,336,861.06 1,336,861.06 297,638.941,543,500.00 1,634,500.00RevenueType: 20 - Licenses & Permits Total:
RevenueType: 30 - Fines & Forfeitures
15,010.02 109,065.51 109,065.51 60,934.49170,000.00 170,000.006301 - Vehicle Code Fines
9,718.00 97,693.15 97,693.15 22,306.85120,000.00 120,000.006303 - Penalties, Int. & Restitution
24,728.02 206,758.66 206,758.66 83,241.34290,000.00 290,000.00RevenueType: 30 - Fines & Forfeitures Total:
RevenueType: 40 - Use Of Money & Property
3,055.00 48,992.20 48,992.20 11,007.8060,000.00 60,000.006401 - Rental Of Property
193,775.93 344,904.94 344,904.94 -124,904.94170,000.00 220,000.006403 - Investment Income
1,900.00 19,000.00 19,000.00 3,800.0022,800.00 22,800.006405 - City Plaza Rental Revenue
0.00 0.00 0.00 1,000.001,000.00 1,000.006406 - Trolley Rentals
198,730.93 412,897.14 412,897.14 -109,097.14253,800.00 303,800.00RevenueType: 40 - Use Of Money & Property Total:
RevenueType: 50 - Intergovernmental
0.00 17,738.63 17,738.63 -2,738.6315,000.00 15,000.006505 - Motor Vehicle In-lieu
17,590.00 17,590.00 17,590.00 117,410.000.00 135,000.006513 - Local Coastal Program Grant
0.00 0.00 0.00 0.0060,000.00 0.006514 - Waste Disposal Agreement Allocation
0.00 0.00 0.00 195,000.00195,000.00 195,000.006515 - Nuclear Power Program
64,816.00 77,645.18 77,645.18 -7,645.18100,000.00 70,000.006521 - Intergovernmental Cost Reimb
0.00 0.00 0.00 0.0032,000.00 0.006523 - State Grants
82,406.00 112,973.81 112,973.81 302,026.19402,000.00 415,000.00RevenueType: 50 - Intergovernmental Total:
RevenueType: 60 - Charges For Services
0.00 0.00 0.00 500.00500.00 500.006607 - Planning Comm. Determin.
0.00 1,176.00 1,176.00 -176.000.00 1,000.006609 - Variance Minor Amendment
0.00 2,100.00 2,100.00 -100.001,500.00 2,000.006621 - Concept Approval

B. FY18 YTD Activity by Fund For Fiscal: 2017-2018 Period Ending: 04/30/2018
MTD Activity YTD ActivityYTD Activity +
EncumbrancesBudget
RemainingRevenueObject;ExpenseObjectCurrent
Total BudgetOriginal
Total Budget
8,310.04 114,798.67 114,798.67 5,201.3395,000.00 120,000.006623 - Planning Plan Check Fee
50,229.34 559,872.77 559,872.77 140,127.23850,000.00 700,000.006631 - Building Plan Check Fee
3,105.00 31,285.00 31,285.00 8,715.0040,000.00 40,000.006633 - Permit Issuance Fee
0.00 22.00 22.00 -22.000.00 0.006635 - Other Building Fees
126.00 5,355.00 5,355.00 -355.001,000.00 5,000.006639 - Addressing Fee
16,251.48 161,347.95 161,347.95 -21,347.95100,000.00 140,000.006641 - Grading Inspection
0.00 -691.94 -691.94 691.940.00 0.006649 - Map Check Fee
22,322.66 126,204.47 126,204.47 -31,204.4775,000.00 95,000.006655 - Other Engineering Fees
240.00 1,320.00 1,320.00 680.002,000.00 2,000.006659 - Solid Waste Exemption Fee
0.00 626,062.08 626,062.08 -0.080.00 626,062.006682 - Lantern District Impact Fees
0.00 70,496.59 70,496.59 -70,496.590.00 0.006683 - Art In Public Places Fees
2,055.53 22,696.86 22,696.86 2,303.14200,000.00 25,000.006685 - Reimbursed Expenses
48,644.57 58,676.10 58,676.10 -48,676.100.00 10,000.006687 - Legal Reimbursements - Development
0.00 61,810.05 61,810.05 8,189.950.00 70,000.006688 - Legal Reimbursements - Other
10,360.01 106,645.64 106,645.64 -21,645.640.00 85,000.006689 - Police Services Reimbursements
16,647.61 119,991.58 119,991.58 50,008.42170,000.00 170,000.006691 - Recreation Classes
15,685.35 18,179.40 18,179.40 -15,179.400.00 3,000.006692 - Planning Reimbursements
360.00 19,345.00 19,345.00 655.0050,000.00 20,000.006693 - Activities & Trips
11,524.46 35,875.12 35,875.12 -15,875.120.00 20,000.006694 - Staff Time Reimbursements
143.40 2,613.70 2,613.70 386.301,000.00 3,000.006697 - Photocopies
1,955.26 28,142.48 28,142.48 11,857.5234,000.00 40,000.006699 - Other P/b/e
207,960.71 2,173,324.52 2,173,324.52 4,237.481,620,000.00 2,177,562.00RevenueType: 60 - Charges For Services Total:
RevenueType: 70 - Other
500.00 2,500.00 2,500.00 -500.001,000.00 2,000.006701 - Planning Appeal Fee
782.72 8,831.84 8,831.84 6,168.1615,000.00 15,000.006703 - Miscellaneous Revenues
8,991.00 36,342.00 36,342.00 -8,342.003,000.00 28,000.006704 - Gain/Loss on Asset Sale
0.00 0.00 0.00 9,000.009,000.00 9,000.006705 - Sale Of Recyclable Materials
0.00 29,628.72 29,628.72 25,371.2855,000.00 55,000.006707 - User Fee Income Solid Waste
0.00 0.00 0.00 151,600.00151,600.00 151,600.006715 - Other Financing Source
10,273.72 77,302.56 77,302.56 183,297.44234,600.00 260,600.00RevenueType: 70 - Other Total:
RevenueType: 90 - Transfers
0.00 0.00 0.00 573,216.00573,216.00 573,216.006903 - Tsfs In - Fr Gas Tax Fund
0.00 0.45 0.45 -0.450.00 0.006907 - Tsfs In - Fr CFD Bond Fund
0.00 0.45 0.45 573,215.55573,216.00 573,216.00RevenueType: 90 - Transfers Total:
4,674,496.81 30,361,846.16 30,361,846.16 7,842,831.8436,877,116.00 38,204,678.00Revenue Total:
B. FY18 YTD Activity by Fund For Fiscal: 2017-2018 Period Ending: 04/30/2018
MTD Activity YTD ActivityYTD Activity +
EncumbrancesBudget
RemainingRevenueObject;ExpenseObjectCurrent
Total BudgetOriginal
Total Budget
Expense
ExpenseType: 10 - Personnel
445,268.28 5,090,739.52 5,090,739.52 1,181,850.486,507,758.00 6,272,590.001010 - Salaries
12,189.11 135,301.04 135,301.04 43,898.96167,333.00 179,200.001030 - Hourly
1,714.54 68,482.59 68,482.59 20,517.4187,000.00 89,000.001050 - Overtime
692.30 7,615.30 7,615.30 1,384.709,000.00 9,000.001070 - Stipends
75,202.23 773,934.89 773,934.89 214,968.111,013,460.00 988,903.001100 - Benefits
42,219.35 648,796.32 648,796.32 119,461.68787,489.00 768,258.001120 - Retirement Benefits
7,017.32 80,729.25 80,729.25 14,288.7598,180.00 95,018.001140 - Medi-tax 1.45%
0.00 0.00 0.00 0.00-200,000.00 0.001199 - Organizational Review Savings
8,526.82 62,853.61 62,853.61 29,870.390.00 92,724.001200 - Outside Assistance
0.00 0.00 0.00 0.000.00 0.001990 - Personnel Allocation
592,829.95 6,868,452.52 6,868,452.52 1,626,240.488,470,220.00 8,494,693.00ExpenseType: 10 - Personnel Total:
ExpenseType: 20 - Materials & Services
9,844.58 87,913.59 103,483.11 25,206.89128,690.00 128,690.002010 - Communications
26,288.42 429,631.54 534,230.05 82,081.95340,270.00 616,312.002030 - Equipment Maintenance
3,297.98 11,071.74 11,071.74 5,828.2616,900.00 16,900.002040 - Copier Usage
36,452.94 107,445.23 121,945.13 2,006.87123,952.00 123,952.002050 - Vehicle Maintenance
10,883.95 60,464.56 70,510.82 37,464.18102,625.00 107,975.002070 - Office Supplies
655.00 56,656.22 56,656.22 9,033.7855,090.00 65,690.002090 - Memberships & Dues
18,957.41 284,317.66 314,662.65 169,750.35504,413.00 484,413.002110 - Operating Supplies
60.04 12,597.62 13,644.35 8,300.6521,945.00 21,945.002130 - Books & Subscriptions
1,104.00 26,224.93 26,224.93 36,225.0762,450.00 62,450.002150 - Training
153.87 11,736.93 18,471.25 14,128.7532,600.00 32,600.002170 - Postage
2,103.69 16,663.96 19,300.00 36,310.0046,800.00 55,610.002190 - Facil & Equip Lease/Rent
91,076.76 941,294.12 1,197,772.61 37,902.391,235,675.00 1,235,675.002210 - Utilities
134,897.25 1,776,889.20 2,518,444.84 887,936.162,384,004.00 3,406,381.002230 - Professional Services
104,745.18 519,046.31 531,968.68 148,031.32305,000.00 680,000.002240 - Reimbursable Costs
5,904.90 30,528.46 35,316.18 7,783.8243,100.00 43,100.002250 - Advertising
4,031.21 53,390.80 53,390.80 33,909.2092,650.00 87,300.002270 - Travel, Conf. & Meetings
3,928.71 49,450.96 49,450.96 13,749.0463,200.00 63,200.002290 - Auto Allowance
-90,000.00 776,773.10 952,239.35 269,760.65862,000.00 1,222,000.002310 - City Attorney
1,019,945.65 10,179,624.64 12,162,051.21 -89,338.2112,072,713.00 12,072,713.002330 - Police Services
6,623.00 35,615.78 37,515.00 0.0037,515.00 37,515.002340 - Parking Lot Leases
132,752.58 841,615.28 1,426,618.53 881.471,377,500.00 1,427,500.002350 - Street Maintenance
15,258.81 568,609.46 571,415.61 61,334.39632,750.00 632,750.002410 - Community Activities
1,580.09 73,341.53 73,341.53 10,658.4784,000.00 84,000.002430 - Recreation Programs
55,702.19 602,480.05 765,803.72 64,196.28680,000.00 830,000.002450 - Landscape Maintenance
76,068.00 378,058.00 500,000.00 50,000.00600,000.00 550,000.002470 - Tree Maintenance
18,300.00 180,615.12 251,120.00 7,285.00258,405.00 258,405.002490 - Street Sweeping
55,666.06 422,998.12 805,958.34 40,541.66821,500.00 846,500.002510 - Storm Drains
52,552.25 96,441.16 179,160.10 8,839.90188,000.00 188,000.002530 - Safety Lighting
142,170.61 835,248.61 1,014,206.28 80,793.721,095,000.00 1,095,000.002550 - Park Maintenance
7,877.48 112,438.99 156,796.11 85,703.89194,500.00 242,500.002590 - Data Technology
226.99 20,738.99 20,738.99 21,061.0124,500.00 41,800.002600 - Marketing
0.00 0.00 0.00 123,000.00250,000.00 123,000.002999 - Operations Contingency
1,949,109.60 19,599,922.66 24,593,509.09 2,290,366.9124,737,747.00 26,883,876.00ExpenseType: 20 - Materials & Services Total:
ExpenseType: 30 - Capital Outlay
0.00 25,000.00 25,000.00 35,000.000.00 60,000.003010 - Furniture & Equipment
0.00 121.51 121.51 -121.510.00 0.003030 - Facilities Improvements
0.00 0.00 0.00 60,947.000.00 60,947.003050 - Park Structures & Improvemnts
0.00 25,121.51 25,121.51 95,825.490.00 120,947.00ExpenseType: 30 - Capital Outlay Total:
ExpenseType: 40 - Insurance
2,170.00 483,297.26 483,297.26 5,702.74489,000.00 489,000.004010 - Liability Insur Premiums
0.00 59,885.00 59,885.00 5,115.0065,000.00 65,000.004030 - Property Insurance Premiums
0.00 1,060.00 1,060.00 140.001,200.00 1,200.004050 - Employee Bond Premiums
0.00 164.50 164.50 -164.500.00 0.004090 - Litigation
0.00 115,980.00 115,980.00 20.00116,000.00 116,000.004110 - Workers' Compensation
B. FY18 YTD Activity by Fund For Fiscal: 2017-2018 Period Ending: 04/30/2018
MTD Activity YTD ActivityYTD Activity +
EncumbrancesBudget
RemainingRevenueObject;ExpenseObjectCurrent
Total BudgetOriginal
Total Budget
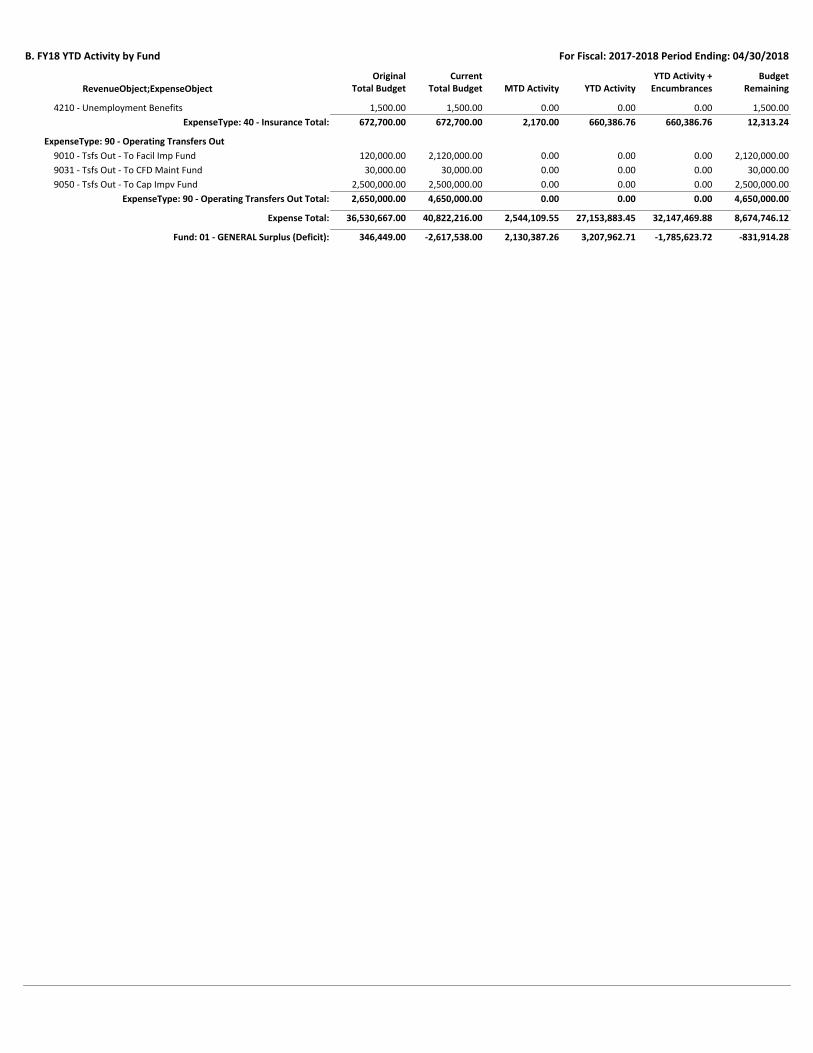
0.00 0.00 0.00 1,500.001,500.00 1,500.004210 - Unemployment Benefits
2,170.00 660,386.76 660,386.76 12,313.24672,700.00 672,700.00ExpenseType: 40 - Insurance Total:
ExpenseType: 90 - Operating Transfers Out
0.00 0.00 0.00 2,120,000.00120,000.00 2,120,000.009010 - Tsfs Out - To Facil Imp Fund
0.00 0.00 0.00 30,000.0030,000.00 30,000.009031 - Tsfs Out - To CFD Maint Fund
0.00 0.00 0.00 2,500,000.002,500,000.00 2,500,000.009050 - Tsfs Out - To Cap Impv Fund
0.00 0.00 0.00 4,650,000.002,650,000.00 4,650,000.00ExpenseType: 90 - Operating Transfers Out Total:
2,544,109.55 27,153,883.45 32,147,469.88 8,674,746.1236,530,667.00 40,822,216.00Expense Total:
2,130,387.26 3,207,962.71 -1,785,623.72 -831,914.28346,449.00 -2,617,538.00Fund: 01 - GENERAL Surplus (Deficit):
B. FY18 YTD Activity by Fund For Fiscal: 2017-2018 Period Ending: 04/30/2018
MTD Activity YTD ActivityYTD Activity +
EncumbrancesBudget
RemainingRevenueObject;ExpenseObjectCurrent
Total BudgetOriginal
Total Budget
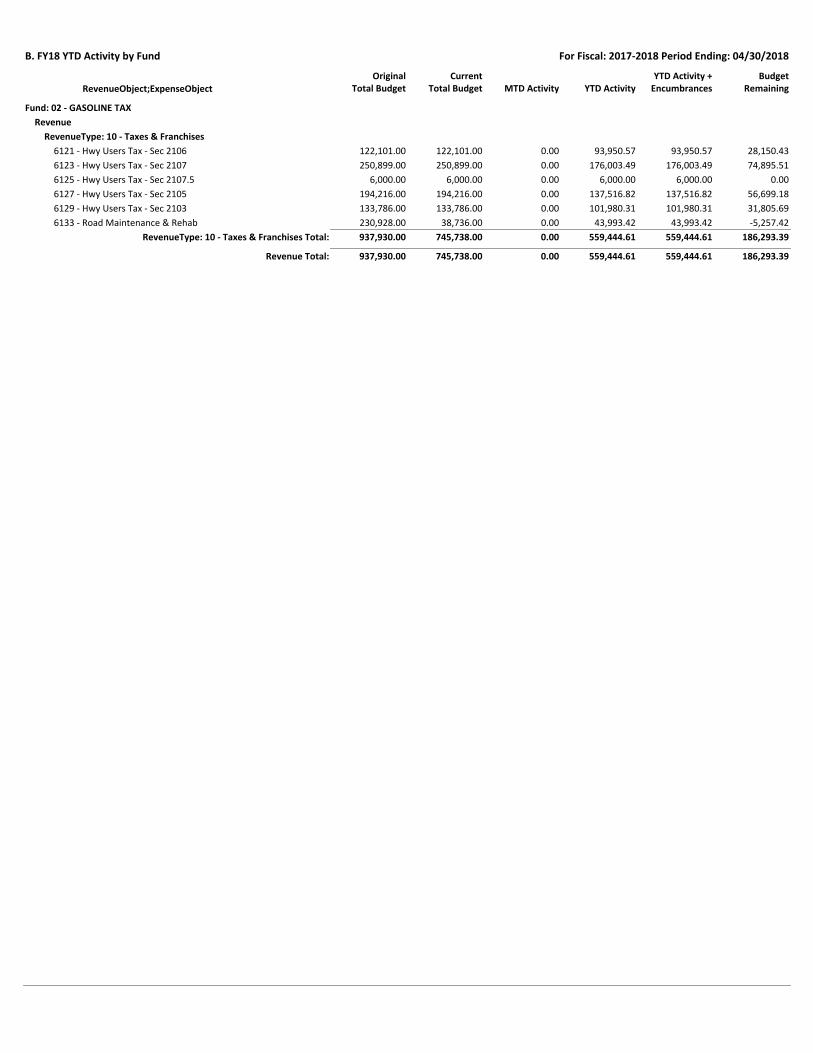
Fund: 02 - GASOLINE TAX
Revenue
RevenueType: 10 - Taxes & Franchises
0.00 93,950.57 93,950.57 28,150.43122,101.00 122,101.006121 - Hwy Users Tax - Sec 2106
0.00 176,003.49 176,003.49 74,895.51250,899.00 250,899.006123 - Hwy Users Tax - Sec 2107
0.00 6,000.00 6,000.00 0.006,000.00 6,000.006125 - Hwy Users Tax - Sec 2107.5
0.00 137,516.82 137,516.82 56,699.18194,216.00 194,216.006127 - Hwy Users Tax - Sec 2105
0.00 101,980.31 101,980.31 31,805.69133,786.00 133,786.006129 - Hwy Users Tax - Sec 2103
0.00 43,993.42 43,993.42 -5,257.42230,928.00 38,736.006133 - Road Maintenance & Rehab
0.00 559,444.61 559,444.61 186,293.39937,930.00 745,738.00RevenueType: 10 - Taxes & Franchises Total:
0.00 559,444.61 559,444.61 186,293.39937,930.00 745,738.00Revenue Total:

B. FY18 YTD Activity by Fund For Fiscal: 2017-2018 Period Ending: 04/30/2018
MTD Activity YTD ActivityYTD Activity +
EncumbrancesBudget
RemainingRevenueObject;ExpenseObjectCurrent
Total BudgetOriginal
Total Budget
Expense
ExpenseType: 90 - Operating Transfers Out
0.00 0.00 0.00 573,216.00573,216.00 573,216.009030 - Transfers Out to General Fund
0.00 0.00 0.00 172,522.00364,714.00 172,522.009050 - Tsfs Out - To Cap Impv Fund
0.00 0.00 0.00 745,738.00937,930.00 745,738.00ExpenseType: 90 - Operating Transfers Out Total:
0.00 0.00 0.00 745,738.00937,930.00 745,738.00Expense Total:
0.00 559,444.61 559,444.61 -559,444.610.00 0.00Fund: 02 - GASOLINE TAX Surplus (Deficit):
B. FY18 YTD Activity by Fund For Fiscal: 2017-2018 Period Ending: 04/30/2018
MTD Activity YTD ActivityYTD Activity +
EncumbrancesBudget
RemainingRevenueObject;ExpenseObjectCurrent
Total BudgetOriginal
Total Budget
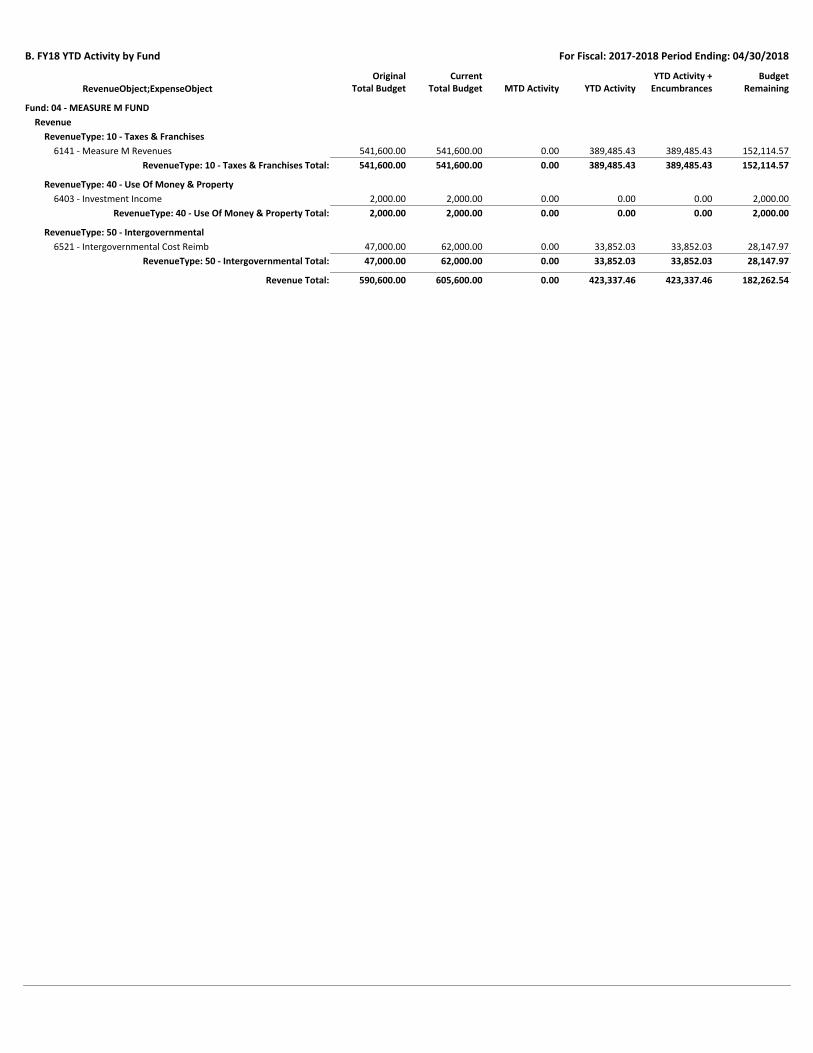
Fund: 04 - MEASURE M FUND
Revenue
RevenueType: 10 - Taxes & Franchises
0.00 389,485.43 389,485.43 152,114.57541,600.00 541,600.006141 - Measure M Revenues
0.00 389,485.43 389,485.43 152,114.57541,600.00 541,600.00RevenueType: 10 - Taxes & Franchises Total:
RevenueType: 40 - Use Of Money & Property
0.00 0.00 0.00 2,000.002,000.00 2,000.006403 - Investment Income
0.00 0.00 0.00 2,000.002,000.00 2,000.00RevenueType: 40 - Use Of Money & Property Total:
RevenueType: 50 - Intergovernmental
0.00 33,852.03 33,852.03 28,147.9747,000.00 62,000.006521 - Intergovernmental Cost Reimb
0.00 33,852.03 33,852.03 28,147.9747,000.00 62,000.00RevenueType: 50 - Intergovernmental Total:
0.00 423,337.46 423,337.46 182,262.54590,600.00 605,600.00Revenue Total:

B. FY18 YTD Activity by Fund For Fiscal: 2017-2018 Period Ending: 04/30/2018
MTD Activity YTD ActivityYTD Activity +
EncumbrancesBudget
RemainingRevenueObject;ExpenseObjectCurrent
Total BudgetOriginal
Total Budget
Expense
ExpenseType: 20 - Materials & Services
5,322.81 46,250.59 46,250.59 15,749.4147,000.00 62,000.002230 - Professional Services
5,322.81 46,250.59 46,250.59 15,749.4147,000.00 62,000.00ExpenseType: 20 - Materials & Services Total:
ExpenseType: 90 - Operating Transfers Out
0.00 0.00 0.00 541,600.00541,600.00 541,600.009050 - Tsfs Out - To Cap Impv Fund
0.00 0.00 0.00 541,600.00541,600.00 541,600.00ExpenseType: 90 - Operating Transfers Out Total:
5,322.81 46,250.59 46,250.59 557,349.41588,600.00 603,600.00Expense Total:
-5,322.81 377,086.87 377,086.87 -375,086.872,000.00 2,000.00Fund: 04 - MEASURE M FUND Surplus (Deficit):

B. FY18 YTD Activity by Fund For Fiscal: 2017-2018 Period Ending: 04/30/2018
MTD Activity YTD ActivityYTD Activity +
EncumbrancesBudget
RemainingRevenueObject;ExpenseObjectCurrent
Total BudgetOriginal
Total Budget
Fund: 05 - AB2766 - CLEAN AIR ACT
Revenue
RevenueType: 40 - Use Of Money & Property
0.00 0.00 0.00 3,000.003,000.00 3,000.006403 - Investment Income
0.00 0.00 0.00 3,000.003,000.00 3,000.00RevenueType: 40 - Use Of Money & Property Total:
RevenueType: 50 - Intergovernmental
0.00 20,881.95 20,881.95 19,118.0540,000.00 40,000.006521 - Intergovernmental Cost Reimb
0.00 20,881.95 20,881.95 19,118.0540,000.00 40,000.00RevenueType: 50 - Intergovernmental Total:
0.00 20,881.95 20,881.95 22,118.0543,000.00 43,000.00Revenue Total:
0.00 20,881.95 20,881.95 22,118.0543,000.00 43,000.00Fund: 05 - AB2766 - CLEAN AIR ACT Total:

B. FY18 YTD Activity by Fund For Fiscal: 2017-2018 Period Ending: 04/30/2018
MTD Activity YTD ActivityYTD Activity +
EncumbrancesBudget
RemainingRevenueObject;ExpenseObjectCurrent
Total BudgetOriginal
Total Budget
Fund: 06 - COASTAL TRANSIT
Revenue
RevenueType: 40 - Use Of Money & Property
0.00 0.00 0.00 7,000.007,000.00 7,000.006403 - Investment Income
0.00 0.00 0.00 7,000.007,000.00 7,000.00RevenueType: 40 - Use Of Money & Property Total:
RevenueType: 50 - Intergovernmental
0.00 402,664.28 402,664.28 147,335.72550,000.00 550,000.006521 - Intergovernmental Cost Reimb
0.00 402,664.28 402,664.28 147,335.72550,000.00 550,000.00RevenueType: 50 - Intergovernmental Total:
RevenueType: 60 - Charges For Services
0.00 19,054.84 19,054.84 -19,054.840.00 0.006685 - Reimbursed Expenses
0.00 19,054.84 19,054.84 -19,054.840.00 0.00RevenueType: 60 - Charges For Services Total:
0.00 421,719.12 421,719.12 135,280.88557,000.00 557,000.00Revenue Total:

B. FY18 YTD Activity by Fund For Fiscal: 2017-2018 Period Ending: 04/30/2018
MTD Activity YTD ActivityYTD Activity +
EncumbrancesBudget
RemainingRevenueObject;ExpenseObjectCurrent
Total BudgetOriginal
Total Budget
Expense
ExpenseType: 20 - Materials & Services
6,870.00 427,998.87 440,628.77 294,526.23735,155.00 735,155.002230 - Professional Services
6,870.00 427,998.87 440,628.77 294,526.23735,155.00 735,155.00ExpenseType: 20 - Materials & Services Total:
6,870.00 427,998.87 440,628.77 294,526.23735,155.00 735,155.00Expense Total:
-6,870.00 -6,279.75 -18,909.65 -159,245.35-178,155.00 -178,155.00Fund: 06 - COASTAL TRANSIT Surplus (Deficit):

B. FY18 YTD Activity by Fund For Fiscal: 2017-2018 Period Ending: 04/30/2018
MTD Activity YTD ActivityYTD Activity +
EncumbrancesBudget
RemainingRevenueObject;ExpenseObjectCurrent
Total BudgetOriginal
Total Budget
Fund: 07 - TBID
Revenue
RevenueType: 10 - Taxes & Franchises
82,998.00 834,751.98 834,751.98 165,248.021,000,000.00 1,000,000.006115 - TBID Taxes
82,998.00 834,751.98 834,751.98 165,248.021,000,000.00 1,000,000.00RevenueType: 10 - Taxes & Franchises Total:
RevenueType: 40 - Use Of Money & Property
0.00 0.00 0.00 12,000.0012,000.00 12,000.006403 - Investment Income
0.00 0.00 0.00 12,000.0012,000.00 12,000.00RevenueType: 40 - Use Of Money & Property Total:
82,998.00 834,751.98 834,751.98 177,248.021,012,000.00 1,012,000.00Revenue Total:

B. FY18 YTD Activity by Fund For Fiscal: 2017-2018 Period Ending: 04/30/2018
MTD Activity YTD ActivityYTD Activity +
EncumbrancesBudget
RemainingRevenueObject;ExpenseObjectCurrent
Total BudgetOriginal
Total Budget
Expense
ExpenseType: 20 - Materials & Services
0.00 590,157.96 590,157.96 659,842.041,250,000.00 1,250,000.002573 - TBID Expenditures
0.00 590,157.96 590,157.96 659,842.041,250,000.00 1,250,000.00ExpenseType: 20 - Materials & Services Total:
0.00 590,157.96 590,157.96 659,842.041,250,000.00 1,250,000.00Expense Total:
82,998.00 244,594.02 244,594.02 -482,594.02-238,000.00 -238,000.00Fund: 07 - TBID Surplus (Deficit):

B. FY18 YTD Activity by Fund For Fiscal: 2017-2018 Period Ending: 04/30/2018
MTD Activity YTD ActivityYTD Activity +
EncumbrancesBudget
RemainingRevenueObject;ExpenseObjectCurrent
Total BudgetOriginal
Total Budget
Fund: 08 - ROAD MAINTENANCE AND REHAB
Revenue
RevenueType: 10 - Taxes & Franchises
25,113.86 63,436.08 63,436.08 128,755.920.00 192,192.006133 - Road Maintenance & Rehab
25,113.86 63,436.08 63,436.08 128,755.920.00 192,192.00RevenueType: 10 - Taxes & Franchises Total:
25,113.86 63,436.08 63,436.08 128,755.920.00 192,192.00Revenue Total:

B. FY18 YTD Activity by Fund For Fiscal: 2017-2018 Period Ending: 04/30/2018
MTD Activity YTD ActivityYTD Activity +
EncumbrancesBudget
RemainingRevenueObject;ExpenseObjectCurrent
Total BudgetOriginal
Total Budget
Expense
ExpenseType: 90 - Operating Transfers Out
0.00 0.00 0.00 192,192.000.00 192,192.009050 - Tsfs Out - To Cap Impv Fund
0.00 0.00 0.00 192,192.000.00 192,192.00ExpenseType: 90 - Operating Transfers Out Total:
0.00 0.00 0.00 192,192.000.00 192,192.00Expense Total:
25,113.86 63,436.08 63,436.08 -63,436.080.00 0.00Fund: 08 - ROAD MAINTENANCE AND REHAB Surplus (Deficit):

B. FY18 YTD Activity by Fund For Fiscal: 2017-2018 Period Ending: 04/30/2018
MTD Activity YTD ActivityYTD Activity +
EncumbrancesBudget
RemainingRevenueObject;ExpenseObjectCurrent
Total BudgetOriginal
Total Budget
Fund: 09 - CFD ESHA
Revenue
RevenueType: 40 - Use Of Money & Property
30,000.00 30,000.00 30,000.00 1,450.0031,450.00 31,450.006403 - Investment Income
30,000.00 30,000.00 30,000.00 1,450.0031,450.00 31,450.00RevenueType: 40 - Use Of Money & Property Total:
30,000.00 30,000.00 30,000.00 1,450.0031,450.00 31,450.00Revenue Total:

B. FY18 YTD Activity by Fund For Fiscal: 2017-2018 Period Ending: 04/30/2018
MTD Activity YTD ActivityYTD Activity +
EncumbrancesBudget
RemainingRevenueObject;ExpenseObjectCurrent
Total BudgetOriginal
Total Budget
Expense
ExpenseType: 20 - Materials & Services
0.00 0.00 0.00 22,700.0022,700.00 22,700.002550 - Park Maintenance
0.00 0.00 0.00 22,700.0022,700.00 22,700.00ExpenseType: 20 - Materials & Services Total:
0.00 0.00 0.00 22,700.0022,700.00 22,700.00Expense Total:
30,000.00 30,000.00 30,000.00 -21,250.008,750.00 8,750.00Fund: 09 - CFD ESHA Surplus (Deficit):

B. FY18 YTD Activity by Fund For Fiscal: 2017-2018 Period Ending: 04/30/2018
MTD Activity YTD ActivityYTD Activity +
EncumbrancesBudget
RemainingRevenueObject;ExpenseObjectCurrent
Total BudgetOriginal
Total Budget
Fund: 11 - CAPITAL IMPROVEMENTS
Revenue
RevenueType: 60 - Charges For Services
0.00 5,026.60 5,026.60 -5,026.600.00 0.006685 - Reimbursed Expenses
0.00 5,026.60 5,026.60 -5,026.600.00 0.00RevenueType: 60 - Charges For Services Total:
RevenueType: 90 - Transfers
0.00 0.00 0.00 2,500,000.002,500,000.00 2,500,000.006901 - Tsfs In - Fr General Fund
0.00 0.00 0.00 172,522.00364,714.00 172,522.006903 - Tsfs In - Fr Gas Tax Fund
0.00 0.00 0.00 541,600.00541,600.00 541,600.006904 - Tsfs In - Fr Measure M Fund
0.00 0.00 0.00 192,192.000.00 192,192.006908 - Tsfs In - Fr Road Maint & Rehab Fund
0.00 0.00 0.00 3,406,314.003,406,314.00 3,406,314.00RevenueType: 90 - Transfers Total:
0.00 5,026.60 5,026.60 3,401,287.403,406,314.00 3,406,314.00Revenue Total:

B. FY18 YTD Activity by Fund For Fiscal: 2017-2018 Period Ending: 04/30/2018
MTD Activity YTD ActivityYTD Activity +
EncumbrancesBudget
RemainingRevenueObject;ExpenseObjectCurrent
Total BudgetOriginal
Total Budget
Expense
ExpenseType: 30 - Capital Outlay
23,397.86 1,750,394.03 3,760,988.43 2,760,329.574,975,000.00 6,521,318.003110 - Construction in Progress
23,397.86 1,750,394.03 3,760,988.43 2,760,329.574,975,000.00 6,521,318.00ExpenseType: 30 - Capital Outlay Total:
23,397.86 1,750,394.03 3,760,988.43 2,760,329.574,975,000.00 6,521,318.00Expense Total:
-23,397.86 -1,745,367.43 -3,755,961.83 640,957.83-1,568,686.00 -3,115,004.00Fund: 11 - CAPITAL IMPROVEMENTS Surplus (Deficit):

B. FY18 YTD Activity by Fund For Fiscal: 2017-2018 Period Ending: 04/30/2018
MTD Activity YTD ActivityYTD Activity +
EncumbrancesBudget
RemainingRevenueObject;ExpenseObjectCurrent
Total BudgetOriginal
Total Budget
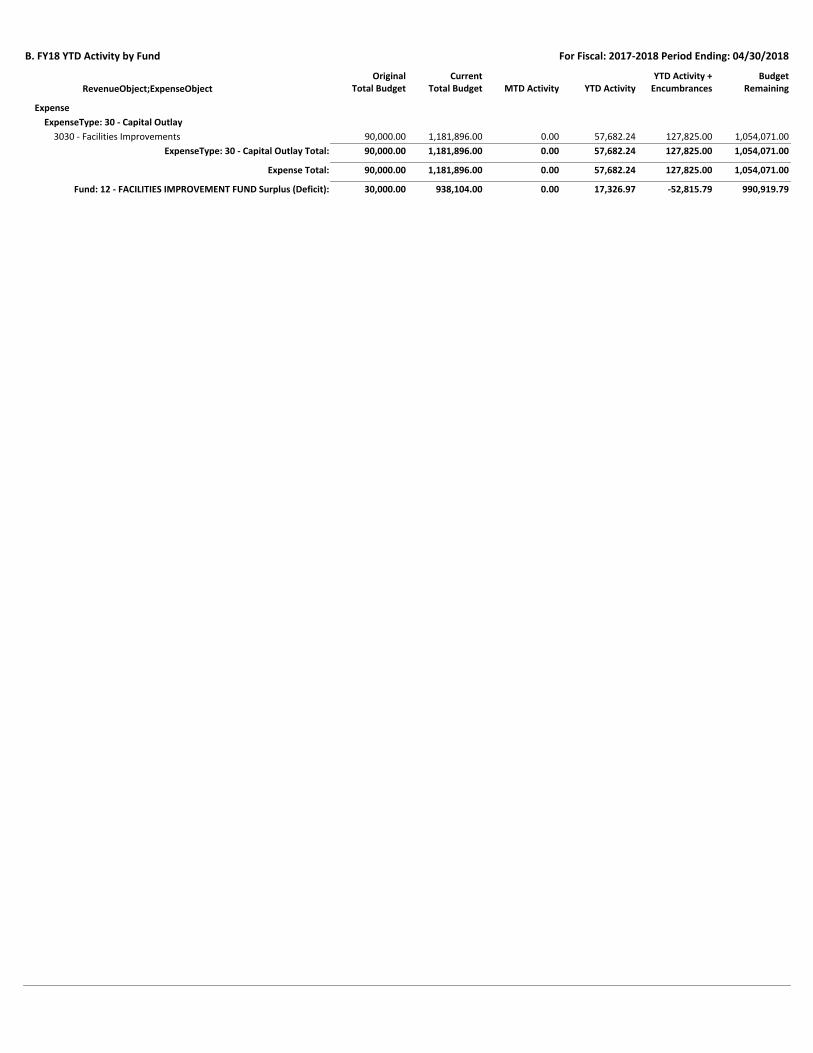
Fund: 12 - FACILITIES IMPROVEMENT FUND
Revenue
RevenueType: 10 - Taxes & Franchises
0.00 75,009.21 75,009.21 -75,009.210.00 0.006106 - PEG Franchise Fees
0.00 75,009.21 75,009.21 -75,009.210.00 0.00RevenueType: 10 - Taxes & Franchises Total:
RevenueType: 90 - Transfers
0.00 0.00 0.00 2,120,000.00120,000.00 2,120,000.006901 - Tsfs In - Fr General Fund
0.00 0.00 0.00 2,120,000.00120,000.00 2,120,000.00RevenueType: 90 - Transfers Total:
0.00 75,009.21 75,009.21 2,044,990.79120,000.00 2,120,000.00Revenue Total:
B. FY18 YTD Activity by Fund For Fiscal: 2017-2018 Period Ending: 04/30/2018
MTD Activity YTD ActivityYTD Activity +
EncumbrancesBudget
RemainingRevenueObject;ExpenseObjectCurrent
Total BudgetOriginal
Total Budget
Expense
ExpenseType: 30 - Capital Outlay
0.00 57,682.24 127,825.00 1,054,071.0090,000.00 1,181,896.003030 - Facilities Improvements
0.00 57,682.24 127,825.00 1,054,071.0090,000.00 1,181,896.00ExpenseType: 30 - Capital Outlay Total:
0.00 57,682.24 127,825.00 1,054,071.0090,000.00 1,181,896.00Expense Total:
0.00 17,326.97 -52,815.79 990,919.7930,000.00 938,104.00Fund: 12 - FACILITIES IMPROVEMENT FUND Surplus (Deficit):

B. FY18 YTD Activity by Fund For Fiscal: 2017-2018 Period Ending: 04/30/2018
MTD Activity YTD ActivityYTD Activity +
EncumbrancesBudget
RemainingRevenueObject;ExpenseObjectCurrent
Total BudgetOriginal
Total Budget
Fund: 25 - SUPP LAW ENFORCEMENT SERVICES
Revenue
RevenueType: 50 - Intergovernmental
3,630.55 136,532.04 136,532.04 -6,961.040.00 129,571.006501 - Citizens Opt For Public Sfty
3,630.55 136,532.04 136,532.04 -6,961.040.00 129,571.00RevenueType: 50 - Intergovernmental Total:
RevenueType: 60 - Charges For Services
0.00 3,274.00 3,274.00 0.000.00 3,274.006685 - Reimbursed Expenses
0.00 3,274.00 3,274.00 0.000.00 3,274.00RevenueType: 60 - Charges For Services Total:
3,630.55 139,806.04 139,806.04 -6,961.040.00 132,845.00Revenue Total:

B. FY18 YTD Activity by Fund For Fiscal: 2017-2018 Period Ending: 04/30/2018
MTD Activity YTD ActivityYTD Activity +
EncumbrancesBudget
RemainingRevenueObject;ExpenseObjectCurrent
Total BudgetOriginal
Total Budget
Expense
ExpenseType: 20 - Materials & Services
24,611.56 135,216.71 135,216.71 60,879.290.00 196,096.002572 - Slesf Program Operating Exp
24,611.56 135,216.71 135,216.71 60,879.290.00 196,096.00ExpenseType: 20 - Materials & Services Total:
24,611.56 135,216.71 135,216.71 60,879.290.00 196,096.00Expense Total:
-20,981.01 4,589.33 4,589.33 -67,840.330.00 -63,251.00Fund: 25 - SUPP LAW ENFORCEMENT SERVICES Surplus (Deficit):

B. FY18 YTD Activity by Fund For Fiscal: 2017-2018 Period Ending: 04/30/2018
MTD Activity YTD ActivityYTD Activity +
EncumbrancesBudget
RemainingRevenueObject;ExpenseObjectCurrent
Total BudgetOriginal
Total Budget
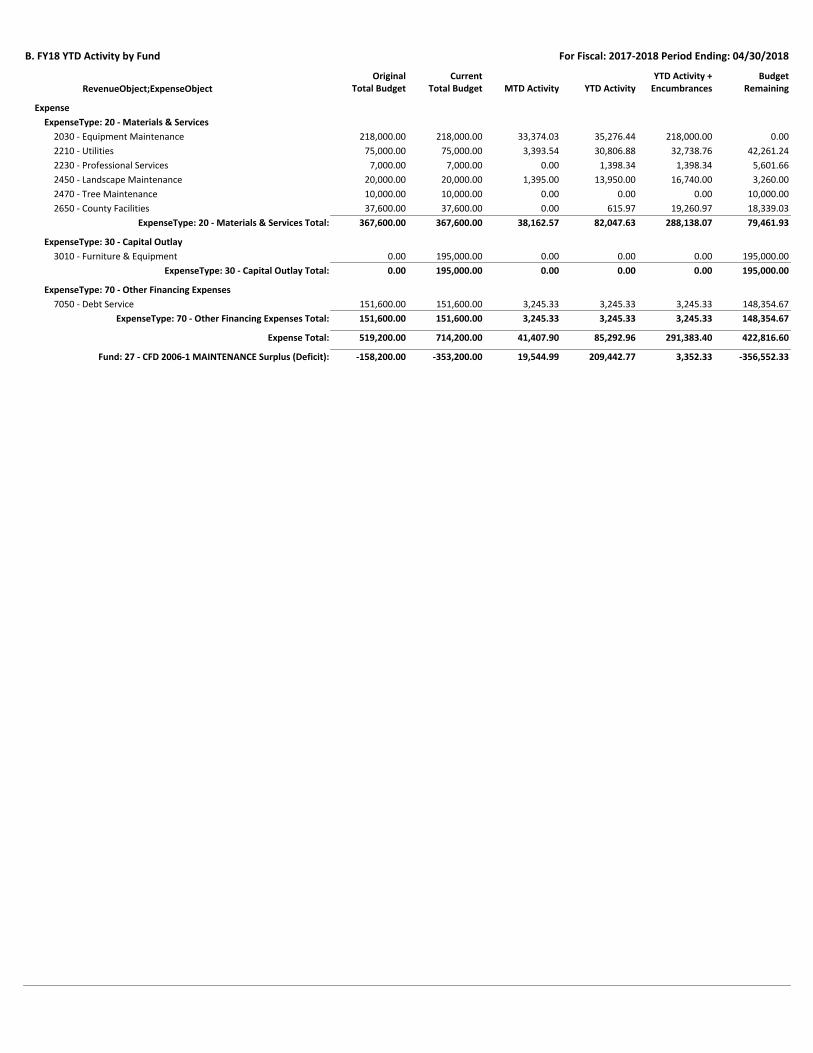
Fund: 27 - CFD 2006-1 MAINTENANCE
Revenue
RevenueType: 40 - Use Of Money & Property
0.00 0.00 0.00 7,000.007,000.00 7,000.006403 - Investment Income
0.00 0.00 0.00 7,000.007,000.00 7,000.00RevenueType: 40 - Use Of Money & Property Total:
RevenueType: 60 - Charges For Services
60,952.89 294,735.73 294,735.73 29,264.27324,000.00 324,000.006686 - Charges for Services
60,952.89 294,735.73 294,735.73 29,264.27324,000.00 324,000.00RevenueType: 60 - Charges For Services Total:
RevenueType: 90 - Transfers
0.00 0.00 0.00 30,000.0030,000.00 30,000.006901 - Tsfs In - Fr General Fund
0.00 0.00 0.00 30,000.0030,000.00 30,000.00RevenueType: 90 - Transfers Total:
60,952.89 294,735.73 294,735.73 66,264.27361,000.00 361,000.00Revenue Total:
B. FY18 YTD Activity by Fund For Fiscal: 2017-2018 Period Ending: 04/30/2018
MTD Activity YTD ActivityYTD Activity +
EncumbrancesBudget
RemainingRevenueObject;ExpenseObjectCurrent
Total BudgetOriginal
Total Budget
Expense
ExpenseType: 20 - Materials & Services
33,374.03 35,276.44 218,000.00 0.00218,000.00 218,000.002030 - Equipment Maintenance
3,393.54 30,806.88 32,738.76 42,261.2475,000.00 75,000.002210 - Utilities
0.00 1,398.34 1,398.34 5,601.667,000.00 7,000.002230 - Professional Services
1,395.00 13,950.00 16,740.00 3,260.0020,000.00 20,000.002450 - Landscape Maintenance
0.00 0.00 0.00 10,000.0010,000.00 10,000.002470 - Tree Maintenance
0.00 615.97 19,260.97 18,339.0337,600.00 37,600.002650 - County Facilities
38,162.57 82,047.63 288,138.07 79,461.93367,600.00 367,600.00ExpenseType: 20 - Materials & Services Total:
ExpenseType: 30 - Capital Outlay
0.00 0.00 0.00 195,000.000.00 195,000.003010 - Furniture & Equipment
0.00 0.00 0.00 195,000.000.00 195,000.00ExpenseType: 30 - Capital Outlay Total:
ExpenseType: 70 - Other Financing Expenses
3,245.33 3,245.33 3,245.33 148,354.67151,600.00 151,600.007050 - Debt Service
3,245.33 3,245.33 3,245.33 148,354.67151,600.00 151,600.00ExpenseType: 70 - Other Financing Expenses Total:
41,407.90 85,292.96 291,383.40 422,816.60519,200.00 714,200.00Expense Total:
19,544.99 209,442.77 3,352.33 -356,552.33-158,200.00 -353,200.00Fund: 27 - CFD 2006-1 MAINTENANCE Surplus (Deficit):

B. FY18 YTD Activity by Fund For Fiscal: 2017-2018 Period Ending: 04/30/2018
MTD Activity YTD ActivityYTD Activity +
EncumbrancesBudget
RemainingRevenueObject;ExpenseObjectCurrent
Total BudgetOriginal
Total Budget
Fund: 33 - CFD 2013 BONDHOLDER FUND
Expense
ExpenseType: 90 - Operating Transfers Out
0.00 0.45 0.45 -0.450.00 0.009030 - Transfers Out to General Fund
0.00 0.45 0.45 -0.450.00 0.00ExpenseType: 90 - Operating Transfers Out Total:
0.00 0.45 0.45 -0.450.00 0.00Expense Total:
0.00 0.45 0.45 -0.450.00 0.00Fund: 33 - CFD 2013 BONDHOLDER FUND Total:
2,231,472.43 2,983,117.68 -4,309,926.25Total Surplus (Deficit): -1,263,367.75-5,573,294.00-1,712,842.00
B. FY18 YTD Activity by Fund For Fiscal: 2017-2018 Period Ending: 04/30/2018
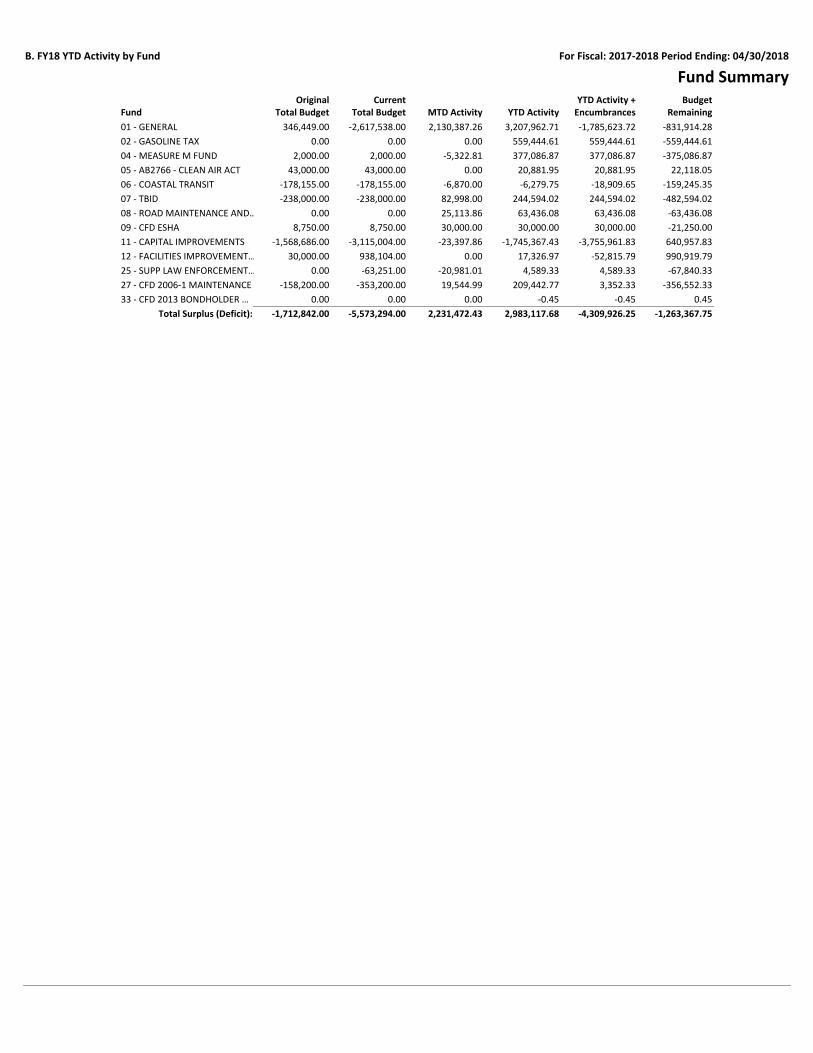
Fund Summary
MTD Activity YTD ActivityYTD Activity +
EncumbrancesBudget
RemainingFundCurrent
Total BudgetOriginal
Total Budget
01 - GENERAL 2,130,387.26 3,207,962.71 -1,785,623.72 -831,914.28-2,617,538.00346,449.00
02 - GASOLINE TAX 0.00 559,444.61 559,444.61 -559,444.610.000.00
04 - MEASURE M FUND -5,322.81 377,086.87 377,086.87 -375,086.872,000.002,000.00
05 - AB2766 - CLEAN AIR ACT 0.00 20,881.95 20,881.95 22,118.0543,000.0043,000.00
06 - COASTAL TRANSIT -6,870.00 -6,279.75 -18,909.65 -159,245.35-178,155.00-178,155.00
07 - TBID 82,998.00 244,594.02 244,594.02 -482,594.02-238,000.00-238,000.00
08 - ROAD MAINTENANCE AND… 25,113.86 63,436.08 63,436.08 -63,436.080.000.00
09 - CFD ESHA 30,000.00 30,000.00 30,000.00 -21,250.008,750.008,750.00
11 - CAPITAL IMPROVEMENTS -23,397.86 -1,745,367.43 -3,755,961.83 640,957.83-3,115,004.00-1,568,686.00
12 - FACILITIES IMPROVEMENT… 0.00 17,326.97 -52,815.79 990,919.79938,104.0030,000.00
25 - SUPP LAW ENFORCEMENT… -20,981.01 4,589.33 4,589.33 -67,840.33-63,251.000.00
27 - CFD 2006-1 MAINTENANCE 19,544.99 209,442.77 3,352.33 -356,552.33-353,200.00-158,200.00
33 - CFD 2013 BONDHOLDER … 0.00 -0.45 -0.45 0.450.000.00
Total Surplus (Deficit): 2,231,472.43 2,983,117.68 -4,309,926.25 -1,263,367.75-5,573,294.00-1,712,842.00
(THIS PAGE INTENTIONALLY LEFT BLANK)

C. CIP Budget vs ActualCity of Dana Point, CA Account Summary
For Fiscal: 2017-2018 Period Ending: 04/30/2018
FiscalActivity
VarianceFavorable
(Unfavorable)Percent
RemainingCurrent
Total BudgetPeriod
ActivityOriginal
Total Budget
Fund: 11 - CAPITAL IMPROVEMENTS
Expense
Arterial Road Rehab & Repairs 24,887.00 0.00 24,887.00 100.00 %0.0011-99-30-1277-3110 0.00
FY17 Annual Res Road Resurf 535,342.00 164,527.21 370,814.79 69.27 %0.0011-99-30-1281-3110 0.00
Crown Valley Median Drought Conver… 163,456.00 81,140.50 82,315.50 50.36 %2,207.0011-99-30-1284-3110 0.00
Capo Beach Connectivity Study Enhan… 77,454.00 0.00 77,454.00 100.00 %0.0011-99-30-1291-3110 0.00
FY18 Citywide Storm Drain Repairs 200,000.00 62,795.50 137,204.50 68.60 %0.0011-99-30-1293-3110 200,000.00
FY18 WQ/Diversion Repairs & Mainte… 50,000.00 0.00 50,000.00 100.00 %0.0011-99-30-1295-3110 50,000.00
FY18 Slurry Seal Program 954,000.00 898,511.05 55,488.95 5.82 %0.0011-99-30-1297-3110 775,000.00
FY18 Roadway Rehabilitation & Repai… 11,000.00 0.00 11,000.00 100.00 %0.0011-99-30-1299-3110 100,000.00
FY18 Sidewalk/Concrete Repairs & A… 10,000.00 0.00 10,000.00 100.00 %0.0011-99-30-1301-3110 100,000.00
FY18 Traffic Safety Repairs & Improv… 100,000.00 21,804.51 78,195.49 78.20 %0.0011-99-30-1303-3110 100,000.00
FY18 Arterial Roadways-Pavement Pr… 1,200,000.00 10,281.78 1,189,718.22 99.14 %10,281.7811-99-30-1305-3110 1,200,000.00
FY18 Annual City Parking Lot Repairs 50,000.00 0.00 50,000.00 100.00 %0.0011-99-30-1307-3110 50,000.00
FY18 Arterial Roadway Resurfacing 3,145,179.00 511,333.48 2,633,845.52 83.74 %10,909.0811-99-30-1310-3110 2,400,000.00
Expense Total: 1,750,394.0323,397.864,975,000.00 6,521,318.00 4,770,923.97 73.16 %
Fund: 11 - CAPITAL IMPROVEMENTS Total: 1,750,394.0323,397.864,975,000.00 6,521,318.00 4,770,923.97 73.16 %
Report Total: 23,397.86 1,750,394.034,975,000.00 6,521,318.00 4,770,923.97 73.16 %

C. CIP Budget vs Actual For Fiscal: 2017-2018 Period Ending: 04/30/2018
Group Summary
FiscalActivity
VarianceFavorable
(Unfavorable)Period
ActivityAccount Typ…Current
Total BudgetOriginal
Total BudgetPercent
Remaining
Fund: 11 - CAPITAL IMPROVEMENTS
Expense 1,750,394.0323,397.864,975,000.00 6,521,318.00 4,770,923.97 73.16 %
1,750,394.0323,397.864,975,000.00 6,521,318.00 4,770,923.97Fund: 11 - CAPITAL IMPROVEMENTS Total: 73.16 %
Report Total: 23,397.86 1,750,394.034,975,000.00 6,521,318.00 4,770,923.97 73.16 %
C. CIP Budget vs Actual For Fiscal: 2017-2018 Period Ending: 04/30/2018
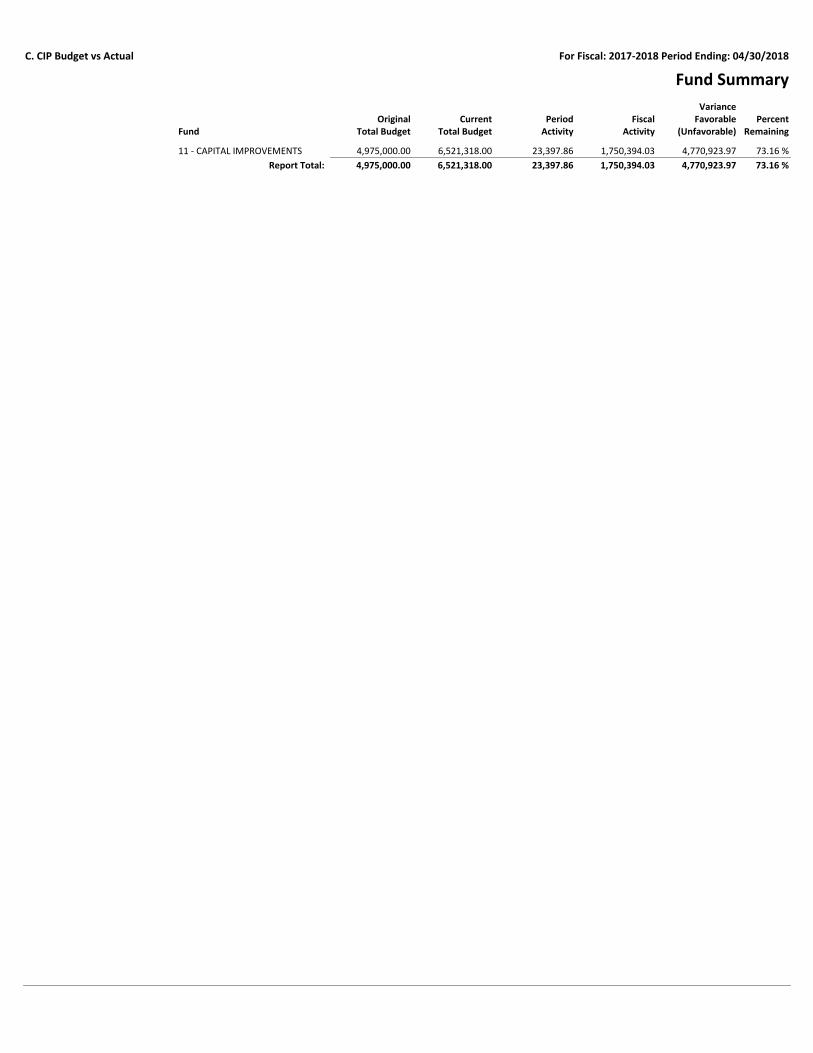
Fund Summary
FiscalActivity
VarianceFavorable
(Unfavorable)FundPeriod
ActivityCurrent
Total BudgetOriginal
Total BudgetPercent
Remaining
11 - CAPITAL IMPROVEMENTS 1,750,394.0323,397.864,975,000.00 6,521,318.00 4,770,923.97 73.16 %
Report Total: 23,397.86 1,750,394.034,975,000.00 6,521,318.00 4,770,923.97 73.16 %

(THIS PAGE INTENTIONALLY LEFT BLANK)

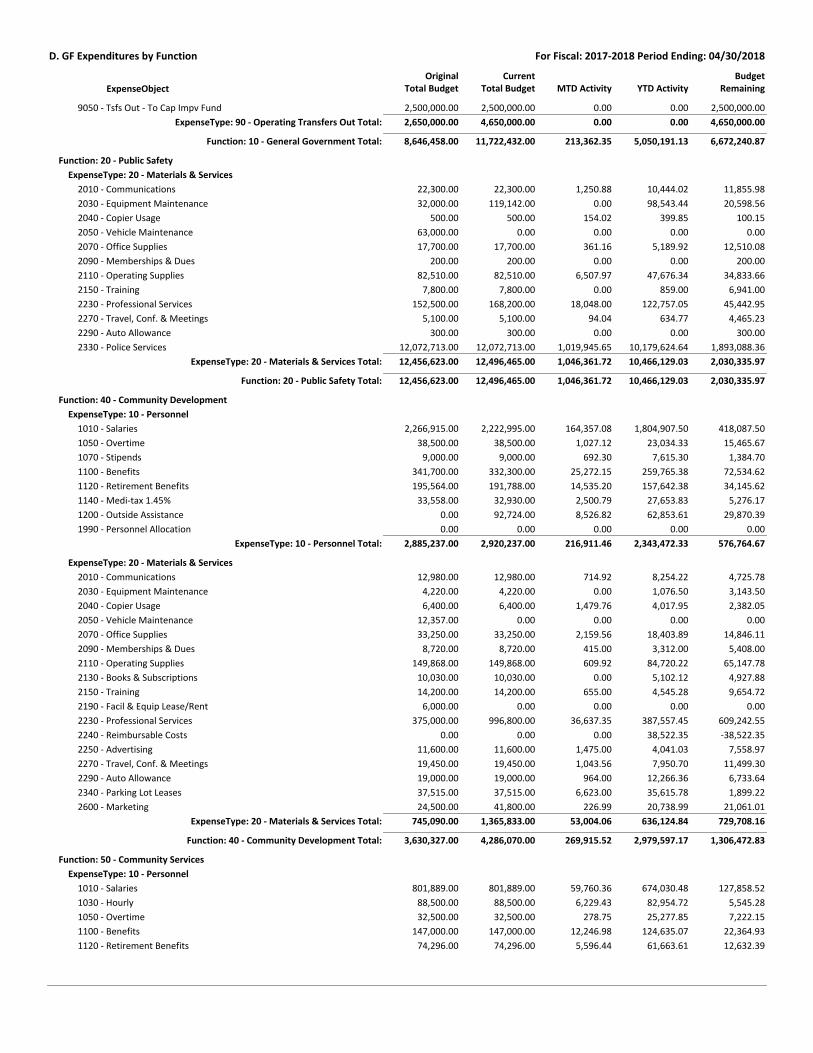
D. GF Expenditures by FunctionCity of Dana Point, CA Group Summary
For Fiscal: 2017-2018 Period Ending: 04/30/2018
MTD Activity YTD ActivityBudget
RemainingExpenseObjectCurrent
Total BudgetOriginal
Total Budget
Fund: 01 - GENERAL
Function: 10 - General Government
ExpenseType: 10 - Personnel
119,149.18 1,395,344.09 330,260.911,723,254.00 1,725,605.001010 - Salaries
5,959.68 52,346.32 24,853.6865,333.00 77,200.001030 - Hourly
408.67 14,806.67 -2,306.6710,500.00 12,500.001050 - Overtime
22,953.56 224,301.55 57,901.45281,760.00 282,203.001100 - Benefits
12,060.07 317,349.63 51,546.37367,195.00 368,896.001120 - Retirement Benefits
1,905.21 22,222.54 4,137.4626,087.00 26,360.001140 - Medi-tax 1.45%
0.00 0.00 0.00-200,000.00 0.001199 - Organizational Review Savings
0.00 0.00 0.000.00 0.001990 - Personnel Allocation
162,436.37 2,026,370.80 466,393.202,274,129.00 2,492,764.00ExpenseType: 10 - Personnel Total:
ExpenseType: 20 - Materials & Services
6,760.77 57,506.12 21,893.8879,400.00 79,400.002010 - Communications
26,288.42 330,011.60 162,788.40303,900.00 492,800.002030 - Equipment Maintenance
1,004.66 3,470.77 2,029.235,500.00 5,500.002040 - Copier Usage
36,452.94 107,445.23 16,506.774,200.00 123,952.002050 - Vehicle Maintenance
2,374.98 22,157.70 9,642.3029,800.00 31,800.002070 - Office Supplies
240.00 49,282.72 -1,457.7237,225.00 47,825.002090 - Memberships & Dues
7,814.23 63,099.30 33,935.70117,035.00 97,035.002110 - Operating Supplies
54.09 7,453.85 2,861.1510,315.00 10,315.002130 - Books & Subscriptions
199.00 16,584.56 10,415.4427,000.00 27,000.002150 - Training
153.87 11,590.68 6,409.3218,000.00 18,000.002170 - Postage
2,103.69 16,663.96 32,946.0419,300.00 49,610.002190 - Facil & Equip Lease/Rent
10,310.70 104,480.00 55,420.00159,900.00 159,900.002210 - Utilities
28,448.44 564,597.43 430,183.57808,004.00 994,781.002230 - Professional Services
3,579.90 17,931.68 3,568.3221,500.00 21,500.002250 - Advertising
2,774.66 35,920.57 13,579.4351,500.00 49,500.002270 - Travel, Conf. & Meetings
2,243.15 24,803.80 5,246.2030,050.00 30,050.002290 - Auto Allowance
-90,000.00 776,773.10 445,226.90862,000.00 1,222,000.002310 - City Attorney
75.00 16,100.00 4,400.0020,500.00 20,500.002410 - Community Activities
7,877.48 112,438.99 130,061.01194,500.00 242,500.002590 - Data Technology
0.00 0.00 123,000.00250,000.00 123,000.002999 - Operations Contingency
48,755.98 2,338,312.06 1,508,655.943,049,629.00 3,846,968.00ExpenseType: 20 - Materials & Services Total:
ExpenseType: 30 - Capital Outlay
0.00 25,000.00 35,000.000.00 60,000.003010 - Furniture & Equipment
0.00 121.51 -121.510.00 0.003030 - Facilities Improvements
0.00 25,121.51 34,878.490.00 60,000.00ExpenseType: 30 - Capital Outlay Total:
ExpenseType: 40 - Insurance
2,170.00 483,297.26 5,702.74489,000.00 489,000.004010 - Liability Insur Premiums
0.00 59,885.00 5,115.0065,000.00 65,000.004030 - Property Insurance Premiums
0.00 1,060.00 140.001,200.00 1,200.004050 - Employee Bond Premiums
0.00 164.50 -164.500.00 0.004090 - Litigation
0.00 115,980.00 20.00116,000.00 116,000.004110 - Workers' Compensation
0.00 0.00 1,500.001,500.00 1,500.004210 - Unemployment Benefits
2,170.00 660,386.76 12,313.24672,700.00 672,700.00ExpenseType: 40 - Insurance Total:
ExpenseType: 90 - Operating Transfers Out
0.00 0.00 2,120,000.00120,000.00 2,120,000.009010 - Tsfs Out - To Facil Imp Fund
0.00 0.00 30,000.0030,000.00 30,000.009031 - Tsfs Out - To CFD Maint Fund
D. GF Expenditures by Function For Fiscal: 2017-2018 Period Ending: 04/30/2018
MTD Activity YTD ActivityBudget
RemainingExpenseObjectCurrent
Total BudgetOriginal
Total Budget
0.00 0.00 2,500,000.002,500,000.00 2,500,000.009050 - Tsfs Out - To Cap Impv Fund
0.00 0.00 4,650,000.002,650,000.00 4,650,000.00ExpenseType: 90 - Operating Transfers Out Total:
213,362.35 5,050,191.13 6,672,240.878,646,458.00 11,722,432.00Function: 10 - General Government Total:
Function: 20 - Public Safety
ExpenseType: 20 - Materials & Services
1,250.88 10,444.02 11,855.9822,300.00 22,300.002010 - Communications
0.00 98,543.44 20,598.5632,000.00 119,142.002030 - Equipment Maintenance
154.02 399.85 100.15500.00 500.002040 - Copier Usage
0.00 0.00 0.0063,000.00 0.002050 - Vehicle Maintenance
361.16 5,189.92 12,510.0817,700.00 17,700.002070 - Office Supplies
0.00 0.00 200.00200.00 200.002090 - Memberships & Dues
6,507.97 47,676.34 34,833.6682,510.00 82,510.002110 - Operating Supplies
0.00 859.00 6,941.007,800.00 7,800.002150 - Training
18,048.00 122,757.05 45,442.95152,500.00 168,200.002230 - Professional Services
94.04 634.77 4,465.235,100.00 5,100.002270 - Travel, Conf. & Meetings
0.00 0.00 300.00300.00 300.002290 - Auto Allowance
1,019,945.65 10,179,624.64 1,893,088.3612,072,713.00 12,072,713.002330 - Police Services
1,046,361.72 10,466,129.03 2,030,335.9712,456,623.00 12,496,465.00ExpenseType: 20 - Materials & Services Total:
1,046,361.72 10,466,129.03 2,030,335.9712,456,623.00 12,496,465.00Function: 20 - Public Safety Total:
Function: 40 - Community Development
ExpenseType: 10 - Personnel
164,357.08 1,804,907.50 418,087.502,266,915.00 2,222,995.001010 - Salaries
1,027.12 23,034.33 15,465.6738,500.00 38,500.001050 - Overtime
692.30 7,615.30 1,384.709,000.00 9,000.001070 - Stipends
25,272.15 259,765.38 72,534.62341,700.00 332,300.001100 - Benefits
14,535.20 157,642.38 34,145.62195,564.00 191,788.001120 - Retirement Benefits
2,500.79 27,653.83 5,276.1733,558.00 32,930.001140 - Medi-tax 1.45%
8,526.82 62,853.61 29,870.390.00 92,724.001200 - Outside Assistance
0.00 0.00 0.000.00 0.001990 - Personnel Allocation
216,911.46 2,343,472.33 576,764.672,885,237.00 2,920,237.00ExpenseType: 10 - Personnel Total:
ExpenseType: 20 - Materials & Services
714.92 8,254.22 4,725.7812,980.00 12,980.002010 - Communications
0.00 1,076.50 3,143.504,220.00 4,220.002030 - Equipment Maintenance
1,479.76 4,017.95 2,382.056,400.00 6,400.002040 - Copier Usage
0.00 0.00 0.0012,357.00 0.002050 - Vehicle Maintenance
2,159.56 18,403.89 14,846.1133,250.00 33,250.002070 - Office Supplies
415.00 3,312.00 5,408.008,720.00 8,720.002090 - Memberships & Dues
609.92 84,720.22 65,147.78149,868.00 149,868.002110 - Operating Supplies
0.00 5,102.12 4,927.8810,030.00 10,030.002130 - Books & Subscriptions
655.00 4,545.28 9,654.7214,200.00 14,200.002150 - Training
0.00 0.00 0.006,000.00 0.002190 - Facil & Equip Lease/Rent
36,637.35 387,557.45 609,242.55375,000.00 996,800.002230 - Professional Services
0.00 38,522.35 -38,522.350.00 0.002240 - Reimbursable Costs
1,475.00 4,041.03 7,558.9711,600.00 11,600.002250 - Advertising
1,043.56 7,950.70 11,499.3019,450.00 19,450.002270 - Travel, Conf. & Meetings
964.00 12,266.36 6,733.6419,000.00 19,000.002290 - Auto Allowance
6,623.00 35,615.78 1,899.2237,515.00 37,515.002340 - Parking Lot Leases
226.99 20,738.99 21,061.0124,500.00 41,800.002600 - Marketing
53,004.06 636,124.84 729,708.16745,090.00 1,365,833.00ExpenseType: 20 - Materials & Services Total:
269,915.52 2,979,597.17 1,306,472.833,630,327.00 4,286,070.00Function: 40 - Community Development Total:
Function: 50 - Community Services
ExpenseType: 10 - Personnel
59,760.36 674,030.48 127,858.52801,889.00 801,889.001010 - Salaries
6,229.43 82,954.72 5,545.2888,500.00 88,500.001030 - Hourly
278.75 25,277.85 7,222.1532,500.00 32,500.001050 - Overtime
12,246.98 124,635.07 22,364.93147,000.00 147,000.001100 - Benefits
5,596.44 61,663.61 12,632.3974,296.00 74,296.001120 - Retirement Benefits

D. GF Expenditures by Function For Fiscal: 2017-2018 Period Ending: 04/30/2018
MTD Activity YTD ActivityBudget
RemainingExpenseObjectCurrent
Total BudgetOriginal
Total Budget
1,038.66 12,043.79 1,338.2113,382.00 13,382.001140 - Medi-tax 1.45%
85,150.62 980,605.52 176,961.481,157,567.00 1,157,567.00ExpenseType: 10 - Personnel Total:
ExpenseType: 20 - Materials & Services
374.18 3,955.24 144.764,100.00 4,100.002010 - Communications
0.00 0.00 150.00150.00 150.002030 - Equipment Maintenance
261.20 997.33 1,002.672,000.00 2,000.002040 - Copier Usage
0.00 0.00 0.0019,640.00 0.002050 - Vehicle Maintenance
273.21 3,133.57 3,066.436,200.00 6,200.002070 - Office Supplies
0.00 1,484.00 1,486.002,970.00 2,970.002090 - Memberships & Dues
2,387.40 65,910.85 34,639.15100,550.00 100,550.002110 - Operating Supplies
250.00 2,389.19 1,060.813,450.00 3,450.002150 - Training
0.00 146.25 14,453.7514,600.00 14,600.002170 - Postage
0.00 0.00 6,000.0015,000.00 6,000.002190 - Facil & Equip Lease/Rent
52,574.66 536,404.14 173,595.86710,000.00 710,000.002210 - Utilities
10,368.98 251,034.22 217,165.78400,500.00 468,200.002230 - Professional Services
850.00 8,555.75 1,444.2510,000.00 10,000.002250 - Advertising
118.95 8,750.71 -150.718,600.00 8,600.002270 - Travel, Conf. & Meetings
422.65 7,220.61 -420.616,800.00 6,800.002290 - Auto Allowance
15,183.81 552,509.46 59,740.54612,250.00 612,250.002410 - Community Activities
1,580.09 73,341.53 10,658.4784,000.00 84,000.002430 - Recreation Programs
55,702.19 602,480.05 227,519.95680,000.00 830,000.002450 - Landscape Maintenance
76,068.00 378,058.00 171,942.00600,000.00 550,000.002470 - Tree Maintenance
142,170.61 835,248.61 259,751.391,095,000.00 1,095,000.002550 - Park Maintenance
358,585.93 3,331,619.51 1,183,250.494,375,810.00 4,514,870.00ExpenseType: 20 - Materials & Services Total:
ExpenseType: 30 - Capital Outlay
0.00 0.00 60,947.000.00 60,947.003050 - Park Structures & Improvemnts
0.00 0.00 60,947.000.00 60,947.00ExpenseType: 30 - Capital Outlay Total:
443,736.55 4,312,225.03 1,421,158.975,533,377.00 5,733,384.00Function: 50 - Community Services Total:
Function: 60 - Public Works
ExpenseType: 10 - Personnel
102,001.66 1,216,457.45 305,643.551,715,700.00 1,522,101.001010 - Salaries
0.00 0.00 13,500.0013,500.00 13,500.001030 - Hourly
0.00 5,363.74 136.265,500.00 5,500.001050 - Overtime
14,729.54 165,232.89 62,167.11243,000.00 227,400.001100 - Benefits
10,027.64 112,140.70 21,137.30150,434.00 133,278.001120 - Retirement Benefits
1,572.66 18,809.09 3,536.9125,153.00 22,346.001140 - Medi-tax 1.45%
0.00 0.00 0.000.00 0.001990 - Personnel Allocation
128,331.50 1,518,003.87 406,121.132,153,287.00 1,924,125.00ExpenseType: 10 - Personnel Total:
ExpenseType: 20 - Materials & Services
743.83 7,753.99 2,156.019,910.00 9,910.002010 - Communications
398.34 2,185.84 314.162,500.00 2,500.002040 - Copier Usage
0.00 0.00 0.0024,755.00 0.002050 - Vehicle Maintenance
5,715.04 11,579.48 7,445.5215,675.00 19,025.002070 - Office Supplies
0.00 2,577.50 3,397.505,975.00 5,975.002090 - Memberships & Dues
1,637.89 22,910.95 31,539.0554,450.00 54,450.002110 - Operating Supplies
5.95 41.65 1,558.351,600.00 1,600.002130 - Books & Subscriptions
0.00 1,846.90 8,153.1010,000.00 10,000.002150 - Training
0.00 0.00 0.006,500.00 0.002190 - Facil & Equip Lease/Rent
28,191.40 300,409.98 65,365.02365,775.00 365,775.002210 - Utilities
41,394.48 450,943.05 327,456.95648,000.00 778,400.002230 - Professional Services
104,745.18 480,523.96 199,476.04305,000.00 680,000.002240 - Reimbursable Costs
0.00 134.05 4,515.958,000.00 4,650.002270 - Travel, Conf. & Meetings
298.91 5,160.19 1,889.817,050.00 7,050.002290 - Auto Allowance
132,752.58 841,615.28 585,884.721,377,500.00 1,427,500.002350 - Street Maintenance
18,300.00 180,615.12 77,789.88258,405.00 258,405.002490 - Street Sweeping
55,666.06 422,998.12 423,501.88821,500.00 846,500.002510 - Storm Drains

D. GF Expenditures by Function For Fiscal: 2017-2018 Period Ending: 04/30/2018
MTD Activity YTD ActivityBudget
RemainingExpenseObjectCurrent
Total BudgetOriginal
Total Budget
52,552.25 96,441.16 91,558.84188,000.00 188,000.002530 - Safety Lighting
442,401.91 2,827,737.22 1,832,002.784,110,595.00 4,659,740.00ExpenseType: 20 - Materials & Services Total:
570,733.41 4,345,741.09 2,238,123.916,263,882.00 6,583,865.00Function: 60 - Public Works Total:
2,544,109.55 27,153,883.45 13,668,332.5536,530,667.00 40,822,216.00Fund: 01 - GENERAL Total:
Fund: 02 - GASOLINE TAX
Function: 10 - General Government
ExpenseType: 90 - Operating Transfers Out
0.00 0.00 573,216.00573,216.00 573,216.009030 - Transfers Out to General Fund
0.00 0.00 172,522.00364,714.00 172,522.009050 - Tsfs Out - To Cap Impv Fund
0.00 0.00 745,738.00937,930.00 745,738.00ExpenseType: 90 - Operating Transfers Out Total:
0.00 0.00 745,738.00937,930.00 745,738.00Function: 10 - General Government Total:
0.00 0.00 745,738.00937,930.00 745,738.00Fund: 02 - GASOLINE TAX Total:
Fund: 04 - MEASURE M FUND
Function: 10 - General Government
ExpenseType: 20 - Materials & Services
5,322.81 46,250.59 15,749.4147,000.00 62,000.002230 - Professional Services
5,322.81 46,250.59 15,749.4147,000.00 62,000.00ExpenseType: 20 - Materials & Services Total:
ExpenseType: 90 - Operating Transfers Out
0.00 0.00 541,600.00541,600.00 541,600.009050 - Tsfs Out - To Cap Impv Fund
0.00 0.00 541,600.00541,600.00 541,600.00ExpenseType: 90 - Operating Transfers Out Total:
5,322.81 46,250.59 557,349.41588,600.00 603,600.00Function: 10 - General Government Total:
5,322.81 46,250.59 557,349.41588,600.00 603,600.00Fund: 04 - MEASURE M FUND Total:
Fund: 06 - COASTAL TRANSIT
Function: 10 - General Government
ExpenseType: 20 - Materials & Services
6,870.00 427,998.87 307,156.13735,155.00 735,155.002230 - Professional Services
6,870.00 427,998.87 307,156.13735,155.00 735,155.00ExpenseType: 20 - Materials & Services Total:
6,870.00 427,998.87 307,156.13735,155.00 735,155.00Function: 10 - General Government Total:
6,870.00 427,998.87 307,156.13735,155.00 735,155.00Fund: 06 - COASTAL TRANSIT Total:
Fund: 07 - TBID
Function: 10 - General Government
ExpenseType: 20 - Materials & Services
0.00 590,157.96 659,842.041,250,000.00 1,250,000.002573 - TBID Expenditures
0.00 590,157.96 659,842.041,250,000.00 1,250,000.00ExpenseType: 20 - Materials & Services Total:
0.00 590,157.96 659,842.041,250,000.00 1,250,000.00Function: 10 - General Government Total:
0.00 590,157.96 659,842.041,250,000.00 1,250,000.00Fund: 07 - TBID Total:
Fund: 08 - ROAD MAINTENANCE AND REHAB
Function: 10 - General Government
ExpenseType: 90 - Operating Transfers Out
0.00 0.00 192,192.000.00 192,192.009050 - Tsfs Out - To Cap Impv Fund
0.00 0.00 192,192.000.00 192,192.00ExpenseType: 90 - Operating Transfers Out Total:
0.00 0.00 192,192.000.00 192,192.00Function: 10 - General Government Total:
0.00 0.00 192,192.000.00 192,192.00Fund: 08 - ROAD MAINTENANCE AND REHAB Total:
Fund: 09 - CFD ESHA
Function: 10 - General Government
ExpenseType: 20 - Materials & Services
0.00 0.00 22,700.0022,700.00 22,700.002550 - Park Maintenance
0.00 0.00 22,700.0022,700.00 22,700.00ExpenseType: 20 - Materials & Services Total:
0.00 0.00 22,700.0022,700.00 22,700.00Function: 10 - General Government Total:
0.00 0.00 22,700.0022,700.00 22,700.00Fund: 09 - CFD ESHA Total:

D. GF Expenditures by Function For Fiscal: 2017-2018 Period Ending: 04/30/2018
MTD Activity YTD ActivityBudget
RemainingExpenseObjectCurrent
Total BudgetOriginal
Total Budget
Fund: 11 - CAPITAL IMPROVEMENTS
Function: 10 - General Government
ExpenseType: 30 - Capital Outlay
23,397.86 1,750,394.03 4,770,923.974,975,000.00 6,521,318.003110 - Construction in Progress
23,397.86 1,750,394.03 4,770,923.974,975,000.00 6,521,318.00ExpenseType: 30 - Capital Outlay Total:
23,397.86 1,750,394.03 4,770,923.974,975,000.00 6,521,318.00Function: 10 - General Government Total:
23,397.86 1,750,394.03 4,770,923.974,975,000.00 6,521,318.00Fund: 11 - CAPITAL IMPROVEMENTS Total:
Fund: 12 - FACILITIES IMPROVEMENT FUND
Function: 10 - General Government
ExpenseType: 30 - Capital Outlay
0.00 57,682.24 1,124,213.7690,000.00 1,181,896.003030 - Facilities Improvements
0.00 57,682.24 1,124,213.7690,000.00 1,181,896.00ExpenseType: 30 - Capital Outlay Total:
0.00 57,682.24 1,124,213.7690,000.00 1,181,896.00Function: 10 - General Government Total:
0.00 57,682.24 1,124,213.7690,000.00 1,181,896.00Fund: 12 - FACILITIES IMPROVEMENT FUND Total:
Fund: 25 - SUPP LAW ENFORCEMENT SERVICES
Function: 10 - General Government
ExpenseType: 20 - Materials & Services
24,611.56 135,216.71 60,879.290.00 196,096.002572 - Slesf Program Operating Exp
24,611.56 135,216.71 60,879.290.00 196,096.00ExpenseType: 20 - Materials & Services Total:
24,611.56 135,216.71 60,879.290.00 196,096.00Function: 10 - General Government Total:
24,611.56 135,216.71 60,879.290.00 196,096.00Fund: 25 - SUPP LAW ENFORCEMENT SERVICES Total:
Fund: 27 - CFD 2006-1 MAINTENANCE
Function: 10 - General Government
ExpenseType: 20 - Materials & Services
33,374.03 35,276.44 182,723.56218,000.00 218,000.002030 - Equipment Maintenance
3,393.54 30,806.88 44,193.1275,000.00 75,000.002210 - Utilities
0.00 1,398.34 5,601.667,000.00 7,000.002230 - Professional Services
1,395.00 13,950.00 6,050.0020,000.00 20,000.002450 - Landscape Maintenance
0.00 0.00 10,000.0010,000.00 10,000.002470 - Tree Maintenance
0.00 615.97 36,984.0337,600.00 37,600.002650 - County Facilities
38,162.57 82,047.63 285,552.37367,600.00 367,600.00ExpenseType: 20 - Materials & Services Total:
ExpenseType: 30 - Capital Outlay
0.00 0.00 195,000.000.00 195,000.003010 - Furniture & Equipment
0.00 0.00 195,000.000.00 195,000.00ExpenseType: 30 - Capital Outlay Total:
ExpenseType: 70 - Other Financing Expenses
3,245.33 3,245.33 148,354.67151,600.00 151,600.007050 - Debt Service
3,245.33 3,245.33 148,354.67151,600.00 151,600.00ExpenseType: 70 - Other Financing Expenses Total:
41,407.90 85,292.96 628,907.04519,200.00 714,200.00Function: 10 - General Government Total:
41,407.90 85,292.96 628,907.04519,200.00 714,200.00Fund: 27 - CFD 2006-1 MAINTENANCE Total:
Fund: 33 - CFD 2013 BONDHOLDER FUND
Function: 10 - General Government
ExpenseType: 90 - Operating Transfers Out
0.00 0.45 -0.450.00 0.009030 - Transfers Out to General Fund
0.00 0.45 -0.450.00 0.00ExpenseType: 90 - Operating Transfers Out Total:
0.00 0.45 -0.450.00 0.00Function: 10 - General Government Total:
0.00 0.45 -0.450.00 0.00Fund: 33 - CFD 2013 BONDHOLDER FUND Total:
-2,645,719.68 -30,246,877.26Total Surplus (Deficit): -22,738,233.74-52,985,111.00-45,649,252.00

D. GF Expenditures by Function For Fiscal: 2017-2018 Period Ending: 04/30/2018
Fund Summary
MTD Activity YTD ActivityBudget
RemainingFundCurrent
Total BudgetOriginal
Total Budget
01 - GENERAL -2,544,109.55 -27,153,883.45 -13,668,332.55-40,822,216.00-36,530,667.00
02 - GASOLINE TAX 0.00 0.00 -745,738.00-745,738.00-937,930.00
04 - MEASURE M FUND -5,322.81 -46,250.59 -557,349.41-603,600.00-588,600.00
06 - COASTAL TRANSIT -6,870.00 -427,998.87 -307,156.13-735,155.00-735,155.00
07 - TBID 0.00 -590,157.96 -659,842.04-1,250,000.00-1,250,000.00
08 - ROAD MAINTENANCE AND… 0.00 0.00 -192,192.00-192,192.000.00
09 - CFD ESHA 0.00 0.00 -22,700.00-22,700.00-22,700.00
11 - CAPITAL IMPROVEMENTS -23,397.86 -1,750,394.03 -4,770,923.97-6,521,318.00-4,975,000.00
12 - FACILITIES IMPROVEMENT… 0.00 -57,682.24 -1,124,213.76-1,181,896.00-90,000.00
25 - SUPP LAW ENFORCEMENT… -24,611.56 -135,216.71 -60,879.29-196,096.000.00
27 - CFD 2006-1 MAINTENANCE -41,407.90 -85,292.96 -628,907.04-714,200.00-519,200.00
33 - CFD 2013 BONDHOLDER … 0.00 -0.45 0.450.000.00
Total Surplus (Deficit): -2,645,719.68 -30,246,877.26 -15,445,189.81-52,985,111.00-45,649,252.00
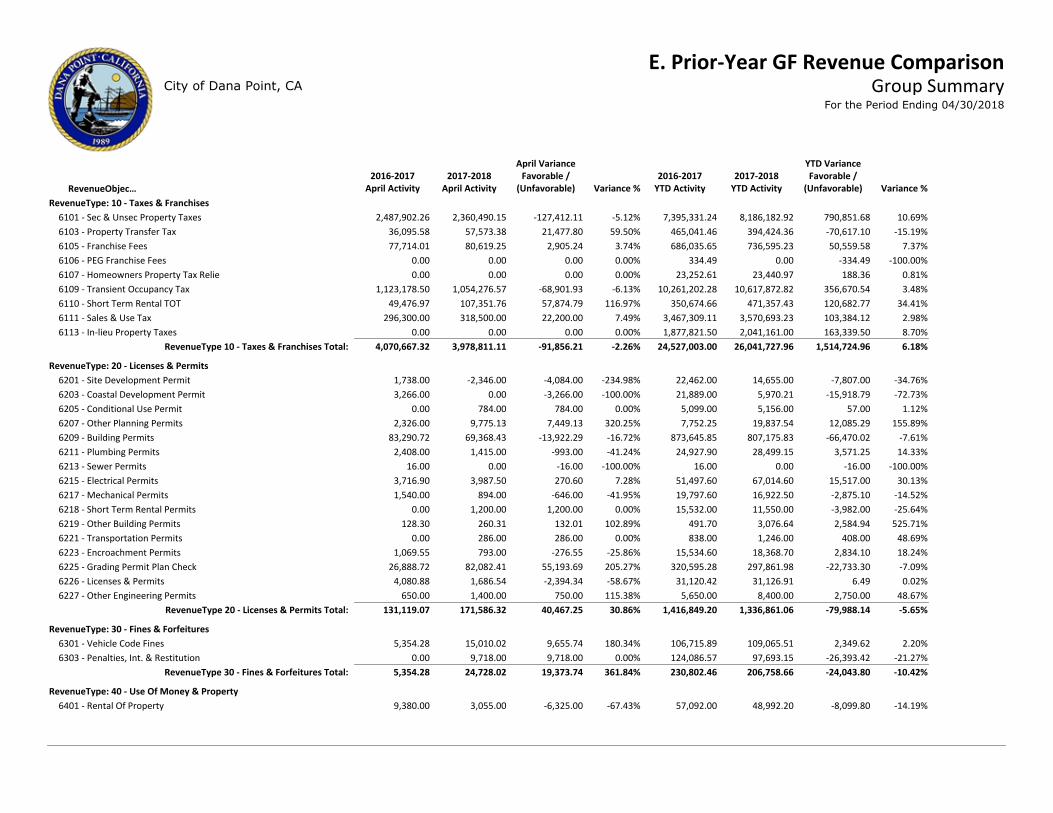
E. Prior-Year GF Revenue ComparisonCity of Dana Point, CA Group Summary
For the Period Ending 04/30/2018
RevenueObjec…2017-2018
April Activity2017-2018
YTD Activity
April VarianceFavorable /
(Unfavorable)
YTD VarianceFavorable /
(Unfavorable)2016-2017
YTD Activity2016-2017
April Activity Variance % Variance %
RevenueType: 10 - Taxes & Franchises
6101 - Sec & Unsec Property Taxes 2,487,902.26 7,395,331.242,360,490.15 -127,412.11 8,186,182.92 790,851.68 10.69%-5.12%
6103 - Property Transfer Tax 36,095.58 465,041.4657,573.38 21,477.80 394,424.36 -70,617.10 -15.19%59.50%
6105 - Franchise Fees 77,714.01 686,035.6580,619.25 2,905.24 736,595.23 50,559.58 7.37%3.74%
6106 - PEG Franchise Fees 0.00 334.490.00 0.00 0.00 -334.49 -100.00%0.00%
6107 - Homeowners Property Tax Relie 0.00 23,252.610.00 0.00 23,440.97 188.36 0.81%0.00%
6109 - Transient Occupancy Tax 1,123,178.50 10,261,202.281,054,276.57 -68,901.93 10,617,872.82 356,670.54 3.48%-6.13%
6110 - Short Term Rental TOT 49,476.97 350,674.66107,351.76 57,874.79 471,357.43 120,682.77 34.41%116.97%
6111 - Sales & Use Tax 296,300.00 3,467,309.11318,500.00 22,200.00 3,570,693.23 103,384.12 2.98%7.49%
6113 - In-lieu Property Taxes 0.00 1,877,821.500.00 0.00 2,041,161.00 163,339.50 8.70%0.00%
4,070,667.32 24,527,003.003,978,811.11 -91,856.21 26,041,727.96 1,514,724.96 6.18%-2.26%RevenueType 10 - Taxes & Franchises Total:
RevenueType: 20 - Licenses & Permits
6201 - Site Development Permit 1,738.00 22,462.00-2,346.00 -4,084.00 14,655.00 -7,807.00 -34.76%-234.98%
6203 - Coastal Development Permit 3,266.00 21,889.000.00 -3,266.00 5,970.21 -15,918.79 -72.73%-100.00%
6205 - Conditional Use Permit 0.00 5,099.00784.00 784.00 5,156.00 57.00 1.12%0.00%
6207 - Other Planning Permits 2,326.00 7,752.259,775.13 7,449.13 19,837.54 12,085.29 155.89%320.25%
6209 - Building Permits 83,290.72 873,645.8569,368.43 -13,922.29 807,175.83 -66,470.02 -7.61%-16.72%
6211 - Plumbing Permits 2,408.00 24,927.901,415.00 -993.00 28,499.15 3,571.25 14.33%-41.24%
6213 - Sewer Permits 16.00 16.000.00 -16.00 0.00 -16.00 -100.00%-100.00%
6215 - Electrical Permits 3,716.90 51,497.603,987.50 270.60 67,014.60 15,517.00 30.13%7.28%
6217 - Mechanical Permits 1,540.00 19,797.60894.00 -646.00 16,922.50 -2,875.10 -14.52%-41.95%
6218 - Short Term Rental Permits 0.00 15,532.001,200.00 1,200.00 11,550.00 -3,982.00 -25.64%0.00%
6219 - Other Building Permits 128.30 491.70260.31 132.01 3,076.64 2,584.94 525.71%102.89%
6221 - Transportation Permits 0.00 838.00286.00 286.00 1,246.00 408.00 48.69%0.00%
6223 - Encroachment Permits 1,069.55 15,534.60793.00 -276.55 18,368.70 2,834.10 18.24%-25.86%
6225 - Grading Permit Plan Check 26,888.72 320,595.2882,082.41 55,193.69 297,861.98 -22,733.30 -7.09%205.27%
6226 - Licenses & Permits 4,080.88 31,120.421,686.54 -2,394.34 31,126.91 6.49 0.02%-58.67%
6227 - Other Engineering Permits 650.00 5,650.001,400.00 750.00 8,400.00 2,750.00 48.67%115.38%
131,119.07 1,416,849.20171,586.32 40,467.25 1,336,861.06 -79,988.14 -5.65%30.86%RevenueType 20 - Licenses & Permits Total:
RevenueType: 30 - Fines & Forfeitures
6301 - Vehicle Code Fines 5,354.28 106,715.8915,010.02 9,655.74 109,065.51 2,349.62 2.20%180.34%
6303 - Penalties, Int. & Restitution 0.00 124,086.579,718.00 9,718.00 97,693.15 -26,393.42 -21.27%0.00%
5,354.28 230,802.4624,728.02 19,373.74 206,758.66 -24,043.80 -10.42%361.84%RevenueType 30 - Fines & Forfeitures Total:
RevenueType: 40 - Use Of Money & Property
6401 - Rental Of Property 9,380.00 57,092.003,055.00 -6,325.00 48,992.20 -8,099.80 -14.19%-67.43%

E. Prior-Year GF Revenue Comparison For the Period Ending 04/30/2018
RevenueObjec…2017-2018
April Activity2017-2018
YTD Activity
April VarianceFavorable /
(Unfavorable)
YTD VarianceFavorable /
(Unfavorable)2016-2017
YTD Activity2016-2017
April Activity Variance % Variance %
6403 - Investment Income 27,265.30 130,105.40193,775.93 166,510.63 344,904.94 214,799.54 165.10%610.71%
6405 - City Plaza Rental Revenue 1,900.00 19,000.001,900.00 0.00 19,000.00 0.00 0.00%0.00%
6406 - Trolley Rentals 0.00 345.000.00 0.00 0.00 -345.00 -100.00%0.00%
38,545.30 206,542.40198,730.93 160,185.63 412,897.14 206,354.74 99.91%415.58%RevenueType 40 - Use Of Money & Property Total:
RevenueType: 50 - Intergovernmental
6505 - Motor Vehicle In-lieu 0.00 14,969.360.00 0.00 17,738.63 2,769.27 18.50%0.00%
6513 - Local Coastal Program Grant 0.00 0.0017,590.00 17,590.00 17,590.00 17,590.00 0.00%0.00%
6514 - Waste Disposal Agreement Allocation 0.00 53,278.000.00 0.00 0.00 -53,278.00 -100.00%0.00%
6521 - Intergovernmental Cost Reimb 0.00 33,748.6664,816.00 64,816.00 77,645.18 43,896.52 130.07%0.00%
0.00 101,996.0282,406.00 82,406.00 112,973.81 10,977.79 10.76%0.00%RevenueType 50 - Intergovernmental Total:
RevenueType: 60 - Charges For Services
6607 - Planning Comm. Determin. 0.00 392.000.00 0.00 0.00 -392.00 -100.00%0.00%
6609 - Variance Minor Amendment 0.00 1,176.000.00 0.00 1,176.00 0.00 0.00%0.00%
6615 - Initial Study 0.00 50.000.00 0.00 0.00 -50.00 -100.00%0.00%
6621 - Concept Approval 0.00 1,600.000.00 0.00 2,100.00 500.00 31.25%0.00%
6623 - Planning Plan Check Fee 8,459.36 91,379.238,310.04 -149.32 114,798.67 23,419.44 25.63%-1.77%
6627 - Other Planning Fees 0.00 196.000.00 0.00 0.00 -196.00 -100.00%0.00%
6631 - Building Plan Check Fee 121,215.56 781,281.8950,229.34 -70,986.22 559,872.77 -221,409.12 -28.34%-58.56%
6633 - Permit Issuance Fee 2,850.00 34,575.003,105.00 255.00 31,285.00 -3,290.00 -9.52%8.95%
6635 - Other Building Fees 0.00 22.000.00 0.00 22.00 0.00 0.00%0.00%
6639 - Addressing Fee 63.00 756.00126.00 63.00 5,355.00 4,599.00 608.33%100.00%
6641 - Grading Inspection 29,202.12 175,829.5816,251.48 -12,950.64 161,347.95 -14,481.63 -8.24%-44.35%
6649 - Map Check Fee 0.00 -730.650.00 0.00 -691.94 38.71 5.30%0.00%
6655 - Other Engineering Fees 8,488.73 51,667.6322,322.66 13,833.93 126,204.47 74,536.84 144.26%162.97%
6659 - Solid Waste Exemption Fee 0.00 1,270.00240.00 240.00 1,320.00 50.00 3.94%0.00%
6682 - Lantern District Impact Fees 0.00 0.000.00 0.00 626,062.08 626,062.08 0.00%0.00%
6683 - Art In Public Places Fees 0.00 0.000.00 0.00 70,496.59 70,496.59 0.00%0.00%
6685 - Reimbursed Expenses 2,225.44 127,877.472,055.53 -169.91 22,696.86 -105,180.61 -82.25%-7.63%
6687 - Legal Reimbursements - Development 0.00 0.0048,644.57 48,644.57 58,676.10 58,676.10 0.00%0.00%
6688 - Legal Reimbursements - Other 0.00 0.000.00 0.00 61,810.05 61,810.05 0.00%0.00%
6689 - Police Services Reimbursements 0.00 0.0010,360.01 10,360.01 106,645.64 106,645.64 0.00%0.00%
6691 - Recreation Classes 19,649.83 110,001.8716,647.61 -3,002.22 119,991.58 9,989.71 9.08%-15.28%
6692 - Planning Reimbursements 0.00 0.0015,685.35 15,685.35 18,179.40 18,179.40 0.00%0.00%
6693 - Activities & Trips 657.00 49,460.30360.00 -297.00 19,345.00 -30,115.30 -60.89%-45.21%
6694 - Staff Time Reimbursements 0.00 0.0011,524.46 11,524.46 35,875.12 35,875.12 0.00%0.00%
6697 - Photocopies 159.70 1,213.20143.40 -16.30 2,613.70 1,400.50 115.44%-10.21%
6699 - Other P/b/e 3,447.57 32,824.141,955.26 -1,492.31 28,142.48 -4,681.66 -14.26%-43.29%
196,418.31 1,460,841.66207,960.71 11,542.40 2,173,324.52 712,482.86 48.77%5.88%RevenueType 60 - Charges For Services Total:
RevenueType: 70 - Other
6701 - Planning Appeal Fee 500.00 1,250.00500.00 0.00 2,500.00 1,250.00 100.00%0.00%
6703 - Miscellaneous Revenues 700.02 2,784.38782.72 82.70 8,831.84 6,047.46 217.19%11.81%

E. Prior-Year GF Revenue Comparison For the Period Ending 04/30/2018
RevenueObjec…2017-2018
April Activity2017-2018
YTD Activity
April VarianceFavorable /
(Unfavorable)
YTD VarianceFavorable /
(Unfavorable)2016-2017
YTD Activity2016-2017
April Activity Variance % Variance %
6704 - Gain/Loss on Asset Sale 0.00 1,790.408,991.00 8,991.00 36,342.00 34,551.60 1,929.83%0.00%
6705 - Sale Of Recyclable Materials 0.00 8,962.000.00 0.00 0.00 -8,962.00 -100.00%0.00%
6707 - User Fee Income Solid Waste 0.00 28,377.740.00 0.00 29,628.72 1,250.98 4.41%0.00%
1,200.02 43,164.5210,273.72 9,073.70 77,302.56 34,138.04 79.09%756.13%RevenueType 70 - Other Total:
RevenueType: 90 - Transfers
6907 - Tsfs In - Fr CFD Bond Fund 0.00 0.000.00 0.00 0.45 0.45 0.00%0.00%
0.00 0.000.00 0.00 0.45 0.45 0.00%0.00%RevenueType 90 - Transfers Total:
Total Surplus (Deficit): 4,443,304.30 27,987,199.264,674,496.81 231,192.51 30,361,846.16 2,374,646.90 8.48%5.20%

E. Prior-Year GF Revenue Comparison For the Period Ending 04/30/2018
Fund Summary
Fund2017-2018
April Activity2017-2018
YTD Activity
April VarianceFavorable /
(Unfavorable)
YTD VarianceFavorable /
(Unfavorable)2016-2017
YTD Activity2016-2017
April Activity Variance % Variance %
01 - GENERAL 4,443,304.30 27,987,199.264,674,496.81 231,192.51 30,361,846.16 2,374,646.90 8.48%5.20%
Total Surplus (Deficit): 4,443,304.30 27,987,199.264,674,496.81 231,192.51 30,361,846.16 2,374,646.90 8.48%5.20%

F. Prior-Year GF Expenditure ComparisonCity of Dana Point, CA Group Summary
For the Period Ending 04/30/2018
ExpenseObjec…2017-2018
April Activity2017-2018
YTD Activity
April VarianceFavorable /
(Unfavorable)
YTD VarianceFavorable /
(Unfavorable)2016-2017
YTD Activity2016-2017
April Activity Variance % Variance %
ExpenseType: 10 - Personnel
1010 - Salaries 468,284.35 5,446,834.97445,268.28 23,016.07 5,090,739.52 356,095.45 6.54%4.91%
1030 - Hourly 10,611.34 141,554.4112,189.11 -1,577.77 135,301.04 6,253.37 4.42%-14.87%
1050 - Overtime 2,718.43 86,458.211,714.54 1,003.89 68,482.59 17,975.62 20.79%36.93%
1070 - Stipends 623.07 7,546.07692.30 -69.23 7,615.30 -69.23 -0.92%-11.11%
1100 - Benefits 74,337.54 785,451.9475,202.23 -864.69 773,934.89 11,517.05 1.47%-1.16%
1120 - Retirement Benefits 41,222.51 607,746.4442,219.35 -996.84 648,796.32 -41,049.88 -6.75%-2.42%
1140 - Medi-tax 1.45% 7,310.70 86,131.887,017.32 293.38 80,729.25 5,402.63 6.27%4.01%
1200 - Outside Assistance 0.00 25,792.508,526.82 -8,526.82 62,853.61 -37,061.11 -143.69%0.00%
1990 - Personnel Allocation 0.00 0.000.00 0.00 0.00 0.00 0.00%0.00%
605,107.94 7,187,516.42592,829.95 12,277.99 6,868,452.52 319,063.90 4.44%2.03%ExpenseType 10 - Personnel Total:
ExpenseType: 20 - Materials & Services
2010 - Communications 6,201.45 84,739.649,844.58 -3,643.13 87,913.59 -3,173.95 -3.75%-58.75%
2030 - Equipment Maintenance 50,285.76 329,996.4726,288.42 23,997.34 429,631.54 -99,635.07 -30.19%47.72%
2040 - Copier Usage 2,929.64 9,247.623,297.98 -368.34 11,071.74 -1,824.12 -19.73%-12.57%
2050 - Vehicle Maintenance 5,169.17 73,073.8136,452.94 -31,283.77 107,445.23 -34,371.42 -47.04%-605.20%
2070 - Office Supplies 6,537.77 68,298.1810,883.95 -4,346.18 60,464.56 7,833.62 11.47%-66.48%
2090 - Memberships & Dues 1,765.55 45,557.94655.00 1,110.55 56,656.22 -11,098.28 -24.36%62.90%
2110 - Operating Supplies 46,514.25 314,198.2918,957.41 27,556.84 284,317.66 29,880.63 9.51%59.24%
2130 - Books & Subscriptions 105.57 11,181.7860.04 45.53 12,597.62 -1,415.84 -12.66%43.13%
2150 - Training 959.11 36,169.701,104.00 -144.89 26,224.93 9,944.77 27.49%-15.11%
2170 - Postage 102.95 20,903.18153.87 -50.92 11,736.93 9,166.25 43.85%-49.46%
2190 - Facil & Equip Lease/Rent 616.63 6,527.742,103.69 -1,487.06 16,663.96 -10,136.22 -155.28%-241.16%
2210 - Utilities 64,868.78 792,025.5691,076.76 -26,207.98 941,294.12 -149,268.56 -18.85%-40.40%
2230 - Professional Services 227,831.58 2,407,470.71134,897.25 92,934.33 1,776,889.20 630,581.51 26.19%40.79%
2240 - Reimbursable Costs 32,326.55 329,309.97104,745.18 -72,418.63 519,046.31 -189,736.34 -57.62%-224.02%
2250 - Advertising 8,163.47 45,218.245,904.90 2,258.57 30,528.46 14,689.78 32.49%27.67%
2270 - Travel, Conf. & Meetings 5,719.30 65,251.014,031.21 1,688.09 53,390.80 11,860.21 18.18%29.52%
2290 - Auto Allowance 4,029.60 43,279.673,928.71 100.89 49,450.96 -6,171.29 -14.26%2.50%
2310 - City Attorney 0.00 637,098.10-90,000.00 90,000.00 776,773.10 -139,675.00 -21.92%0.00%
2330 - Police Services 972,266.26 9,641,965.351,019,945.65 -47,679.39 10,179,624.64 -537,659.29 -5.58%-4.90%
2340 - Parking Lot Leases 4,518.82 33,834.826,623.00 -2,104.18 35,615.78 -1,780.96 -5.26%-46.56%
2350 - Street Maintenance 118,123.84 970,664.18132,752.58 -14,628.74 841,615.28 129,048.90 13.29%-12.38%
2410 - Community Activities 36,502.33 666,118.7015,258.81 21,243.52 568,609.46 97,509.24 14.64%58.20%
2430 - Recreation Programs 8,925.48 110,043.481,580.09 7,345.39 73,341.53 36,701.95 33.35%82.30%
2450 - Landscape Maintenance 35,255.00 385,796.2955,702.19 -20,447.19 602,480.05 -216,683.76 -56.17%-58.00%

F. Prior-Year GF Expenditure Comparison For the Period Ending 04/30/2018
ExpenseObjec…2017-2018
April Activity2017-2018
YTD Activity
April VarianceFavorable /
(Unfavorable)
YTD VarianceFavorable /
(Unfavorable)2016-2017
YTD Activity2016-2017
April Activity Variance % Variance %
2470 - Tree Maintenance 69,085.00 413,059.0076,068.00 -6,983.00 378,058.00 35,001.00 8.47%-10.11%
2490 - Street Sweeping 19,141.97 180,759.4818,300.00 841.97 180,615.12 144.36 0.08%4.40%
2510 - Storm Drains 98,435.49 444,232.5555,666.06 42,769.43 422,998.12 21,234.43 4.78%43.45%
2530 - Safety Lighting 25,159.63 155,670.0852,552.25 -27,392.62 96,441.16 59,228.92 38.05%-108.88%
2550 - Park Maintenance 88,730.40 752,435.65142,170.61 -53,440.21 835,248.61 -82,812.96 -11.01%-60.23%
2590 - Data Technology 4,231.24 109,145.387,877.48 -3,646.24 112,438.99 -3,293.61 -3.02%-86.17%
2600 - Marketing 127.05 31,358.22226.99 -99.94 20,738.99 10,619.23 33.86%-78.66%
1,944,629.64 19,214,630.791,949,109.60 -4,479.96 19,599,922.66 -385,291.87 -2.01%-0.23%ExpenseType 20 - Materials & Services Total:
ExpenseType: 30 - Capital Outlay
3010 - Furniture & Equipment 0.00 212,150.180.00 0.00 25,000.00 187,150.18 88.22%0.00%
3030 - Facilities Improvements 0.00 0.000.00 0.00 121.51 -121.51 0.00%0.00%
3050 - Park Structures & Improvemnts 66,075.00 66,075.000.00 66,075.00 0.00 66,075.00 100.00%100.00%
66,075.00 278,225.180.00 66,075.00 25,121.51 253,103.67 90.97%100.00%ExpenseType 30 - Capital Outlay Total:
ExpenseType: 40 - Insurance
4010 - Liability Insur Premiums -599.00 456,068.152,170.00 -2,769.00 483,297.26 -27,229.11 -5.97%-462.27%
4030 - Property Insurance Premiums 0.00 61,042.000.00 0.00 59,885.00 1,157.00 1.90%0.00%
4050 - Employee Bond Premiums 0.00 1,060.000.00 0.00 1,060.00 0.00 0.00%0.00%
4090 - Litigation 9,520.00 206,614.470.00 9,520.00 164.50 206,449.97 99.92%100.00%
4110 - Workers' Compensation 0.00 75,225.000.00 0.00 115,980.00 -40,755.00 -54.18%0.00%
4210 - Unemployment Benefits 0.00 2,480.750.00 0.00 0.00 2,480.75 100.00%0.00%
8,921.00 802,490.372,170.00 6,751.00 660,386.76 142,103.61 17.71%75.68%ExpenseType 40 - Insurance Total:
ExpenseType: 90 - Operating Transfers Out
9010 - Tsfs Out - To Facil Imp Fund 0.00 1,036,269.000.00 0.00 0.00 1,036,269.00 100.00%0.00%
9031 - Tsfs Out - To CFD Maint Fund 0.00 30,000.000.00 0.00 0.00 30,000.00 100.00%0.00%
9050 - Tsfs Out - To Cap Impv Fund 0.00 1,850,000.000.00 0.00 0.00 1,850,000.00 100.00%0.00%
0.00 2,916,269.000.00 0.00 0.00 2,916,269.00 100.00%0.00%ExpenseType 90 - Operating Transfers Out Total:
Total Surplus (Deficit): -2,624,733.58 -30,399,131.76-2,544,109.55 80,624.03 -27,153,883.45 3,245,248.31 10.68%3.07%

F. Prior-Year GF Expenditure Comparison For the Period Ending 04/30/2018
Fund Summary
Fund2017-2018
April Activity2017-2018
YTD Activity
April VarianceFavorable /
(Unfavorable)
YTD VarianceFavorable /
(Unfavorable)2016-2017
YTD Activity2016-2017
April Activity Variance % Variance %
01 - GENERAL -2,624,733.58 -30,399,131.76-2,544,109.55 80,624.03 -27,153,883.45 3,245,248.31 10.68%3.07%
Total Surplus (Deficit): -2,624,733.58 -30,399,131.76-2,544,109.55 80,624.03 -27,153,883.45 3,245,248.31 10.68%3.07%

(THIS PAGE INTENTIONALLY LEFT BLANK)
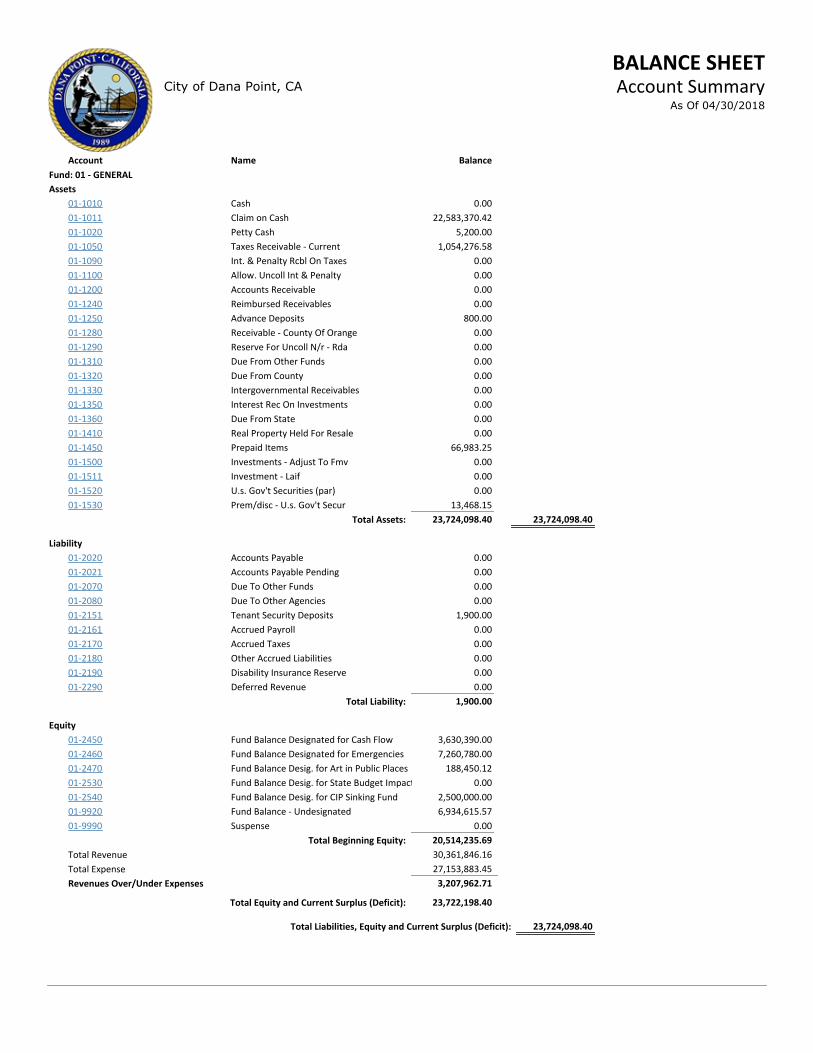
BALANCE SHEETCity of Dana Point, CA Account Summary
As Of 04/30/2018
Account Name Balance
Fund: 01 - GENERAL
Assets
01-1010 Cash 0.00
01-1011 Claim on Cash 22,583,370.42
01-1020 Petty Cash 5,200.00
01-1050 Taxes Receivable - Current 1,054,276.58
01-1090 Int. & Penalty Rcbl On Taxes 0.00
01-1100 Allow. Uncoll Int & Penalty 0.00
01-1200 Accounts Receivable 0.00
01-1240 Reimbursed Receivables 0.00
01-1250 Advance Deposits 800.00
01-1280 Receivable - County Of Orange 0.00
01-1290 Reserve For Uncoll N/r - Rda 0.00
01-1310 Due From Other Funds 0.00
01-1320 Due From County 0.00
01-1330 Intergovernmental Receivables 0.00
01-1350 Interest Rec On Investments 0.00
01-1360 Due From State 0.00
01-1410 Real Property Held For Resale 0.00
01-1450 Prepaid Items 66,983.25
01-1500 Investments - Adjust To Fmv 0.00
01-1511 Investment - Laif 0.00
01-1520 U.s. Gov't Securities (par) 0.00
01-1530 Prem/disc - U.s. Gov't Secur 13,468.15
23,724,098.40Total Assets: 23,724,098.40
Liability
01-2020 Accounts Payable 0.00
01-2021 Accounts Payable Pending 0.00
01-2070 Due To Other Funds 0.00
01-2080 Due To Other Agencies 0.00
01-2151 Tenant Security Deposits 1,900.00
01-2161 Accrued Payroll 0.00
01-2170 Accrued Taxes 0.00
01-2180 Other Accrued Liabilities 0.00
01-2190 Disability Insurance Reserve 0.00
01-2290 Deferred Revenue 0.00
1,900.00Total Liability:
Equity
01-2450 Fund Balance Designated for Cash Flow 3,630,390.00
01-2460 Fund Balance Designated for Emergencies 7,260,780.00
01-2470 Fund Balance Desig. for Art in Public Places 188,450.12
01-2530 Fund Balance Desig. for State Budget Impacts 0.00
01-2540 Fund Balance Desig. for CIP Sinking Fund 2,500,000.00
01-9920 Fund Balance - Undesignated 6,934,615.57
01-9990 Suspense 0.00
20,514,235.69Total Beginning Equity:
30,361,846.16Total Revenue
27,153,883.45Total Expense
3,207,962.71Revenues Over/Under Expenses
Total Liabilities, Equity and Current Surplus (Deficit): 23,724,098.40
23,722,198.40Total Equity and Current Surplus (Deficit):