City of Chino Hills - San Bernardino County · The City of Chino Hills provides the following...
14
The City of Chino Hills provides the following services: contracted police, lighting and landscaping, public improvements, water, sewer, planning and zoning, general administrative services, contracted animal control, building and safety, community services, and street and highway maintenance. Fire protection is provided by the independent Chino Valley Independent Fire District. The City operates with governmental funds and reports two business-type funds: water and sewer. Redevelopment activities have been removed for all years to normalize for the dissolution of redevelopment agencies effective February 1, 2012. The City did not have a redevelopment agency during the timeframe of this program. The City also receives property tax revenue from community facility special taxes and assessment district assessments. The agency retirement plan is administered by SBCERA.Additional information on the City can be accessed via the link below. Agency Information (map, contact information, fiscal indicators, SCAG profile) under construction City of Chino Hills Report Created:1/22/2018 1 San Bernardino LAFCO Fiscal Indicators
Transcript of City of Chino Hills - San Bernardino County · The City of Chino Hills provides the following...

The City of Chino Hills provides the following services: contracted police, lighting and landscaping, public improvements, water, sewer, planning and zoning, general administrative services, contracted animal control, building and safety, community services, and street and highway maintenance. Fire protection is provided by the independent Chino Valley Independent Fire District. The City operates with governmental funds and reports two business-type funds: water and sewer. Redevelopment activities have been removed for all years to normalize for the dissolution of redevelopment agencies effective February 1, 2012. The City did not have a redevelopment agency during the timeframe of this program. The City also receives property tax revenue from community facility special taxes and assessment district assessments. The agency retirement plan is administered by SBCERA.Additional information on the City can be accessed via the link below.
Agency Information (map, contact information, fiscal indicators, SCAG profile) under construction
City of Chino Hills
Report Created:1/22/2018
1San Bernardino LAFCO
Fiscal Indicators

Change in Assessed Value
DescriptionThere is a correlation between assessed property value and the receipt of the general property tax levy.
Formula:change in tax roll value/beginning tax roll value
Source:County Auditor - Agency Net Valuations
2012 2013 2014 2015 2016
$62,481,691 $119,741,861 $300,670,169 $615,367,768 $423,672,953
$8,831,767,055 $8,951,508,916 $9,252,179,085 $9,867,546,853 $10,291,219,806
0.7% 1.3% 3.2% 6.2% 4.1%
Agency Response
City of Chino Hills
Report Created:1/22/2018
2San Bernardino LAFCO
Fiscal Indicators

Property Tax Revenue
DescriptionThis indicator will have more importance for those agencies heavily reliant upon property tax revenues. As this revenue source is relatively stable and lags about two years behind changes in market conditions, this indicator can potentially depict the level of stability of an agency’s revenue base.
Formula:property tax revenue
Source:Statement of Activities; Statement of Revenues, Expenditures and Changes in Fund Balance/Net Position
Agency Response
City of Chino Hills
Report Created:1/22/2018
3San Bernardino LAFCO
Fiscal Indicators

Sales Tax Revenue (cities)
DescriptionThis indicator can help agencies determine the levels of sales tax revenue that are more sensitive to changes in the economic conditions, possibly impacting their abilities to fund and provide services.
Formula:sales tax revenue
Source:Statement of Activities
Agency Response
City of Chino Hills
Report Created:1/22/2018
4San Bernardino LAFCO
Fiscal Indicators
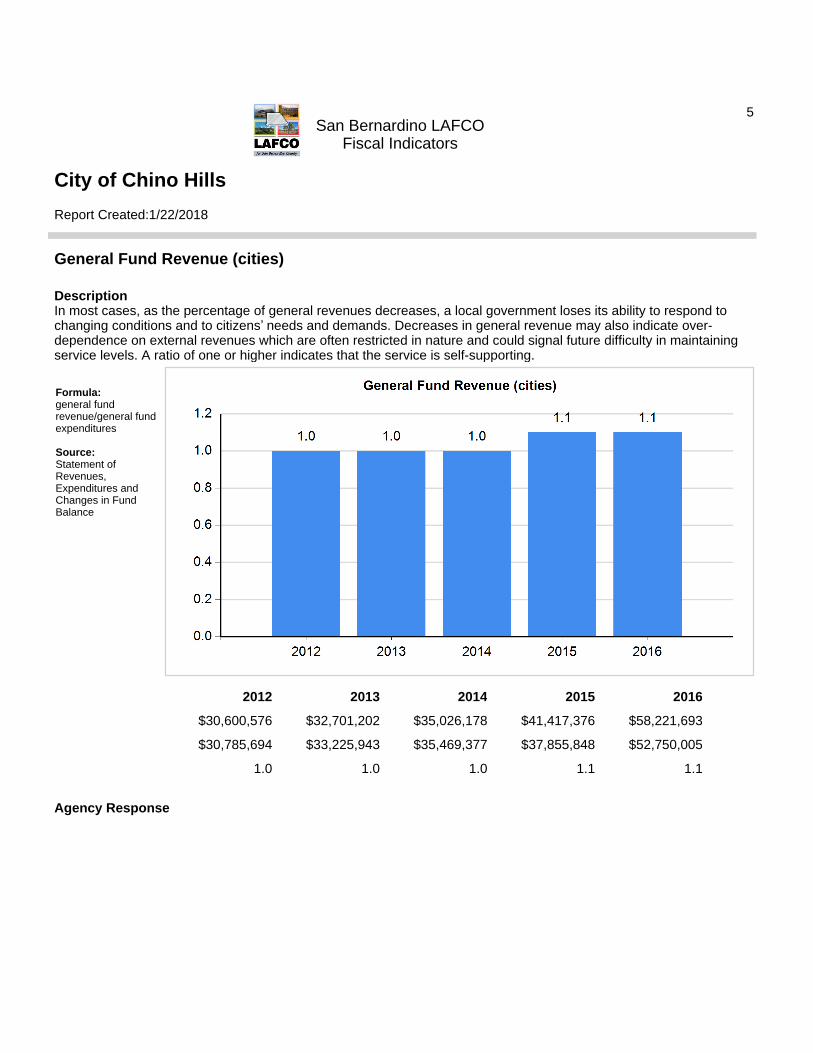
General Fund Revenue (cities)
DescriptionIn most cases, as the percentage of general revenues decreases, a local government loses its ability to respond to changing conditions and to citizens’ needs and demands. Decreases in general revenue may also indicate over-dependence on external revenues which are often restricted in nature and could signal future difficulty in maintaining service levels. A ratio of one or higher indicates that the service is self-supporting.
Formula:general fund revenue/general fund expenditures
Source:Statement of Revenues, Expenditures and Changes in Fund Balance
2012 2013 2014 2015 2016
$30,600,576 $32,701,202 $35,026,178 $41,417,376 $58,221,693
$30,785,694 $33,225,943 $35,469,377 $37,855,848 $52,750,005
1.0 1.0 1.0 1.1 1.1
Agency Response
City of Chino Hills
Report Created:1/22/2018
5San Bernardino LAFCO
Fiscal Indicators

Charges for Service (business)
DescriptionAddresses the extent to which charges for service covered total expenses. A ratio of one or higher indicates that the service is self-supporting.
Formula:charges for service/operating expenses (minus depreciation)
Source:Statement of Activities; Statement of Cash Flows
2012 2013 2014 2015 2016
$30,477,942 $34,215,578 $35,873,378 $35,905,739 $33,259,200
$21,875,174 $22,906,379 $24,251,542 $26,367,374 $26,521,969
1.4 1.5 1.5 1.4 1.3
Agency Response
City of Chino Hills
Report Created:1/22/2018
6San Bernardino LAFCO
Fiscal Indicators

Service Obligation (governmental)
DescriptionMeasures whether or not a government's annual revenues were sufficient to pay for annual operations. A ratio of one or higher indicates that a government lived within its annual revenues.
Formula:operating revenue/operating expenditures
Source:Statement of Revenues, Expenditures and Changes in Fund Balance
2012 2013 2014 2015 2016
$53,738,202 $51,733,129 $67,306,063 $63,295,782 $93,781,007
$60,897,692 $57,499,462 $63,141,477 $61,065,250 $85,699,817
0.9 0.9 1.1 1.0 1.1
Agency Response
City of Chino Hills
Report Created:1/22/2018
7San Bernardino LAFCO
Fiscal Indicators

Liquidity
DescriptionMeasures a government's ability to meet its short-term obligations. A high ratio suggests a government is able to meet its short-term obligations.
Formula:cash & investments (does not include fiscal agents, restricted, or fiduciary)/current liabilities
Source:Statement of Net Position
2012 2013 2014 2015 2016
$94,198,267 $95,625,949 $109,807,579 $120,072,208 $135,641,623
$8,967,075 $10,917,280 $12,792,403 $12,438,924 $10,563,634
10.5 8.8 8.6 9.7 12.8
Agency Response
City of Chino Hills
Report Created:1/22/2018
8San Bernardino LAFCO
Fiscal Indicators

Change in Cash and Cash Equivalents (business)
DescriptionCash and cash equivalents are the most liquid assets of an agency’s assets and can be readily converted into cash. A positive percent change indicates that a government's cash position has improved.
Formula:change in cash & cash equivalents/begin cash & cash equivalents
Source:Statement of Cash Flows
2012 2013 2014 2015 2016
($3,957,076) $8,315,005 $4,829,352 $7,474,362 $5,535,039
$36,391,416 $32,434,340 $40,749,345 $45,578,697 $53,053,059
-10.9% 25.6% 11.9% 16.4% 10.4%
Agency Response
City of Chino Hills
Report Created:1/22/2018
9San Bernardino LAFCO
Fiscal Indicators

Debt Service (governmental)
DescriptionLooks at service flexibility by determining the amount of total expenditures committed to annual debt service. Service flexibility decreases as more resources are committed to annual debt service.
Formula:debt service/operating expenditures
Source:Statement of Revenues, Expenditures and Changes in Fund Balance
2012 2013 2014 2015 2016
$10,519,851 $1,942,524 $7,242,846 $2,074,445 $20,599,433
$60,897,692 $57,499,462 $63,141,477 $61,065,250 $85,699,817
17.3% 3.4% 11.5% 3.4% 24.0%
Agency ResponseIn FY 15/16, the large increase in debt service payments was the result of the refunding of the 2007 Certificates of Participation (COP) in the amount of $14.2 million.
City of Chino Hills
Report Created:1/22/2018
10San Bernardino LAFCO
Fiscal Indicators

Debt Service (business)
DescriptionLooks at service flexibility by determining the amount of total expenses committed to annual debt service. Service flexibility decreases as more resources are committed to annual debt service.
Formula:debt service/operating expenses (minus depreciation)
Source:Statement of Cash Flows; Statement of Activities
2012 2013 2014 2015 2016
$2,084,971 $19,895,359 $2,230,152 $2,222,250 $2,220,449
$21,875,174 $22,906,379 $24,251,542 $26,367,374 $26,521,969
9.5% 86.9% 9.2% 8.4% 8.4%
Agency ResponseIn FY 12/13 the City refunded the 2002 and 2003 Certificates of Participation and issued the 2012 Water Revenue Bonds.
City of Chino Hills
Report Created:1/22/2018
11San Bernardino LAFCO
Fiscal Indicators

Pension Payments (Pre GASB 68: through 2014)
DescriptionThis indicator depicts the relationship between the pension payments as a percentage of an agency’s total revenues. Due to updates to pension reporting requirements, this Pension Payments indicator shows data through 2014. GASB 68 revised and established new financial reporting for pensions effective for 2015. For pension payments for 2015 and beyond, please refer to the next fiscal indicator.
Formula:annual pension cost/total revenue
Source:Notes; Statement of Revenues, Expenditures and Changes in Fund Balance
2012 2013 2014 2015 2016
$3,800,665 $4,467,097 $4,510,221 - -
$84,551,704 $86,120,966 $105,037,587 - -
4.5% 5.2% 4.3% - -
Agency Response
City of Chino Hills
Report Created:1/22/2018
12San Bernardino LAFCO
Fiscal Indicators

Pension Payments (Post GASB 68: 2015 and beyond)
DescriptionThis indicator depicts the relationship between pension contributions as a percentage of covered-employee payroll. Due to updates to pension reporting requirements, this Pension Payments indicator shows data for 2015 and beyond. GASB 68 revised and established new financial reporting for pensions effective for 2015. For pension payments through 2014, please refer to the previous fiscal indicator.
Formula:contributions in relation to the actuarially determined contribution/covered payroll
Source:Schedule of Plan Contributions
2012 2013 2014 2015 2016
- - - $4,546,047 $5,528,874
- - - $11,999,151 $12,556,972
- - - 37.9% 44.0%
Agency Response
City of Chino Hills
Report Created:1/22/2018
13San Bernardino LAFCO
Fiscal Indicators

Other Post Employment Benefits (OPEB) Payments
DescriptionMonitors whether the agency is able to pay or is paying the amount required to fund the OPEB system as determined by its actuary.
Formula:OPEB payments/OPEB annual cost
Source:Notes
2012 2013 2014 2015 2016
$2,352 $2,448 $4,985 $8,033 $13,173
$102,323 $98,593 $94,821 $123,842 $106,231
2.3% 2.5% 5.3% 6.5% 12.4%
Agency Response
City of Chino Hills
Report Created:1/22/2018
14San Bernardino LAFCO
Fiscal Indicators