City of Bowie, Maryland
104
City of Bowie, Maryland City of Bowie, Maryland Comprehensive Annual Financial Report Comprehensive Annual Financial Report Fiscal Year Ended June 30, 2007 Fiscal Year Ended June 30, 2007
Transcript of City of Bowie, Maryland

City of Bowie, MarylandCity of Bowie, Maryland
Comprehensive Annual Financial ReportComprehensive Annual Financial Report Fiscal Year Ended June 30, 2007 Fiscal Year Ended June 30, 2007

In November 2005, 77% of the voters supported the creation of a City Police Department. On September 11, 2006, the City hired its first police chief. By June 30, 2007, fifteen officers were on board, including a Deputy Police Chief. In addition, a temporary police facility was located adjacent to City Hall.

C O M P R E H E N S I V E AN N U AL F I N AN C I AL R E P O R T
I s s u e d B y
C i t y O f B o w i e , P r i n c e G e o r g e ' s C o u n t y
M a r y l a n d
F o r F i s c a l Y e a r
J u l y 1 , 2 0 0 6 T o J u n e 3 0 , 2 0 0 7
P r e p a r e d B y D e p a r t m e n t O f F i n a n c e
R o b e r t S . P a t r i c k , F i n a n c e D i r e c t o r
H . B y r o n M a t t h e w s , A s s i s t a n t F i n a n c e D i r e c t o r
A l i c e S m i t h , A c c o u n t a n t
K a t h l e e n S t r a s e r , A c c o u n t a n t

CITY OF BOWIE, MARYLAND
COMPREHENSIVE ANNUAL FINANCIAL REPORTFOR THE FISCAL YEAR ENDED JUNE 30, 2007
Table of Contents
INTRODUCTORY SECTIONOfficial Roster……………………………………………………………………………………………………………………………………………………………………………………………………………………………………..1Letter of Transmittal…………………………………………………………………………………………………………………………………………………………………………………………………………………………………2Certificate of Achievement for Excellence in Financial Reporting……………………………………………………………………………………………………………………………………………………………………………………………………………………………………10Organization Chart…………………………………………………………………………………………………………………………………………………………………………………………………………………………………….11
FINANCIAL SECTIONIndependent Auditor's Report……………………………………………………………………………………………………………………………………………………………………………………………………………………………………..15Management's Discussion and Analysis…………………………………………………………………………………………………………………………………………………………………………………………………………………………………..17
Basic Financial StatementsGovernment-wide Financial Statements
Statement of Net Assets………………………………………………………………………………………………………………………………………………………………………………………………………………………………………32Statement of Activities……………………………………………………………………………………………………………………………………………………………………………………………………………………………………33
Fund Financial StatementsBalance Sheet - Governmental Funds……………………………………………………………………………………………………………………………………………………………………………………………………………………………………..36Statement of Revenues, Expenditures, and Changes in Fund Balances - Governmental Funds……………………………………………………………………………………………………………………………………………………………………………………………………………………37Reconciliation of the Statement of Revenues, Expenditures, and Changes in
Fund Balances of Governmental Funds to the Statement of Activities………………………………………………………………………………………………………….38Statement of Net Assets - Proprietary Fund……………………………………………………………………………………………………………….39Statement of Revenues, Expenses, and Changes in Net Assets - Proprietary Fund………………………………………………………………………………………………………………40Statement of Cash Flows - Proprietary Fund……………………………………………………………………………………………………………..41Notes to Basic Financial Statements…………………………………………………………………………………………………………………………………………………………………………………………………………………………………44
Required Supplementary InformationBudgetary Comparison Schedule - General Fund…………………………………………………………………………………………………………………………………………………………………………………………………………………………………………66Notes to Required Supplementary Information………………………………………………………………………………………………………………………………………………………………………………………………………………………………..68
Other Supplementary InformationFund descriptions…………………………………………………………………………………………………………………………………………………………………………………………………………………………….70

Individual Fund Schedules Schedule of Revenues, Expenditures and Encumbrances and Changes in Fund Balance - Budget (Non-GAAP
Budgetary Basis) and Actual - Equipment Acquisition and Replacement Fund…………………………………………………………………………………………………………………………………………………………………………………………………………………………………………71Schedule of Revenues, Expenditures and Encumbrances and Changes in Fund Balance - Budget (Non-GAAP
Budgetary Basis) and Actual - Capital Projects Fund…………………………………………………………………………………………………………………………………………………………………………………………………………………………………………72Schedule of Revenues, Expenses and Other Financing Sources (Uses) -
Budget (Non-GAAP Budgetary Basis) and Actual - Water and Sewer Fund………………………………………………………………………………………………………………………………………………………………………………………………………………………………………….73
STATISTICAL SECTIONNet Assets by Component………………...………………………………………………………………………………………………………………….77Changes in Net Assets…………………………………..…………………………………………………………………………………………………………………78Fund Balances of Governmental Funds…………………………...…………………………………………………………………………………………………..80Changes in Fund Balances of Governmental Funds…………………………...………………………………………………………………………………..81Assessed Value and Estimated Actual Value of Taxable Property…………………………...………………………………………………………………..82Property Tax Rates - Direct and Overlapping Governments……………………………..……………………………………………………………………………83Principal Property Taxpayers………………………………………………………………..…………………………………………………………………………….84Property Tax Levies and Collections………………………………………………………..………………………………………………………………………………85Ratios of Outstanding Debt by Type……………………………………………………….…………………………………………………………………………….86Direct and Overlapping Governmental Activities Debt…………………………………….…………………………………………………………………………….87Legal Debt Margin Information……………………………………………………………...……………………………………………………………………………..88Demographic and Economic Statistics……………………………………………………...……………………………………………………………………………..89Principal Employers…………………………………………………………………………………..……………………………………………………………………………..90Full-time Equivalent City Government Employees by Function……………………………….…………………………………………………………………………….91Operating Indicators by Function………………………………………………………………...……………………………………………………………………….93Capital Asset Statistics by Function……………………………………………………………….…………………………………………………………………………95

SECTION I INTRODUCTORY

“Growth, Unity, Progress”

CITY COUNCIL
G. FREDERICK ROBINSON, MAYOR
TODD M. TURNER, MAYOR PRO TEM
DENNIS BRADY JAMES L. MARCOS
DIANE M. POLANGIN
ISAAC C. TROUTH GERALDINE VALENTINO-SMITH
==================================
CITY MANAGERDAVID J. DEUTSCH
ASSISTANT CITY MANAGERJOHN L. FITZWATER
CITY ATTORNEYROBERT H. LEVAN
FINANCE DIRECTOR ASSISTANT FINANCE DIRECTORROBERT S. PATRICK H. BYRON MATTHEWS
INDEPENDENT CERTIFIED PUBLIC ACCOUNTANTSREZNICK GROUP, P.C.

2
CITY OF BOWIE
December 20, 2007
Honorable Members of the Bowie City Council:
State law requires that all municipalities publish within four months of the close of each fiscal year a complete set of financial statements presented in conformity with generally accepted accounting principles (GAAP) and audited in accordance with generally accepted auditing standards by a certified public accountant. Pursuant to that requirement and the provisions of the City’s Charter, Section 40, we hereby issue the comprehensive annual financial report (CAFR) for the City of Bowie, Maryland, for the year ended June 30, 2007.
This report consists of management’s representations concerning the finances of the City of Bowie, Maryland. Consequently, management assumes full responsibility for the completeness and reliability of all the information presented in this report. To provide a reasonable basis for making these representations, management of the City of Bowie, Maryland has established a comprehensive internal control framework that is designed both to protect the government’s assets from loss, theft, or misuse and to compile sufficient reliable information for the preparation of the City of Bowie, Maryland statements in conformity with GAAP. Because the cost of internal controls should not outweigh their benefits, the City of Bowie, Maryland comprehensive framework of internal controls has been designed to provide reasonable rather than absolute assurance that the financial statements will be free from material misstatement. As management, we assert that, to the best of our knowledge and belief, this financial report is complete and reliable in all material respects.
Reznick Group, P.C., a firm of licensed certified public accountants, has audited the City of Bowie, Maryland’s financial statements. The goal of the independent audit was to provide reasonable assurance that the basic financial statements of the City of Bowie, Maryland for the fiscal year ended June 30, 2007, are free of material misstatement. The independent audit involved examining, on a test basis, evidence supporting the amounts and disclosures in the basic financial statements; assessing the accounting principles used and significant estimates made by management; and evaluating the overall financial statement presentation. The independent auditor concluded, based upon the audit, that there was a reasonable basis for rendering an unqualified opinion that the City of Bowie, Maryland financial statements for the fiscal year ended June 30, 2007,

3
are fairly presented in conformity with GAAP. The independent auditor’s report is presented as the first component of the Financial Section of the CAFR.
GAAP requires that management provide a narrative introduction, overview, and analysis to accompany the basic financial statements in the form of Management’s Discussion and Analysis (MD&A). This letter of transmittal is designed to complement MD&A and should be read in conjunction with it. The City of Bowie, Maryland’s MD&A can be found immediately following the report of the independent auditor in the Financial Section of the CAFR.
PROFILE OF THE GOVERNMENT
The City of Bowie is approximately 18 square miles in size and located halfway between Washington, DC, and Baltimore, Maryland. Founded in 1870, and incorporated as a town in 1916, Bowie has grown from a small railroad stop to the largest municipality in Prince George’s County, and the fourth largest city in the State of Maryland, with an estimated population of 55,626. The town was first called Huntington City, though its train station was named in honor of local resident, Governor Oden Bowie, president of the Baltimore and Potomac Railroad. The town was subsequently rechartered as Bowie. In the early days the land was subdivided by developers into more than 500 residential building lots, to create a large town site at a junction of the Baltimore and Potomac’s main line to southern Maryland, and the branch line to Washington, DC.
In 1957, the firm of Levitt and Sons acquired the nearby Belair Estate, the original colonial plantation of Governor Samuel Ogle, where it developed the residential community of “Belair at Bowie”. Two years later the Town of Bowie annexed the Levitt properties, and it re-incorporated as a city in 1963.
Today, the City of Bowie represents 8.2% of the total Prince George’s County assessable base and 32% of the total municipal assessable base within the county.
The City of Bowie operates under a Council/Manager form of government. Policy-making and legislative authority are vested in a governing council consisting of seven members (Mayor and six Council members). The governing council is responsible, among other things, for passing ordinances, adopting the budget, appointing committees, and hiring both the government’s manager and attorney. The government’s manager is responsible for carrying out the policies and ordinances of the governing council, for overseeing the day-to-day operations of the government, and for appointing the heads of the various departments. The council is elected on a non-partisan basis. All seven members serve two-year terms. Four of the council members are elected by district. The mayor and the two remaining council members are elected at large.
The City provides a range of municipal services including, but not limited to the following: housing and property inspections; solid waste and recycling collection; police department; storm drainage; street and bike trail maintenance; snow removal and

4
street lighting; parks and recreation; youth counseling; senior services and animal control. In addition, the City also provides water and sewer services to approximately 7,900 customers, of which 98% are residential households.
ECONOMIC CONDITION AND OUTLOOK
The City is located in the northern part of Prince George’s County at the crossroads of highways 3/301 and 50. Although considered to be in the Washington, DC metropolitan area, the City’s location also gives it easy access to Baltimore and Annapolis. The City’s total assessed value continues to grow, primarily due to increasing assessed values, commercial development and continued annexations of adjacent properties. The City issued 44 permits for new home construction during FY2007 as compared to 33 permits issued in FY2006. The majority of homes in the city are owner occupied single-family homes that the 2000 census placed in the price range of $150,000 to $199,000 with a median value of $158,100. The price of homes sold in the City during FY2007 well exceeded the median values from the 2000 census. The current economic condition of the City is excellent, with an outlook for the intermediate to longer term of stable.
The Maryland Department of Labor, Licensing and Regulation reported the unemployment rate in Prince George’s County at 4.2percent and the State at 4 percent on June 30, 2007. The 2000 Census showed the median household income for the City of Bowie at $76,778. The income level far exceeds the State of Maryland at $45,289 and the United States at $37,005. According to the Office of Federal Housing Enterprise Oversight, Maryland ranked twenty-first in the nation for home price appreciation during the last year.
State-administered income tax proceeds, the City’s largest source of intergovernmental revenue, increased by 4.3% in FY2007. State-administered Highway User Revenues, the City’s second largest source of intergovernmental revenue, increased by 3% in FY2007. Uncertainty surrounding the State of Maryland’s budget stresses the need for the City to maintain its fiscally conservative policy.
The City prepares long-term financial forecasts which are used in the development of the annual operating budget and six-year capital improvements program. The assumptions used in the financial forecasts are reviewed with the City Council as background for decisions about revenue projections and estimated costs.
RELEVANT FINANCIAL POLICIES
In October 2006, the City sold a parcel of surplus land, commonly referred to as the Hohensee Property. It is the City’s policy that “onetime” resource inflows not be used for operating purposes. Accordingly, the City has designated the proceeds from the land sale for the construction of a new City Hall.

5
MAJOR INITIATIVES
The following activities highlight some of the City’s major accomplishments during FY2007:
In November 2005, 77% of the voters supported the creation of a City Police Department. On September 11, 2006, the City hired its first police chief. By June 30, 2007, fifteen officers were on board, including a Deputy Police Chief. In addition, a temporary police facility was located adjacent to City Hall.
The City received an innovation award from the Maryland Municipal League for its implementation of a recreation and facility management system.
Eight City employees traveled to Bowie’s adopted city of D’Iberville, Mississippi to assist with rebuilding efforts necessitated by the damage caused by Hurricane Katrina. Proceeds from a Bowie staff yard sale were presented at a D’Iberville City Council meeting to benefit the employees whose homes had been destroyed by the hurricane. Donations from Bowie businesses, churches, clubs, and individuals were presented to the D’Iberville Volunteer Foundation to assist with rebuilding efforts.
On August 25, 2006, the City opened a 10,000 square foot concrete skate park located at Allen Pond Park. The facility grand opening attracted more than 500 attendees.
The City purchased its first three hybrid vehicles for use in the motor pool.
The Senior Center developed a marketing plan to reach the Boomers generation ages 55-60 which has weekly programs tailored to this group and featured a Boomer Week.
The Youth Services Bureau distributed drug awareness kits to each of the seventeen elementary and middle schools within the City of Bowie.
A contract was awarded in the amount of $4.1 million dollars, to demolish and construct a new Parks and Grounds and Stormwater Management Maintenance Facility that will house 37 staff. The staff at this 3-acre facility is responsible for the maintenance of all athletic fields, trails, curb trees, rights of way, field lighting and stormwater management facilities. The facility will be a certified Silver LEEDS facility which will feature a living roof, the use of recycled materials, solar energy, and geothermal heating. The projected completion date is early 2008.
Facility generators were installed at the Bowie Senior Center and the Bowie Ice Arena. These improvements, allow each site to operate independently in the event of loss of electricity.
The snack bar at the Bowie Ice Arena implemented an inventory software package. This allows staff to track sales, maintain inventory and order materials.

6
The Old Town Bowie Residential Façade Program concluded on February 1, 2007. This sixteen-month program, designed with input from the community, enabled Huntington residents to invest over $100,000 in façade projects and improve fourteen neighborhood homes.
During the months of September 2006 and February 2007, the City experienced two huge storms that created tremendous debris which was collected and eventually hauled away for recycling. Crews from the City’s Public Works and Community Services departments were responsible for the city-wide clean up effort.
The City is a member of the Baltimore Regional Cooperative Purchasing Committee (BRCPC). This buying co-op allows its members to purchase electricity at lower rates. In FY2007, the City saved $367,028 in electricity costs. Therefore, even though the City experienced higher electric rates in FY2007 than it did in FY2006, the magnitude of the increase was greatly reduced because of the City’s participation with the BRCPC.
Completion of a segment of the hiker/biker trail along MD Route 197.
Significant construction occurred on the new Parks and Grounds facility. The facility will incorporate Green Building and Low Impact Development features.
Continued curb, gutter and sidewalk improvements in Old Town Bowie.
Completion of Lansdale Park, including a hiker/biker trail and cemetery memorial.
The Hohensee property was sold during the year. Proceeds from this land sale will be used for the construction of a new City Hall.
In January 2007, the Public Improvement Refunding Bonds of 1994 were redeemed.
Several new buildings were constructed or neared completion at the Maryland Science and Technology Center during the year including: a 150,000 square foot Class “A” office building; two 40,800 square foot office buildings; and the International Masonry Institute, which includes a 234,000 square foot campus consisting of a60,500 square foot national training center, a 45,500 square foot main building/dormitory.
Completion of the new Northview Elementary School.
A City Hall space evaluation study was conducted. The study determined current and future facility needs.
The State Highway Administration opened a new bridge over the CSX railroad tracks on Old MD Route 450, providing access to West Bowie Village.
The Maryland-National Capital Park and Planning Commission completed major renovations to the Bowie Community Center located on Stonybrook Drive.
The Shoppes at Highbridge, consisting of 60,000 square feet of retail commercial space located at the intersection of MD Route 450 and High Bridge Road, opened during the year.

7
Construction completed on a 132,000 square foot office building and one bank at the Bowie Corporate Center.
In March 2006, the City approved the granting of a franchise agreement with Verizon to provide high speed internet, voice over internet protocol, and video-on-demand services to Bowie customers. Verizon began installing fiber throughout the city and substantially completed the project by June 2007.
Major changes at Freestate Shopping Center neared completion, including a new prototype Giant Food Store and Cold Stone Creamery.
The City actively pursued and received grants for various capital projects.
Future developments include:
FY2007 real and personal property tax rates remain at $.352 and $.88 per hundred dollars of assessed valuation, respectively.
Selection of a project management firm to oversee the design and construction of a new 80,000 square foot City Hall, to be located at the Bowie Town Center.
The City’s Police Department is scheduled to receive a $500,000 interoperability appropriation from the federal government for 800 megahertz radios for all Bowie police officers.
The FY2008 budget includes the hiring of 17 new officers for the City’s Police Department, bringing the total number of officers to 33 by June 30, 2008.
Plans submitted for 287 multi-family apartment units on Health Center Drive near the Bowie Town Center.
Anticipated construction by Prince George’s County of a full service fire/EMS station at the intersection of Health Center and Northview Drives.
A major upgrade to the Waste Water Treatment Plant is planned, which includes an enhanced nutrient removal system that will help improve the health of the Chesapeake Bay. The State’s Bay Restoration Fund will contribute approximately 85% towards the cost of this project.
Annexation of Phase I of the Ashleigh subdivision (77 single family homes).
Implementation of the GOVQA system. This Government Question and Answer system, which also includes a service request option, will be added to the City’s website.
Renovation of the South Bowie Community Center by the Maryland-National Capital Park and Planning Commission.

8
Building permit application submitted for a 150,000 square foot, four-story office building at the Maryland Science and Technology Center. Plans have been submitted for a 300-room hotel conference center, 135,000 square feet of office space in five buildings and 250,000 square feet of flex space in seven buildings at this same location.
RETIREMENT AND OTHER POSTEMPLOYMENT BENEFITS
The City has a defined contribution employee savings plan authorized under Section 401(k) of the Internal Revenue Service Code covering all full-time employees. Additionally, the City has established a deferred compensation plan in accordance with Internal Revenue Code Section 457 which is available to all employees.
The City also provides hospitalization and prescription benefits for qualifying retirees. Two retirees received benefits during the year, which were financed on a pay-as-you-go basis.
Additional information on the City’s retirement and other post-employment benefits can be found in Notes 3F, 3G and 3I to the basic financial statements.
CASH MANAGEMENT
Temporary idle cash during the year was invested in the State created Maryland Local Government Investment Pool, certificates of deposit, and an interest bearing cash account. On June 30, 2007, the City’s financial assets consisted of $1,304,918 cash and $35,652,593 in the investment pool. Interest earned on investments during fiscal year 2007 totaled $1,804,308. This was $648,552 more than the interest earned on investments in fiscal year 2006.
Additional information on the City’s cash management can be found in Note 3 to the basic financial statements.
RISK MANAGEMENT
On July 1, 1987, the City joined with other local governments and formed the Local Government Insurance Trust. The Local Government Insurance Trust is a self-insurance pool providing coverage for all risks except Workers’ Compensation. The Injured Workers’ Insurance Fund, a not-for-profit organization established by the State of Maryland, provides coverage for Workers’ Compensation.
Additional information on the City’s risk management can be found in Note 4 to the basic financial statements.

9
CERTIFICATE OF ACHIEVEMENT FOR EXCELLENCE IN FINANCIAL REPORTING
The Government Finance Officers Association of the United States and Canada (GFOA) awarded a Certificate of Achievement for Excellence in Financial Reporting to the City of Bowie, Maryland, for its comprehensive annual financial report for the fiscal year ended June 30, 2006. This was the thirty-third consecutive year that the government has achieved this prestigious award. In order to be awarded a Certificate of Achievement, a government must publish an easily readable and efficiently organized comprehensive annual financial report. This report must satisfy both generally accepted accounting principles and applicable legal requirements.
A Certificate of Achievement is valid for a period of one year only. We believe that our current comprehensive annual financial report continues to meet the Certificate of Achievement Program’s requirements and we are submitting it to the GFOA, pursuant to an approved extension request, to determine its eligibility for another certificate.
DISTINGUISHED BUDGET PRESENTATION
The Government Finance Officers Association of the United States and Canada (GFOA) presented an award of Distinguished Budget Presentation to the City of Bowie for its annual budget for the fiscal year beginning July 1, 2007. In order to receive this award, a governmental unit must publish a budget document that meets program criteria as a policy document, as an operations guide, as a financial plan and as a communication device.
This award is valid for a period of one year only. We believe our current budget continues to conform to program requirements, and we are submitting it to GFOA to determine its eligibility for another award.
ACKNOWLEDGMENTS
Our sincere appreciation is extended to the staff of the Finance Department whose efficient and dedicated support throughout the year has culminated in the completion of this report. A word of thanks also goes to the City staff for their continuing cooperation. We thank the City Council for their interest and support in the planning and implementing of the financial operations of the City. A special acknowledgment is given to H. Byron Matthews, Kathleen Straser, Alice Smith, Michael Finelli and Ellen Hall for their efforts in the completion of this report.
Respectfully submitted:
David J. Deutsch Robert S. PatrickCity Manager Finance Director


CITIZENS OF BOWIE
CITY COUNCIL
CITY COMMITTEES CITY ATTORNEY
CITY MANAGER
ASSISTANT CITY MANAGER
INFORMATION TECHNOLOGY
FINANCECOMMUNITY
SERVICES
PLANNING AND ECONOMIC
DEVELOPMENTPUBLIC WORKS
CITY MANAGER’S OFFICE
CITY OF BOWIE, MARYLANDCITY OF BOWIE, MARYLANDCITY OF BOWIE, MARYLANDORGANIZATION CHARTORGANIZATION CHARTORGANIZATION CHART
City ManagerPersonnelElectionsLegal ServicesPublic InformationCity ClerkPublic SafetyRisk ManagementGrants
Network ServicesVoice ServicesData ServicesInternet ServicesGIS Services
AccountingBudgetingFinancial ReportingPayrollTax BillingWater and Sewer BillingDebt Administration
Public BuildingsCode ComplianceSenior Citizen ServicesYouth ServicesAnimal ControlSpecial Events and Park OperationsParks and GroundsStormwater ManagementIce ArenaHistoric Properties and MuseumsGymnasium
PlanningEconomic Development
Equipment MaintenanceSolid Waste CollectionStreet MaintenanceStreet LightingSnow RemovalWater and SewerEngineeringProject Management
POLICE DEPARTMENT
Police Services

“Growth, Unity, Progress”

SECTION II FINANCIAL

“Growth, Unity, Progress”


MANAGEMENT’S DISCUSSION AND ANALYSIS
The Management’s Discussion and Analysis (MD&A) of the City of Bowie’s Comprehensive Annual Financial Report (CAFR) presents a narrative overview and analysis of the financial activities for the fiscal year ended June 30, 2007. The information presented here should be considered in conjunction with additional information provided in the letter of transmittal.
Financial Highlights
The assets of the City exceeded its liabilities at June 30, 2007 by $114.1 million (net assets). Of this amount, $38.5 million is unrestricted and may be used to meet the City’s future obligations. Of the $38.5 million unrestricted assets, $36.9 million is related to governmental activities, which includes the General Fund. Of the $36.9 million unrestricted assets, $20.8 million is undesignated and available for future General Fund expenditures. The $1.6 million remaining balance of unrestricted assets is related to Business-type activities, which consists entirely of the City’s Water and Sewer Fund.
The unreserved fund balance for the General Fund represented 71.4% of total General Fund expenditures compared to the Council adopted target of 25%.
In comparison with the prior fiscal year, the City’s total net assets increased $9.5 million from $104.6 million. Net assets of governmental activities increased $10.1 million from $89.8 million and net assets of business-type activities decreased approximately $0.6 million from $14.9 million.
During the current fiscal year, the City’s total long-term debt decreased by $1 million.
Overview of the Financial Statements
The financial section of the CAFR consists of three parts – management’s discussion and analysis (this section), the basic financial statements and required supplementary information. This discussion and analysis are intended to serve as an introduction to the City of Bowie’s basic financial statements. The City of Bowie’s basic financial statements are comprised of three components: 1) government-wide financial statements, 2) fund financial statements, and 3) notes to the financial statements. This report also contains other supplementary information in addition to the basic financial statements.
The basic financial statements include two kinds of statements that present different views of the City:
The first two statements are government-wide financial statements that provide both long-term and short-term information about the City’s overall financial status.
The remaining statements are fund financial statements that focus on individual parts of the City government, reporting the City’s operations in more detail than the government-wide statements.
The financial statements also include notes that explain some of the information in the financial statements and provide more detailed data. The statements are followed by a section of required supplementary information that further explains and supports the information in the financial statements.
Government-wide financial statements. The government-wide financial statements are designed to provide readers with a broad overview of the City of Bowie’s finances, in a manner similar to a private-sector business. These statements are prepared using the accrual basis of accounting.
The statement of net assets presents information on all of the City’s assets and liabilities, with the difference between the two reported as net assets. Over time, increases or decreases in net assets may serve as a useful indicator of whether the financial position of the City is improving or deteriorating.
The statement of activities presents information showing how the City’s net assets changed during the most recent fiscal year. All changes in net assets are reported as soon as the underlying event giving rise to the change occurs, regardless of the timing of related cash flows. Thus, revenues and expenses are reported in this statement for some items that will only result in cash flows in future fiscal periods.
Both of the government-wide financial statements distinguish functions of the City that are principally supported by taxes and intergovernmental revenues (governmental activities) from other functions that are intended to recover all or a significant portion of their costs through user fees and charges (business-type activities). The governmental activities of the City of Bowie include general government, economic development, public safety, social services, public works, parks, culture and recreation, and interest expense. Business-type activities are limited to the City’s water and sewer system.
Fund financial statements. Traditional readers of government financial statements will find the fund financial statement presentation more familiar. The focus is now on the City’s most significant funds. A fund is a grouping of related accounts that is used to maintain control over resources that have been segregated for specific activities or objectives. The City uses fund accounting to ensure and demonstrate fiscal accountability. The City uses governmental and proprietary fund financial statements to provide more detailed information about the City’s most significant funds rather than the City as a whole.
Governmental funds. Most of the City’s basic services are reported in governmental funds, which focus on how money flows into and out of those funds and the balances left at year-end that are available for spending. These funds are reported using an accounting method called modified accrual accounting, which measures cash and all other financial assets that can readily be converted to cash. The governmental fund statements provide a detailed short-term view of the City’s general government operations and the basic services it provides. Governmental fund information helps you determine whether there are more or fewer financial resources that can be spent in the near future to finance the City’s programs. We describe the relationship (or differences) between governmental activities (reported in the Statement of Net Assets and the Statement of Activities) and governmental funds in a reconciliation at the bottom of the fund financial statements.

Proprietary funds. Proprietary funds are used to account for operations that are financed and operated in a manner similar to private business enterprises in which costs are recovered primarily through user charges. Proprietary fund financial statements, like government-wide financial statements, provide both long-term and short-term financial information. The fund financial statements provide more detail and additional information, such as cash flows, for the City’s enterprise fund (one type of proprietary fund). The enterprise fund is used to report the same functions presented as business-type activities in the government-wide financial statements. The City uses an enterprise fund to account for its water and sewer operations.
Notes to the Basic Financial Statements. The notes to the basic financial statements provide additional information that is essential to a full understanding of the data provided in the government-wide and fund financial statements.
Required Supplementary Information. In addition to the basic financial statements and accompanying notes, this report presents certain required supplementary information concerning the City. A budgetary comparison schedule has been provided for the General Fund.
Other Supplementary Information. Budgetary comparison schedules have been provided for the following funds to demonstrate compliance with their budgets:
Equipment Acquisition and Replacement Fund Capital Projects Fund Water and Sewer Fund
Statistical Section
The statistical section provides supplemental financial and statistical information intended to provide a broader understanding of the City’s financial and economic environment. Much of the data presented is multi-year and some of it is derived from records external to the City’s accounting records, therefore the statistical section is unaudited.
Financial Analysis of the City as a Whole
Government-wide Financial Analysis
The City’s financial statements are prepared in conformity with the reporting model required by Governmental Accounting Standards Board Statement No. 34 (GASB 34), Basic Financial Statements – and Management’s Discussion and Analysis (MD&A) – for State and Local Governments. MD&A includes prior fiscal year results for the purpose of providing comparative information.

2007Restated
2006 2007 2006 2007Restated
2006Current and other assets 40,000,424$ 34,066,229$ 2,406,706$ 2,538,039$ 42,407,130$ 36,604,268$ Capital assets, net 63,038,056 59,577,190 15,579,932 16,136,285 78,617,988 75,713,475
Total assets 103,038,480 93,643,419 17,986,638 18,674,324 121,025,118 112,317,743
Long-term liabilities outstanding 859,149 1,573,008 3,068,554 3,240,280 3,927,703 4,813,288 Other liabilities 2,268,358 2,292,014 680,916 564,988 2,949,274 2,857,002
Total liabilities 3,127,507 3,865,022 3,749,470 3,805,268 6,876,977 7,670,290
Net assets:Invested in capital assets, net of related debt 63,038,056 58,787,190 12,646,680 13,030,257 75,684,736 71,817,447 Unrestricted 36,872,917 30,991,207 1,590,488 1,838,799 38,463,405 32,830,006
Total net assets 99,910,973$ 89,778,397$ 14,237,168$ 14,869,056$ 114,148,141$ 104,647,453$
Net Assets
Governmental activities Business-type activities Total
As noted earlier, net assets may serve over time as a useful indicator of a government’s financial position. At June 30, 2007, the City’s assets exceeded liabilities by $114.1 million.
By far the largest portion of the City’s net assets (66 percent) reflects its investment in capital assets, less any related debt used to acquire those assets that is still outstanding. Capital assets are used to provide services to residents; consequently, these assets are not available for future spending. Although the investment in capital assets are reported net of related debt, it should be noted that the resources needed to repay this debt must be provided from other sources, since the capital assets themselves cannot be used to liquidate these liabilities.
At the end of the current fiscal year, the City is able to report positive balances in all three categories of net assets, both for the government as a whole, as well as for its separate governmental and business-type activities. The same situation held true for the prior fiscal year.
The governmental activities investment in capital assets, net of related debt increased by $4.3 million or 7.2%. Most of this increase is related to construction in progress for the new Parks Maintenance Facility and the addition of infrastructure.
The business-type activities investment in capital assets, net of related debt decreased by $0.4 million or 2.9%.

The following table summarizes the City’s change in net assets for the year ended June 30, 2007:
2007Restated
2006 2007 2006 2007Restated
2006
Revenues:
Program revenues:
Charges for service 1,774,328$ 1,596,909$ 4,086,247$ 4,171,785$ 5,860,575$ 5,768,694$
Operating grants and contributions 653,146 608,325 - - 653,146 608,325
Capital grants and contributions 450,803 448,468 - - 450,803 448,468
General revenues:
Property taxes 17,394,203 14,868,855 - - 17,394,203 14,868,855
Income taxes 6,022,381 6,280,436 - - 6,022,381 6,280,436
State shared revenues 3,128,356 3,038,416 - - 3,128,356 3,038,416
Other taxes 955,894 906,281 - - 955,894 906,281
Other general revenues 2,942,107 2,605,651 76,536 85,596 3,018,643 2,691,247
Total revenues 33,321,218 30,353,341 4,162,783 4,257,381 37,484,001 34,610,722
Expenses:
General government 6,075,685 5,662,395 - - 6,075,685 5,662,395
Economic development 311,325 323,902 - - 311,325 323,902
Public safety 2,208,335 1,392,616 - - 2,208,335 1,392,616
Social services 1,581,332 1,429,927 - - 1,581,332 1,429,927
Public works 10,819,541 10,115,878 - - 10,819,541 10,115,878
Parks, culture and recreation 5,273,747 4,879,148 - - 5,273,747 4,879,148
Interest 16,223 45,192 16,223 45,192
Water and wastewater - - 4,474,971 4,118,182 4,474,971 4,118,182
Total expenses 26,286,188 23,849,058 4,474,971 4,118,182 30,761,159 27,967,240
Increase (Decrease) in net assets
before special items and transfers 7,035,030 6,504,283 (312,188) 139,199 6,722,842 6,643,482
Special item - gain on sale of land 2,777,846 - - - 2,777,846 -
Transfers 319,700 311,000 (319,700) (311,000) - -
Increase (Decrease) in net assets 10,132,576 6,815,283 (631,888) (171,801) 9,500,688 6,643,482
Net assets - beginning, as restated 89,778,397 82,963,114 14,869,056 15,040,857 104,647,453 98,003,971
Net assets - ending 99,910,973$ 89,778,397$ 14,237,168$ 14,869,056$ 114,148,141$ 104,647,453$
Governmental activities Business-type activities Total
Changes in Net Assets
The overall increase in the City’s net assets amounted to $9.5 million during the fiscal year. These increases are explained in the governmental and business-type activities discussion that follows.
Governmental Activities
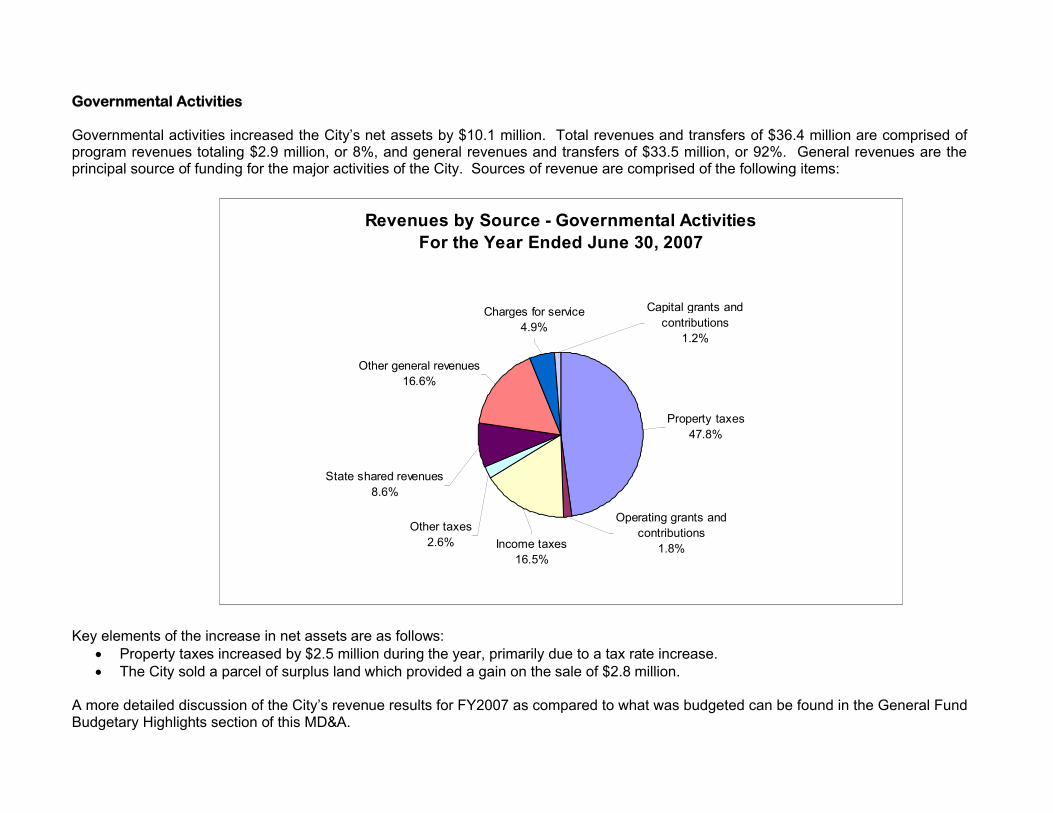
Governmental activities increased the City’s net assets by $10.1 million. Total revenues and transfers of $36.4 million are comprised of program revenues totaling $2.9 million, or 8%, and general revenues and transfers of $33.5 million, or 92%. General revenues are the principal source of funding for the major activities of the City. Sources of revenue are comprised of the following items:
Revenues by Source - Governmental ActivitiesFor the Year Ended June 30, 2007
Other general revenues16.6%
Charges for service4.9%
Property taxes47.8%
Income taxes16.5%
Other taxes2.6%
Operating grants and contributions
1.8%
State shared revenues8.6%
Capital grants and contributions
1.2%
Key elements of the increase in net assets are as follows: Property taxes increased by $2.5 million during the year, primarily due to a tax rate increase. The City sold a parcel of surplus land which provided a gain on the sale of $2.8 million.
A more detailed discussion of the City’s revenue results for FY2007 as compared to what was budgeted can be found in the General Fund Budgetary Highlights section of this MD&A.

The cost of all governmental activities for FY2007 was $26.3 million. As the following chart indicates, Public Works constitutes the City’s largest program, totaling $10.8 million. General government expenses totaled $6.1 million, while Parks, culture and recreation, the third largest expense for the City, totaled $5.3 million.
Expenses by Function - Governmental ActivitiesFor the Year Ended June 30, 2007
Economic development1%
General government23%
Social services6%
Public works42%
Parks, culture and recreation20%
Public safety8%
The following table presents the cost and program revenues of each of the City’s five largest programs – public works, general government, parks, culture and recreation, public safety, and social services – as well as each program’s net cost (total cost less fees generated by the activities and program-specific grants and contributions).

2007 2006 2007 2006 2007 2006Public works 10,819,541$ 10,115,878$ 825,036$ 875,595$ 9,994,505$ 9,240,283$ General government 6,075,685 5,662,395 117,734 48,343 5,957,951 5,614,052 Parks, culture and recreation 5,273,747 4,879,148 1,381,687 1,196,622 3,892,060 3,682,526 Public safety 2,208,335 1,392,616 346,269 335,874 1,862,066 1,056,742 Social services 1,581,332 1,429,927 207,551 184,768 1,373,781 1,245,159 Other 327,548 369,094 - 12,500 327,548 356,594
Total 26,286,188$ 23,849,058$ 2,878,277$ 2,653,702$ 23,407,911$ 21,195,356$
Net Cost of City's Governmental Activities
Expenses Program Revenues Net Cost of Services
Business-type Activities
The City’s water and sewer operation is reported here. Charges for services represent the principal revenue source for the City’s business-type activities. During the current fiscal year, revenue from business-type activities totaled $4.2 million. Expenses and transfers for these activities totaled $4.8 million and resulted in a decrease in net assets of $0.6 million.
Financial Analysis of the City’s Funds
As noted earlier, the City uses fund accounting to ensure and demonstrate compliance with finance-related legal requirements.
Governmental funds
The focus of the City’s governmental funds is to provide information on near-term inflows, outflows and balances of spendable resources. Such information is valuable in assessing the City’s financing requirements. In particular, the unreserved fund balance may serve as a useful measure of a government’s net resources available for spending at the end of the fiscal year. Types of major governmental funds reported by the City include the General Fund, Equipment Acquisition and Replacement Fund and the Capital Projects Fund.
At the end of FY2007, the City’s governmental funds reported combined ending fund balances of $35.5 million. Of the total ending fund balances, $31.5 million constitutes the unreserved fund balance, which is available for spending at the City’s discretion. Of the unreserved fund balance, $7.5 million has been designated by the City Council for subsequent years expenditures and other uses leaving an unreserved undesignated amount of $24 million. The remainder of fund balance is reserved to indicate that it is not available for new spending because it has already been committed to liquidate contracts and purchase orders of the prior period ($3.8 million) and to account for prepaid costs ($0.2 million).

The General Fund is the primary operating fund of the City. At the end of FY2007, unreserved and undesignated fund balance of the General Fund was $20.8 million, while the total fund balance totaled $22 million. As a measure of the General Fund’s liquidity, it may be useful to compare both unreserved and undesignated fund balance and total fund balance to total fund expenditures. Unreserved and undesignated fund balance represents 68.8 percent of the total General Fund expenditures and transfers out, while total fund balance represents 72.9 percent of the same amount.
The fund balance of the City’s General Fund increased by $2.6 million during the current fiscal year. Revenues increased by $3.4 million primarily due to increasing assessments of taxable property ($2.5 million). Interest income increased by $0.5 million as a result of higher interest rates. Intergovernmental revenues increased by $0.3 million, reflecting a $0.3 million increase in Income Taxes and a $0.1million increase in Highway User Revenue received from the State of Maryland.
Expenditures increased by $4.8 million as a result of the following:
Implementation of the new City police department increased Public Safety expenditures by $0.8 million. The increase of $1.1 million in the Public Works area is mainly attributable to the increased costs incurred by the Streets
Maintenance Division. Higher resurfacing costs and additional personnel and related fringe benefit costs accounted for $0.7 million of the increase in FY2007.
Transfers to the Equipment Acquisition and Replacement Fund and the Capital Projects Fund increased by $0.7 million and $0.6 million, respectively.
Debt service costs increased by $0.5 million.
The Equipment Acquisition and Replacement Fund has a total fund balance of $3.6 million, which predominantly is all designated by the City Council for subsequent years expenditures. The remainder of fund balance is reserved to indicate that it is not available for new spending because it has already been committed to liquidate contracts and purchase orders of the prior period. The net increase in fund balance during the current year was $0.5 million. The required transfer from the General Fund was $0.7 million more than the previous year. Expenditures increased by $0.3 million and included the purchase of 15 police cars and the replacement of two refuse trucks, threedump trucks and other equipment per the replacement schedule.
The Capital Projects Fund is used to account for the overall financing and expenditure of uncompleted projects. Of the total ending fund balance of $9.8 million, $6.4 million constitutes the unreserved fund balance. Of the unreserved fund balance, $3.1 million has been designated by the City Council for subsequent years expenditures and other uses, leaving an unreserved undesignated amount of $3.3million. The remainder of fund balance is reserved to indicate that it is not available for new spending because it has already been committed to liquidate contracts and purchase orders of the prior period ($3.5 million). The net increase in fund balance during the current year was $3.1 million. The transfer from the General Fund was $0.6 million less than the previous year. Expenditures increased by $1.5million as compared to the previous year.
Proprietary funds
The City’s proprietary funds provide the same type of information found in the government-wide statements, but include more detail.

Unrestricted net assets of the Water and Sewer Fund at the end of the year were $1.6 million. After a transfer to the General Fund of $0.3 million, the fund ended FY2007 with a decrease in net assets of $0.6 million.
A discussion of enterprise fund long-term debt can be found in the Debt Administration section presented later in this MD&A. Other factors concerning the finances of the enterprise fund are addressed in the discussion of the City’s business-type activities.
General Fund Budgetary Highlights
The City’s final budget differs from the original budget in that it contains City Council approved supplemental appropriations and transfers between activities. The amount of transfers between the major expenditure functions was relatively minor. Supplemental appropriations totaling $1,363,900 were approved. The supplemental appropriations can be briefly summarized as follows:
$575,600 – Increased the transfer to the Capital Projects Fund to provide additional funding for the new Parks Maintenance Facility and the installation of a new traffic signal on Northview Drive.
$543,000 – Redemption of the Public Improvement Refunding Bonds of 1994. $135,600 – Increased the transfer to the Equipment Acquisition and Replacement Fund to purchase an additional three police
cars. $59,700 – Updated the Green Infrastructure Plan and map. Funding provided by a federal grant $50,000 – Additional police personnel and related equipment.
Actual expenditures and other financing uses were $1.8 million less than the final amended budget. These differences can be briefly summarized as follows:
Initial Police Department expenditures were $0.4 million less, primarily due to personnel and fringe benefit costs being lower than anticipated.
Less than anticipated expenditures for contract police officers and the deferral of the installation of a new traffic signal at the intersections of Race Track Road, Idlewild Lane and Marquette Lane accounted for the $0.2 million difference between budgeted and actual expenditures.
Expenditures across the board in Recreation and Stormwater Management were $0.2 and $0.1 million, respectively, less than anticipated
Total Information Technology expenditures were $0.1 million less than budgeted. Public Information expenditures were $0.1 million less, primarily due to capital outlay costs being lower than anticipated. The required transfer to the Equipment Acquisition and Replacement Fund was $0.1 million less than originally estimated. The remaining differences were spread across the various other activities of the General Fund and were relatively minor within
each activity.
Revenues and other financing sources amounted to $32.8 million in fiscal year 2007, an increase of 11.6 percent from fiscal year 2006.

General property taxes produced $2.5 million more revenue than in fiscal year 2006, an increase of 17 percent. The assessable tax base increased to $4.6 billion, an increase of 9.5 percent.
Intergovernmental revenues increased by $0.3 million. Income tax and highway user revenue proceeds received from the State of Maryland increased by $0.3 million in total.
Expenditures and transfers amounted to $30.2 million, an increase of $4.8 million, or 19.2 percent from fiscal year 2006.
Transfer to the Equipment Acquisition and Replacement Fund and the Capital Projects Fund increased by $0.7 million and $0.6 million respectively.
Capital Assets and Debt Administration
Capital Assets
The City’s capital assets for its governmental and business-type activities as of June 30, 2007, amounted to $78.6 million (net of accumulated depreciation). Capital assets include land, historical treasures, building and improvements, improvements other than buildings, machinery and equipment and infrastructure. The total net increase in the City’s capital assets for the current fiscal year was 3.8% (a 5.8% increase for governmental activities and a 3.5% decrease for business-type activities) as shown in the following table.
Capital Assets, Net of Depreciation
2007 Restated 2006 2007 2006 2007 Restated 2006
Land 13,407,726$ 13,410,226$ 1,489,192$ 1,489,192$ 14,896,918$ 14,899,418$
Historical treasures 187,830 187,830 - - 187,830 187,830
Buildings and improvements 18,455,788 17,803,773 4,622,784 4,337,742 23,078,572 22,141,515
Improvements other than buildings 6,221,358 6,338,458 4,001,529 4,163,753 10,222,887 10,502,211
Machinery and equipment 4,573,946 4,118,945 606,034 767,143 5,179,980 4,886,088
Infrastructure 17,806,201 15,677,270 4,797,028 4,880,859 22,603,229 20,558,129
Construction in progress 2,385,207 2,040,688 63,365 497,596 2,448,572 2,538,284
Total 63,038,056$ 59,577,190$ 15,579,932$ 16,136,285$ 78,617,988$ 75,713,475$
TotalBusiness-type activitiesGovernmental activities
Under the Governmental Activities Capital Assets, the balance of $2,385,207 for Construction in Progress includes: ongoing construction cost for the Parks Maintenance Facility totaling $2,053,061; $10,759 for additional Hiker-Biker Trails; $228,373 for construction costs oftemporary police facilities and $93,014 for various other projects.

The other significant additions to Governmental Activities Capital Assets included: $127,077 for parking lot lighting at Allen Pond; $144,942 for renovations of the HVAC system and installation of a generator at the Bowie Ice Arena; $193,838 for installation of a generator at the Senior Citizen Center; $137,188 for street resurfacing and lights at Church Road Park and $430,129 for improvements to streets and stormwater systems in Old Town Bowie.
Under the Business-type Activities Capital Assets, the more significant additions included: $68,350 to replace two rotors for the oxidation ditch at the wastewater treatment plant; $63,724 for the Washington Suburban Sanitary Commission Interconnection Project; $35,349 for a utility truck; and electrical upgrades and generator installation at the streets/utility building for $80,130.
More detailed information about the City’s capital assets is presented in Note 3D to the basic financial statements.
Debt Administration
At year-end, the City had $2.9 million in bonds outstanding versus $3.9 million last year – a decrease of 24.7 percent - as shown in the following table.
Outstanding Debt
2007 2006 2007 2006 2007 2006
General obligation bonds (backed by the City) -$ 790,000$ -$ -$ -$ 790,000$
Long-term financing with State of Maryland - - 2,938,634 3,112,190 2,938,634 3,112,190
Compensated absences 859,149 783,008 129,920 128,090 989,069 911,098
Total outstanding debt 859,149$ 1,573,008$ 3,068,554$ 3,240,280$ 3,927,703$ 4,813,288$
TotalsBusiness-type ActivitiesGovernmental Activities
Neither Maryland State law nor the City Charter mandates a limit on municipal debt. On May 10, 1999, the City Council established a policy to limit debt, exclusive of amounts being repaid by the Water and Sewer system, to 0.8 percent of assessed value of taxable property. At June 30, assessed value of such property totals $4.6 billion, the debt limit was $36.8 million and no actual outstanding debt subject to the limit.
The City’s general obligation bond rating is Aa2 from Moody’s Investor Service and AA+ from Standard and Poor’s Corporation. Other obligations include accrued vacation leave. More detailed information about the City’s long-term liabilities is presented in the notes to the basic financial statements.

Economic Factors and Next Year’s Budget and Rates
The City is located in the northern part of Prince George’s County at the crossroads of highways 3/301 and 50. Although considered to be in the Washington, DC metropolitan area, the City’s location also gives it easy access to Baltimore and Annapolis. The Baltimore/Washington area is considered to be one of the fastest growing regions in the nation and generally contributes to the City’s stability.
The City’s total assessed value continues to grow. The growth has been attributed primarily due to increasing assessments, additional commercial development and continued annexations of adjacent properties. The City issued 44 permits for new home construction during FY2007 as compared to 33 permits issued in FY2006. The majority of homes in the city are owner occupied single-family homes that the 2000 census placed in the price range of $150,000 to $199,000 with a median value of $158,100. As with other areas across the region, the sale price of homes in the city during FY2007 well exceeded the median values from the 2000 census.
The Maryland Department of Labor, Licensing and Regulation reported the unemployment rate in Prince George’s County at 4.2 percent and the State at 4 percent on June 30, 2007. The 2000 Census showed the median income for the City of Bowie at $76,778. The income level exceeds the State of Maryland at $45,289 and the United States at $37,005. According to the Office of Federal Housing Enterprise Oversight, Maryland ranked twenty-first in the nation for home price appreciation during the last year.
The City prepares a financial forecast as a component in the process of developing the annual operating budget and the six-year capital improvements program. The assumptions in the forecast are reviewed with the City Council as background for decisions about revenue projections and estimated costs.
Real and personal property tax rates remain at $.352 and $.88 per $100 of assessed valuation, respectively, in the FY2008 adopted budget. General Fund revenues and transfers from other funds in FY2008 are budgeted to increase by 10.8 percent from the FY2007budget year. General property taxes make up approximately 55.5 percent of General Fund budgeted revenues and transfers from other funds. General Fund expenditures and transfers to other funds are budgeted to increase by 7 percent from the FY2007 budget year.
State-administered income tax proceeds, the City’s largest source of intergovernmental revenue increased by 4.3% in FY2007. State-administered Highway User Revenues, the City’s second largest source of intergovernmental revenue, increased by 3% in FY2007.
As for the City’s business-type activities, water and sewer rates increase to $5.50 in FY2008 as compared to $5.00 in FY2007.
Requests for Information
The financial report is designed to provide our citizens, customers, investors and creditors with a general overview of the City’s finances. If you have questions about this report or need any additional information, contact the Finance Department, Attn: Finance Director, at 2614 Kenhill Drive, Bowie, Maryland 20715 or call (301) 809-3025.

“Growth, Unity, Progress”

BASIC FINANCIAL STATEMENTS

CITY OF BOWIE, MARYLANDStatement of Net Assets
June 30, 2007
Governmental Business-type Totalactivities activities
Assets:Cash, cash equivalents and investments 35,423,900$ 1,533,611$ 36,957,511$ Property taxes receivable, net 78,280 - 78,280 Other receivables, net 433,993 860,283 1,294,276 Due from other governments 3,912,735 259 3,912,994 Other assets 151,516 12,553 164,069 Capital assets:
Land, historical treasures and construction in progress 15,980,763 1,552,557 17,533,320 Other capital assets, net of accumulated depreciation 47,057,293 14,027,375 61,084,668
Total assets 103,038,480 17,986,638 121,025,118
Liabilities:Accounts payable and accrued liabilities 1,301,635 160,528 1,462,163 Accrued interest payable - 49,216 49,216 Deposits and customer advances 400,632 410,816 811,448 Due to other governments 566,091 60,356 626,447 Noncurrent liabilities:
Due within one year:Long term debt payable - 177,894 177,894 Compensated absences 629,876 116,805 746,681
Due in more than one year:Long term debt payable - 2,760,740 2,760,740 Compensated absences 229,273 13,115 242,388
Total liabilities 3,127,507 3,749,470 6,876,977
Net Assets:Invested in capital assets, net of related debt 63,038,056 12,646,680 75,684,736 Unrestricted 36,872,917 1,590,488 38,463,405
Total net assets 99,910,973$ 14,237,168$ 114,148,141$
The notes to the basic financial statements are an integral part of this statement.
Primary Government

CITY OF BOWIE, MARYLANDStatement of Activities
For the Year Ended June 30, 2007
Charges Operating Capital Business-for Grants and Grants and Governmental type
Functions/Programs Expenses Services Contributions Contributions Activities ActivitiesPrimary Government:Governmental activities:
General government 6,075,685$ 92,734$ 25,000$ -$ (5,957,951)$ -$ Economic development 311,325 - - - (311,325) - Public safety 2,208,335 172,407 173,862 - (1,862,066) - Social services 1,581,332 3,818 203,733 - (1,373,781) - Public works 10,819,541 431,692 146,236 247,108 (9,994,505) - Parks, culture and recreation 5,273,747 1,073,677 104,315 203,695 (3,892,060) - Interest 16,223 - - - (16,223) -
Total governmental activities 26,286,188 1,774,328 653,146 450,803 (23,407,911) -
Business-type activities:Water and wastewater 4,474,971 4,086,247 - - - (388,724)
Total primary government 30,761,159$ 5,860,575$ 653,146$ 450,803$ (23,407,911) (388,724)
General revenues:Taxes:
Property taxes 17,394,203 - Income taxes 6,022,381 - Gas and motor vehicle taxes 3,109,348 Unrestricted state shared revenues 19,008 - Other taxes 955,894 -
Franchise fees 891,831 - Grants not restricted to specific programs 30,107 Unrestricted investment income 1,727,773 76,536 Miscellaneous 292,396 -
Special item - Gain on sale of land 2,777,846 - Transfers 319,700 (319,700)
Total general revenues and transfers 33,540,487 (243,164) Change in net assets 10,132,576 (631,888)
Net assets - beginning, as restated 89,778,397 14,869,056 Net assets - ending 99,910,973$ 14,237,168$
The notes to the basic financial statements are an integral part of this statement.
Primary Governmentin Net Assets
Program Revenues
Net (Expense) Revenue and Changes

CITY OF BOWIE, MARYLANDStatement of Activities
For the Year Ended June 30, 2007
Total
(5,957,951)$ (311,325)
(1,862,066) (1,373,781) (9,994,505) (3,892,060)
(16,223) (23,407,911)
(388,724)
(23,796,635)
17,394,203 6,022,381 3,109,348
19,008 955,894 891,831
30,107 1,804,309
292,396 2,777,846
- 33,297,323
9,500,688 104,647,453 114,148,141$
ent
d Changes

“Growth, Unity, Progress”

FUND FINANCIAL STATEMENTS

CITY OF BOWIE, MARYLANDBalance Sheet
Governmental Funds June 30, 2007
Equipment Acquisition and
General Fund Replacement Fund TotalAssets:Cash, cash equivalents and investments 21,322,911$ 3,679,578$ 10,421,411$ 35,423,900$ Property taxes receivable, net 78,280 - - 78,280 Other receivables 374,933 13,877 45,183 433,993 Due from other governments 3,912,735 - - 3,912,735 Other assets 151,516 - - 151,516
Total assets 25,840,375$ 3,693,455$ 10,466,594$ 40,000,424$
Liabilities And Fund Balances:Liabilities:Accounts payable and accrued liabilities 826,472$ 50,351$ 424,812$ 1,301,635$ Deposits 182,733 - 217,899 400,632 Deferred revenue 2,224,999 - - 2,224,999 Due to other governments 566,091 - - 566,091
Total liabilities 3,800,295 50,351 642,711 4,493,357
Fund Balances:Reserved for:
Encumbrances 303,334 49,104 3,464,349 3,816,787 Prepaid costs 151,516 - - 151,516
Unreserved:Designated for subsequent year's expenditures 533,600 127,600 1,663,800 2,325,000 Designated - other 267,471 3,466,400 1,429,033 5,162,904 Undesignated 20,784,159 - 3,266,701 24,050,860 Total fund balances 22,040,080 3,643,104 9,823,883 35,507,067
Total liabilities and fund balances 25,840,375$ 3,693,455$ 10,466,594$
Amounts reported for governmental activities in the statement of net assets are different because:Capital assets used in governmental activities are not financial resources and, therefore, are not reported in the funds 63,038,056 Other long-term assets are not available to pay for current period expenditures and, therefore, are deferred in the funds 2,224,999 Long-term liabilities, including bonds payable, are not due and payable in the current period and, therefore, are not reported in the funds (859,149) Net assets of governmental activities 99,910,973$
CapitalProjects
Fund
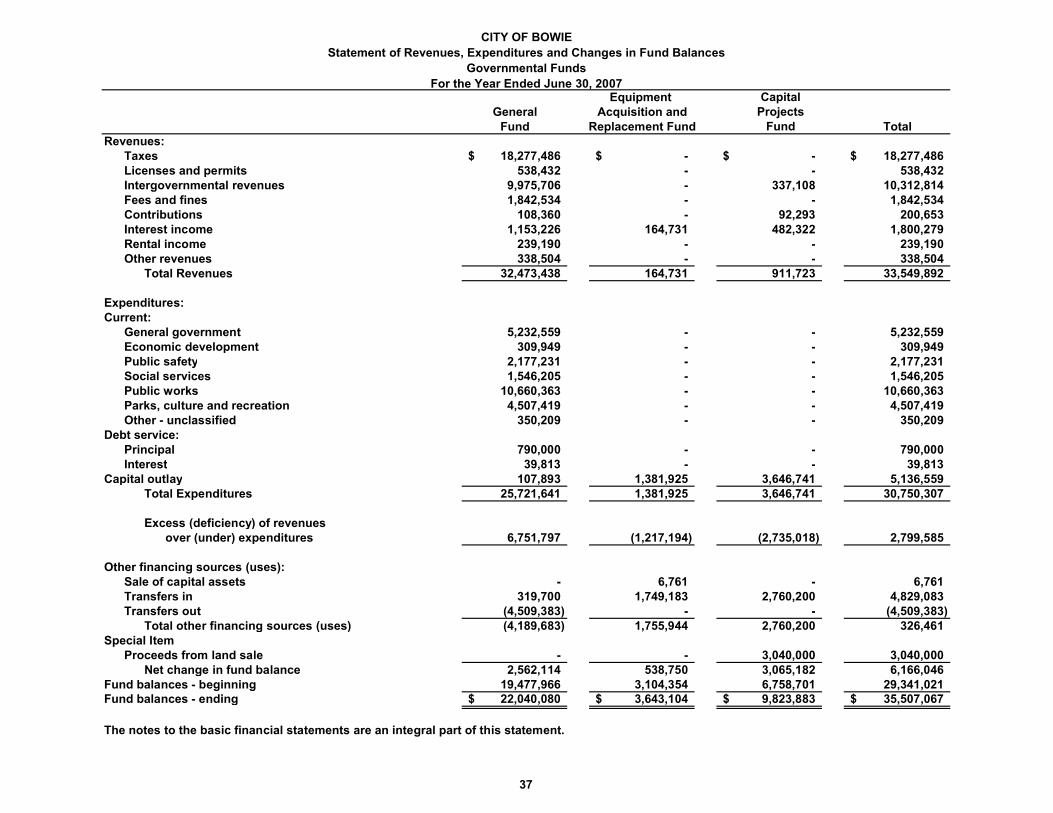
CITY OF BOWIEStatement of Revenues, Expenditures and Changes in Fund Balances
Governmental FundsFor the Year Ended June 30, 2007
Equipment General Acquisition and
Fund Replacement Fund TotalRevenues:
Taxes 18,277,486$ -$ -$ 18,277,486$ Licenses and permits 538,432 - - 538,432 Intergovernmental revenues 9,975,706 - 337,108 10,312,814 Fees and fines 1,842,534 - - 1,842,534 Contributions 108,360 - 92,293 200,653 Interest income 1,153,226 164,731 482,322 1,800,279 Rental income 239,190 - - 239,190 Other revenues 338,504 - - 338,504
Total Revenues 32,473,438 164,731 911,723 33,549,892
Expenditures:Current:
General government 5,232,559 - - 5,232,559 Economic development 309,949 - - 309,949 Public safety 2,177,231 - - 2,177,231 Social services 1,546,205 - - 1,546,205 Public works 10,660,363 - - 10,660,363 Parks, culture and recreation 4,507,419 - - 4,507,419 Other - unclassified 350,209 - - 350,209
Debt service:Principal 790,000 - - 790,000 Interest 39,813 - - 39,813
Capital outlay 107,893 1,381,925 3,646,741 5,136,559 Total Expenditures 25,721,641 1,381,925 3,646,741 30,750,307
Excess (deficiency) of revenues over (under) expenditures 6,751,797 (1,217,194) (2,735,018) 2,799,585
Other financing sources (uses):Sale of capital assets - 6,761 - 6,761 Transfers in 319,700 1,749,183 2,760,200 4,829,083 Transfers out (4,509,383) - - (4,509,383)
Total other financing sources (uses) (4,189,683) 1,755,944 2,760,200 326,461 Special Item
Proceeds from land sale - - 3,040,000 3,040,000 Net change in fund balance 2,562,114 538,750 3,065,182 6,166,046
Fund balances - beginning 19,477,966 3,104,354 6,758,701 29,341,021 Fund balances - ending 22,040,080$ 3,643,104$ 9,823,883$ 35,507,067$
The notes to the basic financial statements are an integral part of this statement.
CapitalProjects
Fund
37

CITY OF BOWIEReconciliation of the Statement of Revenues, Expenditures, and
Changes in Fund Balances of Governmental Funds to the Statement of Activities
For the Year Ended June 30, 2007
Net change in fund balance - total governmental funds 6,166,046$
Amounts reported for governmental activities in the statement of activities are different because:
3,771,048
(310,182)
790,000
(228,674)
20,479
(76,141)
10,132,576$
The notes to the basic financial statements are an integral part of this statement.
In the statement of activities, compensated absences are measured by the amounts earned during the year. In governmental funds, however, expenditures are measured by the amount of financial resources used (essentially, the amounts actually paid). This year, compensated absences earned exceeded amounts used.
Change in net assets of governmental activities
Governmental funds report capital outlays as expenditures. However, in the statement of activities the cost of those assets is allocated over their estimated useful lives and reported as depreciation expense. This is the amount by which capital outlays ($6,322,915) exceeded depreciation ($2,551,867) in the current year.
Repayment of the principal of long-term debt is an expenditure in the governmental funds, however, the repayment reduces long-term liabilities in the statement of net assets.
Revenues in the statement of activities that do not provide current financial resources are not reported as revenues in the funds.
Interest on long-term debt in the statement of activities differs from the amount reported in the governmental funds because interest is recognized as an expenditure in the governmental funds when it is due, thus requires the use of current financial resources. In the statement of activities, however, interest expense is recognized as the interest accrues, regardless of when it is due. The additional interest reported in the statement of activities is the result of accrued interest on the long-term debt.
In the statement of activities, the gain ($2,736,579) on the disposition of capital assets is reported, whereas in the governmental funds, the entire proceeds from the sale ($3,046,761) increase financial resources. Thus, the change in net assets differs from the change in fund balances by costs of the capital assets sold less any accumulated depreciation.
24

CITY OF BOWIE, MARYLANDStatement of Net Assets
Proprietary Fund June 30, 2007
Water and SewerFund
Assets:Current assets:
Cash, cash equivalents and investments 1,533,611$ Accounts receivable, net 247,400 Unbilled accounts receivable 612,883 Accrued interest receivable 6,443 Intergovernmental receivable 259 Prepaid expenses 728
Total current assets 2,401,324 Noncurrent assets:
Capital assets:Land and construction in progress 1,552,557 Other capital assets, net of accumulated depreciation 14,027,375
Issuance costs 5,382 Total noncurrent assets 15,585,314
Total assets 17,986,638
Liabilities:Current liabilities:
Accounts payable and accrued liabilities 160,528 Intergovernmental payable 60,356 Accrued interest payable 49,216 Escrow deposits 55,316 Customers advances for service 355,500 Long-term debt payable - current 177,894
Total current liabilities 858,810 Noncurrent liabilities:
Long-term debt payable 2,760,740 Compensated absences 129,920
Total noncurrent liabilities 2,890,660 Total liabilities 3,749,470
Net Assets:Invested in capital assets, net of related debt 12,646,680 Unrestricted 1,590,488
Total net assets 14,237,168$
The notes to the basic financial statements are an integral part of this statement.
Enterprise Fund

CITY OF BOWIE, MARYLANDStatement of Revenues, Expenses, and Changes in Net Assets
Proprietary Fund For the Year Ended June 30, 2007
Water and SewerFund
Operating revenues:Water sales and sewerage surcharge 2,899,679$ Minimum charges 855,674 Forfeited discounts and penalties 18,982 Processing fees 14,675 Other operating income 109,206
Total operating revenues 3,898,216
Operating expenses:Water supply 1,323,383 Sewage treatment 1,883,770 Administrative and general 249,923 Miscellaneous 87,430 Depreciation 797,759
Total operating expenses 4,342,265
Operating loss (444,049)
Nonoperating revenues (expenses):Interest income 76,536 Rental income - tower leases 176,931 Intergovernmental 11,100 Loss on disposal of capital assets (43,808) Amortization of bond issuance costs (780) Interest expense and fiscal agent charges (88,118)
Total nonoperating revenues (expenses) 131,861
Income before transfers (312,188)
Transfers out (319,700)
Change in net assets (631,888) Total net assets - beginning 14,869,056 Total net assets - ending 14,237,168$
The notes to the basic financial statements are an integral part of this statement.
Enterprise Fund

CITY OF BOWIE, MARYLANDStatement of Cash Flows
Proprietary Fund For the Year Ended June 30, 2007
(Page 3 of 2)
Water and SewerFund
Cash flows from operating activities:Receipts from customers 3,759,512$ Other operating revenues 296,384 Payments to suppliers (1,427,178) Payments to employees (1,998,148)
Net cash provided by operating activities 630,570
Cash flows from noncapital financing activities:Transfer to other funds (319,700)
Cash flows from capital and related financing activities:Proceeds from sale of capital assets 5,202 Purchases and construction of capital assets (291,390) Principal paid on capital debt (173,556) Interest paid on capital debt (90,287)
Net cash used by capital and related financing activities (550,031)
Cash flows from investing activities:Interest income 78,557
Net decrease in cash and cash equivalents (160,604) Cash and cash equivalents - beginning 1,694,215 Cash and cash equivalents - ending 1,533,611$
(Continued)
Enterprise Fund

CITY OF BOWIE, MARYLANDStatement of Cash Flows
Proprietary Fund For the Year Ended June 30, 2007
(Page 4 of 2) Reconciliation of operating income to net cash provided
by operating activities:
Operating loss (444,049)$
Adjustments to reconcile operating loss to net cash providedby operating activities:
Rental income - tower leases 176,931 Intergovernmental 11,100 Depreciation 797,759 Provision for uncollectible accounts 1,383
Change in assets and liabilities:(Increase) in accounts receivable (32,882) Decrease in intergovernmental receivable 6 (Increase) in prepaid expenses (579) Increase in compensated absences 1,830 Increase in intergovernmental payable 60,153 Increase in accrued liabilities 6,354 Increase in accounts payable 51,422 Increase in customer advances 1,142 Total adjustments 1,074,619
Net cash provided by operating activities 630,570$
The notes to the basic financial statements are an integral part of this statement.

NOTES TO THE BASIC FINANCIAL STATEMENTS

CITY OF BOWIE, MARYLANDNOTES TO BASIC FINANCIAL STATEMENTS
JUNE 30, 2007
44
1. Summary of Significant Accounting Policies
The City of Bowie, Maryland is a municipal corporation governed by an elected mayor and six-member council. The City was incorporated in 1916 and adopted its present Charter in 1963. The City operates under a Council-Manager form of government, and although not a full service City, provides the following services: public works, police, culture and recreation, community development, code enforcement, and planning and economic development. In addition, the City owns and operates a water and sewer system that services approximately forty percent of its residents. The Washington Suburban Sanitary Commission provides water and sewer services to residents outside the City’s franchise area. Prince George’s County provides a number of services to City residents that include: police and fire protection, public library and emergency health care. The Prince George’s County Board of Education provides for elementary and secondary education within the City. The Maryland - National Capital Park and Planning Commission contributes additional parks and recreational services within the City.
The City’s financial statements are prepared in accordance with generally accepted accounting principles (GAAP) recognized in the United States of America as applicable to governmental units. The Governmental Accounting Standards Board (GASB) is responsible for establishing GAAP for state and local governments through its pronouncements (Statements and Interpretations). Governments are also required to follow the pronouncements of the Financial Accounting Standards Board (FASB) issued through November 30, 1989 (when applicable) that do not conflict with or contradict GASB pronouncements. Although the City has the option to apply FASB pronouncements issued after that date to its business-type activities and enterprise funds, the City has chosen not to do so. The more significant accounting policies established in GAAP and used by the City are discussed below.
In June 1999, the Governmental Accounting Standards Board (GASB) unanimously approved Statement No. 34, Basic Financial Statements – and Management’s Discussion and Analysis – for State and Local Governments. The City implemented the general provisions of the Statement in the year ended June 30, 2003 and retroactively reportedinfrastructure (assets acquired prior to July 1, 2002) in the fiscal year ending June 30, 2007.
A. Reporting Entity
Using the criteria of Governmental Accounting Standards Board (GASB) Statement No. 14, as amended by Statement 39, management has determined that the financial statements should only include the various departments governed directly by the City Council.
B. Government-wide and Fund Financial Statements
The City’s basic financial statements include both government-wide (reporting the City as a whole) and fund financial statements (reporting the City’s major funds). Both the government-wide and fund financial statements categorize primary activities as either governmental or business type. The City’s public works, parks and recreation, general

CITY OF BOWIE, MARYLANDNOTES TO BASIC FINANCIAL STATEMENTS
JUNE 30, 2007
45
administrative services, public safety, economic development, and social services are classified as governmental activities. The City’s water and sewer services are classified as business-type activities.
In the government-wide Statement of Net Assets, both the governmental and business-type activities columns (a) are presented on a consolidated basis by column, (b) and are reported on a full accrual, economic resource basis, which recognizes all long-term assets and receivables as well as long-term debt and obligations. The City’s net assets are reported in three parts – invested in capital assets, net of related debt; restricted net assets; and unrestricted net assets. The City generally first uses restricted assets for expenses incurred for which both restricted and unrestricted assets are available.
The government-wide Statement of Activities reports both the gross and net cost of each of the City’s functions and business-type activities (public works, parks and recreation, general administrative services, etc.) that are otherwise being supported by general government revenues (general property taxes, certain intergovernmental revenues, fines, permits and charges, etc.). The Statement of Activities reduces gross expenses (including depreciation) by related program revenues, operating and capital grants, and contributions. The program revenues must be directly associated with the function (public works, parks and recreation, etc.) or a business-type activity. Program revenues include (1) charges to customers or applicants who purchase, use, or directly benefit from goods, services, or privileges provided by a given function and (2) grants and contributions that are restricted to meeting the operation or capital requirements of a particular function or activity. Taxes and other items not properly included among program revenues are reported as general revenues. The City does not allocate indirect expenses. Operating grants include operating-specific and discretionary (either operating or capital) grants while the capital grants column reflects capital-specific grants. The net costs (by function or business-type activity) are normally covered by general revenue (general property taxes, intergovernmental revenues, interest income, etc.).
As a general rule the effect of interfund activity has been eliminated from the government-wide financial statements. Exceptions to this general rule are overhead charges between the government’s water and sewer function and various other functions of the government. Elimination of these charges would distort the costs and revenues reported for the various functions concerned.
In the fund financial statements, financial transactions and accounts of the City are organized on the basis of funds. The operation of each fund is considered to be an independent fiscal and separate accounting entity, with a self-balancing set of accounts recording cash and/or other financing resources together with all related liabilities and residual equities or balances, and changes therein, which are segregated for the purpose of carrying on specific activities or attaining certain objectives in accordance with special regulations, restrictions, or limitations. The fund statements are presented on a current financial resource and modified accrual basis of accounting. This is the manner in which these funds are normally budgeted. Since the governmental fund statements are presented on a different measurement focus and basis of accounting than the government-wide statements’ governmental column, a reconciliation is presented which briefly

CITY OF BOWIE, MARYLANDNOTES TO BASIC FINANCIAL STATEMENTS
JUNE 30, 2007
46
explains the adjustment necessary to reconcile the fund financial statements to the governmental column of the government-wide financial statements.
The following is a brief description of the specific funds used by the City in FY2007.
Governmental Funds – Governmental funds are those through which most governmental functions typically are financed.
General Fund - The General Fund is the primary operating fund of the City. It is used to account for all financial resources except those properly accounted for in another fund. The principal sources of revenues for this fund are property taxes, intergovernmental grants and state shared revenues.
Equipment Acquisition and Replacement Fund – The Equipment Acquisition and Replacement Fund receives amounts transferred from other funds, not only to acquire and replace equipment during the current year, but to accumulate amounts appropriated each year to replace equipment scheduled for replacement in future years. The Equipment Acquisition and Replacement Fund is considered a major fund for government-wide reporting purposes.
Capital Projects Fund – The Capital Projects Fund accounts for all financial resources used for the acquisition or construction of major capital facilities not being financed by proprietary funds. The Capital Projects Fund is considered a major fund for government-wide reporting purposes.
Proprietary Funds – Proprietary Funds are used to account for activities that are similar to those often found in the private sector. All assets, liabilities, equities, revenues, expenses, and payments relating to the government’s business activities are accounted for through proprietary funds. The measurement focus is on determination of operating income, financial position, changes in net assets and cash flows. Operating revenues include charges for services. Operating expenses include costs of services as well as, materials, contracts, personnel, and depreciation. All revenues and expenses not meeting these definitions are reported as nonoperating revenues and expenses.
Enterprise Fund – The Enterprise Fund accounts for operations that are financed in a manner similar to private business enterprises, where the intent is that costs of providing goods or services to the general public on a continuing basis be financed or recovered entirely or predominantly through user charges. The City’s Enterprise Fund accounts for the operations of the City’s water and sewer system.
CITY OF BOWIE, MARYLANDNOTES TO BASIC FINANCIAL STATEMENTS
JUNE 30, 2007
47
C. Basis of Accounting
The accounting and financial reporting treatment applied to a fund is determined by its measurement focus. All governmental funds are accounted for using the current financial resources measurement focus. With this measurement focus, only current assets and current liabilities generally are included on the balance sheet in the funds statements. Long-term assets and long-term liabilities are included in the government-wide statements. Operating statements of the governmental funds present increases (i.e., revenues and other financing sources) and decreases (i.e., expenditures and other financing uses) in net current assets.
The government-wide statements of net assets and statements of activities, and proprietary funds are accounted for on a flow of economic resources measurement focus. With this measurement focus, all assets and all liabilities associated with the operation of these activities are included on the statement of net assets. Proprietary fund-type operating statements present increases (e.g., revenues) and decreases (e.g., expenses) in net total assets.
The statements of net assets, statement of activities, and financial statements of the Proprietary Funds are presented on the accrual basis of accounting. Under this method of accounting exchange, revenues are recognized when earned and expenses are recorded when liabilities are incurred without regard to receipt or disbursement of cash.
The fund financial statements of the General, Equipment Acquisition and Replacement, and Capital Projects Funds are maintained and reported on the modified accrual basis of accounting using the current financial resources measurement focus. Under this method of accounting, revenues are recognized in the period in which they become measurable and available. The term “available” is limited to collection within sixty days of the fiscal year-end. Property taxes are the primary source of revenues susceptible to accrual. Other revenue of material amounts which are accrued include intergovernmental revenues, interest and rental income. Building permits, fees, fines and miscellaneous revenues are recorded when received, as they are generally not measurable until actually received. Any revenues received in advance are deferred. Federal and State reimbursement-type grants are recorded as revenue when related eligible expenditures are incurred. Expenditures are recorded when the related fund liabilities are incurred. Principal and interest on general long-term debt are recorded as fund liabilities when due or when amounts have been accumulated for payments to be made early in the new fiscal year.
D. Assets, Liabilities and Net Assets or Equity
CASH, CASH EQUIVALENTS AND INVESTMENTS
Temporary idle cash within the various funds is combined to form a cash and investment pool. Investments and interest earnings are recorded in the individual funds. Funds available for short periods are transferred to an interest bearing bank account. Funds available for longer periods are invested in certificates of deposit or the Maryland Local Government Investment Pool. Investments are stated at fair value, in accordance with GASB Statement No. 31.

CITY OF BOWIE, MARYLANDNOTES TO BASIC FINANCIAL STATEMENTS
JUNE 30, 2007
48
For purposes of statement presentation, all highly liquid investments with an original maturity of three months or less when acquired are considered to be cash equivalents.
TAXES RECEIVABLE
Taxes Receivable are comprised of the uncollected taxes for the past five years. The estimated amount uncollectible of $104,460 is equal to the total of the outstanding receivables of the four oldest years.
UNBILLED ACCOUNTS RECEIVABLE
The Water and Sewer Fund unbilled accounts receivable are for services rendered, but not billed for the billing period April 1, 2007, to June 30, 2007. Unbilled revenue for the fiscal year ended June 30, 2007, totals $612,883.
PREPAID ITEMS
Certain payments to vendors reflect costs applicable to future accounting periods and are recorded as prepaid items in both the government-wide and fund financial statements.
CAPITAL ASSETS
Capital assets, which include property, plant, equipment, and infrastructure assets (e.g., roads, bridges, sidewalks, and similar items), are reported in the applicable governmental or business-type activities columns in the government-wide financial statements. Capital assets are defined as assets with an initial, individual cost of more than $5,000 and an estimated useful life of more than one year. Such assets are recorded at historical cost or estimated historical cost if actual historical cost is not available. Donated capital assets are recorded at fair market value at time of receipt. The cost of normal maintenance and repairs that do not add to the value of the asset or materially extend assets lives are not capitalized.

CITY OF BOWIE, MARYLANDNOTES TO BASIC FINANCIAL STATEMENTS
JUNE 30, 2007
49
Capital assets are depreciated using the straight line method over the following estimated useful lives:
Assets Years
Buildings and improvements 15-50Improvements other than buildings 10-50Machinery and equipment 5-25Public domain infrastructure 7-100Water distribution system 10-100Sewage collection system 10-100
DEFERRED EXPENSE
Bond issuance costs are deferred and amortized over the life of the bonds using the effective interest method.
DEFERRED REVENUES
Governmental funds report deferred revenue in connection with receivables for revenues that are not considered to be available to liquidate liabilities of the current period. Governmental funds also defer revenue recognition in connection with resources that have been received, but not yet earned. At the end of the current fiscal year, the various components of deferred revenue and unearned revenue reported in the governmental funds were as follows:
UnavailableDue from other governments (General Fund) $ 2,224,999
COMPENSATED ABSENCES
The liability for compensated absences reported in the government-wide and proprietary fund statements consists of unpaid, accumulated vacation leave balances. All vacation pay is accrued when incurred in the government-wide and proprietary fund financial statements. The current portion of this debt is estimated based on historical trends. Compensated absences are reported in governmental funds only if they have matured (i.e., unused reimbursable leave still outstanding following an employee’s resignation or retirement), while the proprietary funds report the liability as it is incurred.

CITY OF BOWIE, MARYLANDNOTES TO BASIC FINANCIAL STATEMENTS
JUNE 30, 2007
50
EQUITY CLASSIFICATIONS
Government-wide statements – Equity is classified as net assets and displayed in three components:
Invested in capital assets, net of related debt – consists of capital assets including restricted capital assets, net of accumulated depreciation and reduced by the outstanding balances of bonds or other borrowings that are attributable to the acquisition, construction, or improvement of those assets.
Restricted net assets – consists of net assets with constraints placed on the use either by (1) external groups such as creditors, grantors, contributors, or laws or regulations of other governments; or (2) law through constitutional provisions or enabling legislation. At year-end, the City had no restricted net assets to report.
Unrestricted net assets – all other net assets that do not meet the definition of “restricted” or “invested in capital assets, net of related debt.”
Fund statements – Governmental fund equity is classified as fund balance. Fund balance is further classified as reserved and unreserved, with unreserved further split between designated and undesignated. Proprietary fund equity is classified the same as in the government-wide statements.
Except for those required to comply with accounting standards, all reservations and designations of fund balance reflect City Council action in the context of adoption of the City’s budget, as follows:
1. Reservation of Fund Balance - The significant accounting policies of the City permit the reservation of fund balance that restricts amounts not available for appropriation. The City, at June 30, 2007, reserved the amount of $3,816,787 for encumbrances outstanding that will be liquidated in subsequent years. Prepaid costs of $151,516 in the General Fund have also been reserved at June 30, 2007.
2. Unreserved Fund Balance - Designated for Appropriations - The significant accounting policies of the City designates that unencumbered and unreserved amounts at year end in the amount of $2,325,000 are available to fund appropriations in the subsequent year.
3. Unreserved Fund Balance – Designated for Scholarships – The City accepts donations toward a City Scholarship Fund; earnings on the fund are used to provide scholarships to deserving City students. Unreserved fund balance in the General Fund in the amount of $86,015 has been designated to the Scholarship Fund.
4. Unreserved Fund Balance - Designated for Friends of Belair - The Friends of Belair Mansion is a subcommittee of the City Heritage Committee, which provides volunteer service in support of the Belair Mansion. The City has established a designation in the amount of $22,844 at year end, representing the balance of amounts which have been raised by this group and donated to the City for acquisition of historical furnishings.

CITY OF BOWIE, MARYLANDNOTES TO BASIC FINANCIAL STATEMENTS
JUNE 30, 2007
51
5. Unreserved Fund Balance – Designated for Special Taxing Districts - The City established special taxing districts for the purposes of transportation management and stormwater management in certain areas. Funds raised by special district taxes in the amounts of $158,612 and $1,429,033 are designated only for special taxing district purposes in the General Fund and Capital Projects Fund, respectively.
6. Unreserved Fund Balance - Designated for Equipment Replacement – At June 30, the City designated $3,466,400for the replacement of equipment in the Equipment Acquisition and Replacement Fund.
E. Revenues, Expenditures and Expenses
PROPERTY TAX REVENUE RECOGNITION
Property tax revenue is recognized in the year in which taxes have been levied and become available to meet current expenditures. Recognized revenues are expected to be collected within the current period.
COMPENSATED ABSENCES
Employees are permitted to accumulate earned but unused vacation leave. All vacation leave is accrued when incurred in the government-wide and proprietary fund financial statements. Annual leave is adjusted to current salary cost at June 30, plus salary-related payments associated with the payment of compensated absences. A liability for these amounts is reported in governmental funds only if they have matured, for example, as a result of employee resignations and retirements. Annual leave payable at termination of employment is limited to 30 days.
As part of a flexible benefit plan, all employees receive six personal days each year. The personal days are not accrued and unused days are forfeited on December 31. The employees hired prior to July 1, 1988, who elected not to participate in the flexible benefit plan, accumulate sick leave at the rate of 1 1/4 days per month or 15 days a year. There is no restriction on the accumulation of sick leave. However, no payment is made for the accumulated amount upon separation and no accrued liability is recorded.
STATEMENT PRESENTATION
The Statement of Revenues, Expenditures and Changes in Fund Balances - Governmental Funds is prepared on a basis consistent with generally accepted accounting principles under which method encumbrances are considered a reservation of fund balance and charged to operations in the year liquidated. All intergovernmental revenues applicable to these encumbrances are recorded as unearned for the current period, and earned for the subsequent period in which the reservation of fund balance is liquidated.

CITY OF BOWIE, MARYLANDNOTES TO BASIC FINANCIAL STATEMENTS
JUNE 30, 2007
52
2. Reconciliation of Government-wide and Fund Financial Statements
A. A summary reconciliation of the difference between total fund balances as reflected on the governmental funds balance sheet and the net assets for governmental activities as shown on the government-wide statement of net assets is presented on the face of the governmental funds balance sheet. The asset and liability elements which comprise the reconciliation difference stem from governmental funds using the current financial resources measurement focus and the modified accrual basis of accounting while the government-wide financial statements use the economic resources measurement focus and accrual basis of accounting.
Explanation of certain differences between the governmental fund balance sheet and the government-wide statement of net assets:
Capital assets used in governmental activities are not financial resources and, therefore, are not reported in the funds:Capital assets 85,830,263$ Less: Accumulated depreciation (22,792,207)
Total 63,038,056$
Other long-term assets are not available to pay for current period expenditures and, therefore, aredeferred in the funds:
Due from other governments 2,224,999$
Long-term liabilities, including bonds payable, are not due and payable in the current period and, therefore, are notreported in the funds:
Compensated absences 859,149 Total 859,149$
CITY OF BOWIE, MARYLANDNOTES TO BASIC FINANCIAL STATEMENTS
JUNE 30, 2007
53
3. Detailed Notes on All Funds
ASSETS, LIABILITIES AND FUND EQUITY
A. Cash, Cash Equivalents and Investments - The State of Maryland Code allows municipalities to invest surplus funds in financial institutions within the State of Maryland if the financial institution provides collateral with a market value that equals or exceeds the amount by which a deposit exceeds the deposit insurance. Collateral is limited to obligations of or guarantees by the United States government; State, County or Municipal Obligation; obligations of the Inter-American Development Bank; or obligations of the World Bank. Municipalities may also invest in federal obligations or repurchase agreements those obligations secure. The State of Maryland Code requires municipalities have an investment policy. By resolution passed by the City Council, an investment policy has been adopted. Management has decided to restrict investments to the use of an interest bearing cash account for readily available funds, and the Maryland Local Government Investment Pool or certificates of deposit on a pooled basis for cash amounts that are available for longer periods. Only financial institutions covered by the Federal Deposit Insurance Corporation (FDIC) are used.
Investments are stated at fair value, in accordance with GASB Statement No. 31. All accrued interest is recorded as a receivable for the period earned and reported separately on the balance sheet.
For purposes of this note disclosure, cash and cash equivalents are classified as either deposits or investments. Deposits include cash in checking accounts, savings accounts, certificates of deposit and undeposited cash. Investments consist of amounts invested in the Maryland Local Government Investment Pool.
Deposits - At fiscal year end, the carrying amount of the City’s deposits was $1,299,732, and the bank balances were $2,110,155. Custodial credit risk is the risk that in the event of a bank failure, the government’s deposits may not be returned to it. As of June 30, 2007, the City’s bank balances were not exposed to any custodial credit risk since all deposits were fully collateralized. Of the bank balances, $300,000 was covered by federal depository insurance, and $1,810,155 was covered by collateral pledged to the City and held in the City’s name by the pledging bank’s trust department. The City had undeposited cash in the amount of $5,185.
Investments - Statutes authorize the City to invest in obligations of the United States government, federal government agency obligations, repurchase agreements, certificates of deposit or time deposits insured by the FDIC, and the Maryland Local Government Investment Pool (MLGIP), which invests in United States Treasuries.
The City’s investments are pooled in the State created Maryland Local Government Investment Pool. These funds are

CITY OF BOWIE, MARYLANDNOTES TO BASIC FINANCIAL STATEMENTS
JUNE 30, 2007
54
part of an external investment pool. The investments at June 30, 2007 are shown below:
Carrying Fair Amount Value
General Fund $ 20,118,057 $ 20,118,057Equipment Acquisition and Replacement Fund 3,679,578 3,679,578Capital Projects Fund 10,421,411 10,421,411Water and Sewer Fund 1,433,548 1,433,548
Total - MLGIP $ 35,652,594 $ 35,652,594
There is no custodial credit risk for these investments as the amounts are fully collateralized. In addition, there is no interest rate risk as the interest rates are adjusted periodically. It should also be noted that the City does not have any foreign currency risk associated with any investments.
Article 95 §22G of the Annotated Code of Maryland established the Maryland Local Government Investment Pool. The Pool, under the administrative control of the State Treasurer, is operated in accordance with Rule 2a-7 of the Investment Company Act of 1940, as amended, and is managed by PNC Institutional Investmens. The pool has an AAAm rating from Standard and Poor’s Corporation and maintains a $1.00 per share value. An MLGIP Advisory Committee of current participants was formed to review, on a quarterly basis, the activities of the pool and to provide suggestions to enhance the pool. The fair value of the City’s investment in the pool is equal to the fair value of its shares in the pool.
B. Property Taxes - Real and personal property taxes are levied at a rate consistent with State law requiring that the State Department of Assessments and Taxation’s constant yield tax rate cannot be exceeded without notice to the public of such an intent, and then, only after public hearings are held. The City Council levies the rate, adopted in the appropriations ordinance, based on the assessed value of the property as determined by the State Department of Assessments and Taxation.
By action of the Maryland General Assembly, triennial assessment in the State became effective in fiscal years after 1980. This act provides that only 1/3 of all property be reassessed every year with all property being reassessed every three years. The assessment increase is phased in over the three-year period. Taxable assessment increases were limited to 5 percent this fiscal year.
Prior to FY2001, real property was assessed at 40 percent of estimated full value. Pursuant to a change in State law, which took effect on October 1, 2000, the assessed values for FY2001 and subsequent years reflect the conversion to full value assessments of real property.
Taxes are levied as of July 1, become a lien on that date, and are due and payable by October 1, except principal residences, which are due and payable in semiannual installments at July 1 and December 31. Semiannual

CITY OF BOWIE, MARYLANDNOTES TO BASIC FINANCIAL STATEMENTS
JUNE 30, 2007
55
installments due on December 31 become delinquent January 1. Monthly interest at the rate of 2/3 of 1 percent and a penalty of 1 percent is added to all taxes unpaid. Sale of property for delinquent taxes or tax liens is conducted by the County during the month of May. Delinquent taxes at June 30, 2007 amounting to $104,460 are 0.6 percent of levy. The City’s tax rates for fiscal year 2007 were $.352 per $100 of assessed valuation for real property and $.880 per $100 of assessed valuation for business personal property.
C. Due from/to Other Governments - The following represent amounts due as of June 30, 2007 from/to other governmental units to the City of Bowie:
1. General Fund - Due from Other GovernmentsState of Maryland -- Admissions and Amusement Tax $ 149,679State of Maryland -- Income Tax 2,731,083State of Maryland -- Motor Vehicle and Highway User Revenues 686,272State of Maryland -- Race Track Revenue 9,050State of Maryland -- Traders and Peddlers License Fees 11,041State of Maryland -- Financial Corporation Tax 808Prince George’s County -- Youth Program 56,683Prince George’s County -- Rebate Landfill Fees 36,559Prince George’s County -- Real Property Tax Receipts 1,674Prince George’s County -- Hotel/Motel Tax 146,109Prince George’s County -- Mentoring Program 5,177Maryland National Capital Park and Planning Commission 78,600
Total $ 3,912,735
2. General Fund - Due to Other GovernmentsState of Maryland -- Other $ 14,641Prince George’s County -- Contract Police Services 345,382Prince George’s County -- Landfill Tipping Fees 205,943Prince George’s County -- Other 5Other Local Government 120
Total $ 566,091

CITY OF BOWIE, MARYLANDNOTES TO BASIC FINANCIAL STATEMENTS
JUNE 30, 2007
56
D. Capital Assets
In conjunction with GASB 34, the City deferred recording infrastructure assets for governmental activities acquired prior to July 1, 2002 until the current fiscal year. The below beginning balances have been restated to reflect this action. The effect change was an increase in capital assets governmental activities of $21,573,367 and accumulated depreciation of $7,057,186. Capital asset activity for the year ended June 30, 2007 was as follows:
Governmental Activities Capital Assets:
Restated
Balance BalanceJune 30, 2006 Additions Deductions Reclass Transfers June 30, 2007
Capital assets, not being depreciated:Land 13,410,226$ -$ (2,500)$ -$ -$ 13,407,726$ Construction in Progress 2,040,688 2,073,579 (3,500) (1,725,560) - 2,385,207 Historical Treasures 187,830 - - - - 187,830
Total capital assets, not being depreciated 15,638,744 2,073,579 (6,000) (1,725,560) - 15,980,763
Capital assets, being depreciated:Building & improvements 24,874,533 439,607 (385,600) 875,832 - 25,804,372 Improvements other than buildings 9,052,911 239,699 - 13,967 - 9,306,577 Machinery & equipment 8,150,709 1,510,059 (584,537) - - 9,076,231 Infrastructure 22,766,588 2,059,971 - 835,761 - 25,662,320
Total capital assets, being depreciated 64,844,741 4,249,336 (970,137) 1,725,560 - 69,849,500
Less: accumulated depreciation for:Building & improvements (7,070,760) (424,352) 146,528 - - (7,348,584) Improvements other than buildings (2,714,453) (370,766) - - - (3,085,219) Machinery & equipment (4,031,764) (989,948) 519,427 - - (4,502,285) Infrastructure (7,089,318) (766,801) - - (7,856,119)
Total accumulated depreciation (20,906,295) (2,551,867) 665,955 - - (22,792,207)
Total capital assets, being depreciated, net 43,938,446 1,697,469 (304,182) 1,725,560 47,057,293
Governmental activities capital assets, net 59,577,190$ 3,771,048$ (310,182)$ -$ -$ 63,038,056$
Class

CITY OF BOWIE, MARYLANDNOTES TO BASIC FINANCIAL STATEMENTS
JUNE 30, 2007
57
D. Capital Assets (continued)
Business-type Activities Capital Assets:
Balance Balance
Class June 30, 2006 Additions Deductions Reclass Transfers June 30, 2007
Capital assets, not being depreciated:Land 1,489,192$ -$ -$ -$ -$ 1,489,192$ Construction in Progress 497,596 13,977 - (448,208) - 63,365
Total capital assets, not being depreciated 1,986,788 13,977 - (448,208) - 1,552,557
Capital assets, being depreciated:Building & improvements 9,199,405 80,130 - 448,208 - 9,727,743 Improvements other than buildings 5,927,995 15,086 - - - 5,943,081 Machinery & equipment 3,442,308 103,699 (94,029) - - 3,451,978 Infrastructure 8,809,049 77,524 - - 8,886,573
Total capital assets, being depreciated 27,378,757 276,439 (94,029) 448,208 - 28,009,375
Less: accumulated depreciation for:Building & improvements (4,861,663) (243,296) - - - (5,104,959) Improvements other than buildings (1,764,242) (177,310) - - - (1,941,552) Machinery & equipment (2,675,165) (215,798) 45,019 - - (2,845,944) Infrastructure (3,928,190) (161,355) - - - (4,089,545)
Total accumulated depreciation (13,229,260) (797,759) 45,019 - - (13,982,000)
Total capital assets, being depreciated, net 14,149,497 1,074,198 - (49,010) 448,208 - 14,027,375
Business-type activities capital assets, net 16,136,285$ 1,088,175$ (49,010)$ -$ -$ 15,579,932$

CITY OF BOWIE, MARYLANDNOTES TO BASIC FINANCIAL STATEMENTS
JUNE 30, 2007
58
Depreciation expense was charged to functions/programs of the City for the fiscal year ended June 30, 2007:
Governmental activities:
General government 468,428$ Social services 29,899 Public works 1,303,998 Parks, culture & recreation 749,542
Total 2,551,867$
Business-type activities:
Water 406,857$ Waste water 390,902
Total 797,759$
E. Construction and Other Significant Commitments - As of June 30, 2007, the City had outstanding construction commitments in excess of $100,000, as follows:
Original RemainingContract Contract
Project Amounts AmountsStreet Resurfacing $ 1,977,400 76,780Parks Maintenance Facility 4,229,458 2,574,225Playhouse Renovation 233,000 233,000Total $ 6,439,858 $ 2,884,005
F. Pension Plans - The City provides coverage for all its employees under the Federal Social Security System. In addition, the City established a defined contribution employees savings plan in accordance with Section 401(k) of the Internal Revenue Code. The City has the authority to establish and amend the benefit provisions of the savings plan, including contribution requirements of the employees and employer. The trustee for the plan is the ICMA Retirement Corporation.
The defined contribution plan establishes individual accounts for each participant and specifies how the contributions to the participants’ accounts are to be determined. In a defined contribution plan, the benefits a participant receives will depend on the amount contributed to the participant’s account and the earnings from investment of these contributions.

CITY OF BOWIE, MARYLANDNOTES TO BASIC FINANCIAL STATEMENTS
JUNE 30, 2007
59
All City employees, who work in a full-time status and have one year of service, may choose to participate. To receive a City matching contribution, a minimum employee contribution of 1% of gross pay, exclusive of overtime or bonuses, is required by the plan. The City matches employee contributions on a variable percentage scale, based upon years of service, to a maximum of 6%.
A participant is at all times vested in his own contributions to the plan, plus any interest earned on these contributions. A participant’s vested percentage in the City’s contribution amount is determined from the following table based on years of service:
Years of Service Vested PercentageLess than 2 0%
2 25%3 50%4 75%
5 or more 100%
An additional employer contribution of 4 % of gross pay, exclusive of overtime and bonuses, is made for all employees with one year of service, who complete 1,000 hours of service during the plan year and are employed on the last day of the plan year. No contributions are required by the employees to receive this 4 % annual contribution. At the time of making the contribution, the City may, at its discretion, designate that all or a portion of the contribution is fully vested when made. In the absence of such a designation, the vesting schedule for the 4 % contribution is as follows:
Years of Service Vested PercentageLess than 2 0%
2 25%3 50%4 75%
5 or more 100%
The plan allows withdrawals for death, disability, retirement and hardship. The plan also has a loan option to enable participants to borrow from their own contributions. Loans may not exceed the lesser of: (1) Fifty thousand dollars ($50,000) reduced by the excess of the highest outstanding loan balance during the one year period preceding the date of the loan over the outstanding balance of loans on the day the loan is made, or (2) the greater of $10,000 or 50 percent of the participant’s vested interest in the plan. All loans must have a repayment schedule not to exceed five years. The plan year is from January 1 to December 31.

CITY OF BOWIE, MARYLANDNOTES TO BASIC FINANCIAL STATEMENTS
JUNE 30, 2007
60
Employee contributions and the City’s matching funds are transferred to the ICMA Retirement Corporation on a bi-weekly basis. The annual 4% City contribution was made in February following the plan year end. The March 2007contribution was $375,189. The City’s required and actual matching contributions for fiscal year 2007 amounted to $414,391. Employee contributions totaled $640,317 in fiscal year 2007.
The City also maintains a 401(a) Money Purchase Plan. The trustee for the plan is the ICMA Retirement Corporation. Participation is limited exclusively to the City Manager. Eligibility commences upon employment. Under the plan, the City contributes 10% of gross salary, exclusive of bonuses. Employer contributions are transferred to the ICMA Retirement Corporation on a bi-weekly basis. Contributions are 100% vested in the participant’s account at all times. The City has the authority to establish and amend the benefit provisions of the money purchase plan, including contribution requirements of the employee and employer.
ICMA Retirement Corporation held no securities of the City on behalf of the pension plan during or at the close of the fiscal year.
G. Deferred Compensation Plan - The City offers substantially all its employees a deferred compensation plan created in accordance with Internal Revenue Code (IRC) Section 457. The plan permits participating employees to defer a portion of their salary until future years. The deferred compensation is not available to employees until termination, retirement, death, or unforeseeable emergency.
H. Compensated Absences – Compensated absences at June 30, 2007 totaled $859,149 for governmental activities and $129,920 for business-type activities, of which $629,876 and $116,805, respectively, were due within one year.
As part of the flexible benefit plan, all employees receive six non-accruable personal leave days each year instead of accruing sick leave. Current employees were offered the option of a buy back of accrued sick leave if they transfer to the personal leave benefit. Employees hired prior to July 1, 1988, and who elected to stay with the original sick leave option, accumulate sick leave at the rate of 1 1/4 days per month or 15 days a year. There is no restriction on the amount that may be accumulated. However, no payment is made for the accumulated amount upon separation and no accrued liability is recorded. The total dollar value of accumulated sick leave at June 30, 2007 was $350,750computed at the rates of pay as of that date.
I. Postretirement Healthcare Benefits – The City offers postretirement healthcare, including prescription coverage, to employees who retire at or after age 55 and have 25 years of service, or have any other combination of age and years of service, which equal the number 80. The retiree pays 50 percent of the cost and the City pays 50 percent of the cost. The coverage is available until the retiree is eligible for Medicare. The employee’s spouse is also eligible for this coverage. The City’s contributions are funded on a pay-as-you-go basis. Two retirees received benefits during the year. The total cost of providing this benefit was $8,896 for the fiscal year ended June 30, 2007.

CITY OF BOWIE, MARYLANDNOTES TO BASIC FINANCIAL STATEMENTS
JUNE 30, 2007
61
J. Long – Term Debt – The City issues general obligation bonds to provide funds for the acquisition and construction of major capital facilities. General obligation bonds are direct obligations and pledge the full faith and credit of the City. General obligation bonds issued for governmental activities in previous years were redeemed in full during the current fiscal year.
The City has also obtained long-term financing with the State of Maryland for its business-type activities. The Water and Sewer enterprise fund entered into the State’s revolving loan program in order to modernize the City’s water and wastewater plants. The long–term loans are direct obligations and pledge the full faith and credit of the City. However, these revolving loans will be retired from revenues of the Water and Sewer enterprise fund.
State revolving loans outstanding as of June 30, 2007 are composed of the following issues:
Business-type Activities
1. State Revolving Loan-Water Quality - Amount drawn $2,241,000, matures in twentylevel annual installments starting February 1, 2002; interest rate at 2.5% per annumpayable on August 1 and February 1; total interest payable to maturity is $331,940. Administrative fees are 5.0% of total debt service, totaling$127,905 over the total loan period. $1,680,612
2. State Revolving Loan-Drinking Water - Amount drawn $1,677,500; matures in twentylevel annual installments starting February 1, 2002; interest rate at 2.5% per annumpayable on August 1 and February 1; total interest payable to maturity is$248,474. Administrative fees are 5.0% of total debt service, totaling$96,784 over the total loan period. 1,258,022
Total State revolving loans $2,938,634

CITY OF BOWIE, MARYLANDNOTES TO BASIC FINANCIAL STATEMENTS
JUNE 30, 2007
62
Annual debt service requirements to maturity for State revolving loans are as follows:
Fiscal Year Principal Interest2008 177,894 73,466 2009 182,342 69,019 2010 186,901 64,460 2011 191,573 59,788 2012 196,362 54,999 2013-2017 1,057,949 198,853 2018-2020 945,613 59,829
Total 2,938,634$ 580,414$
Business-type Activities
Changes in long-term liabilities – Long-term liability activity for the year ended June 30, 2007, was as follows:
Due withinJune 30, 2006 Increases Decreases June 30, 2007 one year
Governmental activities:General obligation bonds 790,000$ -$ (790,000)$ -$ $ -Compensated absences 783,008 706,017 (629,876) 859,149 629,876
Total Governmental activities 1,573,008$ 706,017$ (1,419,876)$ 859,149$ 629,876$
Business-type activities:Long-term financing with State of Maryland 3,112,190$ -$ (173,556)$ 2,938,634$ 177,894$ Compensated absences 128,090 118,635 (116,805) 129,920 116,805
Total Business-type activities 3,240,280$ 118,635$ (290,361)$ 3,068,554$ 294,699$
The liabilities for governmental activities are liquidated by the general fund, while liabilities for business-type activities are liquidated by the water and sewer fund.
K. Legal Debt Margin - Neither Maryland State law nor the City Charter mandates a limit on municipal debt. On May 10, 1999, the City Council established a policy to limit debt, exclusive of amounts being repaid by the Water and Sewer System, to 0.8 percent of assessed value of taxable property. At June 30, assessed value of such property totals $4,599,583,297, the debt limit was $36,796,666, and there was no outstanding debt subject to the limit.

CITY OF BOWIE, MARYLANDNOTES TO BASIC FINANCIAL STATEMENTS
JUNE 30, 2007
63
L. Rental Income - The operation of the City’s golf course has been contracted to outside operators. The term of the contract is thirty years, commencing October 1, 1981, and expiring September 30, 2011. The monthly rental fee is progressively increased from $1,000 to $6,000 by October 1, 2006. The rent changed from $4,000 to $5,000 effective October 1, 2001, and increased again to $6,000 on October 1, 2006.
4. Risk Management
On July 1, 1987, the City joined the Local Government Insurance Trust (LGIT) sponsored by the Maryland Municipal League (MML) and the Maryland Association of Counties. The Local Government Insurance Trust is a self-insurance pool offering General Liability, Excess Liability, Business Auto Liability, Police Legal Liability, and Public Official Liability.
LGIT is capitalized at an actuarially determined level to provide financial stability for its local government members and to reduce the possibility of assessments. The trust is owned by the participating cities and counties and managed by a Board of Trustees elected by the members. Annual premiums are assessed for the various policy coverages. During fiscal year 2007, the City paid premiums of $297,569 to the trust.
5. Interfund Transfers
Interfund transfers for the year ended June 30, 2007, consisted of the following:
Transfer to General Fund from Water and Sewer Fund $ 319,700Transfer to Equipment Acquisition and Replacement Fund from General Fund 1,749,183Transfer to Capital Projects Fund from General Fund 2,760,200
Transfers are used to (1) move revenues from the fund that budget requires to collect them to the fund that budget requires to expend them, or (2) move unrestricted revenues collected in the general fund to finance various programs accounted for in other funds in accordance with budgetary authorizations.
6. Summary Disclosure of Significant Contingencies and Commitments
A. The City is party to legal proceedings which normally occur in governmental operations. The legal proceedings are not, in the opinion of the City Attorney, likely to have a material, adverse impact on the financial position of the City as a whole.
B. The City receives financial assistance from the U.S. Government and the State of Maryland in the form of grants. Entitlement to grant resources is generally conditioned upon compliance with terms and conditions of the grant agreements and applicable Federal and State regulations, including the expenditure of the resources for eligible purposes. Some grants are subject to financial and compliance audits in accordance with grantor’s requirements. Any

CITY OF BOWIE, MARYLANDNOTES TO BASIC FINANCIAL STATEMENTS
JUNE 30, 2007
64
disallowances as a result of these audits become a liability of the City. As of June 30, 2007, the City estimates that no material liabilities will result from such audits.
7. New Governmental Accounting Standards Board (GASB) Standard
The Governmental Accounting Standards Board (GASB) has issued several pronouncements prior to the year ended June 30, 2007, that have effective dates that may impact future financial presentations.
Management has not currently determined what, if any, impact implementation of the following statements may have on the financial statement of the City:
GASB Statement No. 43, “Financial Reporting for Postemployment Benefit Plans Other Than Pension Plans”, will be implemented in phases using the same criteria applied in the implementation of the new governmental reporting model. As a result, this Statement will be effective for the City beginning with its year ending June 30, 2008. This statement establishes uniform financial reporting standards for other postemployment benefit plans (OPEB plans) and supersedes existing guidance.
GASB Statement No. 45, “Accounting and Financial Reporting by Employers for Postemployment Benefits Other Than Pensions”, will be implemented in phases using the same criteria applied in the implementation of the new governmental reporting model. As a result, this Statement will be effective for the City beginning with its year ending June 30, 2009. This Statement will require governments to recognize an expense under the accrual basis for annual required OPEB contributions, regardless of amounts paid. The cumulative difference between amounts expensed and paid will create a liability (asset) similar to net pension obligations.

REQUIRED SUPPLEMENTARY INFORMATION

CITY OF BOWIEBudgetary Comparison Schedule (Non-GAAP Budgetary Basis)
General FundFor The Year Ended June 30, 2007
(Page 1 of 2)Variance withFinal Budget
Original Final PositiveBudget Budget Actual (Negative)
Revenues:Taxes 17,427,300$ 17,427,300$ 18,277,486$ 850,186$ Licenses and permits 317,400 317,400 538,432 221,032 Intergovernmental revenues 9,634,200 9,693,900 9,975,706 281,806 Fees and fines 1,531,400 1,531,400 1,842,534 311,134 Contributions 82,000 82,000 108,360 26,360 Interest income 715,000 715,000 1,153,226 438,226 Rental income 198,100 198,100 239,190 41,090 Other revenues 191,000 191,000 338,504 147,504
Total Revenues 30,096,400 30,156,100 32,473,438 2,317,338
Expenditures and encumbrances:General Government
City Council 195,500 195,500 185,293 10,207 City Manager 838,800 840,800 865,401 (24,601) Personnel 296,100 334,100 344,004 (9,904) Elections 200 4,400 2,955 1,445 Legal Services 140,000 156,200 152,057 4,143 Public Information 710,100 694,100 558,600 135,500 City Clerk 122,600 123,400 119,381 4,019 Finance 659,700 658,700 581,933 76,767 Information Technology 1,141,100 1,163,100 1,055,148 107,952 Community Services 484,800 485,800 468,320 17,480 Public Buildings and Grounds 399,000 416,800 409,024 7,776 Planning 497,700 554,200 533,301 20,899
Total General Government 5,485,600 5,627,100 5,275,417 351,683
Economic Development 452,300 452,300 298,780 153,520
Public SafetyHousing Inspection and Code Compliance 463,600 464,600 400,410 64,190 Public Safety 990,200 977,900 820,557 157,343 Police Department 1,298,100 1,167,000 807,583 359,417 Animal and Disease Control 203,100 204,100 171,798 32,302
Total Public Safety 2,955,000 2,813,600 2,200,348 613,252
Social ServicesSenior Citizen Services 856,300 856,700 798,226 58,474 Youth Services Bureau 737,400 737,600 753,108 (15,508)
Total Social Services 1,593,700$ 1,594,300$ 1,551,334$ 42,966$
(Continued)

CITY OF BOWIEBudgetary Comparison Schedule (Non-GAAP Budgetary Basis)
General FundFor The Year Ended June 30, 2007
(Page 2 of 2)Variance withFinal Budget
Original Final PositiveBudget Budget Actual (Negative)
Public WorksAdministrative 861,400$ 861,400$ 844,257$ 17,143$ Equipment Maintenance and Garage 788,200 788,200 736,286 51,914 Solid Waste 5,045,300 4,927,500 4,887,661 39,839 Street Maintenance 3,826,800 3,998,800 3,940,127 58,673 Stormwater Management 395,300 401,900 265,682 136,218
Total Public Works 10,917,000 10,977,800 10,674,013 303,787
Parks, Culture and RecreationRecreation 973,100 981,300 818,044 163,256 Parks and Grounds 1,910,600 1,932,600 1,936,535 (3,935) Ice Arena 746,100 827,900 827,651 249 Historic Properties and Museums 553,800 567,800 528,627 39,173 Gymnasium 422,900 440,900 445,132 (4,232)
Total Parks, Culture and Recreation 4,606,500 4,750,500 4,555,989 194,511
Debt Service 289,800 832,800 829,813 2,987
Nondepartmental 504,800 409,000 350,209 58,791
Total expenditures and encumbrances 26,804,700 27,457,400 25,735,903 1,721,497
Excess of revenues over expenditures 3,291,700 2,698,700 6,737,535 4,038,835
Other financing sources (uses):Sale of capital assets - - - - Transfers in 319,700 319,700 319,700 - Transfers out (3,903,900) (4,615,100) (4,509,383) 105,717
Total other financing sources (uses) (3,584,200) (4,295,400) (4,189,683) 105,717
Net change in fund balance (292,500) (1,596,700) 2,547,852 4,144,552
Fund balance - beginning 19,477,966 19,477,966 19,477,966 - Fund balance - ending 19,185,466$ 17,881,266$ 22,025,818 4,144,552$
Adjustments to reconcile to GAAP basis:Addition of encumbrances outstanding 303,334 Less prior year encumbrances expended in current year (289,072) Fund balance - June 30, 2007 (GAAP basis) 22,040,080$

CITY OF BOWIE, MARYLANDNOTES TO REQUIRED SUPPLEMENTARY INFORMATION
JUNE 30, 2007
A. Budgetary information - The annual operating budgets are plans of current expenditures and the proposed means of financing them. The primary means by which most of the financing, acquisition, spending, and service delivery activities of the governmental unit are legally controlled, is through the annual operating budget. The City of Bowie prepares an annual operating budget for each fund. The budgets are prepared on a line item basis by function, activity and object. The City’s fiscal year begins on July 1 and ends on June 30.
The following procedures are followed in establishing the budgetary data reflected in the financial statements:
Prior to April 15, a 6 year Capital Improvements Program is submitted by the City Manager to the City Council for adoption. Public hearings are held regarding the programs and adoption, via resolution, is made by the Council for those programs.
By the fifteenth of April, the City Manager submits to the City Council a proposed operating budget. The operating budget includes proposed expenditures, including those expenditures for the Capital Improvements Program approved for the ensuing year, and the estimated revenues by which the expenditures are to be financed.
Public hearings are conducted for taxpayers input regarding the proposed operating budget.
A favorable vote by a majority of the elected members of the Council is necessary to adopt, as an ordinance, the operating budget at the activity level.
Budgetary integration is used as a management control for all funds. Council approval is required, by ordinance, to increase the budgeted appropriations. Transfers of appropriations between activities require a council approved resolution. Twosupplemental appropriation ordinances and one transfer resolution were required this year.
Expenditures may not legally exceed budgeted appropriations at the activity level.
All appropriations, not expended or lawfully encumbered, lapse at the end of the budget year, and are available to fund appropriations in the subsequent year.
The making of contracts, or the spending of monies for capital improvements financed in whole or in part by bond proceeds, or the making of contracts for leases or services that extend beyond the budget year in which the contract is made, is expressly authorized.
B. An encumbrance system is used in the governmental fund type of accounts. This method is employed to reserve the applicable appropriations for those expenditure commitments resulting from approved contracts or purchase orders that have not been

CITY OF BOWIE, MARYLANDNOTES TO REQUIRED SUPPLEMENTARY INFORMATION
JUNE 30, 2007
performed or received by the end of the budget year. All encumbrances outstanding at year-end are recorded as a reservation of fund balance and do not constitute expenditures or liabilities because the commitments will be reappropriated and honored during the subsequent year.
C. For the year ended June 30, 2007, expenditures exceeded appropriations in the following activities (the legal level of budgetary control) of the general fund by the following amounts:
Activity AmountCity Manager, General Government $24,601Personnel, General Government 9,904Youth Services Bureau, Social Services 15,508Parks and Grounds, Parks, Culture and Recreation 3,935Gymnasium, Parks, Culture and Recreation 4,232 Total $58,180
These over expenditures were funded by unexpended appropriations from the remaining activities within each respective area of the general fund.
D. The City’s financial statements are prepared in accordance with all applicable legal requirements, which if inconsistent with generally accepted accounting principles are shown on separate schedules. There are no known violations of grant assurances or compliance procedures.
E. The City Code requires the adoption of an annual operating budget for each City fund including the proprietary funds.
F. The Statement of Revenues, Expenditures and Changes in Fund Balances - Governmental Funds is prepared on a basis consistent with generally accepted accounting principles under which method encumbrances are considered a reservation of fund balance and charged to operations in the year liquidated. All intergovernmental revenues applicable to these encumbrances are recorded as unearned for the current period, and earned for the subsequent period in which the reservation of fund balance is liquidated.
G. The Budgetary Comparison Schedule for the General Fund and the schedule of Revenues, Expenditures and Encumbrances and Changes in Fund Balance - Budget (Non-GAAP Budgetary Basis) and Actual – for the Equipment Acquisition and Replacement, and Capital Projects Fund were prepared on a basis consistent with the legally adopted budget. Under this method current year encumbrances outstanding are charged to budgetary appropriations and considered an expenditure of the current period.

CITY OF BOWIE, MARYLANDFund Descriptions
MAJOR GOVERNMENTAL FUNDS
GENERAL FUND
This fund accounts for all revenues and expenditures which are not accounted for in other funds. It is the largest and most important accounting activity. It receives a great variety of general revenues and finances a wide range of programs. Most of the City’s operation is financed from this fund.
EQUIPMENT ACQUISITION AND REPLACEMENT FUND
This Fund was established by Ordinance Number 5-79 passed by the Council on June 4, 1979. It receives amounts transferred from other funds, not only to acquire and replace equipment during the current year, but to accumulate amounts appropriated each year to replace equipment scheduled for replacement in future years.
CAPITAL PROJECTS FUND
The fund was established to account for all resources used for the acquisition of capital facilities by the City except those financed by enterprise funds. Capital Projects are those capital outlays which involve the acquisition and/or construction of major, permanent facilities having a relatively long life.
PROPRIETARY FUNDS
WATER AND SEWER FUND
This fund is operated to account for the activities of the Water and Sewer System. It is classified as an enterprise fund rendering services on a user charge basis. The system should be a self-supporting entity and the accounting must make it possible to show whether it operated at a profit or loss.

CITY OF BOWIESchedule of Revenues, Expenditures and Encumbrances
and Changes in Fund Balance - Budget (Non-GAAP Budgetary Basis) and ActualEquipment Acquisition and Replacement Fund
For the Year Ended June 30, 2007
Variance withFinal Budget
Original Final PositiveBudget Budget Actual (Negative)
Revenues:Interest income 132,000$ 132,000$ 164,730$ 32,730$
Expenditures and encumbrances:General Government
City Council 35,100 35,100 - 35,100 Information Technology 101,000 88,800 93,345 (4,545) Public Information 15,300 15,300 13,283 2,017
Total General Government 151,400 139,200 106,628 32,572
Public WorksAdministration 13,000 13,000 13,081 (81) Equipment Maintenance and Garage 60,000 60,000 59,140 860 Solid Waste 260,000 260,000 176,612 83,388 Street Maintenance 108,300 108,300 101,647 6,653 Stormwater Management 39,500 39,500 32,294 7,206
Total Public Works 480,800 480,800 382,774 98,026
Public SafetyPolice Department 480,000 620,600 627,564 (6,964) Animal Control 33,500 33,500 33,344 156
Total Public Safety 513,500 654,100 660,908 (6,808)
Social ServicesSenior Citizens Center 64,000 71,200 71,136 64
Total Senior Citizens Center 64,000 71,200 71,136 64
Parks, Culture and RecreationPark Operations 9,600 9,600 9,554 46 Parks and Grounds 139,600 139,600 161,974 (22,374) Ice Arena 5,400 5,400 5,400 -
Total Parks, Culture and Recreation 154,600 154,600 176,928 (22,328)
Total expenditures and encumbrances 1,364,300 1,499,900 1,398,374 101,526
Excess of revenues over expenditures (1,232,300) (1,367,900) (1,233,644) 134,256
Other financing sources (uses):Sale of Capital Assets 30,000 30,000 6,761 (23,239) Transfers in 1,719,300 1,854,900 1,749,183 (105,717)
Total other financing sources (uses) 1,749,300 1,884,900 1,755,944 (128,956)
Net change in fund balance 517,000 517,000 522,300 5,300
Fund balance - beginning 3,104,354 3,104,354 3,104,354 - Fund balance - ending 3,621,354$ 3,621,354$ 3,626,654 5,300$
Adjustments to reconcile to GAAP basis:Addition of encumbrances outstanding 49,103 Less prior year encumbrances expended in current year (32,653)
Fund balance - June 30, 2007 (GAAP basis) 3,643,104$

CITY OF BOWIESchedule of Revenues, Expenditures and Encumbrances
and Changes in Fund Balance - Budget (Non-GAAP Budgetary Basis) and ActualCapital Projects Fund
For the Year Ended June 30, 2007Variance withFinal Budget
Original Final PositiveBudget Budget Actual (Negative)
Revenues:Intergovernmental revenues 2,440,100$ 3,370,200$ 337,108$ (3,033,092)$ Contributions - - 92,293 92,293 Interest income 140,000 140,000 482,322 342,322 Sale of fixed assets - - 3,040,000 3,040,000
Total revenues 2,580,100 3,510,200 3,951,723 441,523
Expenditures and encumbrances:Capital outlay:
Land Acquisition 2,523,500 2,523,500 3,400 2,520,100 Public Buildings 4,318,700 5,576,400 4,846,388 730,012 Infrastructure 463,700 756,700 464,154 292,546 Drainage Control 72,200 72,200 10,080 62,120 Recreation Areas Development 1,615,700 1,570,700 691,893 878,807
Total expenditures and encumbrances 8,993,800 10,499,500 6,015,915 4,483,585
Deficiency of revenues under expenditures (6,413,700) (6,989,300) (2,064,192) 4,925,108
Other financing sources (uses):Transfers in 2,184,600 2,760,200 2,760,200 -
Net change in fund balance (4,229,100) (4,229,100) 696,008 4,925,108
Fund balance - beginning 6,758,701 6,758,701 6,758,701 - Fund balance - ending 2,529,601$ 2,529,601$ 7,454,709 4,925,108$
Adjustments to reconcile to GAAP basis:Addition of encumbrances outstanding 3,044,200 Less prior year encumbrances expended in current year (675,026)
Fund balance - June 30, 2007 (GAAP basis) 9,823,883$

CITY OF BOWIESchedule of Revenues, Expenses and Other Financing Sources (Uses) - Budget (Non-GAAP Budgetary Basis) and Actual
Water and Sewer FundFor the Year Ended June 30, 2007
Variance withFinal Budget
Original Final PositiveBudget Budget Actual (Negative)
Revenues:Water sales and sewerage surcharge 3,100,300$ 3,100,300$ 2,899,679$ (200,621)$ Minimum charges 831,000 831,000 855,674 24,674 Forfeited discounts and penalties 18,500 18,500 18,982 482 Processing fees 17,000 17,000 14,675 (2,325) Interest income 94,500 94,500 76,536 (17,964) Rental income - tower leases 217,800 217,800 176,931 (40,869) Intergovernmental 6,470,300 6,470,300 11,100 (6,459,200) Contributions - - 70,417 70,417 Other income 26,700 26,700 38,789 12,089
Total revenues 10,776,100 10,776,100 4,162,783 (6,613,317)
Expenses:Water Supply 1,777,600 1,792,600 1,422,897 369,703 Sewage treatment 9,487,900 9,613,300 2,074,672 7,538,628 Administrative and general 343,800 345,400 249,923 95,477 Miscellaneous 233,000 91,000 87,430 3,570 Debt service 264,000 264,000 261,674 2,326
Total expenses 12,106,300 12,106,300 4,096,596 8,009,704
Excess (deficiency) of revenues over expenses (1,330,200) (1,330,200) 66,187 1,396,387
Other financing sources (uses):Sales of capital assets 5,000 5,000 5,202 202 Proceeds - State Loan 1,277,900 1,277,900 - (1,277,900) Transfers out (319,700) (319,700) (319,700) -
Total other financing sources (uses) 963,200 963,200 (314,498) (1,277,698)
Net change in net assets (367,000) (367,000) (248,311) 118,689
Net assets - beginning 14,869,056 14,869,056 14,869,056 - Net assets - ending 14,502,056$ 14,502,056$ 14,620,745 118,689$
Adjustments to reconcile to GAAP basis:Addition of capital assets acquired in current year 290,416 Addition of principal payments on debt 173,556 Less depreciation expense (797,759) Less loss on sale of capital assets (49,010) Less amortization of bond issuance costs (780)
Net assets - June 30, 2007 (GAAP basis) 14,237,168$

“Growth, Unity, Progress”

SECTION III STATISTICAL SECTION

STATISTICAL SECTION
The Statistical Section presents detailed information for the primary government in the following areas, as a context for understanding what the information in the Financial Section says about the City’s overall financial health:
FINANCIAL TRENDS – Information to help the reader understand how the City’s financial performance and well-being have changed over time.
REVENUE CAPACITY – Information to help the reader assess the City’s most significant local revenue source, the property tax.
DEBT CAPACITY – Information to help the reader assess the affordability of the City’s current levels of outstanding debt and the City’s ability to issue additional debt in the future.
DEMOGRAPHIC AND ECONOMIC INFORMATION – Indicators to help the reader understand how the environment within which the city’s financial activities take place.
OPERATING INFORMATION – Service and infrastructure data to help the reader understand how the information in the City’s Financial report relates to the services the City provides and the activities it performs.
Many of the tables cover more than two fiscal years and present data from outside accounting records. Therefore, the Statistical Section is unaudited.
Sources: Unless otherwise noted, the information in these schedules is derived from the comprehensive annual financial reports for the relevant year. The City implemented GASB Statement 34 in 2003; schedules presenting government-wide information include information beginning that year.

CITY OF BOWIE, MARYLANDNet Assets by Component
Last Five Fiscal Years(accrual basis of accounting)
Restated2003 2004 2005 2006 2007
Governmental activities
Invested in capital assets net of debt 38,612,591$ 40,496,810$ 42,440,408$ 58,787,190$ 1 63,038,056$ Restricted - - - - - Unrestricted 20,582,615 20,770,099 26,006,525 30,991,207 36,872,917
Total Governmental activities net assets 59,195,206$ 61,266,909$ 68,446,933$ 89,778,397$ 99,910,973$
Business type activities Invested in capital assets net of debt 13,429,788$ 13,106,228$ 13,174,865$ 13,030,257$ 12,646,680$ Restricted - - - - - Unrestricted 2,520,311 2,413,965 1,865,992 1,838,799 1,590,488
Total business type activities net assets 15,950,099$ 15,520,193$ 15,040,857$ 14,869,056$ 14,237,168$
Primary Government Invested in capital assets net of debt 52,042,379$ 53,603,038$ 55,615,273$ 71,817,447$ 75,684,736$ Restricted - - - - - Unrestricted 23,102,926 23,184,064 27,872,517 32,830,006 38,463,405
Total primary governmental net assets 75,145,305$ 76,787,102$ 83,487,790$ 104,647,453$ 114,148,141$
Note: The city began to report accrual information when it implemented GASB Statement 34 in fiscal year 2003.
1 In conjunction with GASB 34, the City deferred recording infrastructure assets acquired prior to July 1, 2002 until the current fiscal year.
Fiscal Year

CITY OF BOWIEChanges in Net AssetsLast Five Fiscal Years
(accrual basis of accounting)
2003 2004 2005 2006 2007Expenses:Governmental activities: General government 4,670,793$ 4,994,301$ 5,217,842$ 5,662,395$ 6,075,685$ Economic development 349,273 343,077 340,841 323,902 311,325 Public safety 1,211,804 1,243,853 1,509,462 1,392,616 2,208,335 Social services 1,194,725 1,265,530 1,346,627 1,429,927 1,581,332 Public works 8,509,103 8,928,989 9,241,246 10,115,878 10,819,541 Parks, culture and recreation 3,552,626 5,401,085 4,378,977 4,879,148 5,273,747 Interest on longterm debt 109,125 86,923 63,881 45,192 16,223 Total government activities expenses 19,597,449 22,263,758 22,098,876 23,849,058 26,286,188
Business-type activities Water and wastewater 3,604,020 3,853,207 3,944,839 4,118,182 4,474,971
Total primary governmental expenses 23,201,469$ 26,116,965$ 26,043,715$ 27,967,240$ 30,761,159$
Program RevenuesGovernmental activities Charges for services: General government 33,017$ 56,392$ 44,640$ 48,343$ 92,734$ Economic development - - - - - Public safety 231,477 149,747 171,109 150,392 172,407 Social services - 1,875 2,122 2,509 3,818 Public works 296,951 349,673 367,716 367,253 431,692 Park, culture and recreation 709,990 730,175 819,069 1,028,412 1,073,677 Operating grants and contributions 779,478 675,960 711,199 608,325 653,146 Capital grants and contributions 1,110,812 803,126 246,092 448,468 450,803
Total government activities program revenues 3,161,725 2,766,948 2,361,947 2,653,702 2,878,277
Business-type activities
Charges for services
Water and wastewater 3,676,508 3,592,311 3,644,954 4,171,785 4,086,247
Total primary governmental program revenues 6,838,233$ 6,359,259$ 6,006,901$ 6,825,487$ 6,964,524$
Fiscal Year

CITY OF BOWIEChanges in Net AssetsLast Five Fiscal Years
(accrual basis of accounting)
2003 2004 2005 2006 2007Fiscal Year
Net (expenses)\revenueGovernmental activities (16,435,724)$ (19,496,810)$ (19,736,929)$ (21,195,356)$ (23,407,911)$ Business-type activities 72,488 (260,896) (299,885) 53,603 (388,724)
Total primary government net expenses (16,363,236) (19,757,706) (20,036,814) (21,141,753) (23,796,635)
General Revenues and Other Changes in Net Assets
Governmental activities: Taxes Property taxes 10,858,963$ 11,724,241$ 13,411,672$ 14,868,855$ 17,394,203$ Income taxes 5,243,686 5,344,257 5,821,688 6,280,436 6,022,381 State shared revenues 2,234,853 1,889,284 2,397,100 3,038,416 3,128,356 Other taxes 861,221 902,622 856,128 906,281 955,894 Franchise fees 615,199 644,409 764,202 914,942 891,831 Grants not restricted to specific programs - - - 20,884 30,107 Unrestricted Investment earnings 302,502 217,838 483,686 1,071,910 1,727,773 Special Item - Proceed from land sale easement 421,500 - - - 2,777,846 Miscellaneous 110,670 655,062 778,632 597,915 292,396 Transfers 171,900 190,800 242,900 311,000 319,700
Total government activities 20,820,494 21,568,513 24,756,008 28,010,639 33,540,487
Business-type activities Unrestricted Investment earnings 26,618 21,790 47,672 83,846 76,536 Miscellaneous - - 15,777 1,750 - Transfers (171,900) (190,800) (242,900) (311,000) (319,700)
Total business-type activities (145,282) (169,010) (179,451) (225,404) (243,164)
Total primary government 20,675,212$ 21,399,503$ 24,576,557$ 27,785,235$ 33,297,323$
Change in Net AssetsGovernmental activities 4,384,770$ 2,071,703$ 5,019,079$ 6,815,283$ 10,132,576$ Business-type activities (72,794) (429,906) (479,336) (171,801) (631,888)
Total primary government 4,311,976$ 1,641,797$ 4,539,743$ 6,643,482$ 9,500,688$
Note: The city began to report accrual information when it implemented GASB Statement 34 in fiscal year 2003.

CITY OF BOWIEFund Balances of Governmental Funds(modified accrual basis of accounting)
2003 2004 2005 2006 2007General fund Reserved 303,984$ 764,536$ 661,118$ 771,781$ 454,850$ Unreserved 13,399,821 13,508,766 14,826,010 18,706,185 21,585,230 Total general fund 13,703,805$ 14,273,302$ 15,487,128$ 19,477,966$ 22,040,080$
All other governmental funds Reserved 1,190,628$ 966,196$ 1,812,969$ 1,199,413$ 3,513,453$ Unreserved reported in: Equipment Acquisition and Replacement fund 3,059,600 2,539,700 2,777,200 3,071,700 3,594,000 Capital Projects fund 3,033,643 3,287,821 4,500,887 5,591,942 6,359,534
Total all other governmental funds 7,283,871$ 6,793,717$ 9,091,056$ 9,863,055$ 13,466,987$
Note: The city began to report accrual information when it implemented GASB Statement 34 in fiscal year 2003.
Fiscal Year

CITY OF BOWIE, MARYLANDCHANGES IN FUND BALANCES OF GOVERNMENTAL FUNDS
LAST TEN FISCAL YEARS(modified accrual basis of accounting)
1998 1999 2000 2001 2002 2003 2004 2005 2006 2007
REVENUESTaxes 7,616,102$ 8,555,616$ 8,574,221$ 9,299,309$ 10,081,805$ 11,674,465$ 12,561,973$ 14,193,004$ 15,696,055$ 18,277,486$ License and permits 420,981 392,907 519,968 498,161 290,602 284,834 362,940 444,810 454,708 538,432 Intergovernmental revenues 5,757,029 6,071,036 6,835,578 8,111,370 8,644,584 9,055,150 8,570,333 9,064,497 9,869,900 10,312,814 Fees and fines 453,212 482,596 893,607 684,689 784,675 1,362,136 1,360,455 1,487,800 1,830,944 1,842,534 Contributions 110,919 (35,774) 85,842 134,328 122,182 313,679 142,294 115,670 83,576 200,653 Interest income 1,295,328 1,323,645 1,342,183 1,310,435 522,801 340,511 268,676 483,686 1,071,910 1,800,279 Rental income 300,337 205,140 188,780 176,668 174,342 174,447 174,980 170,761 186,426 239,190 Other revenues 588,836 146,742 453,524 153,516 124,490 183,597 196,170 265,780 666,288 338,504 TOTAL REVENUES 16,542,744 17,141,908 18,893,703 20,368,476 20,745,481 23,388,819 23,637,821 26,226,008 29,859,807 33,549,892
EXPENDITURESCurrent: General government 2,797,012 3,007,449 3,284,565 5,183,037 4,339,439 3,924,247 4,033,515 4,342,281 4,786,384 5,232,559 Economic development 52,701 109,895 124,886 99,213 189,125 345,280 338,616 339,812 324,692 309,949 Public safety 686,738 739,273 823,325 979,047 1,122,952 1,209,471 1,241,726 1,506,995 1,404,494 2,177,231 Social services 548,289 595,737 667,172 843,437 1,071,889 1,159,481 1,229,803 1,316,770 1,413,710 1,546,205 Public works 4,819,083 4,946,217 5,627,920 5,781,706 6,848,599 8,028,357 8,463,104 8,742,477 9,531,847 10,660,363 Parks, culture and recreation 1,107,589 1,199,624 1,405,954 1,506,870 2,189,764 2,894,423 4,719,275 3,635,131 4,057,655 4,507,419 Other - unclassified 1,713,388 1,751,541 1,843,669 1,851,360 359,161 329,151 446,631 341,867 329,795 350,209 Debt service Principal 1,271,054 1,325,060 1,380,060 1,431,060 408,050 414,050 406,050 417,050 235,000 790,000 Interest 397,995 335,576 271,816 203,439 131,192 109,482 98,203 75,711 51,865 39,813 Capital outlay 2,532,274 2,789,744 7,530,621 4,928,684 2,233,810 4,439,724 3,128,838 2,817,093 3,302,392 5,136,559 TOTAL EXPENDITURES 15,926,123 16,800,116 22,959,988 22,807,853 18,893,981 22,853,666 24,105,761 23,535,187 25,437,834 30,750,307
Excess (deficiency) of revenues over (under) expenditures 616,621 341,792 (4,066,285) (2,439,377) 1,851,500 535,153 (467,940) 2,690,821 4,421,973 2,799,585
OTHER FINANCING SOURCES (USES)
Sale of Capital assets 7,019 3,483 24,300 35,690 28,058 10,592 95,226 577,444 29,864 6,761 Proceeds from land sale - - - - - - - - - 3,040,000 Transfers in 4,376,388 8,776,394 5,857,608 3,340,833 5,013,765 2,290,718 1,606,246 4,128,373 3,430,146 4,829,083 Transfers out (4,186,988) (8,856,594) (5,797,208) (3,174,528) (4,882,065) (2,118,818) (1,415,446) (3,885,473) (3,119,146) (4,509,383) TOTAL OTHER FINANCING SOURCES (USES) 196,419 (76,717) 84,700 201,995 159,758 182,492 286,026 820,344 340,864 3,366,461
NET CHANGE IN FUND BALANCES 813,040$ 265,075$ (3,981,585)$ (2,237,382)$ 2,011,258$ 717,645$ (181,914)$ 3,511,165$ 4,762,837$ 6,166,046$
Debt service as a percentage of noncapital expenditures 12.46% 11.85% 10.71% 9.14% 3.24% 2.84% 2.40% 2.38% 1.30% 3.24%
FISCAL YEAR

CITY OF BOWIE, MARYLAND
ASSESSED VALUE AND ESTIMATED ACTUAL VALUE OF TAXABLE PROPERTY LAST TEN FISCAL YEARS
(amounts expressed in thousands)
Estimated AssessedLess: Total Taxable Total Value as a
Fiscal Residential Commercial Personal Tax-Exempt Assessed Real Personal Total Direct Actual Percentage ofYear Property Property Property (1) Property Value Property Property Tax Rate Value Actual Value
1998 954,766$ 100,302$ 67,998$ 38,068$ 1,084,998$ $0.670 $0.670 $0.670 2,564,653$ 42.31%
1999 985,474 102,136 80,974 45,814 1,122,770 0.670 0.670 0.670 2,664,624 42.14
2000 998,808 114,554 83,280 46,064 1,150,578 0.630 0.630 0.630 2,865,387 40.15
2001 1,043,039 113,348 105,446 49,027 1,212,806 0.630 0.630 0.285 2,924,109 41.48
2002 2,895,054 341,926 100,883 133,911 3,203,952 0.252 0.630 0.265 3,295,183 97.23
2003 3,131,830 394,856 109,575 131,461 3,504,800 0.292 0.730 0.306 3,613,602 96.99
2004 3,239,542 407,574 167,568 132,279 3,682,405 0.292 0.730 0.312 3,917,664 93.99
2005 3,381,285 425,407 153,531 138,067 3,822,156 0.322 0.805 0.341 4,139,433 92.34
2006 3,755,596 437,608 160,776 136,814 4,217,166 0.322 0.805 0.341 4,869,299 86.61
2007 4,104,632 468,438 164,145 137,632 4,599,583 0.352 0.880 0.371 5,520,354 83.32
Note: Real property is assessed on a triennial basis. Prior to FY2001, real property was assessed at 40% of estimated full value.
Fiscal years 2002 through 2006 have been restated to correct errors.
(1) Assessed value and estimated actual for Personal Property are equal.
Real Property

CITY OF BOWIE, MARYLANDPROPERTY TAX RATES
DIRECT AND OVERLAPPING GOVERNMENTSLAST TEN FISCAL YEARS
(rate per $100 of assessed value)
Full Fiscal Basic Park and Total Value Year Rate County State Planning WSSC WSTC Tax Rate Equivalent
1998 0.6700$ 2.3010$ 0.2100$ 0.6100$ 0.0154$ 0.0650$ 3.8714$ 1.5486$
1999 0.6700 2.3020 0.2100 0.6100 0.0149 0.0650 3.8719 1.5488
2000 0.6300 2.3150 0.2100 0.6100 0.0128 0.0650 3.8428 1.5371
2001 0.6300 2.3300 0.2100 0.6100 0.0106 0.0650 3.8556 1.5422
2002 0.2520 0.9380 0.0840 0.2440 0.0047 0.0260 1.5487
2003 0.2920 0.9440 0.0840 0.2440 0.0038 0.0260 1.5938
2004 0.2920 0.9450 0.1320 0.2790 0.0037 0.0260 1.6777
2005 0.3220 0.9440 0.1320 0.2790 0.0033 0.0260 1.7063
2006 0.3220 0.9440 0.1320 0.2790 0.0017 0.0260 1.7047
2007 0.3520 0.9450 0.1120 0.2790 0.0014 0.0260 1.7154
Notes: Overlapping rates are those of local and county governments that apply to property owners within the City of Bowie.
Beginning in FY2002, real property was assessed at 100% of full value. In prior years real property was assessed at 40% of full value. The
column titled "Full Value Equivalent" has been added to give comparability for prior years data.
Overlapping Tax Rates
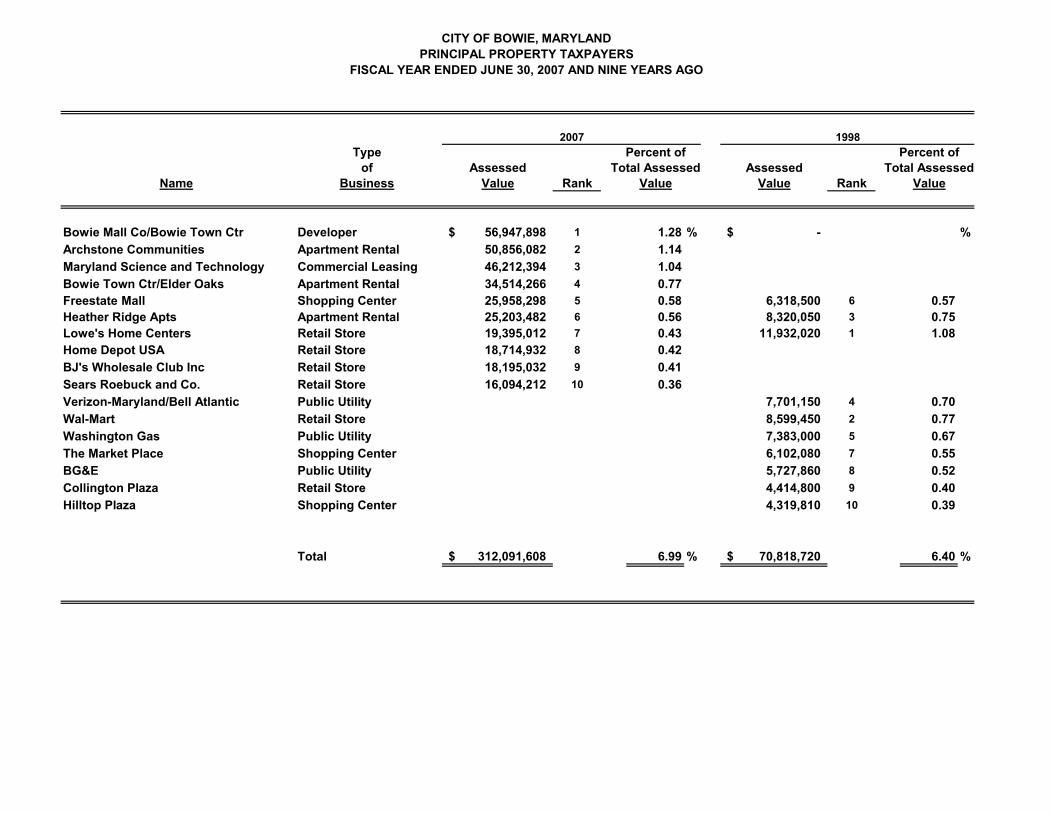
CITY OF BOWIE, MARYLANDPRINCIPAL PROPERTY TAXPAYERS
FISCAL YEAR ENDED JUNE 30, 2007 AND NINE YEARS AGO
Type Percent of Percent ofof Assessed Total Assessed Assessed Total Assessed
Business Value Rank Value Value Rank Value
Bowie Mall Co/Bowie Town Ctr Developer 56,947,898$ 1 1.28 % -$ %
Archstone Communities Apartment Rental 50,856,082 2 1.14
Maryland Science and Technology Commercial Leasing 46,212,394 3 1.04
Bowie Town Ctr/Elder Oaks Apartment Rental 34,514,266 4 0.77Freestate Mall Shopping Center 25,958,298 5 0.58 6,318,500 6 0.57Heather Ridge Apts Apartment Rental 25,203,482 6 0.56 8,320,050 3 0.75Lowe's Home Centers Retail Store 19,395,012 7 0.43 11,932,020 1 1.08Home Depot USA Retail Store 18,714,932 8 0.42
BJ's Wholesale Club Inc Retail Store 18,195,032 9 0.41
Sears Roebuck and Co. Retail Store 16,094,212 10 0.36
Verizon-Maryland/Bell Atlantic Public Utility 7,701,150 4 0.70
Wal-Mart Retail Store 8,599,450 2 0.77
Washington Gas Public Utility 7,383,000 5 0.67
The Market Place Shopping Center 6,102,080 7 0.55
BG&E Public Utility 5,727,860 8 0.52
Collington Plaza Retail Store 4,414,800 9 0.40
Hilltop Plaza Shopping Center 4,319,810 10 0.39
Total 312,091,608$ 6.99 % 70,818,720$ 6.40 %
Name
19982007

CITY OF BOWIE, MARYLAND
PROPERTY TAX LEVIES AND COLLECTIONSLAST TEN FISCAL YEARS
FiscalYear Taxes Levied Collections
Ended for the in Subsequent PercentJune 30, Fiscal Year Amounts Years Amounts of Levy
1998 7,445,424$ 7,407,868$ 99.5 % 16,353$ 7,424,221$ 99.7 %
1999 8,250,818 8,081,471 97.9 18,096 8,099,567 98.2
2000 7,839,798 7,575,380 96.6 41,260 7,616,640 97.2
2001 8,464,043 8,409,781 99.4 368,223 8,778,004 103.7
2002 9,240,192 9,165,877 99.2 37,495 9,203,372 99.6
2003 10,858,962 10,721,204 98.7 43,958 10,765,162 99.1
2004 11,724,241 11,636,211 99.2 79,354 11,715,565 99.9
2005 13,411,671 13,370,358 99.7 59,236 13,429,594 100.1
2006 14,919,768 14,783,047 99.1 29,097 14,812,144 99.3
2007 17,466,709 17,388,429 99.6 26,428 17,414,857 99.7
Collected within the Fiscal Year of the Levy Total Collections to Date
Collectedof LevyPercent

CITY OF BOWIE, MARYLANDRATIOS OF OUTSTANDING DEBT BY TYPE
LAST TEN FISCAL YEARS
Governmental Activities
General General Total Percentage ofFiscal Obligation Obligation State Primary Personal Taxable PerYear Bond Bond Loans Government Income Capita
1998 6,596,380$ 2,198,680$ -$ 8,795,060$ 1.2674% 185.06$ 1999 5,271,320 1,548,740 - 6,820,060 0.9484% 142.86 2000 3,891,260 865,800 - 4,757,060 0.5629% 94.63 2001 2,460,200 147,850 1,928,304 4,536,354 0.5177% 87.84 2002 2,052,150 96,900 3,514,118 5,663,168 0.6262% 107.12 2003 1,848,100 96,900 3,607,869 5,552,869 0.6186% 102.95 2004 1,442,050 47,950 3,446,705 4,936,705 0.5065% 90.63 2005 1,025,000 - 3,281,512 4,306,512 0.4264% 78.89 2006 790,000 - 3,112,190 3,902,190 0.3753% 70.27 2007 - - 2,938,634 2,938,634 - 52.83
Note: The personal taxable income figure for fiscal year 2007 was unavailable prior to publication.
Business Type Activities

CITY OF BOWIE, MARYLANDDIRECT AND OVERLAPPING GOVERNMENTAL ACTIVITIES DEBT
AS OF JUNE 30, 2007
Net PercentageTax-supported Applicable to This
Debt Outstanding Governmental Unit Share of Debt
DIRECT DEBT
City of Bowie -$ -$
OVERLAPPING DEBT1
Prince George's County 759,188,646 8.00% 2 60,735,092
Washington Suburban Sanitary Commission:
Prince George's Storm Drainage3 2,055,000 4.00% 82,200
Maryland-National Capital Park and Planning Commission 106,590,000 8.00% 2 8,527,200
Industrial Development Authority of Prince George's County
lease revenue bonds 50,349,910 8.00% 2 4,027,993
Total Overlapping Debt 918,183,556 73,372,484
Total Direct and Overlapping Debt 918,183,556$ 73,372,484$
which the residents of the City of Bowie are obligated to pay through the direct tax levies of the respective governmental units.
2. Ratio of Assessed Value in the City of Bowie to the total Assessed Value in Prince George's County.
3. Approximation, since residents are not assessed for any new debt issued after June 30, 1978. The City is responsible for all storm drainage within the City after this date.
Total WSSC outstanding debt of $409,545,621 is applicable to Prince George's County acting as co-guarantor with Montgomery County, Maryland.
Approximately one-half of the City is subject to WSSC storm drain debt which was issued prior to June 30, 1978.
Governmental UnitName
1. Overlapping Debt is not bonded debt of the City of Bowie on either a direct or contingent basis, but represents the share of debt of overlapping governmental units

CITY OF BOWIE, MARYLANDLEGAL DEBT MARGIN INFORMATION
LAST TEN FISCAL YEARS(amounts expressed in thousands)
Legal Debt Margin Calculation for Fiscal Year 2007
4,599,583$36,797
- 36,797$
1998 1999 2000 2001 2002 2003 2004 2005 2006 2007
Debt Limit 165,997$ 23,235$ 23,922$ 24,222$ 25,632$ 28,038$ 29,459$ 30,577$ 33,737$ 36,797$
Total net debt applicable to limit 6,596 6,271 3,891 2,460 2,052 1,638 1,442 1,025 790 -
Legal Debt Margin 159,401$ 16,964$ 20,031$ 21,762$ 23,580$ 26,400$ 28,017$ 29,552$ 32,947$ 36,797$
Total net debt applicable to thelimit as a percentage of debt limit 3.97% 26.99% 16.27% 10.16% 8.01% 5.84% 4.89% 3.35% 2.34% 0.00%
Debt applicable to limit: General obligation bonds
Legal debt margin
Assessed valueDebit limit (.8% of assessed value)

CITY OF BOWIE, MARYLANDDEMOGRAPHIC AND ECONOMIC STATISTICS
LAST TEN FISCAL YEARS
PersonalFiscal Taxable Per Capita Median Educational UnemploymentYear Population Income6 Income Age Level Rate7
1998 47,523 2 693,954,117$ 21,144$ 33.0 14.6 8,347 4 4.8%
1999 47,738 2 719,080,749 21,567 33.0 14.6 8,444 3.8
2000 50,269 3 845,119,417 30,703 3 36.3 3 14.9 4 8,410 4.3
2001 51,643 2, 4 876,326,108 31,685 4 36.3 4 14.9 4 8,555 4.0
2002 52,865 2, 4 907,367,924 32,034 36.3 14.9 8,580 5.1
2003 53,933 2, 4 897,677,138 32,707 36.3 14.9 8,650 5.2
2004 54,469 2,4 974,666,884 33,786 36.3 14.9 8,698 4.8
2005 54,588 2 1,010,061,784 34,641 36.3 14.9 8,767 4.8
2006 55,529 2 1,039,684,679 36,066 36.3 14.9 8,760 4.8
2007 55,626 2 - 5 37,035 36.3 14.9 8,522 4.2
1. Prince George's County Board of Education.
2. Estimate from City of Bowie Planning Department.
3. Bureau of the Census.
4. Restated to correct error in prior year totals.
5. 2007 Information not yet available.
6. State of Maryland provides Net Taxable Income data.
7. Maryland Department of Labor, Career and Workforce.
SchoolEnrollment1

CITY OF BOWIE, MARYLANDPRINCIPAL EMPLOYERSFOR FISCAL YEAR 2007
Percentageof Total City
Employer Employees Employment
Prince George's County Public Schools 1,000 6.77%City of Bowie 319 2.16%Giant Food 225 1.52%Washington Savings Bank 163 1.10%Larkin Chase Nursing (Harborside Healthcare) 156 1.06%United States Post Office 150 1.01%ITT 135 0.91%Institute for Defense Analysis 112 0.76%Safeway 110 0.74%US Census Computer Facility 100 0.68%
Totals 2,470 16.71%
Source: City of Bowie Economic Development Office. Data for 1998 is unavailable. Percentages of total employment calculated from 2005 US Census Bureau ZIP Code Business Patterns Summary. There are 14,781 total employees for the zipcodes describing the City.

CITY OF BOWIE, MARYLANDFULL-TIME EQUIVALENT CITY GOVERNMENT EMPLOYEES BY FUNCTION
LAST TEN FISCAL YEARS
1998 1999 2000 2001 2002 2003 2004 2005 2006 2007FUNCTION
GENERAL GOVERNMENT:City Manager 6.0 6.0 6.0 6.0 7.0 7.0 6.5 7.1 7.1 7.2 Personnel 2.3 2.5 2.8 2.8 2.8 2.8 2.8 2.8 3.3 3.5 Finance 4.3 4.3 5.3 6.0 6.0 6.0 6.8 6.8 6.8 8.4 Information Technology 3.0 3.0 5.0 5.5 6.5 6.9 6.9 8.4 10.0 12.4 Public Information 5.3 5.3 5.3 5.0 5.9 5.9 6.4 5.6 5.6 5.6 City Clerk 1.0 1.0 1.0 1.0 1.0 1.0 1.0 1.0 1.0 1.0 Community Services 5.4 5.4 5.4 4.5 4.5 4.5 4.5 4.5 4.5 4.5 Public Building and Grounds 12.2 12.9 14.9 17.0 17.6 7.0 5.5 4.5 4.5 4.5 Planning 7.7 7.7 7.7 7.7 6.7 6.7 5.7 6.0 6.0 6.0 Economic Development 1.0 1.0 1.0 1.0 1.0 1.0 1.0 1.8 2.0 2.0 Total General Government 48.2 49.1 54.4 56.5 59.0 48.8 47.1 48.5 50.8 55.1
PUBLIC SAFETY:Housing Inspection and Code Compliance 6.4 6.4 6.4 6.4 6.4 6.4 6.9 7.4 7.4 7.4 Public Safety - - - 1.0 1.0 1.0 1.0 1.0 1.0 1.0 Police Department - - - - - - - - 0.1 10.2 Animal and Disease Control 2.0 3.0 3.0 3.0 3.0 3.0 3.0 3.0 3.0 3.2 Total Public Safety 8.4 9.4 9.4 10.4 10.4 10.4 10.9 11.4 11.5 21.8
SOCIAL SERVICES:Senior Citizen Services 6.6 6.5 9.7 10.2 11.6 11.6 12.0 12.1 13.2 13.8 Youth Services Bureau 7.9 7.9 8.5 8.5 9.0 9.0 9.1 9.1 9.2 9.2 Total Social Services 14.5 14.4 18.2 18.7 20.6 20.6 21.1 21.2 22.4 23.0
PUBLIC WORKS:Administration 7.0 7.0 7.0 7.0 7.0 7.0 7.0 7.0 8.0 8.0 Equipment Maintenance and Garage 4.0 4.0 4.0 4.0 4.0 4.0 4.0 4.0 4.0 4.0 Solid Waste 48.3 50.5 52.5 52.5 54.5 52.5 56.5 56.5 57.7 57.7 Street Maintenance 16.2 16.2 18.2 17.2 18.2 19.2 20.5 21.0 25.3 25.9 Stormwater Management 3.3 3.5 4.3 4.3 5.3 5.3 5.3 5.3 5.3 6.3 Total Public Works 78.8 81.2 86.0 85.0 89.0 88.0 93.3 93.8 100.3 101.9
Full-Time Equivalent Employees as of June 30
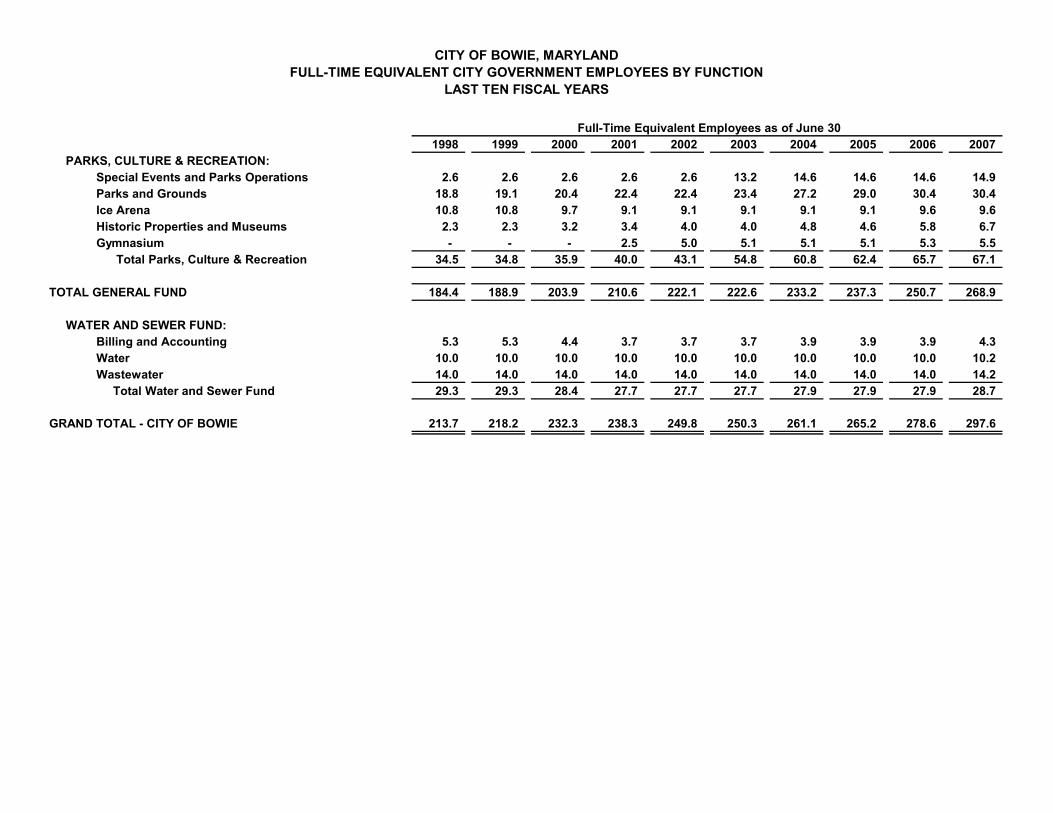
CITY OF BOWIE, MARYLANDFULL-TIME EQUIVALENT CITY GOVERNMENT EMPLOYEES BY FUNCTION
LAST TEN FISCAL YEARS
1998 1999 2000 2001 2002 2003 2004 2005 2006 2007 Full-Time Equivalent Employees as of June 30
PARKS, CULTURE & RECREATION:Special Events and Parks Operations 2.6 2.6 2.6 2.6 2.6 13.2 14.6 14.6 14.6 14.9 Parks and Grounds 18.8 19.1 20.4 22.4 22.4 23.4 27.2 29.0 30.4 30.4 Ice Arena 10.8 10.8 9.7 9.1 9.1 9.1 9.1 9.1 9.6 9.6 Historic Properties and Museums 2.3 2.3 3.2 3.4 4.0 4.0 4.8 4.6 5.8 6.7 Gymnasium - - - 2.5 5.0 5.1 5.1 5.1 5.3 5.5 Total Parks, Culture & Recreation 34.5 34.8 35.9 40.0 43.1 54.8 60.8 62.4 65.7 67.1
TOTAL GENERAL FUND 184.4 188.9 203.9 210.6 222.1 222.6 233.2 237.3 250.7 268.9
WATER AND SEWER FUND:Billing and Accounting 5.3 5.3 4.4 3.7 3.7 3.7 3.9 3.9 3.9 4.3 Water 10.0 10.0 10.0 10.0 10.0 10.0 10.0 10.0 10.0 10.2 Wastewater 14.0 14.0 14.0 14.0 14.0 14.0 14.0 14.0 14.0 14.2 Total Water and Sewer Fund 29.3 29.3 28.4 27.7 27.7 27.7 27.9 27.9 27.9 28.7
GRAND TOTAL - CITY OF BOWIE 213.7 218.2 232.3 238.3 249.8 250.3 261.1 265.2 278.6 297.6

CITY OF BOWIE, MARYLANDOPERATING INDICATORS BY FUNCTION
LAST TEN FISCAL YEARS
1998 1999 2000 2001 2002 2003 2004 2005 2006 2007FUNCTION
GENERAL GOVERNMENTPublic Building and Grounds:
Square feet maintained per full-time equivalent - - - - 107,332 107,332 107,332 107,932 107,932 110,732Planning and Economic Development:
Subdivision Reviews - Total 16 2 2 4 6 10 13 6 8 4Zoning Reviews - Total 8 17 3 8 7 6 2 1 9 6Site Plans - Total 38 29 17 9 10 13 13 12 18 14
PUBLIC SAFETY:Housing Inspection and Code Compliance:
Number of Code Compliance Warning Notices 3,677 4,768 4,976 4,900 4,509 4,708 4,835 4,653 3,214 7,580Rental Inspections/reinspections performed 2,614 2,487 2,734 2,800 1,454 1,511 2,040 1,183 1,200 1,464Number of Building Permits issued 725 691 747 700 836 482 526 559 532 602
Animal Control:Number of service reports taken 0 0 1,418 1,018 1,327 1,137 1,816 2,368 2,500 2,630Number of running-at-large calls 0 0 526 406 392 300 554 476 550 456Number of wildlife complaints 0 0 108 128 70 90 184 300 275 500
SOCIAL SERVICES:Senior Citizen Services:
Number of bus passenger miles 51,700 46,588 51,939 55,052 61,000 58,871 58,963 59,600 60,000 61,200Number of meals served and delivered 9,874 11,534 11,494 15,774 11,624 10,919 13,703 11,900 13,300 15,050Average daily attendance (all times) 56 80 93 203 331 302 319 342 318 326
Youth Services Bureau:Number of adults & youths counseled 484 451 467 553 576 470 474 832 500 650Number of alcohol/drug-free events for youth 14 12 12 12 12 13 18 15 15 12
PUBLIC WORKS:Solid Waste:
Number of households served 16,980 17,485 17,763 19,049 19,200 19,500 20,184 20,250 20,514 20,554Total number of tons collected 27,482 27,800 27,336 29,500 32,533 34,470 38,114 38,600 37,385 37,508Number of tons recycled 6,883 7,000 6,759 7,000 7,969 7,864 9,242 9,500 8,985 9,280
Street Maintenance:Miles of street maintained by City 150 153 155 160 163 175 178 180 182 182Miles of sidewalks maintained by City 65 68 68 82 85 100 116 122 123 125Number of street lights maintained by City 3,966 4,047 4,332 4,400 4,500 4,600 4,752 4,910 5,182 5,200
FISCAL YEAR

CITY OF BOWIE, MARYLANDOPERATING INDICATORS BY FUNCTION
LAST TEN FISCAL YEARS
1998 1999 2000 2001 2002 2003 2004 2005 2006 2007FISCAL YEAR
PARKS, CULTURE & RECREATION:Special Events and Park Operations:
Number of picnics-resident & non-resident 298 300 390 445 445 480 447 * 441 455 525Bowie Playhouse days in use 197 200 195 217 200 200 178 139 150 185Number of special events 0 0 0 0 8 9 9 10 10 12Number of city concerts 0 0 0 0 15 15 14 27 28 29Number of days boathouse open 0 0 103 94 94 64 68 ** 70 70 49
Ice Arena:Length of skating season 0 0 10 mo. 9 mo. 10 mo. 10 mo. 10 mo. 10 mo. 10 mo. 10 mo.Total number of all admissions 0 0 19,000 17,583 18,000 17,500 17,200 16,500 18,000 17,625
Historic Properties and Museums:Visitors to all properties and museums 6,278 8,175 9,350 9,358 11,706 12,002 13,210 13,525 14,900 15,800Volunteer hours at all properties and museums 2,917 2,050 3,400 2,040 1,833 1,787 1,720 1,665 1,710 1,400
Gymnasium:Hours Programmed 0 0 0 1,300 3,500 3,680 4,180 4,264 5,085 5,100Court rental hours 0 0 0 0 0 0 0 6,349 6,530 7,380
Water and Sewer Fund:Billing and Accounting:Number of water/sewer customers-residential 7,677 7,660 7,682 7,655 7,690 7,684 7,660 7,690 7,690 7,700Number of water/sewer customers-commercial 194 191 189 180 174 178 173 175 180 176Water:Miles of pipeline 90 90 90 90 90 90 90 90 90 90Number of fire hydrants 562 560 560 560 560 560 560 560 560 560Million gallons treated/delivered 766 800 718 653 710 744 673 692 700 800Wastewater:Million gallons of wastewater treated 772 718 691 689 667 732 758 684 660 744Tons of sludge produced 4,420 4,444 4,229 4,740 3,718 3,402 3,616 3,406 2,678 3,008
1Meals delivered only
*Beginning in FY 04, these indicators are based on number of days reserved, whereas prior years these were based on number of permits issued. This is due to change over to new RecWare management software.**Beginning in FY 04, these indicators are now based on the calendar year boathouse season.

CITY OF BOWIE, MARYLANDCAPITAL ASSET STATISTICS BY FUNCTION
LAST TEN FISCAL YEARS
1998 1999 2000 2001 2002 2003 2004 2005 2006 2007FUNCTION
PUBLIC WORKS:Street Maintenance
Miles of Streets and Roads 163 161 163 164 163 175 178 180 180 182Miles of Sidewalks 73 73 73 73 85 100 116 122 124 125Miles of Alleys 2 2 2 2 2 2 2 2 2 2Number of street lights 4,047 3,966 4,234 4,234 4,450 4,600 4,752 4,910 5,100 4,982Number of Traffic Light Controlled Intersections 18 18 19 19 23 23 23 24 24 24
Solid WasteNumber of Households Served 16,980 17,485 17,763 19,049 19,200 19,500 20,184 20,250 20,350 20,554
Stormwater ManagementMiles of Storm Sewers 396 396 396 396 396 396 396 396 396 396Number or SWM ponds and basins maintained 29 30 37 40 49 51 57 60 60 67
PARKS, CULTURE & RECREATION:Parks and Open Space-Number of Acres 1,780 1,780 1,780 1,780 1,780 1,780 1,780 1,360 1,360 1,360Number of Community Centers 3 3 3 3 3 3 3 3 3 3Number of Ball Fields-City, Co. Bd of Ed MNCPPC1 72 72 72 72 72 75 75 78 78 78Number of Ice Skating Rinks 1 1 1 1 1 1 1 1 1 1Number of Theaters 1 1 1 1 1 1 1 2 2 2Number of Skateboard Parks 1 1 1 1 1 1 0 0 1 1Number of Museums 3 5 5 5 5 5 5 5 5 5
WATER & SEWER FUND: Miles of Sanitary Sewers 130 130 130 130 130 130 130 130 130 130 Number of Customers 7,851 7,871 7,858 7,864 7,853 7,862 7,833 7,865 7,879 7,876Daily Average Water Consumption M.G. 3 3 3 3 2 2 2 2 2 2Water Plant Capacity M.G.D. 5 5 5 5 5 5 5 5 5 5Miles of Water Mains 95 95 95 95 95 90 90 90 90 90Number of Fire Hydrants 562 562 562 562 562 560 560 560 560 560Water Plant Storage Capacity M.G. 4 4 4 4 4 4 4 4 4 4
1 Restated to correct errors in fiscal years 2005 and 2006.
FISCAL YEAR

“Growth, Unity, Progress”