The Materials Genome Initiative and Materials Innovation Infrastructure
1
Mayor Kasim Reed
City of Atlanta
Green Infrastructure Initiative Incorporating GI into Watershed Improvement Plans
SESWA 2016 Annual Conference
Kishia L. Powell, Commissioner
Department of Watershed Management
10/25/2016
2
Agenda
• Background on the GI program
• Overview of Atlanta watersheds
• Adding GI to WIP Process
3
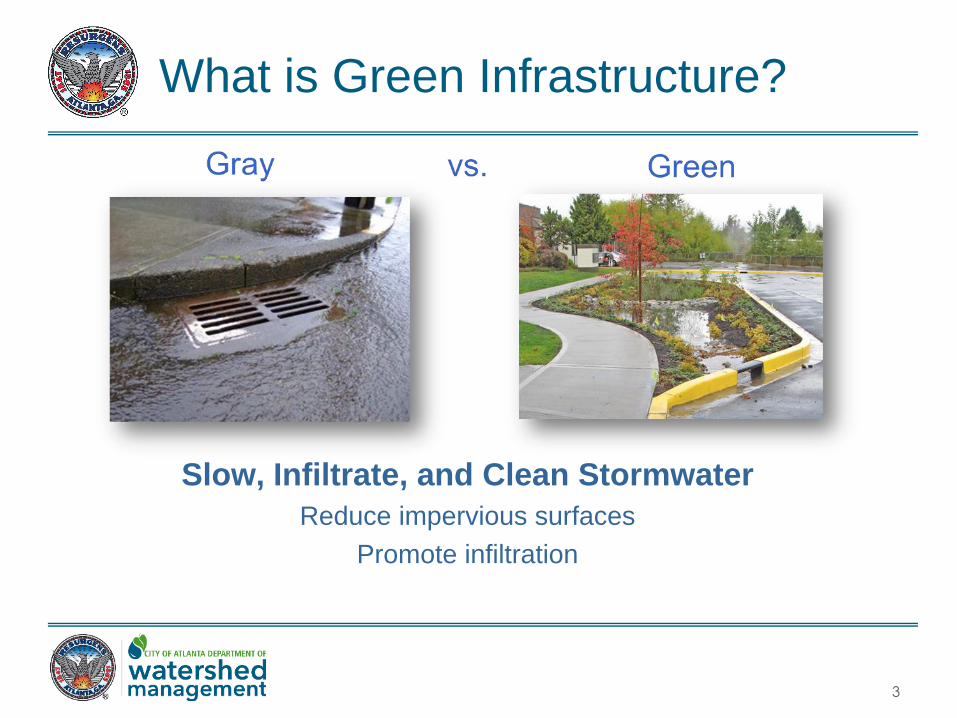
What is Green Infrastructure?
Slow, Infiltrate, and Clean Stormwater
Reduce impervious surfaces
Promote infiltration
4
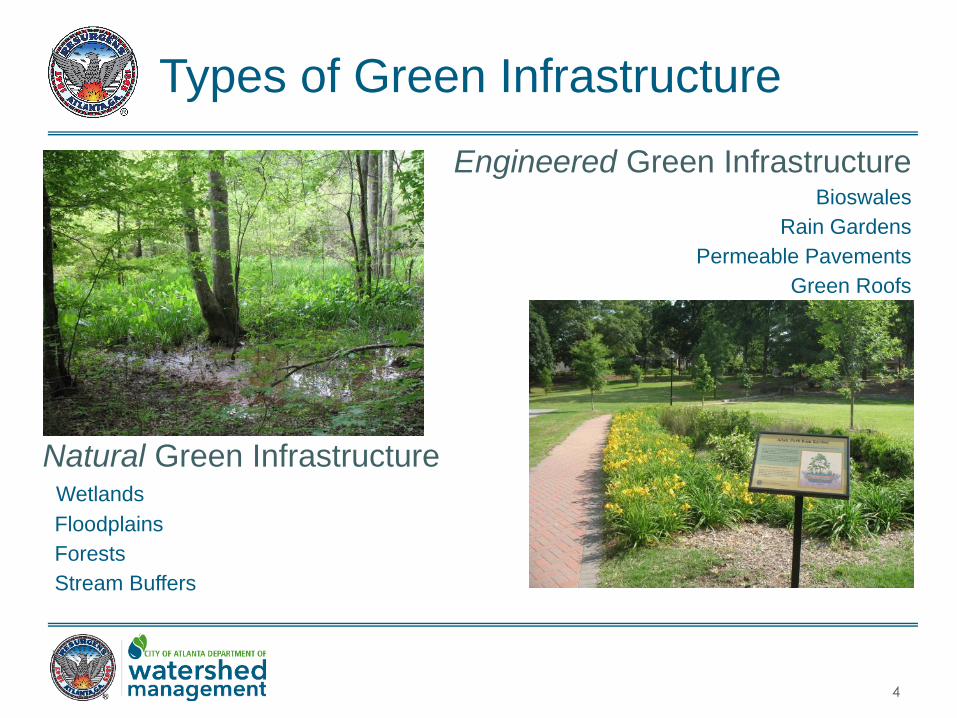
Types of Green Infrastructure
Natural Green Infrastructure Wetlands
Floodplains
Forests
Stream Buffers
Engineered Green Infrastructure Bioswales
Rain Gardens
Permeable Pavements
Green Roofs
5
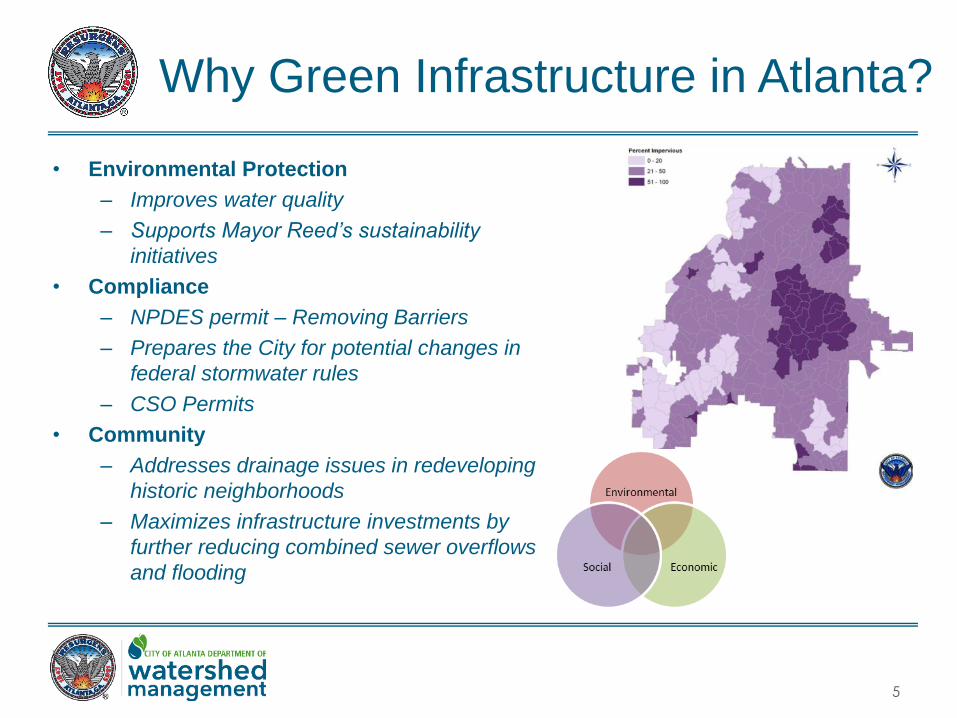
• Environmental Protection
– Improves water quality
– Supports Mayor Reed’s sustainability
initiatives
• Compliance
– NPDES permit – Removing Barriers
– Prepares the City for potential changes in
federal stormwater rules
– CSO Permits
• Community
– Addresses drainage issues in redeveloping
historic neighborhoods
– Maximizes infrastructure investments by
further reducing combined sewer overflows
and flooding
Why Green Infrastructure in Atlanta?
6
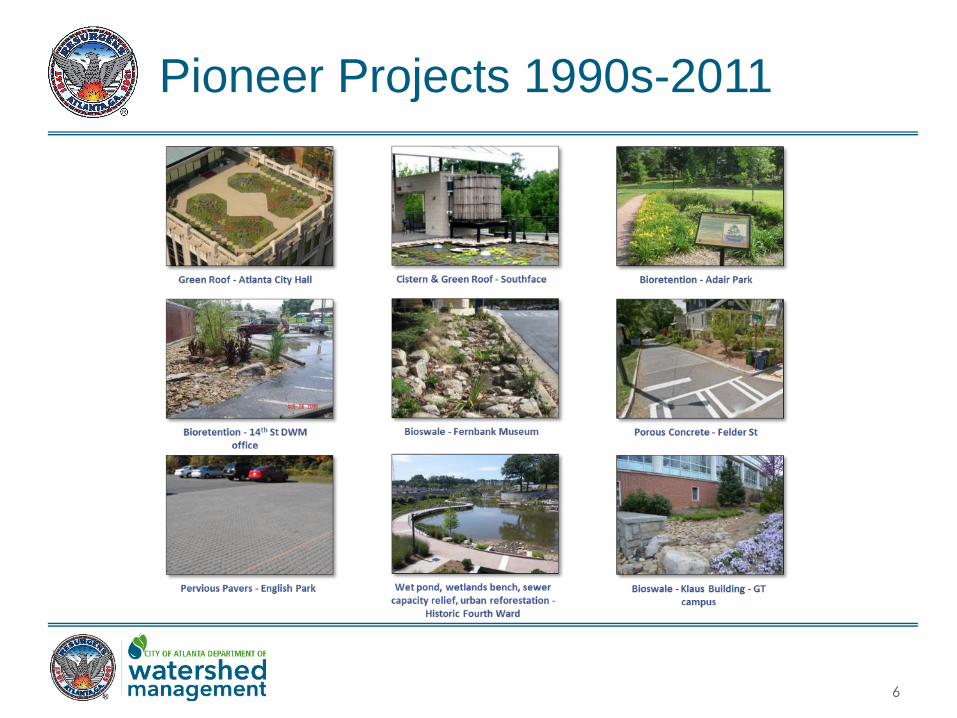
Pioneer Projects 1990s-2011
7
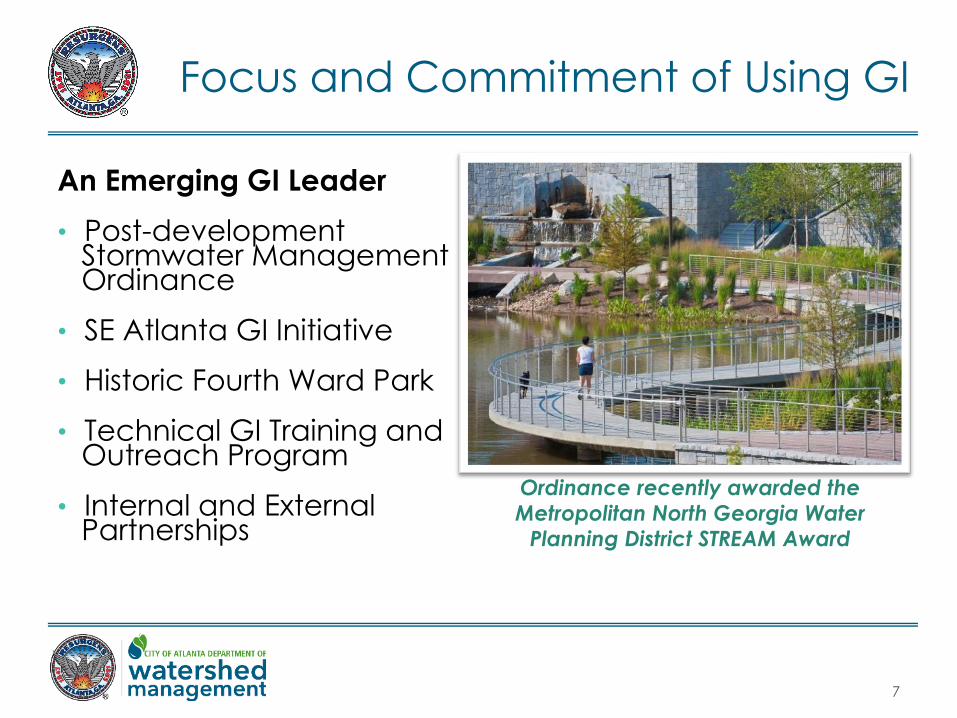
Focus and Commitment of Using GI
An Emerging GI Leader
• Post-development Stormwater Management Ordinance
• SE Atlanta GI Initiative
• Historic Fourth Ward Park
• Technical GI Training and Outreach Program
• Internal and External Partnerships
Ordinance recently awarded the Metropolitan North Georgia Water
Planning District STREAM Award
8
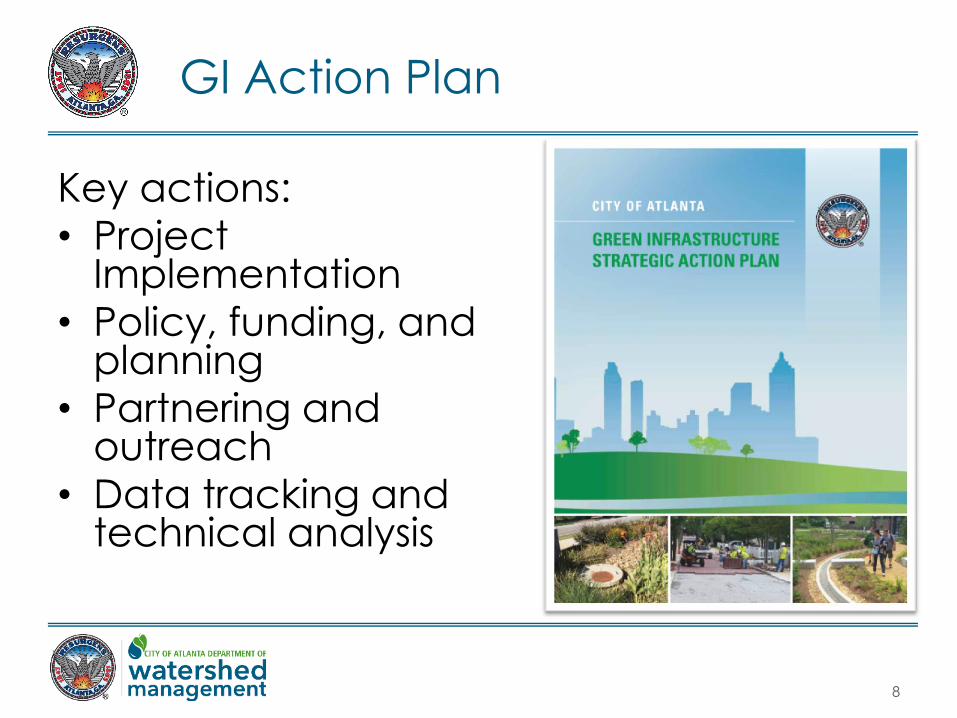
GI Action Plan
Key actions:
• Project Implementation
• Policy, funding, and planning
• Partnering and outreach
• Data tracking and technical analysis
9
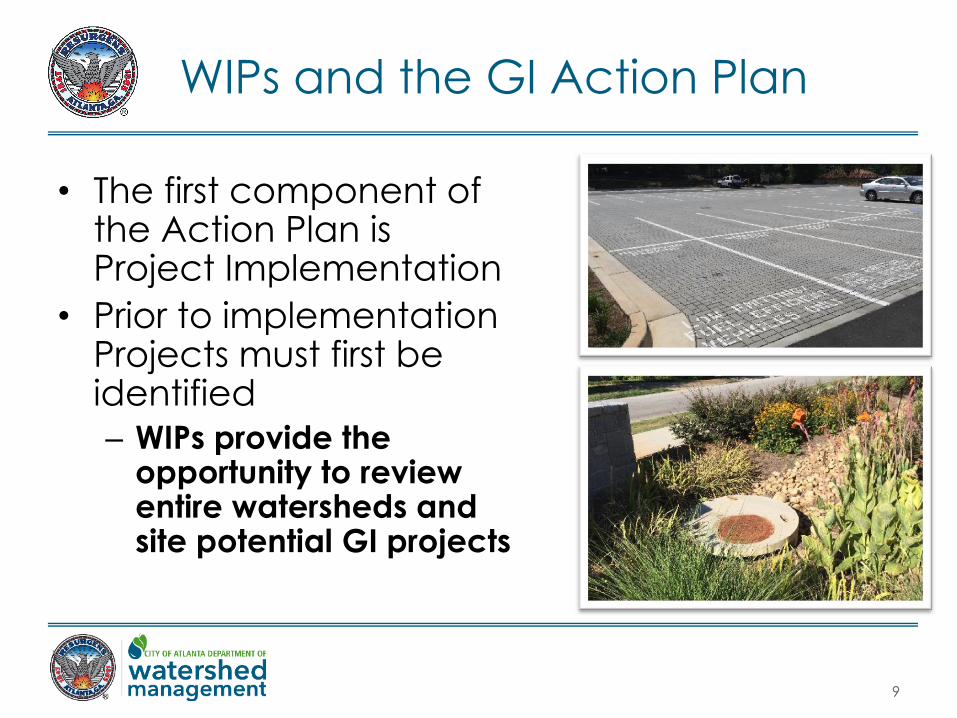
WIPs and the GI Action Plan
• The first component of the Action Plan is Project Implementation
• Prior to implementation Projects must first be identified
– WIPs provide the opportunity to review entire watersheds and site potential GI projects
10
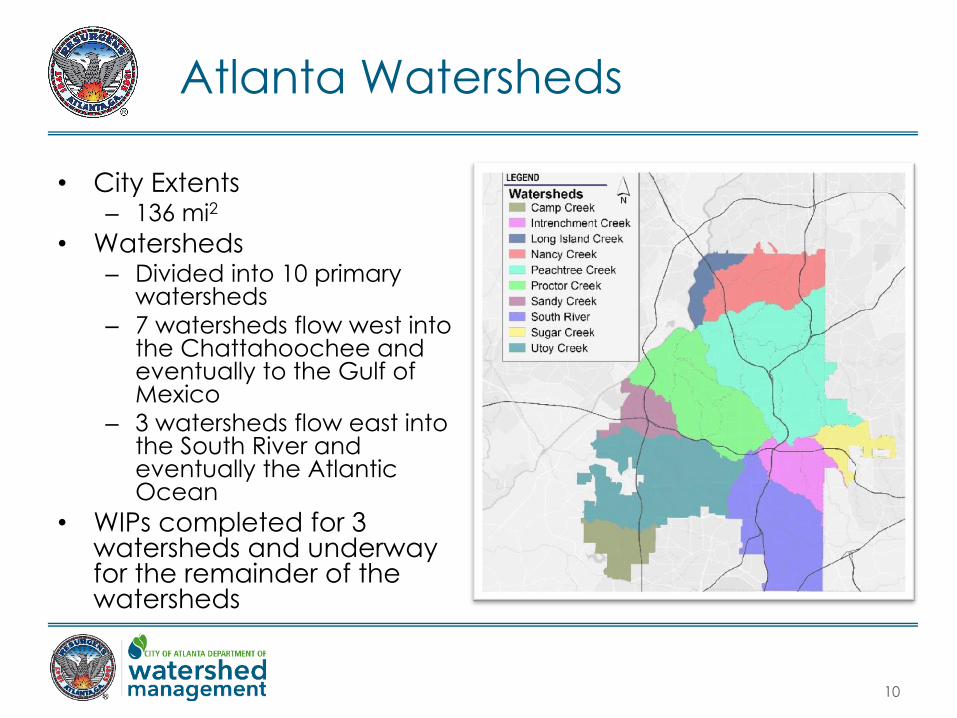
Atlanta Watersheds
• City Extents – 136 mi2
• Watersheds – Divided into 10 primary
watersheds
– 7 watersheds flow west into the Chattahoochee and eventually to the Gulf of Mexico
– 3 watersheds flow east into the South River and eventually the Atlantic Ocean
• WIPs completed for 3 watersheds and underway for the remainder of the watersheds
11
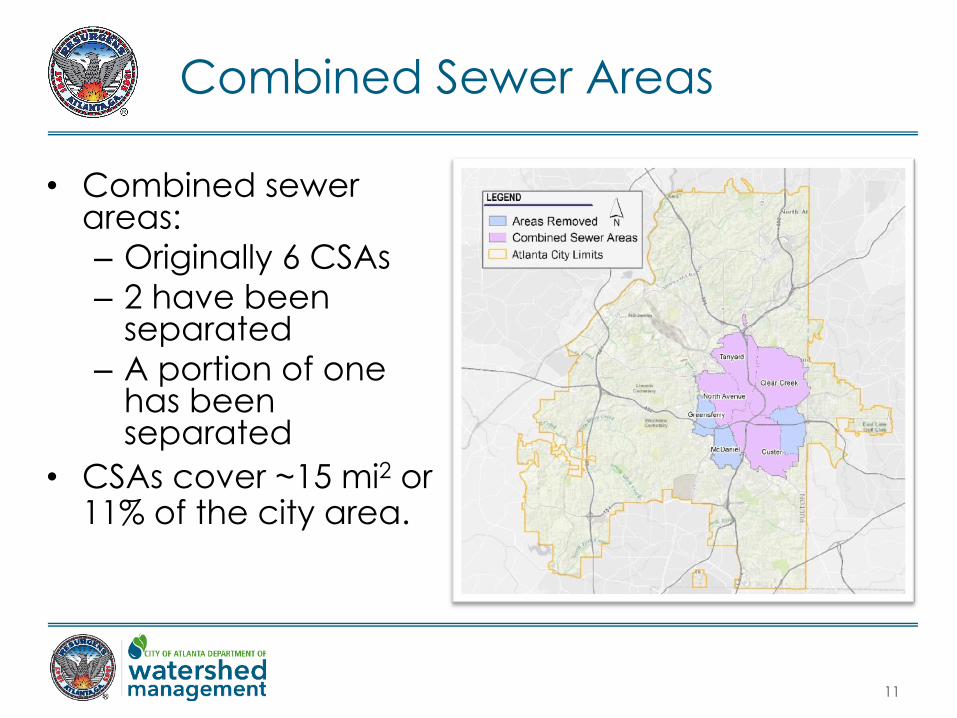
Combined Sewer Areas
• Combined sewer areas:
– Originally 6 CSAs
– 2 have been separated
– A portion of one has been separated
• CSAs cover ~15 mi2 or 11% of the city area.
12
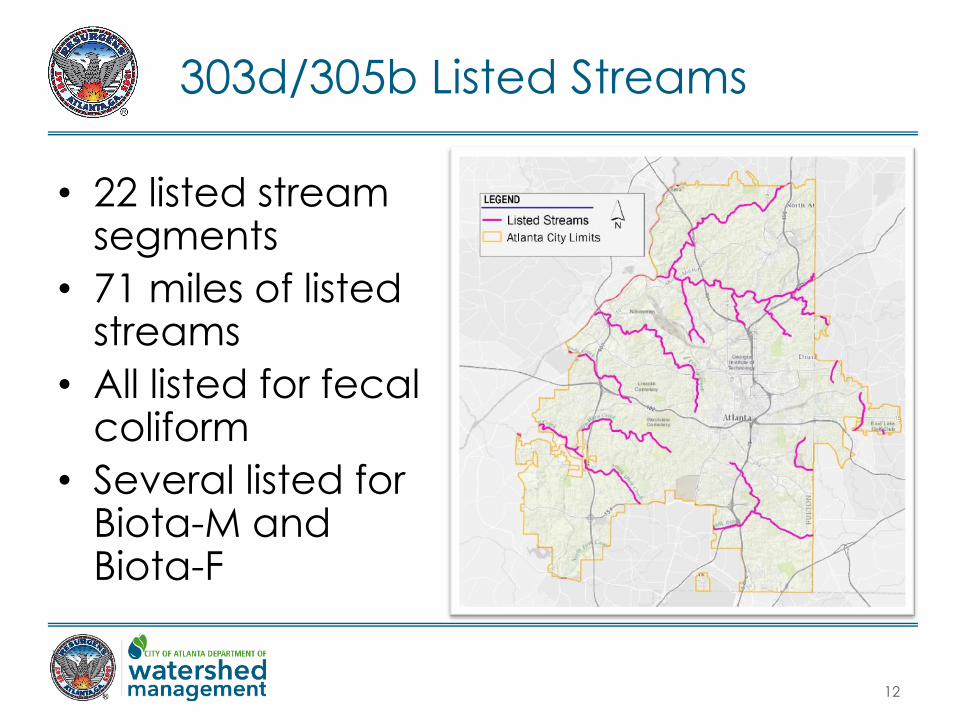
303d/305b Listed Streams
• 22 listed stream segments
• 71 miles of listed streams
• All listed for fecal coliform
• Several listed for Biota-M and Biota-F
13
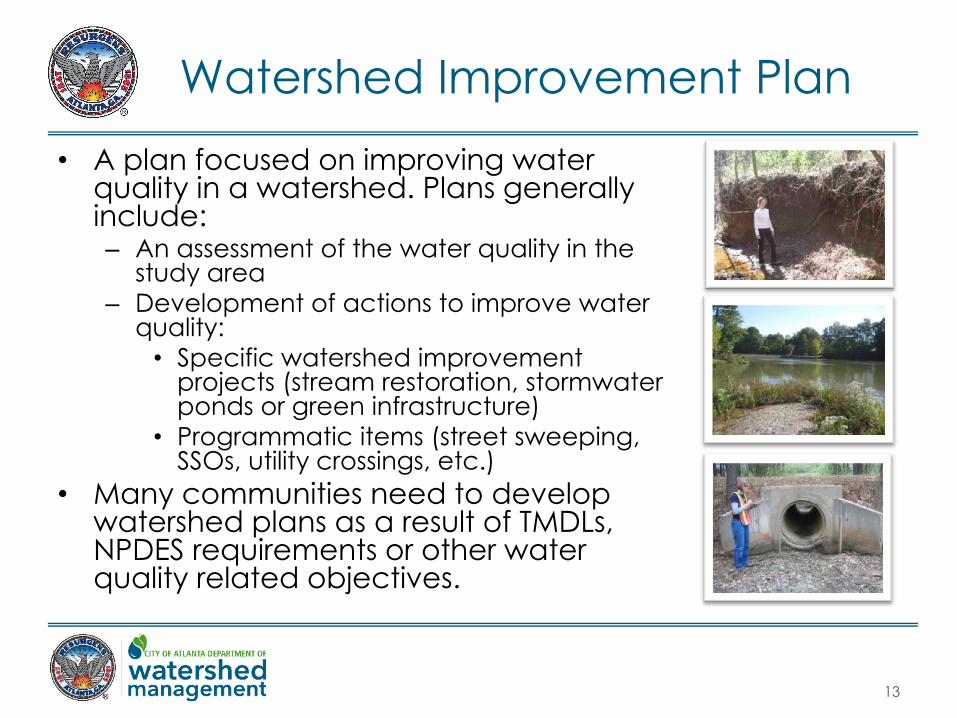
Watershed Improvement Plan
• A plan focused on improving water quality in a watershed. Plans generally include: – An assessment of the water quality in the
study area
– Development of actions to improve water quality:
• Specific watershed improvement projects (stream restoration, stormwater ponds or green infrastructure)
• Programmatic items (street sweeping, SSOs, utility crossings, etc.)
• Many communities need to develop watershed plans as a result of TMDLs, NPDES requirements or other water quality related objectives.
14
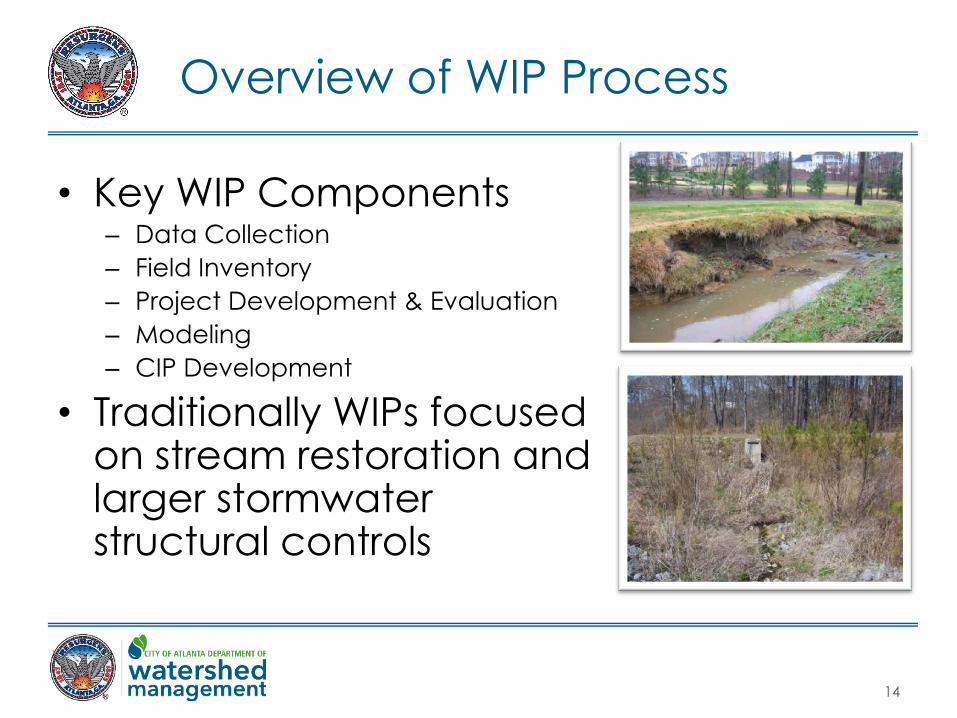
Overview of WIP Process
• Key WIP Components – Data Collection
– Field Inventory
– Project Development & Evaluation
– Modeling
– CIP Development
• Traditionally WIPs focused on stream restoration and larger stormwater structural controls
15
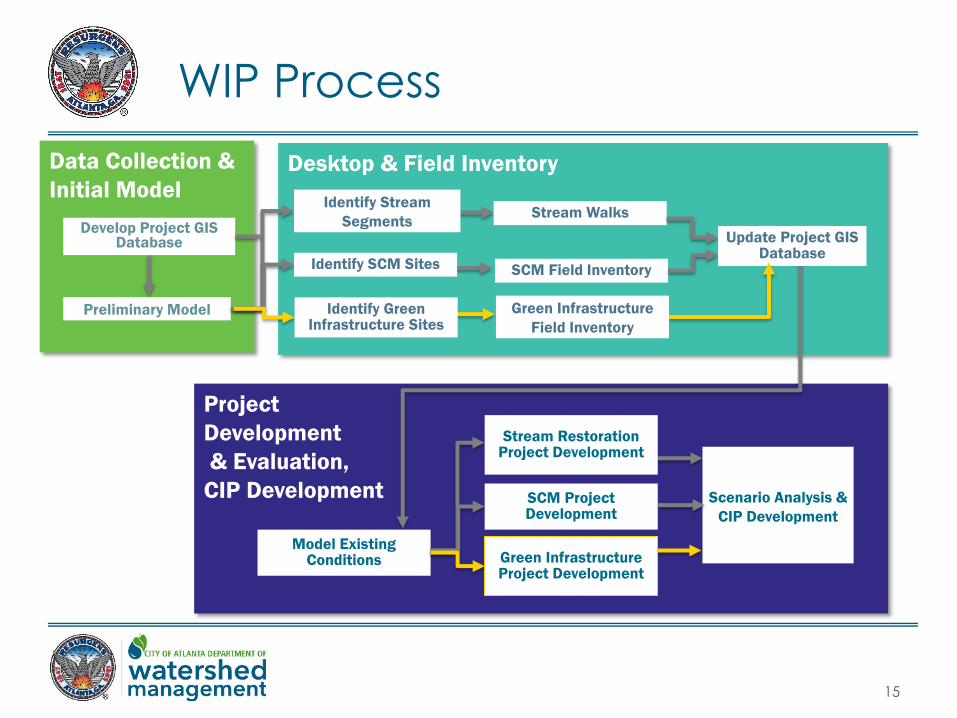
WIP Process
Data Collection &
Initial Model Desktop & Field Inventory
Project
Development
& Evaluation,
CIP Development
Develop Project GIS Database
Preliminary Model
Identify Stream
Segments
Identify SCM Sites
Stream Walks
Update Project GIS Database
Model Existing
Conditions
Stream Restoration
Project Development
Scenario Analysis &
CIP Development
SCM Project Development
SCM Field Inventory
Green Infrastructure Project Development
Identify Green Infrastructure Sites
Green Infrastructure
Field Inventory
16
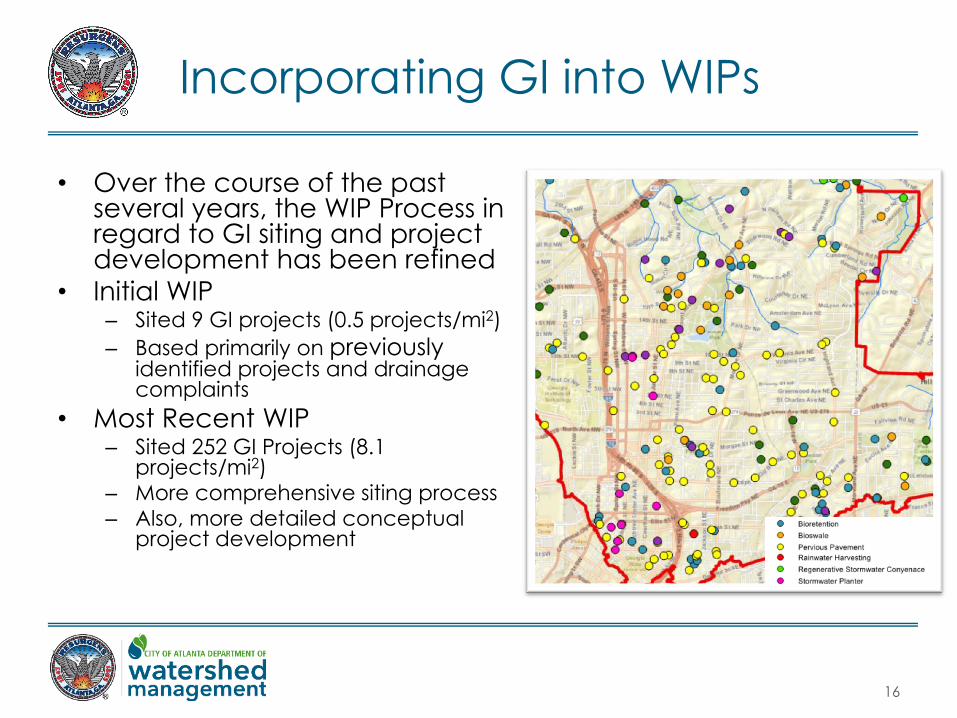
Incorporating GI into WIPs
• Over the course of the past several years, the WIP Process in regard to GI siting and project development has been refined
• Initial WIP – Sited 9 GI projects (0.5 projects/mi2)
– Based primarily on previously identified projects and drainage complaints
• Most Recent WIP – Sited 252 GI Projects (8.1
projects/mi2)
– More comprehensive siting process
– Also, more detailed conceptual project development
17
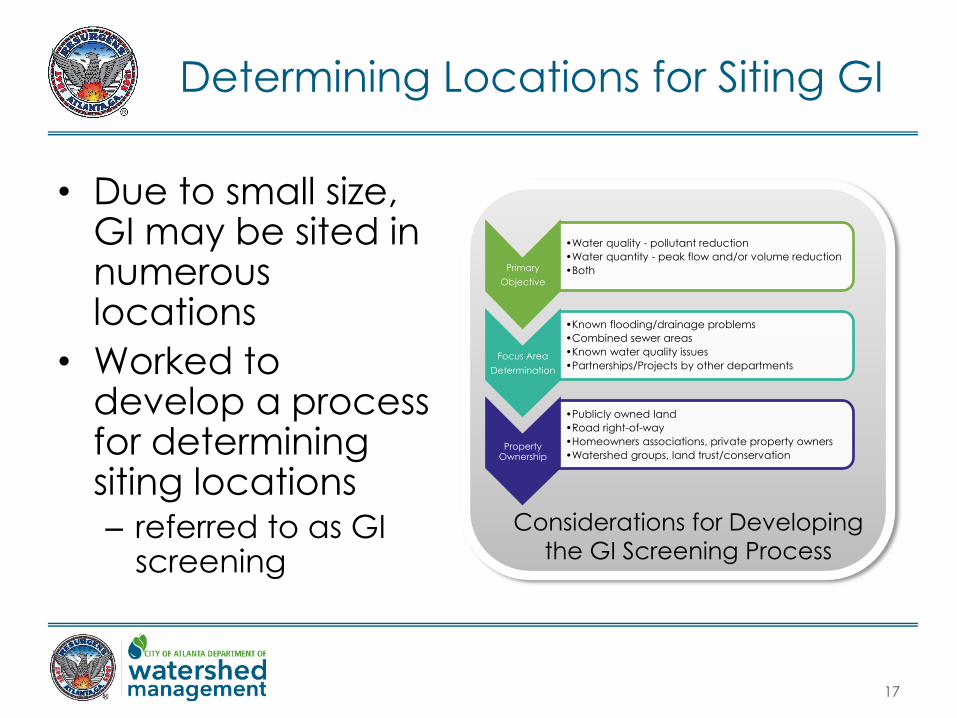
Determining Locations for Siting GI
• Due to small size, GI may be sited in numerous locations
• Worked to develop a process for determining siting locations – referred to as GI
screening
Primary
Objective
•Water quality - pollutant reduction
•Water quantity - peak flow and/or volume reduction
•Both
Focus Area
Determination
•Known flooding/drainage problems
•Combined sewer areas
•Known water quality issues
•Partnerships/Projects by other departments
Property Ownership
•Publicly owned land
•Road right-of-way
•Homeowners associations, private property owners
•Watershed groups, land trust/conservation
Considerations for Developing
the GI Screening Process
18
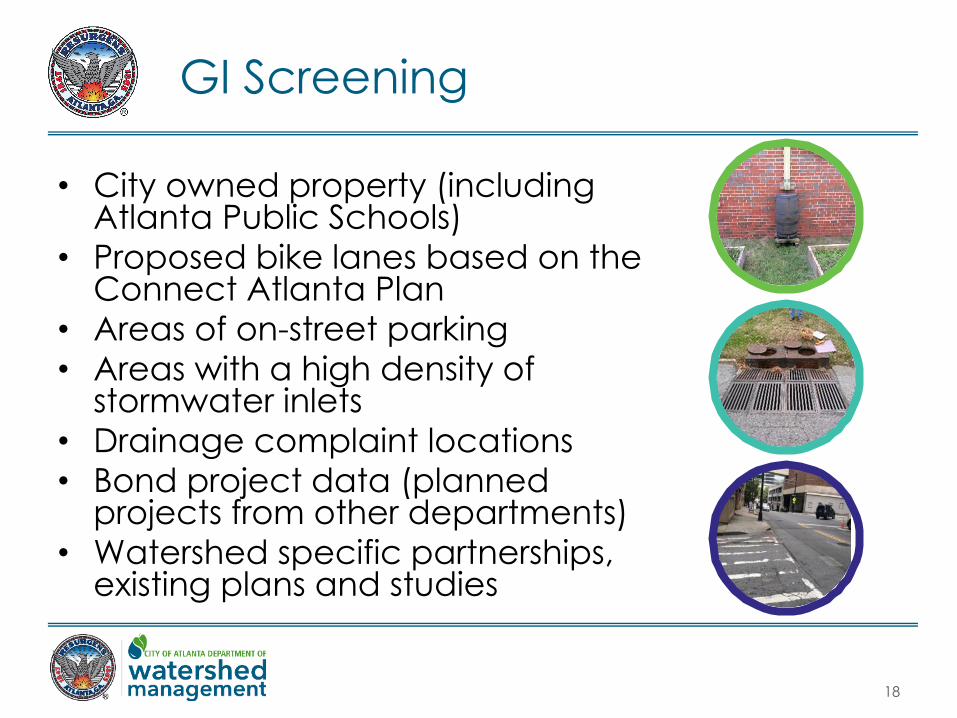
GI Screening
• City owned property (including Atlanta Public Schools)
• Proposed bike lanes based on the Connect Atlanta Plan
• Areas of on-street parking
• Areas with a high density of stormwater inlets
• Drainage complaint locations
• Bond project data (planned projects from other departments)
• Watershed specific partnerships, existing plans and studies
19
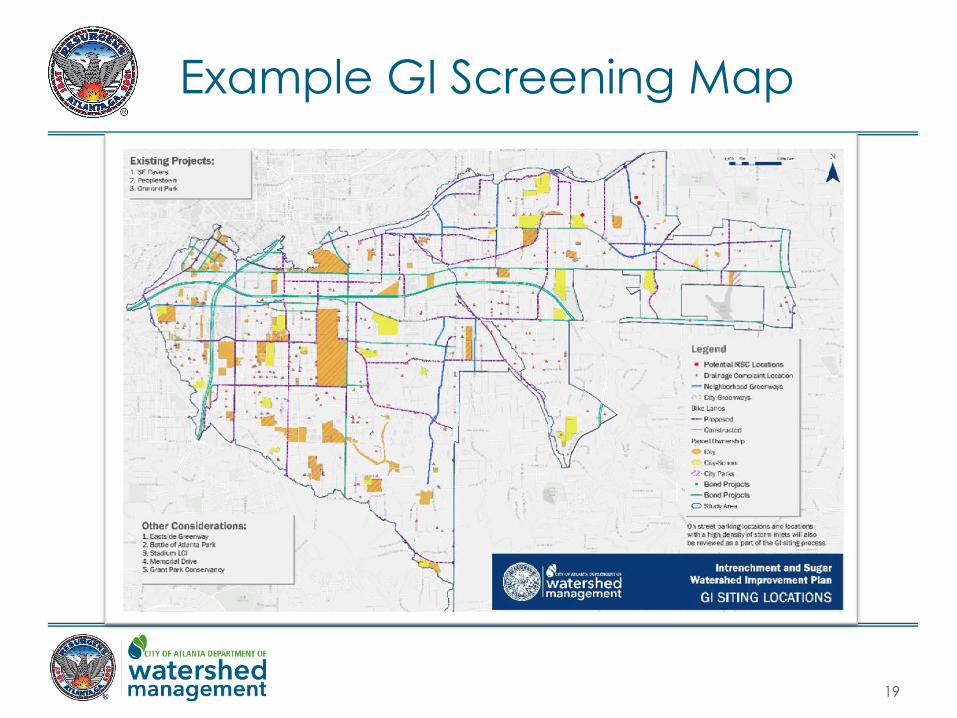
Example GI Screening Map
20
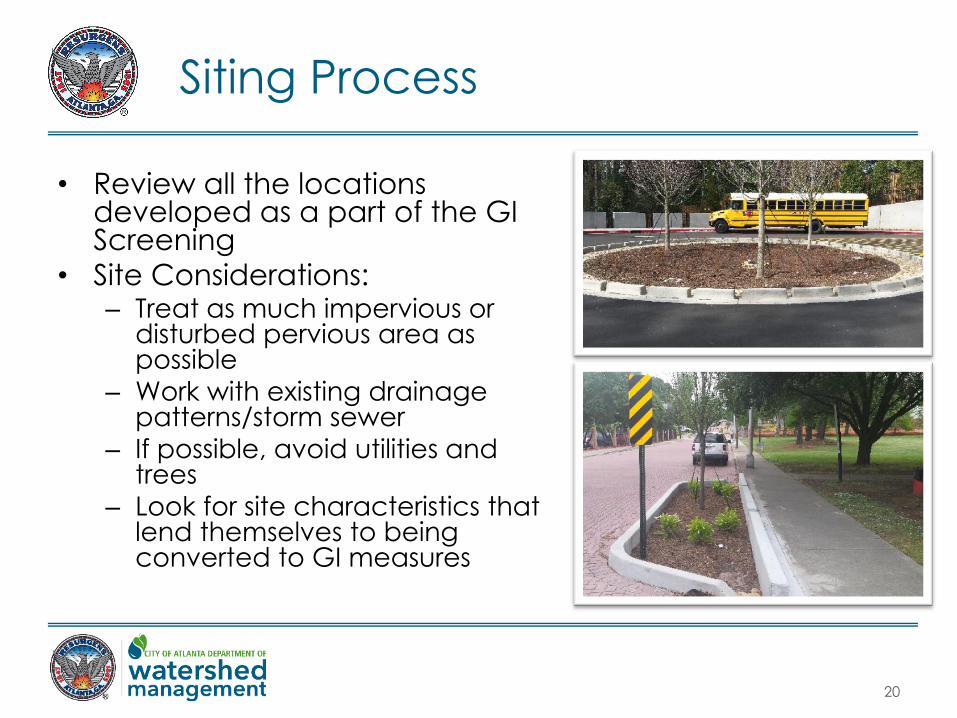
Siting Process
• Review all the locations developed as a part of the GI Screening
• Site Considerations: – Treat as much impervious or
disturbed pervious area as possible
– Work with existing drainage patterns/storm sewer
– If possible, avoid utilities and trees
– Look for site characteristics that lend themselves to being converted to GI measures
21
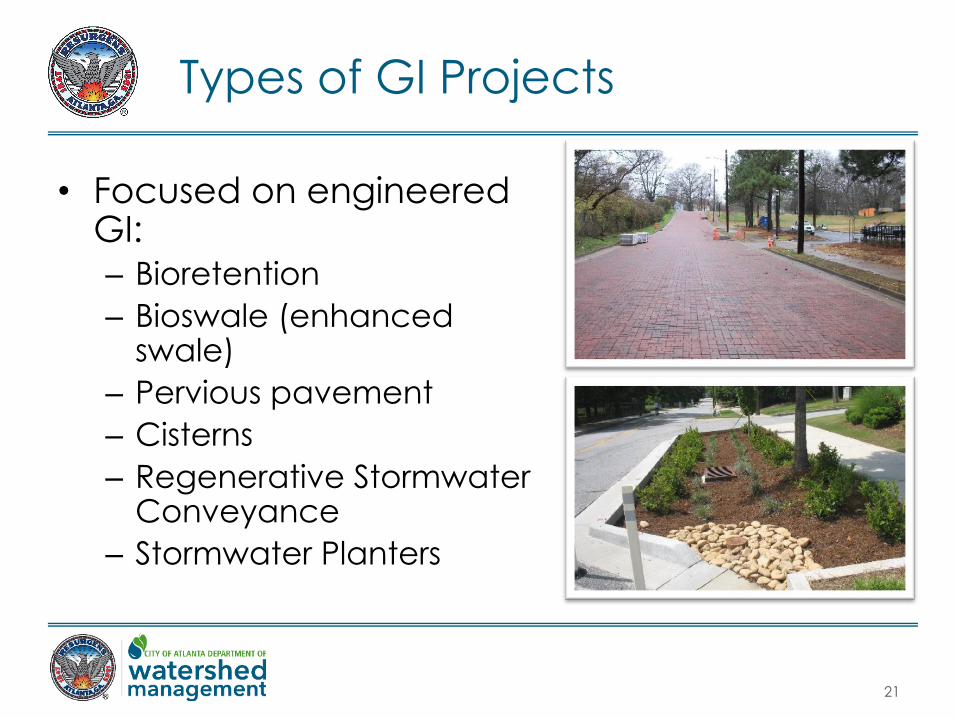
Types of GI Projects
• Focused on engineered GI:
– Bioretention
– Bioswale (enhanced swale)
– Pervious pavement
– Cisterns
– Regenerative Stormwater Conveyance
– Stormwater Planters
22
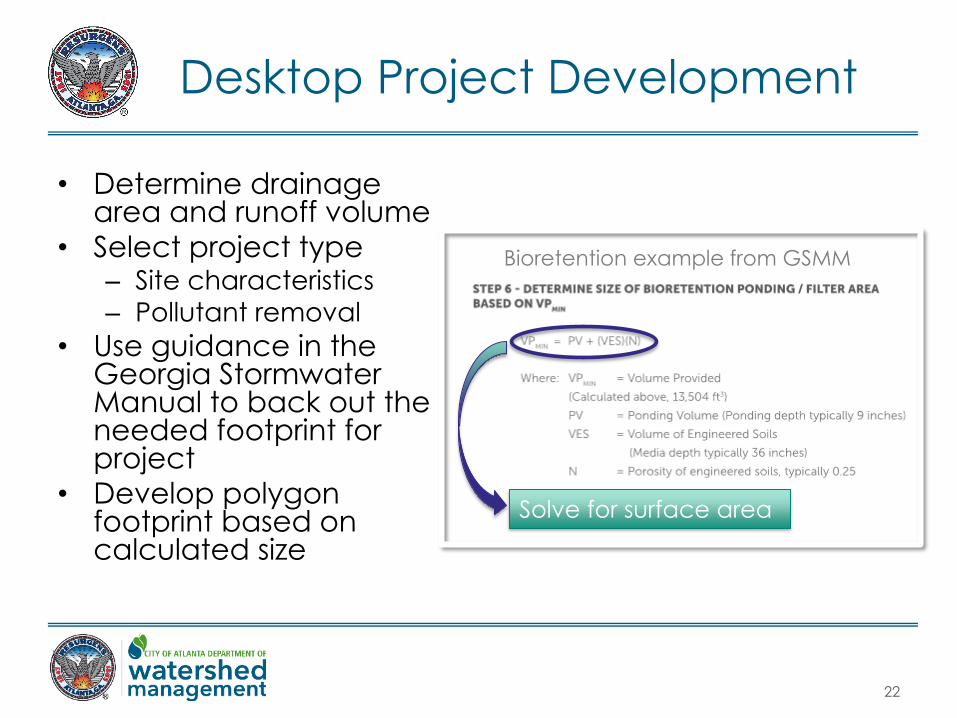
Desktop Project Development
• Determine drainage area and runoff volume
• Select project type – Site characteristics
– Pollutant removal
• Use guidance in the Georgia Stormwater Manual to back out the needed footprint for project
• Develop polygon footprint based on calculated size
Bioretention example from GSMM
Solve for surface area
23
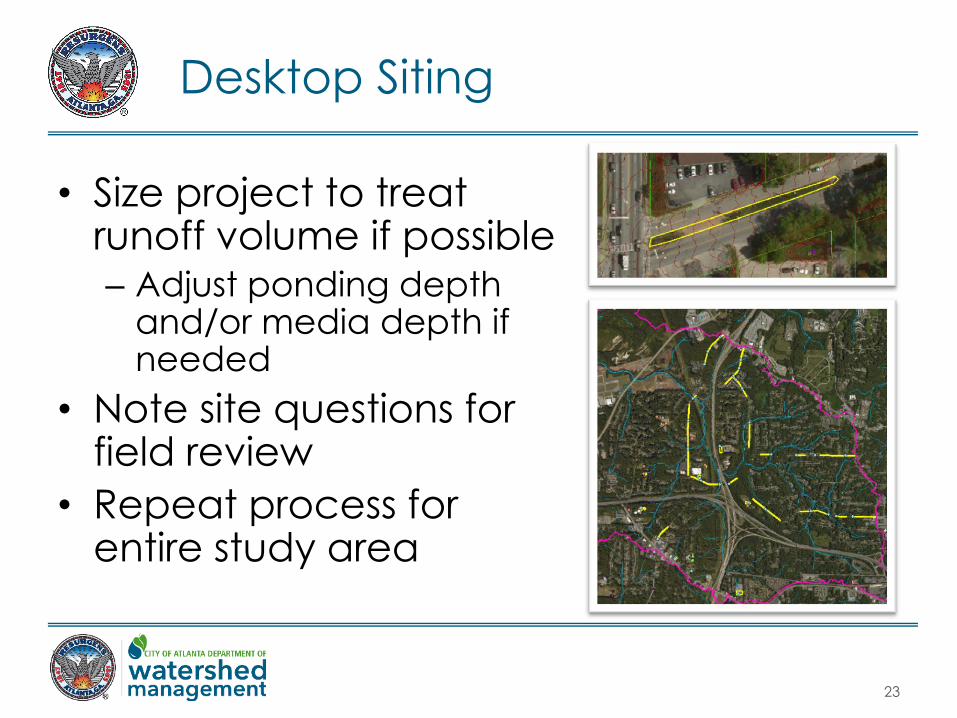
Desktop Siting
• Size project to treat runoff volume if possible – Adjust ponding depth
and/or media depth if needed
• Note site questions for field review
• Repeat process for entire study area
24
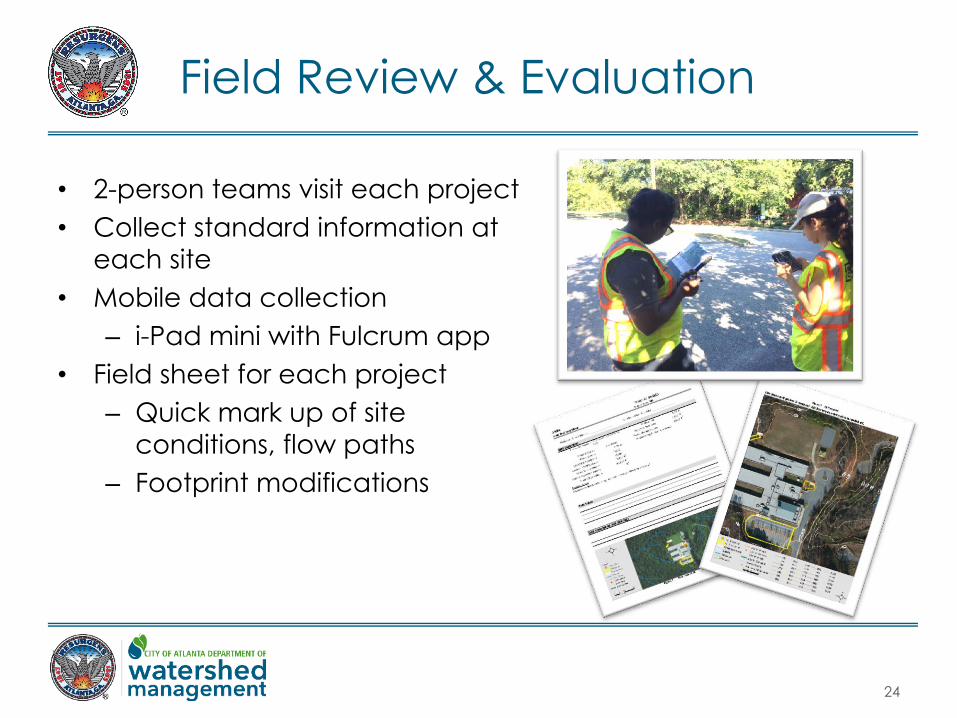
Field Review & Evaluation
• 2-person teams visit each project
• Collect standard information at
each site
• Mobile data collection
– i-Pad mini with Fulcrum app
• Field sheet for each project
– Quick mark up of site
conditions, flow paths
– Footprint modifications
25
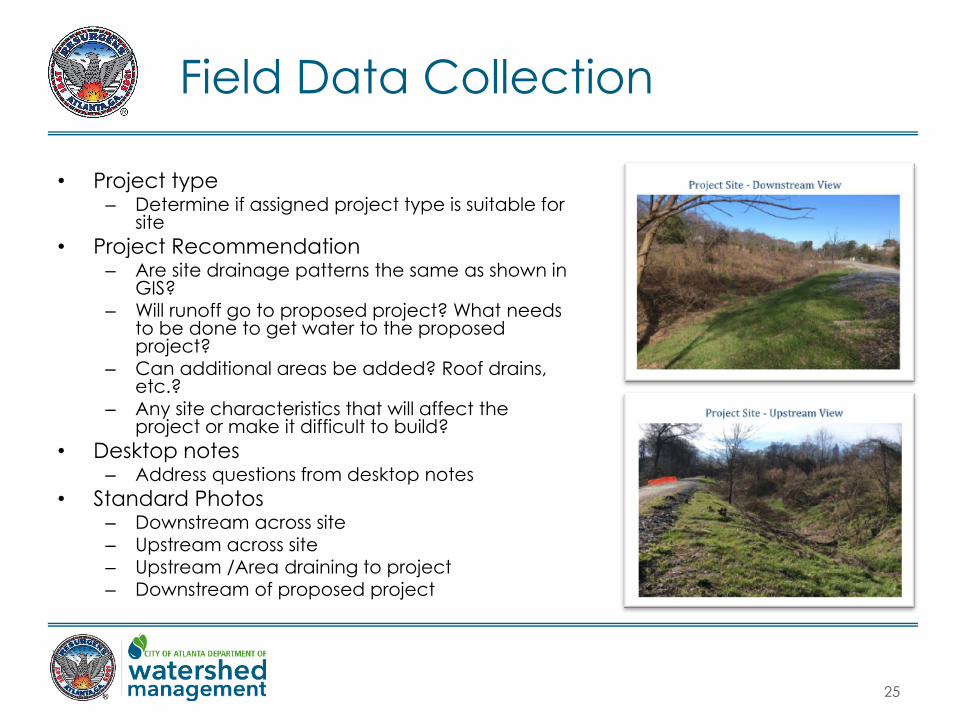
Field Data Collection
• Project type – Determine if assigned project type is suitable for
site
• Project Recommendation – Are site drainage patterns the same as shown in
GIS?
– Will runoff go to proposed project? What needs to be done to get water to the proposed project?
– Can additional areas be added? Roof drains, etc.?
– Any site characteristics that will affect the project or make it difficult to build?
• Desktop notes – Address questions from desktop notes
• Standard Photos – Downstream across site
– Upstream across site
– Upstream /Area draining to project
– Downstream of proposed project
26
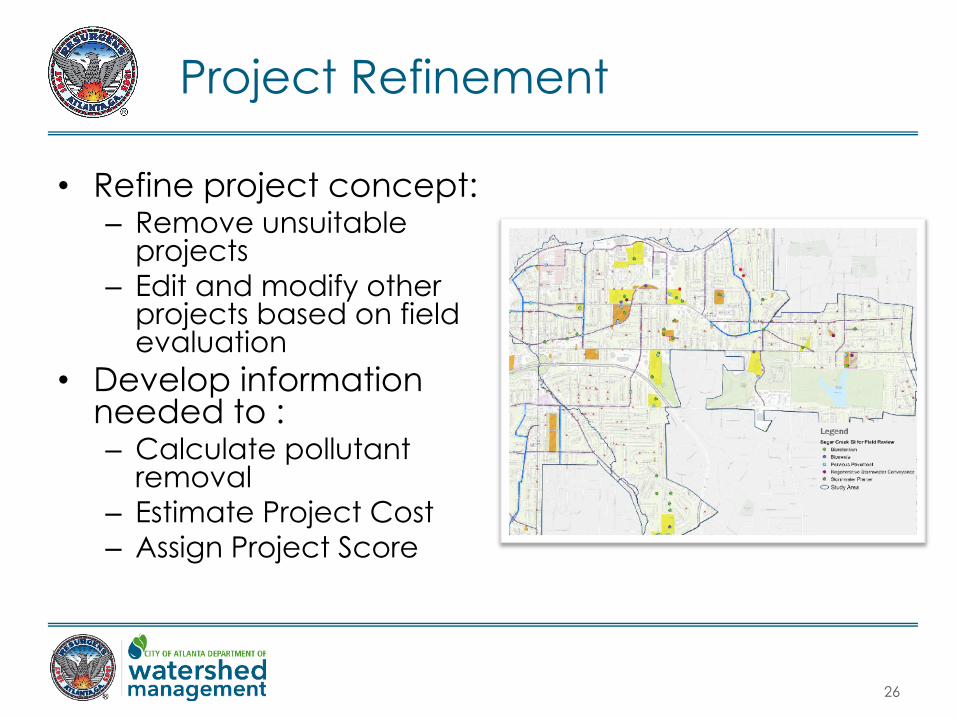
Project Refinement
• Refine project concept: – Remove unsuitable
projects
– Edit and modify other projects based on field evaluation
• Develop information needed to : – Calculate pollutant
removal
– Estimate Project Cost
– Assign Project Score
27
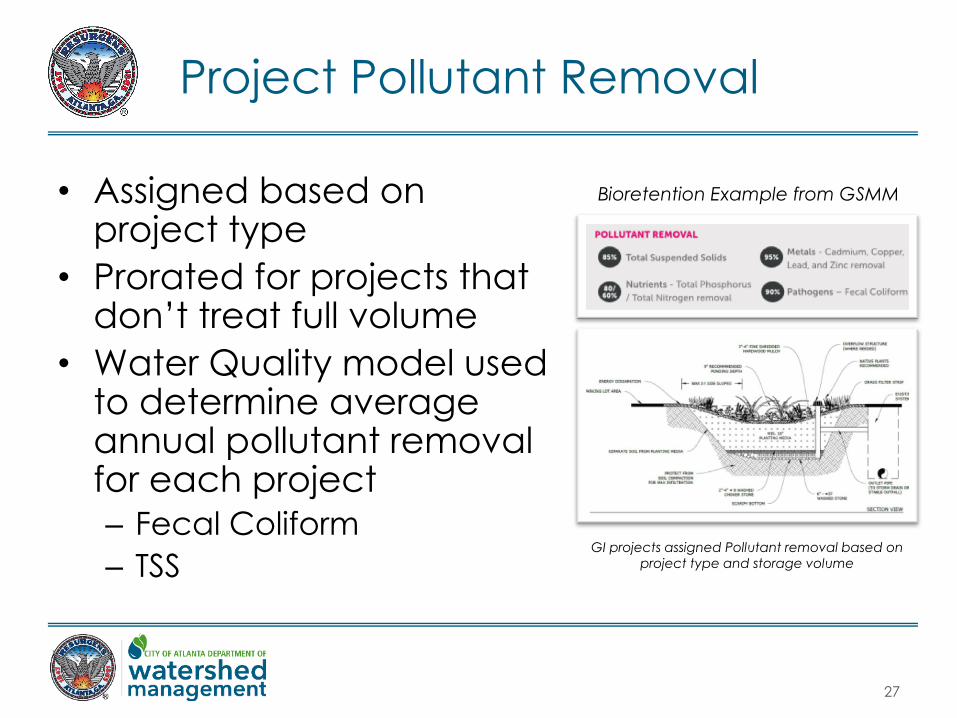
Project Pollutant Removal
• Assigned based on project type
• Prorated for projects that don’t treat full volume
• Water Quality model used to determine average annual pollutant removal for each project
– Fecal Coliform
– TSS GI projects assigned Pollutant removal based on
project type and storage volume
Bioretention Example from GSMM
28
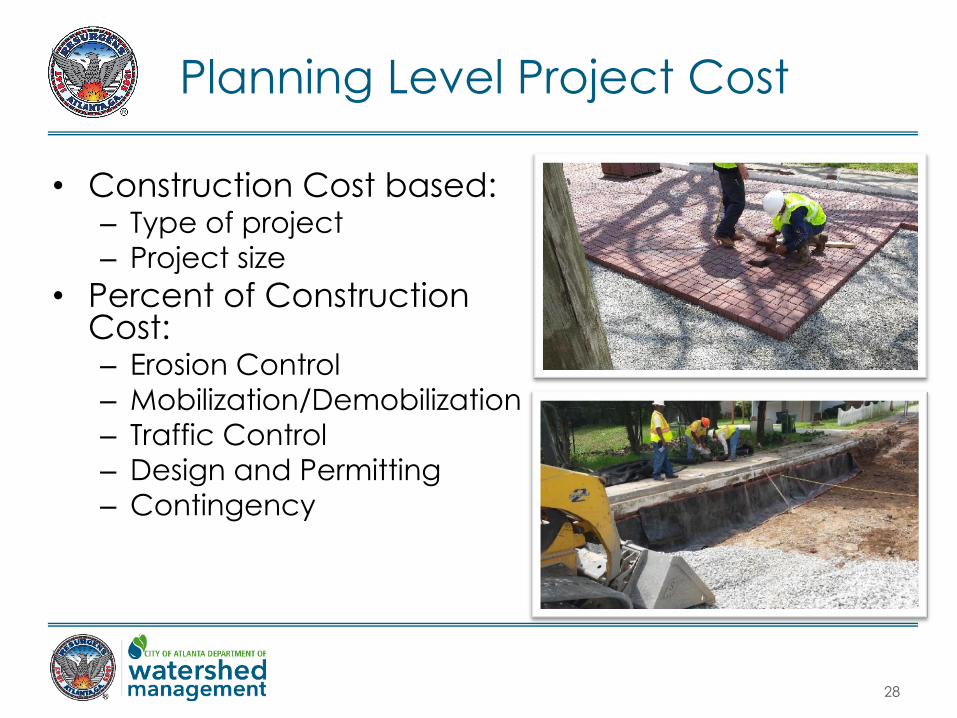
Planning Level Project Cost
• Construction Cost based: – Type of project
– Project size
• Percent of Construction Cost: – Erosion Control
– Mobilization/Demobilization
– Traffic Control
– Design and Permitting
– Contingency
29
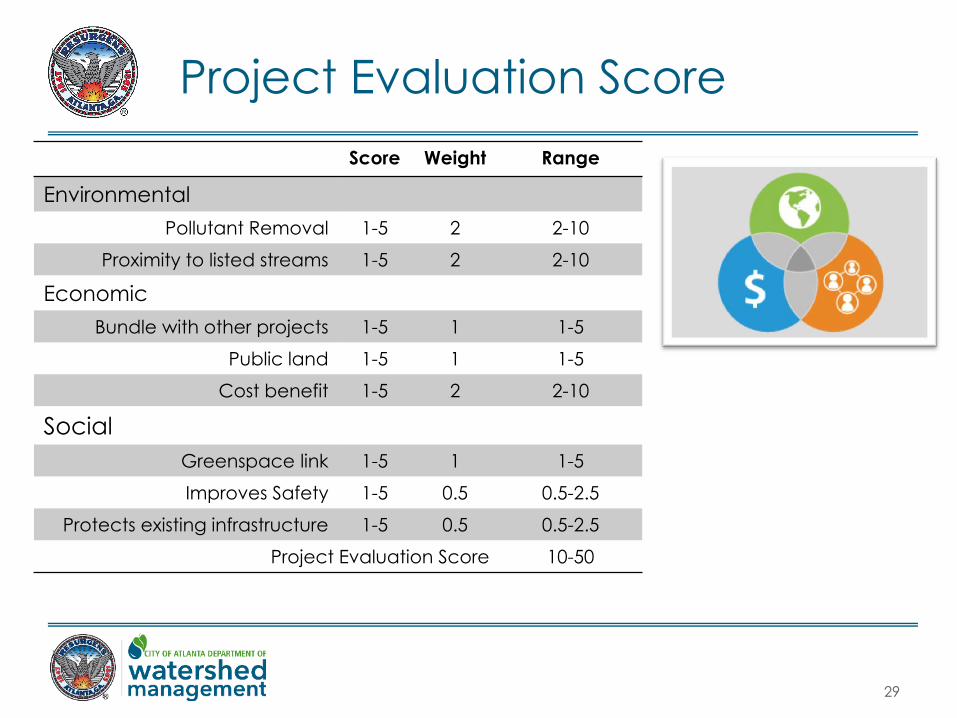
Project Evaluation Score
Score Weight Range
Environmental
Pollutant Removal 1-5 2 2-10
Proximity to listed streams 1-5 2 2-10
Economic
Bundle with other projects 1-5 1 1-5
Public land 1-5 1 1-5
Cost benefit 1-5 2 2-10
Social
Greenspace link 1-5 1 1-5
Improves Safety 1-5 0.5 0.5-2.5
Protects existing infrastructure 1-5 0.5 0.5-2.5
Project Evaluation Score 10-50
30
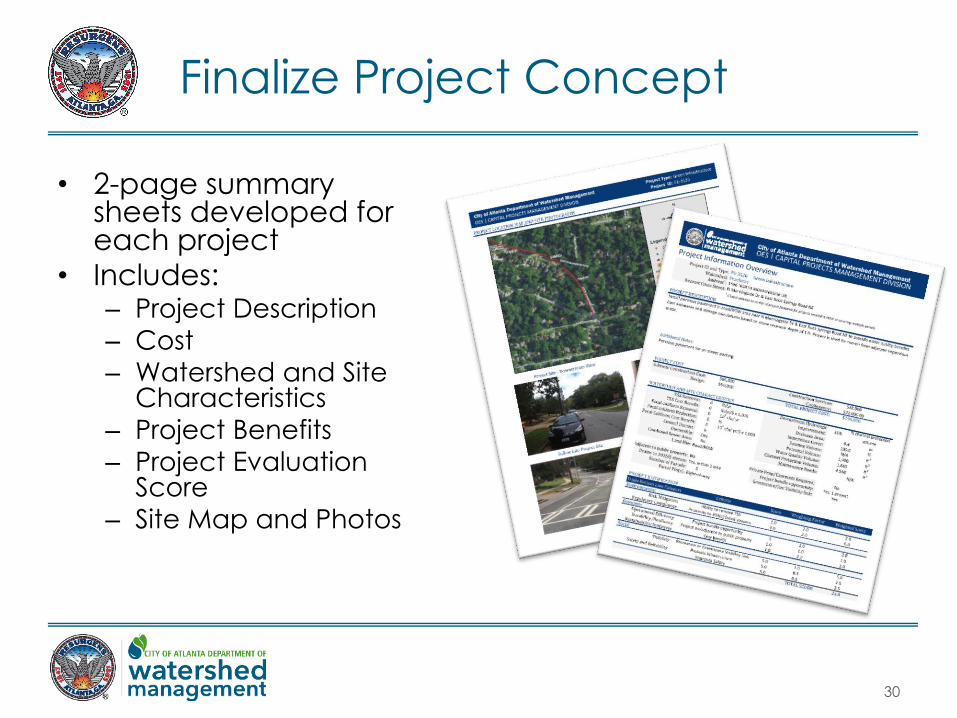
Finalize Project Concept
• 2-page summary sheets developed for each project
• Includes: – Project Description
– Cost
– Watershed and Site Characteristics
– Project Benefits
– Project Evaluation Score
– Site Map and Photos
31
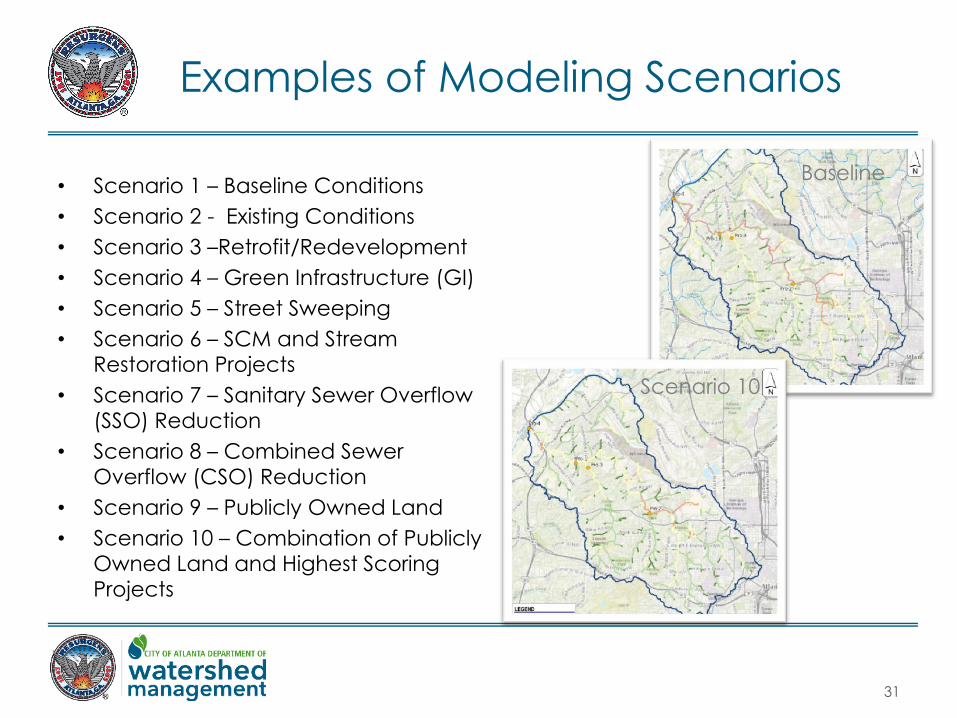
Examples of Modeling Scenarios
• Scenario 1 – Baseline Conditions
• Scenario 2 - Existing Conditions
• Scenario 3 –Retrofit/Redevelopment
• Scenario 4 – Green Infrastructure (GI)
• Scenario 5 – Street Sweeping
• Scenario 6 – SCM and Stream
Restoration Projects
• Scenario 7 – Sanitary Sewer Overflow
(SSO) Reduction
• Scenario 8 – Combined Sewer
Overflow (CSO) Reduction
• Scenario 9 – Publicly Owned Land
• Scenario 10 – Combination of Publicly
Owned Land and Highest Scoring
Projects
Baseline
Scenario 10
32
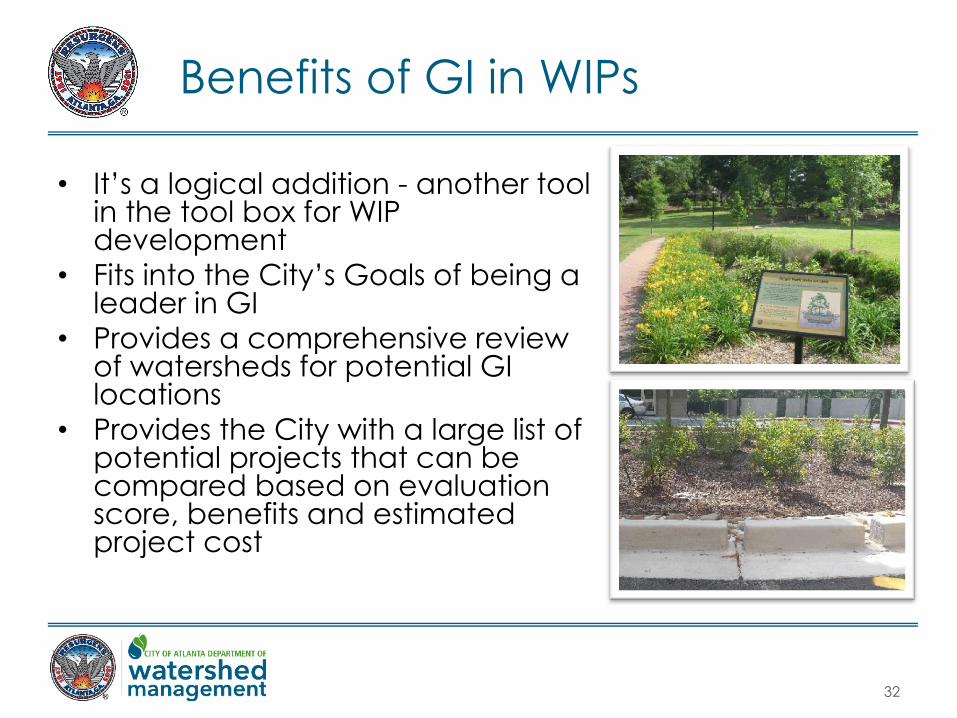
Benefits of GI in WIPs
• It’s a logical addition - another tool in the tool box for WIP development
• Fits into the City’s Goals of being a leader in GI
• Provides a comprehensive review of watersheds for potential GI locations
• Provides the City with a large list of potential projects that can be compared based on evaluation score, benefits and estimated project cost
33
Questions?
Julie Owens, City of Atlanta – [email protected]
Lori Visone, Brown and Caldwell – [email protected]