City of Alexandria Budget and Fiscal of Alexandria Budget and Fiscal ... The City should continue to...
40
Transcript of City of Alexandria Budget and Fiscal of Alexandria Budget and Fiscal ... The City should continue to...


City of Alexandria Budget and Fiscal
Affairs Advisory Committee
Report on the City Manager’s Proposed
Budget for Fiscal Year 2011
Dennis Auld
Elliott Branch
James Butler, Vice Chair
Mark Elder, Secretary
Margaret Gullen
Dak Hardwick
Holly Hemphill
Dennis Jones
Tracy Rickett, Chair
Len Rubenstein
Matt Tallmer
Michael Wenk

0
Table of Contents
EXECUTIVE SUMMARY 1
The Budget Process 1
The Proposed Operating Budget 1
The Proposed Capital Improvement Program 2
Revenues and Outlook 3
THE BUDGET PROCESS 6
A. Long Range Budget Outlook 6
B. Citizen Surveys 7
C. Strategic Plan 7
D. Multi-year Financial Forecasting 8
E. Managing for Results Initiative (MFRI) 8
THE PROPOSED OPERATING BUDGET 10
A. Compensation 10
B. Benefits 12
C. Risk Management, Workers Compensation and Disability Retirement 12
D. Financial Forecasting 14
E. Alexandria City Public Schools 16
F. Priority Setting 17
THE PROPOSED CAPITAL IMPROVEMENT PROGRAM 18
A. Overview 18
B. CIP Prioritization and Development 18
C. Cash Capital 21
D. Alexandria City Public Schools 23
REVENUES AND OUTLOOK 26
A. Tax Burden Issues 26
B. Debt Burden Issues 28
C. Commercial Real Estate Add-on Tax for Transportation 30
D. Stormwater Utility Fee 32
E. Increase in Sanitary Sewer Fees 35
F. Economic Development Issues 36

1
EXECUTIVE SUMMARY
The Budget Process
For FY 2011 and into the future, the City should take more aggressive steps to identify
nonessential services that can be eliminated, scaled back, or phased-out in an effort to rebase
the Operating and CIP budgets.
The City needs to identify and then adopt controls that reduce the rate of growth in City
spending caused by critical ―drivers‖ of budget expenditure growth.
To effectively accomplish this, BFAAC encourages the City staff and Council to expand
their efforts (as initiated in Resolution 2368) and establish a process of utilizing long-range
financial forecasts to develop current budgets.
BFAAC recommends that Council establish guidelines for operational priorities among and
within Strategic Plan Goals as budget reductions (or increases) are anticipated.
BFAAC believes that the City would be well served to review and analyze the various
methods of obtaining citizen input, with an objective to modify those processes to produce
data that is more actionable in relation to funding of services.
Using the Mid Growth Forecast Model, BFAAC recommends that the City go out 5 fiscal
years and balance the budget. Employing ―what if‖ scenarios, determine what programs and
activities are affordable, in concert with what the citizens want, and what programs should be
reduced, eliminated, or expanded.
In order to effectively measure the degree to which Strategic Goals are attained, BFAAC
encourages the City to continue its evolvement of MFRI to develop a greater focus on the
results.
The Proposed Operating Budget
BFAAC prefers an employee pay increase based on the new performance-based
compensation system now being developed. However, given no COLA/MRA adjustment
since FY 2008, the freezing of the merit/step increase in FY2010 and the desire to have a
fully developed new compensation system that is understood and trusted by management and
employees, we concur with the Manager’s recommendation for a merit/step increase for FY
2011.
BFAAC recommends the continuing implementation of the Competency Based
Classification System (CBCS), but notes that implementation of performance management
and benchmarking recommendations without additional financial resources will be
challenging.

2
BFAAC urges the Council to consider other compensation-related options that, even though
they do not provide direct compensation to employees in FY 2011, do move the City towards
a more equitable system of compensation.
BFAAC commends Council and City staff for moving to a more equitable balance between
salary and benefits in order to attract and retain employees; we also urge the City to approach
these factors as integral aspects of a total compensation approach in planning future
personnel remuneration.
BFAAC commends the City for its increased emphasis on safety and focus on improving
safety awareness and practices, especially in the departments of Fire, Police, Parks &
Recreation and Transportation and Environmental Services (T&ES). Such improvements are
essential to reducing injury, absence from work and disability claims.
BFAAC repeats its recommendations from last year to establish a more transparent view of
the disability retirement program, and a system to monitor the status and post-retirement
employment history, if any, of those on total or partial disability retirement.
The City and Council should develop the skills to greater utilization of the multi-year
planning tool, using the Strategic Plan as a guide, to assist in the development of the current
budget.
The City should continue to strengthen the forecasting models, and to utilize them in
developing the MFRI Business Plans.
BFAAC urges both City staff and Council to keep in mind the increasing ACPS student
population when adopting the FY 2011 budget, and in drafting future budget guidelines and
proposed spending plans.
BFAAC strongly recommends the City Manager and Council segregate and not spend the
$5,000,000 in reduced ACPS contributions to the Virginia Retirement System, since that
money eventually must be used to fund VRS obligations.
BFAAC is greatly impressed with the ACPS Division-Level plan, and recommends the City
consider using such a model as part of MFRI.
Council should apply guidelines and mechanisms for analysis established as part of the
overall budget process in making determinations on preservation, expansions, and reductions
in services in the FY 2011 budget.
The Proposed Capital Improvement Program
We recommend that all projects in each category be listed in priority rank order. For
example, City Council and the public should be able to decipher clearly the relative priority
of the General Services Capital Facilities Program ($11 million over a 10-year period) and

3
the ACPS Eco-City Projects ($9.5 million over 10 years) or Dash fleet replacement ($26
million over 10 years).
We recommend that the projects cut from the CIP be listed in priority order.
We recommend that the City develop improved criteria for scoring the existing or future
value of projects and that the timing and implementation of a project is consistent with its
priority rank and operational considerations.
The CIP should define clearly the terms used within the CIP submission.
The timing and impact of the CIP on the City's Operating Budget should be presented.
The CIP should discuss the impact of Federal and State funds on the priority setting within
the CIP.
The City should develop a cash capital policy similar to the one it has successfully utilized
with respect to debt policy.
When considering cash capital contributions to the CIP, Council should consider the equities
between current and future taxpayers that are inherent in funding the CIP budget.
The City and ACPS should continue to work together to solve school capacity issues.
The City should finalize its Master Plan so that the ACPS can incorporate its ideas into
school planning.
The City and ACPS should continue to work together to meet the ACPS’s building-by-
building needs, in particular, FF&E project funding.
Revenues and Outlook
The percentage of per capita income that goes to pay the residential real property tax should
continue to be monitored and Council should be especially cautious, particularly in the
current economic environment, in setting tax rates that that would result in ratios
significantly above historic ranges.
If real estate values continue to fall as projected, the real estate tax revenue/per capita income
indicator may prove helpful in setting the tax rate in future years inasmuch as it is an
indication of the taxpayers’ ability to pay.
As the City continues to add pay-for-use taxes and fees, we believe it will become
increasingly important to develop metrics which track overall City-imposed financial burdens
as a function of personal income and gross receipts.

4
BFAAC believes that the established debt policy guidelines have served as an important tool
for fiscal discipline. Many of the limits of these guidelines are now forecast to be challenged.
We strongly support efforts to remain within all of the guidelines.
Any additional borrowing should be analyzed against the debt policy guidelines. Current
forecasts are now showing debt service payments crowding out operating budgets.
Borrowing in excess of the targets should be temporary and undertaken only with the most
careful deliberation, and only in circumstances where the projects to be funded are essential
under the strategic goals and result in significant long-term benefits to the City, or represent
the City’s commitment to fulfill a prior obligation, (e.g., Metro).
We support the commercial real estate add-on tax for transportation, provided that the rate of
such a differential tax is determined annually, taking into account current market and other
economic conditions and is set to be consistent with the City’s efforts to attract and retain its
commercial tax base. A commercial real estate add-on tax of 3 cents is within the range
recommended in the Study Committee Report (2-4 cents) and would fund needed,
economically beneficial transportation improvements.
The City should evaluate and prioritize its long-term transportation capital needs and identify
for funding through this source projects that may readily seen by commercial real property
taxpayers as producing demonstrable, positive economic impacts for the City.
While, as noted in the Study Committee Report, Alexandria’s overall business tax burden is
low to moderate such that the City is business-competitive, small retailers that generally
operate on a low margin may be less able to absorb added tax costs. If the add-on tax is
adopted, Council should consider providing some tax relief for small retailers, for example,
through adjustments to the business gross receipts tax, as recommended by the Study
Committee.
Since the add-on is a new tax, the rate should be determined annually (and could be set at
zero, as it was last year). The amount of revenues collected may well vary from year to year,
thus the City should avoid borrowing against this additional tax.
The proposed SWUF should be self-sustaining. The City should begin to align estimated
costs and SWU revenues for any planned stormwater projects such that no costs for this
activity would remain in the operating budget. Further, the City should ultimately rebase the
existing operating budget by the amount of funding currently used for stormwater
management activities.
The City should not adopt or implement a SWUF until a full cost estimate for administering
the fee (including appeals process and public education activities) and an implementation
plan are completed. Given the current economic environment, it is imperative that the City
be assured it has adequate funds to administer this fee.

5
Expenditures for projects funded from the SWUF should not be initiated until fee revenue is
in hand in order to avoid increasing the City’s debt burden.
BFAAC cautions against exempting non-profit organizations from a SWUF. Tax-exempt
properties often have a significant amount of impervious area, which is a leading cause of
stormwater run-off. Further, exempting such properties will put more of the burden from this
fee on residential owners.
The City should ensure that a strong, transparent public education campaign is conducted and
adequate time is allotted for this campaign between the adoption and implementation of an
SWUF.
BFAAC continues to believe that sanitary sewer usage fees should be set at a level that
provides for self-sufficiency of the system. We interpose no objection to the proposed
increase in order to achieve that objective this year. We observe, however, that a sanitary
sewer master plan is currently under development and additional projects are likely to be
identified. Ideally, the fee structure should be reviewed and determined in the longer term
context of the master plan, and not revisited year-by-year.
We have previously recognized the critical contribution of economic development to the
City’s finances. We continue to urge that economic development efforts be given a very high
priority.
As in our Report for FY 2010, we again urge the City to continue to seek a financially
capable developer and promote creative financing options for the redevelopment of
Landmark Mall (which this year has again had a reduction in property value, increased
vacancy rates and an immeasurable loss of revenue in meal and sales tax).
We urge prompt action to complete the Waterfront Plan, consider implementing
recommendations from the King Street Retail Study, and move forward with the proposed
Potomac Yards Area Plan.
We endorse the idea of utilizing Planning and Zoning staff (with costs paid by developers) at
development sites to ease the permitting and other regulatory processes.

6
I. THE BUDGET PROCESS
A. Long Range Budget Outlook
The City Manager’s message on the proposed FY 2011 Operating Budget and FY 2011-2020
Capital Improvement Program concludes: ―We can expect at least 3 maybe 4 more years of
difficult financial prospects calling for significant spending restraint. For this reason, we should
not rely on expedient, short term fixes to try to solve a long term budget problem. We also need
to focus on our strategic goals and objectives in the face of these financial difficulties and not
abandon them.‖ 1
In fact, if you use the City’s Interactive Budget Assumptions Model, both the low and medium
growth models have a budget deficit thru 2020. The only model showing a surplus is the high
growth model, and even it projects deficits until 2016.2 This year marks the third year that the
City has faced daunting fiscal challenges, and as the City Manager has stated above, we can
probably expect several more years of difficult financial prospects.
In examining the long-term fiscal outlook, BFAAC is concerned that the FY 2011 budget
represents ―budgeting business as usual.‖ It continues the current practice of having the City
make marginal changes to balance the budget, through a combination of trimming the budget at
the edges and offering numerous small increases to various revenue sources.3 Given the current
economic environment, this approach may not be the most responsible and effective way to
address the annual deficits the City will face over the next several years.
BFAAC believes the problem of the projected rate of expenditure growth exceeding projected
rates of revenue growth for several years requires the City to make a more aggressive effort to
rebase the Operating and CIP budgets. An initial step in this direction has been taken by Council
under Resolution 2368 in which the long-range forecasts are used to show expected revenues and
expenditures in FY 2012.4 BFAAC supports this effort and encourages the City and Council to
extend this analysis out five years. The result would be to better align spending with the weak
revenue forecasts projected over this period. Under this process, the current budget would be
shaped by the long range outlook to preserve core City services, while eliminating, scaling back,
or phasing out nonessential services.
As stated by the City Manager, taking the long-term approach also includes focusing on the
strategic goals and objectives. To effectively pursue this course, City staff and Council will need
to rely on several tools that are in various stages of development, i.e., citizen input, the Strategic
Plan, multi-year financial forecasting, and Managing for Results Initiative (MFRI). To
effectively utilize these tools, the City Council and City staff will need to alter the current
method of budget formulation in order to effectively address the needs of Alexandria’s citizens.
1 FY 2011 Proposed Budget, City Managers Message, p. 2-1. 2 FY 2011 Proposed Budget, Forecast Scenarios, pp. 10-8, 10-9, 10-10. 3 FY 2011 Proposed Budget, Forecast Scenarios, p. 10-3. 4 FY 2011 Proposed Budget, Forecast Scenarios, p. 10-2, 3.

7
B. Citizen Surveys
To measure what your outcomes are, you need to know where you are going. The City has
developed a Strategic Plan, and is updating it at this time. An important input to strategic
planning is to know what the citizens of Alexandria want, need, and how they feel about the
services the City provides. To Alexandria’s credit, citizen input is both expansive and multi-
faceted. The City earns high marks for seeking input via broad-based questionnaires available
on the City’s website and through targeted issue meetings.
In looking at citizen input, comments have been made suggesting that the City push deeper in
exploring citizen reactions to specific issues. What is also noted, especially on the broad
surveys, are suggestions that the surveys dig deeper in order to give a more concrete picture of
what citizens feel about the services provided by the City. In reviewing these various inputs,
BFAAC is not suggesting that new expansive surveys are needed. Rather, we suggest that
developing a cohesive process of evaluating the existing inputs, and modifying them where
necessary, would increase their value. Moreover, incorporating surveys into the budget
consideration process, just as public budget hearings are part of the formal budget process,
should be considered.
The objective here is to more clearly understand what citizens understand about services
provided, how they prioritize them, what is deemed necessary, and what does not rise to the level
of necessary. Understanding this better would be very powerful in helping the City to shape the
services and determine appropriate levels of funding. One could say that effectively measuring
citizen valuations could be a Strategic Goal in itself.
C. Strategic Plan
The City has sought to link its budget to the revised Strategic Plan. As a result, there is greater
transparency in the connection between spending, spending reductions, and the Plan. The City
Manager has provided both a description of the percentage of City spending as well as the
percentage of reductions allocated to each priority. As the City Manager also notes, the City has
used an incremental approach in each Strategic Plan area to match resources to goals for various
services.5 However, as Council and the City well know, each Strategic Plan goal will not be able
to be treated equally. Funding shortages will force budget constraints to be applied differently
across Strategic Plan goals. These choices will become obvious when forecasts are balanced as
described in the Multi-Year Financial Forecasting section.
In light of the serious fiscal constraints facing Alexandria, BFAAC recommends additional
levels of analysis and decision-making in order to match limited resources with priority needs.
In the current process, it is not clear to us whether and how decisions are made to prioritize
spending either among the areas in the Strategic Plan or within each area. The percentage of City
spending allocated to each dimension of the Strategic Plan varies widely, from 3% in the area of
health and environment to 36% for education and youth.6 One would expect wide differentials
5 Budget Memo #4, City-Wide General Fund Program Budget by Strategic Plan Goal Area, February 26, 2010. 6 Id.

8
among the eight Strategic Plan goals given the varying nature and accompanying funding
requirements of the functions covered. In a time of retrenchment that is likely to last for years to
come, a clearer determination of priorities within and among the areas would be helpful,
especially at the margins where reductions will be made.
D. Multi-year Financial Forecasting
For the first time, Council has asked via Resolution 2368 for the City Manager to show expected
revenues and expenditures for FY 2012 at a detail level shown in the long-range financial
forecast.7 It is gratifying to see the Council utilize this planning tool. To further the use of this
tool, BFAAC recommends the City project five fiscal years in the future and balance the budget
using the Mid Growth scenario as the base line. Although this is a conservative approach, it is
significantly easier to project low and revise up based on higher revenues rather than project high
and revise down based on lower revenue.
However, BFAAC cautions that each year, if the Mid Growth scenario proves, in fact, to be too
optimistic, City Council and City staff should revise its estimates downward and adjust the
planning process accordingly. With the Strategic Plan as a guideline, spending cuts and revenue
enhancements could be employed in a ―what if‖ scenario. This would give the City the
opportunity to see the impact of current reductions to programs in later fiscal years. The City
staff could also build better initial budgets based on long range Council approved plans. As the
City Council and City staff develops familiarity with this process, it should greatly assist in the
budgeting process.
E. Managing for Results Initiative (MFRI)
In the FY 2010 BFAAC Report, we recognized that MFRI is evolutionary and its activity
measurements needed continued scrutiny and recalibration to be effective. The question facing
MFRI this year is whether the metrics are effectively measuring the outcomes and effectiveness
of programs and activities? Or, are the metrics only measuring the efficiency of program inputs,
without significant focus on the effectiveness of programs and activities in achieving results?
Simply measuring output, input and efficiency is not enough. The City needs the metrics to tell
it if it is effectively delivering the services the citizens want. In order to effectively measure the
degree to which Strategic Goals are attained, BFAAC encourages the City to continue the
evolution of MFRI to develop a greater focus on results. Indeed, if MFRI measurements do not
evolve into results measurement, MFRI could become a limiting factor hindering the production
of effective budget information.
RECOMMENDATIONS
For FY 2011 and into the future, the City should take more aggressive steps to identify
nonessential services that can be eliminated, scaled back, or phased-out in an effort to
rebase the Operating and CIP budgets.
The City also needs to identify and then adopt controls that reduce the rate of growth in
City spending caused by critical “drivers” of budget expenditure growth.
7 FY 2011 Proposed Budget, Forecast Scenarios, p. 10-2.
9
To effectively accomplish this, BFAAC encourages the City staff and Council to expand
its efforts (as initiated in Resolution 2368) and establish a process of utilizing long-range
financial forecasts to develop current budgets.
BFAAC recommends that Council establish guidelines for operational priorities among
and within Strategic Plan Goals as budget reductions (or increases) are anticipated.
BFAAC believes that the City would be well served to review and analyze the various
methods of obtaining citizen input, with an objective to modify those processes to
produce data that is more actionable in relation to funding of services.
Using the Mid Growth Forecast Model, BFAAC recommends that the City go out 5
fiscal years and balance the budget. Employing “what if” scenarios, determine what
programs and activities are affordable, in concert with what the citizens want, and what
programs should be reduced, eliminated, or expanded.
In order to effectively measure the degree to which Strategic Goals are attained,
BFAAC encourages the City to continue its evolvement of MFRI to develop a greater
focus on the results.

10
II. THE PROPOSED OPERATING BUDGET
A. Compensation
In our FY 2009 report to Council, we noted that ―the City of Alexandria is facing the most severe
budget challenge in more than 30 years.‖8 Unfortunately, the fiscal situation of Alexandria has
become even more precarious, requiring difficult choices and a close examination of City
priorities in order to meet the needs of citizens and employees. Since Council has focused
attention on valuing City employees in Goal Five of the revised Strategic Plan, and because total
personnel costs, including compensation and benefits, account for a majority of City outlays, it is
important to review proposed employee financial compensation.9
The City Manager’s proposed budget calls for total staff compensation of $248.1 million. This
figure represents a 1.9% increase over FY 2010, with the primary driver being a proposed $2.8
million budgeted amount for a step/merit increase based on employees receiving a satisfactory or
above performance evaluations. It should be noted, however, that this figure does not include
employees at the proposed Q step level. Q step employees are the highest earners in the City and
implementation of a merit/step increase for these employees would add an additional $570,000.
This brings the total cost of the proposed merit/step increase to $3.37 million should Q step
employees be included in the proposed merit/step adjustment.10
The City Manager has proposed
no Market Rate Adjustment (MRA), formerly known as a Cost of Living Adjustment (COLA).
Benefits would increase by $2.4 million (or 3.6%) over FY 2010. Overall, pay and benefits
account for 57% of the total City outlay.11
In previous reports, BFAAC has supported fairly and competitively compensating City
employees and continues to do so. Noting that City employees have not received consistent pay
adjustments in recent years, BFAAC understands why the City Manager has proposed a
merit/step increase this year. BFAAC also notes that pay increases, such as the one proposed by
the City Manager, have both a short-term and a long-term cost. Unlike one-time bonuses, for
example, merit or step increases become permanent fixtures in the base line budget and affect
both compensation and retirement pay long after this budget would be approved.
BFAAC notes that step increases under the current system for employee evaluation are not
necessarily a cost saving tool. As Staff informed Council during the compensation work session,
it is likely that more than 90% of employees will receive a satisfactory or above rating of their
performance this year.12
When that fact is added to the mix, the proposed merit/step increase
resembles a COLA/MRA adjustment rather than a true merit-based step increase.
BFAAC repeatedly has called for the City to move to a pay-for-performance compensation
system. We once again make that recommendation this year. As a result of the recent
recommendations from the Watson-Wyatt Report on Pay for Performance, Position
Classification and Compensation, the City Manager has proposed a minimum of approximately
8 FY 2010 BFAAC Report, Compensation, p. 3. 9 FY 2011 Proposed Budget, Budget Overview, p. 3-4. 10 Budget Memo #12, Cost of Proposed Q Step. 11 FY 2011 Proposed Budget, Personnel and Compensation Summary, p. 8-3. 12 City Council Work Session, February 20, 2010.

11
$264,000 for implementation of a new Competency Based Classification System (CBCS).13
The
CBCS, however, is just one part of larger reforms proposed by Watson-Wyatt. BFAAC supports
the funding of this element carried over from Council contingent reserves. This is an
encouraging beginning towards moving to a more equitable and effective classification system
and the adoption of successful pay-for-performance system.
The study also found that benchmarking and performance management within the City needs
significant revision. Unfortunately, the FY 2011 proposed budget does not include funding for
implementation of recommendations beyond the CBCS.14
While BFAAC commends the City
Manager for implementing the CBCS portion of the study’s recommendations, we encourage
Council to propose full implementation of the recommendations as soon as financially possible.
Any implementation delay puts at risk the work and resources spent on generating
recommendations for needed reforms.
Given the long standing position on this issue, the committee extensively discussed the
reinstitution of the merit/step increases as recommended in the Manager’s proposed budget.
Given the lack of a COLA/MRA increase in FY 2008-FY 2010 and also the freezing of
merit/step increases in FY 2010, the Committee agrees with the merit/step increase proposal.
We do so with the desire to avoid mixing the FY 2011 merit/step issue with efforts by Council
and management to maximize proper and effective implementation of the CBCS. Since the
beginnings of the new system are, in fact, already underway, full implementation must be done
in due course and with full involvement of staff, so it will be a trusted, fair and effective
compensation philosophy for the employees.
While BFAAC concurs with the City Manager’s merit/step recommendation, BFAAC urges
Council to consider other compensation-related options that, even though they do not provide
direct compensation to employees in FY 2011, do move the City towards a more equitable
system of compensation. For example, Council could consider redirecting the funding for the
proposed merit/step increase toward beginning implementation of the performance management
and benchmarking recommendations found in the Watson-Wyatt study. This option is difficult,
given the understandable desire to compensate employees directly this year. However, the
establishment of a more consistent and equitable compensation system is consistent with goal
five of the Strategic Plan, and would be beneficial to employees in the long-term and build on the
considerable funding of the Watson-Wyatt study conducted last year.
RECOMMENDATIONS
BFAAC prefers an employee pay increase based on the new performance-based
compensation system now being developed. However, given no COLA/MRA
adjustment since FY 2008, the freezing of merit/step increase in FY 2010 and the desire
to have a fully developed new compensation system that is understood and trusted by
management and employees, we concur with the Manager’s recommendation for a
merit/step increases for FY 2011.
13 FY2011 Proposed Budget, Personnel and Compensation Summary, p. 8-16. 14 FY2011 Proposed Budget, Personnel and Compensation Summary, p. 8-15.

12
BFAAC recommends the continuing implementation of the Competency Based
Classification System (CBCS), but notes that implementation of performance
management and benchmarking recommendations without additional financial
resources will be challenging.
BFAAC urges the Council to consider other compensation-related options that, even
though they do not provide direct compensation to employees in FY 2011, do move the
City towards a more equitable system of compensation.
B. Benefits
BFAAC consistently has stressed the need for the City to change the balance between salary and
benefits with less emphasis on being a regional leader in benefits. We are pleased to see
continuation of the move started last year for employees to pay a portion of health insurance
premiums, while devoting money for personnel to a merit or step increase in the FY 2011
proposed budget.
BFAAC again urges the City to approach changes in expenditures for personnel to adopt the
concept of total compensation, not salary or benefits as unique line items. The continuing
implementation of the Watson Wyatt studies of last year takes this approach. The reports also
provide comparison data with nearby jurisdictions on benefits: medical, dental, life insurance,
paid sick leave, disability, vacation and holiday, defined contribution, post-retirement medical,
and post retirement life insurance. The reports also provide data that supports rationales for
abandoning past approaches to compensation. As a part of the move to a merit-based
compensation philosophy and in keeping with Watson-Wyatt reports, the City should
increasingly move to a total compensation approach for any and all subsequent benchmarking
and actual changes in compensation.
In addition, new employees must pay 20% of premium for health insurance and employees hired
prior to 2009 must, beginning next year, pay 13% of premium rather than 10%, moving
gradually to the point where all employees will pay 20%. This helps reduce City expenditures
for this purpose and helps with the balance compared to salaries. In addition, for retirees,
Alexandria has made changes in insurance offered to new employees upon retirement, further
reducing City expenditures.
RECOMMENDATION
BFAAC commends Council and management for moving to a more equitable balance
between salary and benefits in order to attract and retain employees; we also urge the
City to approach these factors as integral aspects of a total compensation approach in
planning of future personnel remuneration.
C. Risk Management, Workers Compensation and Disability Retirement
Risk Management. Last year’s BFAAC report reviewed the City’s programs involving risk
management. We found that the City had hired a new firm to handle workers’ compensation and
13
liability claims. According to staff, this change has been beneficial and continues to produce
better information and analysis of risk and trends in this area.
Also last year, the City formed a new city-wide staff Executive Safety Committee. The purpose
of the Committee is to share ideas to reduce on-the-job injuries, to promote and support the work
of departmental safety committees, and to improve communication among departments most at-
risk for at-work injuries. This increased emphasis aims to create a culture of safety throughout
the City, not only to help protect employees from injury and disability, but also to preserve City
fiscal assets as well. The group is also attempting to uncover trends and find solutions that cross
departmental boundaries.
Calendar year 2009 also saw the establishment of the Risk Management Oversight Committee
(RMOC). The RMOC is co-chaired by the Fire Chief and the City Attorney, and its members
consist of department heads with support from additional staff. The Committee has established
two draft strategic objectives:
To develop a comprehensive, city-wide disability management program that reduces
the median cost per occurrence of injuries, illnesses, and accidents by 5% over the
next five years.
To develop a comprehensive, city-wide employee safety, health, and wellness program to
reduce accidents, injuries and illnesses.
Next steps include development of initiative statements for each of the objectives.
Workers' Compensation. Workers’ compensation claim incidents are running at comparable
numbers this year compared to last. In 2009, there were 237 total claims of which 195 were
medical and 42 cases involved lost time. This year to date, rates are similar, with 32 involving
lost time.
Disability Leave. By City administrative regulation, disability leave is used for authorized time
off work following an at-work injury or illness, up to one year’s worth of lost time. To date this
year, the rate of use is comparable to last year. Individual cases are monitored closely by
responsible staff in departments and the Risk Management office.
Disability Retirement. There is little change in the number of disability retirements in
comparable yearly statistics. The chart below compares the latest data with the year before for
totals of those on disability retirement. The benefits detailed in the ―% of Avg. Pay‖ column are
the same for each year. At this time, there is no new information on any follow-up of those on
partial or full disability to determine if they remain disabled and whether or not any individual
has resumed employment elsewhere, even though collecting partial or full disability retirement
payments from the City.

14
Table 1. Disability Data
Dec 2009 Dec 2008 % of Avg. Pay
Total disability, service related 6 6 70%
Partial disability, service related 48 44 66 2/3%
Total disability, non service related 0 0 66 2/3%
Partial disability, non service related 23 21 50%
RECOMMENDATIONS
BFAAC commends the City for its increased emphasis on safety and focus on improving
safety awareness and practices, especially in the departments of Fire, Police, Parks &
Recreation and Transportation and Environmental Services (T&ES). Such
improvements are essential to reducing injury, absence from work and disability claims.
BFAAC repeats its recommendations from last year to establish a more transparent
view of the disability retirement program, and a system to monitor the status and post-
retirement employment history, if any, of those on total or partial disability retirement.
D. Financial Forecasting
BFAAC has commented on multi-year financial forecasting in the last two reports. With the
future financial picture still looking unsettled at best, we again strongly support the continuing
improvement of this process, and the role it can plan in budgeting. While the current status is
impressive, there is room for even more improvement both in multi-year planning and in its use,
which could yield even better information on which the Council and the City can make more
informed financial/budgeting decisions.
The City has recently expanded its six-year CIP to ten years in order to accommodate the sheer
number of current projects, and requests for additional projects which greatly exceed what could
be realistically implemented over the next six years. In order to more accurately plan for project
start dates, ten program years will be included.15
For the FY 2011 – FY 2020 CIP, the CIP
Steering Committee will set priorities among individual projects over all program years, and
recommend a plan to the City Manager that balances expected available revenues with
expenditures in each fiscal year. With this requirement, the City would be well served to
implement a stronger multi-year financial forecasting process to provide the information critical
to the Steering Committee to do this.
15 Memorandum, City Council Retreat – Report on FY 2011 – FY 2020 Capital Improvement Program, October 30, 2009.
15
In addition, Council for the first time has asked for the City Manager to show expected revenues
and expenditures for FY 2012 in the same detail level shown in the long-range financial
forecast.16
The impact of expenditure FY 2011 changes on the FY 2012 budget amounts to a
reduction of expenditures of $725,964.17
These reductions are included in the Forecast Scenarios
which also shows all proposed tax and fee rates. The Low Growth scenario shows a budget
deficit of $35.7 million; the Medium Growth scenario shows a budget deficit of $21.7 million;
and the High Growth a budget deficit of $7.8 million. Addressing the CIP and utilizing the
multi-year revenue and expenditure projections in concert greatly strengthens the budgeting
process.
As noted in the City’s MFRI, the link between the City’s Strategic Plan, and the departmental
activities as encapsulated in the budget, is the development of coordinated business plans. These
plans allow City managers to identify key results areas that can be measured to assure effective
realization of the Strategic Plan. Such plans take several years to develop, and are in the initial
stages now. Establishing a more robust multi-year financial planning process would
significantly increase the validity of these business plans by providing more actionable
information.
In responding to last year’s BFAAC report, OMB noted:
OMB is developing a more robust 10-year financial forecasting model that
enables policy makers and interested members of the public to understand (1) the
long-term impacts on the budget of current fiscal decisions, and (2) the range of
uncertainty in budget projections caused by factors largely outside of the City’s
control. The model is also designed to be interactive to permit anyone to explore
the long-term effects of changes in fiscal policies and different assumptions about
the future.18
BFAAC notes the forecasting model has evolved into a more robust tool, and applauds the City’s
major progress. BFAAC hopes that the City and Council will utilize this resource much more
extensively to deal with the difficult financial years ahead. This will help the City continue
evolving the forecasting model itself, making it better by filling in known numbers both on the
revenue and expense sides, and in looking at current expense trends to modify, if necessary,
projections based upon percentages.
RECOMMENDATIONS
The City and Council should develop the skills to greater utilization of the multi-year
planning tool, using the Strategic Plan as a guide, to assist in the development of the
current budget.
The City should continue to strengthen the forecasting models, and to utilize them in
developing the MFRI Business Plans.
16 FY 2011 Proposed Budget, Forecast Scenarios, p. 10-2. 17 FY 2011 Proposed Budget, Forecast Scenarios, p. 10-4. 18 Report on City Manager’s Proposed Budget: Staff Response, p. 3.

16
E. Alexandria City Public Schools
The Alexandria City Public Schools (ACPS) FY 2011 budget approved by the School Board
totals $221,124,062, or an increase of 1.6%. Of that, $201,137,753 is for the operating budget.
That includes proposed City appropriations of $167,886,567 (a 2.0% increase). Some critics
have questioned why ACPS is proposing additional funding while most surrounding jurisdictions
are seeking to cut the allocations for schools. There are a number of factors, primary among
which is that ACPS has demographics that are not unique to some jurisdictions in the
Washington area but are to most of the nation: 54% of students are eligible for free and/or
reduced lunches; 25% of students are projected to be enrolled in English Language Learner
classes; and the number of students with moderate to severe disabilities enrolling in special
education is increasing.
BFAAC notes that ACPS has reallocated 30% of its funding, directing more dollars to school-
based programming. For example, between FYs 2010 and 2011, the percentage of positions
within the central office has decreased from 122 to 118. BFAAC further notes the cost-per-
student has decreased by $1,000: from $18,000-per-pupil to $17,000.
Since 2007, ACPS has seen its population increase by 1,700 students. ACPS estimates that total
enrollment for FY 2011 is projected to be 12,002, an increase of 379 students or 3.3%. Should
the pupil trend lines continue to increase, ACPS will require significant additional operating
resources and possibly capital expenditures to construct new schools. BFAAC urges both City
staff and Council to keep this in mind when adopting the FY 2011 budget and in drafting future
budget guidelines and proposed spending plans.
The biennium budget recently agreed to by the General Assembly includes provisions that
reduce ACPS contributions to the Virginia Retirement System by $5,000,000 below that
budgeted in the School Board approved FY 2011 budget. ACPS officials and the City’s Chief
Financial Officer recently informed BFAAC that that money eventually will have to be used for
VRS obligations. Both the City and ACPS are attempting to find a way to ensure that this
funding is available, if appropriated, only for future School VRS costs. BFAAC strongly
supports that effort and recommends the City Manager, Council, School Superintendent, and
School Board not seek to use the funds for other purposes.
ACPS recently completed a division-level plan that sets specific targets by academic area,
establishes a baseline metric, and determines whether those targets are being met. Each division
and school is held accountable to meeting the standards within the plan. For several years,
BFAAC has recommended the City adopt such a plan for its agencies, which is underway.
BFAAC is greatly impressed with the ACPS plan, and recommends the City consider using such
a model as its MFRI matrices.
RECOMMENDATIONS
BFAAC urges both City staff and Council to keep in mind the increasing ACPS student
population when adopting the FY 2011 budget, and in drafting future budget guidelines
and proposed spending plans.

17
BFAAC strongly recommends the City Manager and Council segregate and not spend
the $5,000,000 in reduced ACPS contributions to the Virginia Retirement System, since
that money eventually must be used to fund VRS obligations.
BFAAC is greatly impressed with the ACPS Division-Level plan, and recommends the
City consider using such a model as part of MFRI.
F. Priority Setting
We noted in the Budget Process section the need for guidelines and processes for establishing
and applying priorities. Such guidelines could usefully be applied to decisions about budget
reductions this year. As is evident in the City Manager’s overview of the budget, funding
reductions in relation to the Strategic Plan areas vary greatly. For example, the City Manager’s
budget memo #4 points out, over two years, public safety funding remained essentially flat. At
the extremes, Caring Community cuts amount to 9.64% while Health and Environment
experienced a 1.38% increase.19
The memo also points out that the changes in allocation
percentages among priorities reflect a number of factors, some of which involve reallocating
resources by program. Nevertheless, real decisions are reflected in the budget proposals to
preserve some activities and cut others, and it would be helpful to Council and citizens to be
clearer about what the priorities are.
No transparent standards or guidelines currently exist for allocating funds among Strategic Plan
priorities or in making proposed reductions. Thus, for example (without BFAAC expressing a
view on the particular cuts), it would be helpful to know whether the proposed one-third decline
in the number of people served through the outreach program to homeless people with mental
illness is a product of lower demand or some other criteria.20
By the same token, it would be
helpful to understand whether the approximately 40% increase in case management services for
adults is based on additional demand, or whether it compensates for reductions in the homeless
program.21
As an additional example, it could be productive to have an analysis of the extensive
subsidy for the King Street Trolley, where no cuts were made this year, using criteria derived
from its impact on the economy of the City.22
We recognize that establishing and applying standards or guidelines is difficult. In their absence,
decisions on preservation or reductions in services will be made with insufficient information
available about consequences.
RECOMMENDATION
Council should apply guidelines and mechanisms for analysis established as part of the
overall budget process in making determinations on preservation, expansions, and
reductions in services in the FY 2011 budget.
19 FY 2011 Proposed Budget, Budget Overview, p. 3-3. 20 FY 2011 Proposed Budget, p. 15-33. 21 FY 2011 Proposed Budget, p. 15-32. 22 FY 2011 Proposed Budget, p. 18-35.

18
III. THE PROPOSED CAPITAL IMPROVEMENT PROGRAM
A. Overview
The FY 2011 CIP budget summary indicates that "[t]he appetite for capital investment in the
Alexandria community continues to exceed the City’s funding limitations for the fourth
consecutive year."23
The FY 2008 – FY 2013 Approved CIP identified $85.3 million of projects
above what the City projected for revenues under the then approved tax rates and tax structure.
For FY 2011, the shortfall between funding requests and funding limits has grown to over $200
million.
The Manager’s CIP expands the program scope from six years to ten years. The expansion of
program scope allows the City ―to confront and deal with the funding shortfall directly and build
a ten-year plan that meets the most critical needs of the City and community while assuming
realistic funding levels in each year.‖24
The CIP section comments on the process used by the
City to develop a ten-year CIP and the role of cash capital in the capital planning process.
B. CIP Prioritization and Development
The FY 2010- FY 2020 CIP includes spending plans for all ten years. As a result of the austere
fiscal environment, the City Manager modified the framework for assessing proposed capital
projects. The Manager reduced the number of categories from six ―maintain‖ and ―five
―improve‖ categories by consolidating them into the following three categories:
―Group 1‖: Ongoing Maintenance – annualized funding streams that cover an ongoing
maintenance need for an existing City asset;
―Group 2‖: Major, Stand-alone Maintenance Projects – specific large renovation or
restoration projects that are necessary cyclically or periodically, but can be scheduled for
a specific time period. These projects also pertain to existing City assets; and
―Group 3‖: New, Improvement Projects – projects that result in a new or expanded level
of service and can be scheduled.
Based on the categorization of the projects described above, the CIP Steering Committee
reviewed all the requests, made adjustments to the identified project categories, and developed
an initial set of funding priorities. Group 1 projects were considered the highest priority, Group
2 projects were scheduled next for an appropriate time period based on program constraints and
Group 3 projects were considered to be of the lowest initial priority.
The Steering Committee agreed upon appropriate funding levels for the Group 1 projects. The
City and Schools Group 1 funding is approximately $20 million in FY 2011 and gradually grows
to approximately $34 million by FY 2020. This level of funding was set aside from the
remaining prioritization exercises. As the Manager’s Budget states:
23 FY 2001 Proposed Capital Improvement Program Budget, p. 2-6. 24 Id.

19
It is anticipated that after several years of appropriately scheduled maintenance
and significant catch-up on deferred maintenance, this level of annual investment
will begin to decline. For now, while it will be important to review justification
for these Group 1 funding requests each year, it is equally as important that these
funds be given priority during the strict competition for funds that occurs each
year. The City cannot afford to sacrifice its current assets in order to grow its
service levels.25
Group 2 and Group 3 projects were then scheduled across the life of the CIP program as program
constraints and funds permitted.
BFAAC endorses the 10-year planning process. The earlier six-year plan was not sufficiently
comprehensive to consider the effects on the Operating Budget of deploying new infrastructure.
The length of the CIP is now consistent with long-term horizon presented in the Operating
Budget. BFAAC believes that the CIP is now more focused on the entire span of the program,
and the undue focus on the first and last years of the funding cycle of the project has been
moderated.
The new framework also makes a distinction between core and enhanced services. The previous
framework co-mingled projects that addressed "core" services with projects that "improved" or
"enhanced" services. The priority between critical core projects and "wanted" and "wished for"
projects was difficult to decipher. The 10-year plan clearly states "what we will do," and "what
we will not do." In previous budgets, it was difficult to determine which projects in the CIP
were not recommended for funding in previous CIP budgets.
The new 10-year approach is a deeper look into what the City really needs – a determination as
to the real value added by a project to the core services of the City. The 10-year cycle lends
itself better to priority setting. It also provides a better sense that "things are being managed."
Group 1 projects now stand out as supporting core services, which must be protected. Project
timing is more transparent. As an example, the Fire Department will need several new fire
stations as the City grows. However, the City does not have the capacity to bring on all the fire
stations simultaneously. The 10-year plan provides executable, managed timelines for bringing
the Fire stations on line. Effective timing is an essential ingredient of a CIP plan.
BFAAC also notes the linkage between project and the City’s strategic goals. While this is a
good start, we urge the Manager to go further. As noted in previous reports, BFAAC strongly
supports a CIP prioritization process as the major means for ensuring a strong relationship
between the City’s Strategic Plan, the MFRI, and planned CIP expenditures. While this linkage
may not appear important in an environment in which preservation of assets is the City’s primary
goal, it remains important because it allows the City to adjust capital funding priorities as the
Mayor and Council adjust the City’s operating priorities. It also provides a framework to
continually evaluate project priorities, which is critical for a program that spans ten years.
25 FY 2001 Proposed Capital Improvement Program Budget, p. 2-8.

20
In our report on the 2009 Proposed CIP Budget, we recommended that the City adopt a
structured business case approach (including estimates of full lifecycle costs; analysis of two to
four alternatives; and defined project dependencies and risks) for all new CIP projects and stand
by this recommendation as a management best practice. We are encouraged to see that the
Manager is beginning to implement this recommendation. In FY 2010, the City identified 14
projects to be part of the stage gate process and established five stage gates for capital projects
that require the use of a structured business case approach:
Identification of Need or Problem;
Development of Initial Requirements/Initial Study;
Alternatives Analysis and Design;
Invitation to Bid Issuance; and
Construction Contract
We believe that the CIP development process is on a path of steady and continuous
improvement. Given the current fiscal environment, BFAAC believes that it would be wise for
the City Manager and Council to adhere to the established, structured CIP development process
before additional near-term projects to the CIP (i.e., Potomac Yard Metro Station). BFAAC
believes that future development of the CIP process should address the following issues:
Better prioritization of projects within the three categories – Budget Memo #9 cites that
Group 1 includes about 90 projects that encompass the majority of the CIP funding needs
for 2011. Fifteen projects represent 80% of the required funding for Group 1. Thirty one
smaller projects represent 18% of the remaining funding and are characterized as
"equally essential."
Prioritization of projects not included in the CIP – In its presentation to City Council,
staff submitted a list of all the projects that were reduced in scope, delayed, not
considered for inclusion, or removed from the proposed CIP. Projects that were not
considered for in inclusion in the CIP or those that were removed from the CIP were not
ranked in priority order. For example, City staff included the Hammond field upgrade
($1.2 million) in its list of CIP cuts. However, ACPS indicated it has found some
additional funding and will fund the Hammond site renovations from those funds.
Improvement to the criteria for scoring the existing or future value of projects. Budget
Memo #7, ―Athletic Field Site Rankings for Conversion to Artificial Turf,‖ contains
scores for field sites based on nine criteria: 1. size; 2. direct fiscal impact; 3. process; 4.
impact on existing use; 5. location; 6. field condition; 7. public access and site amenities;
8. indirect fiscal impact; and 9. constructability. Weights are included for each criterion
to reflect City goals. The memo includes in rank order (based on scoring) 14 field-related
projects. We commend Parks and Recreation staff and the Commission for this cogent
approach and believe this type of scoring activity should be used to measure the value of
every project.
The CIP should define clearly the terms used within the CIP submission – Throughout
the CIP BFAAC notes the use of terms such as "core," "essential," "needed," "non-

21
essential," "desirous," "wanted," (e.g., real need vs. real want). BFAAC also sees
designations of "categories,‖ "groups," "projects," "service levels" including terms such
as "useful life." An explanation of these terms and how they relate to the development of
the CIP would increase transparency.
Impact of CIP on the City's Operating Budget – Cash Capital and borrowing will be
discussed below in detail. We would encourage a clearer definition of the impact CIP
projects on the Operating Budget for the entire 10-year cycle. We understand this has a
serious impact on staff resources but believe it would be beneficial in CIP decisions. We
would recommend that necessary resources be devoted to this end.
Integration of Federal and State funds into CIP – A clear description how Federal and
State funds will be integrated into the CIP, especially detail as to how these types of
funds may affect priority ranking, is necessary. It would be helpful to understand how
such funding might affect core services (e.g., Federal stimulus funding to purchase four
trolley buses).
RECOMMENDATIONS
We recommend that all projects in each category be listed in priority rank order. For
example, City Council and the public should be able to decipher clearly the relative
priority of the General Services Capital Facilities Program ($11 million over a 10-year
period) and the ACPS Eco-City Projects ($9.5 million over 10 years) or Dash fleet
replacement ($26 million over 10 years).
We recommend that the projects cut from the CIP be listed in priority order.
We recommend that the City develop improved criteria for scoring the existing or
future value of projects and that the timing and implementation of a project is
consistent with its priority rank and operational considerations.
The CIP should define clearly the terms used within the CIP submission.
The timing and impact of CIP on the City's Operating Budget should be presented.
The CIP should discuss the impact Federal and State funds on the priority setting
within the CIP.
C. Cash Capital
BFAAC has historically chosen to view the cash capital contribution issue as an equitable
oneBhow much of any given project should be paid for by existing taxpayers and how much
should be paid for by future taxpayers given that capital projects are, by definition, designed to
benefit the City long term. As is evidenced by the graph below, neither BFAAC nor the City has
been scientific in its approach to cash capital--certainly not in the same way that we have
approached the debt policy guidelines. If we had been, the graph would have a trend line that

22
was much more consistent. That said, BFAAC finds that this proposed CIP Budget restores
some consistency in funding, and restores some equity in financing between current and future
taxpayers.
Throughout the first six years of this century, cash capital was never below 19% of the CIP
budget and four of those years it was over 25%. Our 2005 report to Council noted the increasing
size and significance that cash capital contributions had made to the expanding CIP and that such
contributions had remained high for a number of years. We then observed that cash capital
contributions ―may have reached the point where today’s taxpayers are paying more than their
fair share for projects that will also be enjoyed by future residents.‖ We thus recommended that
Council reduce the planned cash capital contribution and spread the burden out more equitably to
future generations of Alexandrians.
As if on cue, the FY 2007 CIP Budget began a rather precipitous drop – down 8% from the
previous year to 20% cash capital. In 2008 it fell to 15% and in 2009 it fell to 7.3%. Last year,
after Council added $3.7 million to cash capital during the add/delete process, the $4.4 million
total was 6.2% of the $71.4 million CIP. Clearly, the equities of funding the CIP between
current and future taxpayers has swung considerably against future taxpayers since they will be
the ones having to pay the debt service on the City’s borrowing for CIP projects.
According to the FY 2011 – 2020 proposed CIP Budget, without Council action, the 2011 budget
will be the low water mark for cash capital: $4 million or 4.1% of the CIP’s total cost, including
outlays for storm and sanitary sewers, of $98.5 million. The FY 2012 budget also contains $4
million in cash capital, but the percentage of the CIP rises to 6.5% as the total budget outlay is
$61.8 million. The trend line continues to rise through the FY2012 – 2020 CIP budget, with a
number of years having over 20% cash capital. In addition, beginning in FY 2015, the cash
capital contribution annually remains above $12 million.
Table 2. FY 2000-2020 Cash Capital Contributions

23
Table 3. Cash Capital as a Percentage of CIP
BFAAC is mindful of the many City capital needs as well as the favorable environment that
currently exists for debt financing. We are also acutely aware of the City’s revenue situation and
the challenges inherent in making a significant contribution to cash capital. BFAAC believes
that the proposed budget, especially in the out years, restores CIP cash capital funding to a more
equitable distribution between current and future taxpayers.
RECOMMENDATIONS
The City should develop a cash capital policy similar to the one it has successfully
utilized with respect to debt policy.
When considering cash capital contributions to the CIP, Council should consider the
equities between current and future taxpayers that are inherent in funding the CIP
budget.
D. Alexandria City Public Schools
In an unusual but useful move, in November 2009, the ACPS staff presented the School Board
with two CIP budget options: a Needs-Based Request for $139.1 million over six years; and a
Constrained Resources Request totaling $127 million over six years. (The Schools, for now,
continue to operate under a six-year CIP budget cycle.) The primary differences between the
two are less funding under the Constrained Resources Request for furniture, fixtures and
equipment (FF&E) and less funding for the Eco-City initiative.
As noted in the Operating Budget section of this report, enrollment in the ACPS has increased by
1,700 students since 2007. If enrollment estimates for 2011 are accurate (an increase of 379
students for a total enrollment of over 12,000), enrollment will have increased by 20% in four
years. That is a considerable amount of new students to educate, even if ACPS facilities had no
problem accommodating such an influx. Not surprisingly, however, enrollment growth has put

24
significant pressure on ACPS buildings and overcrowding has become a very real concern,
especially in the West End schools.
In an attempt to begin addressing the enrollment challenges being faced by the Schools, last
year’s School Board Approved CIP requested $86.7 million, which included funding for new
construction to alleviate some of the overcrowding. The City Council Approved CIP Budget
contained an allocation of $63.8 million for ACPS, $22.9 million less than requested, and made
no provision for new construction.
This year is different. The City Manager’s Proposed CIP Budget includes funding for new
construction, although not in as quick a manner as the schools would like. This year’s Proposed
Budget includes an allocation to the Schools in the first six-years of the CIP of $108.3 million.
(This year, the City Manager modified the Schools’ six-year request into a 10-year proposal but,
beginning next year, the ACPS will also adopt a 10-year CIP budget cycle.) That amount is
some $18 million less than the Constrained Resources Request budget and some $30 million less
than the Needs-Based Request budget. The proposed ten-year budget, as modified by the City
Manager, includes total funding of $160.2 million, or $33.2 million more than the six-year
Constrained Budget Request.
Despite the funding differences, it appears to BFAAC that the City and ACPS are working
together to solve the capacity issue. BFAAC believes that ACPS has been creative in its
attempts to solve the issue, most particularly in the creation of pK-8 facility on the Patrick Henry
campus. We are concerned however about the treatment of FF&E expenditures. Last year the
ACPS undertook a facilities study to help them identify building-by-building needs. To the
extent possible given our current financial situation, the City and ACPS should work together to
meet those needs in a timely manner. During the 1990s, ACPS facilities fell into disrepair as the
result of a lack of funding. That situation was remedied after years of significant contributions to
FF&E. BFAAC would not want to see ACPS facilities get to the point where, as the result of
failing to fund routine needs, additional resources would be required in the future.
BFAAC would like to note two areas of increased interest: Potomac Yard and Jefferson
Houston.
Potomac Yard. There is a lot of discussion currently taking place about the future of the
Potomac Yard area. The City and the Schools need to work together on that development
issue, as decisions made in the coming months could dramatically affect the schools for
years to come, especially if it is decided that there will be a sizable residential component
to the development.
Jefferson Houston. Much discussion has taken place about the possibility of creating a
public/private partnership that would both develop the site commercially and allow for
the construction of a new school. BFAAC finds the idea of a partnership intriguing, but
has decided not to comment until more specifics are known.
A final thought on development. Jefferson Houston, as well as the Potomac Yard situation,
highlights the need for the City to finalize its Master Plan. Small area plans are useful when

25
thinking about an area’s development, but the Schools need to look at the same issues from a
City-wide perspective when attempting to determine where Alexandria’s children will live and
what schools will be necessary to accommodate them.
RECOMMENDATIONS
The City and ACPS should continue to work together to solve school capacity issues.
The City should finalize its Master Plan so that the ACPS can incorporate its ideas into
school planning.
The City and ACPS should continue to work together to meet the ACPS’s building-by-
building needs, in particular, FF&E project funding

26
IV. REVENUES AND OUTLOOK
A. Tax Burden Issues
BFAAC has been tracking the percentage of per capita income that goes to pay the residential
real property tax for several years. This measure may be an indication of taxpayers’ ability to
pay. We have observed that on average, Alexandrians have typically paid less than 2.0% of their
income for this tax; we have cautioned against setting rates that would result in tax/personal
income ratios above historic ranges. As shown in the chart below (page 7-7 of City Manager’s
Proposed FY 2011 Budget), after declining in the 1990s when personal income outpaced
appreciation in property values, the ratio began a steep rise in 2001, reflecting a strongly
appreciating real estate market relative to personal income. The ratio has leveled off in the last
five years, with a more constant ratio that is expected to hold into the current year, at slightly
more than 2.0%. This measure should continue to be monitored, particularly in the current
economic environment where personal income may be declining.
Table 4. Residential Real Estate Tax Revenue as a Percent of Per Capita Income
Residential Real Estate Tax Revenue as a Percent of Per Capita Income26
While the above chart is useful in portraying the relative burden of real estate taxes on the
residents of the City, it does not fully reflect the financial burden posed by the City on the
citizenry. This is particularly highlighted in recent years by the segregation of some additional
fees from the real estate tax. The trash collection fee ($300 per residential household), sanitary
26 This chart includes multi-family rental properties, as well as single family, under the assumption that most landlords pass along property taxes
to tenants in the form of higher rents.

27
sewer fees, and the proposed stormwater fee, all once funded as part of the real estate tax, add
significantly (double digit percentages in most cases) to the average tax/fee bill. Personal
property taxes, licenses, and other fees add further to this burden.
We feel the above chart may not provide sufficient historic information. Accordingly, for our FY
2011 report, we are adding the City’s budget chart tracking general fund revenues from local
sources27
as a function of personal income (page 7-6 of City Manager’s Proposed FY 2011
Budget). While we understand that not all local fund revenues are borne by residents (e.g.,
transient lodging), this is one metric which provides insights into the total burden on residents.
For FY 2012, BFAAC would like to work with City staff to develop a metric that tracks this
burden. Perhaps the best way to accomplish this is to track the taxes and fees that fall to property
owners—real estate taxes, sanitary sewer fees, trash fees, personal property taxes, etc. We would
also like to develop a metric for businesses, where the denominator could be gross receipts.
Table 5. General Fund Revenue from Local Sources as a Percentage of Personal Income
RECOMMENDATIONS
The percentage of per capita income that goes to pay the residential real property tax
should continue to be monitored and Council should be especially cautious, particularly
in the current economic environment, in setting tax rates that that would result in ratios
significantly above historic ranges.
If real estate values continue to fall as projected, the real estate tax revenue/per capita
income indicator may prove helpful in setting the tax rate in future years inasmuch as it
is an indication of the taxpayers’ ability to pay.
27 Local sources include everything except intergovernmental revenues (i.e., State funding).
28
As the City continues to add pay-for-use taxes and fees, we believe it will become
increasingly important to develop metrics which track overall City-imposed financial
burdens as a function of personal income and gross receipts.
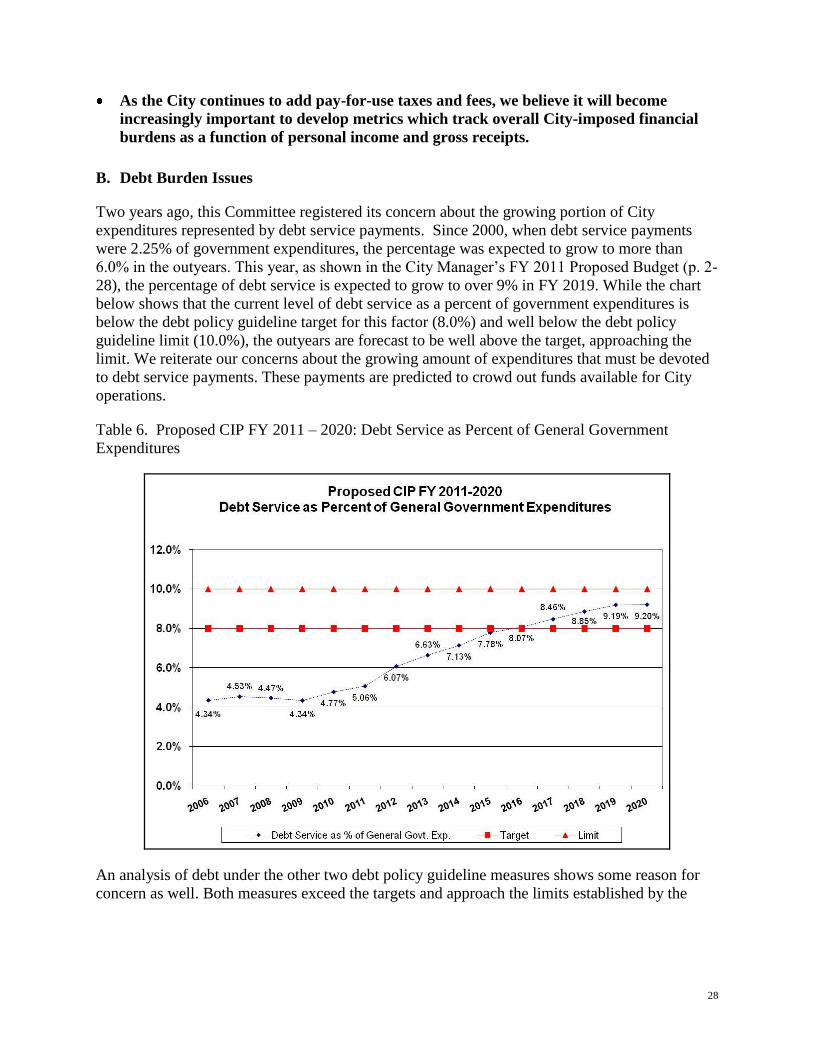
B. Debt Burden Issues
Two years ago, this Committee registered its concern about the growing portion of City
expenditures represented by debt service payments. Since 2000, when debt service payments
were 2.25% of government expenditures, the percentage was expected to grow to more than
6.0% in the outyears. This year, as shown in the City Manager’s FY 2011 Proposed Budget (p. 2-
28), the percentage of debt service is expected to grow to over 9% in FY 2019. While the chart
below shows that the current level of debt service as a percent of government expenditures is
below the debt policy guideline target for this factor (8.0%) and well below the debt policy
guideline limit (10.0%), the outyears are forecast to be well above the target, approaching the
limit. We reiterate our concerns about the growing amount of expenditures that must be devoted
to debt service payments. These payments are predicted to crowd out funds available for City
operations.
Table 6. Proposed CIP FY 2011 – 2020: Debt Service as Percent of General Government
Expenditures
An analysis of debt under the other two debt policy guideline measures shows some reason for
concern as well. Both measures exceed the targets and approach the limits established by the

29
guidelines for debt as a percent of personal income (3.25% target; 4.5% limit)28
and debt as a
percent of real property assessed value (1.1% target; 1.6% limit). These relationships are shown
in the following charts from the Proposed Budget (pages 2-27 and 2-26):
Table 7. Proposed CIP FY 2011 – 2020: Debt as Percent of Personal Income
Table 8. Proposed CIP FY 2011 – 2020: Debt as Percent of Real Property Assessed Value
The City Manager has advised that this level of debt will not have an adverse effect on the City’s
double triple-A bond rating. Nevertheless, we raise a note of caution against borrowing in
28 In accord with recommendations of this Committee, this guideline was recalibrated last year by raising the target and limit from 2.25% and
3.25% respectively. See Memorandum from James K. Hartmann, City Manager, Modification to the City’s Debt Related Financial Policies: Debt Per Capita as a Percent of Per Capita Income, June 18, 2008.
30
excess of the targets, given the effect that increasing debt service has on operating budgets in
future years. At the same time, we understand that the City may wish to take advantage of
favorable conditions for further borrowing (meaning that market interest rates would be lower
for highly-rated bonds in this economic climate) to finance the remaining cost of the police
headquarters facility and any other capital projects appropriate for debt financing. The City
plans to go to the capital markets next June for another round of borrowing for capital projects.
BFAAC observes that as reflected in the proposed FY 2011 budget, the CIP debt as a percent of
real property value is expected to raise and then drop off over the 10-year horizon. However,
incorrect assumptions about real estate development and appreciation could have a significant
effect on this trend, and the measures could remain near—or exceed—the limits. Debt as a
percentage of personal income could also remain at or near the limit if personal incomes do not
soon resume upward trends. Debt service as a function of government expenditures is now
forecast to exceed the target and approach the limit in the outyears; it should be closely
monitored by the City management and Council.
RECOMMENDATIONS
BFAAC believes that the established debt policy guidelines have served as an important
tool for fiscal discipline. Many of the limits of these guidelines are now forecast to be
challenged. We strongly support efforts to remain within all of the guidelines.
Any additional borrowing should be analyzed against the debt policy guidelines.
Current forecasts are now showing debt service payments crowding out operating
budgets.
Borrowing in excess of the targets should be temporary and undertaken only with the
most careful deliberation, and only in circumstances where the projects to be funded
are essential under the strategic goals and result in significant long-term benefits to the
City, or represent the City’s commitment to fulfill a prior obligation, (e.g., Metro).
C. Commercial Real Estate Add-on Tax for Transportation
The General Assembly in its 2007 legislative session passed HB 3202, which enabled Alexandria
(and other jurisdictions in Northern Virginia and Hampton Roads areas) to adopt a differential
real estate tax rate on non-residential commercial property as a source of new local transportation
funding. In the fall of 2007, City Council formed an ad hoc study committee to review the
options and recommend whether to adopt such an ―add-on tax‖ for commercial properties and, if
so, at what rate. 29
The Study Committee, noting Alexandria’s growing transportation needs,
recommended in its 2008 report that Council adopt an add-on tax at the rate of 2-4 cents per
hundred dollars of valuation, that the rate be reviewed annually in the context of existing market
and economic conditions, and that small retailers be afforded special tax relief. 30
Later that year,
29 Resolution No. 2259, November 27, 2007. The Study Committee was composed of five members, including two members of BFAAC. 30 Memorandum from the City Manager to Council, Subject: Report of the Ad Hoc Commercial Real Estate Tax Option Study Committee, March
6, 2008 (the ―Study Committee Report‖).

31
Council advertised a maximum add-on tax rate of $0.02 but decided to set the rate at $0.00 in the
adoption of the FY 2009 budget.
The FY 2011-2020 CIP includes a commercial real estate add-on tax of 3 cents to fund certain
transportation-related projects and Council has advertised a maximum add-on tax at that rate.
Each one cent of add-on tax on commercial real estate is estimated to raise $895,000 in FY 2011
and $447,500 for FY 2010 half year, for a total of just over $4 million that could be raised for
transportation purposes by the end of FY 2011. 31
The City Manager intends that this funding
source, if adopted, would focus on four types of transportation projects for which funds are not
otherwise available: high-capacity transit corridors, peak period bus service, Metro station
improvements, and alternative transportation initiatives. Such projects would include expansion
of DASH bus and trolley service to assist workers and tourists get to and from Alexandria
destinations. 32
Arlington County adopted an add-on tax of 12.5 cents and Fairfax County adopted a tax of 11
cents beginning with their FY 2009 budgets. The current maximum rate established by law is
12.5 cents.
We endorse the adoption of the proposed commercial add-on tax for the following reasons:
This add-on tax for commercial properties would be used solely to fund needed
transportation improvements. These improvements would have the effect of reducing
traffic congestion and boosting the overall business environment to the benefit of
business owners and residents alike, and ultimately producing added revenues for the
City. As noted in the Study Committee Report, the reason behind the creation of this
add-on tax on commercial properties is that transportation improvements benefit
businesses first and foremost in terms of access by employees and customers. 33
As noted by the Alexandria Environmental Commission, the proposed tax would allow at
least partial implementation of projects and programs related to public transportation.
Over the coming years, a strong public transportation system will be increasingly
essential to economic growth, livability and vitality of Alexandria.34
For a number of years, the largest portion of the property tax burden has been shouldered
by residential owners. Between 1984 and 2000, residential and commercial assessments
each accounted for about 50% of the City’s tax base. But residential values began to
increase at a faster pace than commercial values starting in 2000 and today the residential
share is over 57%.35
A small additional tax on commercial properties would serve to
reduce the current imbalance.
Because of the decline in commercial assessments, it is likely that the imposition of a
small add-on tax would not result in larger tax bills for many commercial property
31 Proposed FY 2011 CIP, at 6-102. 32 Proposed FY 2011 CIP, at 6-102 and 6-103; see also Budget Memo #38, April 2, 2010, pp. 1-2. 33 Study Committee Report, at 8. 34 Letter to Mayor William Euille, et al from Scott Barstow, Chair, Environmental Policy Commission re FY 2011 Proposed Budget, March 10,
2010. 35 FY 2011 Proposed Budget, at 7-3.

32
owners and a less than 1% increase overall (less than the proposed percentage increase in
the average residential tax bill).36
An additional 3 cents tax is still substantially lower than the add-ons in our neighboring
jurisdictions (12.5 cents in Arlington; 11 cents in Fairfax) and substantially below the
legal maximum of 12.5 cents.
RECOMMENDATIONS
We support the commercial real estate add-on tax for transportation, provided that the
rate of such a differential tax is determined annually, taking into account current
market and other economic conditions and set to be consistent with the City’s efforts to
attract and retain its commercial tax base. A commercial real estate add-on tax of 3
cents is within the range recommended in the Study Committee Report (2-4 cents) and
would fund needed, economically beneficial transportation improvements.
The City should evaluate and prioritize its long-term transportation capital needs and
identify for funding through this source projects that may readily seen by commercial
real property taxpayers as producing demonstrable, positive economic impacts for the
City.
While, as noted in the Study Committee Report, Alexandria’s overall business tax
burden is low to moderate such that the City is business-competitive, small retailers
that generally operate on a low margin may be less able to absorb added tax costs. If
the add-on tax is adopted, Council should consider providing some tax relief for small
retailers, for example, through adjustments to the business gross receipts tax, as
recommended by the Study Committee. 37
Since the add-on is a new tax, the rate should be determined annually (and could be set
at zero, as it was last year). The amount of revenues collected may well vary from year
to year, thus the City should avoid borrowing against this additional tax.
D. Stormwater Utility Fee
BFAAC is on record as supporting a dedicated, self-sustaining funding source for stormwater
management purposes, akin to the current sanitary user fee.38
Further, BFAAC recognizes that
the City’s stormwater system is a critical infrastructure need that requires additional funding.
In June 2008, City Council authorized the City Manager to appoint a Stormwater Working
Group to, among other things, suggest various funding options for the City’s stormwater
program. The nine-member Working Group, which included two BFAAC members, determined
that there was a significant need for additional resources for the City’s stormwater program and
recommended that a dedicated funding source be established.39
The Working Group identified
36 Budget Memo #38, April 2, 2010, p. 2. 37 Study Committee Report, at 6, 11-13. 38 BFAAC Report on the City Manager’s Proposed Budget for Fiscal Year 2007, p. 14. 39 Preliminary Findings of Stormwater Working Group, January 9, 2009, pp. 1-2.

33
potential options for additional funding for the stormwater program, which included a utility fee,
direct taxation (ad valorem), or a combination.
Utility Fee Approach
The FY 2011 budget includes an option to establish a stormwater utility fee (SWUF) that would
generate an estimated $2.25 million per year when fully operational to cover maintenance and
infrastructure improvement costs of the City’s stormwater system. The annual cost of the
proposed utility fee would average $48 for a single family detached home, $20.64 for a single
family attached home, and $48 per 1,971 square feet of impervious surface for commercial and
multi-family properties. The SWUF option in the proposed budget does not exclude tax-exempt
organizations, such as churches and non-profits, from the fee, although we are advised that the
revenue estimates have been adjusted downward based on an assumption that some credits will
be provided. The FY 2011 CIP budget includes several capital projects totaling about $35
million that would be partly financed by the SWUF: flooding at Hooff’s Run; drainage at
Braddock and West streets; outfall improvements at Commonwealth Avenue and Glebe Road
near Four Mile Run; and West End drainage improvements.40
The major strength of a user fee approach to fund stormwater infrastructure needs is that it more
equitably spreads the cost burden across single family, multi-family, and commercial properties
based on the relative proportion of impervious area located on a property. Single family homes
represent only 23% of the City’s impervious surface, while other properties represent 77%41
However, BFAAC has several concerns with the FY 2011 SWUF concept as currently designed:
The SWUF is not a dedicated, self-sustaining funding source. Rather, this fee would
augment existing operating fund resources for this activity. Under this proposal, funding
―in the operating and capital budgets should remain at current levels, and the stormwater
utility funds should be used to supplement the unmet drainage needs of the City.‖42
Administration of this user fee could be costly and complex, and costs of administration
are unknown. Further, current plans regarding implementation of the SWUF structure are
ambiguous. Adding to the cost concerns under this complex fee structure could be
multiple appeals of SWUF levels from property owners.
Given the current economic environment and concerns about increasing the City’s debt
burden, BFAAC is wary of borrowing against projected SWUF revenue until the user fee
is fully operational.
There has not been adequate education and buy-in for the SWUF among the residential
and business communities. In particular, public materials to date do not provide
sufficient rationale for an SWUF, specifically regarding inherit risks and improvements
needed to aging sewer pipes and the need for increased capacity in the City’s stormwater
system. Furthermore, public materials also do not clearly make the case that the EPA
40 Budget Memo #5, February 26, 2010, p. 4. 41 Budget Memo #16, March 12, 2010, p. 2. 42 Budget Memo #5, February 26, 2010, p. 5.

34
will force the City to repair certain stormwater system problems that pose public health
and safety concerns, without regard to whether new revenue is identified.
Direct Taxation
An alternative to a utility fee approach would be to finance the costs of stormwater sewer
management through an ad valorem tax. As example, Arlington and Fairfax counties currently
charge a real estate property tax of $0.01 per $100 of assessed value to cover the costs of
stormwater management.43
BFAAC believes that this approach is simpler to administer and
would ameliorate concerns about administrative costs and complexity. Also, a real estate tax
add-on would allow home owners to deduct its cost when filing their Federal tax returns.44
However, a real estate tax approach has its downsides as well. It imposes a greater share of the
cost burden on single family versus commercial and multi-family properties despite the latter
have a greater share of the City’s impervious surface, making it a less equitable financing
method. Assuming a real estate property tax rate of 0.7 cents per $100 assessed value (which
would generate the same revenue as the SWUF option), the cost burden on multifamily rental,
retail, and office properties would be reduced by 50% or more relative to the SWUF, whereas the
cost burden for single family detached and attached homes would increase by 4% and 81%,
respectively, relative to an SWUF approach.45
In addition, the concerns raised in points 1, 3, and
4 outlined above still apply if this approach is ultimately adopted.
If a dedicated funding source is established in the FY 2011 budget for the City’s stormwater
program, on balance, BFAAC prefers a utility fee. BFAAC has generally supported a fee-for-
service approach in this type of situation to take pressure off residential taxes via the operating
budget, and instead, charge such costs to direct users. In addition, we have generally been
critical of real property tax set-asides that limit the flexibility of City Council regarding budget
priorities. Given the current imbalance of the property tax burden between commercial and
residential assessments (currently residential property owners account for over 57% of the tax
base, as noted above), a fee approach also seems more equitable. That said, we strongly urge the
following considerations if an SWUF is adopted:
RECOMMENDATIONS
The proposed SWUF should be self-sustaining. The City should begin to align
estimated costs and SWU revenues for any planned stormwater projects such that no
costs for this activity would remain in the operating budget. Further, the City should
ultimately rebase the existing operating budget by the amount of funding currently
used for stormwater management activities.
The City should not adopt or implement a SWUF until a full cost estimate for
administering the fee (including appeals process and public education activities) and an
implementation plan are completed. Given the current economic environment, it is
imperative that the City be assured it has adequate funds to administer this fee.
43 Budget Memo #16, March 12, 2010, p. 1. 44 Id. 45 Budget Memo #16, March 12, 2010, p. 2.

35
Expenditures for projects funded from the SWUF should not be initiated until fee
revenue is in hand in order to avoid increasing the City’s debt burden.
BFAAC cautions against exempting non-profit organizations from a SWUF. Tax-
exempt properties often have a significant amount of impervious area, which is a
leading cause of stormwater run-off. Further, exempting such properties will put more
of the burden from this fee on residential owners.
The City should ensure that a strong, transparent public education campaign is
conducted and adequate time is allotted for this campaign between the adoption and
implementation of an SWUF.
If the City so chooses to adopt a real estate tax in FY 2011 to fund stormwater infrastructure
activities, BFAAC believes the tax rate should be set at a level that does not raise any more
revenue than the utility fee option included in the City Manager’s budget proposal. Further, if
this financing approach is adopted, BFAAC’s concerns above about the tax revenue being self
sustaining, not borrowing against tax revenue until it is realized, and the need for greater public
education should be considered.
E. Increase in Sanitary Sewer Fees
Sanitary sewers in Alexandria are funded by two fees: a sewer connection fee charged to
developers for tying new structures to the system and a usage fee charged to property owners
collected as part of the quarterly water bill. Beginning in 2004, as a result of a review of the
City’s sanitary sewer line maintenance fee charge, the City began implementing a gradual
increase in usage fees until the fee reached $1.00 per 1,000 gallons of water consumption in
2006. BFAAC supported this increase at the time in order to make the sanitary sewer system
self-sustaining, as is the case with other jurisdictions in the region. We supported setting user
fees to be sufficient to cover operating costs, cash capital and debt service, allowing debt
associated with sanitary sewer maintenance to be excluded from the City’s debt ratios. We
projected, however, that fees would likely fall short of this goal in later years and urged that the
fees be reviewed on a timely basis to ensure continuing self-sufficiency. 46
The proposed CIP for FY 2011 indicates that at current levels, the fees are adequate to fully fund
current sanitary sewer operating costs, capital projects and debt service. However, without an
increase in the fee, the City would have to defer certain projects (such as a project to address
Holmes Run infiltration problems) or increase borrowing to fund those projects. 47
The budget
proposes an increase in the usage fee of $0.25 per 1,000 gallons, which would mean an increase
in fees to the typical household from $70 per year to $87.50 per year (or a quarterly increase
from $17.50 to $21.88).
46 BFAAC Report on the City Manager’s Proposed Budget for Fiscal Year 2004, at 6-7. 47 The proposed budget observes that the City will need to plan for capacity-related sewer projects stemming from new development and
population growth but that the sewer connection fees may be a more appropriate method to provide the necessary funds.

36
RECOMMENDATION
BFAAC continues to believe that sanitary sewer usage fees should be set at a level that
provides for self-sufficiency of the system. We interpose no objection to the proposed
increase in order to achieve that objective this year. We observe, however, that a
sanitary sewer master plan is currently under development and additional projects are
likely to be identified. Ideally, the fee structure should be reviewed and determined in
the longer term context of the master plan, and not revisited year-by-year.
F. Economic Development Issues
BFAAC previously recommended that the City Manager assign a qualified economic
development professional to coordinate economic development planning as well as policy
guidance and oversight.48
We are pleased that the position has been filled and that Tom Gates,
Assistant City Manager, has begun work to oversee the City’s economic development efforts, as
well as drive the implementation of the recommendations of the Economic Sustainability Task
Force.
BFAAC previously noted that most of the groups receiving economic development funds from
the City are generally not subject to external performance requirements or measures; instead,
they were using their own performance indicators, which did not appear to have been validated
in many instances.49
As of the FY 2010 budget, $300,000 in contingent funds were allocated
between each of three economic development organizations in the City, the Alexandria
Economic Development Partnership (AEDP), Alexandria Convention and Visitors Association
(ACVA), and Small Business Development Center (SBDC) with the agreement that each
organization would put in place formal performance measures to track the economic
development impact of each organization in the City. We are glad to see the emphasis on getting
performance measures in place and urge the City to complete its review process in order to
release the funds to the organizations that have in fact submitted measurable performance
tracking methods.
In the same year, BFAAC also noted that ―There appears to be considerable duplication of effort
among the groups receiving funds. For example, AEDP, ACVA, Eisenhower Partnership and
WEBA all have marketing functions. ACVA is extending its marketing efforts to neighborhoods
in the City, many of which are already covered by area business associations with their own
marketing activities.‖50
Currently, the Eisenhower Partnership and the WEBA no longer receive
direct funding from the City eliminating any duplication. In addition, the three major economic
development agencies (ACVA, and AEDP and SBDC) have formulated strategic goals, clarified
roles and formalized a referral process to reduce replication of activities.
48 BFAAC Report FY 2010, at 30. 49 BFAAC Report FY 2006, at 12. 50 BFAAC Report FY 2006, at 12-13.

37
RECOMMENDATIONS
We have previously recognized the critical contribution of economic development to the
City’s finances. We continue to urge that economic development efforts be given a very
high priority.
As in our Report for FY 2010,51
we again urge the City to continue to seek a financially
capable developer and promote creative financing options for the redevelopment of
Landmark Mall (which this year has again had a reduction in property value, increased
vacancy rates and an immeasurable loss of revenue in meal and sales tax).
We urge prompt action to complete the Waterfront Plan, consider implementing
recommendations from the King Street Retail Study, and move forward with the
proposed Potomac Yards Area Plan.
We endorse the idea of utilizing Planning and Zoning staff (with costs paid by
developers) at development sites to ease the permitting and other regulatory processes.
51 BFAAC Report FY 2010, at 28.