City Logistics for Sustainability - DSpace
155
KUNGLIGA TEKNISKA HÖGSKOLAN – ΕΘΝΙΚΟ ΜΕΤΣΟΒΙΟ ΠΟΛΥΤΕΧΝΕΙΟ Royal Institute of Technology National Technical University of Athens School of Architecture and the Built Environment School of Civil Engineering Division of Transportation and Logistics Department of Transportation Planning and Engineering City Logistics for Sustainability The Case of Stockholm [Εφοδιαςτική πόλεων και Αειφορία – Η περίπτωςη τησ Στοκχόλμησ] February 2011 Evangelos Maroudas - Tsakyrellis Supervising Professors: Haris N. Koutsopoulos Athanasios Ballis
Transcript of City Logistics for Sustainability - DSpace
KUNGLIGA TEKNISKA HÖGSKOLAN – ΕΘΝΙΚΟ ΜΕΤΣΟΒΙΟ ΠΟΛΥΤΕΧΝΕΙΟ
Royal Institute of Technology National Technical University of Athens
School of Architecture and the Built Environment School of Civil Engineering
Division of Transportation and Logistics Department of Transportation Planning
and Engineering
City Logistics for Sustainability
The Case of Stockholm
[Εφοδιαςτική πόλεων και Αειφορία –
Η περίπτωςη τησ Στοκχόλμησ]
February 2011
Evangelos Maroudas - Tsakyrellis
Supervising Professors:
Haris N. Koutsopoulos
Athanasios Ballis

2
Summary Over the past decades, road freight transport has been constantly growing in vo-
lumes and in proportion to the other modes of transport. This has had grave impacts
on the environment, especially regarding CO2 emissions. Examining opportunities for
taking measures in order to mitigate these impacts on urban level is a rather new
concept, which emerged from the increased sensitivity of urban areas, due to the
large number of people that live there and are exposed to these impacts. Green city
logistics solutions are gaining importance as they focus, not only on mobility, but al-
so to the other two ‘neglected’ sides of city logistics: sustainability and viability.
Stockholm is a city in the frontline of sustainability. The high sensitivity of the local
government and the inhabitants is reflected in the many ambitious environmental
targets that have been set, with most prominent the one to become a fossil-fuel free
city by 2050. However, when it comes to freight transport, the situation is more or
less on the control of private companies, with little public involvement, apart from a
few notable exemptions. There are great possibilities for governmental action on the
direction of sustainable urban freight transport, so that the other environmental tar-
gets can be achieved as well.
The main objective of this thesis is to present green logistics solutions as they have
been or are planned to be implemented in Stockholm and to provide suggestions for
future action, in accordance to the current European policy and based on expe-
riences from other European cities. The aim is to identify and stimulate Stockholm’s
authorities’ level of awareness on urban freight, since it is a common perception that
strong governmental guidance and support can guarantee the success of most green
logistics measures. Private freight transport actors can also find this thesis useful and
adopt initiatives which can also be very beneficial.

3
Forward This thesis is connected with some of the best memories in my life, memories from
the time I spent as an exchange student in Stockholm. It would be risky to mention
exactly how many those memories have been, because it might raise suspicion about
the quality of this thesis, but in the end, I think it is actually a quite complete work
(since I included plenty of Swedish literature, even though I do not speak Swedish) as
well as an interesting one, for it is a vital subject that it is dealing with. A subject that
is certain to draw more attention in the following years.
This thesis owes its existence to the inspiring guidance of both my supervising pro-
fessors, Haris Koutsopoulos from the KTH and Athanasios Ballis from the NTUA. I am
deeply grateful to both of them and I owe them all the knowledge I gained from my
research. The choice of this subject has been in many ways ideal for me compared to
other subjects.
I must also thank my mother, the I.K.Y, the NTUA, the KTH and particularly Eleftheria
Skordalaki and Vasiliki Thoma from the Erasmus office of the NTUA. All of the above
have played a major role in my presence in Sweden. The list of people who have
helped with one or the other way for the writing of this thesis is long but I will try not
to forget anyone: Björn Hugosson from the Environment and Health Administration,
Jan Kristoffersson from Sust, Jonas Eliasson from the Centre for Transport Studies of
KTH, Erik Freudenthal from the Glashusett in Hammarby Sjöstad and Kag Troedson
and his son from Home2You, who all showed great interest in my effort, answered
my questions and provided me with valuable material for my research; Bibby, Ary,
Todor, Haneen and the rest of the people working at the Transport and Logistics Di-
vision, who made my presence there feel very comfortable and pleasant; I have to
thank the guys behind Google Translator for this tool that covers our ignorance so
elegantly; this thesis owes also a lot to señora Ines Sandoval, Simon Wrang and
Christina Leitner.
Finally, I want to thank God for this wonderful gift that is called Life.

4
Table of Contents
Summary _______________________________________________________________ 2
Forward ________________________________________________________________ 3
List of Figures ____________________________________________________________ 7
List of Tables ____________________________________________________________ 8
1. Introduction _______________________________________________________ 9
1.1. Background __________________________________________________________ 9
1.2. Freight transport in Stockholm _________________________________________ 12
1.3. Objectives __________________________________________________________ 13
1.4. Structure of the thesis ________________________________________________ 13
2. Literature Review __________________________________________________ 16
2.1. European Union Policy on Green City Logistics _____________________________ 17
2.1.1. Papers and communications __________________________________________ 17
2.1.2. Incentives and initiatives ____________________________________________ 21
3. City Logistics Solutions from European cities ____________________________ 25
3.1. Introduction ________________________________________________________ 25
3.2. Freight Platforms – Urban Consolidation Centres (UCCs) _____________________ 28
3.2.1 Solution Description _______________________________________________________ 28
3.2.2. London Construction Consolidation Centre (LCCC) – Construction Logistics Plans (CLPs) 31
3.2.3. City Logistik in Kassel, Germany – An abandoned project _________________________ 34
3.2.4. Discussion _______________________________________________________________ 35
3.3. Public Private Partnerships (PPP) _______________________________________ 37
3.3.1. Solution Description_______________________________________________________ 37
3.3.2. Freight Quality Partnerships (FQP) in the United Kingdom ________________________ 38
3.3.3. Nearby delivery area (ELP) in Bordeaux _______________________________________ 40
3.3.4. Discussion _______________________________________________________________ 42
3.4. Night Deliveries _____________________________________________________ 43
3.4.1. Solution Description_______________________________________________________ 43
3.4.2. Quiet Night-time Deliveries in Barcelona ______________________________________ 45
3.4.3. The PIEK project in the Netherlands __________________________________________ 46
3.4.4. Other cities ______________________________________________________________ 48
3.4.5. Discussion _______________________________________________________________ 48
3.5. Road Pricing Systems _________________________________________________ 50
3.5.1. Solution Description_______________________________________________________ 50
3.5.2. Congestion Charging in London ______________________________________________ 52
3.5.3. Other Cities _____________________________________________________________ 54
3.5.4. Discussion _______________________________________________________________ 54
3.6. Technological Solutions _______________________________________________ 56

5
3.6.1. Intelligent Transportation Systems (ITS) _______________________________________ 56
3.6.2. Environmentally-Friendly Vehicles (EFVs) ______________________________________ 59
3.6.3. Discussion _______________________________________________________________ 61
4. Case Study: Stockholm ______________________________________________ 64
4.1. Introduction – A city in the front line of sustainability _______________________ 64
Overview_____________________________________________________________________ 64
The Green City ________________________________________________________________ 65
International Programmes _______________________________________________________ 67
Road freight transport in Sweden: policy and facts ___________________________________ 72
Green logistics strategies in Stockholm _____________________________________________ 75
Swedish Transport Authorities and Organisations ____________________________________ 79
4.2. Logistics Strategies on city-level ________________________________________ 81
4.2.1. The Environmental Zone _____________________________________________ 81
Introduction __________________________________________________________________ 81
Project Development ___________________________________________________________ 82
The Environmental Zone Rules ___________________________________________________ 84
Changes in the Heavy-duty Vehicle Fleet ___________________________________________ 85
Environmental Impact __________________________________________________________ 87
Conclusions ___________________________________________________________________ 91
4.2.2. The Congestion Charging System ______________________________________ 92
Introduction __________________________________________________________________ 92
Project Description _____________________________________________________________ 93
Exemptions from the Congestion Charge ___________________________________________ 94
The Technical System ___________________________________________________________ 95
Traffic Effects _________________________________________________________________ 97
Effects on Commercial Transport ________________________________________________ 100
Opportunities for Evening Distribution ____________________________________________ 103
Environmental effects _________________________________________________________ 104
Conclusions __________________________________________________________________ 105
4.3 Logistics Strategies on district-level _____________________________________ 106
4.3.1. Hammarby Sjöstad – Logistics Centres in a new urban area ________________ 106
Introduction _________________________________________________________________ 106
4.3.1.1. Construction Consolidation Centre (CCC) ___________________________________ 108
Environmental Impact _________________________________________________________ 111
Economic aspects, costs-benefits ________________________________________________ 114
Conclusions __________________________________________________________________ 116
4.3.1.2. Logistics Centre for e-commerce __________________________________________ 116
Conclusions __________________________________________________________________ 119
4.3.2. Gamla Stan – A Logistics Centre for the Old Town _______________________ 120
Introduction _________________________________________________________________ 120
Project Description ____________________________________________________________ 120
Many obstacles appeared on the way_____________________________________________ 122
Financial Aspects _____________________________________________________________ 124
Estimated Results _____________________________________________________________ 125
Conclusions __________________________________________________________________ 126

6
4.3.3. Norra Djurgården – Possibilities for coordinated transport and ITS solutions __ 128
Introduction _________________________________________________________________ 128
Project TransOpt _____________________________________________________________ 130
Possibilities for coordinated distributions__________________________________________ 133
ITS solutions _________________________________________________________________ 136
Cost-benefit analysis __________________________________________________________ 137
Environmental Impact _________________________________________________________ 138
Other benefits _______________________________________________________________ 139
Conclusions __________________________________________________________________ 139
5. Conclusions ______________________________________________________ 140
6. Recommendations ________________________________________________ 144
6.1. A sustainable urban freight transport policy for Stockholm _________________ 144
6.2. Consolidation of goods_______________________________________________ 145
6.3. Other suggestions ___________________________________________________ 146
7. List of References _________________________________________________ 148

7
List of Figures Figure Title Page
1 Single-company and multi-company platform (Karrer & Ruesch, 2007) 29 2 The London Construction Consolidation Centre (TfL, 2009) 31 3 Equipment used at the ELP (Niches, 2007c) 40 4 Espaces de livraison de proximité (ELP) Bordeaux (Ruesch & Patz, 2008) 41 5 Quiet night-time unloading using adapted 40T truck at Mercadona’s Valen-
cia St. outlet (MIRACLES, 2006)
45 6 The extended central London congestion charging zone (TfL, 2008) 52 7 Concept for a virtual distribution centre with single projects (Karrer et al,
2007)
58 8 Scania’s first ethanol truck which came out in 2008 (SCANIA, 2010) 60 9 Stockholm’s location and overview (by author) 64
10 View of the city of Stockholm (Flickr, 2010) 65 11 Trendsetter activities on the map of Stockholm (Civitas Trendsetter, 2006b) 70 12 The rejected proposal of Hugosson and Sunnerstedt (2008) 77 13 Information flows to and from the Traffic Management Centre (Trafik
Stockholm, 2010)
78 14 Overview of the Environmental Zone of Stockholm (Trafikkontoret, 2008) 82 15 Compliance levels in Stockholm’s Environmental Zone (Trafikkontoret, 2008) 85 16 The average age for heavy diesel vehicles in traffic between 1996 and 2007
(Trafikkontoret, 2008)
86 17 Percentage of newly registered heavy-duty diesel vehicles from 1996 to
2007 (Trafikkontoret, 2008)
87 18 Emissions of Hydrocarbon from heavy trucks in the Environmental Zone in
2007 (Trafikkontoret, 2008)
89 19 Emissions of nitrogen oxides (NOx) from heavy trucks in the Environmental
Zone in 2007 (Trafikkontoret, 2008)
89 20 Emissions of particulate matter from heavy trucks in the Environmental
Zone in 2007 (Trafikkontoret, 2008)
90 21 The Congestion Charging area and checkpoints (Transportstyrelsen, 2010) 92
22 Roadside equipment (Transportstyrelsen, 2010) 96
23 Average number of vehicle passages across the congestion tax cordon be-
tween 06:00 and 19:00 (Eliasson, 2008).
98
24 Average travel time increase over free-flow travel times for various catego-
ries of links, April and October 2005-2007 (Eliasson, 2008)
99
25 Freight deliveries in the inner city during the day. (Transek AB, 2006b) 101
26 Direct road-user effect for personal, commercial and business travel in SEKm/year (Transek AB, 2006c)
102
27 Location and overview of Hammarby Sjöstad (Poldermans, 2005) 106
28 The Hammarby Model (Hammarby Sjöstad, 2010) 107
29 The Construction Consolidation Centre in Hammarby Sjöstad (Brisvall, 2002) 109
30 Traffic guidance with smart traffic signs (Brisvall, 2002) 110
31 Noise levels for the Hammarby CCC (Brisvall, 2002) 112 32 Annual vehicle kilometres in the area. (Brisvall, 2002) 113
33 Total number of vehicles in the area. (Brisvall, 2002) 113
34 Emissions of CO2 in the three possible scenarios (Brisvall, 2002) 114
35 Emissions of PM in the three possible scenarios (Brisvall, 2002) 114

8
36 Energy use in the three possible scenarios (Brisvall, 2002) 114 37 Emissions of NOx in the three possible scenarios (Brisvall, 2002) 114 38 The Old Town (Gamla Stan) and the location of “O-Centralen” (by author) 121
39 The biogas vehicle with decals that show suppliers and customers (Civitas Trendsetter, 2006a)
123
40 Deliveries with the biogas van in the Old Town (Civitas Trendsetter, 2010) 125
41 Overview of the development area (Stadsbyggnadskontoret website) 128
42 The vision for Norra Djurgården (Stockholm Stad, 2010a) 129
43 Forecast of apartments constructions in Hjorthagen/Värtan (Kristoffersson, 2010)
131
44 Forecast of retail/offices constructions in Hjorthagen/Värtan (Kristoffersson, 2010)
131
45 Forecast of total number of shipments, construction- and commerce-related (Kristoffersson et al, 2010)
132
46 Possible terminal locations (Kristoffersson et al, 2010) 135
List of Tables Table Title Page
1 Impacts of logistics systems (UK Roundtable on Sustainable Development, 1996)
10
2 Paradoxes of Green Logistics (Rodrigue et al, 2001) 11
3 Objectives and approaches for urban freight transport (Allen et al, 2007) 26
4 Classification of Measures in Action Fields used in this thesis (by author) 27
5 Examples of work undertaken by London’s FQPs (TfL, 2007a) 40
6 Examples of alternative fuels to diesel (Sathaye et al. 2006) 60
7 Total registered trucks in traffic for different fuels (Trafikkontoret, 2008) 86
8 Emissions for diesel engines according to European standards [g/kW4] (Tra-fikkontoret, 2008)
87
9 Tax amount per vehicle crossing (Transportstyrelsen, 2010) 94
10 The measures with Trendsetter Common Indicators and WP Common Indica-tors used in the evaluation (Civitas Trendsetter, 2006a)
111
11 Assumptions for calculations (Civitas Trendsetter, 2006a) 125
12 The indicators used in the TRENDSETTER evaluation for the Old Town area (Civitas Trendsetter, 2006a)
126

9
1. Introduction
1.1. Background Freight transport is vital for the structure of modern societies and absolutely essen-
tial for preserving our modern way of life. It ensures the flow of goods from produc-
tion points to distribution points, making them accessible to consumers. Freight
transport is even more vital when it comes to cities, because cities, by definition, are
places where none of the primarily essential goods is produced. On the contrary, ci-
ties present the highest demand in consumable goods, due to the large number of
people that live there.
In fact, the cities’ population has been increasing constantly over time, and in Europe
it is expected to rise from 72% in 2006 to 84% of the total population in 2050. There-
fore, considering the simultaneous increase of the global (and thus, the European)
population, one can realise the increased significance of an efficient and effective
freight transport system for the future societies.
The efficiency of freight transport lies on the function of Logistics. The term ‘Logis-
tics’ refers to the “planning, organisation, management, execution and control of
freight transport operations. It integrates individual transport acts to door-to-door
supply chains” (European Commission, 2010a). Logistics usually focuses on minimiz-
ing shipper costs, with little consideration of social costs such as congestion or pollu-
tion impacts. Taniguchi et al (2001) defined ‘City logistics’ as “the process for totally
optimizing the logistics and transport activities by private companies with support of
advanced information systems in urban areas considering the traffic environment,
the traffic congestion and energy consumption, the traffic safety and the energy sav-
ings within the framework of a market economy”.
However, the continuous growth of freight transport (and especially the road mode)
aggravates its significant negative impacts on society and the environment. In cities,
millions of people live and work in close vicinity with the road network, being largely
exposed to the effects of road traffic. The growth of logistics activities implies an in-
crease of their many negative effects. The U.K. Round Table on Sustainable Devel-
opment has summarized these negative effects in Table 1.
Transport currently depends by 97% on fossil fuels. Unfortunately, diesel combustion
products can cause significant negative impacts on regional level. Gaseous compo-
nents of diesel exhaust include carbon dioxide (CO2), oxygen (O2), water vapor, ni-
trogen (N2), carbon monoxide (CO), nitrogen compounds, sulfur compounds and
low-molecular-weight hydrocarbons. Particulate matter (PM) released includes a

10
central core of elemental carbon, absorbed organic compounds, as well as small
amounts of sulfate, nitrate, metals and other trace elements (Sathaye et al, 2006).
Nitrogen oxides (NOx) and particulate matter (PM) tend to be the greatest concern,
as they are related to a number of health-effects, such as irritation, neurophysiologic
dysfunction, respiratory problems and even lung cancer. The combination of NOx
with volatile organic compounds (VOC) and sunlight can cause the formation of pho-
tochemical smog, which affects the air quality of many urban areas. In addition nitric
acid (HNO3) can cause paint deterioration, corrosion, degradation of buildings, and
damage to agricultural crops.
CO2 is a greenhouse gas (GHG) which has been found responsible for climate change.
Global climate change is expected to severely affect the hydrological cycle, increase
average temperatures, accelerate the melting of the ice in arctic areas and raise the
sea level, literally changing the face of the earth. Road transport (passenger and
freight) is a major contributor of CO2 emissions (16.3% of the total CO2 emissions in
Europe in 2006). Especially in cities, urban freight transport accounts for 21% of the
CO2 emissions, while transiting heavy goods vehicles add another 10% of the CO2
emissions (European Commission, 2007b).
Older heavy goods vehicles fitted with air conditioners and refrigerators may also
release chloro-fluorocarbons (CFCs), which cause stratospheric O3 depletion, thus
increasing the amount of harmful ultra-violet radiation penetrating the earth’s at-
mosphere.
Economic Impacts 1. Traffic Congestion 2. Resource Waste
Ecological Impacts 1. Greenhouse Gases cause Climate Change 2. The use of non-renewable fossil fuel 3. The effects of waste products such as tires and oil 4. Ecosystem destruction and species extinction
Social Impacts 1. Negative Public Health Impacts of Pollution 2. Crop Destruction 3. Injuries and deaths resulting from traffic accidents 4. Noise 5. Visual intrusion 6. Congestion deterring passenger travel 7. Loss of Greenfield sites and open spaces 8. Deterioration of buildings/infrastructure
Table 1: Impacts of logistics systems (UK Roundtable on Sustainable Development, 1996)

11
Since the early 1990s, there has been growing interest in reducing the negative im-
pacts of logistics and making them “greener”. However, Rodrigue et al. (2001)
showed that there are basic inconsistencies between the goals and objectives of lo-
gistics and “greenness”. The cost-saving strategies followed by logistics operators are
often at variance with the environment since they usually externalize the environ-
mental costs. This means that the benefits of logistics are realised by the users, but
the environment assumes a wide variety of burdens and costs. Furthermore, logis-
tical activities do not usually pay the full costs of using the infrastructures. As a re-
sult, logistical operators use the most polluting, least energy efficient and most infra-
structure-intensive transportation modes to increase the speed of distribution.
Table 2 summarizes the major characteristics of these conflicts. The “Outcomes”
column lists the positive effects on the logistics companies and the “Paradox” col-
umn the negative effects on society.
Dimension Outcome Paradox
Costs Reduction of costs through improvement in packaging and reduction of wastes. Ben-efits are derived by the dis-tributors.
Environmental costs are often externalized.
Time/Flexibility Integrated supply chains. JIT and DTD provide flexible and efficient physical distribution systems.
Extended production, distribu-tion and retailing structures con-suming more space, more ener-gy, and producing more emis-sions.
Network Increasing system-wide effi-ciency of the distribution sys-tem through network changes (Hub-and-spoke structure).
Concentration of environmental impacts next to major hubs and along corridors. Pressure on lo-cal communities.
Reliability Reliable and on-time distribu-tion of freight and passengers.
Modes used, trucking and air transportation are the least en-vironmentally efficient.
Warehousing Reducing the needs for private warehousing facilities.
Inventory shifted in part to pub-lic roads (or in containers), con-tributing to congestion and space consumption.
E-commerce Increased business opportuni-ties and diversification of the supply chains.
Changes in physical distribution systems towards higher levels of energy consumption.
Table 2: Paradoxes of Green Logistics (Rodrigue et al, 2001)
Rodrigue et al (2001) also refer to reverse logistics, as this field was the first trend to
“greenness” beginning in the early 1990s. They observe that this trend was mainly

12
developed as a marketing opportunity and only when there were notable financial
benefits for the companies involved. They even go one step further to argue that re-
verse logistics might even be adding further to the traffic load.
However, many countries have been urged to take measures and implement green
logistics solutions which faced the problem at various levels. The European Commis-
sion also included freight transport in its Action Plans and Papers and promoted best
practices through innovative projects, funded by four Framework Programmes (FP4,
FP5, FP6 and FP7). The European Commission advises authorities to create the ap-
propriate framework conditions and to keep logistics on the political agenda. More-
over, it is increasingly perceived that, although individual green logistics solutions
can be very beneficial, an integrated plan resulting in a package of measures, is the
recommended way to deal with such a complex issue. European cities are just start-
ing to elaborate freight transport plans in this way, focusing not only in mobility, but
also in sustainability and livability.
However, on city level, there is the following difficulty: “cities are often too small for
freight transport planning, since freight transport in one city area is only a part of a
supply chain that includes line haul transport between cities or even between coun-
tries. Therefore, urban freight transport planning in a city should be harmonised with
other adjacent cities (…) Such an institutional framework in a wider area for urban
freight transport planning is essential for sustainable development of urban areas”
(Taniguchi et al, 2003).
1.2. Freight transport in Stockholm Stockholm has set the ambitious goal of becoming a fossil-fuel free city by 2050. CO2
emissions per capita have already been reduced by 25% compared to the levels of
1990. But the city has to face the same growth in freight transport demand as every
European city. Åkerman and Höjer (2006) showed that if the current transport and
technology trends do not change, the estimated energy use per capita will be twice
as high as the target levels for 2050. The goal can only be achieved by an integrated
and complete policy for freight transport, which still does not exist. However, some
important steps have been made in recent years, providing knowledge and expe-
rience from different areas of freight transport, as well as improving relations and
communication between stakeholders.
Stockholm has been leading the way on the field of clean vehicles since 1994. It was
also one of the first cities in the world (together with two other Swedish cities) to
introduce an environmental zone for heavy goods vehicles in 1996. This had a great
impact on the quality of the trucks that drive in the city today, which reflects on the
emissions of pollutants. Furthermore, the Congestion Charging System, which was

13
tested in 2006 and implemented permanently in 2007, has successfully reduced traf-
fic congestion levels by 18%. Road pricing can be an effective tool to manage urban
freight traffic, but the City has not expressed interest in this direction so far.
The city’s participation in some important European programmes provided expe-
rience, cooperation with other cities, funds for innovative logistics solutions and al-
so, enhanced the city’s reputation of being truly environmentally sensitive.
However, to what freight transport is concerned, Stockholm lacks public initiatives
that will promote best practices in the future and is characterized by liberalization of
the freight transport sector. Private companies may be improving their environmen-
tal profile, but this is done mainly for marketing reasons, usually when it is related to
some profit. On the public side, there are many authorities involved, and often se-
rious communication problems appear. Moreover, there is significant lack of freight
traffic data.
1.3. Objectives The main objective of this thesis is to present green logistics solutions as they have
been or are planned to be implemented in Stockholm and to provide suggestions for
future directions, in accordance to the current European policy and based on expe-
riences from other European cities. The aim is to identify and stimulate Stockholm’s
authorities’ level of awareness on urban freight, since it is a common perception that
strong governmental guidance and support can guarantee the success of most green
logistics measures.
1.4. Structure of the thesis The first step of this research (Chapter 2.1) was to review the current European poli-
cy on city logistics, as it has been formed during the past 10 years. As the demand for
freight transport continued growing, accompanied by its various negative impacts,
particularly in the sensitive urban areas, an increasing number of Papers and Com-
munications from the European Commission have been including the urban scale of
logistics into their fields of interest and action. At the same time, several projects
were funded in order to promote best practices and the exchange of information
between European cities, creating an expanding network of actors willing to partici-
pate in further developments and increasing awareness among city authorities. The
most prominent of these projects are listed here, beginning with the most significant
and recent ones.

14
Secondly (Chapter 3), this research addressed a number of interesting green city lo-
gistics solutions, as they emerge from existing literature and the various European
projects which tested them. The intention was not to include all the possible meas-
ures, but to cover a wide range of action fields, namely: distribution strategies, ad-
ministrative solutions, schedule management solutions, pricing strategies and tech-
nological solutions. Specific examples were provided for each of these fields, from
successful (or even unsuccessful) implementations in European cities. Literature and
website references are also provided for further information.
The next step (Chapter 4) focused on the city of Stockholm. Based on literature and
web research, but also on personal interviews with people from the City of Stock-
holm and Sustainable Innovation (SUST), five different green logistics schemes were
selected and presented here, ranging from 1996 to the present (including one study
for a future scheme). They are classified by the size of the area involved into two
categories: (a) strategies on city-level and (b) strategies on district-level. The first
category includes two measures whose driving forces have been public initiatives:
the Environmental Zone and the Congestion Charging System. The second category
reviews the cases of logistic centres serving three different districts of Stockholm
(Hammarby Sjöstad, Gamla Stan and Norra Djurgården), with different levels of pub-
lic actor’s involvement.
For each of the above cases, there is a general description, followed by details of its
impact on road traffic (and particularly on commercial traffic), a discussion on eco-
nomic aspects and a review of its estimated environmental impacts. Finally, each
case study provides conclusions concerning the city authorities’ interest and partici-
pation and other issues related to the rest of the freight transport actors.
Chapter 5 sums up the conclusions drawn from this research. There is an evaluation
of the authorities’ attitude concerning logistics and a comparison to the EU policy on
urban freight transport, but also to the environmental targets set by the City of
Stockholm. Some other interesting points for discussion that were yielded during this
research are also presented here.
Finally, the recommendations for further action are presented in Chapter 6, based
on the conclusions presented on the previous chapter, in accordance to the green
logistics solutions discussed in Chapter 4 and the EU policy as presented in Chapter
3. A specific section is dedicated to Logistics Centres, due to the multiple benefits
related to this measure.
This research did not include interviews with private companies that operate in the
Stockholm area. This is an important field that can fill some of the existing know-
ledge gaps. Another issue that needs further investigation is the Swedish legislation
and the implications it might cause to the implementation of various measures. One

15
barrier for the author has been the Swedish language. Finally, the fertile field of re-
verse logistics provides wide opportunities for applications and research, but has al-
so been left out of this thesis. All the above fields are recommendable for further
research.
All the statistics and charts presented in this thesis have been found in official docu-
ments (which are always mentioned) and are considered as reliable by the author.
The author cannot be held responsible for possible inaccuracies that might be re-
lated to these statistics.
16
2. Literature Review
This thesis is based mainly on literature research from a variety of sources. The first
step included extended research for scientific articles in databases such as Inspec
and Compendex. A number of urban freight transport related terms were used, both
Thesaurus and non-Thesaurus ones. Secondly, there was an extended research in the
websites of various European projects and Freight Transport related pages. Thirdly,
personal interviews were held with people from the City of Stockholm, Sustainable
Innovation, Home2You and KTH.
An important research institute for city logistics has been created by Taniguchi and
Thomson (Institute of City Logistics, 2010), with important contribution in literature,
mainly by publishing the Proceedings of the several “International Conferences on
City Logistics” (e.g. Taniguchi et al, 2003). Those publications cover various aspects of
the subject, including modelling tools, logistics systems planning tools, route plan-
ning tools, organisational and administrative issues etc. The authors pointed out the
three pillars that should run through city logistics activities: mobility, sustainability
and viability. Another important contribution is also the widely acknowledged defini-
tion of city logistics that the authors provided (Taniguchi et al, 2001).
Most of the European Commission’s papers and communications can be found on
the official website for Transport (European Commission, 2010b), as well as other
information material, such as leaflets ad brochures. Details about policy issues can
be found at Europa (2010).
The website of BESTUFS (2010) is a great source of material related to Best Practices
on city logistics in Europe. It includes references to a wide list of city logistics
projects, presentations from the numerous Workshops, Conferences and Round-
tables, and, above all, the updated Best Practice Handbooks for the most important
fields like Freight Platforms, Road Pricing, ITS, Public Private Partnerships, etc. The
“Good Practice Guide on Urban Freight Transport” (Allen et al, 2007) has also been a
very useful guide for the author.
The website of the Civitas project (Civitas, 2010) is of similar significance with the
above, presenting a great variety of case studies from 61 European cities that parti-
cipated in 13 Civitas projects from 2002 to 2012. The various Project Reports contain
valuable information for every city and measure, like for example the Trendsetter
Evaluation report for the city of Stockholm (Civitas Trendsetter, 2006b).
The “Policy Notes” of the NICHES project have also been used by the author (NICHES,
2007a, 2007b), while a series of useful documents can be found at the City Transport

17
and Logistics Network of the Øresund Ecomobility Centre (Oresund, 2010) and at the
British website “Freight Best Practice” (Freight Best Practice, 2010).
Another source for case studies that was proved to be useful is the review of Gero-
liminis and Daganzo (2005). Russo and Comi (2010) provide an interesting way of
classification of city logistics measures and their impacts. Rodrigue et al (2001)
presents the “Paradoxes of Green Logistics” in a comprehensive way, while contains
some useful issues for consideration. Sathaye et al (2006) provides a thorough eval-
uation of the “externalities” of city logistics.
Many studies and reports about logistics in Stockholm have been published by the
former Swedish Road Administration (Vägverket, 2008, 2009), Transek AB (2006a,
2006b), Trafikkontoret (2008, 2010), Miljömiljarden (2006), City of Stockholm (2003).
Reports concerning freight statistics in Stockholm have been issued by Trafikanalys
(2010a, 2010b) and SIKA Statistik (2005, 2009).
More information on recommended literature can be found in the relative sections
of the book. Very valuable contributions to the author’s sources have been made by
Björn Hugosson, Jan Kristoffersson, Jonas Eliasson and Erik Freudenthal.
2.1. European Union Policy on Green City Logistics
2.1.1. Papers and communications European transport policy has been characterized by liberalization and harmoniza-
tion over the years. There has been a growing number of communications and pa-
pers issued by the European Commission on the subject of urban mobility, as the
negative effects of urban transport and logistics become more and more evident.
The subsidiarity principle does not allow the European Union to use regulation as a
means of imposing measures and solutions on towns and cities. The responsibility
for urban transport lies mainly with the national and local authorities, confining the
Commission to taking initiatives to encourage the use of diversified energy in trans-
port, including regulatory initiatives, and to promote good practice. However, coop-
eration at EU level can help urban authorities in making their transport systems
more sustainable. There is a range of activities and fields where the EU can set ex-
amples and continue to promote and support demonstration projects and the ex-
change of best practices. Moreover, the EU can provide a framework in which it will
be easier for local authorities to take measures.

18
From a slow start, the European Union’s transport policy has developed rapidly over
the past 20 years. The objectives of the European transport policy, from the trans-
port White Paper of 1992 via the White Paper of 2001 and in anticipation of the
White Paper of 2010, consist in helping provide Europeans with efficient, effective
transportation systems that:
Offer a high level of mobility to people and business throughout the Union.
The availability of affordable and high quality transport solutions contributes
vitally to achieving the free flow of people, goods and services, to improving
social and economic cohesion, and to ensuring the competitiveness of Euro-
pean industry.
Protect the environment, ensure energy security, promote minimum labour
standards for the sector and protect the passenger and the citizen.
Innovate in support of the first two aims of mobility and protection by in-
creasing the efficiency and sustainability of the growing transport sector. EU
policies develop and bring to market innovative solutions that are energy ef-
ficient or use alternative energy sources or support large intelligent transport
projects such as Galileo.
Connect internationally, projecting the Union’s policies to reinforce sustaina-
ble mobility, protection and innovation, by participating in the international
organizations. It is aimed that the role of the EU as a world leader in sustain-
able transport solutions, industries, equipment and services, shall be even
better recognized.
The 2001 White Paper identified as main challenges the imbalance in the develop-
ment of the different transport modes, congestion on routes and cities, as well as in
airspace, and the impact on the environment. The White Paper proposed policies to
eliminate bottlenecks in the trans-European networks (TEN) and to reduce the num-
ber of road accidents. It called for an effective policy on infrastructure charging and
it argued that the Community should strengthen its position in international organi-
zations. It should be noticed that the White Paper expected a strong economic
growth which was never materialized though.
The White Paper highlighted three main measures related to urban transport (Euro-
pean Commission, 2001):
Support for pioneering towns and cities, with each Member State remaining
responsible for coming up with national plans;
Increased use of clean vehicles and of forms of public transport accessible to
all users including people with reduced mobility;
Identification and dissemination of best urban transport system practices, in-
cluding urban and regional rail services, and best practice in management of
the relevant infrastructure.

19
The market introduction of alternative motor fuels was also supported, with pro-
posed measures such as favorable tax treatment for the use of bio-fuels, natural gas
and hydrogen.
In 2006 there was a mid-term review of the White Paper, redirecting its objectives
according to the contemporary evolutions in global transport. Concerning transport
logistics, the review reports that “industry has taken up the challenge of using exist-
ing infrastructure and vehicles more efficiently by developing sophisticated logistics
chains. Advanced information and communication technologies enable their imple-
mentation and deliver the services needed to make intelligent logistics a reality. The
trend towards integrated logistics companies needs to be matched by public policies
enabling the optimal use and combination (“co-modality”) of different modes of
transport. This may include action to remove regulatory obstacles to co-modality, to
stimulate learning and the exchange of best practices throughout the EU, to pro-
mote standardization and interoperability across modes and to invest in transship-
ment hubs. Adapting dimensions of containers and vehicles to meet the needs of
intelligent logistics will be part of these considerations” (European Commission,
2006a). The action proposed was to develop a framework strategy for freight trans-
port logistics in Europe, followed by broad consultation and leading to an action
plan.
The mid-term review was followed by a Communication of the Commission under
the title “Freight Transport Logistics in Europe - the key to sustainable mobility” (Eu-
ropean Commission, 2006b), which recognized the need for optimization by means
of advanced logistics solutions. The Communication was followed by extensive con-
sultations with stakeholders and led to the “Freight Transport Logistics Action Plan”
of 2007 (European Commission, 2007a).
The Action Plan paid separate attention to urban freight transport logistics and iden-
tified factors as land use planning, environmental considerations and traffic man-
agement to be the most significant. Three separate measures were proposed, con-
cerning urban freight transport:
The issue of an Urban Transport Action Plan to encourage the exchange of
experiences on urban areas to establish a set of recommendations, best prac-
tice, indicators or standards for urban transport logistics, including freight de-
liveries and delivery vehicles. The deadline was set for 2008.
The reinforcement of the freight part of CIVITAS towards better co-ordination
or integration between passenger and freight transport, between interurban
(long-distance) and urban transport logistics. The option of an integrated “CI-
VITAS Freight” was viewed. The deadline was set for 2010.
To make recommendations of commonly agreed benchmarks or performance
indicators to measure efficiency and sustainability of delivery and terminals

20
and, more generally, in urban transport logistics and planning. The deadline
was set by 2011.
In September 2007 the Commission issued the Green Paper “Towards a new culture
for urban mobility” (European Commission, 2007b). Among others, there was men-
tioned that any urban mobility policy must cover both passenger and freight trans-
port. Efficient interfaces between long-haul transport and short distance distribution
to the final destination are required. Planning and technical measures are recognized
as the main instruments for reducing the negative impacts of long distance freight
transport passing through urban areas.
The Paper pointed out that urban freight distribution could be better integrated
within local policy-making and institutional settings. While public passenger trans-
port is usually supervised by the competent administrative body, freight transport
distribution is normally a task for the private sector. It is necessary for local authori-
ties to consider all urban logistics related to passenger and freight transport togeth-
er, as a single logistics system.
The “Action Plan on Urban Mobility” came out on September 2009, following the
consultations of stakeholders after the above Green Paper (European Commission,
2009b). Action 19 focuses on urban freight transport and consists on optimizing ur-
ban logistics efficiency by improving the links between long-distance, inter-urban
and urban freight transport, aiming to ensure efficient ‘last mile’ delivery. The inten-
tion is to focus on how to better incorporate freight transport in local policies and
plans and how to better manage and monitor transport flows.
The recent communication ‘A sustainable future for transport’ identifies policy op-
tions to be tested and eventually included in the next White Paper of 2010 (Euro-
pean Commission, 2009a). Among other policy objectives, the communication con-
siders the improved exploitation of the transport network’s capacity and of each
mode as a tool to reduce congestion, emissions, pollution and accidents. This re-
quires the optimization and operation of the network as a single entity, whereas cur-
rently modal networks are largely separated. Even within modes there is lack of in-
tegration between countries. Particularly concerning freight transport, the goal is the
realization of an intelligent and integrated logistics system, where development of
ports and intermodal terminals is a key element.
Currently, the target of the European Commission is to reduce total Greenhouse Gas
(GHG) emissions in the EU by 20% with respect to 1990. Transport has a key role to
play in achieving this goal and an inversion of some of the current trends will be ne-
cessary. A binding target of 10% share of renewable energy sources in transport by
2020 has been adopted recently as part of the Climate and Energy package. A confe-
rence on urban freight transport and logistics is also planned for November 2010.
21
2.1.2. Incentives and initiatives As mentioned above, apart from regulatory initiatives, the European Commission is
aiming to promote good practice in city logistics. Three Framework Programmes
(FP5, FP6 and FP7) have been the funding base for a large number of projects con-
cerning the wider area of urban freight transport.
Within the key Action “Sustainable Mobility and Intermodality” the European Com-
mission established the thematic network on BEST Urban Freight Solutions (BES-
TUFS) in January 2000 with a 4-year-duration (BESTUFS I). The initiative wanted to
make a collection of all initiatives and projects already existing and all their results in
Europe rather than starting new research activities. The initiative was followed by
another 4-year thematic network (BESTUFS II) which aimed to maintain and expand
an open European network between urban freight transport experts, user
groups/associations, ongoing projects, the relevant European Commission Directo-
rates and representatives of national, regional and local transport administrations
and transport operators.
The main objectives of BESTUFS were (Egger & Ruesch, 2003):
To create a permanent and dynamic concentration activity during the period
of the 5th Framework Programme(BESTUFS I) and the 6th Framework Pro-
gramme (BESTUFS II);
To identify and structure the various themes which build the urban freight so-
lutions (UFS) domain and which have relations and influence to it;
To present projects and best practices;
To support the clustering of projects on European level and to integrate
projects and clusters into the network;
To collect, compare and summarize available experiences and results of
projects and initiatives in the UFS domain mainly for Europe but also if easily
obtainable – for the USA and other countries;
To identify and describe best practices and success criteria within the UFS
domain;
To disseminate experiences, project relations, best practices and success crite-
ria to a broad public of interested actors, thereby aiming at the transferability
of solutions;
To establish links and co-operations with relevant other thematic networks
(treating different themes) on European level in order to share and integrate
the results (regarding overlapping themes) and to avoid duplication of work;
To establish links and co-operations with national thematic networks (treat-
ing the UFS domain) in order to share and integrate results;

22
To support the co-operation between actors in the UFS domain by providing
information and by providing contacts.
The second edition of BESTUFS began in 2004 and ended in 2008. It increased broad
geographic coverage and dissemination of guides about best practices in different
languages, quantified urban freight solutions to EU policy objectives and reviewed
existing urban freight transport models and data structures. From BESTUFS I it
emerged that it is necessary to have tools for the design, assessment and control of
urban freight transport systems, thus simulating with the use of models what the
system state will be once the new scheme/practice is adopted (BESTUFS, 2010).
The CIVITAS Initiative (CIty VITAlity Sustainability) supports cities in introducing and
testing bold and innovative measures to radically improve urban passenger and
freight transport. CIVITAS I started in early 2002 (within the 5th Framework Research
Programme – FP5) and was followed by CIVITAS II (FP6) and CIVITAS PLUS (FP7).
CIVITAS objectives are:
To promote and implement sustainable, clean and (energy) efficient urban
transport measures;
To implement integrated packages of technology and policy measures in the
field of energy and transport in 8 categories of measures;
To build up critical mass and markets for innovation.
Within CIVITAS I (2002-2006) 19 cities were clustered in 4 demonstration projects,
within CIVITAS II (2005-2009) 17 cities participated in 4 demonstration projects,
whilst within CIVITAS PLUS (2008-2012) 25 cities took part in 5 demonstration
projects. These demonstration cities all over Europe are funded by the European
Commission.
A wide variety of measures has been applied, concerning both passenger and freight
transport, in 61 cities all over Europe. Some of them have shown great sensitivity
towards the implementation of ‘green’ measures on freight transport, while others
have been much slower. Stockholm participated in the TRENDSETTER project of CIVI-
TAS I and had the opportunity to implement green logistics schemes, such as the lo-
gistics centres in Hammarby Sjöstad and Gamla Stan. TRENDSETTER in Stockholm is
presented in section 4.1 of this thesis. (Civitas, 2010)
The SUGAR initiative (Sustainable Urban Goods logistics Achieved by Regional and
local policies) promotes the exchange, discussion and transfer of policy experiences,
knowledge and good practices in the field of urban freight management, since 2009.
The SUGAR approach is structured along three main strands (SUGAR, 2010):

23
The refinement of policies of 4 Good Practice Sites through dialogue with
other leading administration outside the project partnership.
The development of policies in 7 Transfer Sites, supported by the develop-
ment of good practice analysis thematic training, joint planning for transfer
sites and the development of local transfer action plans.
The creation of interest, knowledge, tools and exchange for new administra-
tions from outside the SUGAR partnership through the Enlarged Transfer
Programme.
Another important project that focused on urban freight transport was the START
project (Short Term Actions to Reorganize Transport of Goods). Five European cities
(Göteborg, Bristol, Ljubljana, Ravenna and Riga) joined forces to develop and imple-
ment sustainable city logistics and urban freight solutions. The START project started
in February 2006 and ended in January 2009 and was funded through the Intelligent
Energy Europe (STEER) programme. The START approach was based on local freight
networks which established a close collaboration between the city government,
transport companies and local businesses (START, 2010).
FREILOT is a pilot implemented in four European cities aiming to increase energy ef-
ficiency in road goods transport, to widely disseminate and share the pilot results
with all stakeholders and to increase the involvement of fleet operators, cities and
other stakeholders in the scheme. The FREILOT project will experiment with the fol-
lowing services:
Energy efficient intersection control (by providing priority to trucks at inter-
sections)
Adaptive speed and acceleration controls
Eco-driving support
Real-time loading/delivery space booking
It started in April 2009 and will last for 2,5 years (FREILOT, 2010).
FIDEUS (Freight Innovative Delivery in European Urban Spaces) is a project aiming to
provide a complementary set of vehicle solutions to support an innovative approach
to the organization of urban freight transport, in line with political strategies to safe-
guard the livability of cities, while being compatible with efficient logistics. In the
project participated 13 companies from 6 countries, from May 2005 to April 2008
(European Commission, 2010c, and Videolectures.net, 2010)
The NICHES project (2004-2007) promoted innovation in urban transport in 4 re-
search areas, among which were “Innovative approaches in city logistics”. These ap-
proaches included:
Space Management for Urban Delivery

24
Inner-city Night Delivery
Alternative Solutions for Home Delivery
Good quality dissemination material and policy notes were produced by the project.
The project has been succeeded by NICHES+ (2008-2011), financed by the 7th
Framework Programme, which promotes further sustainable and efficient urban
transport solutions. (NICHES+, 2010)
CITY PORTS (2003-2005) is a transnational co-operation project devoted to the top-
ics of the urban goods distribution, which has been developed within the framework
and under the financial assistance of the INTERREG IIIB CADSES Community Pro-
gramme. Under the leadership of Regione Emilia-Romagna in Italy, the project ac-
tions have been developed by a transnational consortium joining public administra-
tions, public utilities and consulting companies in four countries (Italy, Austria, Slo-
venia and Greece). CITY PORTS’ overall objective is to promote concrete interven-
tions in urban logistics for some European cities in order to reorganize their urban
systems (CITY PORTS, 2005).
e-DRUL (e-Commerce Enabled, Demand Responsive Urban Logistics) was a research and innovation project in the field of e-logistics that lasted from April 2002 till Octo-ber 2004. It investigated, developed and validated an innovative e-logistics platform, and supported service models, for improved management of freight distribution processes in four urban areas: Siena, Lisbon, Eindhoven and Aalborg (e-DRUL, 2010).
COST 346 (2000-2004) aimed to develop an improved methodology for estimating
pollutant emissions and fuel consumption from commercial road transport operated
with Heavy Duty Vehicles in Europe. It concentrated on improving the amount and
quality of basic data on emissions and transport activity, as well as validating and
improving existing models. (Europa, 2010a)
Project REFORM (1997) analysed and evaluated the effects of freight platforms re-
garding the urban traffic and provided guidelines and criteria for designing, locating
and organising freight platforms in urban areas with the view of optimizing their
benefits and reducing their negative effects. (Europa, 2010b)
COST 321 (1994-1998) studied the design and operation of innovative measures to
improve the environmental performance of freight transport in urban areas. The
project analysed how the air pollution, noise and energy consumption are reduced
by optimizing the use of trucks in the city traffic through the application of modern
logistical devices and appropriate administrative measures. (Europa, 2010c)

25
3. City Logistics Solutions from European cities
3.1. Introduction The BESTUFS Initiative (see section 3.2) attempted to develop a common framework
for best urban freight solutions, considering as many as possible relevant aspects
which might have an impact on urban freight transport. The term ‘Best Practice Solu-
tions’ has been used to identify different ‘types’ of actions, research and activities
which might affect urban freight transport directly or indirectly. The BESTUFS Best
Practice Handbooks give the following definition of Best Practices:
“Best Practices are planned or implemented private only, public only or Public Pri-
vate Partnership (PPP) strategies, measures or activities which have an essential con-
tribution to urban goods transport and ideally lead to benefits for all actors involved.
Best Practices will be identified on the fulfillment degree regarding the following re-
quirements:
1. Best Practices have to fit to a defined theme or address a relevant problem
with respect to the movement of goods in urban areas.
2. Best Practices should be based on real experiences (real world implementa-
tions, pilot projects) or analysis in studies.
3. Best Practices should have considerable and measurable positive effects (qu-
alitative, quantitative) or relevant indicators of urban goods transport.
4. In some cases it can also be important to take project activities into account
which have not been successful. We can also learn from bad experiences and
improve solutions by describing and analyzing failure factors” (Ruesch & Patz,
2008).
A classification of solutions (measures) that concern city logistics and their possible
results has been proposed by Russo and Comi (2010). The proposed classification is
the following:
Measures related to material infrastructure:
Linear measures (referring to the links of the urban transport net-
work);
Surface measures (referring to areas reserved for freight operations);
Measures related to immaterial infrastructure (telematics) or Intelligent
Transport Systems (e.g. systems for traffic information, freight capacity ex-
change systems, route optimization services, vehicle maintenance manage-
ment systems, other information services, and centralized route planning);
Measures related to equipment, including measures on:
Loading units;

26
Transport units (e.g. use of alternative fuel vehicles, rail and trams);
Measures related to governance of the traffic network (e.g. access regula-
tions, road pricing etc.).
The BESTUFS Good Practice Guide presents a number of available approaches in re-
lation to the aimed objectives and they are shown in the following table:
Objectives Approaches available Gaining freight industry support for freight strat-egies and initiatives
Freight transport partnerships
Improving journey time reliability of goods ve-hicles
Telematics for urban goods transport
Signing
Urban freight information and maps
Road pricing
Allowing night deliveries
Lorry lanes or no car lanes
Assisting the journey of goods vehicle drivers and reducing goods vehicle trips and kilometres
Telematics for urban goods transport
Signing
Lorry routes
Simplification & harmonization of vehicle weight, size and construction regulations
Urban freight information and maps
Urban consolidation centres
Assisting freight transport companies at the point of delivering and collection
Providing on-street loading bays
Nearby Delivery Area (ELP)
Urban consolidation centres
Reducing environmental impacts and the risk of accidents involving goods vehicles
Vehicle weight, size and emissions stan-dards regulations
Time regulations for goods vehicle access and loading
Allowing night deliveries
Environmental zones
Lorry lanes
Infrastructure improvements
Encourage use of environmentally-friendly vehicles
Enforcement
Table 3: Objectives and approaches for urban freight transport (Allen et al, 2007)
The fields presented in this thesis have been selected by the following criteria:
They are commonly accepted as effective (under certain conditions)
They are widely tested and recommended by a number of sources
They cover a wide range of action fields and levels (see Table below)
There is great availability of relevant literature
The green logistics solutions presented below can be classified to the following ac-
tion fields:

27
Action Field Measure
Distribution strategies Freight Platforms – Urban Consolidation Centres (UCCs) Examples:
London Construction Consolidation Cen-tre
City Logistik in Kassel Institutional solutions Public Private Partnerships
Examples: Freight Quality Partnerships in the UK Nearby Delivery Area (ELP) in Bordeaux
Schedule management solutions Night Deliveries Examples:
Night-time deliveries in Barcelona The PIEK Project in the Netherlands
Pricing Strategies Road Pricing Systems Examples:
Congestion Charging in London
Technological solutions Technological Solutions Examples:
Intelligent Transport Systems (ITS) Environmentally-Friendly Vehicles (EFV)
Table 4: Classification of Measures in Action Fields used in this thesis (by author)
It is beyond the purposes of this work to make a complete record of all possible
measures that have been used to reduce the negative impacts of urban freight
transport. However the following examples are interesting and can be seen as an
introduction to the broader subject of Green City Logistics, rather than a thorough
analysis. The cities that are mentioned are not the only ones that have implemented
these measures of course, but they were chosen on the basis of the success of the
implementation and the availability of related data. A failed project (‘City Logistik in
Kassel’, see 4.5.2) has also been presented as an additional source of knowledge that
can be derived from bad experiences.
28
3.2. Freight Platforms – Urban Consolidation Centres (UCCs)
3.2.1 Solution Description
Freight platforms were developed to reduce urban freight traffic and to shift long
distance freight traffic from road to rail. The first freight centres in Europe were es-
tablished in Paris in the mid 1960s in response to urban congestion. Many countries
followed and Italy was the first to include the development of freight centres in their
national policy, in 1990, followed by Germany in 1992 and France in 1993. Today,
this trend has slowed down after the inability of a number of projects “to fulfill their
optimistic expectations” (Karrer & Ruesch, 2007). However it is beyond doubt that
urban consolidation and distribution centres can be very effective when planned ap-
propriately and realistically.
Freight platforms can be found in a great variety of forms and names, because they
don’t obey the rule: ‘one size fits all’. Instead every different freight platform is in-
tended to cover the needs of a different area with different stakeholders and aims.
Therefore, there are many different names that refer to similar but not identical
kinds of centres. The boundaries between them are not clear (Allen et al, 2008):
Freight platform
Urban consolidation centre
Public distribution depot
Central goods sorting point
Urban transshipment centre
Shared-user urban transshipment depot
Co-operative delivery system
Specific consolidation centre (e.g. retail, construction)
Urban distribution centre
City logistics (or logistik) scheme
Logistics centre
Pick-up/drop-off location
Freight village
The REFORM (see p.25) definition for freight platforms describes them as “areas in
which different transport related companies such as forwarders, logistic service pro-
viders etc. are established. They are transshipment areas where, ideally, at least two
transport modes are connected (usually road and rail, but also waterborne and air)”
(Karrer & Ruesch, 2007).

29
A term more dedicated to urban freight is an Urban Consolidation Centre (UCC). The
BESTUFS definition describes it as “a logistics facility situated in relatively close prox-
imity to the geographical area that it serves (be that a city centre, an entire town or
a specific site such as a shopping centre), to which many logistics companies deliver
goods destined for the area, from which consolidated deliveries are carried out with-
in that area, in which a range of other value-added logistics and retail services can be
provided” (Allen et al, 2008).
Logistics companies with deliveries scheduled for the urban area or site are able to
transfer their loads at the UCC and thereby avoid entering the congested area. The
UCC operator sorts and consolidates the loads from a number of logistics companies
and delivers them, sometimes using environmentally friendly vehicles, to an agreed
delivery pattern.
A classification of UCCs can be as follows:
Area UCCs – serving a town/city (e.g. German city logistics schemes, La Ro-
chelle in France, etc).
UCCs on single sites with one landlord (e.g. airports or shopping centres).
Special project UCCs (e.g. construction material UCCs)
Further classification may concern: company structure, spatial orientation (urban,
regional, national, international), transport modes and access, Institutional solution
(private or Public Private Partnership), main aims. The following Figure shows two
examples of different company structure.
Figure 1: Single-company and multi-company platform (Karrer & Ruesch, 2007)

30
The UCCs are a solution that has been widely tried and applied all over Europe, be-
cause it can offer a number of advantages (Huschebeck & Allen, 2005):
environmental and social benefits resulting from more efficient and less in-
trusive transport operations within urban areas
better planning and implementation of logistics operation, opportunity to in-
troduce new information systems at the same time as consolidation centre
better inventory control, product availability and customer service
can facilitate a switch from push to pull logistics through better control and
visibility of the supply chain
potential to link in with wider policy and regulatory initiatives
theoretical cost benefits from contracting out “last mile”
public relations benefits for participants
potential to allow better use of resources at delivery locations
specific transport advantages
opportunity for carrying out value-added activities
However, not all these advantages appear in every UCC. In fact there are a number
of disadvantages linked to their implementation (Huschebeck & Allen, 2005):
potentially high set up costs (and sometimes high operating costs)
much urban freight is already consolidated at the intra-company level or by
parcels carriers, so limited benefits (or even negative consequences) for try-
ing to channel these flows through a consolidation centre. The potential
scope for UCCs may therefore be limited
difficult for a single centre to be able to handle the wide variety of goods
moving in and out of an urban area, for example due to different handling
and storage requirements
most studies report an increase in delivery costs due to an additional stage in
the supply chain which imposes a cost (and often a time) penalty though this
clearly depends on how well the centre is integrated into the supply chain
and the extent to which all costs and benefits are considered
a single consolidation centre for an urban area is unlikely to be attractive for
many suppliers’ flows due to the degree of diversion required from their
normal route (and may therefore negate transport savings for onward distri-
bution)
lack of enforcement of regulations for vehicles not included in the consolida-
tion scheme
organizational and contractual problems often limit effectiveness
potential to create monopolistic situations, thus eliminating competition and
perhaps leading to legal issues
loss of the direct interface between suppliers and customers

31
More about the impacts of UCCs on the supply chain, the carriers and the environ-
ment, but also the key issues in planning and operating them, can be found in
Browne et al (2005b).
3.2.2. London Construction Consolidation Centre (LCCC) – Construction
Logistics Plans (CLPs)
Following the success of the acclaimed Heathrow Consolidation Centre and the DTI
supported study of the project, a large-scale Construction Consolidation Centre
opened in the area of South Bermondsey in South London, in 2005. The LCCC was
established for the supply of construction materials to major construction sites on a
just-in-time basis of material from suppliers to site. It was intended to reduce the
number of deliveries going directly to the construction sites and thereby reducing
traffic congestion and vehicle emissions.
Figure 2: The London Construction Consolidation Centre (TfL, 2009)
The mission statement of the LCCC was “to deliver in the safest and most efficient
manner possible the right materials to the right site at the required time in active
partnership with trade contractors and project managers” (TfL, 2009).
Funded by Transport for London (£1.85m), Stanhope and Bovis Lend Lease (£1.35m)
and managed by Wilson James, the LCCC covers an area of 5.000m2 and can process
in excess of 200,000 pallets of construction project material per annum. 16 people
were employed at the LCCC

32
By the end of the two-year pilot project, encouraging findings were provided (TfL,
2009):
The reduction in the number of vehicles delivering materials to four construc-
tion sites was estimated from 60 to 70 per cent, when the deliveries where
made via the LCCC
The total amount of deliveries was reduced by approximately 40 per cent in
the case of Unilever House
The vast majority of deliveries from the LCCC were made in rigid goods ve-
hicles, thus eliminating the use of vans
Two hours average reduction in supplier journey times by going directly to
the LCCC than driving into and out the City of London (including load-
ing/unloading time)
Deliveries from the LCCC to sites achieved 97 per cent reliability (i.e. 97 per
cent materials of the correct type and quantity were delivered within 15 mi-
nutes of the scheduled time). The standard achieved without the use of a
consolidation centre is 39%
It increased the productivity of the labour force on the construction sites by
up to 25 minutes per person per day, as a result of the delivery reliability
from the LCCC
Work scheduling problems appeared because of the LCCC, including an in-
crease in the order lead time of up to six days. Some incorrect components
were sent by the LCCC and some items were misplaced at the LCCC
There were some liability issues due to the use of the LCCC, where trade con-
tractors had no longer control of their materials, while the sign-off process
for goods deliveries from the LCCC to the site was not as good as possible
The estimated reduction of CO2 emission from vehicle movements was up to
70-80 per cent (referring to the short journey from the LCCC to the construc-
tion sites)
Approximately 3000 goods vehicles did not enter the London Congestion
Charging Zone during the two-year pilot, as a result of the LCCC
It is likely that noise pollution and traffic accidents have also been reduced
It proved difficult to measure reductions in the material waste as a result of
the use of the LCCC. However, the improved reliability and secured storage at
the LCCC reduced the quantity of materials damaged, lost, stolen and over-
ordered, and thus reduced the total quantity of the required materials
LCCC vehicles brought recyclable packaging and unused materials back to the
LCCC for recycling, re-use, or disposal thereby improving vehicle utilization
and reducing waste transport journeys.
The interest shown by other construction sites to make use of the LCCC was
lower than expected.
33
One goal connected to the LCCC is the creation of a centre of excellence for voca-
tional training and professional learning for businesses, local authorities and people
in London. There is also the intention of the facility serving as a model for logistics
delivery of the major construction programme for the London Olympics 2012 or the
Thames Gateway Regeneration project.
One of the four main projects described in the London Freight Plan are Construction
Logistics Plans. They will be applied to the design and construction phases of pre-
mises to improve construction freight efficiency by reducing CO2 emissions, conges-
tion and collisions. The aim will be for TfL and the GLA Group to take a lead in im-
plementing such plans for their construction projects (TfL, 2007a).
Construction Logistics Plans have a number of benefits for all stakeholders (TfL,
2007b):
1. Benefits for local authorities and residents:
Less congestion on local roads
Reduced emissions to limit the impact of freight transport to the environ-
ment
Fewer goods vehicle journeys lowering the risk of collisions
Opportunity to reduce parking enforcement activity costs
Improved quality of life for local residents (reduced noise, intrusion and ac-
cidents)
2. Benefits for building developers and contractors:
Reduced delivery costs and improved security
More reliable deliveries, which means less disruption to the normal business
practices
Time saved from identification of unnecessary deliveries
Less noise and intrusion
Opportunity to feed into a corporate social responsibility programme and en-
sure your operations comply with health and safety legislation
3. Benefits for freight operators:
Legal loading areas mean less risk of receiving penalty charge notices
Fuel savings through consolidated deliveries
More certainty over delivery times will increase fleet productivity
Less journeys mean less risk of collisions
Transport for London estimates an increase in demand for freight transport by 15
percent by 2025.

34
3.2.3. City Logistik in Kassel, Germany – An abandoned project
The project started in 1993 in Kassel, a medium sized city of about 200.000 inhabi-
tants. It was located in Northern Hessen on the crossing of the A7 (North-South Au-
tobahn) and A44 (connection to the Ruhr area).
The aim was to reduce the constantly rising traffic volume in Kassel, especially indus-
trial and individual traffic. From August 1994, ten forwarding agencies participated in
the co-operative system. A neutral carrier was employed to collect and distribute the
bundled goods in the centre of Kassel, an area which included the pedestrian zone
and adjacent roads.
The neutral operator started the collection tour at 6.00 a.m. with about 5 vehicles.
The goods were delivered during the night to the forwarding agencies. At the urban
distribution centre the consignments were bundled according to the address of the
consignees as well as to specific street corridors. At about 10.00 a.m. the urban deli-
very started, with two or three 7,5 tons vehicles. Usually two tours were carried out
per day (depending on the transport volumes). An average of about 5 to 6 tons was
transported via the urban distribution centre.
Köhler’s (2003) study for the University of Kassel showed a 40% reduction of the an-
nual mileage towards the inner city, a 60% reduction of mileage within the inner city,
a 60% reduction of the distance between stops and a great increase in vehicle utiliza-
tion (+100% per volume or +140% per weight), as a result of the City-Logistik.
Even though it was initially successful, the partners involved gradually lost their in-
terest in the continuation of the project and soon three agents left the partnership,
before it was totally stopped in 2003. There were a number of reasons that led to
that outcome (Köhler, 2003):
There were no regular meetings between the partners
There was no specific form of organization for the centre
There was lack of information between the partners involved
Some profitable deliveries were not carried out via the logistics centre, but by
the forwarding agencies themselves
There was no freight traffic centre, although some studies found it necessary
The local authorities showed little support and did not use restrictive meas-
ures to promote the use of the centre (e.g. prohibiting other transporters
from certain areas of the city)
Little interest for the project was shown by local retailers
The cost savings through the use of the centre were negligible
The City-Logistik in Kassel was just one among over 100 projects related to consoli-
dation centres that were abandoned in Germany in the late 90’s. The main reason is

35
found at the extra time and cost of the cooperation and pre-delivery consolidation. A
number of changes in the German market that contributed to these results (Klaus,
2005):
The structure of the inner city shopping environment was altered due to:
a new trend of shopping at shopping centres at the periphery in most
cities
the continuing replacement of “traditional” stores by standardized
“optimized” chain stores
The structure of the inner city merchandise changed also
Cities and retailers faced severe budgetary problems
Reverse of municipal politics: keeping private cars away from the city was no
longer a target, and neither was commercial vehicle traffic
There were significant changes in retail industry logistics which showed that
urban consolidation should be based on “commercial pressures” rather than
urban planning and politics
A new approach of urban consolidation has appeared and is very popular:
Consolidation close to the final customer (e.g. delivery boxes)
Klaus (2005) concludes that the potential of the “first generation” urban consolida-
tion centre concepts is limited. Instead, more attention must be placed on the
“commercial” developments of the industry sector logistics and “new supply chain
architectures, such as consolidated mail-papers-mail-orders-home-services and
technologies for self-service “consolidated” pick-ups as the Post-Box”.
3.2.4. Discussion
Urban consolidation centres for several companies have been implemented for im-
proving the efficiency of urban distribution and for reducing urban truck traffic.
There was a boom in UCC projects in the 90s mainly in Central Europe. Since then,
many of these projects have been abandoned due to significant problems. Today the
situation is quite heterogeneous among European countries, some being very skep-
tical after the disillusioning experiences, while others are awaiting a second wave of
successful UCCs that will have learned from the failures of the past.
BESTUFS recommends to be ensured that UCC trials have sufficient support and
funding to run for a suitable period of time over which to measure and analyse the
results. Public funding is necessary for any chance of success.
For UCCs there is no ‘one size fits all’ rule. Every city has its own peculiarities and dif-
ferent characteristics that need to be taken into account. Some valuable recommen-
dations for stakeholders related to UCCs are mentioned in Karrer and Ruesch (2007):

36
Urban Consolidation Centres can contribute to solving urban freight prob-
lems. However, they are just one among many tools. In order to see if they
are of use, a community needs to identify what problems or opportunities it
has, and then consider a UCC as one of several possible options.
An in-depth knowledge of the urban mobility system (offer, demand, logistics
chain organization, stakeholders, etc.) is necessary for understanding what
kind of UCC can be realised.
Different tools, regulations etc. must be attentively applied together and
harmonised in order to identify “integrated solutions”.
Once the solution is identified, it must be implemented step by step, trying to
generate consensus among retailers, transport and logistics operators, citi-
zens.
The system must be open to new participants at any time (no monopoly or
oligopoly).
Vehicle usage and efficiency can be increased even more by additional activi-
ties like collecting mail, reverse logistics, etc.
An integrated approach taking into account access regulations, PPP, vehicle
technology etc. is generally more promising.
Browne et al (2005b) made an in-depth analysis of this logistics solution and identi-
fied some parameters that can increase the potential of success of UCCs:
Availability of funding – there is no strong evidence that any truly self-
financing schemes yet exist.
Strong public sector involvement in encouraging (or forcing) their use
through regulatory framework (e.g. relaxing access time restrictions for ve-
hicles operating from the centre).
Significant existing problems in the area to be served (e.g. poor vehicle
access, significant traffic congestion, constrained loading/unloading facilities).
Bottom-up pressure from local interests.
Resolving logistics problems associated with a site that has a single manager/
landlord (e.g. shopping centre).

37
3.3. Public Private Partnerships (PPP)
3.3.1. Solution Description
In international literature there is no general definition for Public Private Partner-
ships. Some speakers can mean the simple informal communication between mem-
bers of the public administration and private enterprises. Others consider PPPs as
exclusively contractual arrangements between government and a private party for
the provision of assets and the delivery of services that have been traditionally pro-
vided by the public sector (a notion close to that of privatization). Thus, PPP is a
blanket term covering many forms of co-operation between government institutions
and private sector entities. Yet all these different forms of PPP have one main idea in
common: that public and private actors are different. Each of them disposes of com-
parative advantages in certain aspects whether it is information, material know-how,
financial resources, etc. Within the partnership (which can be seen as a sort of insti-
tutional division of labour) each partner fulfils the tasks he is better at – resulting in a
win-win situation.
With respect to their degree of formalization, PPPs can be classified in three catego-
ries, although the differences are rather gradual than discrete (Ruesch & Patz, 2008):
Informal co-operations (also called “handshake partnerships”)
Contractual co-operations / agreements
Joint venture companies with public and private shareholders / partners
Various examples of PPPs exist in urban freight transport in recent years. They have
been used for financing, building and operation of infrastructure projects, as well as
for the negotiation and setting of framework conditions and agreements between
the public and private sectors. Such partnerships were used in the city logistics
schemes that were heavily promoted by the public sector in some countries in the
early 1990s.
However, most of these city logistic schemes have since failed (see 3.2.3 and the City
Logistik in Kassel example). The main reasons for these “failures” were that the prof-
itability of such approaches was overestimated and the critical mass on consign-
ments to be bundled for city distribution was never reached. Hence, most projects
vanished or the activities were taken over by one private operator. The lesson
learned from these city logistics experiences was that PPPs which do not provide suf-
ficient commercial benefits are not sustainable over time. More recent efforts to es-
tablish working relationships between the public and private sector to address urban
freight issues have proved more successful – the example of Freight Quality Partner-
ships in the UK is provided below.

38
The initiation and maintenance of a PPP is a complex task. However, bringing both
sides together can result in mutual benefits, large synergy effects and efficiency
gains especially for tasks which are not core duties of the public sector.
Public Private Partnerships offer opportunities and benefits for all partners:
Synergy effects such as the mutual exchange of information and know-how
Effects of reciprocal learning such as a mutual understanding of the partner’s
mindset and action constraints
Acceleration effects in developing and implementing a project (efficient divi-
sion of labour and mutual reduction of resistance through integration of the
opposite sector from the beginning)
For the public shareholder the following benefits can be taken as an example:
Access to corporate funding
Utilization of private management expertise
Ability to concentrate on core competences and
Increase efficiency
For private participation there are also important benefits that can be assumed like:
PR and image gains
Motivated and committed employees
Improved access to public information channels and acceleration of planning
procedures and project implementation
Possibility to influence external factors that play a significant role in the de-
velopment of the company, e.g. economical and social issues
Presently, national governments and urban authorities do not have a good track
record in involving urban freight transport actors in decision-making. Participation in
policy making has been often kept to a limited consultation exercise. A good review
on Public-Private Partnerships in urban freight can be found at Browne et al (2004).
Many examples of PPPs have also been used during the Civitas project and can be
found at Civitas (2010).
3.3.2. Freight Quality Partnerships (FQP) in the United Kingdom
A more inclusive approach to PPP has been developed in the UK. It has included the
publication of documents that outline the government’s determination to recognize
problems caused by and faced by urban freight transport. Urban authorities have
been encouraged by the national government to focus greater attention on freight

39
transport and to include consideration of urban distribution and sustainability in Lo-
cal Transport Plans (LTPs) and to establish Freight Quality Partnerships.
Freight Quality Partnerships (FQPs) are partnerships between the freight industry,
local government, local businesses, the local community, environmental groups and
other interested stakeholders which allow them to work together and address spe-
cific freight transport problems. Their aim is to develop an understanding of those
problems and then promote constructive solutions which reconcile the need for
access to goods and services with local environmental and social concerns (TfL,
2007a).
FQPs provide a forum to achieve best practices in environmentally sensitive, eco-
nomic, safe and efficient freight transport. FQP partners exchange information, ex-
periences and initiate projects regarding urban freight transport.
In addition FQPs (Steele, 2008):
help reduce Penalty Charge Notice (PCN) hotspots to improve congestion and
help reduce CO2 emissions
develop freight mapping and signing
promote London’s Freight Operator’s Recognition Scheme (FORS)
help design-out freight-crime and tackle fly-tipping (illegal dumping of waste
material in public places)
integrate freight in the planning process
enhance Transport for London (TfL)/ Borough communication and collabora-
tion
The real value of an FQP is that it brings together stakeholders to look for the best
practical answers to specific freight problems. This approach increases the likelihood
of finding solutions beneficial to all partners involved.
Being a key of TfL’s London Freight Plan, London’s FQPs are organised at 4 different
levels:
Pan-Regional
Sub-Regional
Local
Single Issue
FQPs develop a programme of works that reflect the views of their members and the
aims of the London Freight Plan and then it is submitted for assessment by TfL. Ex-
amples of work undertaken by London’s Sub-Regional FQPs are presented in the fol-
lowing table:

40
FQP Objective Outputs
West London FQP Park Royal signage and
mapping
Improved directional sig-nage
Freight delivery map
South London FQP Night Time Deliveries
Develop a pilot project in South London
Freight lessons and dis-seminate best practice
Central London FQP Loading, unloading and
parking
Code of Practice
Cancelled PCNs
Hotspot reduction
Table 5: Examples of work undertaken by London’s FQPs (TfL, 2007a)
3.3.3. Nearby delivery area (ELP) in Bordeaux
In Bordeaux, a system was established to ease the delivery of goods in the city cen-
tre, which involved the creation of ‘nearby delivery areas’ (Espaces de livraison de
proximité – ELP). The ELP approach includes the installation of an urban tranship-
ment platform on which dedicated personnel provides assistance for the dispatching
of consignments for the last mile (inner city). Goods are unloaded from incoming ve-
hicles and can be loaded onto trolleys, carts, electric vehicles and bicycles for the fi-
nal distribution leg. This approach can also be used to provide additional services,
such as home delivery, short-term storage etc. (Ruesch and Patz, 2008).
Figure 3: Equipment used at the ELP (Niches, 2007c)

41
The need for the creation of the ELP appeared during the construction of the tram-
way lines in the inner city area. Deliveries were nearly impossible because of the
public works in the city centre. As a result, a PPP started as a general collaboration
between freight organizations, the Chamber of Commerce (CCI) of Bordeaux and the
Bordeaux metropolitan authority to design solutions for delivering the goods during
the building of the new tramway lines. The first main achievement of the PPP
process was to involve the three main truck organizations.
For one year there was one meeting every three months with a private consultant
who was hired to organize and manage the meetings and set up the ELP experiment
project itself. Employing a private consultant was one of the success factors because
he could manage and take care of the PPP more neutrally compared with a city offi-
cial.
Figure 4: Espaces de livraison de proximité (ELP) Bordeaux (Ruesch & Patz, 2008)
The solution reached was the ELP with contractual commitments between parties
involved to set up and co-finance specific delivery areas. The project aimed not only
at the easier delivery of goods to the city centre, but also to reduce traffic conges-
tion, noise and pollution associated with deliveries.
The space is reserved and controlled by up to two members of staff who can also
help goods vehicle drivers to deliver their goods to the shops using trolleys. It can
accommodate 3 to 5 delivery vehicles at once (it is about 30 meters wide). The ELP
operates from Monday to Friday between 09.00 and 17.00 and on Saturday between
09.00 and 11.00.

42
The costs for the two permanent employees are rather high. During the second year
of test, one third of the financing was paid by the operators (TNT), one third by the
chamber of commerce and one third by the city of Bordeaux.
Initial results show that the ELP system is very popular with freight transport compa-
nies because it offers the guarantee of an available and secure unloading area close
to the commercial area in the city centre. A second ELP was set-up in Bordeaux on
2005 and a third on in 2006. ELPs are also being established in other French cities,
e.g. Rouen (Allen et al, 2008).
3.3.4. Discussion
The framework conditions that favor the building of a PPP can be found in Ruesch
and Petz (2008):
Less public budgets
Public interest and acceptance among users
Complex projects
Lack of information
Problems in efficiency
The same BESTUFS Handbook identifies that the main fields for establishing a PPP is
on the optimization of urban distribution, road pricing and the construction of logis-
tics and distribution centres. Other application areas for PPPs can include: the usage
of ITS in urban freight, city access management, the development of environmental-
ly-friendly vehicles for goods distribution, loading zone management, etc.
The most PPPs in the field involve only partners from the freight transport business.
Because of the complexity of environmental and congestion problems in urban areas
it would be advantageous to also integrate other interest groups like public transport
services. It should be aimed to find a comprehensive approach which affects all kinds
and all modes of transport. Communication between different stakeholders with dif-
ferent interests and objectives is otherwise very difficult.
Given the wide range of stakeholders involved in freight transport considerations in
urban areas (including retailers, wholesalers, carriers, warehousing, residents, shop-
pers and workers) it will undoubtedly prove difficult to both engage and please eve-
ryone. However, if the focus remains on ensuring that the delivery and collection of
goods in urban areas takes place as in an efficient manner, while imposing as few
social and environmental impacts as possible, there are clearly benefits to be
achieved through the use of a broad PPP approach.
43
3.4. Night Deliveries
3.4.1. Solution Description
Inner-city night delivery is the delivery to retailers and shops in the inner city area
during the night hours when the city usually is quiet and inactive. Typical times are
between 22:00 and 06:00. In several cities, such as Barcelona or Dublin, successful
experiences with trials on night delivery are made replacing a (higher) number of ve-
hicles operating during day time by a (fewer) number of vehicles operating during
night time.
In most European cities there are night time regulations with some notable excep-
tions such as Paris. Two types of night-time regulations may be introduced (Allen et
al, 2008):
Time regulations on deliveries and collections to and from a particular build-
ing (e.g. a retail outlet, office or factory)
Regulations on goods vehicles movement in a part or the whole of an urban
area.
There may be a number of consequences for freight transport companies due to not
allowing night time activities:
More vehicles may be required to make deliveries in a shorter delivery win-
dow
Deliveries may have to be made in periods of greater congestion (reducing
vehicle & driver productivity and increasing fuel consumption)
Journey times may be slower and less reliable
The supply chain may be less efficient
Total supply costs may be increased
On the opposite side, inner-city night delivery:
Reduces delays for the logistics service providers by using the free road ca-
pacities at night
Reduces emissions and energy consumption (less congestion during night
time, direct access to the shops)
Increases logistics efficiencies in terms of the deployment of HGVs and man-
power
Enhances road safety
Restrictive night-time regulations can result in an increase in total costs within the
supply chain. By being allowed to make night-time deliveries, some companies can

44
improve the efficiency of their operations and improve sales. Unrestricted access to
loading/ unloading facilities without traffic interference ensures faster delivery ser-
vice and minimizes the impact of freight on congestion. Night delivery schemes also
promote the use of cleaner and quieter goods vehicles, e.g. compressed natural gas
(CNG) engines.
The most important issue raised by night-time deliveries is the noise created by the
vehicles operations, the vehicles’ engines, the handling of goods (loading/ unloading
process), the opening/ closing gates etc. Well defined noise standards for night-time
operations could bring significant benefits to local residents increasing the accep-
tance of night-time transport operations. There needs to be a balance between ve-
hicle noise, equipment noise and driver behavior. Operators need to train and edu-
cate their stuff for this sensitive issue.
Another important problem connected to night deliveries is exposure to theft and
lack of security for both the drivers and goods. The lack of flexibility in the person-
nel’s working hours is also a difficulty that is costly to overcome. In addition, it is
more difficult to locate and correct mistakes in deliveries during the night.
Sathaye et al (2009) also showed that nighttime delivery policies might actually dete-
riorate a city’s environment on terms of particulate matter and other emissions,
since the atmospheric boundary layer is usually more stable during the night. The
actual impact depends on the local climate, but in general inland areas are more af-
fected than coastal settings, especially during the summer. The paper highlights the
importance of conducting comprehensive assessments of logistics policies, before
introducing them.
Several European programmes dealt with night deliveries, such as the Civitas MI-
RACLES project, NICHES, FIDEUS and SILENCE. NICHES (2004-2007), for example, ad-
dressed the following aspects (NICHES, 2007b):
The delivery during night-time with specially equipped low noise vehicles
(low noise equipment, CNG engines tec)
Allowance for larger trucks to enter the city centre which are restricted dur-
ing the day time.
An Interesting review on night-time delivery restrictions and their impacts in the UK
has been made by Browne et al (2005a)

45
3.4.2. Quiet Night-time Deliveries in Barcelona
As part of the Civitas MIRACLES project, the goods operator Mercadona adopted
quiet night-time deliveries in the inner city of Barcelona in 2003. The objectives ad-
dressed were (MIRACLES, 2006):
Improving Municipal management of vehicle circulation on the main and lo-
cal road networks
Reducing delivery times and costs
Developing mechanisms to self-finance the successful scheme elements
The Municipality introduced experimental traffic regulations. The delivery processes
were concentrated between 23:00 and 24:00 in the night and between 5:00 and 6:00
in the morning. Traffic police collaborated with the Municipality to measure noise
levels in residences close to the supermarket sites. In this innovative collaboration,
operators have become active in introducing quieter and more ecological vehicles. In
addition to the adaptations to the vehicles, staff were trained to realize the unload-
ing operations using a set of procedures aimed at minimizing verbal communication
and other noise.
Figure 5: Quiet night-time unloading using adapted 40T truck at Mercadona’s Valencia St. outlet (MIRACLES, 2006)
Operator Mercadona has demonstrated that quiet delivery is possible with a 40T lor-
ry serving supermarkets with a rather large capacity and with substantial refrigera-
tion facilities. The result is quantified in terms of noise measures compared to am-
bient noise levels on nights when the delivery was not being made. The average of
the minimum values recorded during unloading inside buildings (23.5 dB(A)) was 0.3

46
dB(A) greater than those recorded before loading started. For maximum values, no
difference was recorded inside buildings (33.4 dB(A)), while in the street they varied
by only 0.1 dB(A), average with unloading of 52.2 dB(A). This was achieved by the
use of special carpets inside the vehicle and electric lift and carry elements.
The delivery characteristics of this trial indicate that 2 trips/week at night can save 7
trips using smaller lorries during day-time traffic. Operator Mercadona estimated
that full investment in vehicle adaptation was recovered within 2-3 years (from the 7
points delivered at the moment a cost saving of about 6,000 € per month can be
seen).
The Municipality and operators realized further trials with the FIDEUS project and
noise measurements through the SILENCE project. The trials with small trucks show
that the combination is possible but in this case only biodiesel was used and no hybr-
id, fuel cell or CNG technology. The combination of low noise equipment and alter-
natively driven vehicles is seen as very important in the future, but at the moment
the availability of alternatively fuelled vehicles is not given especially for long dis-
tance trucks. For the 16T and 40T trucks, the financial rate of return ranges from 18
to 36 months.
Now, apart from Mercadona, Condis and Lidl have also come to be exempt from
time delivery regulations and benefit from night time deliveries. The following noise-
abatement measures are used (Hayes, 2008):
Plastified roll-containers, soundproofing, wedges controlling roll-trainer
movement
Adapted refrigeration equipment
Kerb adaptations for access
Staff training to minimize verbal communication
This measure is cost-effective – both from the local authority and the operators’
points of view. The SILENCE programme has generated improved knowledge; it
shows that operators are only partially successful (in 45% of the cases) in unloading
within the ambient noise conditions; it also identifies which are the most important
noise sources (truck arrival in 62% of cases, goods unloading in 15% of cases) (SI-
LENCE, 2008).
3.4.3. The PIEK project in the Netherlands
At the end of 1998 the Dutch Government put into effect the renewed “Decree Re-
tail Trade Environmental Protection”, which set out that the noise emission level
must remain within noise emission standards set. It particularly defines that the

47
noise emission generated during loading and unloading goods between 19.00 –
23.00 hours must not exceed the peak noise standards of 65 dB(A) and between
23.00 – 07.00 hours the peak noise standard is 60 dB(A). The measurements were
made at a distance of 7,5 meters away from the truck.
The Ministry of Housing, Spatial Planning and Environment, the Ministry for Econom-
ic Affairs and the Ministry for Transport, Public Works and Water Management in-
troduced a long-term PIEK (PEAK, meaning peak noise levels, in contrast to conti-
nuous noise levels) programme in 1999 in order to bring about the necessary tech-
nical adjustments, by tackling the source, to the means of transport, the materials
used when loading/unloading goods and the loading/unloading locations.
The long-term PIEK programme comprises of 10 main projects. With the exception of
the truck and the shopping trolley (<65 dB(A)) all solutions meet the 60 dB(A) re-
quirement (NICHES, 2007b).
Transfer of knowledge to the companies involved on a general level;
Stimulate quiet behavior;
Create the optimal loading and unloading bay;
Low noise trucks (up to 7,5 tons);
Low noise trucks (over 7,5 tons);
Low noise transport refrigeration system;
Low noise take along forklift truck;
Reduce noise of roll containers, pallet-trucks and hand pallet-trucks;
Quiet shopping trolleys;
Electric propulsion or a combination of electric and diesel or gas propulsion
The PIEK MAP (Multi-Annual Program) has resulted in many innovations. It has
shown that meeting the standards of the Detam order in council is technically possi-
ble. It can be concluded that the PIEK MAP has largely fulfilled expectations in terms
of developing ‘quiet’ products. The goal of introducing these products to the market
has also been achieved (fifty ‘quiet’ products available in 2004).
In 2007 Senter Novem and Albert Heijn carried out 5 trials in 9 cities using PIEK-
Certified technology. During a period of 3 months, they performed 1,000 morning
(05:00 – 07:00) and evening (19:00 – 02:00) deliveries and received only one com-
plaint concerning the noise emitted.
The results of these trials were very positive with great noise and air emission reduc-
tions and important cost-savings. For example, in one location the average delivery
time before the trial was 1 hour and a half, while during the trial it was reduced to
only half an hour. Fuel consumption, CO2 emissions, NOx emissions and PM10 emis-
sions were also greatly reduced (Goevaers, 2008).
48
Another profit that came out of the trials was the upgrade from rigid to Euro-trailer.
Three rigid 10 m trucks were replaced by one 17 m tractor trailer saving 75% of the
total costs, with similar reductions to the above mentioned pollutants.
Albert Heijn aims to use 1000 PIEK-Certified trucks for 2010, while many other com-
panies are also heading towards the same direction. The PIEK-Certificate has been
adopted in many European countries as an important tool for night-time deliveries.
3.4.4. Other cities
Apart from the examples mentioned above, night-time delivery schemes have been
successfully implemented in Dublin, London, Rome, Vicenza, Torino and many other
cities. In France they are strongly encouraged by the authorities of some cities (Di-
jon, Marseille, Orléans, Paris) while in other cities they are banned at night at all ve-
hicles due to noise emissions (Lille, Rennes).
3.4.5. Discussion
Night-time deliveries can provide (Browne et al, 2005a):
i. In-store benefits (increased turnover and greater staff efficiency)
ii. Efficiency gains in distribution vehicle operations
iii. Efficiency gains in distribution centre operations
Identification and quantification of the environmental and social costs and benefits
of relaxing or removing delivery restrictions (in terms of vehicle operations, distribu-
tion centre operations and store delivery operations) would also be necessary. Iden-
tification and costing of the approaches that retailers could take to reduce delivery-
related noise would also be required, together with the potential noise reduction
benefits of these approaches.
Before the implementation of the inner-city night delivery concept, the following key
aspects should be considered (NICHES, 2007b):
The acceptance of night delivery can differ from country to country (for ex-
ample southern cities are seen as more noisy than northern cities);
Technical solutions for low noise equipment are available;
Public financial supports/subsidies can encourage buyers/users to make use
of the low noise equipment;
Existing noise limits have to be respected (on the local, national and interna-
tional level);

49
Local access regulations (for example no access for trucks during night time)
have to be considered and adopted;
Urban space for deliveries has to be available (competition with parking ve-
hicles of the inhabitants);
Infrastructure (for example paving) around the ramps may cause additional
noise and has to be mitigated;
Organisation (and/or technical solutions) of the receiving of the goods during
night times or in the morning at the receiver’s side is needed.
The initiatives should come from the logistics operators and retailers which are sub-
ject to complaints by residents because of night deliveries. The authorities should
then respond positively to the operators’ initiatives and promote the development
of innovative solutions by means of special permitting arrangements and privileges.
It can be difficult to implement inner-city night delivery as a stand-alone solution. It
is then recommendable to implement this solution together with additional meas-
ures related to city logistics (e.g. a zone access control scheme which foresees no or
only limited access for delivery vehicles during daytime) and to consider public sub-
sidies which make the solution more attractive for the transport operators.

50
3.5. Road Pricing Systems
3.5.1. Solution Description
BESTUFS defines road pricing and urban freight transport as “all measures imposing
direct fees for the use of (urban) roads that might be able to influence the urban
freight system. This includes all road pricing measures on urban roads, whether they
concern freight transport or passenger transport. On the other hand it excludes all
(so called “inter-urban”) road pricing on non-urban roads (e.g. motorway tolls, etc.)
as well as other pricing measures such as fuel taxes, vehicle taxes or parking fees”
(Karrer & Ruesch, 2007).
Road pricing may have two main purposes: financing or managing the traffic. The
need for financing is the most common incentive for implementing road pricing. The
money can be used in improving infrastructure, public transport or other areas of
the transport system.
Fees with managing purposes can then in turn have the purpose to improve the en-
vironment or accessibility. They can be used to reduce emissions and noise by reduc-
ing the total traffic load, or to protect a certain area, for example a city center. The
only congestion charging scheme that has mainly environmental purposes is the one
implemented in Stockholm in 2006 (see section 4.2.2.).
Charges can be used to reduce congestion on certain roads or at certain hours, and
thus to increase accessibility in the road network. In this case, the design should be
to charge just where and when the traffic load is high, thereby achieving a maximum
redistribution of traffic to other times, places and mode of transportation.
Existing road pricing schemes can be classified in the following categories (Egger &
Ruesch, 2003):
Single road or single lane pricing, often used for financing new roads.
Network pricing, which in the urban context is limited to the network outside
the city or to major roads leading to the city.
Area pricing, which does not have the drawback of cars switching to alterna-
tive routes, unlike the previous categories.
Cordon pricing, where charges are collected on entry or exits around a whole
area (e.g. inner city)
Complex area pricing, which denotes a distance based area pricing scheme
with charges ideally set equal to social marginal costs. However, this is not a
scheme to start with, as major preconditions (acceptance, standardization of
electronic collecting techniques, etc.) are not fulfilled.

51
Although most urban road pricing projects focus mainly on passenger transport,
freight transport is equally affected in a collateral way. By potentially reducing pas-
senger and overall traffic it might also increase the transport business’ efficiency by
improving
Reliability
Punctuality
Duration of the trip
Security
In the medium and long run, road pricing could eventually contribute to more sus-
tainable urban freight transport. Freight transport is likely to react differently to road
pricing, than passenger transport due to a number of reasons:
Commercial transport has a higher trip value, thus a lower elasticity of de-
mand
Commercial transport operators tend to take their decisions based on ration-
al economic considerations (no cost illusion)
For freight transport there is no efficient alternative available. Yet, pricing
sets an incentive for optimizing the freight business processes.
Urban freight is quoted as one of the beneficiaries of urban road pricing, because,
apart from increasing its efficiency, due to reduced congestion, road pricing harmo-
nises competition as all transport operators participate on the cost of road usage in-
cluding foreign vehicles or vehicles from other regions.
Nevertheless, freight transport professionals are rather skeptical against road pric-
ing, mainly because it imposes new costs on their business. However their attitude
varies from complete rejection to the expectation of benefits.
It is also interesting to notice that the majority of the BESTUFS partners participating
in the material collection, when asked about the importance of road pricing in their
countries, answered that is of little or no importance (Egger & Ruesch, 2003). As far
as urban freight transport is concerned, the importance of road pricing was esti-
mated even lower. An explanation for this can be that there was hardly any urban
road pricing scheme implemented till then (2002). Also the existing urban road pric-
ing schemes focused on passenger transport and on financing rather than demand
management. However, their prediction for the future was that road pricing would
substantially gain importance, both in general and urban freight transport.
The European Conference of Transport Ministers identified cost-effectiveness and
public acceptance being the key issues for road pricing, instead of technical feasibili-
ty. A factor critical to the measure’s success is the clarity of the policy objectives tar-
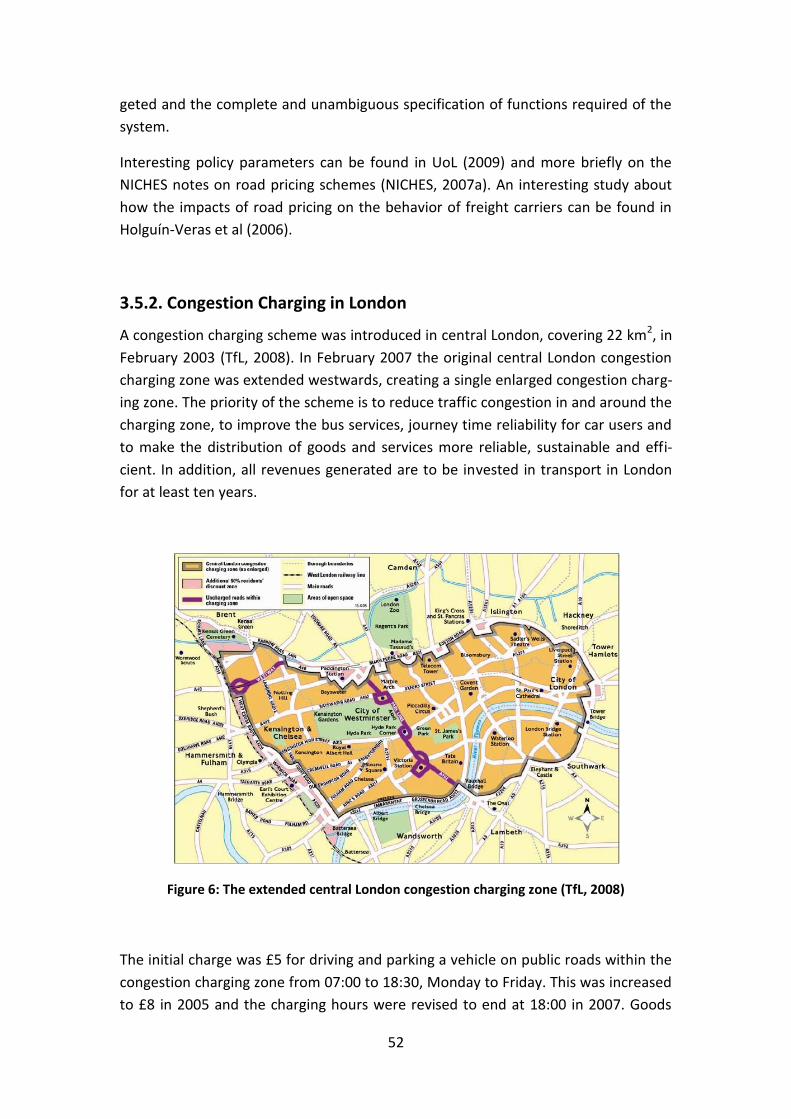
52
geted and the complete and unambiguous specification of functions required of the
system.
Interesting policy parameters can be found in UoL (2009) and more briefly on the
NICHES notes on road pricing schemes (NICHES, 2007a). An interesting study about
how the impacts of road pricing on the behavior of freight carriers can be found in
Holguín-Veras et al (2006).
3.5.2. Congestion Charging in London
A congestion charging scheme was introduced in central London, covering 22 km2, in
February 2003 (TfL, 2008). In February 2007 the original central London congestion
charging zone was extended westwards, creating a single enlarged congestion charg-
ing zone. The priority of the scheme is to reduce traffic congestion in and around the
charging zone, to improve the bus services, journey time reliability for car users and
to make the distribution of goods and services more reliable, sustainable and effi-
cient. In addition, all revenues generated are to be invested in transport in London
for at least ten years.
Figure 6: The extended central London congestion charging zone (TfL, 2008)
The initial charge was £5 for driving and parking a vehicle on public roads within the
congestion charging zone from 07:00 to 18:30, Monday to Friday. This was increased
to £8 in 2005 and the charging hours were revised to end at 18:00 in 2007. Goods

53
vehicles pay the same daily charge as other vehicles. A range of discounts and ex-
emptions are available for certain groups and in respect of certain vehicles, such as
alternative-fuelled and electrically-powered vehicles that attain strict emission stan-
dards.
Vehicles are identified using automatic number plate recognition cameras and are
checked against a database of those who have paid the charge and those who do not
have to pay, as they are exempted for some reason. Once a vehicle for which a
charge has been paid has been successfully matched, the photographic images are
automatically deleted from the database. For those vehicles observed within the
zone for which a charge has not been paid, the photographic images are kept for en-
forcement purposes. Failure to pay the charge results in a penalty charge.
It is important to underline the attention given to vehicle fleet owners (including
goods vehicles). Organisations with 10 or more vehicles can use Fleet Auto Pay and
enjoy a number of benefits:
£7 daily charge per vehicle, instead of £8
Less time spent on administration
Convenient Direct Debit payments
Online account management and telephone helpline
No Penalty Charge Notices (PCNs) for registered vehicles
Possibility to register extra vehicles on the same account
Possibility to add vehicles eligible for a discount (e.g. alternative fuel ve-
hicles), but not vehicles that are exempt from the congestion charge.
However the project’s CITY PORTS Interim report (CITY PORTS, 2005) mentions that
the majority of transport operators assert that the road pricing system is not well
designed because of the limitations imposed on their work. They ask the same ex-
emption from paying as applied to buses, on the grounds that they are also a public
utility service, as well. The access fee is considered as an unfair tax as transport op-
erators cannot avoid it, in the way that other users can.
According to the Sixth Annual Report (TfL, 2008) the congestion charge has reduced
traffic entering the zone by 21% (compared to pre-charging levels), which equals to
some 70,000 fewer cars a day. There is a six percent increase in bus passengers dur-
ing charging hours. The estimated reduction of Light Goods Vehicles and Heavy
Goods Vehicles vehicle kilometres in the zone was -11% in 2005, resulting in a de-
crease in pollutants emissions (Beevers & Carslaw, 2005).
However there has been a recent increase in congestion, back to pre-charging levels,
due to numerous water and gas works, which have greatly reduced the road capaci-
54
ty, in addition to traffic management measures to help pedestrians and other road
users. Of course the congestion problem would be much worse without the charges.
The congestion charging scheme was estimated to be responsible for 8% reduction
in the emissions of NOx, 6% to emissions of PM10 and a reduction of 16% in emissions
of CO2. All these figures were for emissions from all road traffic sources, on an an-
nual total basis. However the trends in measured air pollution remain broadly static.
This confirms the important role of non-charging related ‘background’ factors in de-
termining overall air quality in London. Also, the charge has been a great financing
source for improving the transport in London. In the year 2007/08, 137 million
pounds were raised from the charges. (TfL, 2010)
3.5.3. Other Cities
Other cities with different road pricing systems have been: Singapore (1975), Bergen
(1986) and Oslo (1990) in Norway and Durham City (2002) in the UK. An interesting
form of road pricing which focused on heavy goods vehicles and charged them by
the distance they travelled was introduced in Switzerland (2001), Germany (2003)
and Austria (2004). More information can be found in Ubbels & de Jong (2009), Kar-
rer & Ruesch (2007), Eliasson & Lundberg (2003).
3.5.4. Discussion
Policy makers have multiple choices as road pricing can take different forms. Charges
can be differentiated in various ways (e.g. time of day or location) and revenues can
be used in different ways. So there are many decisions to take for a policy maker
who considers the implementation of road pricing. It is clear that the specific objec-
tive of road pricing will often be a decisive factor in making such decisions. With effi-
ciency as primary objective, the differentiation of charges will be important, as is the
careful determination of charging levels.
Urban freight transport is facing an efficiency problem which is getting increasingly
prominent due to decreasing consignment sizes and more frequent deliveries. Road
pricing can contribute to improve the efficiency of urban freight transport and pro-
vide solutions for problems such as noise, pollution and congestion. In the medium
and in the long run, road pricing could eventually contribute to more sustainable lo-
gistics and distribution strategies and to a more sustainable urban freight transport.
The BESTUFS Best Practice Handbook on road pricing gives the following recommen-
dations concerning the design and operation of a road pricing scheme (Karrer and
Ruesch, 2007):

55
1. The concept design should follow the problems
2. The technical solution should follow the concept design – not the other way
round
3. It is not the majority of ordinary users, but the handling of the few non-
equipped, uniformed or handicapped that is crucial for success
4. The design of the road side equipment can be delicate as it is often installed
in sensitive historic areas (town centres)
5. Include all actors of the transport system, including freight transport, into the
designing process
6. Political and administrative consensus is vital
7. Involve opposing interest groups and build coalitions between them. Get
agreements about how to use the money, give something to both sides
8. Present the project as a compromise, a balanced solution
9. Define and treat the scheme as a technical, environmental, financial problem,
not as an extra tax
10. Illustrate the benefits: the project must be accompanied by advantages clear-
ly visible to the users, both motorists and environmentalists
11. Something is better than nothing: incremental approach, demonstration
projects, pricing for improved capacity is more acceptable than pricing for
demand management; first simple, then complex
12. Find your own way: there is much to be learned from existing projects, but
general recommendations must be adjusted to suit local conditions (traffic
conditions, political system, public opinion, etc.)
Freight transport has so far been sadly neglected by urban road pricing research. It is
strongly advised that freight transport should be considered integrally in future road
pricing projects.

56
3.6. Technological Solutions
3.6.1. Intelligent Transportation Systems (ITS)
The Intelligent Transportation Systems (ITS) is a term generally used to refer to the
combined application of Information and Communication Technologies – ICT, its re-
lated infrastructure, and the necessary legislative/ policy framework, in order to op-
timize transport efficiency and operational sustainability in the future. The freight
operations area of ITS can be defined as “advanced ICT systems aimed at simplifying
and automating freight operations at both the operational efficiency level as well as
the institutional level” (Giannopoulos, 2009).
The BESTUFS Best Practice Handbook on ITS (also called “transport telematics”) iden-
tifies three core features on which ITS tools are based (Karrer et al, 2007):
Information
Communications
Integration
Freight ITS developments (as opposed to Passenger ITS) have been up to now largely
“technology-driven” with emphasis on the introduction of many sophisticated (al-
though mainly stand-alone) systems and technologies that can collect enormous
amounts of data about current status as well as the various planning parameters
concerning the operation of freight transportation systems, and to transmit these
data in one form or another to transportation control centres and databases (im-
peded in ‘virtual transport platforms’) held at authorities, carriers or various inter-
mediaries. Little progress has been made however towards the achievement of inte-
grated and truly ‘intelligent’ systems which are required for the transformation of
these ‘raw’ data into useful information according to the needs of each ‘player’ along
the transport chain.
By the early 2000s the research focused more towards the creation of integrated
web based applications able to be shared by many, over the internet. Original
Freight ITS research produced mainly stand-alone applications that can largely be
classified in the following two broad areas (Giannopoulos, 2009):
1. Commercial Operations, i.e. applications mainly related to the vehicle, the
cargo, or the company (operator) and related in their great majority to sys-
tems for the better monitoring of the transport (e.g. collection and sending of
tracking and tracing data or route choice information, etc.)
2. Fleet Management Systems, i.e. dedicated to the fleet management opera-
tions of a particular operator (or group of operators), including transport
planning.

57
The core of the technological drivers in the freight sector was developed in the nine-
ties and early 2000s and is presented by Giannopoulos (2009):
Mobile transmission technologies such as GSM, allowing transmission of mes-
sages (voice and data) between home-base and vehicles.
GPS (Global Positioning System) technology, enabling for example, Automatic
Vehicle Location (AVL) and Computer-Aided Dispatch (CAD) applications.
Availability of more affordable positioning information via these GPS or GSM
transmission networks.
‘Mobile Internet’ made available via wireless broadband communications for
document exchange and access to ICT services
The XML standard, offering a meta-language for the definition of simple and
non-proprietary data exchange standards.
The various route guidance and navigation systems, i.e. packages of algo-
rithms, electronic networks and software to combine this useful information
to the driver’s assistance.
Onboard sensors performing a variety of functions such as: tracking the ve-
hicle’s mechanical condition, monitoring speed or the state of loading goods,
automatic toll payment, etc.
Systems and hardware for vehicle or load unit identification, e.g. the RFiD
card (transponder).
Smart cards enabling new applications such as the electronic tachograph,
electronic driver license or the storage of load-related information.
The BESTUFS Handbook on ITS identifies a number of applications related to urban
freight transport (Karrer et al, 2007):
Freight and fleet management systems, automatically monitoring of vehicles
and loading, tracking and tracing and proof of delivery, route planning tools;
Electronic management of zones for delivery
Electronic access control
Trucking route signalization
Automatic fee control system in connection with road pricing
Traffic monitoring and traffic control (enforcement)
Electronic operational management of terminals
ITS for the management of dangerous goods transports
On-board computers for delivery vehicles
Electronic freight exchange systems for urban freight transport/ virtual
freight distribution centres e.g. the virtual freight distribution centre (VGVZ)
in Berlin (see Figure 6).

58
Figure 7: Concept for a virtual distribution centre with single projects (Karrer et al, 2007)
Until December 2008, there was no coherent European framework for road trans-
port ITS and for interconnection with other transport modes. On December 16th,
2008, the European Commission issued the “Action Plan for the Deployment of Intel-
ligent Transport Systems in Europe” (European Commission, 2008), which outlined
six priority areas for action. The progress on the implementation of this Action Plan
is to be reported in 2012.
The Action Plan identifies the role of ITS on:
Greening transport by relieving congestion and reducing energy consump-
tion.
Improving transport efficiency, e.g. maintaining a paperless information trail
in the management of the flow of goods (eFreight) or providing Real-Time
Traffic Information (RTTI) services.
Improving road safety and security with the use of Driver Assistance Systems
such as Electronic Stability Control (ESC), Adaptive Cruise Control (ACC), Lat-
eral Support, Collision Warning, Emergency Braking Systems, etc.
Especially in the area of European ITS coordination, the set-up of a specific ITS colla-
boration platform between Member States and regional/local governments to pro-
mote ITS initiatives in the area of urban mobility was planned for the year 2010. The
“Action Plan on Urban Mobility” (European Commission, 2009) included the vision of
assistance on ITS applications for urban mobility to complement the previous Action
Plan. The zoomed areas include: electronic ticketing and payment, traffic manage-

59
ment, travel information, access regulation and demand management, and address
the opportunities opened up by the European Galileo GNSS system. A starting point
was set at the launch of a study on improving interoperability of ticketing and pay-
ment systems across services and transport modes, including the use of smart cards
in urban transport with a focus on major European destinations.
3.6.2. Environmentally-Friendly Vehicles (EFVs)
The introduction of environmentally-friendly vehicles (EFV) into urban transport is
most common in Western European countries at present and Sweden has played a
leading role towards this goal. Public authorities have made resources and financial
support available to encourage innovative freight transport and logistics concepts
including EFV and new vehicle technologies in urban areas, by a mix of incentives
and regulations. Low-emission vehicles can help cities confront problems of air- and
noise-pollution caused by road traffic
Environmentally-friendly vehicles can be running on (Allen et al, 2007):
Alternative fuels, including LPG, CNG, Bio-Fuels and Hydrogen-based technol-
ogy. Technologies and fuels already exist but significant market penetration
has yet to be achieved.
Diesel and petrol. Euro engine emissions standards for goods vehicles are
helping to significantly reduce emissions. Particulate traps can be fitted to
vehicles to capture particulates before they enter the atmosphere.
Electric and hybrid vehicles. Electric vehicles are especially suitable to reduce
noise emissions and produce no exhaust emissions.
The promotion and use of EFVs in urban freight transport has been encouraged by
several urban authorities and national governments (Sweden is a pioneer on the
field, see 4.1). National programmes like the PIEK-programme in the Netherlands or
the French “National Programme on Goods in Cities” have evidenced that there are
successful results to be expected by such programmes and support measures.
Alternative fuels, for instance, can significantly reduce vehicle emissions. The follow-
ing Table is presented by Sathaye et al. (2006):

60
Fuel Considerations
Emulsified Diesel 17-20% decrease for NOx emissions 17-50% decrease for PM emissions Increase for VOC Reduction in fuel economy
Biodiesel Increase for NOx emissions Decrease for PM, CO, hydrocarbons, air toxics
Natural Gas Does not decrease GHG emissions Storage and safe handling difficulties
Propane Decreases NOx and PM emissions by 80% Does not decrease GHG emissions
Ethanol-Diesel Mix Little data available at the time of issue
Table 6: Examples of alternative fuels to diesel (Sathaye et al, 2006)
Key stakeholders involved in EFV introduction schemes are:
Local authorities: the local and regional government needs to initiate a Policy
Strategy for EFVs
Political support: politicians at the local and national level must support the
strategy, especially for tax incentives
Distribution: fuel distributors must be involved
Vehicles: vehicle producers need to be involved in order to get a range of dif-
ferent vehicle models.
Figure 8: Scania’s first ethanol truck which came out in 2008 (SCANIA, 2010)

61
The BESTUFS Good Practice Guide on urban freight transport gives a number of ex-
amples for the following EFV initiatives (Allen et al, 2007):
Informal partnerships: urban authorities, transport operators and urban
businesses have come together to set up sustainable solutions based on a
more environmentally friendly form of urban freight transport
Tax reductions and advantages for EFVs, alternative fuels and the installation
of modern filter technology on diesel vehicles
Freight transport operators that have used EFVs for urban deliveries, often as
part of research projects co-funded by public authorities
Special permission to access parts of the urban area such as shopping and
business districts for vehicles that meet certain emission standards
Road pricing schemes that provide discounts and exemptions for goods ve-
hicles that meet certain emissions standards
Funding of innovative research projects and trials in the field of urban freight
transport by using EFVs
However, there are several obstacles related to the wider use of EFVs. The main fail-
ure factors are (Allen et al, 2007):
Higher operational costs of EFV
Low capacity/volume of electric vehicles
An insufficient filling station infrastructure
Reliability problems and defects resulting in high maintenance requirements
of EFV
Most EFV projects are currently supported by public financial budgets.
3.6.3. Discussion
The intention of this chapter has not been to give a deep review of ITS solutions nei-
ther of all the progress and research currently made on Clean Vehicles, but rather to
give a rough overview of these relatively new technological fields. Below there are
some further recommendations that regard these two fields: ITS first and Clean Ve-
hicles second.
Giannopoulos (2009) foresees the following topics as being the most likely develop-
ments in future ITS:
a) More vehicular and infrastructure intelligence.
b) Improved and more integrated electronics for location, tracking, and com-
munication, and the associated information-technology systems.

62
c) New intelligent models and algorithms to process the data and information
gathered (with the systems developed so far), and transform this information
into timely and meaningful advice tailored to the needs of the different
stakeholders along the different transport chains.
The BESTUFS Best Practice Handbook on ITS (Karrer et al, 2007) notices the complex-
ity of problems in transport and traffic management, therefore concluding that a
comprehensive solution is required for different kind of problems and impacts. Au-
thorities cannot stand alone to find solutions for appropriate ITS solutions. In co-
operation with different interest groups like shop owners and freight transport op-
erators ITS applications should be integrated in urban freight transport policies. The
cities’ authorities can provide data and application about the general traffic situation
in town or introduce traffic flow management for freight movements by usage of
telematics information and communication systems. The special expectations of
freight operators and delivery points have to be taken into account.
Therefore public supported traffic management measures should correspond with
the requirements of freight operators, which mean to integrate companies’ inter-
ests.
Concepts should be developed and should contribute to an economic and consen-
sual solution that would be well accepted among the users. So with respect to finan-
cial investments and time of planning the measures carried out by public authorities
should be supported and checked from independent sides. Because of high invest-
ments in telematics the approach should follow the participation of different inter-
ested parties.
On the field of environmentally-friendly vehicles, most projects are currently sup-
ported by public financial budgets. Private operators tend to change their fleets only
if:
there is a clear financial benefit for the company
there is an adequate alternative fuel station network
there are marketing benefits for the company
the company has a strong commitment to environmental issues
suitable vehicles are available
The success of promoting EFVs often depends on framework conditions like (Allen et
al, 2007):
Emission and environmental regulations and standards
Incentives like tax reduction (fuel price development)
Filling station network availability
Individual transport strategy and deployment of vehicles

63
A combination of incentives and restrictions as used by public authorities in Germa-
ny, France, the Netherlands, and other European countries has shown that develop-
ments in EFV have started. However, only if the operating costs and reliability of EFV
improves compared with traditional fuel technologies will a large-scale introduction
of EFVs be achieved. Public funding and support measures can help to foster and
promote EFVs.

64
4. Case Study: Stockholm
4.1. Introduction – A city in the front line of sustainability
Overview
Stockholm is the capital and largest city in Sweden, situated on 14 islands on the
south-central east coast of Sweden. It is strategically located at the mouth of Lake
Mälaren. Over 30% of the city area is made up of waterways and another 30% is
made up of parks and green spaces. 841,612 people live in the municipality of Stock-
holm which covers 188 km2, 1.25 million people live in the urban area (377.30 km2)
and 2 million in the metropolitan area (6,519 km2), which equals to 22% of the total
country’s population. This population contributes to 28% of Sweden’s Gross Domes-
tic Product (GDP). Stockholm is therefore Sweden’s economic engine.
Figure 9: Stockholm’s location and overview (by author)
Moreover, Stockholm is also Scandinavia’s economic center. Two thirds of the For-
tune 100 companies which have their head offices in Scandinavia have chosen to lo-
cate them in Stockholm. Stockholm is also home to one of the world’s largest ICT
clusters, one of Europe’s largest life science clusters and Northern Europe’s financial
centre. This, combined with the city’s central location and its leading position as a
cultural centre, is what makes Stockholm the capital of Scandinavia.

65
In the 2006 European Innovation Scoreboard, prepared by the Maastricht Economic
Research Institute on Innovation and Technology (MERIT) and the European Com-
mission, Stockholm was ranked as the most innovative city in Europe. Also, an envi-
ronmental survey of the Reader’s Digest Magazine ranked Stockholm as the “green-
est” and most “livable” city in the world in 2007.
Figure 10: View of the city of Stockholm (Flickr, 2010)
The Green City
In 2009 Stockholm was awarded the title as European Green Capital 2010 – as the
first Green capital ever in the European Green Capital Award scheme. The award is
given to a city that (European Commission, 2010):
has a consistent record of achieving high environmental standards
is committed to ongoing and ambitious goals for further environmental im-
provement and sustainable development, and
can act as a role model to inspire other cities and promote best practices to
all other European cities.
Stockholm was the first city to be given this award for a number of reasons related
to the city’s long-lasting environmental policy. Stockholm’s first Environmental Pro-
gramme was launched in the mid 1970s. In 1998, the “Swedish Environmental Code”
(the central legal framework for environmental issues) declared that “the purpose of
this Code is to promote sustainable development which will assure a healthy and
sound environment for present and future generations” (SFS, 1998). In 1999, the
Swedish Parliament decided to “leave a society to the next generation where the
major environmental problems are solved”.
The city has an Integrated Management System which ensures that environmental
issues are included in the city’s budget, operational planning and monitoring. Envi-
ronmental monitoring is accessible to everyone (Stockholm Stad, 2010b).

66
All these years of successful environmental work have turned Stockholm into one of
the world’s greenest cities. More than 90% of the population lives within 300 metres
of a green area. There are extensive plans for developing new green spaces in the
future or improving existing ones, which already cover 30% of the urban area.
At the same time the water quality is maintained at the highest levels all over the
city and swimming and fishing is safe even near the city centre. Drinking water
comes from Lake Mälaren and is treated into two waterworks west of the city. Its
quality is tightly controlled by the Food Administration Authority.
The waste water from Stockholm and some neighboring areas is treated in two
plants with advanced technology for removing nitrogen and phosphorous, exceeding
the ambitions of the EU Urban Waste Water Directive. Biogas is produced in the
waste-water treatment plant and then upgraded for use in public buses as well as
private cars and taxis. The excess heat in the sewage water is recovered for domes-
tic heating. Collection of food waste for biogas is to increase from 4,500 tons to
18,000 tons between 2008 and 2012.
The city has an excellent waste treatment system and uses innovative production
methods such as vacuum controlled underground transportation of solid waste. 25%
of the waste produced by the residents is recycled, 73.5% is recovered for produc-
tion of district heating (energy recovery by incineration) and 1.5% is biologically
treated. More than 70% of the households have access to district heating. The con-
version from oil heating to district heating has reduced greenhouse gas emissions by
593,000 tons since 1990.
Stockholm has also set the ambitious target of becoming a fossil-fuel free city by
2050. CO2 emissions have already been reduced by 25% compared to the levels of
1990 and correspond to 3.4 tons per capita – half of the national Swedish average.
This is made possible by the high proportion of renewable energy for district heating,
reduced traffic congestion, more clean vehicles and green electricity. The City of
Stockholm uses eco-labeled electricity and the aim is for 100% of all the electricity
the city purchases to be environmentally certified.
The public transport system is efficient, reliable and functional. Some 90% of the res-
idents live within 300 metres from public transport with an hourly or more frequent
service. During peak hours, 78% of all trips to the inner city are made by public
transport and 68% of all the trips within the city centre are made on foot or by bi-
cycle. Stockholm has a network of 760 km of cycle lanes which is still expanding. An
internet-based travel planner for bikes, covering both the inner city and neighbour-
ing municipalities is available online (Stockholm Stad, 2010c).

67
Since 1994, Stockholm has actively campaigned for clean vehicles to be introduced
on the market as well as providing adequate infrastructure for fuelling them. The ef-
fort is paying off: clean vehicles make up an impressive 40% of sales. Of the total ve-
hicle fleet in early 2009, 14% were ethanol or biogas-fuelled, hybrid-electric or ultra-
low emission vehicles and the trend is positive. All inner-city buses operate on biogas
or ethanol; 50% of refuse trucks and 40% of taxis either consume biofuels or are hy-
brids. The City of Stockholm’s vehicle fleet aims to be 100% clean by the end of 2010,
and many private companies are moving in the same direction.
An environmentally oriented congestion charge was introduced in 2006 for cars tra-
velling in and out of the inner city area during day time hours (see section 4.2.2.).
The emission reduction levels were approximately 10-15% and the traffic was re-
duced by around 20% improving the air quality by 2-10%.
The city has integrated this environmental policy with its development projects. Two
new eco-profile residential areas are being built, using the experienced gained from
the innovative Hammarby Waterfront (Hammarby Sjöstad - see section 4.3.1.). Lo-
cated on former brownfields, the Stockholm Royal Seaport aims at being fossil fuel
free by 2030 (see section 4.3.3.). The area is intended to be a showcase for sustaina-
ble urban construction where innovative environmental technology and creative so-
lutions are developed, tested and presented. The city district is to be an example for
other cities to follow, a world class environmental urban district.
International Programmes
Stockholm is famous for its pioneering action for the promotion of environmentally-
friendly (‘clean’) vehicles, already since 1994. The city participated in or coordinated
many European or world-wide projects in that direction, but also other aspects of
urban goods distribution have been researched as well. The most important of these
projects are roughly described below.
In 1996, eight European cities signed the Stockholm Resolution pledging their sup-
port for zero and low emission vehicles as an important element in providing sus-
tainable urban mobility. This was the beginning of the ZEUS project (Zero and low
Emission vehicles in Urban Society) which lasted for three years and showed the
great potential in improving the conditions for zero and low emission mobility in Eu-
ropean cities. ZEUS (European Commission, 2000):
identified and clarified market barriers;
identified actions cities could take to reduce or remove barriers;
took active steps to break down market barriers; and

68
tested several types of vehicles, fuels and complementary transport planning
measures.
The project IDIOMA (Innovative Distribution with Intermodal freight Operation in
Metropolitan Areas) supported innovative projects in urban freight transport in dif-
ferent cities. During the period 1999-2001, different concepts aimed to improve the
distribution of goods within urban areas, including Stockholm. Regarding Stockholm
in particular, the aim was to implement technical solutions for coordinated compo-
site distribution by Frigoscandia, a large transport provider of temperature-
controlled logistics services. They tested a vehicle equipped with the specially de-
signed IDIOMA refrigerator cabinet to supply goods to the Burger King restaurants in
Stockholm. The technology used and tested was a multi-temperature vehicle which
enabled the simultaneous distribution of goods with three or more types of temper-
ature requirements (European Transport, 2002).
Stockholm also took part in the ELCIDIS (Electric Vehicle City Distribution) project, a
very successful project which gained great publicity on the field of clean vehicles.
The ELCIDIS project tested a better solution for urban logistics by approaching the
subject in a dual way, in order to set an example for clean and efficient urban distri-
bution in the 21st century (European Commission, 2002):
by organising urban distribution using quiet and clean hybrid-electric vehicles
by achieving a more efficient organisation of urban logistics by more efficient
routing of the vehicles and the use of urban distribution centres (UDC)
The ELCIDIS project ran from March 1998 till August 2002 with objective to provide
the viability of (hybrid) electric vans and trucks for urban distribution, preferably
with the use of an Urban Distribution Centre, showing the environmental benefits of
such an application and promoting incentives for the use of those vehicles.
ELCIDIS in Stockholm focused on the introduction of nine vehicles, six hybrid trucks
(Mercedes Benz 1217 Atego - weight 12 tons) and three electric vans (Citroën Berlin-
go Electrique) for goods distribution in the city centre and region. The nine environ-
mentally adapted vehicles replaced regular diesel and petrol vehicles and thus
helped to reduce pollution and noise in Stockholm.
As a main result, the project succeeded in verifying the principal merits of using (hy-
brid) electric vehicles in urban delivery concepts. ELCIDIS provided indisputable
proof that there are no predominantly objections to the use of hybrid and electric
vehicles in urban distribution, neither from the company managers nor from drivers,
and certainly not from local authorities.
Company managers benefited from the positive publicity for using these vehicles.
Drivers also found the performance of these vehicles very satisfactory. Local authori-

69
ties welcomed the view on a realistic future solution for their transport related envi-
ronmental problems.
The largest European programme in which Stockholm participated (and coordinated)
has been the Trendsetter project of the CIVITAS Initiative (2002-2006). The objec-
tives of the city Stockholm, during that time, were (Civitas Trendsetter, 2006b):
to reduce the emissions of fossil CO2 by 20% from 1990 to 2005
to reduce the emissions of NOx reaching a daily average not exceeding
60μg/m3 by 2006
to reduce the emissions of particulates, reaching a daily average not exceed-
ing 100 μg/m3 by 2006
to reduce the share of residents that are exposed to noise maximums higher
than the recommended level to 10%, i.e. 50% reduction
to increase the number public transport passengers by 100,000 by 2005 (15%
increase)
to increase the number of clean vehicles to 5,000 by 2005 (5% of the public
and private fleet)
to maintain its leading position in the field of clean vehicles and gain a lead-
ing position in the field of sustainable transport management.
Through the Trendsetter project, the city aimed at the following targets:
to reduce annual fossil CO2 emissions by 9,300 tons by 2005
to reduce annual NOx emissions by 70 tons by 2006
to reduce annual particulate emissions by 1,850 tons by 2005
to reduce the share of residents exposed to noise maximums higher than
recommended level to 10% within the environmental zones
to increase the number of clean vehicles to 300 by 2005
to increase cooperation with other European cities
The explicit measure titles of Trendsetter in Stockholm were:
Widening of the environmental zone (see 5.2.1.)
Congestion charging (see 5.2.2.)
Smart card systems and integrated ticketing
Reduced parking fees to promote clean vehicles
Increased public transport passengers
Material logistics centre – to optimise freight deliveries at a construction site
(see 5.3.1.1.)
Logistic centre for Old Town of Stockholm (see 5.3.2.)

70
Figure 11: Trendsetter activities on the map of Stockholm (Civitas Trendsetter, 2006b)
Make bicycling attractive
Creation of a visitor web for optimal trip planning
Traffic monitoring and supervision
Accessible road network (street data)
More adaptive signal control in a bus priority system
Clean and efficient heavy-duty vehicles
Waste collection with biogas-fuelled vehicles
Clean municipal fleets
Making clean vehicles less expensive
Increasing clean vehicle use in private company fleets
Web-portal for drivers of clean vehicles
Improved biogas refueling infrastructure
Particularly on the field of logistics, there were two measures included in the Work
Package 9, titled “WP9: New Concepts for the Distribution of Goods”. The first
measure (WP 9.1) “Consolidation of material to large construction site” consisted of
the establishment of a logistics centre in the developing area of Hammarby Sjöstad.

71
The project was a major success with both environmental and financial benefits for
the actors involved and gained world-wide recognition. The second measure (WP
9.3) “Consolidation of restaurant supplies in medieval Old Town” was mainly driven
by a medium/small-sized private company which faced many difficulties on its way
to persuade clients use its logistics centre. However the project managed to work for
some years. Both these projects are described in detail further below.
The Trendsetter project also included measures to promote clean vehicles, such as
providing 26 clean (biogas) trucks, reducing parking fees for clean vehicles, increas-
ing the number of clean vehicles in the municipal fleet, promoting the use of biogas-
fueled vehicles for waste collection, improving biogas refueling infrastructure and
subsidizing the purchase of private clean vehicles. A web-portal for promoting clean
vehicles and sharing information was also created (Miljöfordon, 2010).
The project also assisted the preparation for the implementation of the Trial scheme
of the congestion charges in 2006. The target of widening the Environmental Zone by
including the developing area of Hammarby Sjöstad was not fulfilled because of con-
struction delays. Therefore, attention was given to increasing compliance with the
zone rules, which was also very successful.
Although some of the activities were altered all delayed, the most important targets
of the Trendsetter project have been met. For example, the target for an increase of
clean vehicles was 300 but the achieved increase of 3,000 was far greater. The
Trendsetter project contributed very clearly to the increase in clean vehicle sales.
The targets of reducing CO2, NOx and noise were fulfilled. The bio-fuelled vehicles
were satisfactory for the drivers. The use of fossil resources decreased. Finally, the
cooperation between stakeholders in Stockholm increased.
On December 2005, Stockholm was hosting the NICHES Workshop, when the OS-
MOSE Awards were launched in order to reward local authorities who have shown
the courage to introduce innovative and daring measures in the urban transport
field. Stockholm did not receive an OSMOSE Award, but was rewarded as a ‘Gold
Star Winner’ for the city’s long term strategy to promote clean vehicles in three le-
vels of action: political (procurement), infrastructural (introduction of filling sta-
tions), vehicle/bus (pre-commercial procurements).
Stockholm was the coordinating city of the BEST project (Bioethanol for Sustainable
Transport) which dealt with the introduction and market penetration of bioethanol
as a vehicle fuel, establishment of infrastructure for supply and fuelling of bioetha-
nol, and the introduction and wider use of ethanol cars and flexible fuel vehicles on
the market. The project was co-financed within the 6th framework programme and
lasted from January 2006 to December 2009. Ten demonstration sites participated,
located in Europe, China and Brazil. During the project (Miljöförvaltningen, 2009):

72
77,000 flexifuel cars and 310 E85 pumps were demonstrated at nine sites;
190 bioethanol buses and 12 ED95 pumps were demonstrated at five sites;
Four conventional vehicles were converted to run on bioethanol;
Three hybrid electric vehicles running on an E25 blend were tested;
Several different low blends were tested;
There was extended guidance of followers on issues of vehicles and fuels dis-
tribution, fuel standards, fuel handling regulations, tariff information and
clean vehicle definitions;
Incentives and disincentives for market development were identified;
There was a sustainability assessment for up-scaling of bioethanol production
and consumption;
There were lifecycle analyses of various bioethanol supply chains and contri-
butions to developing biofuels certification frameworks.
The project was very successful in demonstrating that bioethanol is a reliable and
environmentally-friendly alternative to fossil fuels. The technology is currently under
development and further energy-efficiency can be achieved. Biofuelled trucks are
already in the market with satisfactory results. The project increased Stockholm’s
prestige in clean vehicles promotion and innovation.
Stockholm is currently participating in the CLEANTRUCK project of the LIFE European
programme. CLEANTRUCK will run from January 2010 to December 2013 and its pri-
mary objective is to demonstrate the commercial and technical viability of alterna-
tive fuels and new technologies for goods distribution vehicles. It is planned to con-
struct: filling pumps for the alternative fuels ethanol ED95 and biomethane; filling
stations for CO2 for use as a refrigerant in order to reduce the use of hydrofluoro-
carbons (HFCs); and mobile stations for N2 to inflate tyres. The project will also facili-
tate the procurement of 30 ethanol ED95 trucks, 30 dual-fuel trucks and 20 electric-
hybrid trucks by private distribution companies. The project will further support in-
novations by training around 100 drivers in ‘Heavy-Eco-Driving’ (European Commis-
sion, 2010d).
Road freight transport in Sweden: policy and facts
As has been already mentioned, the Swedish political system is in general very sensi-
tized in environmental issues. The road transport sector has received great attention
as it is a major polluter. The overall goal of transport policy in accordance with the
Swedish Parliament’s decision in 1998 is to ensure a socio-economically efficient
transport system that is sustainable in the long term for individuals and the business
community throughout the country. This goal is divided into six subsidiary goals:
73
an accessible transport system, where the road transport system is designed
to meet the basic transport needs of individuals and the business community
a high level of transport quality, aided by the design and performance of the
road transport system
safe roads, where the long-term goal of road safety is to eliminate fatal or se-
rious injuries as a result of road accidents
a good environment, aided by the design and performance of the road trans-
port system
a regional development, aided by the design and function of the road trans-
port system
a gender-equal road transport system, designed to fulfill the transport needs
of both men and women.
In 1998, Sweden introduced an eco-label for freight transport (Caceres and Richards,
2000). Green procurement means that companies include environmental perfor-
mance when choosing transport services. Transport chain environmental manage-
ment involves life-cycle analysis of the impacts of manufacture, distribution, use and
retirement of products. Transporters are evaluated in terms of their environmental
impacts. In 1998, Swedish State Railways launched the GreenCargo service brand
which offers environmentally-labeled, door-to-door overnight transport.
At the end of 2006, a large number of companies, researchers, organisations and
public authorities joined forces to work towards a shared goal: to reduce the climate
impact of goods transport on Swedish roads. The joint initiative bears the name “On
the road to climate neutral freight transportation (KNEG)” and aims to halve emis-
sions from the typical Swedish long-haul transport operation by 2020 compared with
2005. The 16 current participants are seeking to accomplish this ambitious goal by
(Trafikverket, 2010):
increasing the efficiency of transportation logistics (optimal use of transport
modes, better use of existing freight capacity, eco-driving)
increasing the efficiency of fuel production (high lifecycle energy efficiency,
high energy density, energy efficient fuel production with low CO2 emissions)
increasing vehicle efficiency (energy efficiency, technological improvements)
increasing the use of renewable fuels (increase low-blending, second genera-
tion renewable fuels by 2015)
Among the partners of the initiative, the Swedish Road Administration committed to
contribute to the common purpose by:
implementing eco-driving requirements for all driver’s licenses
supporting trucking companies who want their trucks to observe speed limits

74
supporting the development of new transportation solutions that make it
possible to leverage the road network for longer and heavier vehicles
supporting the development of innovative solutions for deliveries in urban
settings
The increasing need for road transport, with all the unpleasant consequences that it
implies, is the main responsible for this level of sensitivity and awareness that is no-
ticed. Road freight transport accounts for 40% of all freight transport modes (in
ton-kilometers) in Sweden, but it is responsible for more than 90% of the total CO2
emissions from freight transport (SIKA Statistik, 2009). In addition, the share of the
road mode in freight transport is expected to increase to 45% in 2020 (SIKA Statis-
tik, 2005).
According to Transport Analysis (Trafikanalys, 2010b) for the year 2009, the Swedish
road freight transport was 35 billion ton-kilometres, vehicle mileage was 2.6 billion
kilometres, the amount of goods carried was 334 million tons and the number of
shipments was 37.7 million, for the whole country. Empty trips were 568 million km,
approximately one quarter of the total mileage.
The above numbers imply great reductions in road freight traffic in comparison to
2008, which can be explained by the recession which resulted in a decrease in the
demand for freight transport. Specifically, road freight ton-kilometres decreased by
17 percent, professional vehicle mileage decreased by 10 percent, quantity of goods
decreased by 9 percent and the number of shipments by 1 percent.
According to the same report (Trafikanalys, 2010b), in 2009, businesses within the
Stockholm County received 36.5 million tons of goods through road transport, of
which 74 percent was coming from locations within the same County. There were
95.276 light trucks and 12,128 heavy trucks registered in the Stockholm County, and
43,494 light trucks and 4,404 heavy trucks registered in the city of Stockholm, in
2009 (Trafikanalys, 2010a). In 2008, 1.9% of the light trucks and 1.7% of the heavy
trucks registered in the city of Stockholm were alternative-fuelled vehicles (SLB-
analys, 2009).
There is little data concerning urban freight movements in Stockholm. In a report
presented by BESTUFS in 2006 (Browne and Allen, 2006), the authors reported only
five types of freight data collection surveys available at the time. They were all con-
ducted on national level and the possibility to extract urban data was considered
very difficult (with the exception of the road accidents police reports).
Åkerman and Höjer (2006) showed that with the current growth rate in transport,
the sustainability targets for reduced energy use in 2050 are impossible to achieve,
even with the use of advanced technological systems, as they are expected to be in
75
2050. In their sustainable model, freight transport per capita needs to decrease by
27% compared to the levels of 2000, something that is totally opposite to the cur-
rent trends.
Since the implementation of the Congestion Charging System (the Trial in 2006 and
the permanent implementation in 2007) there is some information about the
amount of trucks crossing the tax cordon during the charging hours (6 am.-7 pm.). In
2008, there were 64,135 truck passages towards the inner city of Stockholm during
charging hours. They account for 18% of the incoming vehicles (SLB-analys, 2009).
Green logistics strategies in Stockholm
Stockholm’s location on 14 small islands makes the transportation difficult both re-
garding transit traffic and traffic inside the city. Stockholm has about one million in-
habitants and about 1.5 million living on reasonable commuting distance. There is
political support for making the city’s transport system even more environmentally
compatible by substituting conventional vehicles with clean vehicles and making lo-
gistics services more effective. More effective and attractive public transport means
combined with intelligent traffic information technologies are other important fields.
In the following sections of this chapter we are taking a close look to some city logis-
tics strategies that involved various levels of interference and support from the city
authorities, from total (like the Environmental Zone and the Congestion Charging
System) to partial (like the various logistics centre schemes). Of course, this thesis
cannot cover every possible logistics strategy that has ever been implemented in
Stockholm, especially when it comes to private, single-company consolidation cen-
tres, which also exist in the area. The case-studies presented in the following sec-
tions (4.2 and 4.3) match the following criteria: originality, different levels of public
authorities’ interference and availability of relative information.
According to BESTUFS (Karrer and Ruesch, 2007), the first ‘urban freight platforms’
appeared in the Stockholm area in the 1950s, when transport companies started
building terminals for distribution in the area. The terminals were also used for sto-
rage of goods on demand. Later they were connected to the railroad network so that
freight trains could enter directly into the terminal. However, it was just one compa-
ny per terminal and there was no cooperation. Today, there are many platforms of
single transport operators or forwarders (wholesalers), which have been under con-
stant growth. New terminals are built a few miles outside the city, usually with a rail
connection.

76
Although particularly among the forwarders there are efforts made to cooperate
over company borders, examples of multi-company distribution centres are scarce.
There have been a number of trials, but most of them have failed for different rea-
sons. There is also some restraint in the land use planning regulations when it comes
to traffic disturbance from freight platforms. In some Swedish cities there are restric-
tions of the truck sizes, while in Stockholm, as we will see, there is the Environmental
Zone which regulates truck engine class.
In this research we came across two other multi-company logistics centres that we
do not present in detail. The first one was built in 2002 by 5 transport companies (2
more joined later), consulted by the transport research institute TFK. The platform,
which was a completely private initiative named ‘Stocodist’, covered 35,000m2 in
the outskirts of Stockholm. It was built to handle fruit and vegetables coming from
central Europe by road, destined for distribution in the city. Distribution was made
by a neutral single transport company which was paid a monthly fee by each partici-
pant company. The key element of this cooperation is that none of the companies
involved considers distribution as their core business and hence there is no fear of
losing in competitiveness by contracting a third part for that service (Karrer and Ru-
esch, 2007).
Another effort for goods consolidation, this time driven by the public authorities,
was made in 2005-2006, when a contract was signed with DB Schenker. The project
‘Miljöeffektiva varuleveranser’ (‘Environmentally efficient goods deliveries’) aimed
to (1) separate shipments from supplier agreements, (2) coordinate a local distribu-
tion, (3) apply environmental requirements on goods vehicles, and (4) improve the
city’s supply system. The project was hoping to use consolidation to replace 3-4 truck
deliveries a day by one or two deliveries per week (Vägverket, 2008).
During the project the following negative factors have been observed (Miljömiljar-
den, 2006):
Difficulty of information exchange. It became obvious that there is no com-
munication framework between the city stakeholders;
The city’s decentralized organisation. The various participants have priorities
of their own and are not ready to commit to a common target in the same
level;
In a large organisation (such as DB Schenker) it takes a long time to prepare
and enforce any decision.
Although the preparations for the project were costly and took more than a year to
complete, the project had to cease early, after just 2 months of operation, due to a
different political party winning the national elections. There is still interest in the
project by the political opposition, but the elections of 2010 did not bring any change

77
to the political governance of Sweden, so it is not likely that there will be any action
in this direction in the following few years.
Recently there has been a proposal by members of the Environment and Health Ad-
ministration which suggested an integrated use of logistics centres to serve three
major areas in Stockholm, but it was not approved for funding (Hugosson and Sun-
nerstedt, 2008). A rough design of the proposal can be seen in Figure 12. This pro-
posal could serve as basis for new ideas.
Figure 12: The rejected proposal of Hugosson and Sunnerstedt (2008)
On other fields of city logistics strategies, things have been better. We have already
shown how Stockholm has been a leading city on the field of promoting clean ve-
hicles over the last 16 years. However, the progress in the field of Intelligent Trans-
port Systems and Services (ITS) must not be ignored.
The former Swedish Road Transport Administration (SRA) drew up a national ITS
strategy for the period 2006-2009. The three primary goals of this strategy have
been (Vägverket, 2005):
Improving road safety by increasing compliance with rules and regulations in
commercial traffic and organised passenger transport,
Improving accessibility for work-related journeys for gainfully employed per-
sons on designated commuter routes in metropolitan areas and other major
labour market regions in the country,

78
Improving efficiency of commercial traffic on a designated commercial road
network.
The strategy is characterized by a clear and customer-oriented target image that is
combined with a reliable and efficient working method. The main areas to achieve
more efficient commercial transports have focused on making progress towards a
robust goods transport network and on achieving faster and more reliable bearing
capacity information. ITS measures related to commercial transport include (Vägver-
ket, 2009):
Queue-warning
Weather warnings
Operator-controlled free-text Information
Journey time information
Information about temporary diversions/road works
Lane/motorway control
Road-user charging in urban areas
Monitoring and control of hazardous goods transport
Figure 13: Information flows to and from the Traffic Management Centre (Trafik Stock-
holm, 2010)

79
The newly-formed Swedish Transport Administration has four traffic management
centres all around the country. Trafik Stockholm is the one servicing the area of the
capital through a number of different channels (see Figure 13). The centre is respon-
sible for the delivery of information about the current situation to the general public
via radio, internet and mobile services. Moreover the centre handles calls reporting
incidents on Stockholm city’s streets, public squares and parks.
Additionally, there is a number of websites which provide professional and non-
professional drivers with traffic information and route selection services.
Trafiken.nu (2010) offers a comprehensive and current picture of the traffic
situation for an easier journey planning
Läget på vägarna (2010) offers information about traffic conditions, road-
works, weather conditions and camera locations on a high quality map
Godstrafiken.nu (2010) gives extensive information about all different types
of freight transport in order to facilitate sustainable and cost-effective trans-
port solutions
Yrkestrafiken.se (2010) has been developed to help users in the road trans-
port industry to get easy access to information, application forms, and self-
service applications by bringing together material from several Swedish au-
thorities regulating commercial traffic.
Swedish Transport Authorities and Organisations
There are a number of active authorities within transportation in Sweden. On April
1st 2010, the Swedish Rail Administration (Banverket), the Swedish Road Administra-
tion (Vägverket) and the Swedish Institute for Transport and Communications Analy-
sis (SIKA) were phased out. Instead, the Swedish Transport Administration (Trafik-
verket) and Transport Analysis (Trafikanalys) began operations. The new authorities
cooperate with LFV (the LFV Group – Swedish Airports and Air Navigation Services),
the Swedish Maritime Administration (Sjöfarsverket) and the Swedish Transport
Agency (Transportstyrelsen).
The active authorities in transport have the following responsibilities (Trafikverket,
2010a):
The Swedish Transport Agency (Transportstyrelsen) stipulates rules and
monitors how they are followed, grants permission (driver’s licenses and cer-
tificates), registers change of ownership and manages congestion and vehicle
taxation.

80
The Swedish Transport Administration (Trafikverket) is responsible for long-
term planning of the transport system for all types of traffic, as well as for
building, operating and maintaining public roads and railways. The Swedish
Transport Administration is also responsible for administering the theoretical
and driving tests needed to receive a driving license and taxi driver badge, as
well as the theoretical test for the professional know-how needed for a
transport license and certificate of professional competence.
Transport Analysis (Trafikanalys) reviews bases for decisions, assesses
measures and is responsible for statistics.
LFV is responsible for civilian and military air traffic control in Sweden, as well
as for safety and development of Swedish air space.
The Swedish Maritime Administration (Sjöfarsverket) is responsible for safe-
ty and navigability at sea, as well as for building, operating and maintaining
navigation infrastructure.
The National Public Transport Agency (Rikstrafiken) works to achieve basic
accessibility of interregional public transport via procurement, for example.
The transport-related publications of the Swedish Transport Administration and the
former Swedish Road Administration are very useful and can be found in the rele-
vant websites.
A significant organisation in the field of research and innovation is VINNOVA (The
Swedish Governmental Agency for Innovation Systems). It is a State authority that
aims to promote sustainable and social growth through funding research and devel-
oping efficient innovatory systems. VINNOVA’s activities cover a broad range of
fields, with transportation being a major one among them. Within the field of trans-
port, VINNOVA has focused on three areas: innovative vehicles, vessels and their sys-
tems, innovative logistics systems and freight transport as well as infrastructure and
efficient transport systems.
Framtida Handel (Future Trade) is a pioneering alliance between companies, local
authorities, regions and the Swedish government aiming to achieve sustainable
trade in convenience goods. The common vision was formulated in 2005 and since
then it has served as a basis for goals, strategies and proposals for specific action.
TFK is a prominent private research organization in the transport and logistics area
which was founded in 1949 and aims to improve efficiency, reliability, safety and
sustainability in the transport sector. TFK disseminates results through reports, pres-
entations, conferences and seminars.

81
4.2. Logistics Strategies on city-level
4.2.1. The Environmental Zone
Introduction
The Environmental Zone in Stockholm (as well as in Göteborg and Malmö) came into
force on the 1st of July 1996 and was probably the first environmental zone to pro-
tect a city centre in the world. The city of Lund also developed its own Environmental
Zone since January 1999 and the city of Helsingborg since 2008. Uppsala, Umeå,
Örebro and other cities have also have performed studies about the possibility of
developing their own Environmental Zone.
Heavy vehicles constitute 5% of Stockholm’s vehicle fleet, but are responsible for
40% of hydrocarbon emissions. The objective of the Environmental Zone was to re-
duce air pollution (and secondarily noise pollution) and maintain accessibility to the
city centres of these Swedish cities. It is an important tool to reduce nitrogen oxides
and particulate matter coming from heavy-duty vehicles and acts as a complementa-
ry emissions standard for the new vehicles that are used in the city. It plays an im-
portant part in the government’s plan to achieve higher quality in the urban envi-
ronment.
The National government approved of the use of this measure, which was voluntarily
implemented by the municipal governments. The areas that were characterized as
‘environmentally sensitive’ and were included in the Zones were areas that (Trafik-
kontoret, 2008):
contain a big number of apartment buildings
have streets with many pedestrians and cyclists
contain buildings that are particularly sensitive environmentally
contain parks or green areas that are easily harmed by the environmental ef-
fects of traffic
The Zone in Stockholm includes the districts of Södermalm, Kungsholmen, Vasastad-
ten, Norrmalm, Östermalm and Ladugårdsgärdet, covering an area of approximately
35 km2 (5 x 7 km) with about 250,000 residents and 280,000 work places.
Exempted through routes are Essingeleden including the part of Drottning-
holmsvägen which joins Tranebergsbron, Söderleden, Klarastrandsleden,
Stadsgårdsleden, Långholmsgatan, Västerbron and Götgatan. Klarastrandskopplet,

82
Kungsbrokopplet and Kungsbron between Kungsbrokopplet and Terminalslingan, the
Riddarfjärd exit and access, Södra Järngraven are also exempted.
Figure 14: Overview of the Environmental Zone of Stockholm (Trafikkontoret, 2008)
Project Development
In 1992, there was a change in the traffic legislation (1972:693) that allowed local
authorities to take measures that confine the traffic of trucks heavier than 3,5 tons
with diesel engines, in urban areas. So, in the spring of 1993, the city council of
Stockholm decided that all diesel vehicles that don’t keep up with the standards of
environmental class 1 would be forbidden to access the city after 1997.
The cities of Stockholm, Göteborg and Malmö made concerted efforts to develop
proposals for the environmental zone of each city and to develop a common regula-
tory framework for all three of them. There were also discussions on the extension
of the legislation on more types of vehicles such as buses, light trucks and passenger
cars. The scheduled date for the enforcement of the Zones was on 1 January 1996.
In January 1994 a proposal was made by the Real Estate and Traffic Administration
and was sent to the Urban Planning Authority, the Stockholm County Police, the
Highway Authority, the Environmental Protection Agency and to a further number of

83
major companies and organizations. The consultation would be managed by the Real
Estate and Traffic Administration.
In 1995 it was decided that the Environmental Zone would be introduced in April
1996, prohibiting the access of diesel-powered trucks over 3,5 tons, which did not
belong to environmental class 3 or better. In 1999, demands would be placed on en-
vironmental class 1 or equivalent. For the transitional period of 1996-2000, all mod-
els which would have been 6 years old or less would be admitted in the zone. Envi-
ronmental classification regulations were in accordance to the corresponding Euro-
pean rules.
Exemptions were proposed to be granted for special vehicles of different types, like
fire trucks. Public transport vehicles would also need to be exempted from the high
expectations.
The Zone included the so-called internal traffic area, as it is known to the drivers. The
area was marked by prohibiting road signs. Some major routes were exempted by
the provisions. Before the northern parts of the “Rings” were developed, Vallha-
lavägen and Lidingövägen were also excluded. Exemptions were also made for spe-
cial vehicles, bus traffic and foreign distribution vehicles. In order to verify that a ve-
hicle complied with the regulations, it brought on its windshield a visible mark of en-
vironmental sensitivity (8x12 cm), identifying the vehicle’s travel time within the en-
vironmental zone.
The decision to introduce the Environmental Zone was appealed by the Stockholm
County Haulage Contractors. Highway Authority also complained that the regulations
were discriminating in favor of foreign vehicles owners. The Zone would apply only
for Swedish-registered vehicles. The final starting date for the implementation of the
Environmental Zone was set for 1 July 1996.
The Environmental Zone was introduced on the planned date. The main rule was
that a vehicle would belong at least to the environmental class 3 or it would be less
than 8 years old (since the date of registration).
The first joined evaluation for the three Environmental Zones took place at the end
of 1997. It spanned a wide field, from compliance monitoring to environmental and
socio-economic assessments.
In May 1998, a new exemption was added to the regulations, after a decision of the
City of Stockholm. The vehicles that were exempted were vehicles that were 6 years-
old or younger and met the Swedish environmental criteria, even though they didn’t
meet the European classification criteria.

84
The Stockholm Environmental Zone took part in the European Civitas project Trend-
setter, during 2002-2006, which aimed to reduce the city’s traffic congestion and en-
vironmental impact. The project focused on ways to increase compliance among the
Zone users. The target of widening the Zone to include Hammarby Sjöstad was post-
poned for the future because of delays of the district’s construction. The project also
included ways to provide better information to drivers and companies and regulate
penalties for the violators (Civitas Trendsetter, 2006b).
Eventually, the Trendsetter project yielded positive results, since the understanding
and obedience of the Environmental Zone increased. Also, the acceptance of clean
vehicles increased as a result of this measure.
In 2002 a new rule, concerning the emissions of nitrogen oxides, was added to the
existing rules of carbon oxides and particulate matter emissions. The new rule was
based on the age of the vehicle, rather than on the Swedish concept of environmen-
tal class. That means that even foreign-registered vehicles become subject to the
rules.
In 2007 there was a new definition of “environmentally sensitive areas” and in-
cluded: “areas where many people gather, for instance parks, green passage ways,
sensitive buildings, streets with many users and areas exposed to noise and exhaust
fumes or where there is a risk that environmental quality standards are exceeded.”
In order to move towards a regulatory framework that was based on issues other
than the age of the vehicle, but also to comply with the European Commission’s re-
quirements, the four cities with an Environmental zone and the Ministry of Industry
jointly submitted a proposal for new regulations. The new rules came into force on
the 1st of January 2007, Trafikf rordningen (1998:1276). The new rules meant that
each municipality can decide on its own about developing an Environmental Zone or
not, but is subject to the same rules and emission standards as every other munici-
pality with a Zone. The municipalities can only decide upon the geographical area of
their Zone. The Traffic Office in Stockholm decided on December 11th 2006, that the
area of the local Environmental Zone remains the same as applied since 1996.
The Environmental Zone Rules
The basic rules to be followed in the Environmental Zone area are the following.
More details can be found at DieselNet (2010).
All heavy, diesel-powered trucks and buses are permitted to be driven in the
Environmental Zone for at least six-years, calculated from when the vehicle is
first registered, regardless of the country of registration.

85
Euro 2 or 3 vehicles can be driven in an environmental zone for eight years. In
both cases the time is calculated from the year in which the vehicle was first
registered.
Euro 4 vehicles can be driven in an Environmental Zone up to and including
2016, regardless of the year of registration.
Euro 5 vehicles can be driven up to and including 2020, regardless of the year
of registration.
Monitoring of the rules in the Environmental Zone is a police task. The illegal traffic is
punished with fines. Compliance with Environmental Zone rules is the responsibility
of the drivers. The fine is currently 1000 SEK (approx. €106)
Figure 15: Compliance levels in Stockholm’s Environmental Zone (Trafikkontoret, 2008)
During the period of participation in the Trendsetter project (2002-2006), obedience
to the zone rules has increased, as is shown in Figure 15.
Changes in the Heavy-duty Vehicle Fleet
The following table shows the number of trucks broken down by different types of
fuel. The vast majority of trucks (>3.5 tons) in traffic operate on gas. It is also clear
that there were no trucks running on gas inside Stockholm or Stockholm County in
1996.

86
Diesel Gasoline Ethanol Natural gas/ Biogas/ Mo-tor gas
Municipality 1996 3,658 225 1 0
Municipality 2007 4,108 119 0 70
County 1996 10,011 591 2 0
County 2007 12,168 306 1 113
Table 7: Total registered trucks in traffic for different fuels (Trafikkontoret, 2008)
Figure 16 below shows the average age of heavy diesel-powered vehicles on the
road in the municipality of Stockholm and Stockholm County between 1996 and
2007. It is shown that the average age of these vehicles has been reduced for the
specified period. The medium age of buses has fallen by 1.5 years and the medium
age of trucks has fallen by 0.5-1 years. It is very clear that trucks registered in the
Stockholm Municipality are younger than those registered in the Stockholm County
Figure 16: The average age for heavy diesel vehicles in traffic between 1996 and 2007 (Tra-fikkontoret, 2008)
The proportion of newly registered heavy duty diesel vehicles in the municipality of
Stockholm and Stockholm County between 1996 and 2007 is shown in Figure 17. The
proportion of newly registered buses in the Municipality is the largest and most vari-
able, between 10 and 30%. It could be due to the fact bus contractors make major
contracts where parts or whole fleets are replaced simultaneously. The freight
transport industry consists of smaller actors who buy a few trucks at a time. It must

87
not be ignored, though, that some of the vehicles may have not been registered and
used immediately after their purchase, so they could be older models than the year
of registration.
Figure 17: Percentage of newly registered heavy-duty diesel vehicles from 1996 to 2007 (Trafikkontoret, 2008)
Environmental Impact
The emissions that are related to each Euro class can be seen in the following table:
Table 8: Emissions for diesel engines according to European standards [g/kW4] (Trafikkon-
toret, 2008)

88
To watch the environmental impact of the Environmental Zone, emissions of particu-
late matter (PM), hydrocarbons (HC) and nitrogen oxides (NOx) were measured in
1997 and 2000. The methodology used was different in each case.
During the first year of operation of the Environmental Zone:
Particulate matter emissions decreased by 15-20%
Hydrocarbon emissions decreased by 5-9%
NOx emissions decreased by 1-8%
The estimates made in 2000 showed that:
Particulate matter emissions decreased by 40% compared with a situation
without an Environmental Zone
Hydrocarbon emissions decreased by 25% compared with a situation without
an Environmental Zone
NOx emissions decreased by 10% compared with a situation without an Envi-
ronmental Zone
The impact estimated for the first year of the operation of the Zone (1996-1997) was
not as big as expected. The reason is that most of the users chose engine replace-
ment instead of control devices, vehicle fleet was not so old as had been assumed in
the preliminary calculations and vehicles that were purchased were not the latest
model.
The latest study on the impact of the Environmental Zone was conducted in 2007
(Trafikkontoret, 2008). The methodology used to estimate the reductions is based on
four different scenarios:
1. The real emissions of the actual heavy duty vehicle fleet of the city of Stock-
holm
2. The emissions that would correspond to a vehicle fleet with the characteris-
tics of the fleet of the wider Stockholm County
3. The emissions that would correspond to a vehicle fleet with the characteris-
tics of the fleet of the whole of Sweden
4. The emissions that would correspond to a vehicle fleet with the characteris-
tics of the fleet of Sweden without the cities that have an Environmental
Zone (Stockholm, Göteborg, Malmö and Lund in 2007)
So, if one wants to estimate the environmental impact of the Environmental Zones
should directly compare the results of the first and the last scenario. The estimated
emissions of hydrocarbon, nitrogen oxides and particulate matter can be seen in the
following figures.

89
Figure 18: Emissions of Hydrocarbon from heavy trucks in the Environmental Zone in 2007 (Trafikkontoret, 2008)
In the first Figure we can see that the hydrocarbon (HC) emissions in 2007 in the
Stockholm Environmental Zone were about 11,000 kg. The estimates for a heavy du-
ty vehicle fleet (>3,5 ton) with the characteristics of the Stockholm County fleet
would be just under 13,000 kg. The estimates for a heavy duty vehicle fleet with the
characteristics of the whole Swedish fleet would be just over 13,000 kg. And the es-
timates for a fleet that would look like what the national fleet would be without the
Environmental Zones are almost 14,000 kg.
Figure 19: Emissions of nitrogen oxides (NOx) from heavy trucks in the Environmental Zone in 2007 (Trafikkontoret, 2008)
Figure 19 shows the emissions of nitrogen oxides from heavy goods vehicles in the
Stockholm Environmental Zone in 2007. Emissions in the city of Stockholm were
more than 137,000 kg. Emissions from vehicles similar to the Stockholm County ve-

90
hicles would be approximately 141,000 kg. Emissions from vehicles similar to the av-
erage Swedish vehicles would be approximately 142,000 kg. Emissions from vehicles
similar to the average Swedish vehicles, without including the Environmental Zone
cities, would be 143,000 kg.
Figure 20: Emissions of particulate matter from heavy trucks in the Environmental Zone in 2007 (Trafikkontoret, 2008)
Figure 20 shows emissions of particulate matter (PM) from heavy trucks in the Envi-
ronmental Zone in 2007. Emissions for the Stockholm City vehicle fleet were about
4,000 kg. Emissions from a fleet similar to the Stockholm County fleet would be ap-
proximately 4,500 kg. Emissions from a vehicle fleet similar to the average Swedish
fleet would be just below 5000 kg. Emissions from a fleet similar to the average
Swedish fleet would be almost 5,000 kg.
Summing up the results of the 2007 impact assessment, the Environmental Zone in
Stockholm reduced emissions of nitrogen oxides by 3-4%, hydrocarbon by 16-21%
and particulates by 13-19%, compared with a situation without the Zone.
The above results are bound to some great uncertainties in the type of data used.
Calculations are based mainly on statistics of the number of registered vehicles and
the average mileage in Stockholm, but the vehicle can be registered at an address,
moving in a different geographical area. There are thus no data on which vehicles are
actually operating in the Environmental Zone and the proportion of their total mi-
leage carried out in the Zone.

91
Conclusions
Some issues that were pointed out by the Trendsetter project had to do with the
need to change the national laws, which had often been a barrier to the Environ-
mental Zone implementation. Other barriers in Stockholm have been the procure-
ment laws imposed by EU directives and the case law, which has slowed down the
implementation process considerably.
The Environmental Zone clearly forces new technology on the market by encourag-
ing the purchase of cleaner or upgrading vehicles, which has noted effects on nitro-
gen and particle emission and concentrations. An advantage to this is that the opera-
tion cost is put upon the polluter. Thus the Environmental Zone follows the “pollu-
ter-pays” principle (Rapaport, 2002).
The City of Stockholm is considering possible further developments of the Environ-
mental Zone. The focus is drawn to the possibility of including restrictions for cars
without catalytic converters and commuter routes, and also adding stricter environ-
mental requirements to the existing ones. Passenger cars and light trucks/buses
could be included. Other restrictions may concern specific streets and also there
should be some stimulation of an early introduction of newer vehicles and require-
ments for transport plans for larger businesses.
The City of Stockholm has currently (2007) no plans of widening the Environmental
Zone area. Earlier thoughts about including the newly built (planned to be completed
in 2017) area of Hammarby Sjöstad, are no longer considered. Stockholm City can
propose changes in the regulatory framework but has no right to take decisions (Tra-
fikkontoret, 2008).
The example of Stockholm and the other Swedish cities has been followed by many
other cities around Europe and around the world. Different names, like “Low Emis-
sion Zones” or “Clear Zones” have been given to similar practices (Civitas Trendset-
ter, 2002). These strategies have proved their success in mitigating the negative im-
pacts of urban freight transport.

92
4.2.2. The Congestion Charging System
Introduction
The Congestion Charging System was introduced as a demonstration project, with
the name ‘The Stockholm Trial’, from January 3 till July 31, 2006. It included a road
toll scheme, formally a tax decided by the national parliament, supplemented by ex-
tension of public transport services from August 22, 2005 to July 31, 2006.
The stated purpose of the Trial was to test whether the efficiency of the traffic sys-
tem can be enhanced by congestion charges. The toll was expected to reduce con-
gestion, increase accessibility, and improve the environment. The targeted traffic
reduction across the cordon was of 10-15%. This target was based on previous stu-
dies on the design of road toll schemes in Stockholm.
Figure 21: The Congestion Charging area and checkpoints (Transportstyrelsen, 2010)
The area of the toll zone is about 45 square kilometres. The zone has a little less than
300,000 inhabitants, of which approximately 60,000 commute to workplaces outside

93
the zone. The zone also has 23,000 workplaces, employing approximately 318,000
persons, of which more than two-thirds are commuting from outside the zone.
The Trial turned out to be a milestone in the development of urban road pricing, as it
was the third full-scale demonstration of an urban congestion charge, after Singa-
pore and London. It achieved to change the general public opinion in favor of tolls.
This finally resulted in the implementation of a permanent scheme from August 1st
2007, following a referendum vote. A similar congestion charge is also planned for
the city of Göteborg for the year 2013
Project Description
The “full-scale trial in Stockholm” was conducted in an attempt to reduce congestion
and improve the environment. It included the trial implementation of a congestion
tax, expanded public transport services and more park and ride facilities near city
access roads. Principal players involved were the City of Stockholm, Stockholm
Transport (SL) and the Swedish Road Administration (SRA).
The objectives of the full-scale trial were (Vägverket, 2006):
to reduce traffic to and from the city by 10 – 15 % during rush hour
to achieve a better level of service in Stockholm city traffic
to reduce the emissions of carbon dioxide, nitric oxide and particulate matter
to offer a better urban environment for the residents
The City of Stockholm was responsible for coordination with other municipalities and
for providing general information about the full-scale trial, such as why it was being
conducted. It was also responsible for surveys and evaluations. Stockholm Transport
was responsible for the expansion in public transport during the trial period as well
as for the construction of park and ride facilities and information related to this. The
Swedish Road Administration was commissioned to build and operate the system for
the congestion tax, including the collection of the tax and public information on this
regard.
On June 2, 2003 the Stockholm City Council passed a decision to conduct a trial im-
plementation of environmental charges in the Stockholm inner city zone. A special
Environmental Charges Secretariat was set up for investigation, coordination and
information purpose. The inquiry concluded that congestion charges had to be col-
lected as a state tax, as it is stated by the Swedish law that a charge can only be le-
vied when the payer receives something in return. Due to the fact that the payment
only provided the right to use existing infrastructure, the congestion charge was con-

94
sidered to be a tax. Further, as a municipal authority was not allowed to tax anyone
other than its own inhabitants, the congestion tax had to be a state tax.
The Congestion Tax Act (2004:629) was issued on June 17, 2004 after being ap-
proved by the Swedish Parliament. The Swedish Road Administration was commis-
sioned to ensure that it had contracted the necessary equipment by the 1st of Sep-
tember 2004. Preparations for the full-scale trial initiated in April 2005. The ex-
tended public transport became active on August 22, 2005 and the Congestion Tax
was implemented on January 3rd, 2006.
The Congestion Tax in Stockholm was the second in the world to be based on a time-
differentiated scheme, after Singapore. It was active on working days from 6:30 a.m.
to 18:29 p.m. and followed the amount variation that is shown in the following table:
Time 6:30-6:59
7:00- 7:29
7:30- 8:29
8:30- 8:59
9:00- 15:29
15:30- 15:59
16:00- 17:29
17:30- 17:59
18:00- 18:29
Tax (SEK)
10 15 20 15 10 15 20 15 10
Table 9: Tax amount per vehicle crossing (Transportstyrelsen, 2010)
The same time-variation was kept after the permanent implementation of the Con-
gestion Charge in 2007, and the maximum tax amount per vehicle per day is 60 SEK.
There is no Congestion Tax during weekends, public holidays (and the day before)
and July.
Passages which are subject to tax made by a vehicle during one month are aggre-
gated in the form of a tax decision and the amount is to be paid in arrears. The Swe-
dish Transport Agency will send a payment slip to the owner of the vehicle at the
end of each month. The payment slip will also include information about the number
of passages and the amount per day. The tax must be paid into the Swedish Trans-
port Agency’s congestion tax account no later than the date stated on the payment
slip. If the tax is not paid on time, a surcharge of SEK 500 (€ 53) will be made.
Exemptions from the Congestion Charge
The following vehicles are exempted from the Congestion Charge:
emergency service vehicles
buses with a total weight greater than 14 tons

95
diplomatic cars
motorcycles
vehicles registered abroad
military vehicles
‘green’ vehicles running completely or partially on electricity or gas other
than LPG or on a fuel blend consisting primarily on alcohol
Especially the exemption of green cars was planned to cease after August 1st, 2012,
but a new rule ceased the exemption of green cars from the congestion tax if they
are registered after January 1st, 2009. The main reason for this alteration was that
the percentage of green cars grew very rapidly and threatened the congestion-
reducing ability of the charges. ‘Green cars’ are considered those that have been cer-
tified to be able to use any of the following fuels: bio gas, E85, ethanol, electricity,
producer gas, methane, methanol, natural gas or hydrogen (Transportstyrelsen,
2010).
Finally, an exemption, known as the ‘Lidingö rule’, is made for vehicles that pass two
different control points within 30 minutes, one of which must be a control point at
Gasverksvägen, Lidingövägen or Norra Hamnvägen. This exemption had to be made
because the island of Lidingö (approx. 30,000 inhabitants) in the northeast of Stock-
holm is only connected to the rest of Sweden by a road that goes through the toll
cordon. Essingeleden, the western relief road is also free to move through the
charge cordon.
The Technical System
The development, construction and operation of the technical system were con-
tracted to IBM Svenska AB, which in turn engaged a number of sub-contractors. With
only 14 months of preparation time available, the system was built and ready to
function on the appointed day.
Eighteen control points have been set up at Stockholm city entrance and exit roads.
Vehicles are registered automatically both on the way in and out of the inner city
zone. The traffic flow is not affected as drivers do not have to stop or slow down
when crossing a control point. There are two ways to identify vehicles:
through photographing their number plates, or
via the onboard unit, for those vehicles that have one.
The congestion tax system consists of four principal components:
roadside equipment to collect passage information

96
pre-processors, to process the information from the control points and gen-
erate tax decisions
a business process platform, to book tax decisions, handle payments, re-
minders and reports
a web portal – with both a public website and an Intranet for the benefit of
the Customer Services and the National Tax Board.
The technical equipment at a control point is installed on three gantries or columns
above the carriageway and in a control cabinet at the side of the road. Cameras for
photographing the rear and front number plates are installed on the first and third
gantry, respectively. Laser detectors and transceiver aerials for vehicle identification
via the onboard unit are mounted on the middle gantry.
Figure 22: Roadside equipment. A. Cameras for rear number plates, B. Laser detectors, C. Tran-
sceiver aerials, D. Cameras for the front number plates. 1. The aerials transmit a signal to the onboard unit and receive information to identify the vehicle, 2. A photograph of the front number plates is taken using infrared technology, 3. When the vehicle has driven past the second laser beam the rear
number plates are photographed (Transportstyrelsen, 2010)
The information from cameras, laser detectors and onboard units is sent to the Mul-
ti-Lane Controller (MLC) unit in the control cabinet at the roadside. There the ve-
hicles’ passage information is packaged in a file that is forwarded to the pre-
processor. The pre-processor processes the files from the control points and gene-
rates a tax decision for every vehicle. If the pre-processor cannot identify automati-
cally the number plates, the images are sent for manual identification. For privacy
reasons, the photos show only a small part of the car around the plates, and not the
passengers and the cabin.
97
For every vehicle subject to the tax, the various amounts for crossing control points
during the day are added up to generate a tax decision, which cannot exceed the
amount of SEK 60 per day. Then the tax decisions are sent to the business process
platform for handling. Passage information is stored in a database until the tax id
paid and the case is closed. The business process platform also generates the re-
minders sent to vehicle owners who have not paid in time.
The system has worked out brilliantly so far, managing to handle traffic data without
losses at a percentage of 99.997% for 82 million vehicle passages in 2008. This level
of capacity shows that only a catastrophic failure such as a sustained power outage
at a payment point could result in any loss of data.
An important tool for communicating with the public has been the creation of the
full-scale trial website (Stockholmsförsöket, 2010), which was replaced by the Swe-
dish Transport Agency’s website (Transportstyrelsen, 2010). In the page ‘Mina skat-
tebeslut & Preliminära dygnsbelopp’ (‘My tax decision & Provisional daily amounts’)
vehicle owners can find information about their own current tax decisions and how
to pay them. Onboard units can also be ordered from this website.
Customer Services have also been in use for giving the public an opportunity to find
quick answers to their personal questions and matters. A peak of 10,000 phone calls
a day was reached during the first months of the trial period.
Traffic Effects
Based on traffic simulations made before the trial a 10-15 % reduction of the number
of vehicles crossing the cordon was expected during the charging hours. To make
these changes measurable, the traffic data of 2005 (before the charges) were col-
lected and compared with the later measurements (with the charges).
Traffic effects appeared immediately (Fig. 23), reducing traffic across the charging
cordon by approximately 30 % during the first week, before settling down at a sur-
prisingly stable decrease of about 22 % less traffic than the corresponding periods of
2005. When charges were abolished, August 1st, 2006, traffic immediately jumped
back to almost its old level. In fact there was a remaining traffic decrease of about 5-
10 % compared to 2005 (Eliasson, 2008).
The exact size of the residual effect is uncertain, since data from the period August
2006 to July 2007 (from the end of the trial to the reintroduction of the charges) are
less reliable due to road works and technical problems with the measurement
equipment. The reason for the residual traffic decrease in not certain and it should
not be found in factors such as changes in fuel prices, because they are too small to

98
cause such a large decrease. It is possible that some car users developed new travel
habits during the trial, which remained even when the trial was over.
Figure 23: Average number of vehicle passages across the congestion tax cordon between 06:00 and 19:00. Dashed lines indicate the periods without charges. The percentages at the bottom
are traffic decreases relative to 2005 (Eliasson, 2008).
Since the re-introduction of the charges in August 2007, traffic has once again de-
creased and stabilized around 18 % compared to 2005 levels. The paper of Eliasson
(2008) explains this small traffic increase (compared to -22% of the 2006 trial period)
by increasing population and car ownership, a steadily increasing share of exempted
alternative-fueled cars (from 3 % during the trial to 13 % during 2008), and by infla-
tion which caused the average charge to drop in real terms. The paper also points
out that this increase would not have been possible without the charges, due to road
capacity constraints. However, the official traffic analysis of the Traffic Office finds
that there is no traffic increase between 2008 and 2009, and therefore, identifies an
“unusually large reduction of traffic during the first months of the trial in 2006, ra-
ther than a significant increase of traffic since that time” (Trafikkontoret, 2010). This
large reduction during the trial can be explained by bad weather conditions during
the winter, and by a difficulty for the drivers to adapt to the new system and under-
stand it.
The percentage of passages of vehicles that were exempt from the tax grew steadily
to reach 28% in autumn, 2008. It was mainly the alternative fuel vehicles that were
responsible for this increase (from 3% in 2006 they reached 13% in 2008) and, since
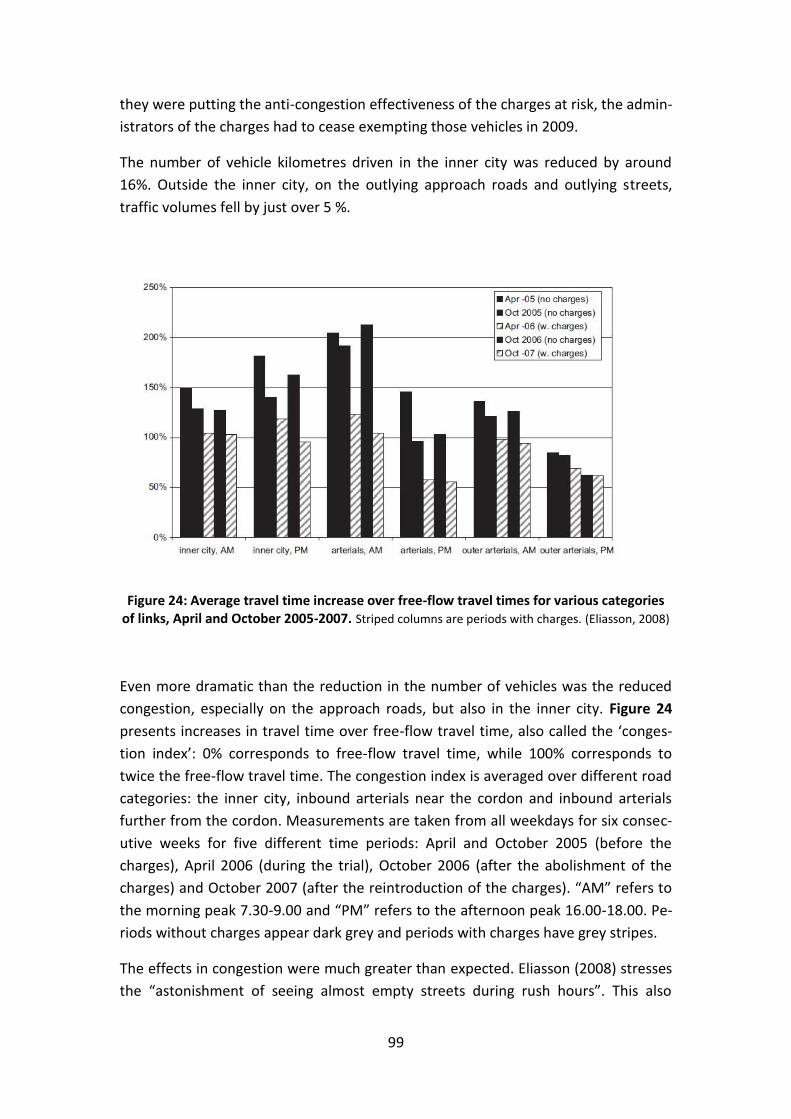
99
they were putting the anti-congestion effectiveness of the charges at risk, the admin-
istrators of the charges had to cease exempting those vehicles in 2009.
The number of vehicle kilometres driven in the inner city was reduced by around
16%. Outside the inner city, on the outlying approach roads and outlying streets,
traffic volumes fell by just over 5 %.
Figure 24: Average travel time increase over free-flow travel times for various categories of links, April and October 2005-2007. Striped columns are periods with charges. (Eliasson, 2008)
Even more dramatic than the reduction in the number of vehicles was the reduced
congestion, especially on the approach roads, but also in the inner city. Figure 24
presents increases in travel time over free-flow travel time, also called the ‘conges-
tion index’: 0% corresponds to free-flow travel time, while 100% corresponds to
twice the free-flow travel time. The congestion index is averaged over different road
categories: the inner city, inbound arterials near the cordon and inbound arterials
further from the cordon. Measurements are taken from all weekdays for six consec-
utive weeks for five different time periods: April and October 2005 (before the
charges), April 2006 (during the trial), October 2006 (after the abolishment of the
charges) and October 2007 (after the reintroduction of the charges). “AM” refers to
the morning peak 7.30-9.00 and “PM” refers to the afternoon peak 16.00-18.00. Pe-
riods without charges appear dark grey and periods with charges have grey stripes.
The effects in congestion were much greater than expected. Eliasson (2008) stresses
the “astonishment of seeing almost empty streets during rush hours”. This also

100
played a huge part in enhancing public acceptance of the charges and literally turn-
ing public opinion in favor of them, as the effects were so visible. The press also cov-
ered this effect enthusiastically.
There is lack of data to support any definitive analysis on the charges’ influence on
traffic safety. The congestion charging cannot be held responsible for any change in
traffic accidents, although it increased average speeds by reducing congestion. Re-
search remains to be made on this field.
Effects on Commercial Transport
The impact of Stockholm’s congestion charging on commercial transport is difficult
to evaluate, because the initial targets of the charges did not include improving
goods distribution’s efficiency. Since there was no such objective, there was also no
need for monitoring and measuring this impact. Therefore, there is a surprising ab-
sence of data and research related to how and if commercial transport was affected
by the charges. The only two studies available concern the Stockholm Trial and no
research has been done since the charges’ permanent implementation in 2007.
There is one study (Transek AB, 2006a) that measured the impact of the Stockholm
Τrial on different vehicle categories, by comparison to data from 2004. It showed
that the light truck traffic had declined by 22% and heavy truck traffic had declined
by 13%, between 2004 and 2006. However variations on the different city entrances
were significant. For example light trucks that went through Mariebergsbron in-
creased by more than 50% during the Trial. In total commercial traffic accounted for
22% of the total passages through the tax cordon, in 2006.
An interview-based study (Transek AB, 2006b) with truck drivers and transport com-
panies was carried out during the Stockholm Trial, and provides a good view on how
the charges were perceived by the freight transport sector. The study held inter-
views with drivers and management from three major transport companies that op-
erate in and around the area of the charges cordon. The study provided the follow-
ing results:
The congestion charges improved accessibility for distribution vehicles in the
inner city. The greatest change was noticed around noon, from 10:00 to
13:30 (see Figure 25).
The total annual number deliveries remained unchanged, but the deliveries
were made faster, increasing each vehicle’s productivity by 25 percent.
There have been changes in route selection. Bergshamraleden and Trane-
bergsbron are no longer preferred, due to increased congestion. A newly pre-
ferred street is Klarastrandsleden.

101
The average speeds measured were unchanged in some routes, reduced in
some junctions and increased in some other parts. The measurements were
made for a trip from the Lund industrial area to Stockholm centre and cannot
give general results.
The transported weight increased by about 7 percent since the previous year,
but this could equally be due to the economic boom or actions of individuals.
The total number of deliveries remained unchanged but the number of deli-
veries per hour increased by 25 percent (from 4 to 5).
Figure 25: Freight deliveries in the inner city during the day. (Transek AB, 2006b)
The opinions expressed by the drivers and management were quite uniform and are
listed below:
Transport to and in the inner city was made easier at the beginning of the
Trial, because of reduced traffic congestion.
The problem with cars parked on loading/unloading zones remained the
same.
Transport through Essingeleden, Tranebergsbron, Bergshamraleden, Järva
krog, Stäketleden and Södra länken was delayed.
Transport speeds have increased in some entrances, such as Kista-Norrtull.
The transport industry was undergoing a renaissance and any impact on the
number of shipments cannot be securely related to the charges.

102
The biggest problem reported by the transport companies was the adminis-
tration of the tax payment. They had to make different payments for every
different vehicle, instead of registering the entire fleet together.
Apart from the new tax they had to pay, an additional cost was created by in-
creased traffic in previously uncongested roads.
The average company’s cost created by the congestion tax was between 1,500 and
2,000 SEK per day or 210,000 SEK for the whole Trial period. Extra administrative
costs of dealing with transponders, controlling the tax and other extra work were
estimated at 100,000 SEK. Thus, the total costs of the congestion charge for a trans-
port company during the seven months of the Trial were around 300,000 SEK (or €
32,000).
However a study of equity effects of the Stockholm Trial showed that commercial
traffic (regarded as a group) has a net gain even before any share in revenues (Tran-
sek AB, 2006c). The value of travel time gain is (on average) higher than the conges-
tion tax paid (Figure 25). According to this study, the adaptation costs are so low that
they do not show up in the chart.
Figure 26: Direct road-user effect for personal, commercial and business travel in SEKm/year (Transek AB, 2006c)
The Environmental Manager of Schenker Åkeri AB (one of the companies inter-
viewed in the second study) argued that the company will save 38 vehicles per day in
the inner city because of the increased accessibility. Other truck operators consider
it unfortunate that there are no environmental initiatives for heavy transport. Al-
though there are no green vehicles on the market, there should be the possibility to
reward high standards vehicle fleets.
103
In general the transport companies did not notice any direct impact of the conges-
tion tax on the business. They were initially positive about the congestion relief dur-
ing the first three months of the project, but later on, they noticed an increase of
congestion to the old levels. Overall, they were not satisfied by the Stockholm Trial,
mainly because of the administrative issues related to the payment of the taxes
(Transek AB, 2006b).
However it is possible that these administrative problems of the tax payment might
have been eliminated by the introduction of automatic Direct Debit payments. The
fleet owner can create a prepaid account for all the vehicles of his fleet and have the
congestion tax paid automatically. It is also possible to choose from two different
modes of tax announcements:
Single notifications – an .avi or EDI file per vehicle
Collective notifications – a collective .avi or EDI file containing the total for all
vehicles registered in one or more organisation’s account or branch account.
It needs to be further investigated if these modifications have eliminated the admin-
istrative problems faced by transporters and reduced the extra administrative costs.
Opportunities for Evening Distribution
An interesting pilot project investigating evening distribution in the district of
Östermalm began in November 2005. The project was initiated by the Dialog Forum
“Framtida Handel” which is mentioned in the introductory section of this chapter.
The evaluation of the results has been carried out by Chalmers Energy Centre CEC.
Two wholesale companies were involved in the project. The original plan was to
choose delivery times between 17:00 and 20:00 in the evening. However, in most
cases the actual delivery times were between 16:00 and 18:00. The main reason for
this was lack of flexibility from the retailers’ side.
The main results of the pilot project can be summarized as follows (Franzén and
Blinge, 2007):
There was a clear reduction of the trip time by about 10 minutes (total trip
duration: 85 minutes), during the congestion charging scheme.
There was a clear reduction of trip time to about 15 minutes for evening dis-
tribution (18-20 pm) compared to afternoon distribution (14-18 pm).
The estimated environmental impact was at least 20% lower per vehicle dur-
ing the project. The impacts are related to the average speed of the vehicles.
It is easier for the drivers to unload the vehicles at the specific loading bays
outside of morning hours, as there are fewer competitive vehicles around.

104
However, the number of passenger cars parked (wrongly) in loading zones
along the streets was higher. Overall, it is less stressful for the drivers.
The success with evening distribution is dependent on the attitudes of the
shop keepers.
Another key issue is the ability of the transport company to effectively plan
new routes during evening hours.
The project ended in November 2006. The project offered valuable knowledge on
the issue of off-peak-hours distribution in Stockholm. No data was found to indicate
that similar activities were carried out after this project, and since the permanent
implementation of the charges.
Environmental effects
Changes in road traffic patterns have affected the emissions of pollutants. The pro-
portion of alternative-fueled vehicles on the total number of vehicles has increased
from 3% during 2006 to 14% at the end of 2008. In fact, exemption from the conges-
tion tax was the single most significant incentive for those buying alternative fuel
cars. Alternatively fueled buses also increased from 6% to 38% for the same period.
Out of the total vehicle kilometres travelled in the City of Stockholm, the proportion
of alternative fuel vehicles has increased from 4% in 2006 to 10% in 2008. Petrol-
fueled vehicles have decreased, while diesel fuel vehicles have increased. The pro-
portion of heavy traffic (buses and trucks) has remained unchanged during 2006-
2008. Among the heavier trucks, alternative fuel vehicles only make up a couple of
percent.
During the Trial, CO2 emissions originating from motorized vehicles in the inner city
fell by between 10 and 14 percent as a result of the congestion tax. Reductions of a
further 4 percent have been estimated since the permanent implementation of the
congestion tax.
Carbon monoxide emissions have dropped about 15% between 2005 (without tax)
and 2008 (with tax). Particulate matter (PM10) emissions in the inner city have
dropped by around 15 to 20 percent with the tax. Nitrogen oxides have decreased by
around 10 percent for the same period.
In the case of particulates, PM10, the increase in clean vehicle fleet is indifferent,
because they originate from road surface wear due to studded tyres. The drop in
their percentage noticed during the measurements could be due to meteorological
conditions, and not due to the congestion tax.

105
It is not very clear exactly how much is the contribution of the congestion charges to
environmental improvements in the city, but it can be said that: i) emissions have
declined faster than what they would have done otherwise, due to more alternative
fuel vehicles, and ii) traffic volumes have been somewhat lower during periods of
congestion charge (SLB-analys, 2009).
Conclusions
Transportation systems worldwide are undergoing a shift from supply side tech-
niques to demand management. The reason for this is that “we can’t build our way
out of congestion” (Replogle, 2006). On that ground, the Congestion Charging sys-
tem is turning out well for Stockholm. The cost-benefit analysis (Eliasson, 2009)
shows that the system will have recovered its investment cost in 4 years in terms of
social benefits and in 3,5 years in financial terms. The achievements against conges-
tion and pollutants emissions have been significant and on accordance to the targets
that were initially set.
An issue that was raised from this research is that there has been hardly any evalua-
tion of the charges’ impacts on freight transport, particularly since their permanent
implementation in 2007. It is necessary that more research is carried out on this
matter. It is not known if there have been changes on trucks’ travel patterns after
the end of the Trial and after the permanent implementation. The pilot project with
evening distribution showed that different logistics practices can be successfully
combined. Success is more likely to occur when these practices consist parts of an
integrated transport policy.
It should also be examined if the problem with tax payment still remains for the
transport companies. It is likely that this problem has been solved with automatic
payments by Direct Debit. Another problem that the drivers reported to be unaf-
fected by the charges was illegal parking on loading zones. Other measures are ne-
cessary to deal with this.
However, the current view of these professional road users – the freight carriers –
remains unknown. Three and a half years after the permanent implementation of
the charges, it would be interesting at least, if not useful, to know the transporters’
opinion on this traffic management scheme, which after all, is still a recognized
green logistics solution.

106
4.3 Logistics Strategies on district-level
4.3.1. Hammarby Sjöstad – Logistics Centres in a new urban
area
Introduction
Situated not far from the inner city, the area of Hammarby Sjöstad was an entirely
industrial area until the early nineties, and since then, it has been Stockholm’s larg-
est urban development project. The cornerstone of the project was to introduce an
environmentally strong profile to a new mixed residential and office area.
As a result, Hammarby Sjöstad is now an exciting new district of Stockholm where
urban intensity is contrasted with tranquil green areas and waterways. The area is
generously provided for means of public transport, carpools, light rail trains and
commuter boats. And it counts its own environmental programme for managing se-
wage, waste water and local energy production.
Figure 27: Location and overview of Hammarby Sjöstad (Poldermans, 2005)
Since day one, the City Council has imposed tough environmental requirements on
the buildings, technical installations and traffic management in Hammarby Sjöstad.
The overall environmental goal was that the impact placed on the environment by
emissions from Hammarby Sjöstad should be a massive 50% lower than the corres-
ponding level for newly constructed housing areas dating from the early 1990s in

107
Stockholm. This strategy has been known as “dubbelt så bra” (double as good) (Pol-
dermans, 2005).
The plan involves an area of about 200 ha (2 km2 of which 40 ha is water) between
Skanstull and Danvikstull and concerns both areas north and south of the Hammarby
lake (“Hammarby sjö”). The complete district will have around 10,800 apartments for
24,000 citizens and 290,000 m2 for commercial use (new offices, light industry and
retail). This plan kicked off in 1995 and should be realized in 2017. It was estimated
to cost around 20 billion Swedish Crowns (around 2 billion euro), of which the City of
Stockholm contributed 4 billion Swedish Crowns (some 400 million euro) (Exploater-
ings Kontoret, 2010).
Everyone living in Hammarby Sjöstad is part of an eco-cycle which handles energy,
waste, sewage and water for both housing and offices. In this eco-cycle, combustible
waste in the area is recycled as heat; food waste is converted into biogas; and energy
is produced in a renewable fuel district heating plant in the area.
This eco-cycle which represents the core of the environmental and infrastructural
planning was developed by the Stockholm Water Company, Fortum (energy compa-
ny) and the City of Stockholm Waste Management Administration. It is known as
‘The Hammarby Model’, and can be seen in Figure 28.
Figure 28: The Hammarby Model (Hammarby Sjöstad, 2010)

108
It shows sewage processing, energy cycles, refuse and the stations and plants where
treatment takes place. The complex model also shows the importance of biogas for
citizens: it is used in the kitchens and as fuel for cars and buses as well. This is an en-
vironmentally friendly solution which reduces emissions. The strong point of the
model is its holistic approach to infrastructure service provision and its integration of
otherwise separate systems in order to accomplish the environmental objectives set
forth by the local parliament.
4.3.1.1. Construction Consolidation Centre (CCC)
The building process in Hammarby Sjöstad is a long and difficult process with a huge
environmental impact for the surrounding area. Incoming heavy truck traffic during
the peak period of the constructions was estimated as one truck delivery every 40
seconds. This peak period was expected to start in mid 2001 and last for five years
(however the intensity of the construction works became lower after two or three
years) (Persson and Bratt, 2001).
Thus a construction consolidation centre (CCC) was created in the entrance of the
site and opened its gates on March 23rd, 2001. It received all small deliveries (less
than four pallets) and stored the construction materials temporarily. Deliveries were
then made with special vehicles to the different construction locations in accordance
with the construction time plans. The centre was set up and operated over a 2.5
years. In December 2003 it was dismantled and moved into a building nearby to
make room for new residential buildings (Ekerlund and Stuhrmann, 2003).
The area inside the CCC was about 3,500 m2 which were protected by alarm systems
for the material storage. Outside the premises, about 4,000 m2 were available for
the CCC. Ten people were employed at the CCC. The vehicle fleet consisted of three
trucks with a crane, one large heavy vehicle with a long crane, three forklifts and a
pick-up vehicle.
The objectives with establishing the CCC would be to reduce the number of direct
small deliveries to the site by approximately 80%. Without the CCC, the construction
site would receive over 400 uncoordinated deliveries per day, or roughly 700 tons of
construction materials into the area per day, during peak period. Furthermore, the
traffic net was overloaded by the arrival of goods in lighter vehicles, the construction
of a high-speed tramway in the area, and the traffic generated by approximately
4000 employees coming to work at the 400 businesses active in the area. Develop-

109
ers, contractors and subcontractors had to co-ordinate services to meet the estab-
lished time schedules and environmental goals. At the same time the area should be
viable for residents who had already moved in.
Figure 29: The Construction Consolidation Centre in Hammarby Sjöstad (Brisvall, 2002)
The CCC also aimed to increase the transport load ratio via collective deliveries when
the lorry ratio would otherwise be low. As a complement, a technology procurement
contest of traffic direction systems was conducted. Experience from the extensive
reconstruction of the Potsdamer Platz in Berlin, where a traffic direction system was
implemented, showed that environmental gains and significant time-savings are
possible via efficient control of construction and goods traffic.
A task force was formed with representatives of all contractors, the LIP-Council and
the Stockholm City Real Estate, Streets and Traffic Administration Office to collabo-
rate in these issues.
In 2002 the City of Stockholm joined the Trendsetter project of the Civitas Initiative
(see 4.1). Among the 20 Trendsetter measures that regarded the city of Stockholm,
was the optimization of the Hammarby Logistics Centre operations, which consti-
tuted the Work Package 9.1 “Construction Materials”.
The objectives for WP 9.1 were (Civitas Trendsetter, 2006a):
To decrease the number of small direct deliveries (fewer than 4 loading pal-
lets) to the site by 80% through co-transportation
Less traffic congestion in the construction site

110
Improved living conditions at the site for new inhabitants
Improved working environment
To reduce energy use and emissions of CO2, NOx and particles.
The main problem was the large number of vehicles coming to the area and causing
congestion. Decreasing the number of vehicles in the area would reduce congestion,
improve the living conditions and the working environment in the area as well as re-
duce energy use and emissions.
A lot of space was needed for the materials storage and handling. This depended on
almost no delivery coordination and a lot of material coming to the area at the
wrong time. This material would get damaged and could cause bad indoor climate
for the clients. The CCC provided temporary material storage in order to avoid all
this.
A smart computer system was the tool for distribution of goods from the CCC. A
web-based calendar was created to prevent traffic congestion. Each contractor who
used the same road had their own community in the calendar where they scheduled
their direct deliveries (which were not reloaded at the CCC) increasing the transpa-
rency of incoming deliveries among the contractors. This enabled all project manag-
ers to synchronise their orders and activities to other surrounding construction work.
Figure 30: Traffic guidance with smart traffic signs (Brisvall, 2002)
The CCC provided a traffic coordinator who supported the area. In case of conges-
tion, the traffic coordinator had the possibility to send traffic info through SMS to

111
concerned contractors. This SMS also reached variable signs at the entrance of the
area (see Figure 30). The coordinator also had the possibility to send SMS to contrac-
tor’s mobile phones. The aim with this procedure was to avoid serious congestion
inside the area and it worked out with great success.
The partners with the largest interest in the information were the ones with a build-
ing site at the most difficult position in the area, i.e. at the end of the roads. It was
hard to make it work since the partners with easy access did not see the need of
supplying their information to make it easier for the partners with more difficult
access.
Environmental Impact
The table below shows the indicators used for the measures in the evaluation.
Indicator Unit Hammarby Sjöstad construction site
Without CCC With CCC
Energy Use Joule/year 1600 G 170 G
Emissions of fossil CO2 Tons/year 119 12.5
Emissions of NOx Tons/year 0.729 0.077
Emissions of PM kg/year 12.3 1.3
Noise levels dB(A) 55 dB(A) exceeded
360 times/day 55 dB(A) exceeded
260 times a day
No of trips (Total num-ber of goods vehicles moving in the area)
No or qualita-tive 5-degree
scale 360 260
Living conditions Noise hours 55 dB(A) exceeded
360 times/day 55 dB(A) exceeded
260 times a day
Working environment Noise hours 55 dB(A) exceeded
360 times/day 55 dB(A) exceeded
260 times a day
Vehicle km (Vkm) by vehicle type (peak/ off peak or total)
Vkm per day 64 26
Vehicle load factor % ~50 85
Queuing time/stop time Minutes/trip ~60 6
Small deliveries Vehicles/day 219 169
Table 10: The measures with Trendsetter Common Indicators and WP Common Indicators
used in the evaluation. (Civitas Trendsetter, 2006a)
Since there was no actual situation without the consolidation centre, only calcula-
tions with estimates and assumptions have been made for that scenario. The cen-
tre’s computer system that stores delivery data (number of goods, the receiver and
the sender of the goods) has been used for the scenario “with CCC”. Counts were

112
made to get an overview of the total incoming transports to the area. Interviews
were made with contractors, drivers and suppliers. Also case studies have been
made. The information from the case studies is presented in a Master Thesis/Report
(Ekerlund and Stuhrmann, 2003) and the most important results are presented here.
Three scenarios are presented as diagrams: A situation with and without a CCC with
two different consolidation levels; 2 and 6. Consolidation level 6.0 is the best situa-
tion for peak periods and is being compared in the table above.
Through this project there has been a reduction in the number of trips in the area by
12,500 during peak period (2.5 years = 700 days). This means a mean value in reduc-
tion of 20 trips per day during this period. During highest peaks there was a consoli-
dation factor of 8, which means that 100 vehicles went into the CCC and was consol-
idated to about 13 vehicle trips from the CCC (8 vehicles into the CCC and one con-
solidated vehicle distributing the goods in the area). The mean value of the consoli-
dation was 6. The mobility index in the area was good, valued as index 4 on a scale of
1-5.
The working and living environment is valued in noise hours. More accurate would
be to look at the reduction of exceeded maximum noise levels per day. During the
highest peak, the CCC helped reduce the number of times the maximal noise levels
(55 dB(A) as a standard limit according to the National Swedish Road Administration)
were exceeded by 100 times per day, compared to a situation without the CCC.
Figure 31: Noise levels for the Hammarby CCC (Brisvall, 2002)
The calculations were made with a simulation program from the Environmental and
Health Administration in Stockholm and were based on the noise levels of a passing
lorry and the number of times vehicles drove by a certain point in the area.

113
The vehicles in the project drove approximately 26 kilometres per day. The number
of vehicle kilometres was reduced with 38 kilometres per day with the CCC com-
pared to a situation without the CCC. The difference between the different situations
can be seen in Figure 32.
Figure 32: Annual vehicle kilometres in the area. (Brisvall, 2002)
Almost half of the total number of vehicles in the area during the project period
were private cars (=111). The total number of delivery vehicles is therefore 169 per
day, see Figure 33. The reduction of vehicles compared to a situation without the
CCC was 50 vehicles per day (delivery vehicles).
Figure 33: Total number of vehicles in the area. (Brisvall, 2002)
The emissions were reduced during the peak project period according to the objec-
tives of the project and the energy use was reduced with almost 1.5 TJoule.

114
Figures 34-37: Emissions of CO2, PM and NOx and energy use in the three possible
scenarios in Hammarby Sjöstad (Brisvall 2002)
One important synergy effect that affected the environmental impact of the con-
structions in Hammarby Sjöstad was the existence of the Environmental Zone (see
Chapter 5.2) in the nearby area. Although Hammarby Sjöstad itself is not included in
the Zone, most of the vehicles that arrived on the construction site had to pass
through the Environmental Zone. This had a positive effect in the environmental
quality of the trucks used, since they had to comply with the strict Zone standards.
Economic aspects, costs-benefits
According to the Trendsetter report, it is hard to realize in numbers and figures the
cost benefits of pilot schemes. There are no quantifiable numbers of the exact
amount of money saved with each measure. Mainly, benefits originate from less ve-
hicle kilometres and a better use of the vehicles. Costs are related to initial invest-
ments and development.
Initially, the implementation and operation of the consolidation centre was spon-
sored by the City of Stockholm, by 95%. After a while, when different services be-
came more familiar to the clients (contractors) and they understood that they could

115
save money using the CCC’s different services it was possible to increase the prices,
and by the end of the project it was almost a breakeven for cost/income. The city
contribution was then about 40% of the budget.
The most important service for the project was to reduce the number of trucks in the
area. To stimulate this, the co-transportation service prices were very low. The major
part of the income came from temporary material storage and extra services (just in
time delivery, part deliveries, goods delivered by crane into the building). To achieve
a good turnover, the CCC’s charge for the temporary material storage started after
day 4.
The CCC charged the contractor for all the extra services. Their benefit was money
saved thanks to less traffic congestion, less damaged goods etc. Unfortunately those
benefits are not always clear to the builders. The delivery companies were one of the
big winners of this solution because the contractor did not charge them. There was a
contact between the CCC and the contractors and each user was invoiced monthly
according to the amount used.
The practical operation of the CCC was performed by a subcontractor hired and fi-
nanced by the City of Stockholm. The subcontracting activities included investments
in the vehicles, stock/office-building and supervision system, running the vehicles
and employing the staff. All income from different services was shared between the
subcontractor and the City. To start with, the subcontractor received a large part of
the income until the break-even point, when the city received a larger part of the
profit.
The Trendsetter report points out the need to visualize hidden costs, for example
transports, theft and damaged goods. While the project was running, a case study
tried to measure such hidden costs, but the target was not reached because “no-one
really wishes to find out the correct figures. Theft and damaged goods are today an
accepted part of the building industry.” (Civitas Trendsetter, 2006a)
The distribution through the CCC hides the correct costs. They include extra bonuses
but they never show the real costs, which of course include the costs for the bonus-
es.
Executives on all levels were negative about the project from the beginning, but now
the service is in demand despite being more expensive. One reason for this is that
there were many situations where the time schedule couldn’t have been held with-
out the CCC.

116
Conclusions
In total, the project was very successful. According to the calculations for the period
when the CCC was in place there have been large reductions of both emissions and
congestion compared to a situation without a CCC. A reduction of almost 90% of the
energy use and emissions of carbon dioxide was reached. The prerequisites for the
CCC were very good – with both a well defined area and an obvious problem with
congestion and long queuing times. Those problems could be solved within the
project and the result was positive.
The project was operated without any major problems. A huge interest has been
seen for the project and the management has presented it in at least 50 seminars.
Experiences have been shared with for example London and La Rochelle for similar
services (for example the Heathrow Airport Construction Consolidation Centre).
It is important in large construction projects to plan the logistics carefully from the
beginning. Plans for technology as well as a logistics centre and definite rules have to
be a natural part of the project. The logistical problems will appear sooner or later in
any large construction site, but if solutions are not implemented from the beginning
it will be difficult trying to convince all partners that some acts or regulations will
help them as well as the whole project.
Looking back at the project there is a better acceptance for the project from the con-
tractors from before. Some contractors that showed skepticism in the beginning now
see the advantages; the possibilities to keep up with time plans etc., and are de-
manding these services despite a higher cost.
In Trendsetter newsletter No 5, June 2005, Johan Brisvall, project leader of the CCC
made the following statement: “I consider this as the future way to build. The con-
struction managers said to me that without the centre they could not have done so
well. It helped them to secure the time plan. In the beginning the logistic centre was
sponsored by the City of Stockholm but in the end the cost for the project almost
made break even. One of the results of the centre is that the number of small delive-
ries to the site was reduced by approximately 80 percent. That meant considerably
less congestion, and as well a better environment for those who already had moved
into the area.”
4.3.1.2. Logistics Centre for e-commerce
The first local logistics centre in Hammarby Sjöstad opened in December 2002, with
the goal to reduce environmental impact through coordinated transports. The centre
was responsible for delivering on-line purchased daily goods, dry cleaning services

117
and distribution of food and beverages, in a coordinated way that would reduce CO2
emissions. (Persson et al, 2003)
The Local Logistical Centre Project started in the year 2000, when the first residents
began to move in the district (Persson and Trepte, 2000). The project was aiming at
inhabitants, homes and care for the elderly, schools, restaurants and other business-
es in Hammarby Sjöstad.
Establishing a local logistical centre was considered to be a possible sustainable solu-
tion. Four surveys were carried out during the project, to verify the working hypo-
thesis of less environmental impact with the chosen form of coordinated transports.
The results of the surveys were more than encouraging with one indicating that al-
most 70 percent of the population was experienced with on-line shopping and will-
ing to take advantage of the services provided by a local logistical centre (Ericson,
2001). Another survey showed that even at a 10 percent level of on-line shopping of
all daily goods, energy consumption and CO2 emissions could be reduced by 5-7%
and 7-8% respectively (Persson and Bratt, 2001).
In 2001 a Purchasers Group was established for the Technology Procurement of the
logistical project planned and arranged by the LIP-Council. Members of the Purchas-
ers Group were representatives from building contractors, internet based daily
goods suppliers, schools, elderly care organizations and the City of Stockholm’s Real
Estate, Roads and Traffic Administration (Persson et al, 2003).
In the beginning of 2002 the LIP-Council launched the Local Logistical Centre Tech-
nology Procurement to find an environmentally oriented enterprise willing to oper-
ate the centre. The competition was won by Home Department AB in August 2002.
Home Department’s business idea was based on a system were residential, business
and organizational customers in the area subscribe to transport or logistical services.
Through a monthly paid subscription fee to Home Department’s services the cus-
tomer gets delivery of purchased goods to their home or business door. The monthly
subscription fee for residential customers was SEK 500 (approx. € 60), while business
customers had individual agreements or subscription.
Deliveries took place at fixed time windows. Residential customers could choose be-
tween 5 and 7 pm or between 7 and 9 pm in weekdays. Business customers and oth-
er organizations could choose either between 8 to 10 am, or between 11 am and 4
pm.
The customers could place their orders on Home Department’s home page, where
about 20 different important suppliers and shops providing on-line purchasing were
represented. The suppliers or shops paid a fee to Home Department for each sepa-
rate delivery. Home Department then collected the goods at the shop and consoli-

118
dated them with other goods to the area and to the specific customer. Alternatively
the shop had the possibility to deliver the goods to a coordination centre in Årsta 4
kilometres from Hammarby Sjöstad.
Home Department used light lorries of the highest environmental class to minimize
environmental impact during the collection of deliveries. Goods distribution was ex-
ecuted by electrical lorries, from the service centre to the customers’ doors or recep-
tion points at the agreed time. Calculations showed that Home Department’s logis-
tical services replaced 10 diesel-supplied lorries with one electrically driven lorry
serving the area daily. At the same time, the use of private cars for daily goods pur-
chasing decreased.
The goods and services offered by the Home Department’s home page were the fol-
lowing (Persson et al, 2003):
Daily goods from two major suppliers
Dry cleaning
Shoe repair services
Film and music
Cameras, film and photo supplies and services
Kitchen equipment
Office equipment and supplies
Clothes from two major supply chains
Books
Package services and stamps from the Swedish Post Office
Various home equipment and tools
Ecologically produced fresh food directly from local farmers
Pharmaceuticals
Wine and other alcoholic beverages
Take away food
One very interesting part of the project is the cooperation with BeM (“Bondens egen
Marknad” = farmers market), a market of local food producers that provides the cus-
tomer with important information about the quality and origin of the products. The
idea was a direct box delivery of farm products to 5000 consumers and some
schools, restaurants, retirement homes, specialist shops and supermarkets in Ham-
marby Sjöstad.
Home Department aimed to provide its services to approximately 2000 households
(20 percent of the area) and a significant number of businesses and other organiza-
tions by the completion of the district. The short-term goal was to reach 500 cus-
tomers during the first two years.

119
Unfortunately this goal was never reached and the logistics centre had to shut down
after one year of operation. Although the project received positive media coverage,
there can be found a number of reasons for the failure of the project: the high cost
of living in the area of Hammarby Sjöstad, the economic recession in Sweden and
the fact the many of the cooperating stores stopped providing on-line services and
left the project (City of Stockholm, 2003).
Conclusions
The project showed that implementing new concepts takes time. From a community
perspective, endurance pays off in the long run. It would therefore be an advantage
if the procurement procedures would be organised in a manner that ensures the use
of logistical services. The process would also benefit from political decisions taken in
support of coordinated deliveries.
The Technology Procurement of the Hammarby Sjöstad logistical centre was tho-
roughly based on several studies and surveys. However the results of the studies
were not verified during the operation of the centre. After a few months of opera-
tion, only one percent of all residents utilized the services offered by the centre. This
level corresponded to the average level of on-line shopping for the country as a
whole.
Advice from the project to other municipalities include (City of Stockholm, 2003):
Start the process with coordination of transports of goods to your own mu-
nicipal service units and to private companies;
Start off by offering a limited range of products in order to see how it turns
out and then gradually extend the offer to new categories;
A sufficient number of purchasers is vital – municipal service units, private
companies or residents all form the base of potential customers;
Efficient deliveries require a thought-through administrative system and
coordinated routines that optimizes the logistics;
Private consumers are an important target group, but it takes long-term ef-
forts in order to change the consumer habits. In Sweden, one percent of all
everyday commodities are purchased through the internet. This number is
probably not representative for other countries since Sweden has Europe’s
highest degree of internet-commerce but can give an idea of the future evo-
lution. Calculations should be based on local conditions;
Secure support from the political leadership and involvement from the mu-
nicipal service units and private companies through personal contacts, train-
ing, information, marketing and media.
120
4.3.2. Gamla Stan – A Logistics Centre for the Old Town
Introduction
Gamla Stan is the Old Town of Stockholm, built on the Stadsholmen island right in
the heart of Stockholm. Gamla Stan, with its medieval streets and alleys dating back
to the 13th century, is the home of the Royal Palace, the Stockholm Cathedral and
the Nobel Museum. There are about 3,000 inhabitants and about 9,000 people who
work here. Approximately 100 restaurants and hotels require regular deliveries of
food in the Old Town. Hotels aside, the 85 restaurants generate 120,000 deliveries
per year (some of them receiving up to six deliveries per day), made by ten suppliers.
The streets are narrow and steep. The cars have to share the space with a big num-
ber of pedestrians, residents, people working in the area, tourist groups, school
classes and other visitors to churches, museums, restaurants and shops in the area.
Apart from disturbing the people, freight traffic generates undesirable emissions and
noise, deteriorating the erosion of historical buildings. Therefore traffic is only per-
mitted between 6 a.m. and 11 a.m. After 11 a.m. only rescue vehicles, taxis and oth-
er exempt vehicles are allowed in the area.
There is also a speed limit in most of the area where cars must “drive according to
pedestrian speed” i.e. around 6-7 kilometres/hour. The knowledge and obedience of
the rules are very limited, and in general no police controls are carried out in the
area. Regular counts made by local NGOs and Home2You show that about 1 ve-
hicle/minute enters the regulated area.
Project Description
In 2002, the city of Stockholm participated in the TRENDSETTER Project of the Civitas
Initiative, with the aim to improve mobility, air quality and quality of life while reduc-
ing noise pollution and traffic congestion by promoting innovative projects. One
measure among the 19 activities planned for the city of Stockholm was to set up a
logistics centre that would serve businesses in the Old Town. The project was part of
the Work Package 9 (WP9) – ‘New Concepts for the Distribution of Goods’, which
had the following objectives (Civitas Trendsetter, 2006a):
To demonstrate measures to increase the efficiency of goods distribution in
various environments (construction site, inner city and hospital area).
To demonstrate how energy consumption, emissions and noise from freight
traffic can be reduced in sensitive areas using more efficient logistics and al-
ternative means of transport.

121
To provide examples of “Green city logistics”, how it can be implemented and
the possible incentives for commercial operators.
The project in Gamla Stan had the name WP 9.3 “Consolidation of restaurant sup-
plies in medieval Old Town”. Its objectives were:
To decrease the number of small direct deliveries to restaurants and shops in
the Old Town through co-transportation with clean vehicles.
Less traffic congestion during delivery hours in the Old Town.
Improved environment for inhabitants, visitors and people working in the
area.
To reduce energy use and emissions by estimated savings corresponding to
30,000 km of driving diesel lorries.
Figure 38: The Old Town (Gamla Stan) and the location of “O-Centralen” (by author)
The project was implemented in January 2004 when Home2You, a medium sized
transport company, took up the task to operate a logistics centre for the supply of
goods to restaurants in the Old Town of Stockholm, Gamla Stan. A terminal building
just outside the Old Town (55 m2, named “O-Centralen”) as well as a new biogas de-
livery van (Mercedes Sprinter) were purchased for the service. A marketing cam-
paign and the inauguration of the reconstructed terminal and biogas vehicle were
held in June 2004.
The operation began in summer 2004. Each of the 14 initial customers in the Old
Town would receive one delivery per day instead of six. The targeted amount of cus-

122
tomers was 25 but in the spring of 2005 they had already reached 30 – 35. Two of
the three biggest restaurant suppliers for the area were initially involved. The third
one participated for a testing period from the end of May 2005 but chose not to be
included in the project in the end. A different customer, the Royal Palace, also ex-
pressed an interest in joining the project later.
This was the first time to implement consolidation of restaurant supplies in this area.
New technology was also used for refrigeration in the delivery vehicle, developed by
the KTH (Royal Institute of technology). Route planning was developed by the driver
of the vehicle, due to his experience of the town accessibility. No computer systems
have been used during the project.
The “O-Centralen” continued to operate after the end of the Trendsetter period, but
currently has been moved to a different location due to the construction works for
the new underground train Citybanan right next to the site. Currently Home2You is
transporting goods directly from two suppliers to the Old Town, without consolida-
tion.
Many obstacles appeared on the way
The main problem to be solved was how to deliver the needed goods to the busi-
nesses with the minimum negative effects on the people, streets, buildings and envi-
ronment. The biggest barriers of the project have been (Civitas Trendsetter, 2006a):
The lack of customer demand and involvement
The lack of overarching knowledge and interest from the different bodies of
the town and their lack of flexibility
The project emerged from discussions among local NGOs, politicians, officials and a
small/medium sized company, but not from the demand of the actual customers, i.e.
the restaurants and their suppliers. The actual customers have not been part of the
discussions. They are on a low organisational level in terms of finding common solu-
tions on general logistics problems, instead they prefer individual solutions. The lack
of traffic control after 11 a.m. gives them the possibility to make deliveries against
regulations.
The project met many other obstacles on the way. In the beginning, the plan was to
use an electric truck for the goods deliveries. Unfortunately that truck was destroyed
in a garage fire of unknown causes, and a new truck had to be purchased, this time
biogas-fuelled. It took two extra months before the new vehicle arrived. The top of
the new vehicle was too small, so a new top had to be used instead.
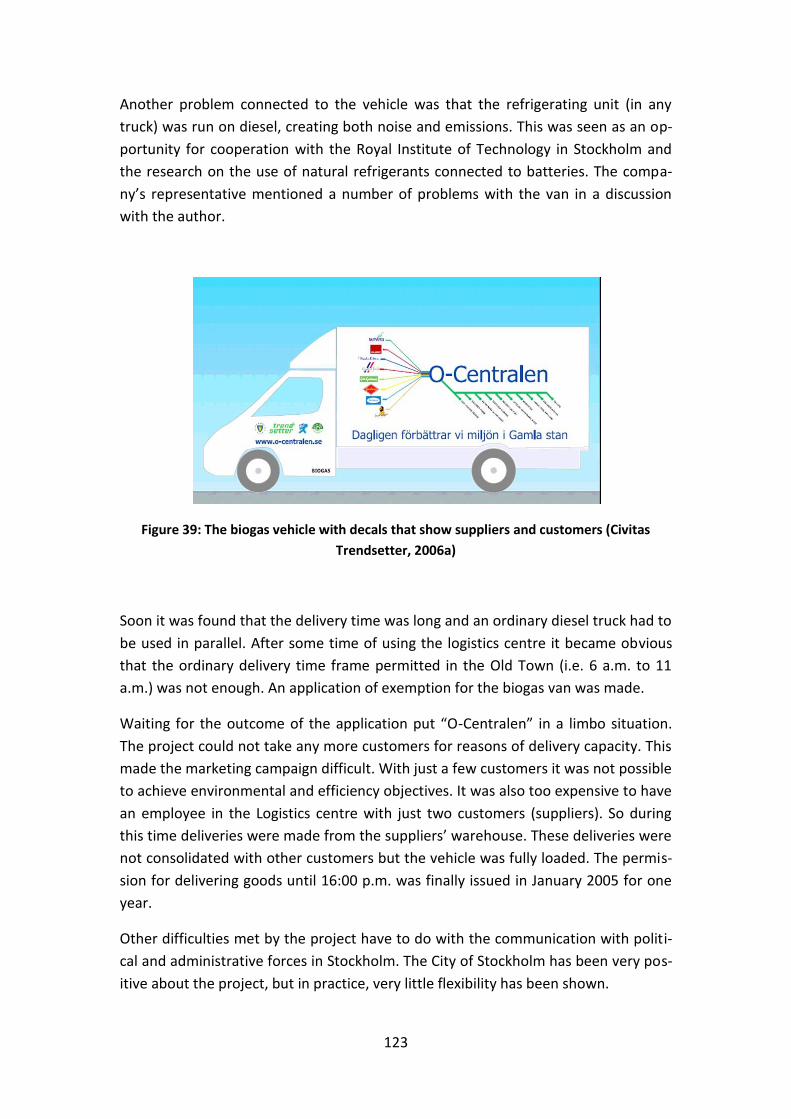
123
Another problem connected to the vehicle was that the refrigerating unit (in any
truck) was run on diesel, creating both noise and emissions. This was seen as an op-
portunity for cooperation with the Royal Institute of Technology in Stockholm and
the research on the use of natural refrigerants connected to batteries. The compa-
ny’s representative mentioned a number of problems with the van in a discussion
with the author.
Figure 39: The biogas vehicle with decals that show suppliers and customers (Civitas
Trendsetter, 2006a)
Soon it was found that the delivery time was long and an ordinary diesel truck had to
be used in parallel. After some time of using the logistics centre it became obvious
that the ordinary delivery time frame permitted in the Old Town (i.e. 6 a.m. to 11
a.m.) was not enough. An application of exemption for the biogas van was made.
Waiting for the outcome of the application put “O-Centralen” in a limbo situation.
The project could not take any more customers for reasons of delivery capacity. This
made the marketing campaign difficult. With just a few customers it was not possible
to achieve environmental and efficiency objectives. It was also too expensive to have
an employee in the Logistics centre with just two customers (suppliers). So during
this time deliveries were made from the suppliers’ warehouse. These deliveries were
not consolidated with other customers but the vehicle was fully loaded. The permis-
sion for delivering goods until 16:00 p.m. was finally issued in January 2005 for one
year.
Other difficulties met by the project have to do with the communication with politi-
cal and administrative forces in Stockholm. The City of Stockholm has been very pos-
itive about the project, but in practice, very little flexibility has been shown.

124
All activities where foods are involved are strictly regulated for hygienic reasons. The
foods handled by the logistics centre were very carefully and individually wrapped
up. There was the idea of taking back from the restaurants empty packaging mate-
rials such as cardboard, and avoid empty returns, but the Food Safety Authority of
the Environment and Health Administration did not allow it. The same authority did
not allow mixed deliveries to shops and restaurants, although they were coming
from the same suppliers.
The logistics centre was just a place for (re)loading the goods and not for storing, but
the Food Safety Authority demanded there would be the same standards as activi-
ties dealing with food. Therefore they demanded rebuilding of the premises.
A compromise between different aspects would have helped the situation. Regular
traffic controls to enforce traffic regulations would have also helped the process of
showing the benefits of consolidated transports. After all, the City of Stockholm
would have a lot to gain from the success of this effort.
Finally, the “O-Centralen” had to be moved, since it coincided with an area of ex-
tended construction works for the Citybanan underground train. There is a large
amount of truck traffic currently (September 2010) in that area and there would be
no possibility to use the logistics centre without interfering largely with the construc-
tions. The company is currently making direct deliveries between two suppliers and
some restaurants in Gamla Stan, until the Citybanan construction works are com-
plete.
Financial Aspects
The investment costs were very high. For a bigger company it would not have been a
problem to buy another truck and hire one or two more employees, but Home2You
is only a small/medium sized company of annual sales somewhat bigger than 2 mil-
lion euro (Troedson, 2005). High economic risks and big investments were difficult
and more customers were necessary for making greater investments on the project.
The only other financial aid was Trendsetter’s contribution for measurements, meet-
ings and reports.
The ‘limbo stage’ mentioned above caused a difficult economic situation and deli-
very consolidation could not be put into practice. After that period, it was considered
necessary to get all three biggest suppliers of the area to participate in the project,
so that benefits and costs would balance, and there would be personnel hired to run
the “O-Centralen” more efficiently. However, the third supplier only joined for a trial
period and then abandoned the project.

125
No subsides have been given from the City of Stockholm and the project was sup-
posed to be self-financed. The moving force has been Home2You’s interest in being
a part of tomorrow’s sustainable logistics market. Some positive economical effects
have been gained by the company, as well new customers and marketing. However
the success of such a project is much safer when it is financed and ‘owned’ by a city,
rather than a small/medium sized company.
Figure 40: Deliveries with the biogas van in the Old Town (Civitas Trendsetter, 2010)
Estimated Results
The evaluation was based on invoice data from the “O-Centralen” as well as several
assumptions. By the end of the Trendsetter project, the “O-Centralen” numbered 30
to 35 customers in the Old Town. The estimate of the total number of deliveries in
the “After” column was based on an assumption of 30 customers. The values used
for the estimates of NOx and PM emissions from diesel vehicles are twice as high as
a common emission calculation for diesel vehicles. These values were used in an ear-
ly application of the project and were maintained in the final report for unknown
reasons.
Table 11: Assumptions for calculations (Civitas Trendsetter, 2006a)
Before After
CO2 0.44 kg/km (diesel vehicle) O kg/km (biogas vehicle)
NOx 7.32 g/km (diesel vehicle) 1.2 g/km (biogas vehicle)
PM 0.226 g/km (diesel vehicle) 0.012 g/km (biogas vehicle)
Fuel Consumption 0.17 l diesel/km 7.2 MJ biogas/km
Number of deliveries 120,000 /year 117,268 /year (9 trips less per day)
Vehicle kilometres 1 km/cage 0.33 km/cage (biogas vehicle)

126
The final TRENDSETTER Evaluation Report presented the following results created by
the use of O-Centralen for the selected indicators:
Indicator Unit Before After
Energy Use Joule/year 924 GJ 917 GJ
Emissions of fossil CO2 Tons per year 63.8 62.5
Emissions of NOx Tons per year 1.061 1.042
Emissions of PM Kg/year 2.71 0.8
Noise levels dB(A) 122 122
Total number of goods vehicles trips in the area
Number 120,000 117,268
Vehicle kilometres Vkm per day 480 474
Vehicle load factor % 67 80
Small deliveries Vehicles/day 329 324
Table 12: The indicators used in the TRENDSETTER evaluation for the Old Town area (Civi-
tas Trendsetter, 2006a)
The results show that the outcome of a logistics centre for the Old Town is good.
There seemed to be a huge potential for reduction of the total number of vehicle
kilometres if the logistics centre succeeded in gaining more customers. The “O-
Centralen” managed to reduce the total number of trips by 9 trips per day and the
number of vehicle kilometres by 6 km per day. If it was further developed, it was ex-
pected to reduce the number of direct small deliveries to the Old Town by 17%.
It should be mentioned that there has been a synergy effect with the Environmental
Zone. The oldest and low-quality vehicles had already been sorted out and the ve-
hicles that are used in the area are often quite good, from an environmental pers-
pective.
Conclusions
The Old Town in Stockholm is a typical medieval city centre as can be found in many
European cities. If a working system is developed it has a good possibility for imple-
mentation in many similar cities in Europe. This could be a driver for other similar
projects. There is a need for special solutions for this kind of areas. The main barrier
for vehicles is the narrow streets. But to find a solution with a small biogas-fuelled

127
vehicle as in Stockholm is a good solution to the problem and becomes an additional
driver for continuing with the project and makes it easier for other cities to motivate.
The biggest driver of the project has been the interest of other groups to the project.
Locals, politicians and officials, but also NGOs and the media are convinced that the
“Logistics Centre model“ is a model for the future. But, it is also important that the
company, Home2You, has a genuine interest in consolidation of goods and environ-
mental issues. Kag Troedson, Home2You’s director, presented the following results
in the first BESTUFS II Conference in Amsterdam (Troedson, 2005):
Success for such projects takes time
Change in traditional logistics practices is very hard
There is no distinct owner of the business and no obvious reasons for change
It is very hard to convince stakeholders that this is the right thing to do in fi-
nancial terms.
For Home2You, a small/medium sized company, it has been a tough experience to
be part of the project. It is difficult for companies of such sizes to be part of a Euro-
pean project as Trendsetter, which is designed for big companies and operations.
Small companies have different problems than big ones.
Another important conclusion from the Old Town project is that if the municipalities
wish for successful projects of this kind, they need to coordinate the different au-
thorities involved. The real estate authority must communicate and discuss relevant
issues with for example the energy and traffic authorities. These aspects seem to be
a problem in most cities. Within the city, there are a lot of different authorities, but
not any natural forum for discussions on subjects that concern more than one au-
thority.

128
4.3.3. Norra Djurgården – Possibilities for coordinated trans-
port and ITS solutions
Introduction
A re-development project is being planned for the industrial area of Norra
Djurgården (Stockholm Royal Seaport), in the north-east of Stockholm, similar to that
of Hammarby Sjöstad (see section 4.3). Spanning from Husarviken in the north to
Loudden in the south, it is Sweden’s largest urban development area. It is planned to
be a modern, innovative and environmentally friendly neighbourhood, and is ex-
pected to be completed by the year 2025.
Figure 41: Overview of the development area (Stadsbyggnadskontoret website)
The planning process began in the early 2000s and includes, inter alia, 10,000 new
dwellings and 30,000 new workplaces. Constructions began in 2009, and the first
residents will be able to move in, in 2012. The examined area covers 236 ha (2.36
square kilometres) and includes four parts: Hjorthagen, Värtahamnen, Frihamnen
and Loudden. There will be areas of housing, workplaces, education, public and pri-
vate services, cultural events and entertainment. It is located only eight minutes by
bike from the city centre, or five minutes by subway (Stockholm Stad, 2010a).

129
The City of Stockholm decided in the Environmental Programme 2008 – 2011 that
the Norra Djurgården will be given a clear environmental profile, with the use of the
experience gained from Hammarby. Norra Djurgården is also promoting the Swedish
environmental technology and generates new technologies that will benefit all hous-
ing projects in Sweden. Through innovative technologies and creative solutions, Nor-
ra Djurgården intends to become an international display for sustainable urban
planning. The environmental work in Norra Djurgården has also been supported by
the Clinton foundation, since May 19th, 2010.
The constructions rate is estimated to reach about 500 apartments per year and the
energy consumption target is 55kWh per m2 and year. The environmental goal is to
achieve CO2 emissions lower than 1.5 ton per inhabitant by 2020 (while in 2008 the
average emission per person in Stockholm was 4.5 ton per person) and that the area
will be fossil-fuel free by 2030, a target which is more ambitious than the one of
Stockholm city as a whole, which is to be fossil-fuel free by 2050. Another goal for
Norra Djurgården is to be prepared for climate change, e.g. increasing precipitation
(City of Stockholm, 2009).
Figure 42: The vision for Norra Djurgården (Stockholm Stad, 2010a)
The new district will also be home to the city’s new main port for passenger ferries
and cruise ships. The pier in Frihamnen features the most modern cruise terminal in
Scandinavia. Lowering emissions, energy consumption and noise is a key priority for

130
the Ports of Stockholm. The goal is to classify among the most environmentally
friendly ports in the world.
Creating a totally new urban area provides an excellent opportunity for sustainable
development. City planners can pioneer cutting edge solutions and the focus will be
given in minimizing energy use, waste and transport needs. Experience gained from
Hammarby Sjöstad can serve as a starting point in this direction.
Project TransOpt
A feasibility study of environmentally friendly solutions concerning freight transport
in the new area has been conducted by Sustainable Innovation i Sverige AB (SUST) in
cooperation with Logica, Riksbyggen and JM and The City of Stockholm (Develop-
ment Office), under the name TransOpt. VINNOVA (Environmental innovators) has
co-financed the project with 440,000 SEK. An extra funding of 100,000 SEK has been
contributed by the different parties involved. SUST has been the main responsible
and coordinator for the project, with the aid of specialists from WSP (Kristoffersson
et al, 2010).
Project TransOpt aims to accelerate the development of both technologies (ITS) and
business models for the optimization of road freight transport in urban environment
and thus contribute to sustainable transport and economic value creation. The latter
may be the value created by efficiency gains in transport, but also through the de-
velopment of IT solutions that have a high degree of generalization in the global
market. This in return can lead to the development of competitiveness of the Swe-
dish industry (new ITS solutions, efficient transport chains) and contribute to the na-
tional environmental and transport policy objectives.
The feasibility study provides scientific basis for the development and demonstration
project planned, mainly in two areas:
Freight transport in urban areas, both generally and for Norra Djurgården, in
areas such as freight volumes, types of goods, freight carriers, traffic, trans-
porters, customer demands, constraints and potentials for coordinated
transport.
ITS (Intelligent Transport Systems) solutions for the optimization of freight
transport, including making inventory of the current state and the different
systems used by carriers and assessing the possibility of integration in order
to share information and the need for IT support for business relations be-
tween carriers.
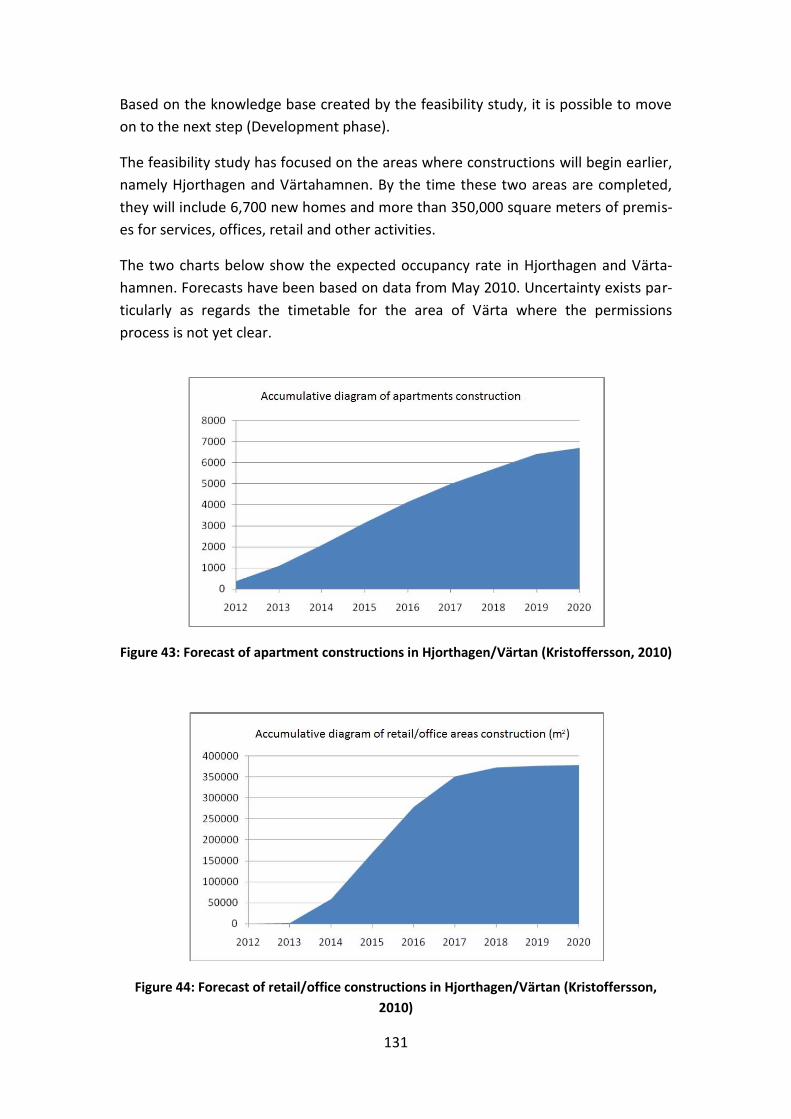
131
Based on the knowledge base created by the feasibility study, it is possible to move
on to the next step (Development phase).
The feasibility study has focused on the areas where constructions will begin earlier,
namely Hjorthagen and Värtahamnen. By the time these two areas are completed,
they will include 6,700 new homes and more than 350,000 square meters of premis-
es for services, offices, retail and other activities.
The two charts below show the expected occupancy rate in Hjorthagen and Värta-
hamnen. Forecasts have been based on data from May 2010. Uncertainty exists par-
ticularly as regards the timetable for the area of Värta where the permissions
process is not yet clear.
Figure 43: Forecast of apartment constructions in Hjorthagen/Värtan (Kristoffersson, 2010)
Figure 44: Forecast of retail/office constructions in Hjorthagen/Värtan (Kristoffersson,
2010)

132
The feasibility study estimated the freight volumes that will be demanded by the
project. As the area is already a suburb of Stockholm, the study didn’t take into ac-
count any materials for the construction of roads, water supply, sewage, electricity,
telecommunications and other infrastructure.
The future demand in freight transport generated by the area has been divided into
three categories:
Construction materials
Commercial materials (office supplies and retail goods)
Residents’ materials (mainly groceries)
The construction materials for the period 2011-2018 are estimated to reach 1.5 mil-
lion tons, which is equivalent to 230,000 shipments towards the construction site.
The peak of construction activities (2013-2015) will generate 50,000 movements per
year or 200 hundred movements per working day. The variation in frequency of the
shipments is expected to be large.
Approximately 30,000 tons of waste products will be generated during the construc-
tion phase, demanding 5,000 to 10,000 outgoing shipments.
The commerce-related shipments towards retail and office premises in the newly
built area are expected to be over 1,100 per day. Of course the transport frequency
varies depending on the different types of activities. The shipments will be per-
formed by carriers in loops but also directly by suppliers’ vehicles. This last part
tends to cover the largest amount of transports but not always the greatest amount
of goods.
Figure 45: Forecast of total number of shipments, construction- and commerce-related
(Kristoffersson et al, 2010)

133
The commerce-related transports are much more than construction-related ones,
while construction-related ones carry much greater loads in tons (see Figure 45). The
number of shipments will gradually increase until 2020 when it will stabilize at
around 350,000 per year.
The area will accommodate 6,700 apartments and 15,000 employees. They will con-
sume about 37,000 tons of groceries per year (food and drink) and produce about
5,700 tons of outgoing waste per year. The number of movements generated by res-
idents’ groceries consumption has not been calculated. It is not possible to know ex-
actly where the residents and workers will purchase these goods, within or outside
the area, and if they will use their own cars or other means of transport or maybe e-
commerce. However in the TransOpt presentation workshop, the average amount of
17 trips for groceries per month has been mentioned (Kristoffersson, 2010). It is also
stated that those who use e-commerce might save 1-2 shopping trips per week that
way.
Possibilities for coordinated distributions
The problems related to transport which are encountered at large construction sites
and urban areas have been analyzed already in other parts of this thesis, and include
pollution, negative effects on climate change, noise, congestion and accidents. Coor-
dinated transports can reduce these effects even by half, as it has been shown in
similar cases, such as Hammarby Sjöstad. More efficient use of distribution vehicles
also means reduced transport costs.
The feasibility study has focused on the possible impacts of establishing a logistics
centre in the area of Norra Djurgården and the preconditions that are necessary for
the implementation of such a solution. The idea is that it can initially work as a con-
struction consolidation centre and then, after the completion of the construction
phase, it can function as a commercial logistics centre for the area.
This solution appears to be beneficial mostly for the contractors, constructing com-
panies and carriers involved, especially from a cost-efficiency point of view. Availabil-
ity and time savings are secondary benefits for the above stakeholders. On the other
hand, the main benefit for the municipality (which will also be the initial capital in-
vestor) will be the environmental and social impact of coordinated transport (the
creation and operation of a logistics centre in the area can be reasonably assumed to
reach a reduction of 45% for construction-related movements and 40% for re-
tail/office-related freight movements).
During the second phase of operation of the logistics centre, different stakeholders
become involved, like shops and offices and, of course, the residents. Shops and of-
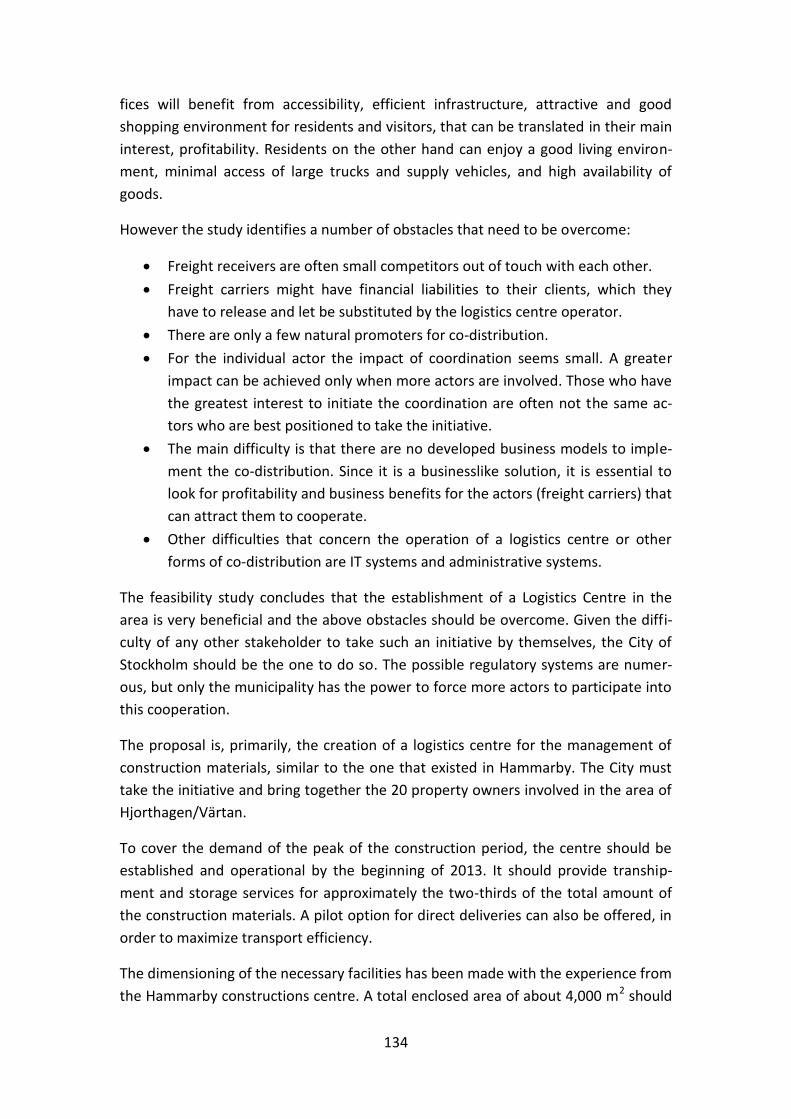
134
fices will benefit from accessibility, efficient infrastructure, attractive and good
shopping environment for residents and visitors, that can be translated in their main
interest, profitability. Residents on the other hand can enjoy a good living environ-
ment, minimal access of large trucks and supply vehicles, and high availability of
goods.
However the study identifies a number of obstacles that need to be overcome:
Freight receivers are often small competitors out of touch with each other.
Freight carriers might have financial liabilities to their clients, which they
have to release and let be substituted by the logistics centre operator.
There are only a few natural promoters for co-distribution.
For the individual actor the impact of coordination seems small. A greater
impact can be achieved only when more actors are involved. Those who have
the greatest interest to initiate the coordination are often not the same ac-
tors who are best positioned to take the initiative.
The main difficulty is that there are no developed business models to imple-
ment the co-distribution. Since it is a businesslike solution, it is essential to
look for profitability and business benefits for the actors (freight carriers) that
can attract them to cooperate.
Other difficulties that concern the operation of a logistics centre or other
forms of co-distribution are IT systems and administrative systems.
The feasibility study concludes that the establishment of a Logistics Centre in the
area is very beneficial and the above obstacles should be overcome. Given the diffi-
culty of any other stakeholder to take such an initiative by themselves, the City of
Stockholm should be the one to do so. The possible regulatory systems are numer-
ous, but only the municipality has the power to force more actors to participate into
this cooperation.
The proposal is, primarily, the creation of a logistics centre for the management of
construction materials, similar to the one that existed in Hammarby. The City must
take the initiative and bring together the 20 property owners involved in the area of
Hjorthagen/Värtan.
To cover the demand of the peak of the construction period, the centre should be
established and operational by the beginning of 2013. It should provide tranship-
ment and storage services for approximately the two-thirds of the total amount of
the construction materials. A pilot option for direct deliveries can also be offered, in
order to maximize transport efficiency.
The dimensioning of the necessary facilities has been made with the experience from
the Hammarby constructions centre. A total enclosed area of about 4,000 m2 should

135
be adequate, including a warehouse/office facility of about 1,000 m2. Moreover, the
vehicle fleet can consist of 3-4 trolleys/forklift loaders and 3-4 trucks (various sizes).
The number of employees depends on the level of service that is intended (opening
hours). There were 10 full-time employees in Hammarby.
The location of the centre must be chosen carefully. It can either be located inside
the Norra Djurgården area or at a distance from it. Both possibilities have advan-
tages. On the way from Stockholm to Norra Djurgården there are many existing ter-
minals that can be used with some adjustments, escaping the cost of creating a
completely new facility. A location far from the construction site might mean less
transport needs for the participating carriers.
On the other hand, this option is rather inappropriate for a future transformation of
the centre to serve residents needs, especially if they have to pick up goods them-
selves. One more reason to keep the terminal close or inside the area of interest is
educational. It becomes easier to notice it as part of an environmentally friendly
area, more people might be interested in using it and its real significance is rescued
from being belittled. A possible disadvantage is that the constructions logistics cen-
tre may have to be moved after a few years for accessibility reasons.
Figure 46: Possible terminal locations (Kristoffersson et al, 2010)

136
ITS solutions
The handling and transport of goods in the logistics centre must be done with the
greatest efficiency and quality, and the lowest possible environmental impact. There
is a need for effective technological solutions, like ITS and low emission vehicles (e.g.
electric vehicles).
The usual notification of the incoming goods to a customer, redirected to a logistics
centre needs to be upgraded with new data on the new freight receiver, which is the
logistics centre, for the first part of the incoming transport. For the second part of
delivering goods, new information on goods and goods recipients is necessary to be
added.
Four different proposals related to ITS solutions have been thoroughly examined by
the feasibility study:
1. The transfer is manual while arranging the goods for the planned distribution
loop in the area. This means that there will be manual registration of the new
shipment at the moment of its reception at the logistics centre.
This solution is simple to implement, and no adjustments to the IT system are
required. It involves, however, much manual work for the registration of car-
go data to the final customer. And it needs to update the IT system when ad-
justing the logistics centre as a recipient of goods for all businesses and resi-
dents in the area.
2. IT-based information processing at the reception of goods and data registra-
tion for the final shipment. This requires that there is an agreement between
carriers on: which information is shared, how it should be done and when it
should be done. This technical solution is based on the internet and uses a
standardized format for the transfer of information such as XML. This kind of
transfer is called push-technology, meaning that anyone who has informa-
tion, in this case the initial carrier, initiates the information transmission to
the logistics centre.
This solution implies that there is an agreement between the carriers, affect-
ing their IT systems. Further study needs to be made on how to manage the
reception and re-loading processes, together with the supporting information
management that will achieve rational and cost-effective operations.
3. A combination of manual and automated processing of information transmis-
sion by sending an e-mail to the logistics centre with all the goods’ data,
which is then recorded in their IT systems.

137
This solution is very similar with the manual handling of the first solution. It is
very dependent on the ability of information management to integrate e-
mails and support the cargo handling process like in option 2. With low or ze-
ro integration, this option seems more like an alert system for incoming
goods.
4. Early warning system via SMS or other mobile communications from carriers
to the logistics centre, with the necessary information for incoming goods.
This option is similar to the previous option by e-mail. It would also require
some adjustment on the carriers’ IT systems to obtain the necessary degree
of integration and harmonization. The advantage of SMS or other mobile ser-
vices is that they provide more accurate indications of when the goods
should be expected, taking into account the current traffic conditions. The
carriers may have mobile equipment where all cargo information is stored
and send it right before the goods arrive at the logistics centre.
Complement and support of the above proposals can be provided by digital maps
and GPS navigation, which can also include data about the current traffic situation,
for example through TMC. These can be used for both parts of the transport chain,
to and from the logistics centre, and are considered as valuable instruments to plan
and optimize shipments.
Cost-benefit analysis
It has been very difficult for this study to make anything than a rough estimate of
costs and benefits. The calculations have been based on an assessment of both envi-
ronmental benefits and economic effects. It is worth noting that the calculations
consider only the Hjorthagen/Värtan area, but it is very likely that an establishment
of such a centre might serve other areas as well.
The location of the facility will affect both the environmental and economic costs
and benefits. Longer distance from the area increases carbon savings. Also the utili-
zation of an existing terminal can reduce very much the initial costs.
The analysis assumed that the centre will be established in an existing terminal from
2013 and will additionally serve retail/office-related transports from 2015. Two-
thirds of the constructions materials are assumed to go through the centre, with a
loading factor of five (five vehicles being replaced by one). A loading factor of seven
can be assumed for the retail/office-related transports. Residents’ goods and waste

138
have not been taken into consideration in the analysis. The centre’s vehicles are as-
sumed to be moving on biogas electricity and the carriers’ vehicles on diesel.
The expected reduction on incoming transport for the period 2013-2020 is about
100,000 less movements or 45%. Retail/office-related transports might be reduced
by 145,000 movements per year (400 a day) which equals to 40%.
Each of these movements that are avoided can be translated into some ‘profit’ from
salaries, vehicles used and fuel. The analysis estimates this ‘profit’ around 300 Swe-
dish Crowns for each constructions-related movement and 200 Swedish Crowns for
each retail/office-related movement. All together they are represented by 210 SEK
per replaced movement.
The cost of the logistics centre depends very much on the grade of consolidation and
the number of daily routes. These numbers can show how many vehicles and em-
ployees are necessary. Other important costs are the costs of vehicles and terminal
operation. The analysis estimates an average cost of 130 SEK per replaced move-
ment.
These numbers provide a result of a social profit of about 75 million Swedish Crowns
for the period 2012-2020. It must be noted that this is a rough estimate and does not
take into account the business model that will be used, as well as any other un-
known details.
It must be noted that partial funding for the centre could be granted by European
programmes, like LIFE+, ERA-NET, etc.
Environmental Impact
The replaced construction-related movements during the period 2013-2020 are es-
timated to have used more than 850,000 liters of diesel and emitted approximately
2,200 tons of carbon dioxide. The replaced commerce-related transports would have
used 550,000 liters of diesel per year, emitting 1,400 tons of carbon dioxide per year.
The logistics centre’s vehicles’ emissions will be negligible, since they are assumed to
be running on biogas and renewable electricity.
The amount of particulate matter and nitrogen oxide emissions has been very diffi-
cult to estimate, because it relates to the types of vehicles that will be replaced. As-
suming that all the vehicles would have been of the best environmental category
(Euro 5), the replaced constructions-related movements would produce 100 kg of
particulate matter, 7,600 kg of nitrogen oxides and 420 kg of carbon monoxide, and
the replaced commerce-related movements would have produced 65 kg of particu-
late matter, 4,900 kg of nitrogen oxides and 270 kg of carbon monoxide per year.

139
Noise levels can be reduced by smaller vehicles driving in the area, especially by the
use of electric vehicles used by the logistics centre. The amount of noise reduction
has not been estimated though.
Other benefits
The reduction of the number of freight movements in the area will improve accessi-
bility for the other road users. The logistics centre can make better use of the road
network by the use of real-time information on traffic conditions. A positive impact
in road safety can also be assumed, through reduced number of vehicles and expe-
rienced trained drivers.
The reduced risk of goods being damaged or stolen is also very important for the
contractors. Experience from Hammarby showed that there was great reduction in
such incidents.
Conclusions
The feasibility study (Kristoffersson et al, 2010) makes clear that there are many
benefits for all the stakeholders involved in a creation of a Logistics Centre in the
area of Norra Djurgården. The Centre’s double nature of handling constructions ma-
terials at first, and commercial materials after the end of the constructions, doubles
the centre’s efficiency and indicates an integrated thorough solution.
The ‘Zero Option’ of not taking any measure for coordinated distribution can bear
many unpleasant consequences that will have to be taken care of afterwards, in a
reactive manner. This way of planning is not appropriate for an innovative develop-
ment project with such high environmental goals.
The establishment of a Logistics Centre in this area is a matter of national interest. It
can efficiently face problems such as pollution, climate change, noise, congestion
and accidents by reducing the total number of freight movements almost by half.
The experience from Hammarby Sjöstad has put the foundation for spreading this
good practice, providing positive results and attracting stakeholders. However the
initiative for this solution can only be taken by the City of Stockholm.

140
5. Conclusions
The City of Stockholm has set the ambitious target of becoming a fossil-fuel free city
by 2050. CO2 emissions have already been reduced by 25% compared to the levels of
1990. But the city has still a long distance to cover before the target is achieved. The
transport sector accounts for a great amount of CO2 emissions, especially road
transport. In freight transport, the road mode accounts for 90% of the total CO2
emissions from all modes. Åkerman and Höjer (2006) showed that the current trans-
port growth in volumes and energy use pose a huge obstacle in achieving the high
environmental targets, even with the use of advanced technology as it is expected to
be in 2050. Hence, it is obvious that any sustainable policy against fossil fuels and air
pollution needs to take serious measures to minimize the impact of road freight
transport.
The European Commission is pointing towards the direction of incorporating freight
transport in local policies and plans and to improving the management and monitor-
ing of transport flows. The idea is that any urban mobility policy must cover both
passenger and freight transport. It is essential for local authorities to consider all ur-
ban logistics related to passenger and freight transport together, as a single logistics
system. Particularly concerning freight transport, the goal is the realization of an in-
telligent and integrated logistics system, where development of ports and intermod-
al terminals is a key element.
In Stockholm, there has been great effort and progress in forming an efficient pas-
senger transport policy, discouraging the use of private cars. However, it seems that
it is still early before we can speak about an integrated and concrete urban freight
transport policy. Joint initiatives like “On the road to climate neutral freight transpor-
tation” (see section 4.1) are positive and encouraging, but it can be said that there is
no actual political pressure for change. The character of such initiatives usually is
more based on “good will” among participants.
So far, developing freight transport logistics in Europe has been primarily a business-
related activity and a task for industry, and Stockholm is no exception. Nevertheless,
the European Commission urges authorities to create the appropriate framework
conditions and to keep logistics on the political agenda. This framework approach
can concentrate on improving the preconditions that Europe can offer for logistics
innovation and leave the internal running of company logistics to the companies
themselves.
A key issue is Stockholm’s governmental structure which is decentralized. There is no
unique authority responsible for logistics. Instead, there are several different author-

141
ities involved and lack of communication and coordination between them is not rare.
Each and every one of these authorities deals with many different subjects and has
different priorities. As a result, there is very little urban freight transport data availa-
ble, mainly originating from a few individual surveys, the database of the congestion
charging system and the vehicle registration records. The need for a new city instru-
ment that deals mainly with urban freight is evident.
Unfortunately, the logistics sector is a very competitive one and there is suspicion
and unwillingness when it comes to sharing data about shipments and clients. There
is no organisation among the members of the sector which would provide solutions
to the common problems. Instead, every company throughout the supply chain tries
to solve its problems on its own, in the most profitable way. Often, this means the
choice of solutions that consume more energy and generate more emissions. Coor-
dinated deliveries can improve this situation a great deal. But cooperation is hard to
appear without governmental initiatives.
In addition, measures like logistics centres are not always financially profitable for all
stakeholders. A lot of projects have been abandoned for this reason all around Eu-
rope. Most companies are unwilling to participate because there is no obvious rea-
son why they should share their customers and give away part of their own services
to third parties. Strong governmental support is necessary not only in financial terms
but also in terms of providing adequate proof of the profitability of the measure,
creating incentives that encourage participation or even using regulations to impose
it, when this is necessary.
Furthermore, people usually react negatively when change is imposed to them. Poli-
ticians usually avoid opposition with the voters and always have to clarify what ex-
actly are the reasons and the expected benefits behind every measure. However,
measures like the Environmental Zone, the Congestion Charging, the various logistics
centres, etc. showed that many people initially opposed them, but, after the imple-
mentation, their opinion changed to supporting the measures. Some brave politi-
cians stood behind those measures.
The national legal framework has also been an obstacle in several cases, like the En-
vironmental Zone or the Congestion Charging. Changes had to be made at a slow
pace through long periods of time. This thesis did not attempt to deal closely with
legal issues, mainly because of the lack of knowledge of the Swedish language and
due to the width of the subject. However, it is an interesting field that needs to be
closely examined.
Two important city logistics tools are currently implemented and operating by the
authorities in Stockholm: the Environmental Zone and the Congestion Charging Sys-
tem. Both can be considered very avant-garde in a global level. Stockholm was one

142
of the first cities to implement these measures in 1996 and 2006-2007, respectively.
The results are very positive and the environmental benefits for the city are obvious
and indisputable, setting the example for other cities around the world.
The Environmental Zone is estimated to have reduced emissions of hydrocarbon by
16-21%, emissions of nitrogen oxides by 3-4% and emissions of particulate matter by
13-19%. These results were reached by setting tight standards on heavy-duty ve-
hicles’ age and engine class. The Zone clearly pushed towards younger and more
technologically advanced vehicle fleets, which pollute much less than older ones.
The Congestion Charging System, unlike the Environmental Zone, affected almost all
vehicle categories and not only the heavy-duty vehicles. Its primary objective of re-
ducing congestion was largely accomplished by achieving a reduction of 18% of ve-
hicles entering the inner-city and a reduction of 16% in total vehicle kilometres with-
in the inner-city. It also pushed the clean-vehicle market. In just three years, the
proportion of alternative-fueled vehicles in the total vehicle fleet increased from 3%
to 14%. These achievements yielded great environmental results: CO2 emissions
dropped by 14-18%, CO emissions dropped by about 15%, PM10 emissions dropped
by 15-20% and NOx emissions dropped by about 10% in the period 2005-2008.
The impact of the Congestion Charging scheme on urban freight transport is not well
assessed, though. A reduction of 10% in truck passages during tax times was ob-
served, but it is not known how these passages were replaced or whether they
moved in later hours. In general, road pricing improves accessibility, reduces travel
times and improves delivery times’ accuracy. At the same time it increases the costs
for transport companies and it might actually transfer congestion to different
streets, previously uncongestioned. The carriers in Stockholm still have not had the
chance to express their opinion on the charges.
The Hammarby Sjöstad Construction Consolidation Centre was a groundbreaking
success. The use of the logistics centre reduced the number of small deliveries in the
construction site by 80% and the total average number of deliveries by around 28%.
Energy use, CO2 emissions, NOx emissions and particulate matter were all largely re-
duced by 90%. The CCC gained global fame and set the target for similar projects all
over the world. The leading role of the City of Stockholm in financing the project was
a key factor for its success.
An interesting point that came up from the CCC project was the lack of information
about the hidden costs. There was difficulty in figuring the exact costs of the material
transportation and how these are included in the products’ final price. At the same
time, costs related to thefts and damaged goods were also hard to estimate, since
they are accepted parts of the building industry.

143
In contrast with the Hammarby CCC, the O-Centralen which did not have financial
support by the City faced many more difficulties. The idea of a single carrier serving
the sensitive area of the Old Town with low emission vehicles should be in the list of
priorities of the City authorities. However, letting this job to private initiative, even
with the support of a major European project, such as Civitas Trendsetter, is always a
risk. The City could have embraced the project more dearly.
The experiences and positive impressions gained by the Hammarby CCC can be the
foundations for future similar projects in Sweden. Norra Djurgården may be one of
them if the project TransOpt is approved. The particularity of this project is that the
proposed logistics centre can serve two different purposes: a) the consolidation of
constructions materials during the construction phase, and b) the consolidation of
goods deliveries to the local businesses and residents, once the construction phase is
completed. A lot can be expected in terms of environmental, but also financial bene-
fits, in case the scheme is approved.
Similar logistics measures, based on detailed and thorough studies, must always be
promoted by the city authorities. There is enough experience in European level to
support that there are multiple benefits for all stakeholders, but most importantly
they contribute a big deal to the city’s sustainability and viability. It is time for an in-
tegrated city logistics policy, even if it means to implement top-down measures that
oppose the current business status in the area of Stockholm.
As a conclusion, this thesis can report that Stockholm is in general a city which has
done a lot for a sustainable future. The steps already made in the area of urban
freight transport are significant, but there are two ways one can look at the situation
as it is now: comparing it to other cities around the world, or comparing it to what is
really necessary to be done by a city on a planet where ecological balances have bro-
ken since a long time ago. Being realistic, we must say that the latter is the only way
to see it, and this implies that there is a lot more to be done before we are in the po-
sition to feel content by Stockholm’s logistics’ efficiency and sustainability. We
should be optimistic, though. If there is any city in the world where change is possi-
ble, then this must be Stockholm.

144
6. Recommendations
6.1. A sustainable urban freight transport policy for Stockholm This thesis attempted to approach the broad issue of Green City Logistics strategies
and their applications in Stockholm. It does not claim to have covered each and
every possible aspect, but it managed to produce a picture of the present views on
Stockholm’s urban freight transport. The following recommendations emerged from
research on European and Swedish literature and hope to serve as a guide for au-
thorities, transport companies and transport-related or environment-related organi-
sations that wish to promote more efficient and sustainable urban freight transport.
The ideal situation would be the creation of a city authority which would deal with
the management of freight transport in Stockholm. A primary function should be the
collection of good quality freight transport data, to identify flows of goods and locate
bottlenecks and problematic areas. Communication with transport companies and
cooperation with research institutes from the beginning is vital. The next step would
be the formation of a concrete and integrated freight transport policy for the city of
Stockholm. Experts from different stages of the supply chain should be consulted or
participate in the policy formation. The objective needs to -at least- comply with the
rest of the city’s high environmental targets. Then, the objective can be broken down
into specific measures and strategies, chosen by necessity and effectiveness criteria
and spanning in all time horizons (short-, medium- and long-term).
A very effective administrative tool that should be examined is Public Private Part-
nerships (PPPs). They can be used for financing, building and operating infrastructure
projects, as well as for the negotiation and setting of framework conditions and
agreements between public and private sectors. Main fields for establishing a PPP is
on the optimization of urban distribution, road pricing and the construction of logis-
tics and distribution centres. Other application areas for PPPs can include: the usage
of ITS in urban freight, city access management, the development of environmental-
ly-friendly vehicles for goods distribution, loading zone management, etc. Freight
Quality Partnerships in London can act as a good example.
Sometimes, legal issues can be crucial factors for the implementation of some meas-
ures. Some regulations and demands can be hard to implement if there are legal bar-
riers. Laws and regulations are possible to change if needed to adjust to the situa-
tion, but it is a difficult and time-consuming process. Clear results and possible bene-
fits must be demonstrated to politicians. A pilot project could be easy to implement
for a short period of time, exempted from regulations, and provide the necessary
evidence of a measure’s true significance.

145
Another parameter that applies to all measures is that all systems and projects need
clear delimitation to be able to identify indicators and measure levels. A base line
scenario has to be evaluated and serve for comparing and assessing results. Control
and monitoring of the project and implemented measures are of grave importance.
Indirect effects and synergies must not be ignored as well. Quantification of results
facilitates understanding and support to the measures.
Many times, the public opinion or the actors affected by a measure react negatively
at the beginning. Awareness campaigns are a possible tool to increase support for a
measure. A pilot project with clear results can also be useful in this direction. Expe-
rience has shown that public and stakeholders’ opinion often changes to positive af-
ter the implementation of a measure. The City’s decisive support can be a success
factor.
However, we must not forget that a city is usually a very small unit in the supply
chain. Possibilities will be limited, unless cooperation on national (and even interna-
tional) level is achieved. For example, similar logistics authorities can be created in
other major Swedish cities and promote a common freight policy, with differentia-
tions of local strategies according to the local problems and needs. The result would
be that private transport would be forced to adapt in a more general situation, ra-
ther than a city’s peculiarity. This option should be examined by the Swedish gov-
ernment.
The measures proposed below can be more effective and beneficial when they are
used as a part of an integrated strategy and not separately. This is the reason why
the author insists on the creation of an urban freight transport policy.
6.2. Consolidation of goods A consolidation centre serving one or more companies, a single site or a whole area,
can prove very beneficial for the area, as well as for the stakeholders involved. How-
ever, cooperation is difficult to trigger and delicate to handle. The city authorities
must embrace such projects and support them in many different ways: financially,
with good marketing and with regulations in favor of the use of the logistics centre.
However, private funding is also a factor that can lead to a project’s success. Large
companies have the ability and interests to take initiatives and make them work.
A good way to start-up such a project is to form a project group consisting of repre-
sentatives from many different affected organisations. The group members need to
be convinced for the necessity of the measure and share the same determination for
accomplishing the common target. Communication and flow of information is cru-
cial, within the group as well as outside the group’s borders.

146
It is important that the area addressed is well defined and has evident problems that
create the need for a (bottom-up) solution. The problems need to be clearly identi-
fied before the solutions are found. The benefits of the project must be evident in
order to persuade companies to participate. Information about previous projects can
be valuable, but different areas have different problems and require different treat-
ment. Different types of goods also have different prerequisites that need to be tak-
en into account. E-commerce is still at its infancy but should be examined as an op-
tion, because it is expected to increase in popularity in the future. The possibility of
minimizing empty returns by developing reverse logistics strategies should also be
examined. Finally, logistics centres can be successfully combined with alternative-
fuelled vehicles, to minimize pollutant’s emissions and promote a ‘green’ image for
the city.
Construction logistics centres are a new concept with many supporters in Stockholm,
after the successful experiment in Hammarby. Their development should continue in
future large-scale (but also in smaller-scale) construction projects and can lead to
new possibilities, such as after-construction-use (like the proposed project for Norra
Djurgården).
As mentioned above, green logistics measures are more efficient when they are used
as part of an integrated strategy instead of being separate individual projects. A very
interesting proposal was made by the Environment and Health Administration
(Miljöförvaltningen) which suggested an integrated use of logistics centres to serve
three major areas in Stockholm, but it was not approved for funding (Hugosson and
Sunnerstedt, 2008). It could serve as basis for new ideas.
6.3. Other suggestions In chapter 3.4 we discussed the case of night deliveries. Given the availability of
technological solutions that minimize noise emissions and well-trained personnel,
night deliveries can improve the efficiency of urban deliveries. A pilot project with
evening distributions was implemented in Stockholm during the Congestion Charge
Trial in 2005-2006 and provided a basis for further efforts.
The existing Congestion Charging scheme can function as a freight traffic manage-
ment tool, not only for moving truck deliveries to different times of day, but also for
interfering with route selection. Once we get a clear picture of the city’s bottlenecks
and problematic areas affected by trucks, different toll prices can be applied to man-
age truck passages from different entrances of the toll cordon. However, it is more
urgent that the people behind the Congestion Charging System should start consi-
dering its impact on Stockholm’s freight, assessing and managing it in a wise way.

147
A problem with parking on loading zones has already been mentioned. Strict en-
forcement of parking regulations and increased penalties can assist the situation.
The use of Nearby delivery areas (ELPs), like the one described in 3.3.3 can also be
considered. Last-mile solutions like this can substitute many heavy truck movements
in sensitive areas.
Stockholm’s location on 14 islands makes the conditions appropriate for the utilisa-
tion of waterborne urban freight transport. Such techniques have been implemented
by the DHL postal service in Amsterdam and by the refreshments supplies in Utrecht
with great success. It is a solution worth considering, as it can greatly reduce envi-
ronmental impact and congestion created by road freight transport. It might even
turn out that appropriate infrastructures, which may require only minor modifica-
tions, already exist in the city. This could largely reduce implementation costs.
European initiatives like Civitas and BESTUFS provided the opportunity for new ideas
and promoted the exchange of information on urban freight transport among Euro-
pean cities. This knowledge network exists and is available for anyone who wishes to
promote sustainable city logistics.
Three main areas of research were not included in this thesis, but are promising and
recommendable: the views and interests of private logistics companies in Stockholm,
the legislation issues that interfere with several logistics measures, and the possible
applications of reverse logistics in the area. More research is needed on all these
three fields.

148
7. List of References
Allen, J., Thorne, G. and Browne, M., 2007, BESTUFS – Good Practice Guide on Urban Freight Transport, www.bestufs.net
Beevers, S. and Carslaw, D., 2005, The impact of congestion charging in vehicle emissions in London, Atmospheric environment 39, 1-5
BESTUFS, 2010, Best Urban Freight Solutions: http://www.bestufs.net/
Brisvall, J., 2002, Smart deliveries to Sweden’s largest housing project, Presentation at the 7th BESTUFS workshop in La Rochelle, France http://www.bestufs.net/workshops/2002-04-25_la_rochelle.html
Browne, M. and Allen, J., 2006, Report on urban freight data collection in Sweden, BESTUFS WP 3.1, http://www.bestufs.net
Browne, M., Nemoto, T., Visser, J. and Whiteing, T., 2004, Urban Freight Movements and Public and Private Partnerships, Logistics Systems for Sustainable Cities, Edited by Taniguchi & Thompson
Browne, M., Allen, J., Anderson, St. and Woodburn, A., 2005a, Night-Time Delivery Restric-tions: A Review, Recent Advances in City Logistics, Proceedings of the 4th International Con-ference on City Logistics in Malaysia, Edited by Taniguchi & Thompson
Browne, M., Sweet, M., Woodburn, A. and Allen, J., 2005b, Urban Freight Consolidation Cen-tres – Final Report, Transport Studies Group, University of Westminster for the Department for Transport
Caceres, J. and Richards, D., 2000, Greenhouse Gas Reduction Opportunities for the Freight Transportation Sector, David Suzuki Foundation (www.davidsuzuki.org).
City of Stockholm, 2003, Internet-based Logistics Centre for Coordinated Transport in Stock-holm, The City of Stockholm, Sweden http://www.managenergy.net/products/R345.htm
City of Stockholm, 2009, Norra Djurgårdsstaden - Stockholm Royal Seaport, Vision 2030, (on-
ly in Swedish, with English summary)
CITY PORTS, 2005, CITY PORTS PROJECT – Interim Report, Quaderni del Servicio Pianifica-zione dei Trasporti e Logistica, Regione Emilia-Romagna, Bologna (available at: http://ermes.regione.emilia-romagna.it/)
Civitas, 2010, Civitas Initiative: http://www.civitas-initiative.org/main.phtml?lan=en
Civitas Trendsetter, 2002, Environmental Zones in Europe, Trendsetter Report No 2002:1, Stockholm
Civitas Trendsetter, 2006a, Evaluation report – New Concepts for the Distribution of Goods (WP 9), Trendsetter Report No 2005:7, Trendsetter External Deliverable No 4.3e http://www.trendsetter-europe.org/index.php
Civitas Trendsetter, 2006b, Evaluation Report – Stockholm local activities, Trendsetter Re-port No 2005:11, Stockholm

149
Civitas Trendsetter, 2010, http://www.trendsetter-europe.org/
DieselNet, 2010, Environmental Zones, http://www.dieselnet.com/standards/se/zones.php
e-DRUL, 2010, http://srvweb01.softeco.it/edrul/portal/alias__Rainbow/lang__en/tabID__1/ DesktopDefault.aspx
Egger, D. and Ruesch, M., 2003, Road pricing and urban freight transport – Urban freight platforms, Best Practice Handbook Year 3, BESTUFS Deliverable D2.3, www.bestufs.net
Ekerlund, S. and Stuhrmann, E., 2003, Hammarby Sjöstad Logistik Centre – Samordnad dis-
tribution på en byggarbetsplats, Trendsetter Report No 2003:1, Trendsetter internal deliver-
able No D 9.1.1 (only in Swedish)
Eliasson, J., 2008, Lessons from the Stockholm congestion charging trial, Transport Policy 15, 395-404
Eliasson, J., 2009, A cost-benefit analysis of the Stockholm congestion charging system, Transportation Research Part A 43, 468-480
Eliasson, J. and Lundberg, M., 2003, Road Pricing in urban areas, Vägverket Publication 2002:136, ISSN 1401-9612
Ericson, U., 2001, Handla dagligvaror över nätet , The City of Stockholm, Utrednings- och
statistikkontoret (USK), Stockholm, Sweden (in Swedish only) 2001
Europa, 2010, Policy areas, Transport: http://europa.eu/pol/trans/index_en.htm
Europa, 2010a, CORDIS, COST 346 http://cordis.europa.eu/cost-transport/src/cost-346.htm
Europa, 2010b, CORDIS, REFORM, http://cordis.europa.eu/transport/src/reform.htm
Europa, 2010c, CORDIS, COST 321 http://cordis.europa.eu/cost-transport/src/cost-321.htm
European Commission, 2000, Reducing Barriers to Zero and Low Emission Mobility – A Guide for Cities, ZEUS Final Report, Stockholm
European Commission, 2001, White Paper, European Transport Policy for 2010: time to de-cide COM(2001)370, Brussels (12.9.2001)
European Commission, 2002, New Solutions in Energy Utilisation, ELCIDIS Final Report, City of Rotterdam, The Netherlands
European Commission, 2006a, Keep Europe moving- Sustainable mobility for our continent, Mid-term review of the European Commission’s 2001 Transport White Paper, COM(2006)314, Brussels (22.06.2006)
European Commission, 2006b, Freight Transport Logistics in Europe – the key to sustainable mobility, COM(2006)336, Brussels (28.06.2006)
European Commission, 2007a, Green Paper, Towards a new culture for urban mobility, COM(2007)551, Brussels (25.09.2007)
European Commission, 2007b, Freight Transport Logistics Action Plan, COM(2007)607, Brus-sels (18.10.2007)

150
European Commission, 2008, Action Plan for the Deployment of Intelligent Transport Sys-tems in Europe, COM(2008) 886, Brussels (16.12.2008)
European Commission, 2009a, A sustainable future for transport: Towards an integrated, technology-led and user-friendly system, COM(2009) 279 (17.6.2009)
European Commission, 2009b, Action Plan on Urban Mobility, COM(2009)490, Brussels (30.09.2009)
European Commission, 2010, Stockholm – European Green Capital 2010, (brochure), Publica-tions of the European Union, Luxembourg http://ec.europa.eu/environment/europeangreencapital/index_en.htm
European Commission, 2010a, Logistics: http://ec.europa.eu/transport/logistics/
European Commission, 2010b, Transport: http://ec.europa.eu/transport/
European Commission, 2010c, FIDEUS, Projects, Transport, Research: http://ec.europa.eu/research/transport/projects/article_5013_en.html
European Commission, 2010d, Environment, http://ec.europa.eu/environment/life/
European Transport, 2002, IDIOMA – Final Report for Publication, Project Funded by the Commission under the RTD Programme of the 4th Framework Programme
Exploaterings Kontoret, 2010, Facts and figures on Hammarby Sjostad, City of Stockholm
Flickr, 2010, Photo Sharing http://www.flickr.com/photos/oskarbakke/3376010114/#/
Franzén, S. and Blinge, M., 2007, Utvärdering av pilotproject med Kvällsdistribution I Stock-
holms innerstad (Östermalm) 2005-2006, (In Swedish only), Chalmers University of Technol-
ogy, Report CEC 2007:1, Göteborg
Freight Best Practice, 2010, http://www.freightbestpractice.org.uk/case-studies
FREILOT, 2010, Urban Freight Energy Efficiency Pilot: http://www.freilot.eu/
Geroliminis, N. and Daganzo, C. F., 2005, A review of green logistics schemes used in cities around the world, U.C. Berkeley Center for Future Urban Transport: A Volvo Center of Excel-lence, Institute of Transportation Studies, U.C. Berkeley
Giannopoulos, G., 2009, Towards a European ITS for freight transport and logistics: results of current EU funded research and prospects for the future, European Transportation Research Review (1) 147-161
Godstrafiken.nu, 2010, http://www.godstrafiken.nu/Default.aspx?epslanguage=SV
Goevaers, R., 2008, The PIEK Project, Presentation at BESTUFS Final Conference in Athens http://www.bestufs.net/
Hammarby Sjöstad, 2010, http://www.hammarbysjostad.se/
Hayes, S., 2008, Noise Abatement: Quiet Night Deliveries in Barcelona, POLIS Environment & Health WG, SILENCE, Barcelona, http://www.silence-ip.org/site/

151
Holguín-Veras, J., Wang, Q., Xu, N., Ozbay, K., Cetin, M. and Polimeni, J., 2006, The impacts of time of day pricing on the behavior of freight carriers in a congested urban area: Implica-tions to road pricing, Transportation Research Part A 40, 744-766
Hugosson, B. and Sunnerstedt, 2008, Ett Logistiksystem i Världsklass – Okad framkomlighet i innerstaden genom smartare distribution av varor (A world class logistics system – In Swe-dish only) – Utkast - Arbetsmaterial, Miljöförvaltningen
Huschebeck, M. and Allen, J., 2005, Policy and Research Recommendations I – Urban Consol-idation Centres, Last Mile Solutions, BESTUFS D1.1
Institute of City Logistics, 2010, http://www.citylogistics.org/
Karrer, R., and Ruesch, M., 2007, Road pricing and urban freight transport – Urban freight platforms, Best Practice Update 2007 Part I, Updated from Year 2002, BESTUFS II Deliverable D2.3 Part I, www.bestufs.net
Karrer, R., Petz, C. and Ruesch, M., 2007, Intelligent Transport Systems (ITS), Updated Hand-book from year 2003, BESTUFS Deliverable D2.3 Part II, www.bestufs.net
Klaus, P., 2005, A future role for urban consolidation centres? – German experiences and prospects, Presentation at the 1st BESTUFS II Workshop in London, 14 January 2005
Kristoffersson, J, 2010, TransOpt – energieffektiv distributionstrafik i storstadsmiljö, Tran-
sOpt presentation workshop, Sustainable Innovation i Sverige (SUST), Stockholm, (only in Swedish)
Kristoffersson, J., Eklund, B. and Petterson, M., 2010, Förutsättningar för Samordnad god-
strafik inom Norra Djurdårdsstaden I Stockholm, Utgiven av Sustainable Innovation i Sverige
AB (SUST), (only in Swedish)
Köhler, U., 2003, New Ideas for the City-Logistics – Project in Kassel, Logistics systems for
sustainable cities: proceedings of the 3rd International Conference on City Logistics in Madei-ra, Portugal 25-27 June 2003, Elsevier Ltd.
Läget på vägarna, 2010, http://trafikinfo.trafikverket.se/lpvmenu/lpvmenu.htm#id=1
Miljöfordon, 2010, Green vehicles in Sweden, http://www.miljofordon.se/
Miljöförvaltningen, 2009, BEST – Results and recommendations from the European BEST
Project, Environmental and Health Administration, City of Stockholm
Miljömiljarden, 2006, Miljöeffektiva varuleveranser, Slutrapport, Project number B 112
MIRACLES, 2006, Annex 3 – 2nd Implementation Report for Barcelona, Report on Evaluation Results, Deliverable No 4.2, version No 4.0, www.civitas-initiative.org/
NICHES, 2007a, Road Pricing Schemes, Innovative Demand Management Strategies, Policy Notes, www.niches-transport.org
NICHES, 2007b, Inner-city Night Delivery, Innovative Approaches in City Logistics, Policy notes www.niches-transport.org

152
NICHES, 2007c, Space Management for Urban Delivery, Innovative Approaches in City Logis-tics, Policy Notes, www.niches-transport.org
NICHES+, 2010, What is NICHES+? http://niches-transport.euregio.net/
Oresund, 2010, Oresund Ecomobility Knowledge and Information Centre: http://www.oresund.org/ecomobility
Persson, A. and Bratt, M., 2001, Future CO2 savings from on-line shopping jeopardized by bad
planning, ÅF-Energikonsult AB and LIP Council, ECEEE Paper, Sweden
Persson, A. and Trepte, B., 2000, Logistik och e-handel av dagligvaror i Hammarby Sjöstad,
ÅF-Energikonsult AB, Stockholm, Sweden (in Swedish only)
Persson, A., Bratt, M., Wahlgren, P. and Higson, J., 2003, Smart infrastructure solutions im-
plemented in Stockholm – systematic approach on transports pays off in many ways, ÅF-
Energikonsult AB & Bratt Communication, Hammarby Sjöstad Home Department Service and
john Higson Ltd, Stockholm, Sweden
Poldermans, C., 2005, Sustainable Urban Development –The case of Hammarby Sjöstad, Pa-
per for Advanced Course in Human Geography, Kulturgeografiska Institutionen, Stockholms Universitet
Rapaport, E., 2002, The Stockholm environmental zone, a method to curb air pollution from bus and truck traffic, Transportation Research Part D (7), 213-224
Replogle, M., 2006, Road Pricing and Congestion Charging – Experience, Opportunities, Mo-tivation, Presentation to BAQ-pre-meeting, Environmental Defense and the Institute for Transportation and Development Policy
Rodrigue, J.P., Slack, B. and Comtois, C., 2001, Green Logistics (The Paradoxes of), Handbook of Logistics ad Supply-Chain Management, Handbooks in Transport #2, London, Perga-mon/Elsevier, pp 339-351
Ruesch, M. and Patz, C., 2008, Public Private Partnerships (PPP) in urban freight transport, Updated Handbook from Year 2003, , BESTUFS Deliverable D2.4 Part II, www.bestufs.net
Russo, F. and Comi, A., 2010, A classification of city logistics measures and connected im-pacts, The sixth International Conference on City Logistics, Procedia Social and Behavioral Sciences 2, 6355-6365
Sathaye, N., Li, Y., Horvath, A. and Madanat, S., 2006, The Environmental Impacts of Logistics Systems and Options for Mitigation, Working Paper, U.C. Berkeley Center for Future Urban Transport: A Volvo Center of Excellence, Institute of Transportation Studies, U.C. Berkeley
Sathaye, N., Harley, R. and Madanat, S., 2009, Unintended environmental impacts of night-time freight logistics activities, U.C. Berkeley Center for Future Urban Transport: A Volvo Center of Excellence, Institute of Transportation Studies, U.C. Berkeley
SCANIA, 2010, Scania Image Bank: http://imagebank.scania.com/
SFS, 1998, The Swedish Environmental Code, SFS 1998:808

153
SIKA Statistik, 2005, Forecast for Swedish goods transport for 2020, Summary of SIKA Report, 2005:9
SIKA Statistik, 2009, Lätta och tunga lastbilar 2008 (Light and heavy goods vehicles 2008 – In Swedish only), Vägtrafik, 2009:13
SILENCE, 2008, Practitioner Handbook for Local Noise Action Plans, Recommendations from the SILENCE Project, p. 93-4 http://www.silence-ip.org/site/
SLB-analys, 2009, The effects of the congestion tax on emissions and air quality, Stockholm Environment and Health Administration, SLB 8:2009
START, 2010, Short Term Actions to Reorganize Transport of goods: http://www.start-project.org/default.htm
Steele, St., 2008, Green Logistics – Urban Freight (presentation), Freight Transport for Lon-don, 23 April 2008
Stockholmsförsöket, 2010, The Stockholm Trial, http://www.stockholmsforsoket.se/
Stockholm Stad, 2010a, Norra Djurgården, http://www.stockholm.se/norradjurgardsstaden
Stockholm Stad, 2010b, Miljöbarometern, http://miljobarometern.stockholm.se/
Stockholm Stad, 2010c, Cykelreseplaneraren, http://cykla.stockholm.se/
SUGAR, 2010, Sustainable Urban Goods Logistics Achieved by Regional and Local Policies: http://www.sugarlogistics.eu/
Taniguchi, E., Thompson, R.G. and Yamada, T., (2001), Recent advances in modelling city lo-gistics. In: City Logistics II (E. Taniguchi and R.G. Thompson, eds.), Institute of Systems Science Research, Kyoto, pp.3-34.
Taniguchi, E., Thompson, R.G. and Yamada, T., (2003) Visions for City Logistics, In: Logistics Systems for Sustainable Cities, Proceedings of the 3rd International Conference on City Logis-tics, Madeira, Portugal (25-27.6.2003)
TfL, 2007a, London Freight Plan – Sustainable freight distribution: a plan for London, Trans-port for London www.tfl.gov.uk/microsites/freight
TfL, 2007b, Building a better future for freight: Construction Logistics Plans, Transport for London, (available at: http://www.tfl.gov.uk/microsites/freight/construction_logistics_plans.aspx)
TfL, 2008, Central London Congestion Charging Impacts Monitoring – Sixth Annual Report, Transport for London, July 2008
TfL, 2009, London Construction Consolidation Centre – Final Report, Transport for London in partnership with Bovis Lend Lease, Constructing Excellence, Stanhope, Wilson James and the University of Westminster
TfL, 2010, Congestion Charging: http://www.tfl.gov.uk/roadusers/congestioncharging/
Trafik Stockholm, 2010, Traffic Management Centre channels:

154
http://www.trafikstockholm.com/images/nya/trafikledningsinformation_svenska.jpg
Trafikanalys, 2010a, Fordon I län och kommuner 2009/2010, 2010-03-17
Trafikanalys, 2010b, Lastbilstrafik 2009- Swedish national and international road goods transport 2009, Statistik 2010:3
Trafiken.nu, 2010, http://www.trafiken.nu/
Trafikkontoret, 2008, Miljözon för tung trafik i Stockholm 1996-2007, Stockholm Stad, (only
in Swedish) www.stockholm.se/tk
Trafikkontoret, 2010, Analysis of traffic in Stockholm – with special focus on the effects of the congestion tax 2005-2008, Congestion Tax Monitoring Report 100520
Trafikverket, 2010, On the Road to climate Neutral Freight Transportation, http://www.vv.se/climateneutral
Trafikverket, 2010a, http://www.trafikverket.se/
Transek AB, 2006a, Fördelning av olika fordonsslag – Analys och sammanställning av for-
donsräkningar genomförda 2004, 2005 och 2006 (Distribution of different types of vehicles –
In Swedish only), 2006:24
Transek AB, 2006b, Utvärdering av effecter på distributions- och renhållningstransporter av
Stockholmsförsöket (Evaluation of the effects of the Stockholm Trial on the freight and waste
collection transport – In Swedish only), 2006:28
Transek AB, 2006c, Equity effects of the Stockholm trial, 2006:36
Transportstyrelsen, 2010, Swedish Transport Agency: http://www.transportstyrelsen.se/
Trendsetter Newsletter No 5, June 2005 http://www.trendsetter-europe.org/index.php?ID=4098
Troedson, K., 2005, Co-operation in food distribution with biogas vehicle, Presentation at First BESTUFS II Conference in Amsterdam www.bestufs.net
Ubbels, B. and de Jong, 2009, Review of Evidence on the Effects of Road Pricing, European Transport Conference 2009
UK Roundtable on Sustainable Development, 1996, Defining a Sustainable Transport Sector, UK Roundtable on Sustainable Development.
UoL, 2009, CURACAO – Coordination of Urban Road User Charging Organisational Issues, Coordination Action, Deliverable D2: State of the Art Review (FINAL), Version 8.4, Institute for Transport Studies, University of Leeds
Videolectures.net, 2010, FIDEUS, http://videolectures.net/tra08_sonnabend_fideus/
Vägverket, 2005, National ITS Strategy for 2006-2009, Version 1.01
Vägverket, 2006, Trial implementation of a congestion tax in Stockholm – 3 January – 31 July 2006, Brochure in English, Stockholm

155
Vägverket, 2008, Samordnade varuleveranser inom Stockholm Stad (Coordinated goods deli-veries within the City of Stockholm In Swedish only), Publication 2008:71
Vägverket, 2009, The Road to ITS – A guide to the process of introducing road-based ITS solu-tions, with examples of implemented applications, Publication 2009:114, second edition
Yrkestrafiken.se, 2010, http://www.yrkestrafiken.se/
Åkerman, J. and Höjer, M., 2006, How much transport can the climate stand? – Sweden on a
sustainable path in 2050, Energy Policy 34, pp 1944-1957


![Supplier Sustainability Guidelines and Expectations › content › dam › minisite › pd… · Supplier Sustainability Expectations [8] 2/18/2020 Transport & Logistics ASO’s](https://static.fdocuments.us/doc/165x107/5f0d7d8a7e708231d43a9ddb/supplier-sustainability-guidelines-and-expectations-a-content-a-dam-a-minisite.jpg)