City & County of Denver - EPA
24
Sarah Anderson Green Infrastructure Program Manager Public Works May 21st, 2019 City & County of Denver Green Infrastructure Program
Transcript of City & County of Denver - EPA
Sarah AndersonGreen Infrastructure Program ManagerPublic Works
May 21st, 2019
City & County of DenverGreen Infrastructure Program
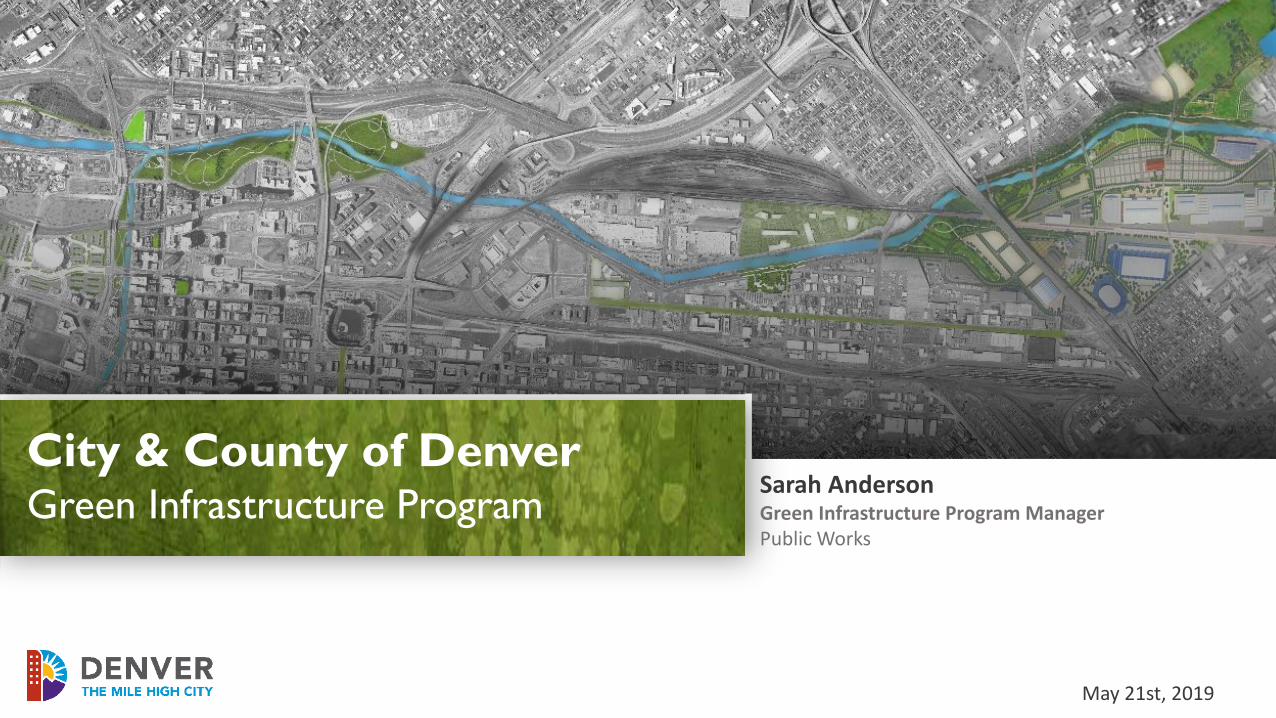
Separated Storm System
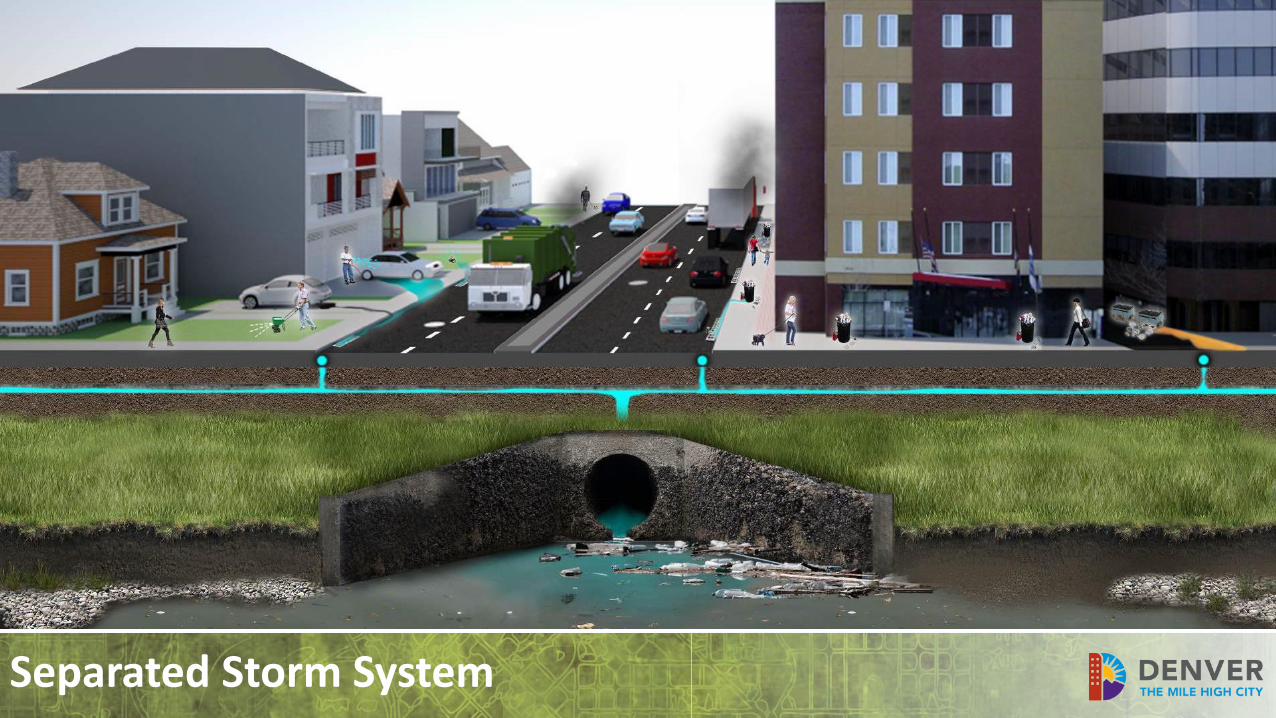
Over1200 Total Outfalls
• 300+ Outfalls into Cherry Creek
• 300+ Outfalls into South Platte
Denver’s Streams:
0/10 meet recreation standards
7/10 suitable for aquatic life2016 Water Quality Report, Denver Dept. of Environmental Health
The PROBLEM
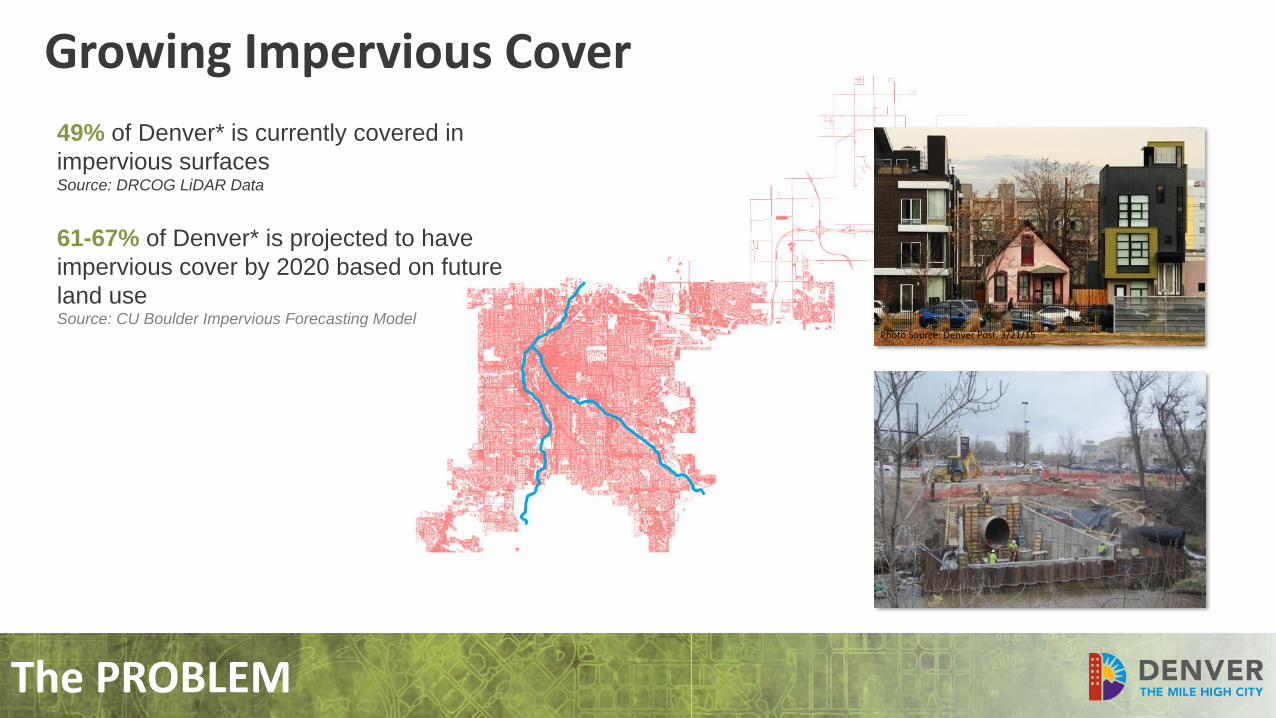
49% of Denver* is currently covered in
impervious surfacesSource: DRCOG LiDAR Data
61-67% of Denver* is projected to have
impervious cover by 2020 based on future
land useSource: CU Boulder Impervious Forecasting Model
Photo Source: Denver Post, 3/21/15
Growing Impervious Cover
The PROBLEM
The PROBLEM
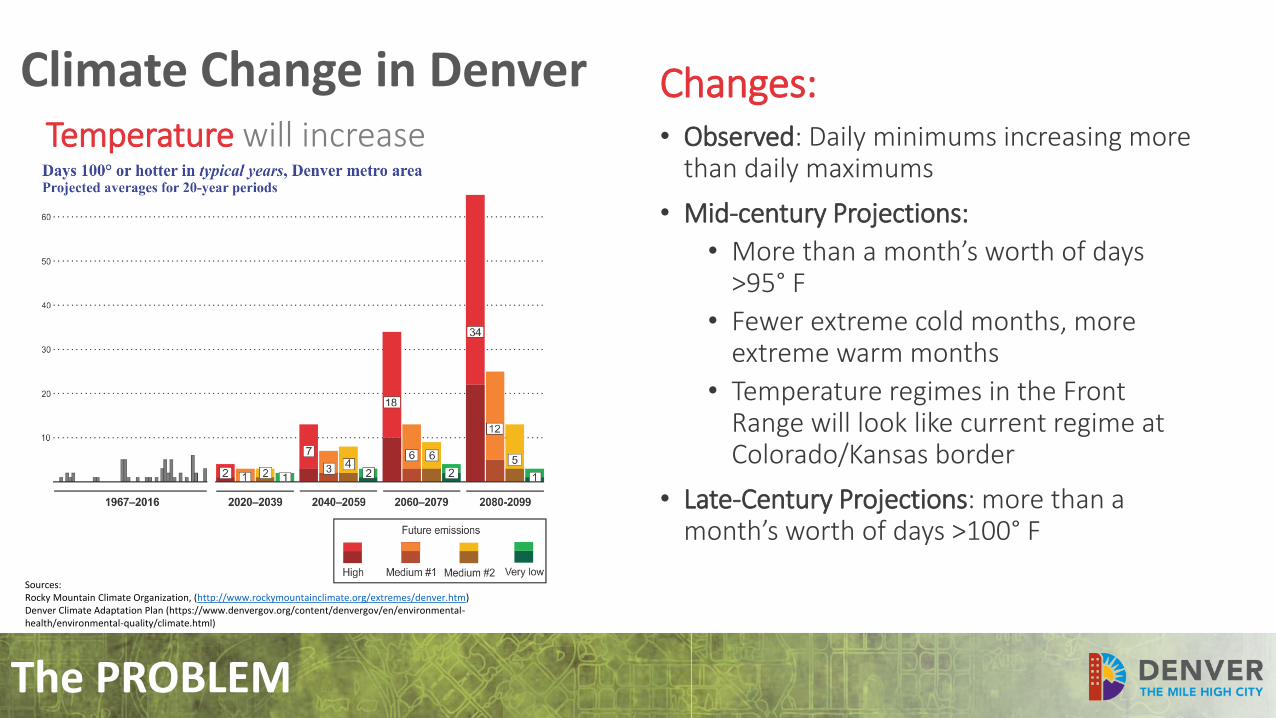
Climate Change in DenverTemperature will increase
Sources: Rocky Mountain Climate Organization, (http://www.rockymountainclimate.org/extremes/denver.htm)Denver Climate Adaptation Plan (https://www.denvergov.org/content/denvergov/en/environmental-health/environmental-quality/climate.html)
Changes:• Observed: Daily minimums increasing more
than daily maximums
• Mid-century Projections:
• More than a month’s worth of days >95° F
• Fewer extreme cold months, more extreme warm months
• Temperature regimes in the Front Range will look like current regime at Colorado/Kansas border
• Late-Century Projections: more than a month’s worth of days >100° F
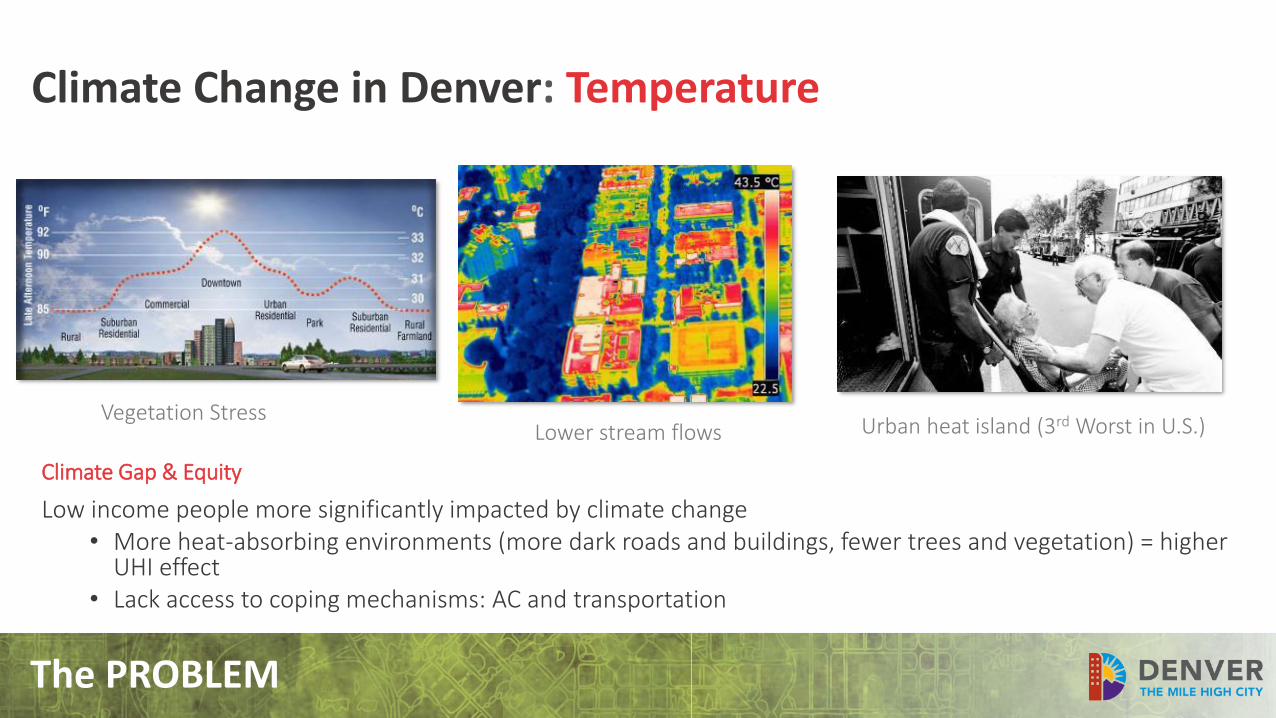
Climate Change in Denver: Temperature
Climate Gap & Equity
Low income people more significantly impacted by climate change• More heat-absorbing environments (more dark roads and buildings, fewer trees and vegetation) = higher
UHI effect• Lack access to coping mechanisms: AC and transportation
Vegetation StressLower stream flows Urban heat island (3rd Worst in U.S.)
The PROBLEM
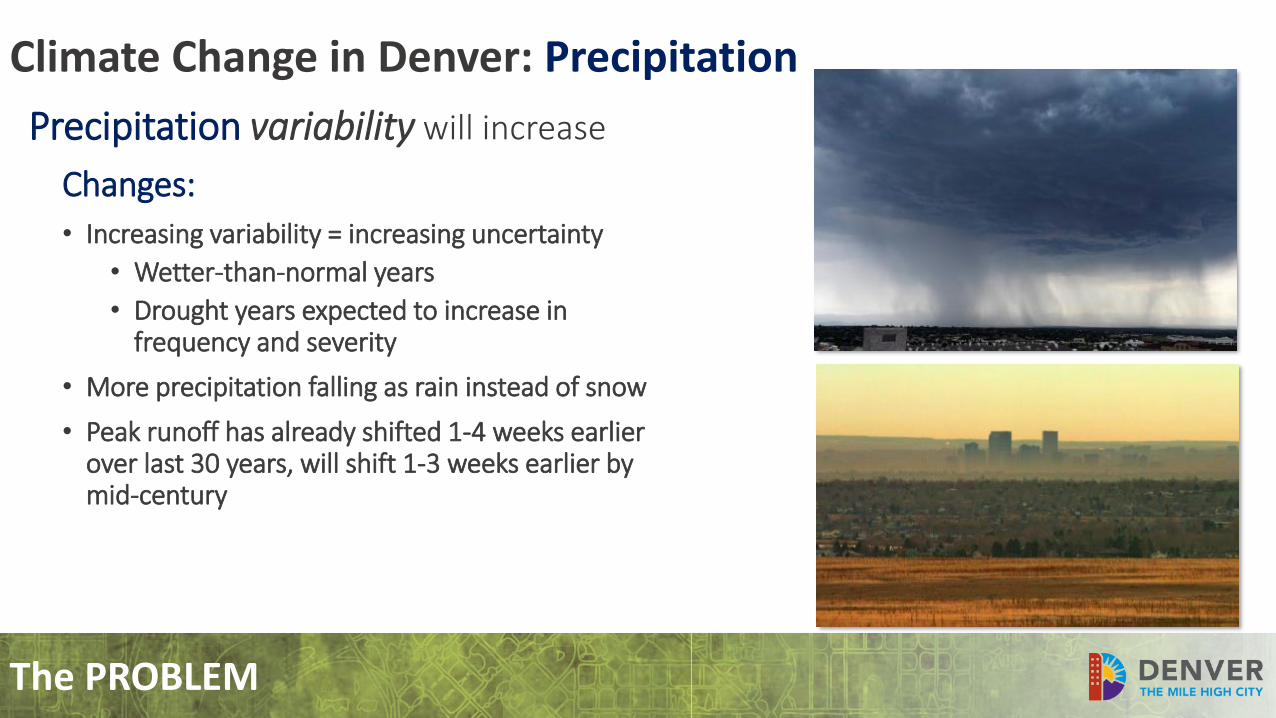
Changes:
• Increasing variability = increasing uncertainty
• Wetter-than-normal years
• Drought years expected to increase in frequency and severity
• More precipitation falling as rain instead of snow
• Peak runoff has already shifted 1-4 weeks earlier over last 30 years, will shift 1-3 weeks earlier by mid-century
Precipitation variability will increase
Climate Change in Denver: Precipitation
The PROBLEM
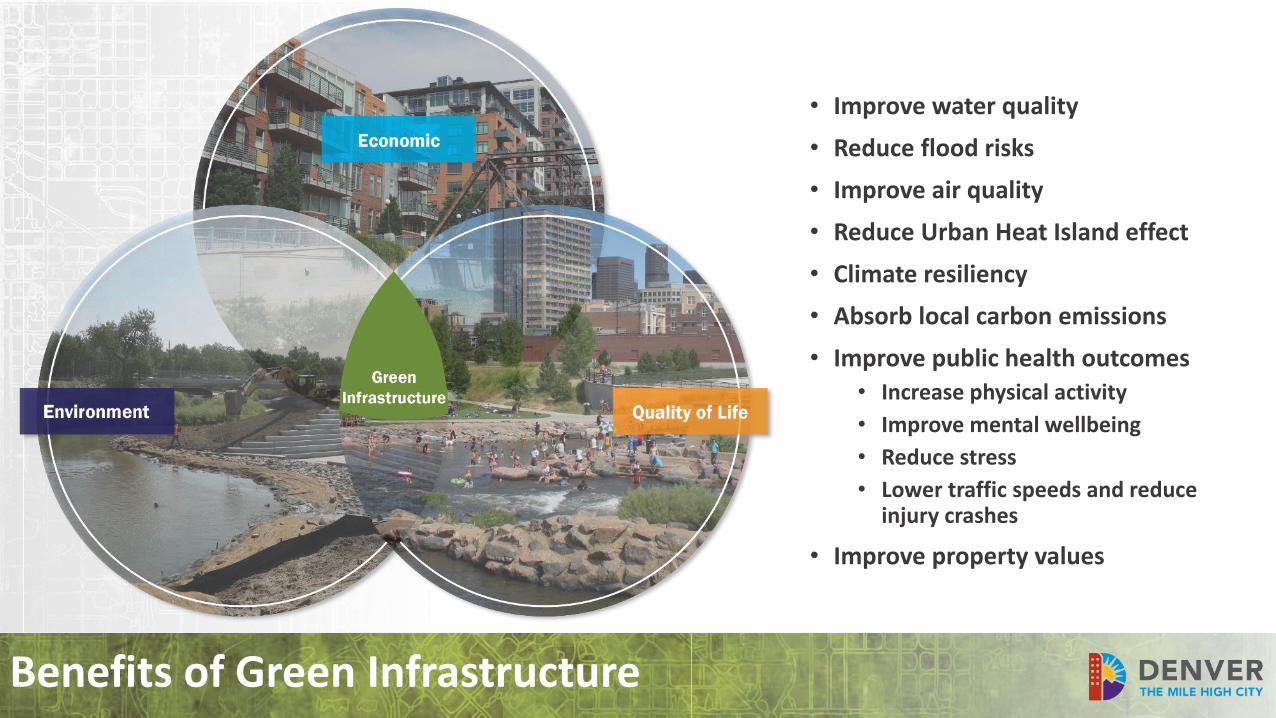
• Improve water quality
• Reduce flood risks
• Improve air quality
• Reduce Urban Heat Island effect
• Climate resiliency
• Absorb local carbon emissions
• Improve public health outcomes• Increase physical activity
• Improve mental wellbeing
• Reduce stress
• Lower traffic speeds and reduce injury crashes
• Improve property values
Benefits of Green Infrastructure

Objectives
1. Data Driven: Prioritize basins with greatest WQ needs based on data
2. Strategic Prioritization: Identify large & site-scale GI projects by using “Scorecard” criteria
3. Proactive: Address wet and dry weather discharges
4. Meet Multiple City Goals: Work with other city agencies to maximize collaboration
opportunities & ‘OPM’
Primary Category
Existing TMDL Is drainage basin directly to the SPR & existing TMDL (126 cfu/ml)
303(d) listed waterbody Does drainage basin contain a water body listed on the 303(d) list (impaired waterway)
Wet weather pollutant loading
Dry weather pollutant loading
Average annual pollutant load per land use for wet weather
Average annual dry weather pollutant load per area
Disconnected Impervious Area Density of storm drain network (higher indicates greater need for WQ)
Redevelopment Potential Per Blueprint (new development over 1 acre requires WQ)
Impervious Area within the ROW Amount of ROW divided by total basin area (streets largest contributor of pollutants)
Existing Treatment Amount of treatment expected by existing WQ facilities
Secondary Category
Park Density Ratio of park per 10,000 persons
Economics % of persons in low to moderate income level (HUD defined)
Green-ness Ratio of total tree canopy coverage divided by basin area
Heat Island Effect Measure of heat energy absorbed by urban materials
Transportation Pollutant Index Total vehicle miles traveled
Green Infrastructure Planning
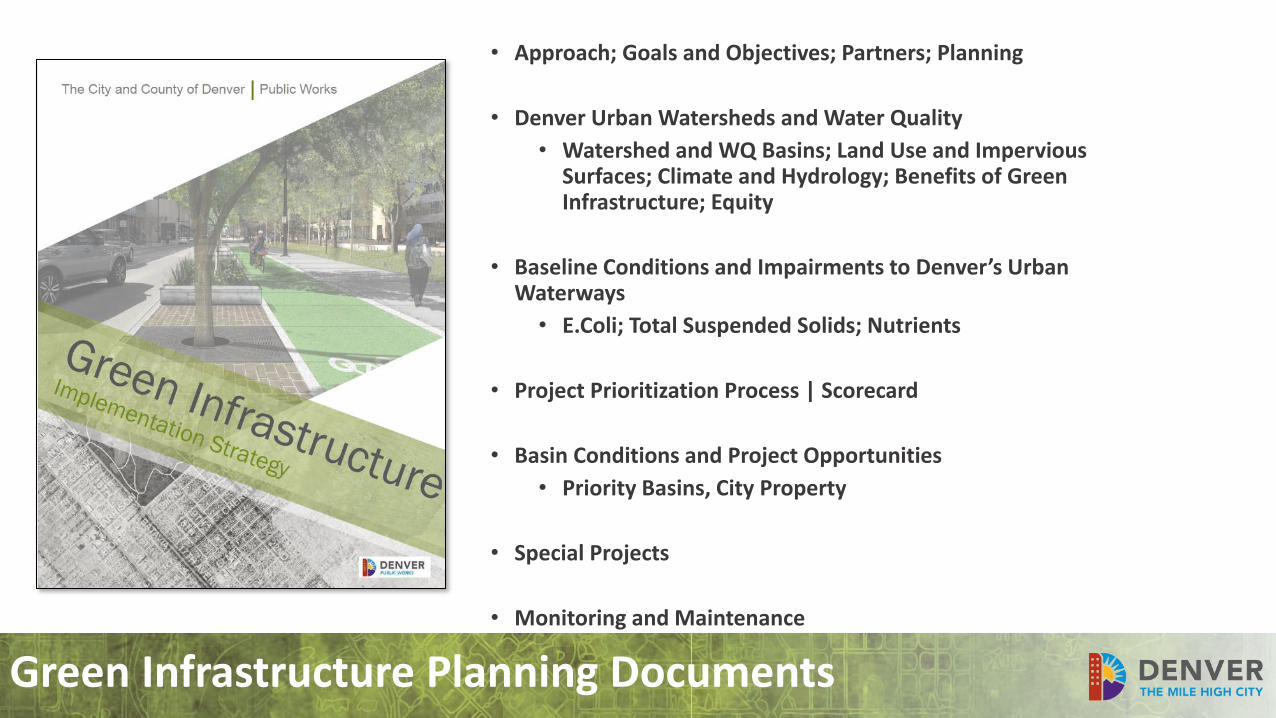
Green Infrastructure Planning Documents
• Approach; Goals and Objectives; Partners; Planning
• Denver Urban Watersheds and Water Quality
• Watershed and WQ Basins; Land Use and Impervious Surfaces; Climate and Hydrology; Benefits of Green Infrastructure; Equity
• Baseline Conditions and Impairments to Denver’s Urban Waterways
• E.Coli; Total Suspended Solids; Nutrients
• Project Prioritization Process | Scorecard
• Basin Conditions and Project Opportunities
• Priority Basins, City Property
• Special Projects
• Monitoring and Maintenance
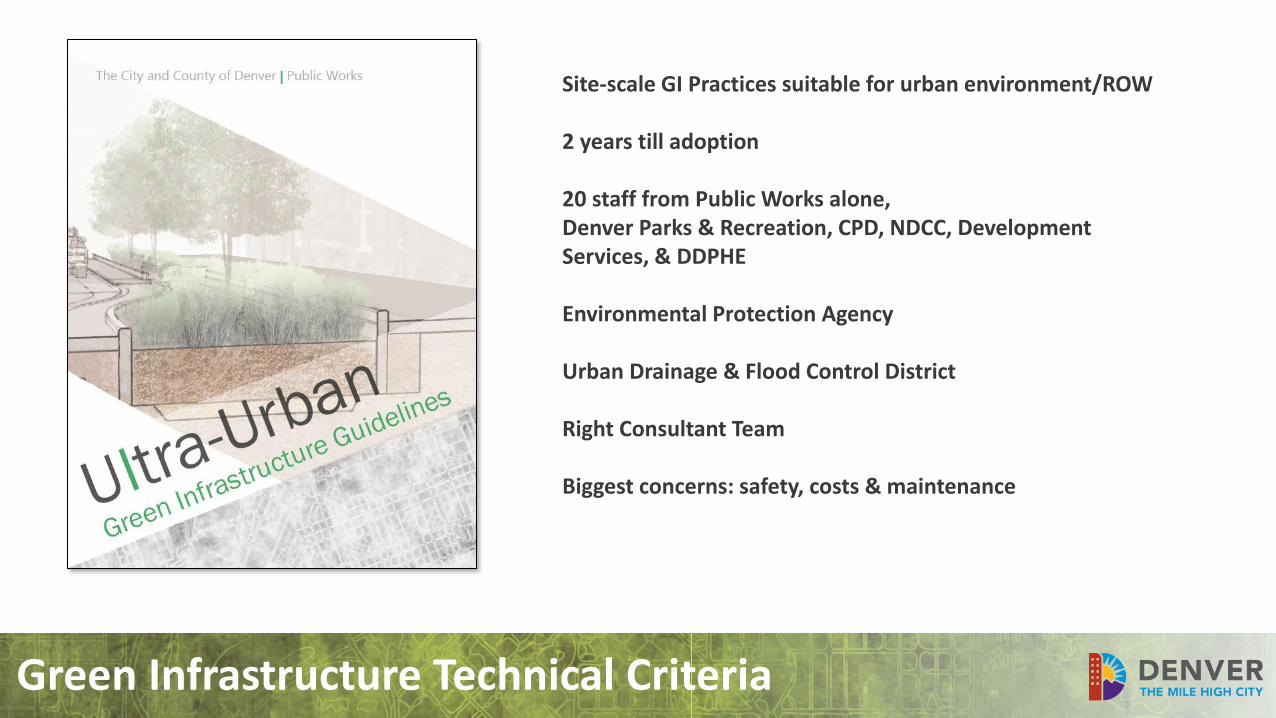
Green Infrastructure Technical Criteria
Site-scale GI Practices suitable for urban environment/ROW
2 years till adoption
20 staff from Public Works alone,Denver Parks & Recreation, CPD, NDCC, Development Services, & DDPHE
Environmental Protection Agency
Urban Drainage & Flood Control District
Right Consultant Team
Biggest concerns: safety, costs & maintenance
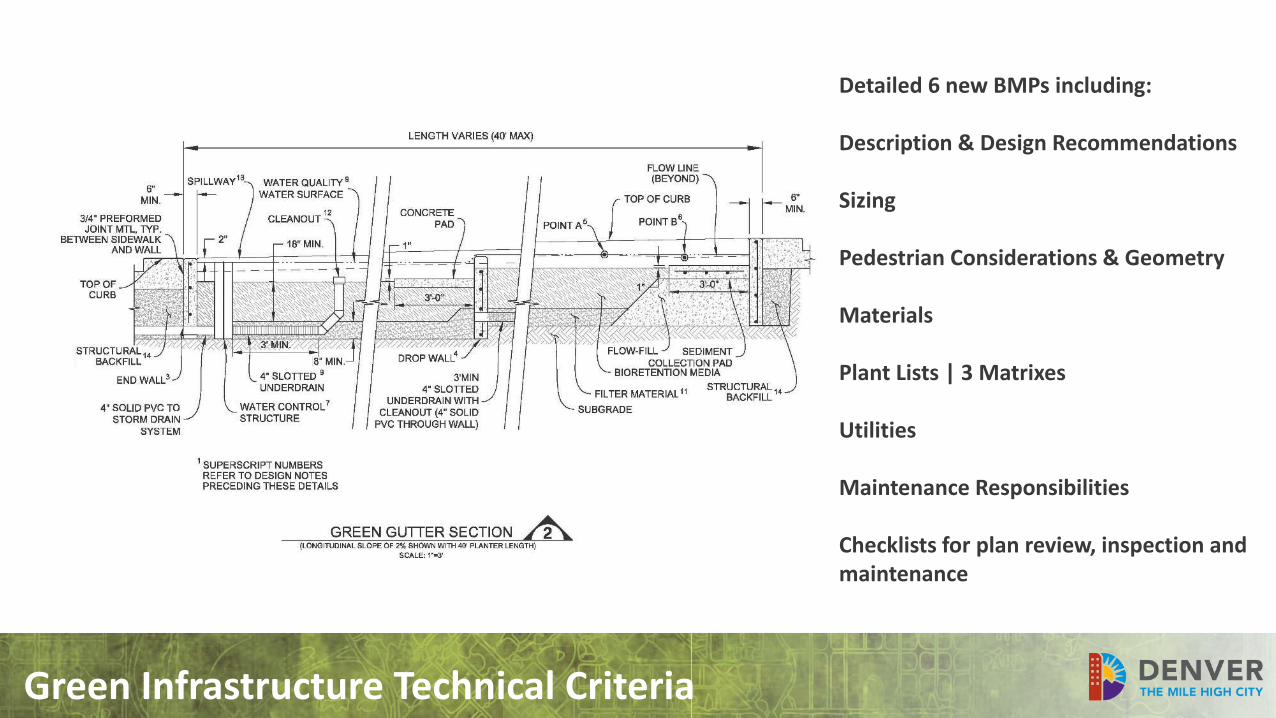
Detailed 6 new BMPs including:
Description & Design Recommendations
Sizing
Pedestrian Considerations & Geometry
Materials
Plant Lists | 3 Matrixes
Utilities
Maintenance Responsibilities
Checklists for plan review, inspection and maintenance
Green Infrastructure Technical Criteria
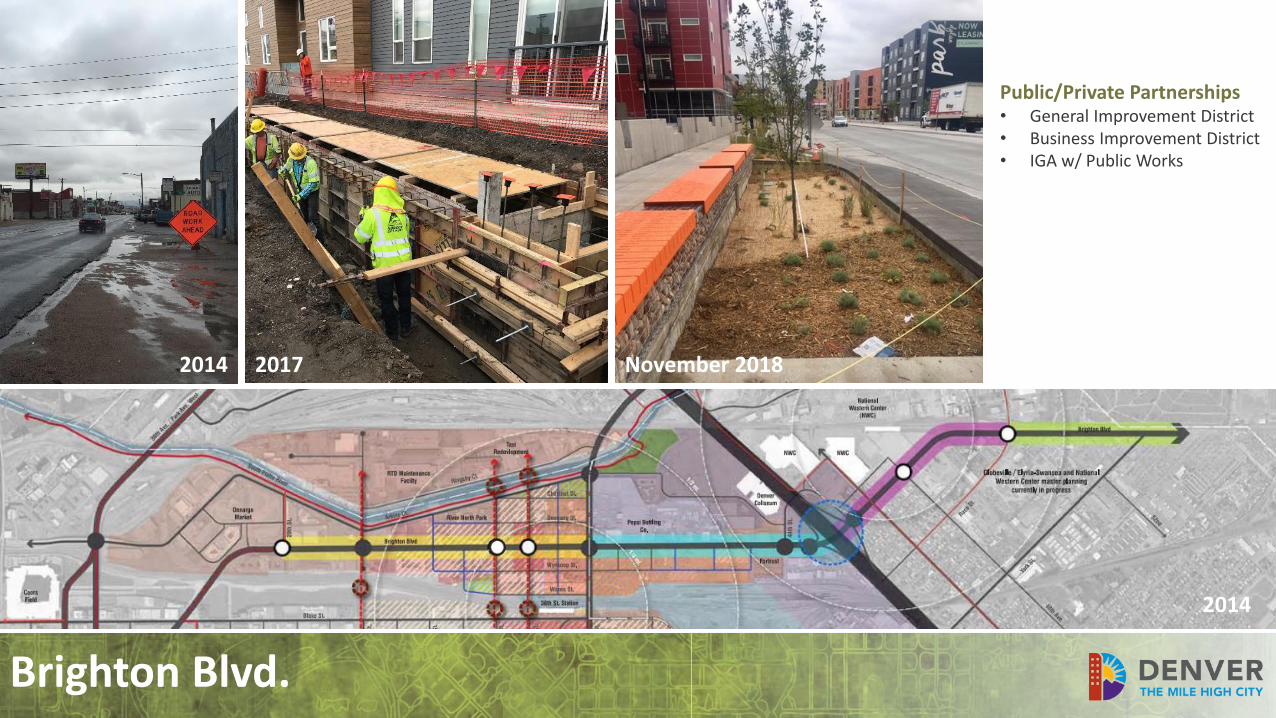
Brighton Blvd.
2014
2014 2017 November 2018
Public/Private Partnerships• General Improvement District• Business Improvement District• IGA w/ Public Works
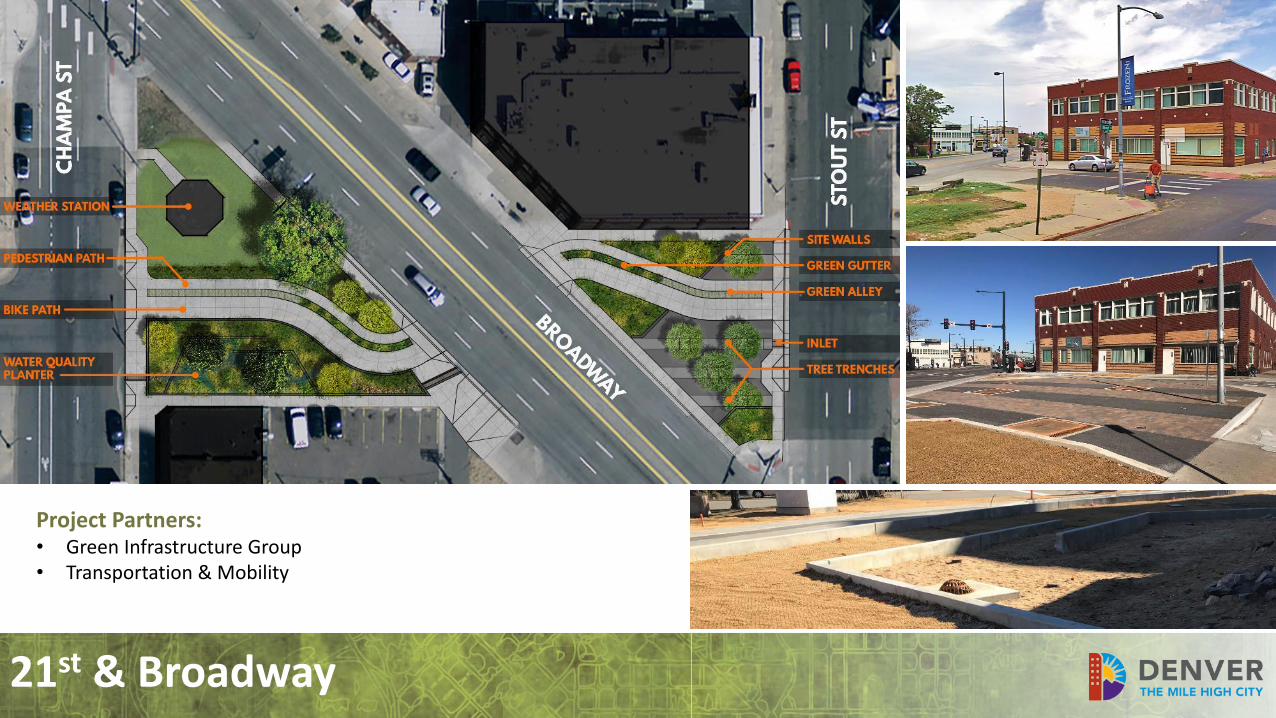
21st & Broadway
Project Partners:• Green Infrastructure Group• Transportation & Mobility
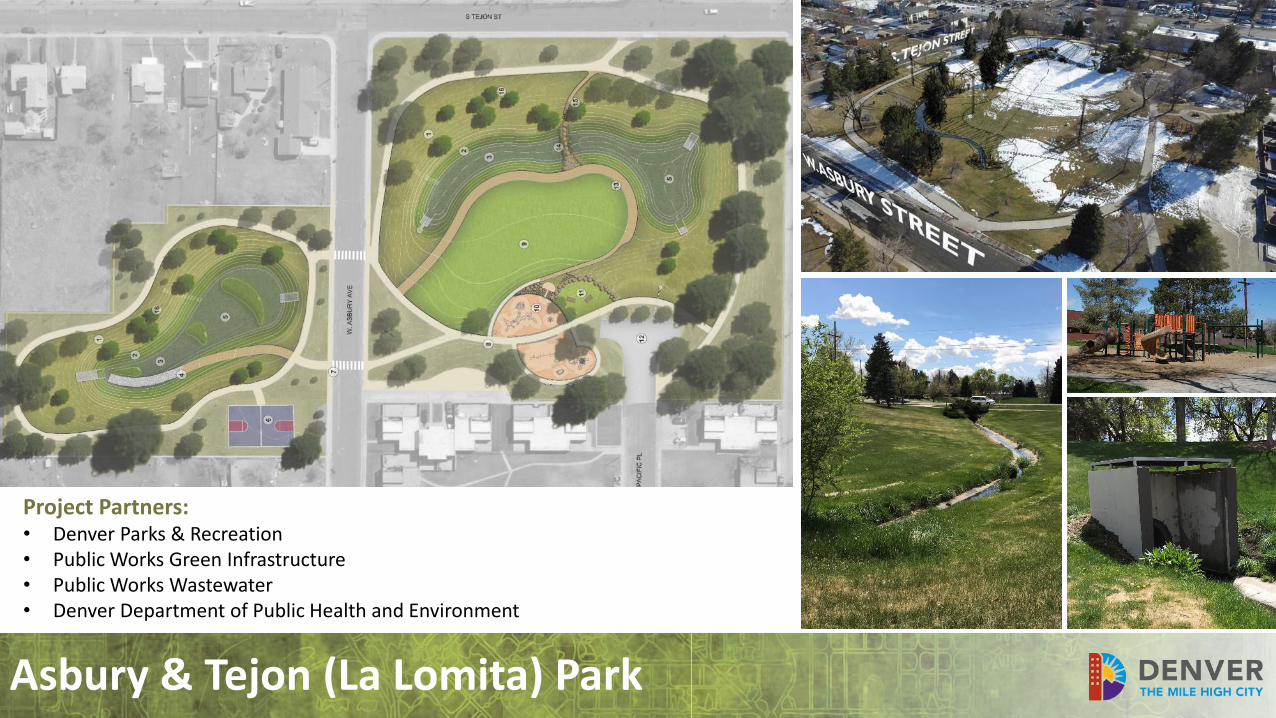
Asbury & Tejon (La Lomita) Park
Project Partners:• Denver Parks & Recreation• Public Works Green Infrastructure• Public Works Wastewater• Denver Department of Public Health and Environment
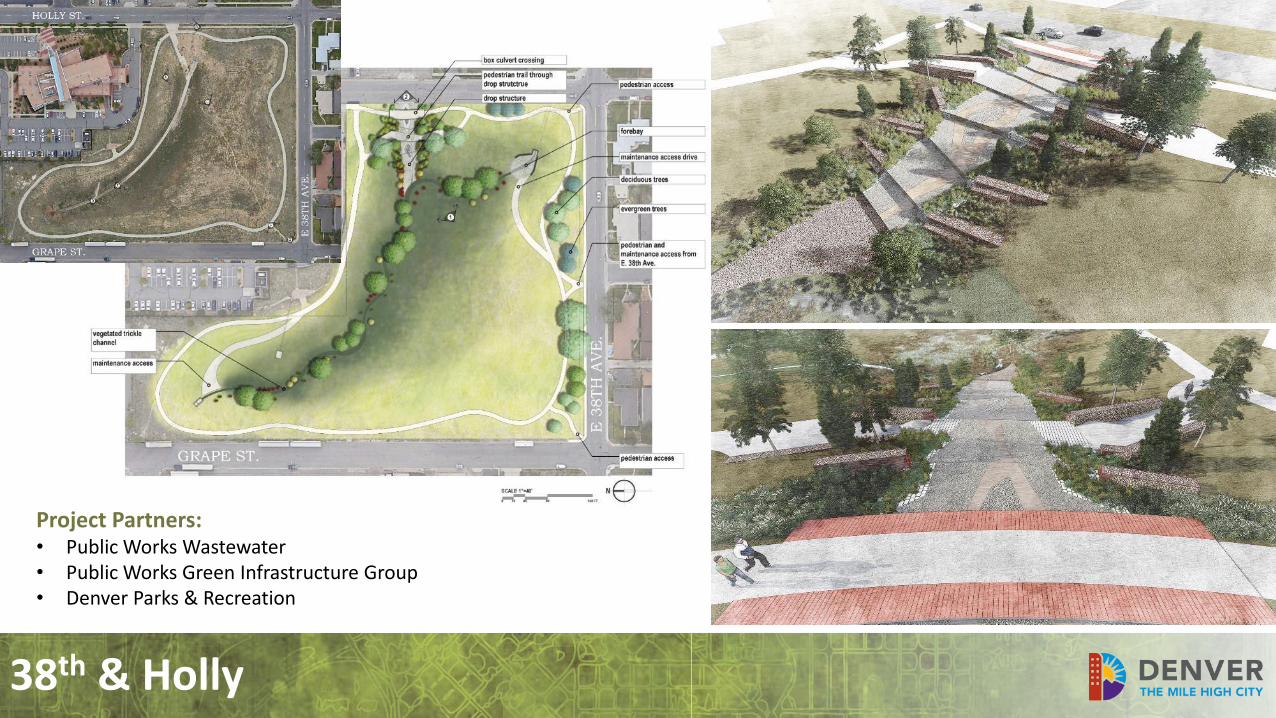
Project Partners:• Public Works Wastewater• Public Works Green Infrastructure Group• Denver Parks & Recreation
38th & Holly
Next Steps: PRT
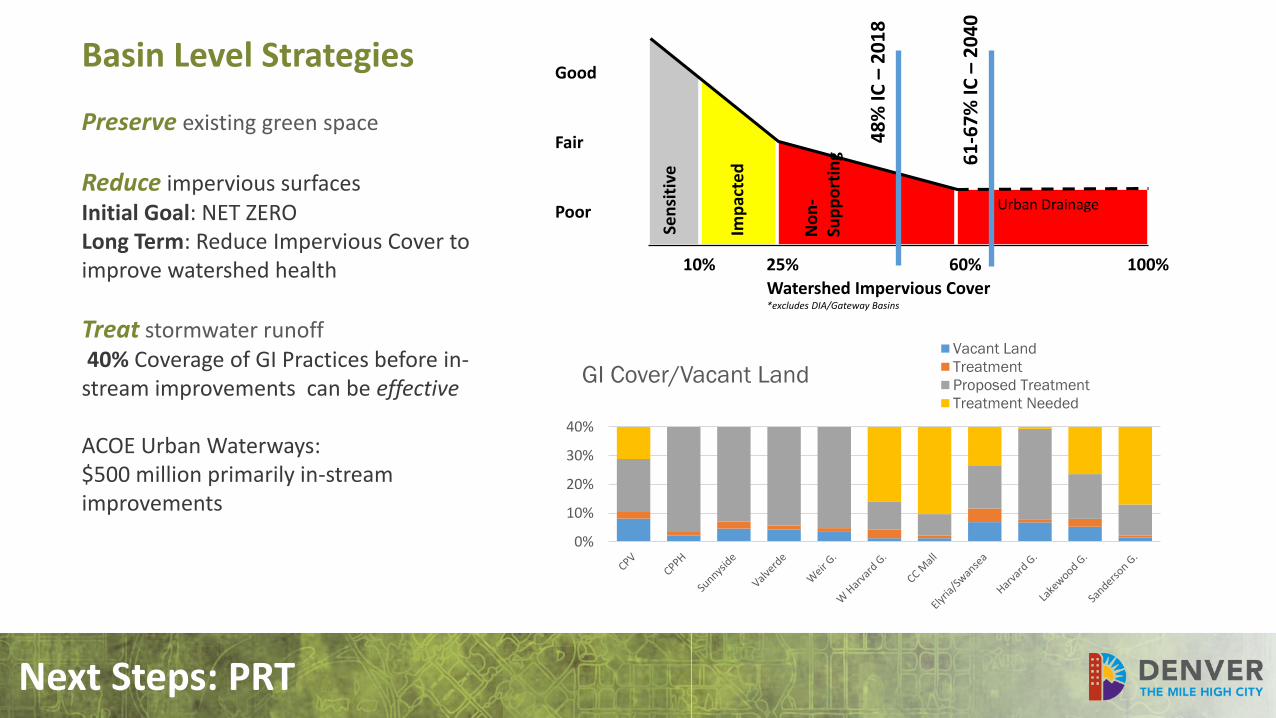
Basin Level Strategies
Preserve existing green space
Reduce impervious surfacesInitial Goal: NET ZEROLong Term: Reduce Impervious Cover to improve watershed health
Treat stormwater runoff40% Coverage of GI Practices before in-
stream improvements can be effective
ACOE Urban Waterways: $500 million primarily in-stream improvements
0%
10%
20%
30%
40%
GI Cover/Vacant Land
Vacant Land
Treatment
Proposed Treatment
Treatment Needed
Sen
siti
ve
Imp
acte
d
No
n-
Sup
po
rtin
g
Urban Drainage
10%
Fair
Poor
25% 60% 100%
Watershed Impervious Cover*excludes DIA/Gateway Basins
Good
48
% IC
–2
01
8
61
-67
% IC
–2
04
0
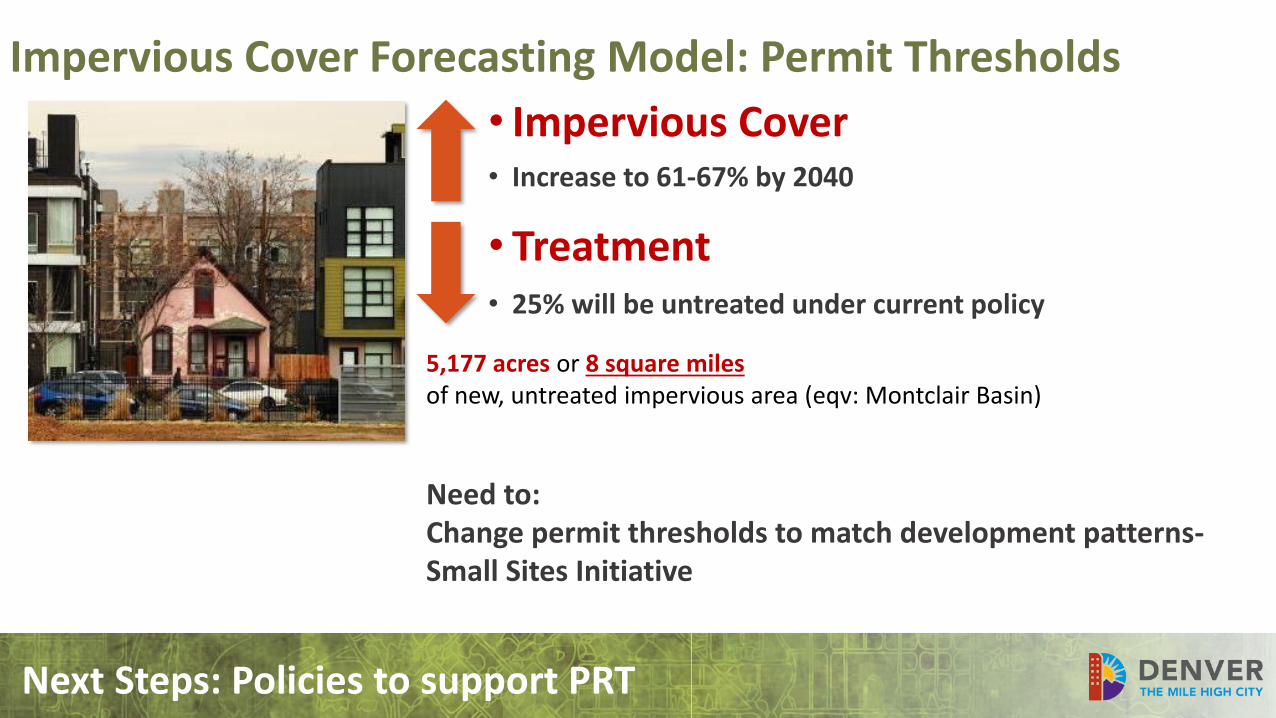
• Impervious Cover • Increase to 61-67% by 2040
• Treatment• 25% will be untreated under current policy
Impervious Cover Forecasting Model: Permit Thresholds
5,177 acres or 8 square milesof new, untreated impervious area (eqv: Montclair Basin)
Need to:Change permit thresholds to match development patterns-Small Sites Initiative
Next Steps: Policies to support PRT
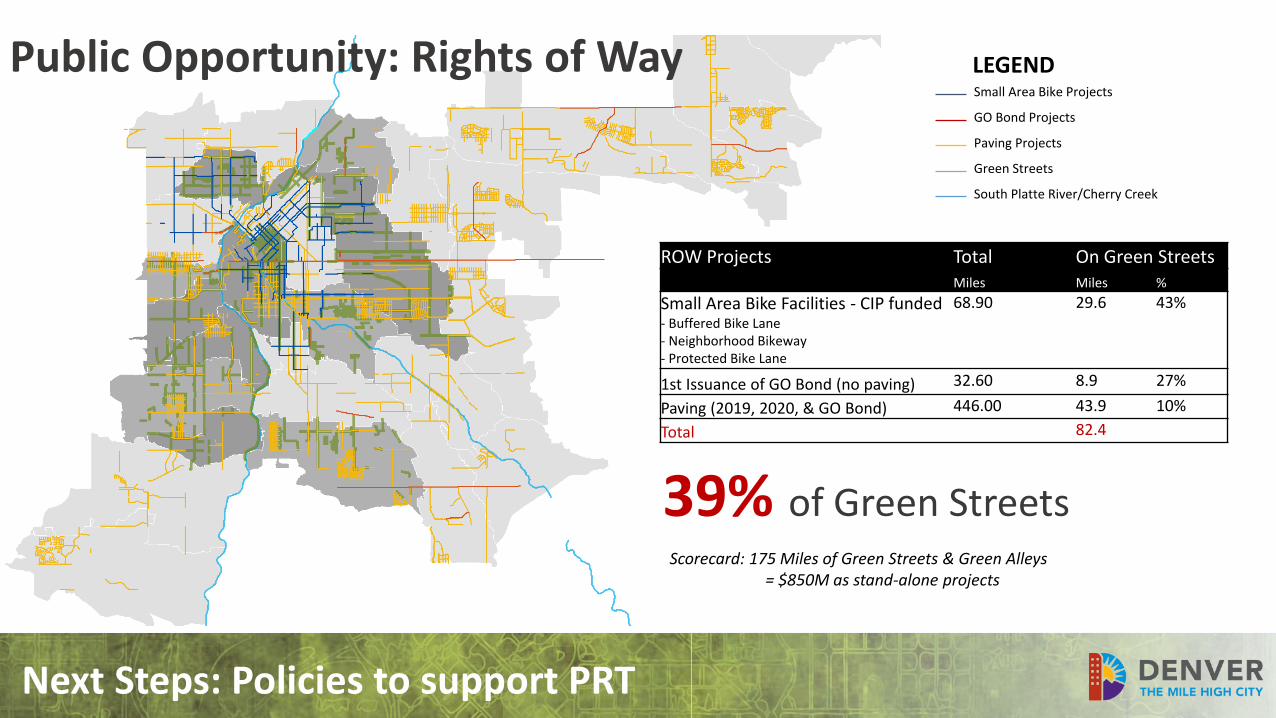
Public Opportunity: Rights of WaySmall Area Bike Projects
GO Bond Projects
Paving Projects
Green Streets
South Platte River/Cherry Creek
ROW Projects Total On Green StreetsMiles Miles %
Small Area Bike Facilities - CIP funded- Buffered Bike Lane- Neighborhood Bikeway- Protected Bike Lane
68.90 29.6 43%
1st Issuance of GO Bond (no paving) 32.60 8.9 27%
Paving (2019, 2020, & GO Bond) 446.00 43.9 10%
Total 82.4
39% of Green Streets
LEGEND
Scorecard: 175 Miles of Green Streets & Green Alleys= $850M as stand-alone projects
Next Steps: Policies to support PRT
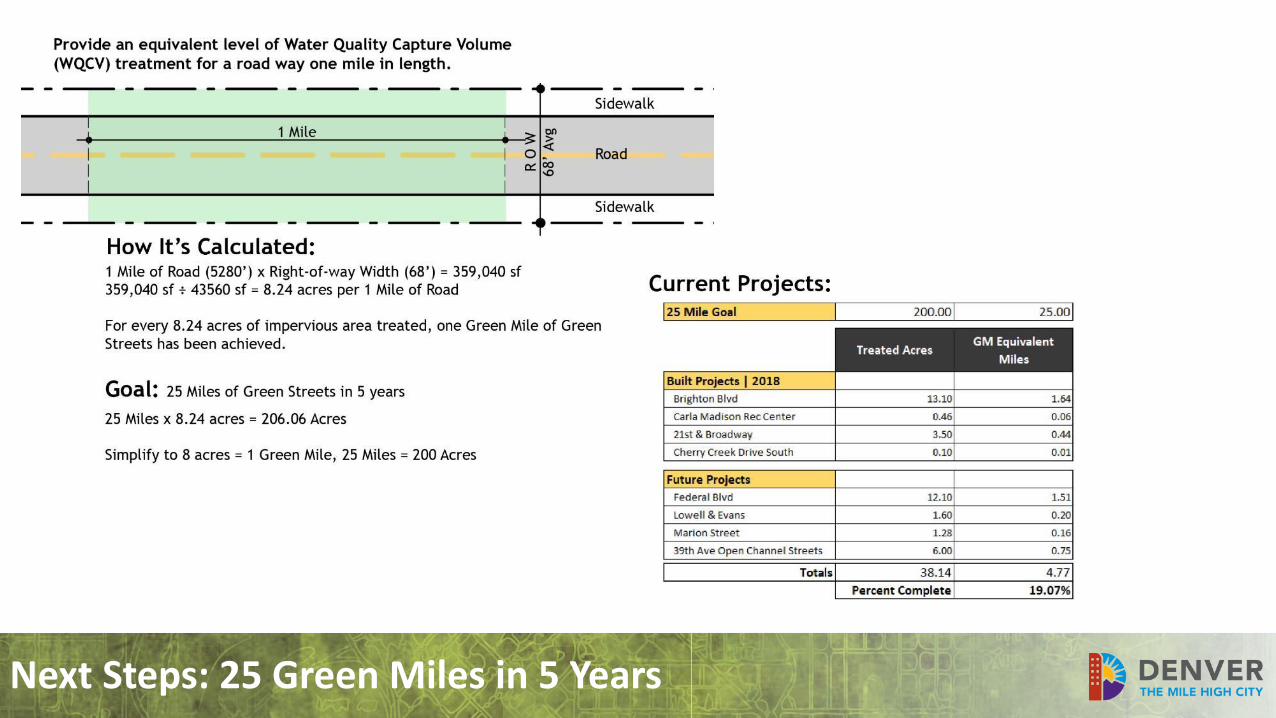
Next Steps: 25 Green Miles in 5 Years
Next Steps: Design Guidelines
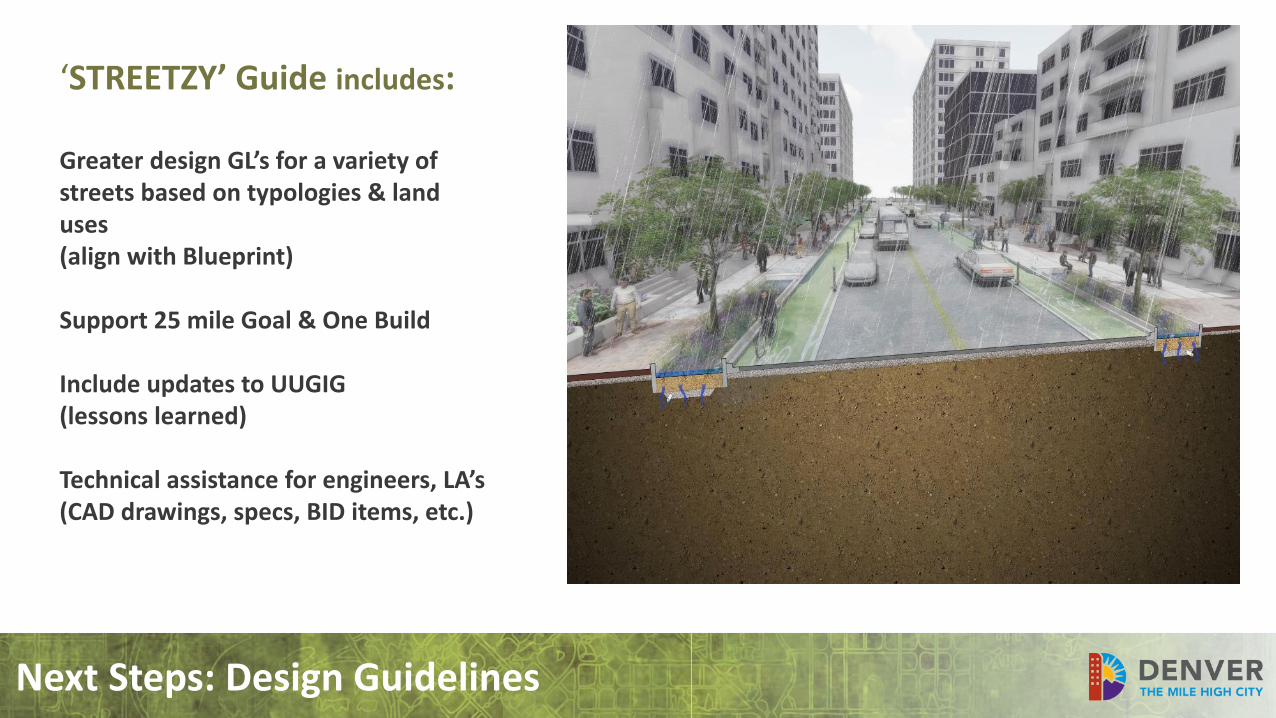
‘STREETZY’ Guide includes:
Greater design GL’s for a variety of streets based on typologies & land uses (align with Blueprint)
Support 25 mile Goal & One Build
Include updates to UUGIG(lessons learned)
Technical assistance for engineers, LA’s(CAD drawings, specs, BID items, etc.)
Next Steps: Vulnerability Analysis
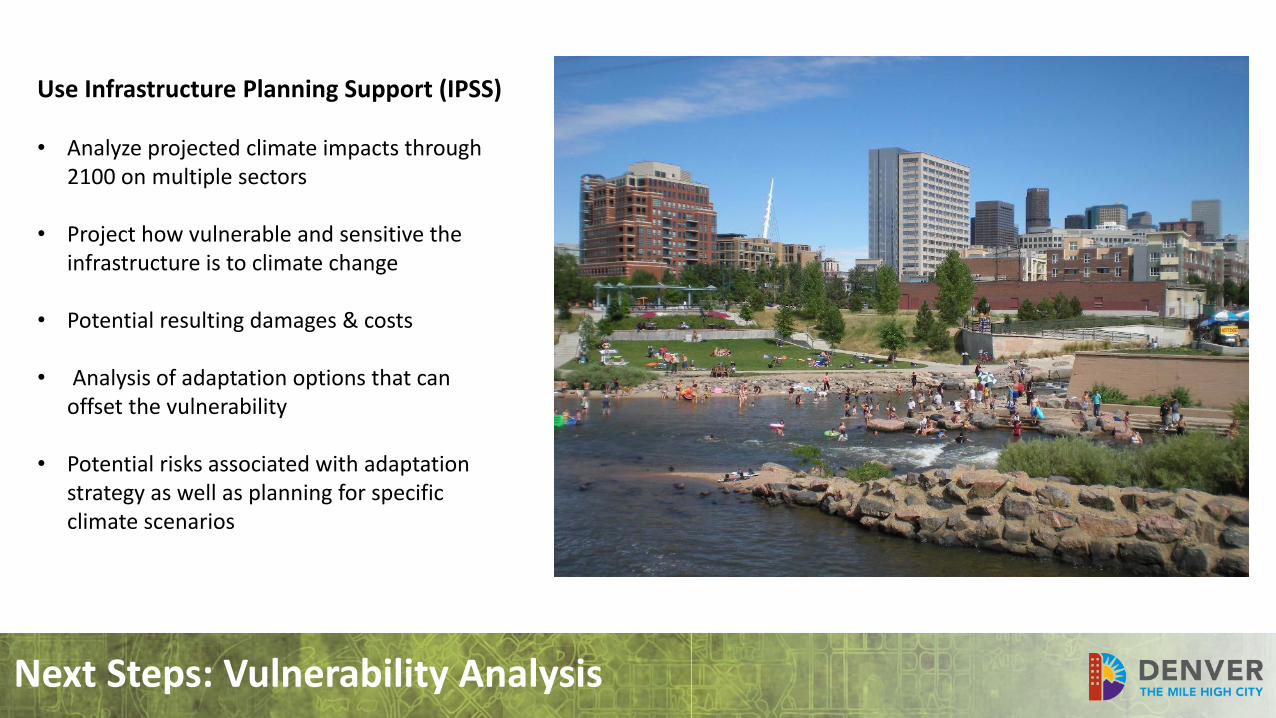
Use Infrastructure Planning Support (IPSS)
• Analyze projected climate impacts through 2100 on multiple sectors
• Project how vulnerable and sensitive the infrastructure is to climate change
• Potential resulting damages & costs
• Analysis of adaptation options that can offset the vulnerability
• Potential risks associated with adaptation strategy as well as planning for specific climate scenarios
Brian WethingtonGreen Infrastructure Group Project [email protected]
Sarah AndersonGreen Infrastructure Group Program [email protected]
For More Information, please visit:http://www.denvergov.org/greeninfrastructure
Thank You!