Citrix Cloud XenApp and XenDesktop Service Sizing and ... · o Two Cloud Connectors hosted on Azure...
19
1 | Page Citrix Cloud XenApp and XenDesktop Service Sizing and Scalability Considerations Overview The Citrix Cloud XenApp and XenDesktop Service allows you to create a virtual desktop environment that uses a cloud-based control infrastructure. This Azure-hosted infrastructure includes the Delivery Controllers, Site database, monitoring database, Director, and StoreFront. The components are updated every two weeks, giving customers the most current versions of the XenApp and XenDesktop Service. To bridge the gap between the Citrix-managed services and customer-managed components, use the Citrix Cloud Connector. The Cloud Connector is a group of services from Citrix Cloud that allow communication between the VDAs, customer-managed StoreFront, and the cloud-based Delivery Controller. When evaluating the XenApp and XenDesktop Service for sizing and scalability, consider all the components. Research and test the configuration of the Cloud Connectors and the customer-managed StoreFront for your specific requirements. Undersizing the machines can impact system performance negatively. This document provides details of the tested maximum capacities, and best practice recommendations for Cloud Connector machine configuration. Summary All results in this summary are based on the findings from a test environment as configured in the detailed sections of this document. Different system configurations may yield different results. Key results from testing: • XenApp and XenDesktop Service Sizing and Scalability o A set of three 4-vCPU Cloud Connectors is recommended for sites that host no more than 5,000 Workstation VDAs. ▪ This is an N+1 High Availability configuration. o Starting 20,000 sessions to 100 Server VDAs is 57% faster using customer-managed StoreFront compared to using Citrix-managed StoreFront. o Provisioning 1,000 VMs takes an average of 140 minutes. • XenDesktop Essentials o Two Cloud Connectors hosted on Azure Standard_A2_v2 VMs are recommended for 1,000 Windows 10 VMs. o Starting 1,000 sessions to Windows 10 VMs hosted in Azure takes less than 20 minutes. o Testing found that it takes approximately 44 seconds from when a user logs on to StoreFront until the user receives a functional VDI desktop with default settings. o Provisioning 1,000 Windows 10 VMs in Azure takes an average of 8 hrs.
Transcript of Citrix Cloud XenApp and XenDesktop Service Sizing and ... · o Two Cloud Connectors hosted on Azure...
1 | P a g e
Citrix Cloud XenApp and XenDesktop Service Sizing and Scalability Considerations
Overview The Citrix Cloud XenApp and XenDesktop Service allows you to create a virtual desktop environment that uses a cloud-based control infrastructure. This Azure-hosted infrastructure includes the Delivery Controllers, Site database, monitoring database, Director, and StoreFront. The components are updated every two weeks, giving customers the most current versions of the XenApp and XenDesktop Service.
To bridge the gap between the Citrix-managed services and customer-managed components, use the Citrix Cloud Connector. The Cloud Connector is a group of services from Citrix Cloud that allow communication between the VDAs, customer-managed StoreFront, and the cloud-based Delivery Controller.
When evaluating the XenApp and XenDesktop Service for sizing and scalability, consider all the components. Research and test the configuration of the Cloud Connectors and the customer-managed StoreFront for your specific requirements. Undersizing the machines can impact system performance negatively. This document provides details of the tested maximum capacities, and best practice recommendations for Cloud Connector machine configuration.
Summary All results in this summary are based on the findings from a test environment as configured in the detailed sections of this document. Different system configurations may yield different results.
Key results from testing:
• XenApp and XenDesktop Service Sizing and Scalability o A set of three 4-vCPU Cloud Connectors is recommended for sites that host no more
than 5,000 Workstation VDAs. ▪ This is an N+1 High Availability configuration.
o Starting 20,000 sessions to 100 Server VDAs is 57% faster using customer-managed StoreFront compared to using Citrix-managed StoreFront.
o Provisioning 1,000 VMs takes an average of 140 minutes.
• XenDesktop Essentials o Two Cloud Connectors hosted on Azure Standard_A2_v2 VMs are recommended for
1,000 Windows 10 VMs. o Starting 1,000 sessions to Windows 10 VMs hosted in Azure takes less than 20 minutes. o Testing found that it takes approximately 44 seconds from when a user logs on to
StoreFront until the user receives a functional VDI desktop with default settings. o Provisioning 1,000 Windows 10 VMs in Azure takes an average of 8 hrs.
2 | P a g e
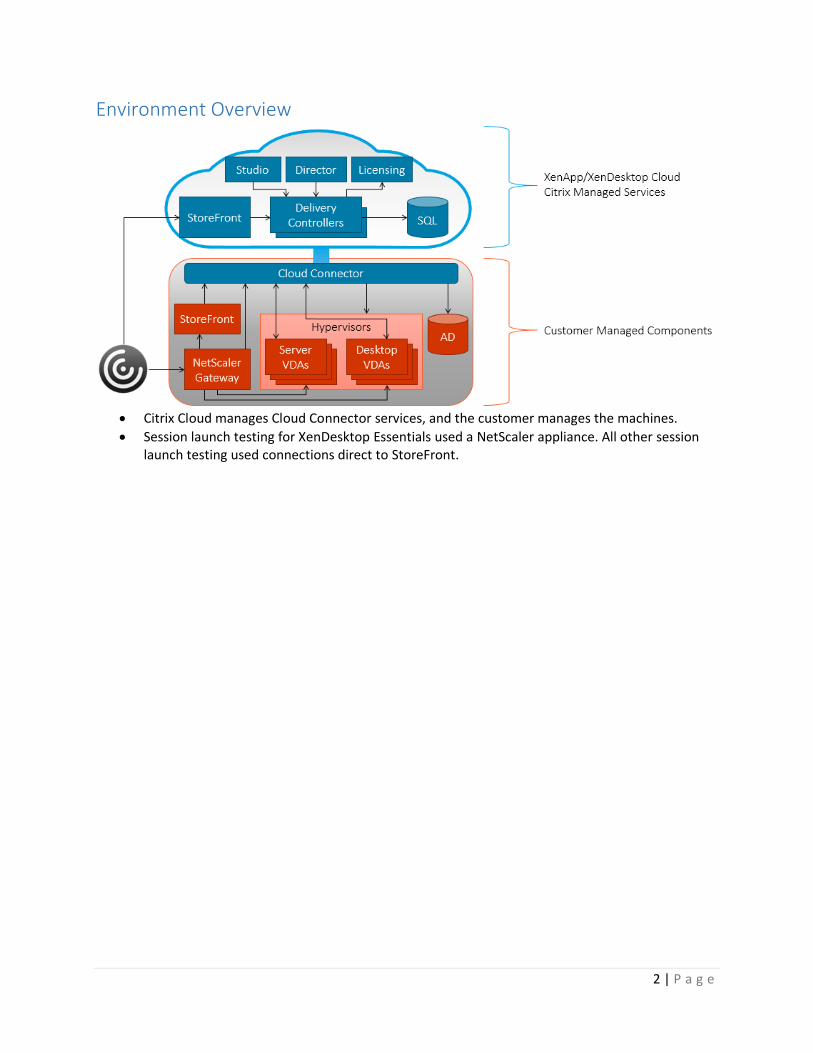
Environment Overview
• Citrix Cloud manages Cloud Connector services, and the customer manages the machines.
• Session launch testing for XenDesktop Essentials used a NetScaler appliance. All other session launch testing used connections direct to StoreFront.
3 | P a g e
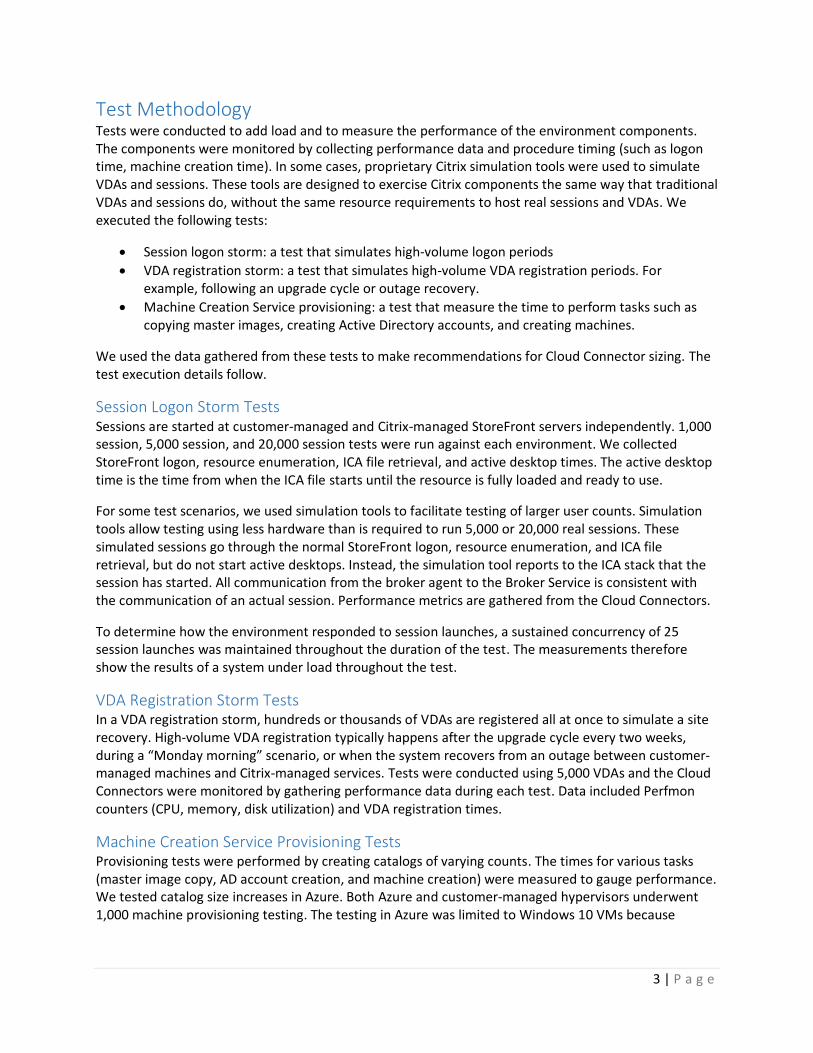
Test Methodology Tests were conducted to add load and to measure the performance of the environment components. The components were monitored by collecting performance data and procedure timing (such as logon time, machine creation time). In some cases, proprietary Citrix simulation tools were used to simulate VDAs and sessions. These tools are designed to exercise Citrix components the same way that traditional VDAs and sessions do, without the same resource requirements to host real sessions and VDAs. We executed the following tests:
• Session logon storm: a test that simulates high-volume logon periods
• VDA registration storm: a test that simulates high-volume VDA registration periods. For example, following an upgrade cycle or outage recovery.
• Machine Creation Service provisioning: a test that measure the time to perform tasks such as copying master images, creating Active Directory accounts, and creating machines.
We used the data gathered from these tests to make recommendations for Cloud Connector sizing. The test execution details follow.
Session Logon Storm Tests Sessions are started at customer-managed and Citrix-managed StoreFront servers independently. 1,000 session, 5,000 session, and 20,000 session tests were run against each environment. We collected StoreFront logon, resource enumeration, ICA file retrieval, and active desktop times. The active desktop time is the time from when the ICA file starts until the resource is fully loaded and ready to use.
For some test scenarios, we used simulation tools to facilitate testing of larger user counts. Simulation tools allow testing using less hardware than is required to run 5,000 or 20,000 real sessions. These simulated sessions go through the normal StoreFront logon, resource enumeration, and ICA file retrieval, but do not start active desktops. Instead, the simulation tool reports to the ICA stack that the session has started. All communication from the broker agent to the Broker Service is consistent with the communication of an actual session. Performance metrics are gathered from the Cloud Connectors.
To determine how the environment responded to session launches, a sustained concurrency of 25 session launches was maintained throughout the duration of the test. The measurements therefore show the results of a system under load throughout the test.
VDA Registration Storm Tests In a VDA registration storm, hundreds or thousands of VDAs are registered all at once to simulate a site recovery. High-volume VDA registration typically happens after the upgrade cycle every two weeks, during a “Monday morning” scenario, or when the system recovers from an outage between customer-managed machines and Citrix-managed services. Tests were conducted using 5,000 VDAs and the Cloud Connectors were monitored by gathering performance data during each test. Data included Perfmon counters (CPU, memory, disk utilization) and VDA registration times.
Machine Creation Service Provisioning Tests Provisioning tests were performed by creating catalogs of varying counts. The times for various tasks (master image copy, AD account creation, and machine creation) were measured to gauge performance. We tested catalog size increases in Azure. Both Azure and customer-managed hypervisors underwent 1,000 machine provisioning testing. The testing in Azure was limited to Windows 10 VMs because
4 | P a g e
Windows 10 is the only supported OS for XenDesktop Essentials. The customer-managed hypervisor was tested on Windows 10 and on Windows 2012 R2.
Test Environment The test environment configuration included Citrix Cloud Connector, XenApp and XenDesktop Service and XenApp and XenDesktop components. The machine and operating system specifications we used are provided here so you can compare our configuration and test results to your own configuration and requirements.
Tools Used An internal testing tool collected performance data and metrics from the machines under test, and drove the session launches. This proprietary tool orchestrates user session launches to the XenApp and XenDesktop environment, and provides a central location for collecting response time data and performance metrics. In essence, the test tool administers the tests and collects the results.
Test Configuration – XenApp and XenDesktop The following is a list of the machine and OS specifications used during XenApp and XenDesktop testing.
Cloud Connectors: Scenario One: Two Windows 2012 R2, 2 vCPU, 4 GB memory Scenario Two: Two Windows 2012 R2, 4 vCPU, 4 GB memory
StoreFront (customer-managed): One Windows 2012 R2, 8 vCPU, 8 GB memory Hypervisors: Eight VMware vSphere ESXi 6.0 Update 1, HP ProLiant BL 460c Gen9, Two Intel E5-2620
CPU, 256 GB Memory Hypervisor Storage: 2-TB NFS share on NetApp 3250 VDA: Windows 2012 R2 and Windows 10 32-bit Build 1607
Test Configuration – XenDesktop Essentials Sessions were started from 100 Windows 2012 R2 client launcher machines. Sessions were authenticated against a Windows Active Directory hosted in Azure. Roaming profiles were stored on a Windows file server in Azure.
VDA: 1,000 Windows 10 64-bit Build 1607, 2 vCPU, 7 GB memory (Standard_D2_v2 instance) Client: 100 Windows 2012 R2 Servers, 8 vCPU, 8 GB memory Domain Controller: Two Windows 2012 R2, 4 vCPU, 14 GB memory (Standard_D3_v2 instance) File Server: One Windows 2012 R2, DS11 instance NetScaler VPX: One NetScaler 11.0, Standard_D3_v2 instance that has 1,000 Platinum license. Cloud Connectors:
Scenario One: Two Windows 2012 R2, 2 vCPU, 4 GB memory (Standard_A2_v2 instance) Scenario Two: Two Windows 2012 R2, 4 vCPU, 7 GB memory (Standard_A3 instance)
StoreFront (customer-managed): One Windows 2012 R2, DSv2 instance
5 | P a g e
Customer-Managed Machine Considerations Customer-managed machines can be in the customer office, data center, or cloud account (such as Azure or AWS). By our definition, customer-managed machine is under the complete customer control. Customer-managed machines include: Cloud Connector, StoreFront servers, RDS servers, VDI machines, and Remote PC Access machines (not covered during testing). For the sake of brevity, we refer to RDS servers, VDI machines, and Remote PC Access machines as VDAs throughout this report.
StoreFront servers We used an 8-vCPU, 8-GB memory machine as the customer-managed StoreFront server when we tested the XenApp and XenDesktop Service. For XenDesktop Essentials testing, we used an Azure Standard_DS2_v2 (2 vCPU, 7 GB memory) for the customer-managed StoreFront server. See the StoreFront Planning Guide to size your StoreFront server properly for your environment.
Cloud Connectors We tested customer-managed Cloud Connectors hosted on VMs that had 2-vCPU and 4-GB memory in
one scenario, and 4-vCPU and 4-GB memory in another. In Azure, Cloud Connectors were tested on
Standard_A2_v2 (2 vCPU, 4 GB memory) and Standard_A3 (4 vCPU, 7 GB memory) instances.
In our testing, Cloud Connectors were deployed in HA sets (they are not load-balanced). Although this
document focuses on testing environments that have two Cloud Connectors, an N+1 set of three Cloud
Connectors is recommended. The rest of this report focuses on the Cloud Connectors and how to size
them for best performance.
6 | P a g e
Test Results
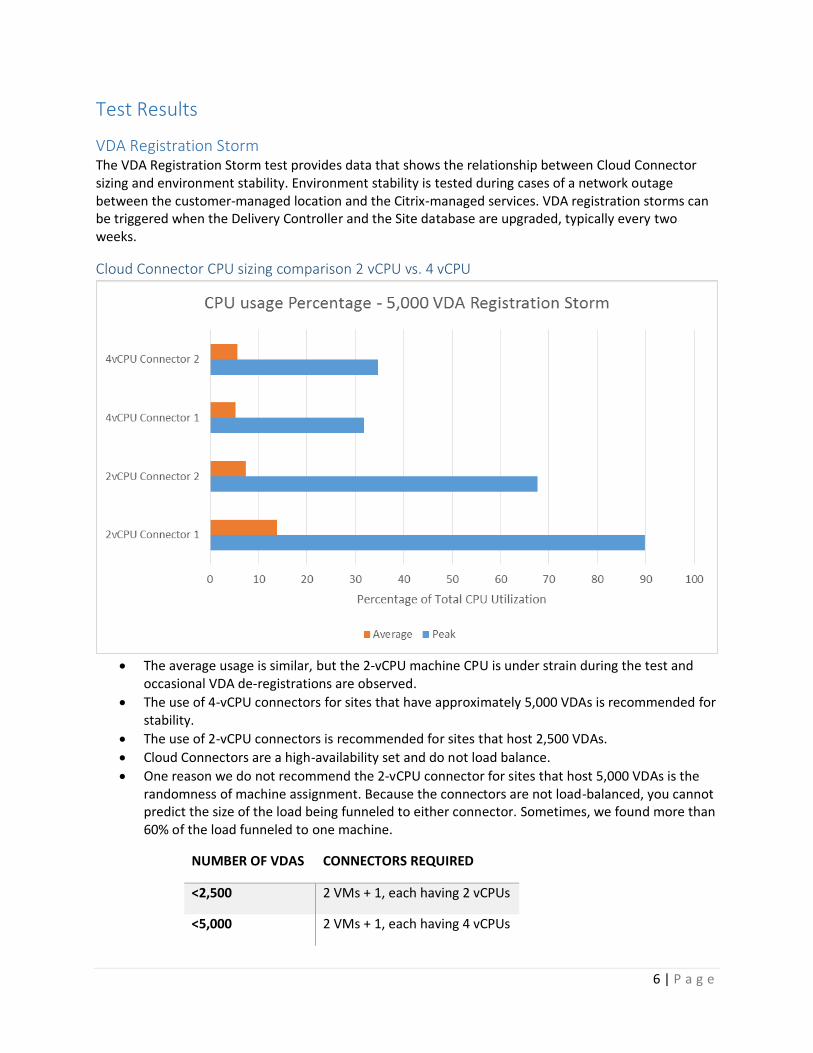
VDA Registration Storm The VDA Registration Storm test provides data that shows the relationship between Cloud Connector sizing and environment stability. Environment stability is tested during cases of a network outage between the customer-managed location and the Citrix-managed services. VDA registration storms can be triggered when the Delivery Controller and the Site database are upgraded, typically every two weeks.
Cloud Connector CPU sizing comparison 2 vCPU vs. 4 vCPU
• The average usage is similar, but the 2-vCPU machine CPU is under strain during the test and occasional VDA de-registrations are observed.
• The use of 4-vCPU connectors for sites that have approximately 5,000 VDAs is recommended for stability.
• The use of 2-vCPU connectors is recommended for sites that host 2,500 VDAs.
• Cloud Connectors are a high-availability set and do not load balance.
• One reason we do not recommend the 2-vCPU connector for sites that host 5,000 VDAs is the randomness of machine assignment. Because the connectors are not load-balanced, you cannot predict the size of the load being funneled to either connector. Sometimes, we found more than 60% of the load funneled to one machine.
NUMBER OF VDAS CONNECTORS REQUIRED
<2,500 2 VMs + 1, each having 2 vCPUs
<5,000 2 VMs + 1, each having 4 vCPUs
7 | P a g e
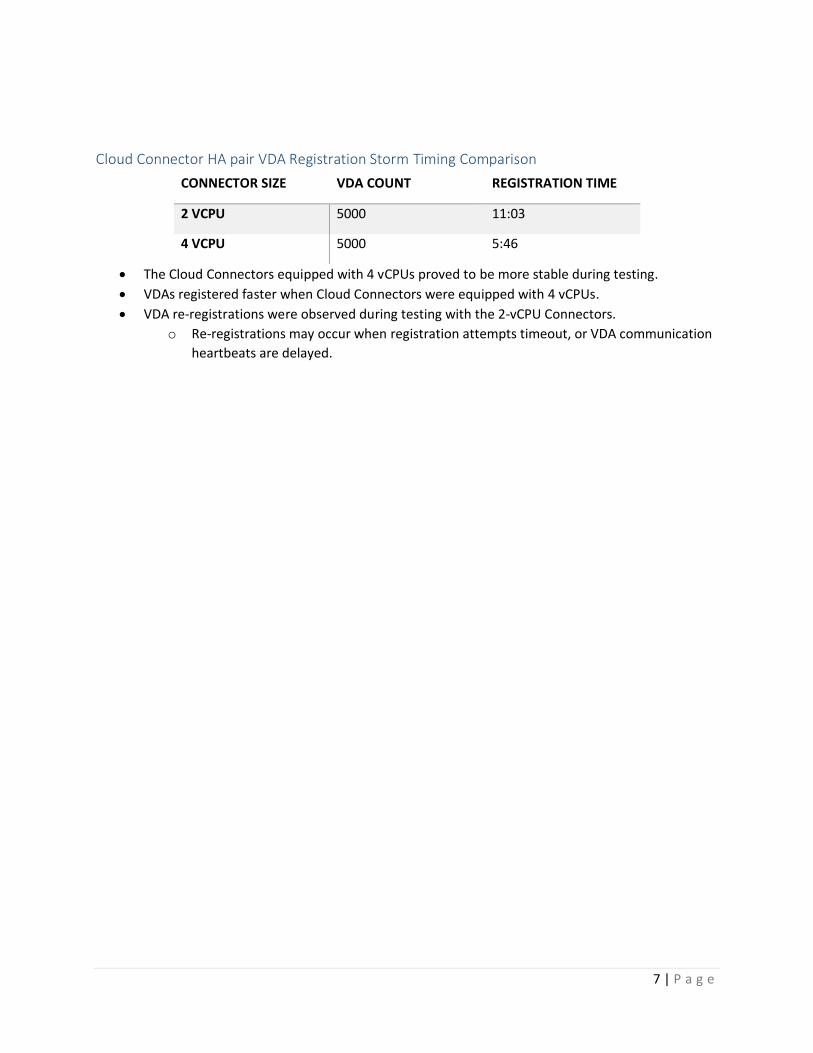
Cloud Connector HA pair VDA Registration Storm Timing Comparison
CONNECTOR SIZE VDA COUNT REGISTRATION TIME
2 VCPU 5000 11:03
4 VCPU 5000 5:46
• The Cloud Connectors equipped with 4 vCPUs proved to be more stable during testing.
• VDAs registered faster when Cloud Connectors were equipped with 4 vCPUs.
• VDA re-registrations were observed during testing with the 2-vCPU Connectors.
o Re-registrations may occur when registration attempts timeout, or VDA communication
heartbeats are delayed.
8 | P a g e
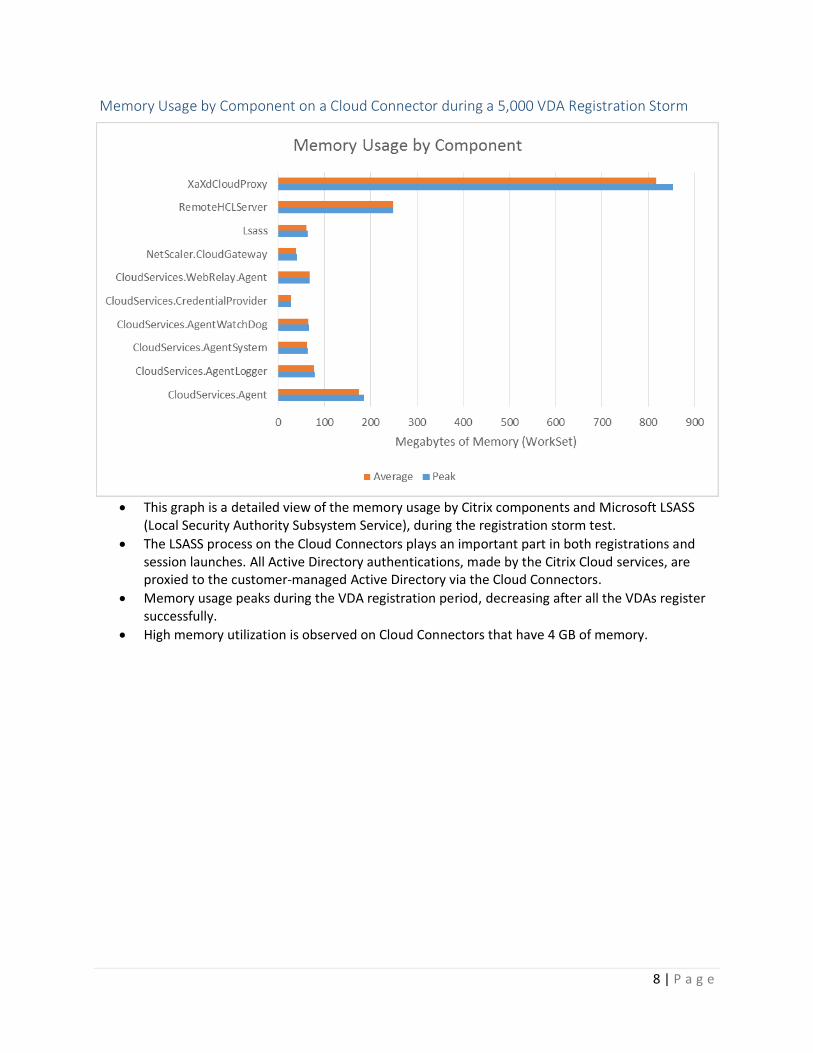
Memory Usage by Component on a Cloud Connector during a 5,000 VDA Registration Storm
• This graph is a detailed view of the memory usage by Citrix components and Microsoft LSASS (Local Security Authority Subsystem Service), during the registration storm test.
• The LSASS process on the Cloud Connectors plays an important part in both registrations and session launches. All Active Directory authentications, made by the Citrix Cloud services, are proxied to the customer-managed Active Directory via the Cloud Connectors.
• Memory usage peaks during the VDA registration period, decreasing after all the VDAs register successfully.
• High memory utilization is observed on Cloud Connectors that have 4 GB of memory.
9 | P a g e
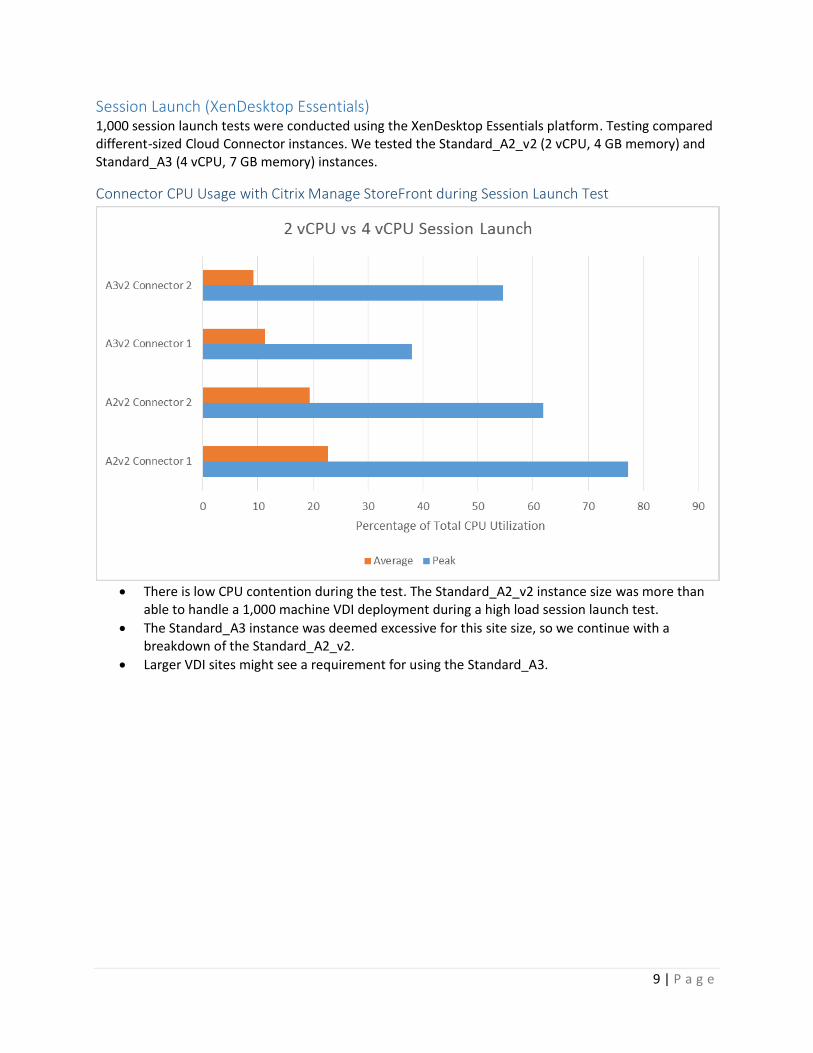
Session Launch (XenDesktop Essentials) 1,000 session launch tests were conducted using the XenDesktop Essentials platform. Testing compared different-sized Cloud Connector instances. We tested the Standard_A2_v2 (2 vCPU, 4 GB memory) and Standard_A3 (4 vCPU, 7 GB memory) instances.
Connector CPU Usage with Citrix Manage StoreFront during Session Launch Test
• There is low CPU contention during the test. The Standard_A2_v2 instance size was more than able to handle a 1,000 machine VDI deployment during a high load session launch test.
• The Standard_A3 instance was deemed excessive for this site size, so we continue with a breakdown of the Standard_A2_v2.
• Larger VDI sites might see a requirement for using the Standard_A3.
10 | P a g e
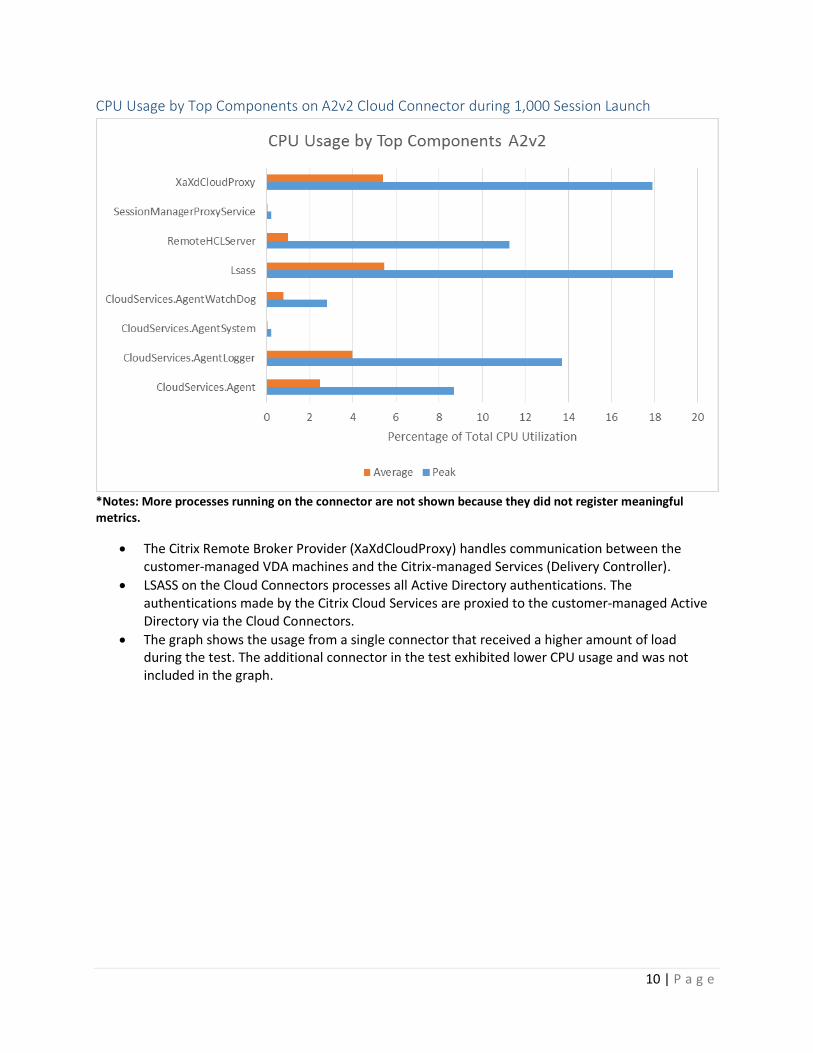
CPU Usage by Top Components on A2v2 Cloud Connector during 1,000 Session Launch
*Notes: More processes running on the connector are not shown because they did not register meaningful metrics.
• The Citrix Remote Broker Provider (XaXdCloudProxy) handles communication between the customer-managed VDA machines and the Citrix-managed Services (Delivery Controller).
• LSASS on the Cloud Connectors processes all Active Directory authentications. The authentications made by the Citrix Cloud Services are proxied to the customer-managed Active Directory via the Cloud Connectors.
• The graph shows the usage from a single connector that received a higher amount of load during the test. The additional connector in the test exhibited lower CPU usage and was not included in the graph.
11 | P a g e
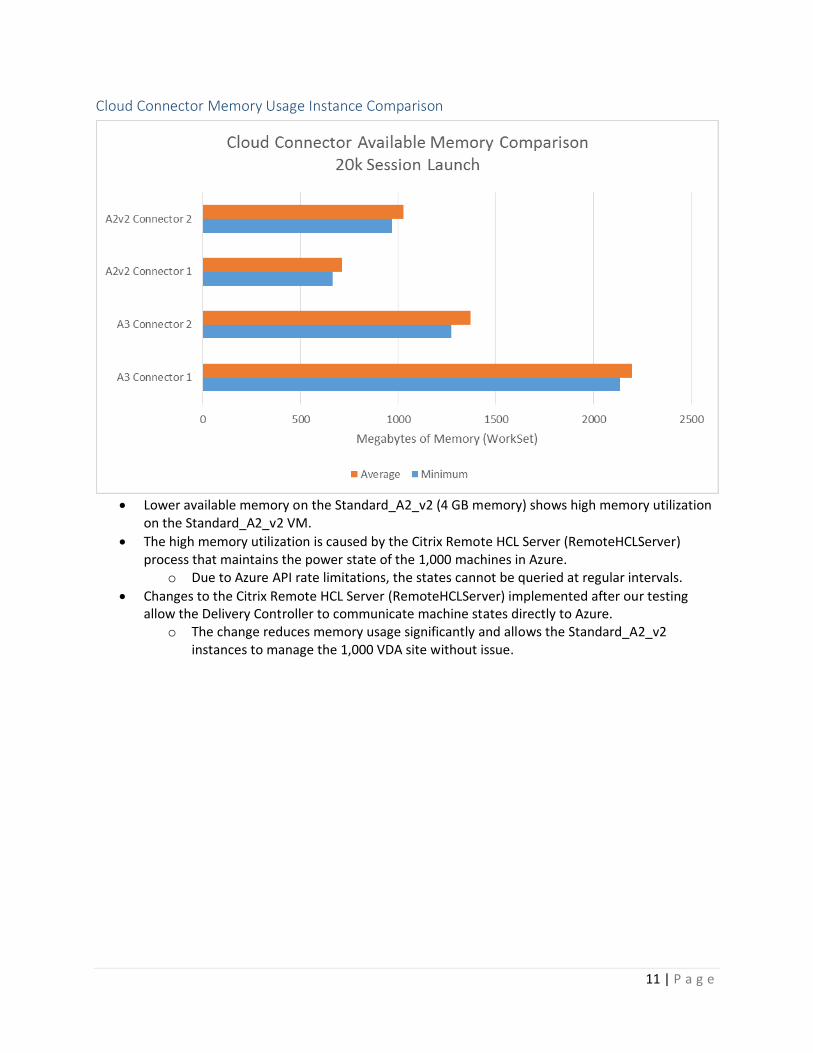
Cloud Connector Memory Usage Instance Comparison
• Lower available memory on the Standard_A2_v2 (4 GB memory) shows high memory utilization on the Standard_A2_v2 VM.
• The high memory utilization is caused by the Citrix Remote HCL Server (RemoteHCLServer) process that maintains the power state of the 1,000 machines in Azure.
o Due to Azure API rate limitations, the states cannot be queried at regular intervals.
• Changes to the Citrix Remote HCL Server (RemoteHCLServer) implemented after our testing allow the Delivery Controller to communicate machine states directly to Azure.
o The change reduces memory usage significantly and allows the Standard_A2_v2 instances to manage the 1,000 VDA site without issue.
12 | P a g e
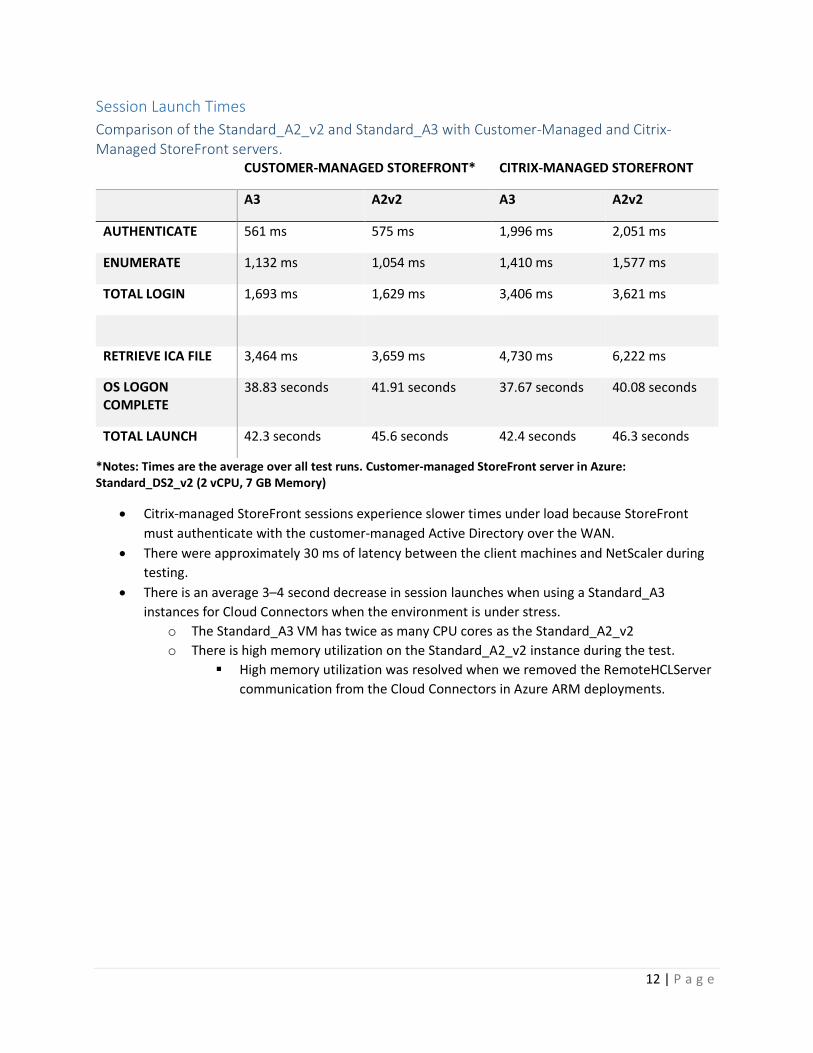
Session Launch Times
Comparison of the Standard_A2_v2 and Standard_A3 with Customer-Managed and Citrix-Managed StoreFront servers.
CUSTOMER-MANAGED STOREFRONT* CITRIX-MANAGED STOREFRONT
A3 A2v2 A3 A2v2
AUTHENTICATE 561 ms 575 ms 1,996 ms 2,051 ms
ENUMERATE 1,132 ms 1,054 ms 1,410 ms 1,577 ms
TOTAL LOGIN 1,693 ms 1,629 ms 3,406 ms 3,621 ms
RETRIEVE ICA FILE 3,464 ms 3,659 ms 4,730 ms 6,222 ms
OS LOGON COMPLETE
38.83 seconds 41.91 seconds 37.67 seconds 40.08 seconds
TOTAL LAUNCH 42.3 seconds 45.6 seconds 42.4 seconds 46.3 seconds
*Notes: Times are the average over all test runs. Customer-managed StoreFront server in Azure: Standard_DS2_v2 (2 vCPU, 7 GB Memory)
• Citrix-managed StoreFront sessions experience slower times under load because StoreFront
must authenticate with the customer-managed Active Directory over the WAN.
• There were approximately 30 ms of latency between the client machines and NetScaler during
testing.
• There is an average 3–4 second decrease in session launches when using a Standard_A3
instances for Cloud Connectors when the environment is under stress.
o The Standard_A3 VM has twice as many CPU cores as the Standard_A2_v2
o There is high memory utilization on the Standard_A2_v2 instance during the test.
▪ High memory utilization was resolved when we removed the RemoteHCLServer
communication from the Cloud Connectors in Azure ARM deployments.
13 | P a g e
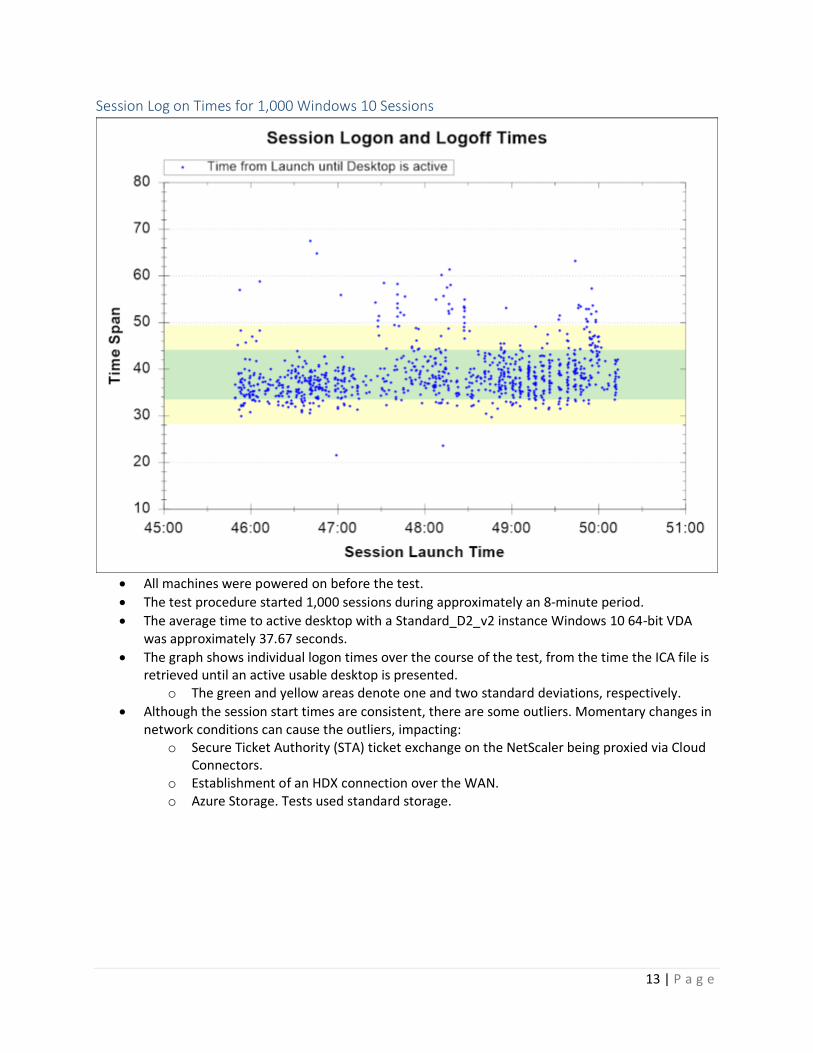
Session Log on Times for 1,000 Windows 10 Sessions
• All machines were powered on before the test.
• The test procedure started 1,000 sessions during approximately an 8-minute period.
• The average time to active desktop with a Standard_D2_v2 instance Windows 10 64-bit VDA was approximately 37.67 seconds.
• The graph shows individual logon times over the course of the test, from the time the ICA file is retrieved until an active usable desktop is presented.
o The green and yellow areas denote one and two standard deviations, respectively.
• Although the session start times are consistent, there are some outliers. Momentary changes in network conditions can cause the outliers, impacting:
o Secure Ticket Authority (STA) ticket exchange on the NetScaler being proxied via Cloud Connectors.
o Establishment of an HDX connection over the WAN. o Azure Storage. Tests used standard storage.
14 | P a g e
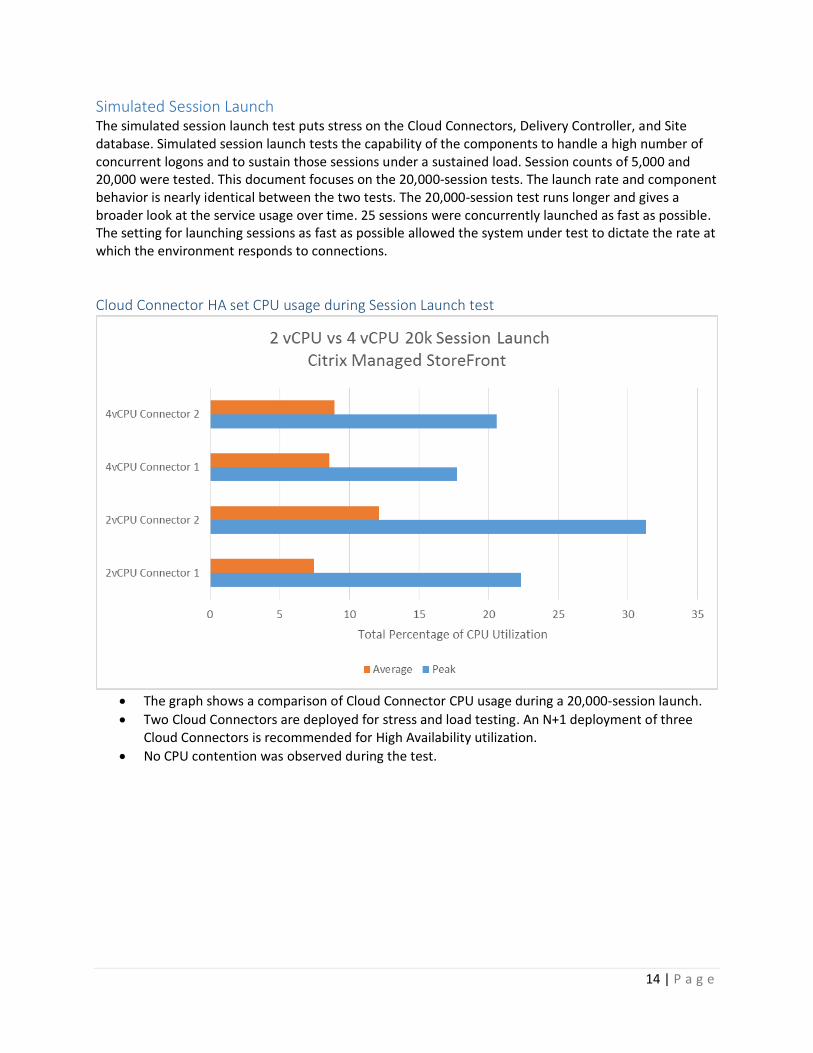
Simulated Session Launch The simulated session launch test puts stress on the Cloud Connectors, Delivery Controller, and Site database. Simulated session launch tests the capability of the components to handle a high number of concurrent logons and to sustain those sessions under a sustained load. Session counts of 5,000 and 20,000 were tested. This document focuses on the 20,000-session tests. The launch rate and component behavior is nearly identical between the two tests. The 20,000-session test runs longer and gives a broader look at the service usage over time. 25 sessions were concurrently launched as fast as possible. The setting for launching sessions as fast as possible allowed the system under test to dictate the rate at which the environment responds to connections.
Cloud Connector HA set CPU usage during Session Launch test
• The graph shows a comparison of Cloud Connector CPU usage during a 20,000-session launch.
• Two Cloud Connectors are deployed for stress and load testing. An N+1 deployment of three Cloud Connectors is recommended for High Availability utilization.
• No CPU contention was observed during the test.
15 | P a g e
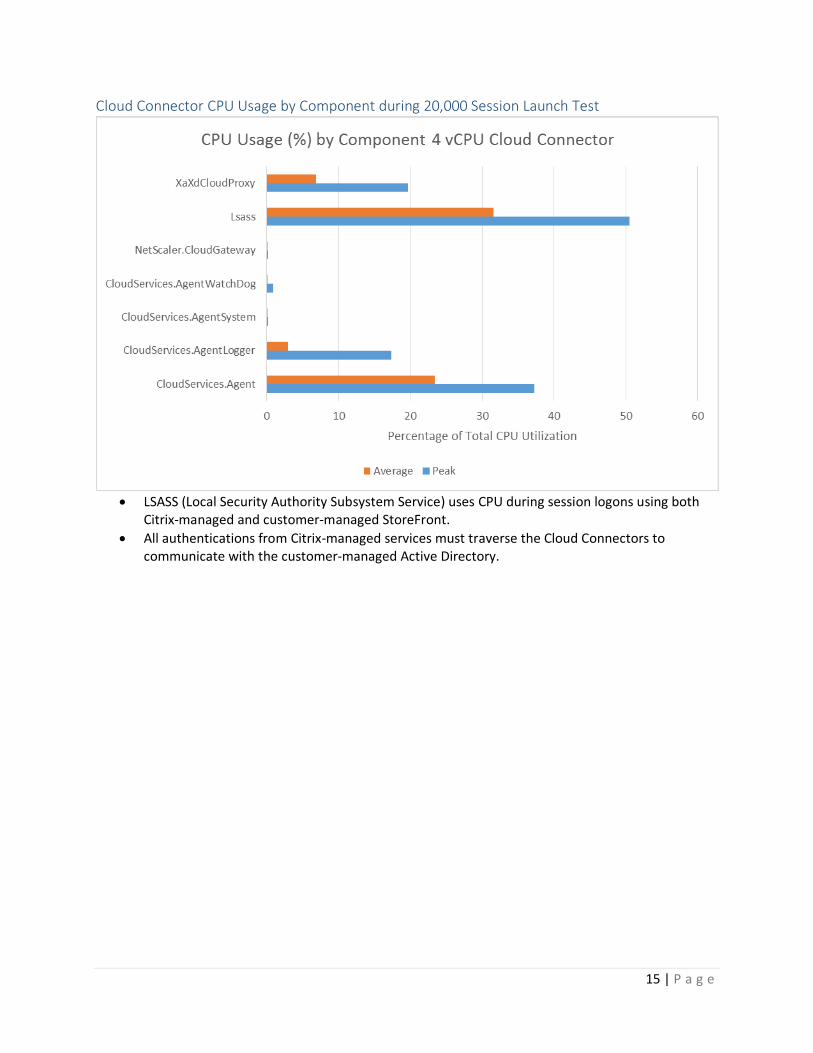
Cloud Connector CPU Usage by Component during 20,000 Session Launch Test
• LSASS (Local Security Authority Subsystem Service) uses CPU during session logons using both Citrix-managed and customer-managed StoreFront.
• All authentications from Citrix-managed services must traverse the Cloud Connectors to communicate with the customer-managed Active Directory.
16 | P a g e
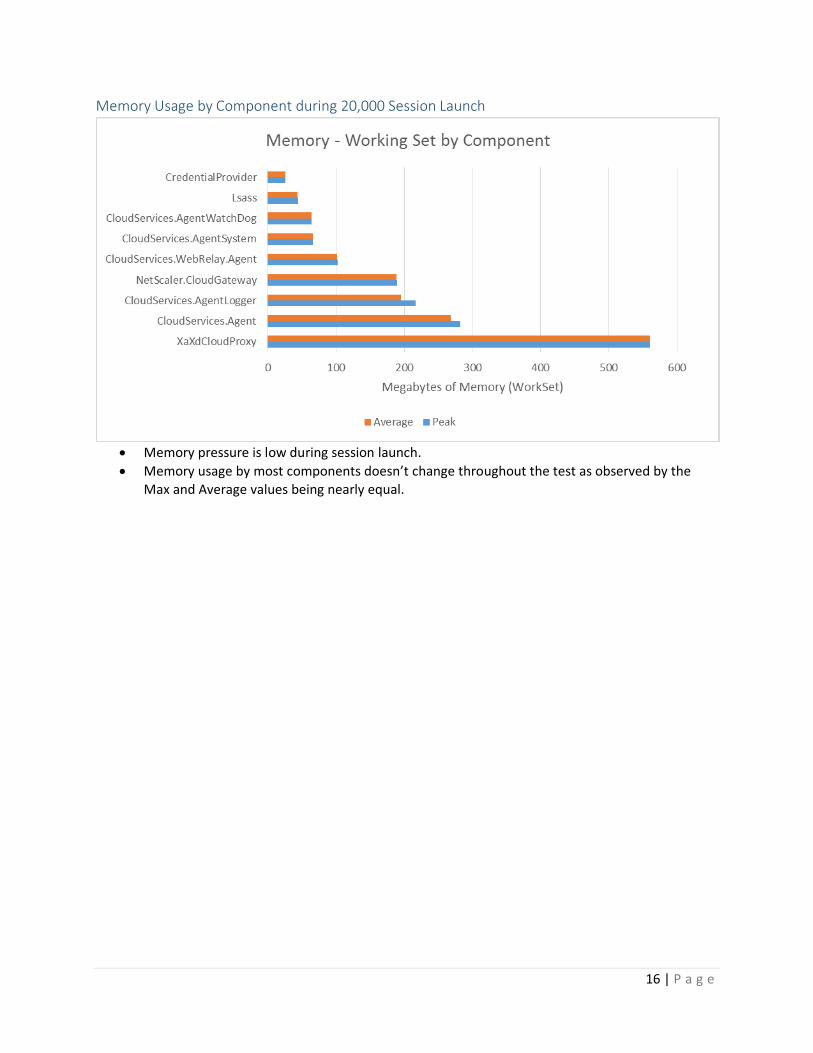
Memory Usage by Component during 20,000 Session Launch
• Memory pressure is low during session launch.
• Memory usage by most components doesn’t change throughout the test as observed by the
Max and Average values being nearly equal.
17 | P a g e
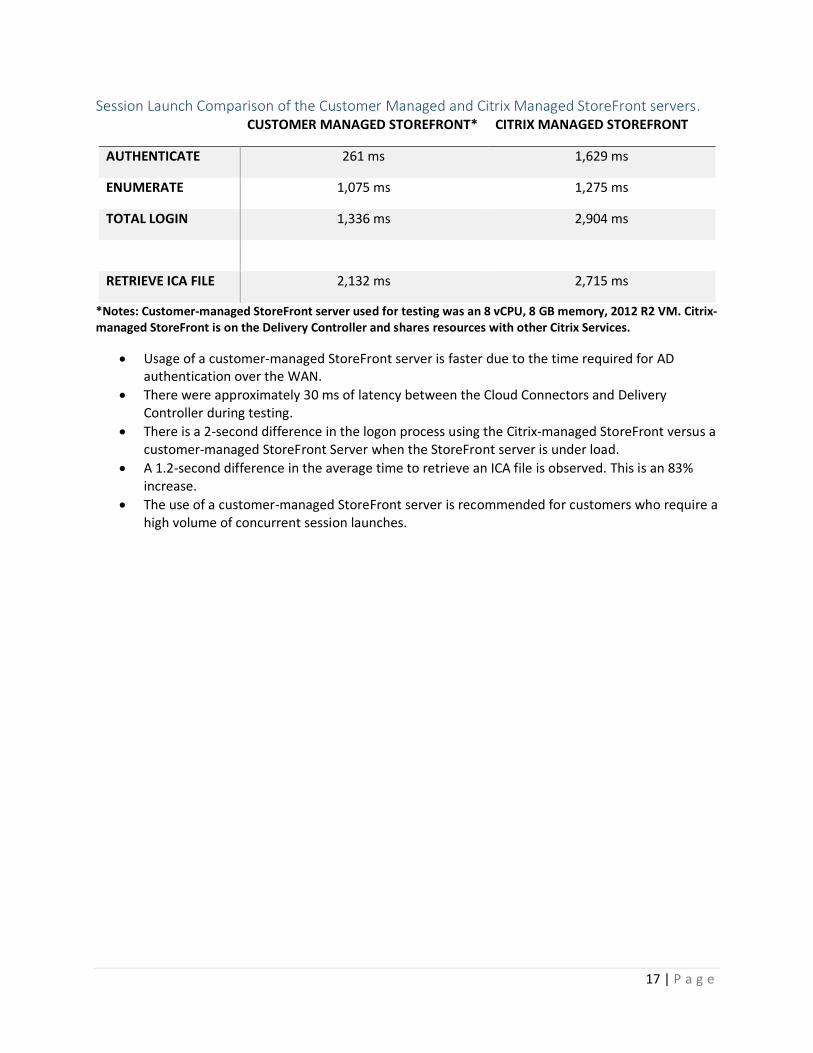
Session Launch Comparison of the Customer Managed and Citrix Managed StoreFront servers. CUSTOMER MANAGED STOREFRONT* CITRIX MANAGED STOREFRONT
AUTHENTICATE 261 ms 1,629 ms
ENUMERATE 1,075 ms 1,275 ms
TOTAL LOGIN 1,336 ms 2,904 ms
RETRIEVE ICA FILE 2,132 ms 2,715 ms
*Notes: Customer-managed StoreFront server used for testing was an 8 vCPU, 8 GB memory, 2012 R2 VM. Citrix-managed StoreFront is on the Delivery Controller and shares resources with other Citrix Services.
• Usage of a customer-managed StoreFront server is faster due to the time required for AD authentication over the WAN.
• There were approximately 30 ms of latency between the Cloud Connectors and Delivery Controller during testing.
• There is a 2-second difference in the logon process using the Citrix-managed StoreFront versus a customer-managed StoreFront Server when the StoreFront server is under load.
• A 1.2-second difference in the average time to retrieve an ICA file is observed. This is an 83% increase.
• The use of a customer-managed StoreFront server is recommended for customers who require a high volume of concurrent session launches.
18 | P a g e
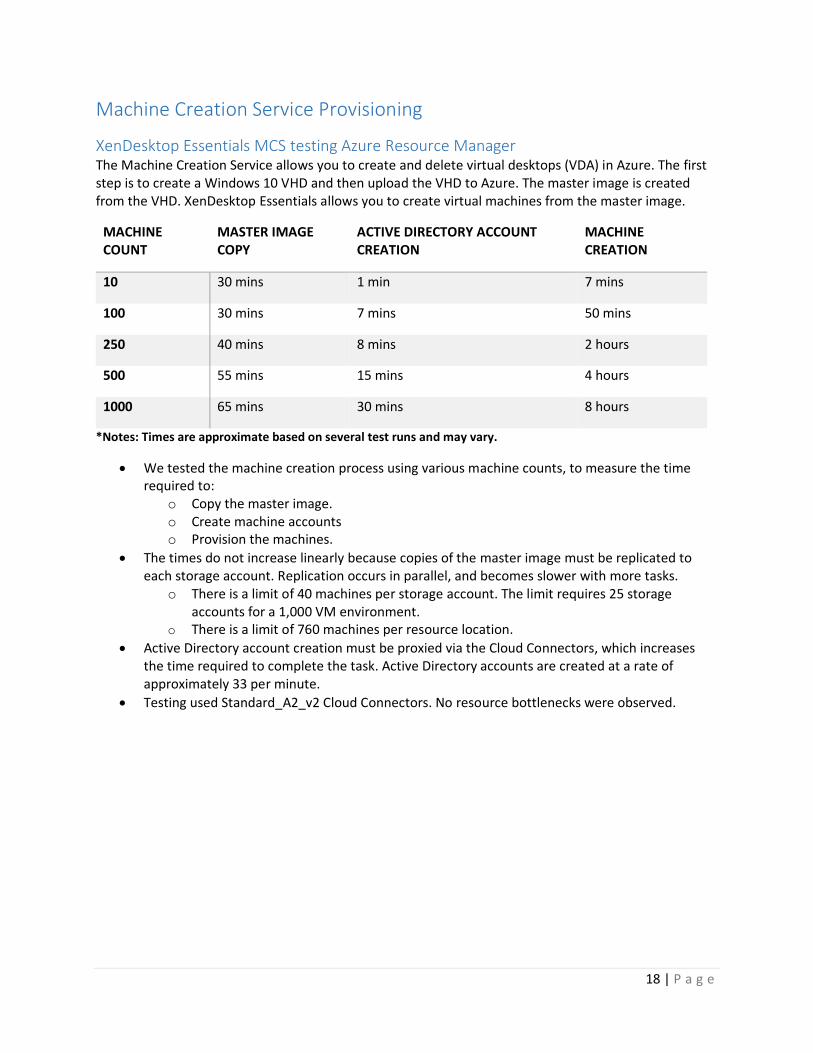
Machine Creation Service Provisioning
XenDesktop Essentials MCS testing Azure Resource Manager The Machine Creation Service allows you to create and delete virtual desktops (VDA) in Azure. The first step is to create a Windows 10 VHD and then upload the VHD to Azure. The master image is created from the VHD. XenDesktop Essentials allows you to create virtual machines from the master image.
MACHINE COUNT
MASTER IMAGE COPY
ACTIVE DIRECTORY ACCOUNT CREATION
MACHINE CREATION
10 30 mins 1 min 7 mins
100 30 mins 7 mins 50 mins
250 40 mins 8 mins 2 hours
500 55 mins 15 mins 4 hours
1000 65 mins 30 mins 8 hours
*Notes: Times are approximate based on several test runs and may vary.
• We tested the machine creation process using various machine counts, to measure the time required to:
o Copy the master image. o Create machine accounts o Provision the machines.
• The times do not increase linearly because copies of the master image must be replicated to each storage account. Replication occurs in parallel, and becomes slower with more tasks.
o There is a limit of 40 machines per storage account. The limit requires 25 storage accounts for a 1,000 VM environment.
o There is a limit of 760 machines per resource location.
• Active Directory account creation must be proxied via the Cloud Connectors, which increases the time required to complete the task. Active Directory accounts are created at a rate of approximately 33 per minute.
• Testing used Standard_A2_v2 Cloud Connectors. No resource bottlenecks were observed.
19 | P a g e
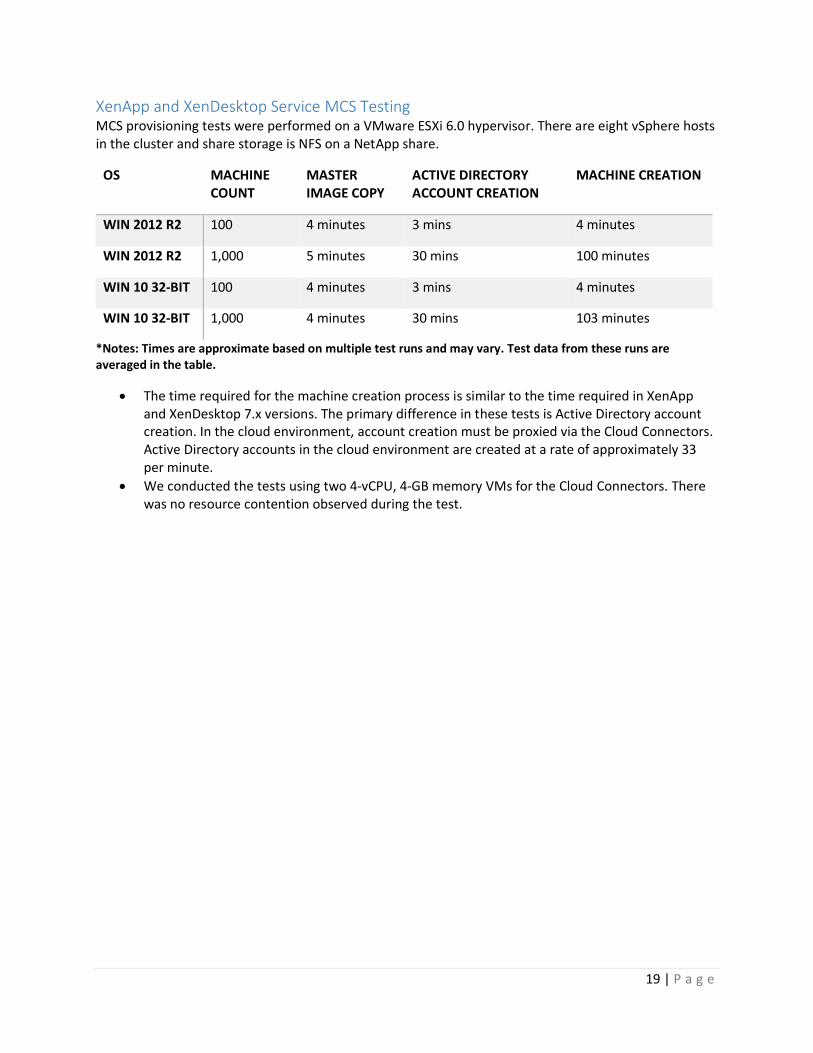
XenApp and XenDesktop Service MCS Testing MCS provisioning tests were performed on a VMware ESXi 6.0 hypervisor. There are eight vSphere hosts in the cluster and share storage is NFS on a NetApp share.
OS MACHINE COUNT
MASTER IMAGE COPY
ACTIVE DIRECTORY ACCOUNT CREATION
MACHINE CREATION
WIN 2012 R2 100 4 minutes 3 mins 4 minutes
WIN 2012 R2 1,000 5 minutes 30 mins 100 minutes
WIN 10 32-BIT 100 4 minutes 3 mins 4 minutes
WIN 10 32-BIT 1,000 4 minutes 30 mins 103 minutes
*Notes: Times are approximate based on multiple test runs and may vary. Test data from these runs are averaged in the table.
• The time required for the machine creation process is similar to the time required in XenApp and XenDesktop 7.x versions. The primary difference in these tests is Active Directory account creation. In the cloud environment, account creation must be proxied via the Cloud Connectors. Active Directory accounts in the cloud environment are created at a rate of approximately 33 per minute.
• We conducted the tests using two 4-vCPU, 4-GB memory VMs for the Cloud Connectors. There was no resource contention observed during the test.