Citigroup Mortgage Loan Trust Asset-Backed Certificates...
50
CMLTI 2006-NC2 Citigroup Global Markets Inc. 1 Term Sheet Date Prepared: September 7, 2006 Citigroup Mortgage Loan Trust Asset-Backed Certificates, Series 2006-NC2 Approximate Total Offered Size: $[155,843,000] Citigroup Global Markets Realty Corp. Seller Wells Fargo Bank N.A. Servicer Citigroup Mortgage Loan Trust, Inc. Depositor Tranche Amount (1) Int. Type / Class (2) Initial Credit Enhancement (4) Ratings (S&P/Moodys/DBRS) WAL (Call/ Mat) (3) Window (Call/ Mat) (3) OFFERED CERTIFICATES A-1 155,843,000 FLT/SR/PT 22.15% AAA Aaa AAA 2 20 2 40 1 - 75 1 - 183 NON-OFFERED CERTIFICATES A-2A 281,879,000 FLT/SR/SEQ 22.15% AAA Aaa AAA A-2B 282,473,000 FLT/SR/SEQ 22.15% AAA Aaa AAA A-2C 18,310,000 FLT/SR/SEQ 22.15% AAA Aaa AAA M-1 39,368,000 Floating / Mezz 18.00% AA+ Aa1 AA (high) M-2 44,111,000 Floating / Mezz 13.35% AA Aa2 AA M-3 14,229,000 Floating / Mezz 11.85% AA- Aa3 AA (low) M-4 16,127,000 Floating / Mezz 10.15% A+ A1 A (high) M-5 16,601,000 Floating / Mezz 8.40% A A2 A M-6 10,909,000 Floating / Mezz 7.25% A- A3 A (low) M-7 9,961,000 Floating / Mezz 6.20% BBB+ A3 A (low) M-8 8,538,000 Floating / Mezz 5.30% BBB Baa1 BBB (high) M-9 11,858,000 Floating / Mezz 4.05% BBB- Baa2 BBB M-10 13,755,000 Floating / Mezz 2.60% BB+ Baa3 BBB (low) M-11 10,909,000 Floating / Mezz 1.45% BB Ba2 BB (high) (1) Certificate sizes are subject to change (+/- 5%) (2) The Class A Certificates will bear interest at variable rates, and their respective margins will increase by 2x following the Optional Termination Date; the Class M Certificates will bear interest at variable rates and their margins will increase by 1.5x following the Optional Termination Date (3) Based on Pricing Prepayment Assumption (4) Includes Overcollateralization Transaction Overview : Sole Manager: Citigroup Global Markets, Inc Expected Pricing Date: [September 11, 2006] Rating Agencies: S&P / Moody’s / DBRS Expected Settlement Date: [September 28, 2006] Trustee: [U.S. Bank, N.A.] Trust Administrator [Citibank N.A.] For Further Information : CONFIDENTIAL AND PROPRIETARY BUSINESS INFORMATION CONFIDENTIAL TREATMENT REQUESTED FM-FCIC-2_00004763
Transcript of Citigroup Mortgage Loan Trust Asset-Backed Certificates...

CMLTI 2006-NC2
Citigroup Global Markets Inc.
1
Term Sheet Date Prepared: September 7, 2006
Citigroup Mortgage Loan Trust Asset-Backed Certificates,
Series 2006-NC2
Approximate Total Offered Size: $[155,843,000]
Citigroup Global Markets Realty Corp. Seller
Wells Fargo Bank N.A. Servicer
Citigroup Mortgage Loan Trust, Inc. Depositor
Tranche
Amount(1)
Int. Type /
Class(2)
Initial Credit
Enhancement(4)
Ratings
(S&P/Moodys/DBRS)
WAL (Call/ Mat)(3)
Window (Call/ Mat)(3)
OFFERED CERTIFICATES A-1 155,843,000 FLT/SR/PT 22.15% AAA Aaa AAA 2 20 2 40 1 - 75 1 - 183
NON-OFFERED CERTIFICATES A-2A 281,879,000 FLT/SR/SEQ 22.15% AAA Aaa AAA
A-2B 282,473,000 FLT/SR/SEQ 22.15% AAA Aaa AAA
A-2C 18,310,000 FLT/SR/SEQ 22.15% AAA Aaa AAA
M-1 39,368,000 Floating / Mezz 18.00% AA+ Aa1 AA (high)
M-2 44,111,000 Floating / Mezz 13.35% AA Aa2 AA
M-3 14,229,000 Floating / Mezz 11.85% AA- Aa3 AA (low)
M-4 16,127,000 Floating / Mezz 10.15% A+ A1 A (high)
M-5 16,601,000 Floating / Mezz 8.40% A A2 A
M-6 10,909,000 Floating / Mezz 7.25% A- A3 A (low)
M-7 9,961,000 Floating / Mezz 6.20% BBB+ A3 A (low)
M-8 8,538,000 Floating / Mezz 5.30% BBB Baa1 BBB (high)
M-9 11,858,000 Floating / Mezz 4.05% BBB- Baa2 BBB
M-10 13,755,000 Floating / Mezz 2.60% BB+ Baa3 BBB (low)
M-11 10,909,000 Floating / Mezz 1.45% BB Ba2 BB (high) (1) Certificate sizes are subject to change (+/- 5%) (2) The Class A Certificates will bear interest at variable rates, and their respective margins will increase by 2x following the Optional
Termination Date; the Class M Certificates will bear interest at variable rates and their margins will increase by 1.5x following the Optional Termination Date
(3) Based on Pricing Prepayment Assumption (4) Includes Overcollateralization Transaction Overview:
Sole Manager: Citigroup Global Markets, Inc Expected Pricing Date: [September 11, 2006] Rating Agencies: S&P / Moody’s / DBRS Expected Settlement Date: [September 28, 2006]
Trustee: [U.S. Bank, N.A.] Trust Administrator [Citibank N.A.] For Further Information:
CONFIDENTIAL AND PROPRIETARY BUSINESS INFORMATION CONFIDENTIAL TREATMENT REQUESTED
FM-FCIC-2_00004763

CMLTI 2006-NC2
Citigroup Global Markets Inc.
2
Mortgage Finance MBS Trading
MBS Structuring
*All numbers are preliminary and subject to change. The issuer has filed a registration statement (including a prospectus) with the SEC for the offering to which this free writing prospectus relates. Before you invest, you should read the prospectus in that registration statement and other documents the issuer has filed with the SEC for more complete information about the issuer and this offering. You may get these documents for free by visiting EDGAR on the SEC Website at www.sec.gov. Alternatively, the issuer, any underwriter or any dealer participating in the offering will arrange to send you the prospectus if you request it by calling 1-877-858-5407. This free writing prospectus is not required to contain all information that is required to be included in the base prospectus and the prospectus supplement. The information in this free writing prospectus is preliminary and is subject to completion or change. The information in this free writing prospectus, if conveyed prior to the time of your commitment to purchase, supersedes information contained in any prior similar free writing prospectus relating to these securities. This free writing prospectus is not an offer to sell or a solicitation of an offer to buy these securities in any state where such offer, solicitation or sale is not permitted. The information in this free writing prospectus may be based on preliminary assumptions about the pool assets and the structure. Any such assumptions are subject to change. The information in this free writing prospectus may reflect parameters, metrics or scenarios specifically requested by you. If so, prior to the time of your commitment to purchase, you should request updated information based on any parameters, metrics or scenarios specifically required by you. This free writing prospectus is being delivered to you solely to provide you with information about the offering of the asset-backed securities referred to in this free writing prospectus and to solicit an indication of your interest in purchasing such securities, when, as and if issued. Any such indication of interest will not constitute a contractual commitment by you to purchase any of the securities. You may withdraw your indication of interest at any time
CONFIDENTIAL AND PROPRIETARY BUSINESS INFORMATION CONFIDENTIAL TREATMENT REQUESTED
FM-FCIC-2_00004764

CMLTI 2006-NC2
Citigroup Global Markets Inc.
3
TRANSACTION SUMMARY
Title of Securities: Citigroup Mortgage Loan Trust, Series 2006-NC2
Offered Certificates: Approximately $[155,843,000] senior floating-rate certificates (the Class A-1 Certificates).
Non-Offered Certificates:
Class A-2A, Class A-2B, Class A-2C, Class M-1, Class M-2, Class M-3, Class M-4, Class M-5, Class M-6, Class M-7, Class M-8, Class M-9, Class M-10, Class M-11, Class CE, Class P, Class R and Class R-X Certificates
Class A Certificates: The Group I and the Group II Certificates
Class M Certificates: Class M-1, Class M-2, Class M-3, Class M-4, Class M-5, Class M-6, Class M-7, Class M-8, Class M-9, Class M-10 and Class M-11 Certificates
Group I Certificates: Class A-1 Certificates which evidence interests in the Group I Mortgage Loans.
Group II Certificates: Class A-2A, Class A-2B and Class A-2C Certificates which evidence interests in the Group II Mortgage Loans.
Seller: Citigroup Global Markets Realty Corp.
Originators: New Century Mortgage Corporation (100.00%)
Interim Servicer: New Century Mortgage Corporation. New Century Mortgage Corporation currently has a Servicer Quality rating of “SQ3+” by Moodys, a rating of “Above Average” by S & P as a Primary Servicer of subprime residential mortgage loans
Servicer: New Century Mortgage Corporation until November 1st 2006, at which point Wells Fargo Bank N.A. will be the Servicer. Wells Fargo Bank N.A. currently has a Servicer Quality rating of “SQ1” by Moodys, a rating of “Strong” by S & P and a rating of “RPS1” by Fitch as a Primary Servicer of subprime residential mortgage loans
Depositor: Citigroup Mortgage Loan Trust, Inc.
Credit Risk Manager: Clayton Fixed Income Services Inc. (formerly known as The Murrayhill Company) will act as the trust’s representative in advising the Servicer regarding certain delinquent and defaulted mortgage loans, and in monitoring and reporting to the trust administrator on the performance of such mortgage loans.
Trust Administrator: Citibank N.A.
Trustee: [U.S. Bank, N.A.]
Cap Provider: Citibank, N.A.
Swap Provider: Citibank, N.A.
Mortgage Loans: 4,507 adjustable-rate and fixed-rate, first and second lien, closed-end, subprime mortgage loans with an aggregate scheduled principal balance as of the Cut-off Date of approximately $948,626,392. For the purpose of calculating interest and principal on the Class A Certificates, the Mortgage Loans have been divided into two loan groups, designated as follows: Group I Mortgage Loans: 1,190 adjustable-rate and fixed-rate Mortgage Loans with an aggregate scheduled principal balance as of the Cut-off Date of approximately $200,183,326 with principal balances at origination that conform to principal balance limits of Fannie Mae. Group II Mortgage Loans: 3,317 adjustable-rate and fixed-rate Mortgage Loans with an aggregate scheduled principal balance as of the Cut-off Date of approximately $748,443,066 with principal balances at origination that may or may not conform to principal balance limits of Fannie Mae.
CONFIDENTIAL AND PROPRIETARY BUSINESS INFORMATION CONFIDENTIAL TREATMENT REQUESTED
FM-FCIC-2_00004765

CMLTI 2006-NC2
Citigroup Global Markets Inc.
4
The characteristics of the pool of Mortgage Loans delivered on the Closing Date are not expected to differ materially from the characteristics of the Mortgage Loans described herein although the range of mortgage rates, maturities and certain other characteristics of the Mortgage Loans set forth in this term-sheet may vary by as much as 5%.
Closing Date: On or about September 28, 2006.
Distribution Dates: 25th of each month, or if such day is not a business day, the next succeeding business day, commencing October 25, 2006
Cut-Off Date: September 1, 2006.
Payment Delay: The Offered Certificates have a 0 day delay.
Day Count: The Offered Certificates are Actual/360.
Administrative Fee Rate:
Sum of the Servicing Fee and Credit Risk Manager Fee equal to 0.515% per annum. For purposes of modeling assumptions the Credit Risk Manager Fee has been assumed as 0.020%, and the total fee has been assumed as 0.520% per annum.
Denomination: $25,000 and multiples of $1 in excess thereof.
Legal Final Maturity: For all classes the legal final maturity is expected to be September 2036.
SMMEA Eligibility: None of the Offered Certificates will be SMMEA eligible.
ERISA Eligibility: The Offered Certificates are not expected to be ERISA eligible.
Tax Status: The Offered Certificates will be treated as REMIC regular interests for federal income tax purposes.
CONFIDENTIAL AND PROPRIETARY BUSINESS INFORMATION CONFIDENTIAL TREATMENT REQUESTED
FM-FCIC-2_00004766

CMLTI 2006-NC2
Citigroup Global Markets Inc.
5
STRUCTURE SUMMARY Structure: Senior/Subordinate/Overcollateralization Structure
Prepayment Assumption:
2-year and shorter Fixed Rate Period Adjustable-Rate Mortgage Loans: 2.0% CPR in month 1, building to 30.0% CPR by month 12; 30.0% CPR for months 13-22; 60.0% CPR for months 23-27; 35.0% CPR for months 28 and thereafter. 3-year and longer Fixed Rate Period Adjustable-Rate Mortgage Loans: 2.0% CPR in month 1, building to 30.0% CPR by month 12; 30.0% CPR for months 13-34; 60.0% CPR for months 35-39; 35.0% CPR for months 40 and thereafter. Fixed-rate Mortgage Loans: 4.0% CPR growing to 23.0% CPR over 12 months and remaining at 23.0% CPR thereafter.
Pass-Through Rate: The monthly Pass-Through Rate for the Class A and Class M Certificates on each Distribution Date is the lesser of: • (1) the Formula Rate • (2) the related Net WAC Cap for that Distribution Date
The Formula Rate for the Class A and Class M Certificates is as follows: • On or prior to the Optional Termination Date: The lesser of (i) 1-Month LIBOR plus a
margin which will be set at pricing for the Class A and Class M Certificates and (ii) the related maximum cap rate.
• After the Optional Termination Date: The lesser of (i)1-Month LIBOR plus 2x the initial margin for the Class A Certificates and 1-Month LIBOR plus 1.5x the initial margin for the Class M Certificates and (ii) the related maximum cap rate.
Principal Payments for Class A
Certificates:
Prior to the Stepdown Date or if a Trigger Event occurs, the Class A Certificates will receive ALL of the principal collected on the related mortgage loans plus any Excess Interest from the mortgage loans required to build to or maintain the Targeted Overcollateralization Amount. On or after the Stepdown Date and assuming no Trigger Event is in effect, principal distributed to the Class A Certificates will be an amount such that the Class A Certificates will have approximately [44.30]% of the current principal balance of the related Mortgage Loans as credit enhancement (which is 2x the initial credit support).
Principal Payments for Class M
Certificates:
The Class M Certificates will NOT receive any principal distributions prior to the Stepdown Date, or if a Trigger Event occurs, unless the aggregate certificate principal balance of the Class A Certificates is reduced to zero. Thereafter (assuming no Trigger Event is in effect), principal will be shared among the Class M Certificates to maintain, in each case, approximately 2x their respective initial credit support.
CONFIDENTIAL AND PROPRIETARY BUSINESS INFORMATION CONFIDENTIAL TREATMENT REQUESTED
FM-FCIC-2_00004767

CMLTI 2006-NC2
Citigroup Global Markets Inc.
6
Maximum Cap Rate: The Maximum Cap Rate for any Distribution Date and (a) the Group I Certificates is a per annum rate (adjusted for the actual number of days in the related Interest Accrual Period) equal to the weighted average of the Maximum Net Mortgage Rates on the then outstanding Group I Mortgage Loans, weighted based on their principal balances as of the first day of the related Due Period
minus the Net Swap Payment or Swap Termination Payment, if any, made to the Swap Provider (only if such Swap Termination Payment is not due to a Swap Provider Trigger Event (as defined in the Swap Agreement)) expressed as a per annum rate of Net Swap Payment or Swap Termination Payment made to the Swap Provider by the Trust divided by the aggregate principal balance of the Mortgage Loans,
plus any amounts expressed as a per annum rate of payments from the Cap Agreement divided by the aggregate principal balance of the Mortage Loans,
plus, any amounts expressed as a per annum rate, equal to the Net Swap Payment made by the Swap Provider and divided by the aggregate principal balance of the Mortgage Loans.
(b) the Group II Certificates is a per annum rate (adjusted for the actual number of days in the related Interest Accrual Period) equal to the weighted average of the Maximum Net Mortgage Rates on the then outstanding Group II Mortgage Loans, weighted based on their principal balances as of the first day of the related Due Period,
minus the Net Swap Payment or Swap Termination Payment, if any, made to the Swap Provider (only if such Swap Termination Payment is not due to a Swap Provider Trigger Event (as defined in the Swap Agreement)) expressed as a per annum rate of Net Swap Payment or Swap Termination Payment made to the Swap Provider by the Trust divided by the aggregate principal balance of the Mortgage Loans,
plus any amounts expressed as a per annum rate of payments from the Cap Agreement divided by the aggregate principal balance of the Mortage Loans,
plus, any amounts expressed as a per annum rate, equal to the Net Swap Payment made by the Swap Provider and divided by the aggregate principal balance of the Mortgage Loans.
(c) the Mezzanine Certificates is a per annum rate equal to the weighted average (weighted in proportion to the results of subtracting from the aggregate principal balance of each loan group the current aggregate Certificate Principal Balance of the related Class A Certificates) of (i) the Maximum Cap Rate for the Group I Certificates and (ii) the Maximum Cap Rate for the Group II Certificates. The Maximum Cap Rate is subject to an adjustment based on the actual number of days that have elapsed in the related Interest Accrual Period.
Group I Principal Remittance Amount:
For any Distribution Date, an amount equal to the aggregate of: (i) the principal portion of all scheduled monthly payments on the Group I Mortgage
Loans actually received or advanced on or prior to the related Determination Date; (ii) the principal portion of all proceeds received in respect of the repurchase of a Group I
Mortgage Loan, or, in the case of a substitution, amounts representing a principal adjustment, as required by the pooling and servicing agreement during the related Prepayment Period; and
(iii) the principal portion of all other unscheduled collections, including insurance proceeds, liquidation proceeds and all full and partial principal prepayments, received during the related Prepayment Period net of reimbursements, including reimbursements to the trustee and the servicer, to the extent applied as recoveries of principal on the Group I Mortgage Loans.
Group II Principal Remittance Amount:
For any Distribution Date, an amount equal to the aggregate of: (i) the principal portion of all scheduled monthly payments on the Group II Mortgage
Loans actually received or advanced on or prior to the related Determination Date;
CONFIDENTIAL AND PROPRIETARY BUSINESS INFORMATION CONFIDENTIAL TREATMENT REQUESTED
FM-FCIC-2_00004768

CMLTI 2006-NC2
Citigroup Global Markets Inc.
7
(ii) the principal portion of all proceeds received in respect of the repurchase of a Group II Mortgage Loan, or, in the case of a substitution, amounts representing a principal adjustment, as required by the pooling and servicing agreement during the related Prepayment Period; and
(iii) the principal portion of all other unscheduled collections, including insurance proceeds, liquidation proceeds and all full and partial principal prepayments, received during the related Prepayment Period net of reimbursements, including reimbursements to the trustee and the servicer, to the extent applied as recoveries of principal on the Group II Mortgage Loans.
Optional Termination: 10% cleanup call based on the Cut-off Date Principal Balance of the mortgage loans. If such call is exercised, the Class A and Class M Certificateholders are entitled, to the extent of funds available, to:
Outstanding principal balance of the Class A and Class M Certificates Current interest accrued on such balance at the related Pass-Through Rate Interest previously earned but not paid (if any) “LIBOR Carryover Amount” (if any)
Net WAC Cap: Group I Certificates: The per annum rate (subject to adjustment based on the actual number of days elapsed in the related Interest Accrual Period) equal to (x) the weighted average of the Net Mortgage Rates of the Group I Mortgage Loans minus (y) the Net Swap Payment or Swap Termination Payment, if any, made to the Swap Provider (only if such Swap Termination Payment is not due to a Swap Provider Trigger Event (as defined in the Swap Agreement)) expressed as a percentage, equal to a fraction, the numerator of which is equal to the Net Swap Payment or Swap Termination Payment made to the Swap Provider by the Trust and the denominator of which is equal to the aggregate principal balance of the Mortgage Loans, multiplied by 12. Group II Certificates: The per annum rate (subject to adjustment based on the actual number of days elapsed in the related Interest Accrual Period) equal to (x) the weighted average of the Net Mortgage Rates of the Group II Mortgage Loans minus (y) the Net Swap Payment or Swap Termination Payment, if any, made to the Swap Provider (only if such Swap Termination Payment is not due to a Swap Provider Trigger Event (as defined in the Swap Agreement)) expressed as a percentage, equal to a fraction, the numerator of which is equal to the Net Swap Payment or Swap Termination Payment made to the Swap Provider by the Trust and the denominator of which is equal to the aggregate principal balance of the Mortgage Loans, multiplied by 12. Class M Certificates: The per annum rate (subject to adjustment based on the actual number of days elapsed in the related Interest Accrual Period) equal to the weighted average (weighted in proportion to the results of subtracting from the aggregate principal balance of each loan group, the current certificate principal balance of the related Class A Certificates), of (i) the Net WAC Cap for the Group I Certificates and (ii) the Net WAC Cap for the Group II Certificates.
Net Mortgage Rate: For each Mortgage Loan the applicable Mortgage Rate less the Administrative Fee Rate.
LIBOR Carryover Amount:
The excess, if any, of (i) the amount of interest the Class A and Class M Certificates would have accrued for such Distribution Date based on its respective Formula Rate, over (ii) the amount of interest the Certificates accrued for such Distribution Date based on the related Net WAC Cap, plus the unpaid portion of any such excess from prior Distribution Dates plus interest accrued thereon at the respective Formula Rate.
Interest Carry Forward Amount:
As of any Distribution Date, the sum of: (x) the excess, if any, of the Accrued Certificate Interest and any Interest Carry Forward Amount
for the prior Distribution Date, over the amount in respect of interest actually distributed on each class on such prior Distribution Date and
(y) interest on such excess at the applicable Pass-Through Rate on the basis of the actual number of days elapsed since the prior Distribution Date.
CONFIDENTIAL AND PROPRIETARY BUSINESS INFORMATION CONFIDENTIAL TREATMENT REQUESTED
FM-FCIC-2_00004769

CMLTI 2006-NC2
Citigroup Global Markets Inc.
8
Excess Interest: Excess Interest, to the extent it is not used for other required purposes, including to absorb realized losses on the Mortgage Loans, to cover certain interest shortfalls on the Certificates, to reimburse previously allocated losses, or to fund any Overcollateralization Deficiency, will be available to make distributions of the LIBOR Carryover Amount to the Certificates in an amount equal to any reductions in the amount of interest distributable to such holders caused by application of the related Net WAC Cap.
Senior Enhancement Percentage:
For any Distribution Date, the percentage obtained by dividing (x) the sum of:
(i) the aggregate Certificate Principal Balance of the Class M Certificates, and (ii) the overcollateralization amount, in each case before taking into account the distribution of
the Principal Distribution Amount on such Distribution Date by (y) the aggregate principal balance of the Mortgage Loans as of the last day of the related Due Period.
Available Funds: For any Distribution Date, the sum, net of amounts reimbursable therefrom to the Servicer, the Trustee, the Credit Risk Manager or the Swap Provider of: (i) the aggregate amount of scheduled monthly payments on the Mortgage Loans due during the related Due Period and received on or prior to the related Determination Date; (ii) unscheduled payments in respect of the Mortgage Loans (including prepayments, insurance proceeds, liquidation proceeds, subsequent recoveries and proceeds from repurchases of and substitutions for the Mortgage Loans, occurring during the related Prepayment Period or proceeds from the repurchase of the Mortgage Loans due to the Optional Termination of the Trust); (iii) all Servicer Advances with respect to the Mortgage Loans received for such Distribution Date; and (iv) all compensating interest paid by the Servicer in respect of prepayment interest shortfalls for the related period.
Principal Distribution Amount:
For each loan group on any Distribution Date, the lesser of (i) the outstanding certificate principal balance of the Class A and Class M Certificates and (ii) the related Principal Remittance Amount minus any related Overcollateralization Release Amount.
Group I Principal Distribution Amount:
With respect to any Distribution Date prior to the Stepdown Date or on which a Trigger Event is in effect, 100% of the principal received on the Group I Mortgage Loans. With respect to any Distribution Date on or after the Stepdown Date on which a Trigger Event is not in effect, an amount, not less than zero, equal to the excess of (i) the outstanding certificate principal balance of the Group I Certificates over (ii) the lesser of (a) approximately [55.70]% of the outstanding principal balance of the Group I Mortgage Loans on the last day of the related Due Period and (b) the outstanding principal balance of the Group I Mortgage Loans as of the last day of the related Due Period minus 0.50% of the aggregate principal balance of the Group I Mortgage Loans as of the cut-off date.
Group II Principal Distribution Amount:
With respect to any Distribution Date prior to the Stepdown Date or on which a Trigger Event is in effect, 100% of the principal received on the Group II Mortgage Loans. With respect to any Distribution Date on or after the Stepdown Date on which a Trigger Event is not in effect, an amount, not less than zero, equal to the excess of (i) the outstanding certificate principal balance of the Group II Certificates over (ii) the lesser of (a) approximately [55.70]% of the outstanding principal balance of the Group II Mortgage Loans on the last day of the related Due Period and (b) the outstanding principal balance of the Group II Mortgage Loans as of the last day of the related Due Period minus 0.50% of the aggregate principal balance of the Group II Mortgage Loans as of the cut-off date. All distributions of principal to the Group II Certificates on any Distribution Date will be distributed sequentially, first to the Class A-2A Certificates, second to the Class A-2B Certificates and third to the Class A-2C Certificates, in each case until the Certificate Principal Balance of each such class of Certificates has been reduced to zero. Notwithstanding the foregoing, on any Distribution Date on or after which the aggregate
CONFIDENTIAL AND PROPRIETARY BUSINESS INFORMATION CONFIDENTIAL TREATMENT REQUESTED
FM-FCIC-2_00004770

CMLTI 2006-NC2
Citigroup Global Markets Inc.
9
Certificate Principal Balance of the Class M and Class CE Certificates has been reduced to zero, principal will be allocated to Group II Certificates on a pro-rata basis based on the Certificate Principal Balance of each such class.
Class M Principal Distribution Amount:
For each Class M Certificate with respect to any Distribution Date on or after the Stepdown Date on which a Trigger Event is not in effect, the excess of (i) the sum of (a) the aggregate outstanding Certificate Principal Balance of all more senior Certificates after distribution of all more senior Principal Distribution Amounts on the related Distribution Date and (b) the outstanding Certificate Principal Balance of the respective Class M Certificates over (ii) the lesser of (a) approximately 100% minus 2X the respective Class M Certificates initial credit support percentage of the outstanding principal balance of the Mortgage Loans on the last day of the related Due Period and (b) the outstanding principal balance of the Mortgage Loans as of the last day of the related Due Period minus 0.50% of the aggregate Principal Balance of the Mortgage Loans as of the Cut-off date.
Cap Agreement: On the Closing Date, the Trust Administrator (in its capacity as Cap Trustee for the Cap Trust) will enter into a Cap Agreement with the Cap Provider for the benefit of the Group I Certificates, Group II Certificates and Class M Certificates. The Cap Provider will be obligated to make monthly payments to the Cap Trustee (based on a notional amount) when one-month LIBOR exceeds the strike rate for the related period. The schedule containing the notional amounts are in the tables on pages 16.
Swap Agreement: On the Closing Date, the Trust Administrator (in its capacity as Supplemental Interest Trust Trustee for the Supplemental Interest Trust) will enter into a Swap Agreement with the Swap Provider. Under the Swap Agreement, on each Distribution Date (i) the trust shall be obligated to pay to the Swap Provider an amount equal to [5.15]% per annum on a notional amount equal to the related swap notional amount set forth in the schedule below and (ii) the trust will be entitled to receive from the Swap Provider an amount equal to One-Month LIBOR on the notional balance in each case as accrued during the related swap accrual period, until the swap is retired. Only the net amount of the two obligations above will be paid by the appropriate party. Upon early termination of the Swap Agreement, the trust or the Swap Provider may be liable to make a termination payment (the “Swap Termination Payment”) to the other party, regardless of which party caused the termination. The Swap Termination Payment will be computed in accordance with the procedures set forth in the Swap Agreement. The schedule containing the notional amounts are in the tables on pages 17.
Payment Priority: On each Distribution Date, Available Funds from the Mortgage Loans will be distributed as follows:
1. First, to pay any Net Swap Payment or the Swap Termination Payment (not caused by a Swap Provider Trigger Event (as defined in the Swap Agreement)) owed to the Swap Provider.
2. From the Interest Remittance Amount for each group, to pay interest on the related Class A Certificates on a pro-rata basis based on the entitlement of such class, including any accrued unpaid interest from a prior Distribution Date, (first from the related loan group, then from the other loan group if necessary), and then, excluding any accrued unpaid interest from prior Distribution Dates, to pay interest to the Class M Certificates, sequentially.
3. Prior to the Stepdown Date or if a Trigger Event is in effect an amount upto the Principal Ditribution Amount will be distributed as follows: a) To pay the Group I Principal Distribution Amount to the Group I Certificates and to pay
the Group II Principal Distribution Amount to the Group II Certificates, until the aggregate Certificate Principal Balance of the Class A Certificatse in each such group has been reduced to zero. Principal distributed to the Group II Certificates will be distributed sequentially to the Class A-2A, A-2B and A-2C Certificates, in that order, until the Certificate Principal Balances thereof have been reduced to zero (except as otherwise specified under “Group II Principal Distribution Amount”). Any remaining Principal Distribution Amounts will be allocated to the Class A Certificates outstanding in the
CONFIDENTIAL AND PROPRIETARY BUSINESS INFORMATION CONFIDENTIAL TREATMENT REQUESTED
FM-FCIC-2_00004771
CMLTI 2006-NC2
Citigroup Global Markets Inc.
10
unrelated group. b) To pay any remaining Principal Distribution Amount to the Class M Certificates
sequentially until each such class has been reduced to zero. 4. On or after the Stepdown Date and if a Trigger Event is not in effect an amount upto the
Principal Ditribution Amount will be distributed as follows: a) To pay the Group I and Group II Principal Distribution Amounts to the Group I and
Group II Certificates, respectively until the aggregate Certificate Principal Balance of the Class A Certificates in each such group has been reduced to zero. Principal distributed to the Group II Certificates will be distributed sequentially to the Class A-2A, A-2B and A-2C Certificates, in that order, until the Certificate Principal Balances thereof have been reduced to zero (except as otherwise specified under Group II Principal Distribution Amount). Any remaining Principal Distribution Amounts will be allocated to the Class A Certificates outstanding in the unrelated group as necessary.
b) To pay the respective Class M Principal Distribution Amount, sequentially to the Class M Certificates until each such class is reduced to zero.
5. From Excess Interest, if any, to the Certificates then entitled to receive distributions in respect of principal in order to reduce the Certificate Principal Balance of the Certificates to the extent necessary to maintain the required level of credit support in the following order of priority:
• Class A Certificates • Class M Certificates, sequentially
6. From Excess Interest, if any, to pay the Interest Carry Forward Amounts on the Class M Certificates, sequentially. 7. From Excess Interest, if any, to pay allocated Realized Loss Amounts on the Class M Certificates, sequentially. 8. From Excess Interest, if any, to pay any LIBOR Carryover Amounts in the following order of priority, in each case to the extent of amounts remaining in the reserve account:
(i) to the Class A Certificates, on a pro rata basis based first on outstanding certificate principal balance and second on such remaining undistributed LIBOR Carryover Amounts,
(ii) sequentially to the Class M Certificates any such remaining undistributed LIBOR Carryover Amounts for each class
9. To pay certain swap termination payments (caused by a Swap Provider Trigger Event) to the Swap Provider. 10. To pay the funds from the Supplemental Interest Trust pursuant to the priorities set forth under Supplemental Interest Trust below. 11. To the holders of the Class CE Certificates as provided in the Pooling and Servicing Agreement. 12. To the holders of the Class R Certificates, any remaining amounts
Cap Priority: Any amounts received under the Cap Agreement will be distributed by the Trust Administrator as follows: 1. To cover interest carry forward amounts on the Class A Certificates. 2. To make distributions as set forth in clauses (5) through (8) above to the extent remaining undistributed. 3. Any remaining amounts to the Class CE Certificates.
Supplemental Interest Trust:
Funds in the Supplemental Interest Trust will be distributed on each Distribution Date in the following order of priority: 1. to the Swap Provider, any net swap payments and certain swap termination payments (other
than a defaulted swap termination payment) owed to the Swap Provider for such Distribution Date
2. To cover interest carry forward amounts on the Class A Certificates.
CONFIDENTIAL AND PROPRIETARY BUSINESS INFORMATION CONFIDENTIAL TREATMENT REQUESTED
FM-FCIC-2_00004772

CMLTI 2006-NC2
Citigroup Global Markets Inc.
11
3. To make distributions as set forth in clauses (5) through (8) above to the extent remaining undistributed.
4. Any remaining amounts to the Class CE Certificates.
CONFIDENTIAL AND PROPRIETARY BUSINESS INFORMATION CONFIDENTIAL TREATMENT REQUESTED
FM-FCIC-2_00004773

CMLTI 2006-NC2
Citigroup Global Markets Inc.
12
CREDIT ENHANCEMENT SUMMARY
Stepdown Date: The earlier to occur of: (i) the Distribution Date on which the aggregate Certificate Principal Balance of the Class A Certificates is zero, and (ii) the later to occur of:
(x) the Distribution Date in October 2009 and (y) the first Distribution Date on which the Senior Enhancement Percentage is greater than or
equal to twice its initial amount
Trigger Event: On a Distribution Date, a Trigger Event will be in effect if: (i) the aggregate amount of Realized Losses incurred since the Cut-off Date through the last
day of the related Due Period divided by the aggregate principal balance of the Mortgage Loans as of the Cut-off Date exceeds the applicable percentages set forth below with respect to such Distribution Date.
Distribution Date Percentage October 2008 through September 2009 [1.30]% October 2009 through September 2010 [2.90]% October 2010 through September 2011 [4.60]% October 2011 through September 2012 [5.90]% October 2012 and thereafter [6.65]%
(ii) If the aggregate principal balance of 60+ Day Delinquent Loans equals or exceeds [36.12]
% of the Senior Enhancement Percentage.
60+ Day Delinquent Loan:
The percentage obtained by dividing (x) the aggregate Stated Principal Balance of (i) Mortgage Loans Delinquent 60 days or more (including Mortgage Loans in bankruptcy and Delinquent 60 days or more), (ii) REO Properties and (iii) Mortgage Loans in foreclosure by (y) the aggregate Stated Principal Balance of the Mortgage Loans, in each case, calculated prior to taking into account payments of principal on the Mortgage Loans due on the related Due Date or received during the related Prepayment Period.
Credit Enhancement: Credit Enhancement will be provided by: Excess Interest Overcollateralization Subordination In addition, the certificates will have the benefit of the Cap Agreement and the Swap
Agreement Class Initial Credit Support*/** Target Credit Support** A 22.15% 44.30% M-1 18.00% 36.00% M-2 13.35% 26.70% M-3 11.85% 23.70% M-4 10.15% 20.30% M-5 8.40% 16.80% M-6 7.25% 14.50% M-7 6.20% 12.40% M-8 5.30% 10.60% M-9 4.05% 8.10%
CONFIDENTIAL AND PROPRIETARY BUSINESS INFORMATION CONFIDENTIAL TREATMENT REQUESTED
FM-FCIC-2_00004774

CMLTI 2006-NC2
Citigroup Global Markets Inc.
13
M-10 2.60% 5.20% M-11 1.45% 2.90% * Includes Overcollateralization **Approximate
Overcollateralization Amount:
For any Distribution Date the excess, if any, of (a) the sum of the aggregate principal balance of the Mortgage Loans as of the last day of the related Due Period (after giving effect to scheduled payments received or advanced on or before the related Determination Date and principal prepayments received during the related Prepayment Period) over (b) the sum of the aggregate Certificate Principal Balance of the Class A , Class M and Class P Certificates, after giving effect to distributions to be made on such Distribution Date.
Overcollateralization Deficiency:
As of any Distribution Date, the excess, if any, of: (x) the Targeted Overcollateralization Amount for such Distribution Date over (y) the Overcollateralization Amount for such Distribution Date, calculated for this purpose after
taking into account the reduction on such Distribution Date of the Certificate Principal Balances of all classes of Certificates from distributions of the Principal Remittance Amount, but prior to taking into account any Allocated Realized Loss Amounts on such Distribution Date.
Overcollateralization Release Amount:
As of any Distribution Date, the lesser of (a) the aggregate Principal Remittance Amount and (b) the excess, if any, of: (x) the Overcollateralization Amount for such Distribution Date, calculated for this purpose after
taking into account the reduction on such Distribution Date of the Certificate Principal Balances of all classes of Certificates from distributions of the Principal Remittance Amount, but prior to taking into account any Applied Realized Loss Amounts on such Distribution Date, over (y) the Targeted Overcollateralization Amount for such Distribution Date.
Targeted Overcollateralization
Amount:
As of any Distribution Date, the Targeted Overcollateralization Amount (a) prior to the Stepdown Date, is an amount equal to approximately [1.45]% of the Principal Balance of the Mortgage Loans as of the Cut-off date; (b) on or after the Stepdown Date provided a Trigger Event is not in effect, the greater of (i) approximately [2.90]% of the then current aggregate outstanding Principal Balance of the Mortgage Loans as of the last day of the related due period and (ii) 0.50% of the principal balance of the Mortgage Loans as of the Cut-off date; and (c) on or after the Stepdown Date and if a Trigger Event is in effect, the Targeted Overcollateralization Amount for the immediately preceding Distribution Date.
Allocation of Losses/ Subordination:
Realized losses on the Mortgage Loans will be applied: First to reduce the Excess Interest, cash from the cap agreement,cash from the swap agreement
and overcollateralization amount Then to the Class M Certificates, reverse sequentially, until each such class has been reduced
to zero In no event will losses be allocated to the Class A certificates
Advances: Subject to certain limitations, the Servicers must advance delinquent payments of principal and interest on the mortgage loans.
Compensating Interest:
The Servicer is obligated to offset any Prepayment Interest Shortfall, on any Distribution Date, with Compensating Interest to the extent of one-half of its Servicing Fee for each Distribution Date.
CONFIDENTIAL AND PROPRIETARY BUSINESS INFORMATION CONFIDENTIAL TREATMENT REQUESTED
FM-FCIC-2_00004775

CMLTI 2006-NC2
Citigroup Global Markets Inc.
14
Net WAC Cap and Effective Maximum Rate for the Group I Certificates
Period NWC(1)
(%)
Effective Max Rate (2,3)
(%) Period NWC(1)
(%)
Effective Max Rate (2,3)
(%) 1 8.84 22.85 39 9.82 20.63 2 7.70 21.66 40 9.50 20.483 7.96 21.88 41 9.54 20.624 7.70 21.60 42 10.52 22.105 7.70 21.56 43 9.59 21.196 8.53 22.35 44 9.90 21.407 7.70 21.48 45 9.57 21.088 7.96 21.70 46 9.88 21.309 7.70 21.39 47 9.56 21.10
10 7.96 21.59 48 9.56 21.3311 7.70 21.24 49 9.87 21.5412 7.70 21.15 50 9.54 21.2013 7.96 21.29 51 9.85 21.4214 7.70 20.92 52 9.52 21.0815 7.96 21.05 53 9.51 21.1016 7.70 20.67 54 10.42 22.0417 7.70 20.53 55 9.49 21.0618 8.23 20.87 56 9.80 21.2819 7.70 20.09 57 9.47 20.9320 7.96 19.96 58 9.78 21.1521 7.71 19.36 59 9.45 20.8322 7.98 19.36 60 9.44 20.7923 7.89 19.22 61 9.75 21.0124 8.76 20.03 62 9.42 11.5425 9.03 20.41 63 9.72 11.9026 8.71 20.12 64 9.40 11.5027 8.99 20.10 65 9.39 11.4728 8.70 19.60 66 10.03 12.2429 8.78 19.36 67 9.37 11.4330 10.12 20.29 68 9.67 11.7931 9.24 19.46 69 9.35 11.3832 9.54 19.50 70 9.65 11.7433 9.22 19.13 71 9.33 11.3434 9.53 19.23 72 9.32 11.3235 9.37 19.18 73 9.61 11.6736 9.53 19.82 74 9.29 11.2737 9.84 19.95 75 9.59 11.6238 9.51 20.06
Assumptions:
(1) Assumes 1mLIBOR and 6mLIBOR stays at 5 35% and 5 41% respectively and the cashflows are run to the 10% Optional Termination at the pricing speed (2) Assumes 1mLIBOR and 6mLIBOR increase instantaneously to 20 00% and the cashflows are run to the 10% Optional Termination at the pricing speed (3) Includes cash from Cap Agreement and net cash from the Swap Agreement
CONFIDENTIAL AND PROPRIETARY BUSINESS INFORMATION CONFIDENTIAL TREATMENT REQUESTED
FM-FCIC-2_00004776

CMLTI 2006-NC2
Citigroup Global Markets Inc.
15
Net WAC Cap and Effective Maximum Rate for the Group II Certificates
Period NWC(1)
(%)
Effective Max Rate (2,3)
(%) Period NWC(1)
(%)
Effective Max Rate (2,3)
(%) 1 8.77 22.78 39 10.12 21.03 2 7.64 21.60 40 9.79 20.913 7.89 21.82 41 9.87 21.154 7.64 21.53 42 10.88 22.645 7.64 21.50 43 9.92 21.686 8.45 22.27 44 10.24 21.917 7.64 21.42 45 9.90 21.598 7.89 21.63 46 10.23 21.859 7.64 21.33 47 9.91 21.68
10 7.89 21.52 48 9.91 21.8811 7.64 21.18 49 10.23 22.1212 7.64 21.09 50 9.90 21.7613 7.89 21.23 51 10.22 22.0014 7.64 20.86 52 9.88 21.6515 7.90 20.99 53 9.87 21.6916 7.64 20.61 54 10.82 22.6717 7.64 20.47 55 9.86 21.6318 8.17 20.81 56 10.18 21.8819 7.64 20.04 57 9.84 21.5120 7.91 19.92 58 10.16 21.7521 7.68 19.33 59 9.83 21.4222 8.01 19.38 60 9.82 21.3823 8.02 19.35 61 10.14 21.6224 8.85 20.12 62 9.80 12.1425 9.12 20.50 63 10.12 12.5326 8.82 20.22 64 9.79 12.1027 9.12 20.23 65 9.78 12.0828 8.88 19.78 66 10.45 12.9029 9.03 19.61 67 9.76 12.0530 10.37 20.53 68 10.08 12.4331 9.46 19.69 69 9.75 12.0132 9.78 19.74 70 10.06 12.3933 9.46 19.38 71 9.73 11.9734 9.79 19.55 72 9.72 11.9535 9.66 19.58 73 10.04 12.3336 9.81 20.17 74 9.71 11.9137 10.13 20.32 75 10.02 12.2938 9.80 20.43
Assumptions:
1) Assumes 1mLIBOR and 6mLIBOR stays at 5 35% and 5 41% respectively and the cashflows are run to the 10% Optional Termination at the pricing speed 2) Assumes 1mLIBOR and 6mLIBOR increase instantaneously to 20 00% and the cashflows are run to the 10% Optional Termination at the pricing speed 3) Includes cash from Cap Agreement and net cash from the Swap Agreement
CONFIDENTIAL AND PROPRIETARY BUSINESS INFORMATION CONFIDENTIAL TREATMENT REQUESTED
FM-FCIC-2_00004777

CMLTI 2006-NC2
Citigroup Global Markets Inc.
16
Net WAC Cap and Effective Maximum Rate for the Class M Certificates
Period NWC(1)
(%)
Effective Max Rate (2,3)
(%) Period NWC(1)
(%)
Effective Max Rate (2,3)
(%) 1 8.78 22.79 39 10.06 20.94 2 7.65 21.61 40 9.73 20.823 7.90 21.83 41 9.80 21.044 7.65 21.54 42 10.80 22.535 7.65 21.51 43 9.85 21.586 8.47 22.29 44 10.17 21.807 7.65 21.43 45 9.84 21.488 7.91 21.65 46 10.16 21.749 7.65 21.34 47 9.83 21.56
10 7.91 21.54 48 9.84 21.7711 7.65 21.19 49 10.16 22.0012 7.65 21.10 50 9.82 21.6513 7.91 21.25 51 10.14 21.8814 7.65 20.87 52 9.80 21.5315 7.91 21.01 53 9.79 21.5616 7.65 20.62 54 10.73 22.5317 7.65 20.48 55 9.78 21.5118 8.18 20.83 56 10.10 21.7419 7.66 20.05 57 9.76 21.3820 7.92 19.93 58 10.08 21.6221 7.69 19.33 59 9.74 21.2922 8.01 19.38 60 9.74 21.2523 7.99 19.33 61 10.05 21.4924 8.83 20.10 62 9.72 12.0125 9.10 20.48 63 10.03 12.3926 8.80 20.20 64 9.70 11.9727 9.09 20.20 65 9.69 11.9528 8.84 19.74 66 10.35 12.7529 8.97 19.56 67 9.68 11.9130 10.31 20.48 68 9.99 12.2931 9.41 19.64 69 9.66 11.8732 9.73 19.69 70 9.97 12.2433 9.41 19.33 71 9.64 11.8334 9.74 19.48 72 9.63 11.8135 9.60 19.50 73 9.94 12.1836 9.75 20.09 74 9.61 11.7737 10.07 20.24 75 9.93 12.1438 9.74 20.35
Assumptions:
(1) Assumes 1mLIBOR and 6mLIBOR stays at 5 35% and 5 41% respectively and the cashflows are run to the 10% Optional Termination at the pricing speed (2) Assumes 1mLIBOR and 6mLIBOR increase instantaneously to 20 00% and the cashflows are run to the 10% Optional Termination at the pricing speed (3) Includes cash from Cap Agreement and net cash from the Swap Agreement
CONFIDENTIAL AND PROPRIETARY BUSINESS INFORMATION CONFIDENTIAL TREATMENT REQUESTED
FM-FCIC-2_00004778

CMLTI 2006-NC2
Citigroup Global Markets Inc.
17
Cap Agreement Schedule, Strike= [5.40]% for all Periods.
Period Notional Balance
($) 1 910,207,000.00 2 902,152,264.47 3 892,806,987.80 4 881,993,749.93 5 869,226,335.58 6 854,180,948.04 7 837,517,175.53 8 819,058,554.69 9 798,426,993.98
10 775,808,553.64 11 750,341,494.18 12 724,136,657.59 13 698,075,329.12 14 672,569,001.96 15 647,571,538.67 16 623,183,608.31 17 599,275,286.85 18 573,948,437.61 19 546,599,632.62 20 514,032,879.73 21 483,476,764.05 22 454,743,766.91 23 427,604,617.66 24 401,648,424.48
25 and Thereafter 0.00
CONFIDENTIAL AND PROPRIETARY BUSINESS INFORMATION CONFIDENTIAL TREATMENT REQUESTED
FM-FCIC-2_00004779

CMLTI 2006-NC2
Citigroup Global Markets Inc.
18
Swap Agreement Schedule, Trust Pays [5.15]% for all Periods and Receives One-Month LIBOR
Period Notional Balance ($) Period Notional Balance ($) 1 0.00 32 249,588,491.02 2 0.00 33 237,857,139.68 3 0.00 34 226,651,676.14 4 0.00 35 215,945,735.77 5 0.00 36 205,717,381.68 6 0.00 37 195,942,234.48 7 0.00 38 195,942,234.48 8 0.00 39 195,942,234.48 9 0.00 40 191,188,907.69
10 0.00 41 184,407,233.64 11 0.00 42 177,868,277.18 12 0.00 43 171,563,336.39 13 0.00 44 165,483,255.46 14 0.00 45 159,619,964.52 15 0.00 46 153,965,689.11 16 0.00 47 148,512,932.03 17 0.00 48 143,254,570.36 18 0.00 49 138,183,722.60 19 0.00 50 133,293,454.82 20 0.00 51 128,577,295.66 21 0.00 52 124,029,007.57 22 0.00 53 119,642,579.34 23 0.00 54 115,412,249.23 24 0.00 55 111,332,471.11 25 376,997,764.20 56 107,397,768.96 26 353,853,535.24 57 103,602,632.72 27 332,194,937.47 58 99,941,949.37 28 311,939,185.08 59 96,409,952.73 29 292,463,179.11 60 93,000,701.69 30 274,742,133.59 61 89,709,316.33 31 261,873,621.03 62 and Thereafter 0.00
CONFIDENTIAL AND PROPRIETARY BUSINESS INFORMATION CONFIDENTIAL TREATMENT REQUESTED
FM-FCIC-2_00004780

CMLTI 2006-NC2
Citigroup Global Markets Inc.
19
Sensitivity Analysis – To Maturity
Percent of Prepay Assumption 50% 100% 150% 200%
A-1 WAL (yrs) 4.81 2.40 1.33 1.08
Principal Window (mos) 1 - 330 1 - 183 1 - 30 1 - 24 Principal Window End (date) Mar-34 Dec-21 Mar-09 Sep-08
A-2A
WAL (yrs) 1.60 1.00 0.75 0.62 Principal Window (mos) 1 - 35 1 - 21 1 - 15 1 - 12
Principal Window End (date) Aug-09 Jun-08 Dec-07 Sep-07
A-2B WAL (yrs) 6.72 3.07 1.77 1.44
Principal Window (mos) 35 - 208 21 - 101 15 - 28 12 - 23 Principal Window End (date) Jan-24 Feb-15 Jan-09 Aug-08
A-2C
WAL (yrs) 21.35 10.78 2.41 1.99 Principal Window (mos) 208 - 324 101 - 176 28 - 30 23 - 24
Principal Window End (date) Sep-33 May-21 Mar-09 Sep-08
M-1 WAL (yrs) 9.45 5.23 5.98 4.28
Principal Window (mos) 49 - 293 47 - 153 30 - 111 24 - 78 Principal Window End (date) Feb-31 Jun-19 Dec-15 Mar-13
M-2
WAL (yrs) 9.42 4.99 4.15 3.07 Principal Window (mos) 49 - 277 43 - 141 41 - 87 32 - 61
Principal Window End (date) Oct-29 Jun-18 Dec-13 Oct-11
M-3 WAL (yrs) 9.38 4.88 3.70 2.80
Principal Window (mos) 49 - 260 42 - 131 39 - 80 30 - 57 Principal Window End (date) May-28 Aug-17 May-13 Jun-11
Assumptions: 1. Prepayments are capped at 85% CPR.
CONFIDENTIAL AND PROPRIETARY BUSINESS INFORMATION CONFIDENTIAL TREATMENT REQUESTED
FM-FCIC-2_00004781
CMLTI 2006-NC2
Citigroup Global Markets Inc.
20
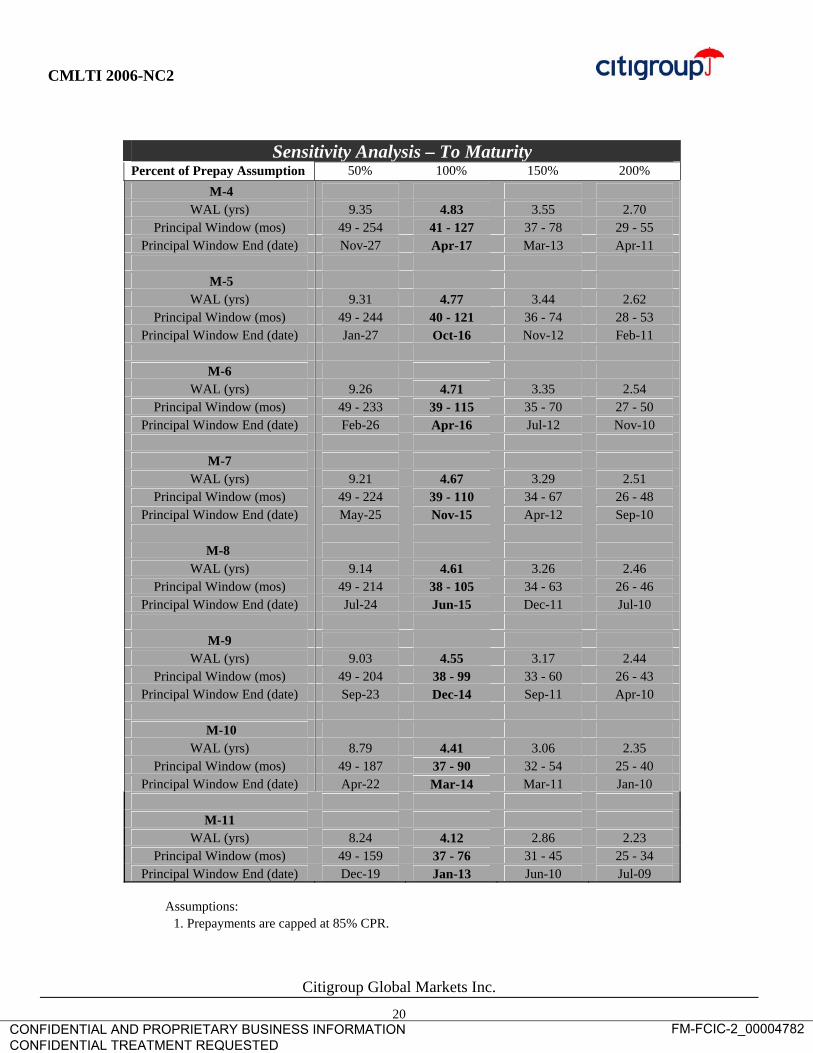
Sensitivity Analysis – To Maturity
Percent of Prepay Assumption 50% 100% 150% 200%
M-4 WAL (yrs) 9.35 4.83 3.55 2.70
Principal Window (mos) 49 - 254 41 - 127 37 - 78 29 - 55 Principal Window End (date) Nov-27 Apr-17 Mar-13 Apr-11
M-5
WAL (yrs) 9.31 4.77 3.44 2.62 Principal Window (mos) 49 - 244 40 - 121 36 - 74 28 - 53
Principal Window End (date) Jan-27 Oct-16 Nov-12 Feb-11
M-6 WAL (yrs) 9.26 4.71 3.35 2.54
Principal Window (mos) 49 - 233 39 - 115 35 - 70 27 - 50 Principal Window End (date) Feb-26 Apr-16 Jul-12 Nov-10
M-7
WAL (yrs) 9.21 4.67 3.29 2.51 Principal Window (mos) 49 - 224 39 - 110 34 - 67 26 - 48
Principal Window End (date) May-25 Nov-15 Apr-12 Sep-10
M-8 WAL (yrs) 9.14 4.61 3.26 2.46
Principal Window (mos) 49 - 214 38 - 105 34 - 63 26 - 46 Principal Window End (date) Jul-24 Jun-15 Dec-11 Jul-10
M-9
WAL (yrs) 9.03 4.55 3.17 2.44 Principal Window (mos) 49 - 204 38 - 99 33 - 60 26 - 43
Principal Window End (date) Sep-23 Dec-14 Sep-11 Apr-10
M-10 WAL (yrs) 8.79 4.41 3.06 2.35
Principal Window (mos) 49 - 187 37 - 90 32 - 54 25 - 40 Principal Window End (date) Apr-22 Mar-14 Mar-11 Jan-10
M-11
WAL (yrs) 8.24 4.12 2.86 2.23 Principal Window (mos) 49 - 159 37 - 76 31 - 45 25 - 34
Principal Window End (date) Dec-19 Jan-13 Jun-10 Jul-09
Assumptions: 1. Prepayments are capped at 85% CPR.
CONFIDENTIAL AND PROPRIETARY BUSINESS INFORMATION CONFIDENTIAL TREATMENT REQUESTED
FM-FCIC-2_00004782

CMLTI 2006-NC2
Citigroup Global Markets Inc.
21
Sensitivity Analysis – To Optional Termination
Percent of Prepay Assumption 50% 100% 150% 200%
A-1 WAL (yrs) 4.44 2.20 1.33 1.08
Principal Window (mos) 1 - 156 1 - 75 1 - 30 1 - 24 Principal Window End (date) Sep-19 Dec-12 Mar-09 Sep-08
A-2A
WAL (yrs) 1.60 1.00 0.75 0.62 Principal Window (mos) 1 - 35 1 - 21 1 - 15 1 - 12
Principal Window End (date) Aug-09 Jun-08 Dec-07 Sep-07
A-2B WAL (yrs) 6.57 3.00 1.77 1.44
Principal Window (mos) 35 - 156 21 - 75 15 - 28 12 - 23 Principal Window End (date) Sep-19 Dec-12 Jan-09 Aug-08
A-2C
WAL (yrs) 12.99 6.24 2.41 1.99 Principal Window (mos) 156 - 156 75 - 75 28 - 30 23 - 24
Principal Window End (date) Sep-19 Dec-12 Mar-09 Sep-08
M-1 WAL (yrs) 8.53 4.74 3.70 2.82
Principal Window (mos) 49 - 156 47 - 75 30 - 45 24 - 34 Principal Window End (date) Sep-19 Dec-12 Jun-10 Jul-09
M-2
WAL (yrs) 8.53 4.54 3.69 2.79 Principal Window (mos) 49 - 156 43 - 75 41 - 45 32 - 34
Principal Window End (date) Sep-19 Dec-12 Jun-10 Jul-09
M-3 WAL (yrs) 8.53 4.44 3.42 2.62
Principal Window (mos) 49 - 156 42 - 75 39 - 45 30 - 34 Principal Window End (date) Sep-19 Dec-12 Jun-10 Jul-09
Assumptions: 1. Prepayments are capped at 85% CPR.
CONFIDENTIAL AND PROPRIETARY BUSINESS INFORMATION CONFIDENTIAL TREATMENT REQUESTED
FM-FCIC-2_00004783

CMLTI 2006-NC2
Citigroup Global Markets Inc.
22
Sensitivity Analysis – To Optional Termination
Percent of Prepay Assumption 50% 100% 150% 200%
M-4 WAL (yrs) 8.53 4.40 3.29 2.54
Principal Window (mos) 49 - 156 41 - 75 37 - 45 29 - 34 Principal Window End (date) Sep-19 Dec-12 Jun-10 Jul-09
M-5
WAL (yrs) 8.53 4.37 3.20 2.46 Principal Window (mos) 49 - 156 40 - 75 36 - 45 28 - 34
Principal Window End (date) Sep-19 Dec-12 Jun-10 Jul-09
M-6 WAL (yrs) 8.53 4.34 3.12 2.40
Principal Window (mos) 49 - 156 39 - 75 35 - 45 27 - 34 Principal Window End (date) Sep-19 Dec-12 Jun-10 Jul-09
M-7
WAL (yrs) 8.53 4.34 3.08 2.38 Principal Window (mos) 49 - 156 39 - 75 34 - 45 26 - 34
Principal Window End (date) Sep-19 Dec-12 Jun-10 Jul-09
M-8 WAL (yrs) 8.53 4.31 3.07 2.34
Principal Window (mos) 49 - 156 38 - 75 34 - 45 26 - 34 Principal Window End (date) Sep-19 Dec-12 Jun-10 Jul-09
M-9
WAL (yrs) 8.53 4.30 3.02 2.34 Principal Window (mos) 49 - 156 38 - 75 33 - 45 26 - 34
Principal Window End (date) Sep-19 Dec-12 Jun-10 Jul-09
M-10 WAL (yrs) 8.53 4.29 2.98 2.30
Principal Window (mos) 49 - 156 37 - 75 32 - 45 25 - 34 Principal Window End (date) Sep-19 Dec-12 Jun-10 Jul-09
M-11
WAL (yrs) 8.24 4.12 2.86 2.23 Principal Window (mos) 49 - 156 37 - 75 31 - 45 25 - 34
Principal Window End (date) Sep-19 Dec-12 Jun-10 Jul-09
Assumptions: 2. Prepayments are capped at 85% CPR.
CONFIDENTIAL AND PROPRIETARY BUSINESS INFORMATION CONFIDENTIAL TREATMENT REQUESTED
FM-FCIC-2_00004784

CMLTI 2006-NC2
Citigroup Global Markets Inc.
23
Assumed Monthly Excess Interest at Static Indices
Period
Excess Interest at
Static Indices (%) Period
Excess Interest at
Static Indices (%) Period
Excess Interest at
Static Indices (%)
1 2.94 26 3.59 51 4.65 2 2.21 27 3.63 52 4.57 3 2.38 28 3.61 53 4.56 4 2.20 29 3.73 54 4.78 5 2.20 30 4.38 55 4.55 6 2.75 31 4.17 56 4.61 7 2.20 32 4.23 57 4.53 8 2.38 33 4.15 58 4.60 9 2.20 34 4.23 59 4.52
10 2.37 35 4.33 60 4.51 11 2.19 36 4.47 61 4.59 12 2.19 37 4.54 62 4.28 13 2.36 38 4.42 63 4.46 14 2.18 39 4.54 64 4.28 15 2.36 40 4.48 65 4.28 16 2.17 41 4.55 66 4.65 17 2.17 42 4.82 67 4.28 18 2.53 43 4.61 68 4.46 19 2.16 44 4.67 69 4.28 20 2.35 45 4.59 70 4.46 21 2.19 46 4.66 71 4.28 22 2.42 47 4.60 72 4.28 23 2.48 48 4.60 73 4.47 24 3.34 49 4.67 74 4.29 25 3.65 50 4.59 75 4.47
Assumptions:
1) Run at pricing prepayment assumption 2) Excess (30/360) 3) Static Indices: 1mL = 5.35% 6mL = 5.41% 4) 10% optional clean-up call 5) Includes payments made from the Cap Agreement and net payments from the
Swap Agreement, if any
CONFIDENTIAL AND PROPRIETARY BUSINESS INFORMATION CONFIDENTIAL TREATMENT REQUESTED
FM-FCIC-2_00004785

CMLTI 2006-NC2
Citigroup Global Markets Inc.
24
Assumed Monthly Excess Interest at Forward Indices
Period
Excess Interest at
Forwards (%) Period
Excess Interest at
Forwards (%) Period
Excess Interest at
Forwards (%)
1 2.94 26 3.67 51 4.58 2 2.20 27 3.71 52 4.51 3 2.36 28 3.69 53 4.50 4 2.17 29 3.80 54 4.72 5 2.17 30 4.31 55 4.49 6 2.74 31 4.11 56 4.56 7 2.26 32 4.17 57 4.47 8 2.50 33 4.09 58 4.54 9 2.37 34 4.16 59 4.47
10 2.58 35 4.26 60 4.47 11 2.44 36 4.40 61 4.55 12 2.47 37 4.46 62 4.33 13 2.68 38 4.34 63 4.51 14 2.55 39 4.44 64 4.32 15 2.75 40 4.38 65 4.32 16 2.60 41 4.45 66 4.69 17 2.61 42 4.73 67 4.33 18 2.96 43 4.53 68 4.50 19 2.62 44 4.59 69 4.32 20 2.80 45 4.51 70 4.50 21 2.64 46 4.57 71 4.32 22 2.87 47 4.51 72 4.33 23 2.95 48 4.53 73 4.50 24 3.79 49 4.60 74 4.32 25 3.74 50 4.52 75 4.50
Assumptions: 1. Run at pricing prepayment assumption 2. Excess (30/360) 3. 10% optional clean-up call 4. Includes payments made from the Cap Agreement and net payments from
the Swap Agreement, if any
CONFIDENTIAL AND PROPRIETARY BUSINESS INFORMATION CONFIDENTIAL TREATMENT REQUESTED
FM-FCIC-2_00004786

CMLTI 2006-NC2
Citigroup Global Markets Inc.
25
BREAKEVEN (PRIOR TO 1ST DOLLAR LOSS)
BOND CDR BE RATE (%) WAL (yr) Cum Loss (%)
M-1 30.87 5.58 21.97 M-2 22.82 6.40 18.07 M-3 20.54 8.55 16.81 M-4 18.13 8.82 15.38 M-5 15.81 9.27 13.90 M-6 14.34 10.40 12.91 M-7 13.01 10.91 11.97 M-8 11.88 11.52 11.14 M-9 10.28 11.23 9.91
M-10 8.52 11.34 8.47 M-11 7.49 12.25 7.59
Assumptions 1. Stepdown fail 2. 40 % Loss Severity 3. 6 Months Lag 4. Defaults outside Prepays 5. Pricing Prepayment Assumption 6. CDR shown before 1st $ lost 7. Certificates use 1-month LIBOR forward and collateral uses 6-month LIBOR forward 8. 100% Principal and Interest Advancing
CONFIDENTIAL AND PROPRIETARY BUSINESS INFORMATION CONFIDENTIAL TREATMENT REQUESTED
FM-FCIC-2_00004787

CMLTI 2006-NC2
Citigroup Global Markets Inc.
26
Aggregate Collateral: Summary Statistics for the Mortgage Loans listed below are based on Cut-Off Date scheduled balances.
Minimum Maximum Scheduled Principal Balance: $ 948,626,392.10
Number of Mortgage Loans 4,507
Average Scheduled Principal Balance: $210,478.45 $29,982.55 $1,500,000.00
Weighted Average Gross Coupon: 8.425% 5.500% 14.750%
Non-Zero Weighted Average Original Credit Score: 626 500 816
Weighted Average Original LTV Ratio (1): 81.42% 13.16% 100.00%
Weighted Average Combined LTV Ratio (2): 87.58% 13.16% 100.00%
Weighted Average Stated Remaining Term: 357 118 359
Weighted Average Original Term: 359 120 360
Weighted Average Roll Term: 25 18 35
Weighted Average Gross Margin: 6.189% 4.700% 7.600%
Weighted Average Initial Periodic Rate Cap: 1.944% 1.000% 2.000%
Weighted Average Subsequent Periodic Rate Cap: 1.499% 1.000% 1.500%
Weighted Average Gross Maximum Lifetime Rate: 15.336% 12.500% 19.400%
Weighted Average Gross Minimum Lifetime Rate: 6.189% 4.700% 7.600%
Weighted Average Seasoning: 2 1 6
Weighted Average Origination Date: 06/28/2006 07/06/2003 07/25/2006
Weighted Average First Adjustment Date: 09/18/2008 03/01/2008 08/01/2009 Weighted Average Next Adjustment Date: 09/18/2008 03/01/2008 08/01/2009
Percent Interest Only Loans: 18.33%
Percent Second Liens: 5.24%
Percent of First Lien with Silent Seconds: 31.96%
Non-Zero Weighted Average Debt-To-Income Ratio: 41.15% 0.81% 59 37%
(1) Original LTV = Principal Balance at Origination + Senior Lien Balance (as applicable) / property value (2) Combined LTV = Principal Balance at Origination+ Senior and known Junior Lien Balances (as applicable) / property value
CONFIDENTIAL AND PROPRIETARY BUSINESS INFORMATION CONFIDENTIAL TREATMENT REQUESTED
FM-FCIC-2_00004788

CMLTI 2006-NC2
Citigroup Global Markets Inc.
27
Product Type of the Mortgage Loans
Product Type
Number of
Mortgage Loans
Aggregate Principal Balance
($)
% of Aggregate Principal Balance
Average Principal
Balance ($)
Weighted Average
Mortgage Rate (%)
Weighted Average
Original Loan-to-Value Ratio
(%)
Weighted Average
Combined Loan-to-Value
Ratio (%)
Non-Zero Weighted Average Credit Score
10 Yr Fixed 4 406,364.47 0.04 101,591 12 7.600 74.81 74.81 67415 Yr Fixed 41 3,948,024.96 0.42 96,293 29 8.420 71.64 72.23 61520 Yr Fixed 26 2,683,448.17 0.28 103,209 55 8.394 74.65 74.65 65425 Yr Fixed 2 473,784.46 0.05 236,892 23 6.956 73.58 73.58 73930 Yr Fixed 1,168 130,188,283.65 13.72 111,462 57 9.238 85.38 87.20 641Fixed 40/30 Balloon 229 52,585,643.15 5.54 229,631.63 7.694 78.23 81.69 6422/28 Hybrid 851 164,288,986.31 17.32 193,054.04 8.740 81.36 86.82 6102/28 Hybrid Balloon 1,186 316,632,737.56 33.38 266,975 33 8.398 80.76 86.90 6202/28 Hybrid IO 418 146,823,713.13 15.48 351,252 90 7.866 81.97 94.24 6363/27 Hybrid 301 52,828,061.30 5.57 175,508 51 8.493 79.77 84.10 6183/27 Hybrid Balloon 205 50,671,404.30 5.34 247,177 58 8.222 80.43 85.67 6223/27 Hybrid IO 76 27,095,940.64 2.86 356,525 53 7.662 80.91 91.68 645Total: 4,507 948,626,392.10 100.00 210,478.45 8.425 81.42 87.58 626
Principal Balances of the Mortgage Loans at Origination
Range ($)
Number of
Mortgage Loans
Aggregate Principal Balance
($)
% of Aggregate Principal Balance
Average Principal
Balance ($)
Weighted Average
Mortgage Rate (%)
Weighted Average
Original Loan-to-Value Ratio
(%)
Weighted Average
Combined Loan-to-Value
Ratio (%)
Non-Zero Weighted Average Credit Score
30,000 - 50,000 210 8,566,631.39 0.90 40,793.48 10.750 93.69 93.76 62750,001 - 75,000 503 31,551,404.94 3.33 62,726.45 10.045 86.36 89.03 61575,001 - 100,000 481 42,159,501.13 4.44 87,649.69 9.434 83.27 87.05 617100,001 - 125,000 468 52,779,334.55 5.56 112,776.36 9.092 81.96 87.26 611125,001 - 150,000 392 54,010,520.35 5.69 137,781.94 8.971 80.47 86.08 619150,001 - 175,000 319 51,806,938.17 5.46 162,404.19 8.761 81.00 85.65 613175,001 - 200,000 302 56,866,555.88 5.99 188,299.85 8.465 79.24 85.69 612200,001 - 225,000 284 60,577,603.02 6.39 213,301.42 8.321 79.76 85.06 608225,001 - 250,000 235 55,895,440.93 5.89 237,852.94 8.267 78.88 85.44 612250,001 - 275,000 182 47,684,036.72 5.03 262,000.20 8.168 78.48 85.56 622275,001 - 300,000 187 53,838,487.89 5.68 287,906.35 8.191 80.65 86.01 618300,001 - 333,700 159 50,282,217.47 5.30 316,240.36 8.289 81.94 89.51 639333,701 - 350,000 62 21,182,544.98 2.23 341,653.95 8.409 80.25 85.40 618350,001 - 400,000 203 76,469,341.89 8.06 376,696.27 8.014 81.27 87.55 628400,001 - 500,000 265 118,963,268.91 12.54 448,918.00 8.011 82.12 89.29 637500,001 - 600,000 115 63,266,219.51 6.67 550,141.04 8.028 82.41 90.48 643600,001 - 700,000 75 49,355,379.69 5.20 658,071.73 7.894 83.63 93.18 652700,001 - 800,000 45 33,054,307.26 3.48 734,540.16 8.091 82.57 90.61 651800,001 - 900,000 8 6,767,455.64 0.71 845,931.96 8.358 86.26 88.72 611900,001 - 1,000,000 3 2,958,313.40 0.31 986,104.47 8.728 85.35 89.75 6491,000,001 - 1,500,000 9 10,590,888.38 1.12 1,176,765.38 7.650 74.19 74.19 655Total: 4,507 948,626,392.10 100.00 210,478.45 8.425 81.42 87.58 626
The average loan balance of the mortgage loans at origination was $210,601.06.
CONFIDENTIAL AND PROPRIETARY BUSINESS INFORMATION CONFIDENTIAL TREATMENT REQUESTED
FM-FCIC-2_00004789

CMLTI 2006-NC2
Citigroup Global Markets Inc.
28
Principal Balances of the Mortgage Loans as of the Cut-Off Date
Range ($)
Number of
Mortgage Loans
Aggregate Principal Balance
($)
% of Aggregate Principal Balance
Average Principal
Balance ($)
Weighted Average
Mortgage Rate (%)
Weighted Average
Original Loan-to-Value Ratio
(%)
Weighted Average
Combined Loan-to-Value
Ratio (%)
Non-Zero Weighted Average Credit Score
29,982 - 50,000 210 8,566,631.39 0.90 40,793.48 10.750 93.69 93.76 62750,001 - 75,000 507 31,851,338.01 3.36 62,823.15 10.039 86.21 88.90 61675,001 - 100,000 477 41,859,568.06 4.41 87,755.91 9.434 83.37 87.13 617100,001 - 125,000 468 52,779,334.55 5.56 112,776.36 9.092 81.96 87.26 611125,001 - 150,000 393 54,160,355.27 5.71 137,812.61 8.978 80.52 86.12 619150,001 - 175,000 318 51,657,103.25 5.45 162,443.72 8.753 80.95 85.61 613175,001 - 200,000 302 56,866,555.88 5.99 188,299.85 8.465 79.24 85.69 612200,001 - 225,000 285 60,802,502.85 6.41 213,342.12 8.320 79.76 85.11 608225,001 - 250,000 234 55,670,541.10 5.87 237,908.30 8.268 78.87 85.39 612250,001 - 275,000 182 47,684,036.72 5.03 262,000.20 8.168 78.48 85.56 622275,001 - 300,000 187 53,838,487.89 5.68 287,906.35 8.191 80.65 86.01 618300,001 - 325,000 127 39,727,240.15 4.19 312,812.91 8.253 82.20 90.01 643325,001 - 358,700 123 42,008,751.52 4.43 341,534.57 8.280 80.25 85.33 624358,701 - 375,000 60 21,927,918.42 2.31 365,465.31 8.242 81.94 88.52 617375,001 - 425,000 185 73,568,234.94 7.76 397,666.13 7.922 81.28 88.06 628425,001 - 525,000 223 104,582,926.14 11.02 468,981.73 8.032 82.58 90.00 642525,001 - 625,000 99 56,274,028.65 5.93 568,424.53 8.008 82.37 90.82 646625,001 - 725,000 83 56,401,039.50 5.95 679,530.60 7.970 83.40 92.65 651725,001 - 825,000 26 19,698,972.87 2.08 757,652.80 8.101 83.01 89.59 646825,001 - 925,000 6 5,151,623.16 0.54 858,603.86 8.384 84.30 87.53 607925,001 - 1,025,000 4 3,977,701.80 0.42 994,425.45 8.682 83.98 87.25 6491,025,001 - 1,500,000 8 9,571,499.98 1.01 1,196,437.50 7.554 73.57 73.57 655Total: 4,507 948,626,392.10 100.00 210,478.45 8.425 81.42 87.58 626
The average loan balance of the mortgage loans as of the cut-off date was $210,478.45.
Gross Mortgage Rates of the Mortgage Loans
Range of Gross Mortgage Rates (%)
Number of
Mortgage Loans
Aggregate Principal Balance
($)
% of Aggregate Principal Balance
Average Principal
Balance ($)
Weighted Average
Mortgage Rate (%)
Weighted Average
Original Loan-to-Value Ratio
(%)
Weighted Average
Combined Loan-to-Value
Ratio (%)
Non-Zero Weighted Average Credit Score
5.500 - 5.500 1 599,842.71 0.06 599,842.71 5.500 77.38 77.38 6885.501 - 6.000 20 6,908,821.69 0.73 345,441.08 5.832 71.11 74.30 6746.001 - 6.500 107 29,841,274.18 3.15 278,890.41 6.412 74.56 77.62 6666.501 - 7.000 288 84,210,071.19 8.88 292,396.08 6.831 75.74 81.30 6517.001 - 7.500 413 116,504,679.92 12.28 282,093.66 7.320 79.34 87.08 6427.501 - 8.000 641 164,520,332.95 17.34 256,661.99 7.778 80.66 89.99 6358.001 - 8.500 578 140,637,367.05 14.83 243,317.24 8.291 80.56 89.72 6248.501 - 9.000 693 150,465,809.59 15.86 217,122.38 8.767 81.71 88.56 6189.001 - 9.500 460 86,875,852.56 9.16 188,860.55 9.268 83.00 86.65 6049.501 - 10.000 446 74,594,984.58 7.86 167,253.33 9.766 83.91 85.42 59310.001 - 10.500 229 34,030,349.23 3.59 148,604.15 10.265 86.13 88.06 59810.501 - 11.000 184 21,347,509.14 2.25 116,019.07 10.746 88.95 89.54 61511.001 - 11.500 116 11,695,607.46 1.23 100,824.20 11.279 91.58 91.96 61311.501 - 12.000 163 14,079,485.67 1.48 86,377.21 11.793 97.59 97.59 63012.001 - 12.500 117 8,476,286.93 0.89 72,446.90 12.320 97.43 97.43 61712.501 - 13.000 39 2,948,329.86 0.31 75,598.20 12.751 99.74 99.74 62913.001 - 13.500 9 666,114.53 0.07 74,012.73 13.200 100.00 100.00 61713.501 - 14.000 1 104,916.67 0.01 104,916.67 13.700 100.00 100.00 59814.001 - 14.500 1 82,772.96 0.01 82,772.96 14.500 100.00 100.00 59014.501 - 14.750 1 35,983.23 0.00 35,983.23 14.750 100.00 100.00 593Total: 4,507 948,626,392.10 100.00 210,478.45 8.425 81.42 87.58 626
The weighted-average mortgage rate of the mortgage loans as of the cut-off date was 8.425%.
CONFIDENTIAL AND PROPRIETARY BUSINESS INFORMATION CONFIDENTIAL TREATMENT REQUESTED
FM-FCIC-2_00004790

CMLTI 2006-NC2
Citigroup Global Markets Inc.
29
Original Term to Maturity of the Mortgage Loans
Original Term to Maturity (Months)
Number of
Mortgage Loans
Aggregate Principal Balance
($)
% of Aggregate Principal Balance
Average Principal
Balance ($)
Weighted Average
Mortgage Rate (%)
Weighted Average
Original Loan-to-Value Ratio
(%)
Weighted Average
Combined Loan-to-Value
Ratio (%)
Non-Zero Weighted Average Credit Score
120 - 240 71 7,037,837.60 0.74 99,124.47 8.363 72.97 73.30 633241 - 360 4,436 941,588,554.50 99.26 212,260.72 8.425 81.48 87.69 626Total: 4,507 948,626,392.10 100.00 210,478.45 8.425 81.42 87.58 626
The weighted-average original term to maturity of the mortgage loans as of the cut-off date was 359 months.
Remaining Term to Maturity of the Mortgage Loans
Remaining Term to Maturity (Months)
Number of
Mortgage Loans
Aggregate Principal Balance
($)
% of Aggregate Principal Balance
Average Principal
Balance ($)
Weighted Average
Mortgage Rate (%)
Weighted Average
Original Loan-to-Value Ratio
(%)
Weighted Average
Combined Loan-to-Value
Ratio (%)
Non-Zero Weighted Average Credit Score
118 - 120 4 406,364.47 0.04 101,591.12 7.600 74.81 74.81 674121 - 180 41 3,948,024.96 0.42 96,293.29 8.420 71.64 72.23 615181 - 240 26 2,683,448.17 0.28 103,209.55 8.394 74.65 74.65 654241 - 300 2 473,784.46 0.05 236,892.23 6.956 73.58 73.58 739301 - 359 4,434 941,114,770.04 99.21 212,249.61 8.426 81.48 87.70 625Total: 4,507 948,626,392.10 100.00 210,478.45 8.425 81.42 87.58 626
The weighted-average remaining term to maturity of the mortgage loans as of the cut-off date was 357 months.
Seasoning of the Mortgage Loans
Seasoning (Months)
Number of
Mortgage Loans
Aggregate Principal Balance
($)
% of Aggregate Principal Balance
Average Principal
Balance ($)
Weighted Average
Mortgage Rate (%)
Weighted Average
Original Loan-to-Value Ratio
(%)
Weighted Average
Combined Loan-to-Value
Ratio (%)
Non-Zero Weighted Average Credit Score
1 2,618 568,315,019.96 59.91 217,079.84 8 310 80.01 86.50 6232 1,440 277,896,668.60 29.29 192,983.80 8.621 82.94 88.44 6283 311 66,583,383.99 7.02 214,094.48 8.762 86.04 92.12 6334 88 21,401,722.32 2.26 243,201.39 8 365 84.72 90.99 6415 46 13,734,697.98 1.45 298,580.39 7.610 81.16 87.85 6146 4 694,899.25 0.07 173,724.81 9.659 86.14 86.14 645Total: 4,507 948,626,392.10 100.00 210,478.45 8.425 81.42 87.58 626
The weighted-average seasoning of the mortgage loans as of the cut-off date was 2 months.
CONFIDENTIAL AND PROPRIETARY BUSINESS INFORMATION CONFIDENTIAL TREATMENT REQUESTED
FM-FCIC-2_00004791

CMLTI 2006-NC2
Citigroup Global Markets Inc.
30
Original Loan-To-Value Ratio of the Mortgage Loans*
Original Loan-To-Value Ratio (%)
Number of
Mortgage Loans
Aggregate Principal Balance
($)
% of Aggregate Principal Balance
Average Principal
Balance ($)
Weighted Average
Mortgage Rate (%)
Weighted Average
Original Loan-to-Value Ratio
(%)
Weighted Average
Combined Loan-to-Value
Ratio (%)
Non-Zero Weighted Average Credit Score
13.16 - 15.00 1 49,510.28 0.01 49,510.28 9.975 13.16 13.16 50415.01 - 20.00 2 134,706.40 0.01 67,353.20 8.565 16.81 16.81 56920.01 - 25.00 5 388,702.70 0.04 77,740.54 8.352 23.79 23.79 58425.01 - 30.00 5 457,756.10 0.05 91,551.22 7.214 27.84 27.84 64630.01 - 35.00 14 2,410,061.54 0.25 172,147.25 7.659 32.50 32.50 60435.01 - 40.00 20 2,313,725.78 0.24 115,686.29 8.185 38.07 38.07 57940.01 - 45.00 30 4,933,796.35 0.52 164,459.88 7.959 42.93 43.33 59545.01 - 50.00 50 7,997,466.35 0.84 159,949.33 7.751 48.34 48.34 61350.01 - 55.00 67 11,708,065.09 1.23 174,747.24 7.860 52.87 52.87 60555.01 - 60.00 88 18,021,819.05 1.90 204,793.40 7.727 58.30 58.39 60360.01 - 65.00 129 28,179,673.27 2.97 218,447.08 7.860 63.14 63.14 60865.01 - 70.00 175 35,395,416.65 3.73 202,259.52 8.397 68.71 69.02 59370.01 - 75.00 252 55,320,499.31 5.83 219,525.79 8.201 73.67 73.72 59275.01 - 80.00 1,628 397,139,686.49 41.86 243,943.30 8.059 79.83 94.08 63880.01 - 85.00 467 106,589,033.66 11.24 228,242.04 8.533 84.37 85.39 58985.01 - 90.00 649 149,653,737.62 15.78 230,591.28 8.716 89.64 90.06 62790.01 - 95.00 297 78,669,460.54 8.29 264,880.34 8.517 94.69 94.70 65295.01 - 100.00 628 49,263,274.92 5.19 78,444.71 11.310 99.96 99.96 653Total: 4,507 948,626,392.10 100.00 210,478.45 8.425 81.42 87.58 626
The weighted-average original loan-to-value ratio of the mortgage loans as of the cut-off date was 81.42%.
*Original LTV = Principal Balance at Origination + Senior Lien Balance (as applicable) / property value
Combined Loan-To-Value Ratio of the Mortgage Loans*
Combined Loan-To-Value Ratio (%)
Number of
Mortgage Loans
Aggregate Principal
Balance ($)
% of Aggregate Principal Balance
Average Principal
Balance ($)
Weighted Average
Mortgage Rate (%)
Weighted Average
Original Loan-to-Value Ratio
(%)
Weighted Average
Combined Loan-to-Value
Ratio (%)
Non-Zero Weighted Average Credit Score
13.16 - 15.00 1 49,510.28 0.01 49,510.28 9.975 13.16 13.16 50415.01 - 20.00 2 134,706.40 0.01 67,353.20 8.565 16.81 16.81 56920.01 - 25.00 5 388,702.70 0.04 77,740.54 8.352 23.79 23.79 58425.01 - 30.00 5 457,756.10 0.05 91,551.22 7.214 27.84 27.84 64630.01 - 35.00 14 2,410,061.54 0.25 172,147.25 7.659 32.50 32.50 60435.01 - 40.00 20 2,313,725.78 0.24 115,686.29 8.185 38.07 38.07 57940.01 - 45.00 29 4,735,883.06 0.50 163,306.31 8.020 42.87 42.90 59045.01 - 50.00 50 7,997,466.35 0.84 159,949.33 7.751 48.34 48.34 61350.01 - 55.00 68 11,905,978.38 1.26 175,087.92 7.838 52.73 52.88 60755.01 - 60.00 87 17,943,834.63 1.89 206,250.97 7.720 58.31 58.31 60360.01 - 65.00 129 28,179,673.27 2.97 218,447.08 7.860 63.14 63.14 60865.01 - 70.00 172 34,934,547.95 3.68 203,107.84 8.405 68.72 68.72 59370.01 - 75.00 250 55,210,097.18 5.82 220,840.39 8.199 73.67 73.67 59275.01 - 80.00 507 112,031,967.16 11.81 220,970.35 8.204 79.42 79.43 60380.01 - 85.00 420 97,870,620.55 10.32 233,025.29 8.492 84.29 84.33 58985.01 - 90.00 618 143,892,270.93 15.17 232,835.39 8.692 89.54 89.64 62690.01 - 95.00 352 89,632,384.92 9.45 254,637.46 8.542 93.37 94.69 64995.01 - 100.00 1,778 338,537,204.92 35.69 190,403.38 8.508 83.09 99.96 651Total: 4,507 948,626,392.10 100.00 210,478.45 8.425 81.42 87.58 626
The weighted-average combined loan-to-value ratio of the mortgage loans as of the cut-off date was 87.58%.
*Combined LTV = Principal Balance at Origination+ Senior and known Junior Lien Balances (as applicable) / property value
CONFIDENTIAL AND PROPRIETARY BUSINESS INFORMATION CONFIDENTIAL TREATMENT REQUESTED
FM-FCIC-2_00004792

CMLTI 2006-NC2
Citigroup Global Markets Inc.
31
Occupancy Type of the Mortgage Loans
Occupancy Type
Number of
Mortgage Loans
Aggregate Principal
Balance ($)
% of Aggregate Principal Balance
Average Principal
Balance ($)
Weighted Average
Mortgage Rate (%)
Weighted Average
Original Loan-to-Value Ratio
(%)
Weighted Average
Combined Loan-to-Value
Ratio (%)
Non-Zero Weighted Average Credit Score
Investor 327 61,807,766.62 6.52 189,014.58 9.297 86.25 86.48 665Primary 4,005 857,906,187 28 90.44 214,208.79 8.347 80.98 87.43 622Second Home 175 28,912,438 20 3.05 165,213.93 8.884 84.01 94.40 663Total: 4,507 948,626,392 10 100.00 210,478.45 8.425 81.42 87.58 626
Property Types of the Mortgage Loans
Property Type
Number of
Mortgage Loans
Aggregate Principal Balance
($)
% of Aggregate Principal Balance
Average Principal
Balance ($)
Weighted Average
Mortgage Rate (%)
Weighted Average
Original Loan-to-Value Ratio
(%)
Weighted Average
Combined Loan-to-Value
Ratio (%)
Non-Zero Weighted Average Credit Score
2-4 Family 262 67,152,262.79 7.08 256,306.35 8.538 81.93 87.04 647Condo 288 56,394,650.05 5.94 195,814.76 8.545 81.12 90.14 636Mod 2 280,707.67 0.03 140,353.84 7.938 83.30 90.10 590PUD 632 132,558,474.56 13.97 209,744.42 8.462 82.40 89.58 623Single Family 3,323 692,240,297.03 72.97 208,317.87 8.397 81.20 87.04 623Total: 4,507 948,626,392.10 100.00 210,478.45 8.425 81.42 87.58 626
Loan Purpose of the Mortgage Loans
Loan Purpose
Number of
Mortgage Loans
Aggregate Principal
Balance ($)
% of Aggregate Principal Balance
Average Principal
Balance ($)
Weighted Average
Mortgage Rate (%)
Weighted Average
Original Loan-to-Value Ratio
(%)
Weighted Average
Combined Loan-to-Value
Ratio (%)
Non-Zero Weighted Average Credit Score
Purchase 2,082 409,293,594.47 43 15 196,586.74 8.630 84 30 96.35 647Cash-Out Refinance 2,069 453,444,738.42 47.80 219,161.30 8.327 78.87 79.05 605Rate/Term Refinance 356 85,888,059.21 9.05 241,258.59 7.969 81 13 90.85 630Total: 4,507 948,626,392.10 100.00 210,478.45 8.425 81.42 87.58 626
Documentation of the Mortgage Loans
Documentation Type
Number of
Mortgage Loans
Aggregate Principal
Balance ($)
% of Aggregate Principal Balance
Average Principal
Balance ($)
Weighted Average
Mortgage Rate (%)
Weighted Average
Original Loan-to-Value Ratio
(%)
Weighted Average
Combined Loan-to-
Value Ratio (%)
Non-Zero Weighted Average Credit Score
Full / Alt 10 2,230,105.86 0.24 223,010.59 8.198 86.45 94.32 574Full Doc – 12 Mo. Bk Stmts 260 70,030,469.79 7.38 269,347.96 8.107 82.55 91.13 633Full Doc - 1Yr W2 1,234 221,676,830.32 23.37 179,640.87 8.075 79.97 84.01 608Full Doc - 24 Mo. Bk Stmts 31 7,806,364.43 0.82 251,818.21 7.771 83.03 88.63 612Full Doc - 2YR W2/Tax Returns 1,227 216,584,189.91 22.83 176,515.23 8.278 80.44 86.14 603Full Doc – Business Bank Stmts 90 31,317,540.97 3.30 347,972.68 8.081 82.73 88.82 623Full Doc 12Mo. Bk Stmts 3 1,452,220.18 0.15 484,073.39 7.578 78.02 91.28 611Limited Doc - 6 Mo. Bk Stmts 70 17,529,828.65 1.85 250,426.12 8.196 83.67 94.10 633Stated Doc 1,575 378,388,614.34 39.89 240,246.74 8.829 82.35 89.35 648Stated Income / Stated Assets 1 170,877.29 0.02 170,877.29 10.375 90.00 90.00 641Stated Income / Verified Assets 6 1,439,350.36 0.15 239,891.73 8.597 79.50 92.11 631Total: 4,507 948,626,392.10 100.00 210,478.45 8.425 81.42 87.58 626
CONFIDENTIAL AND PROPRIETARY BUSINESS INFORMATION CONFIDENTIAL TREATMENT REQUESTED
FM-FCIC-2_00004793
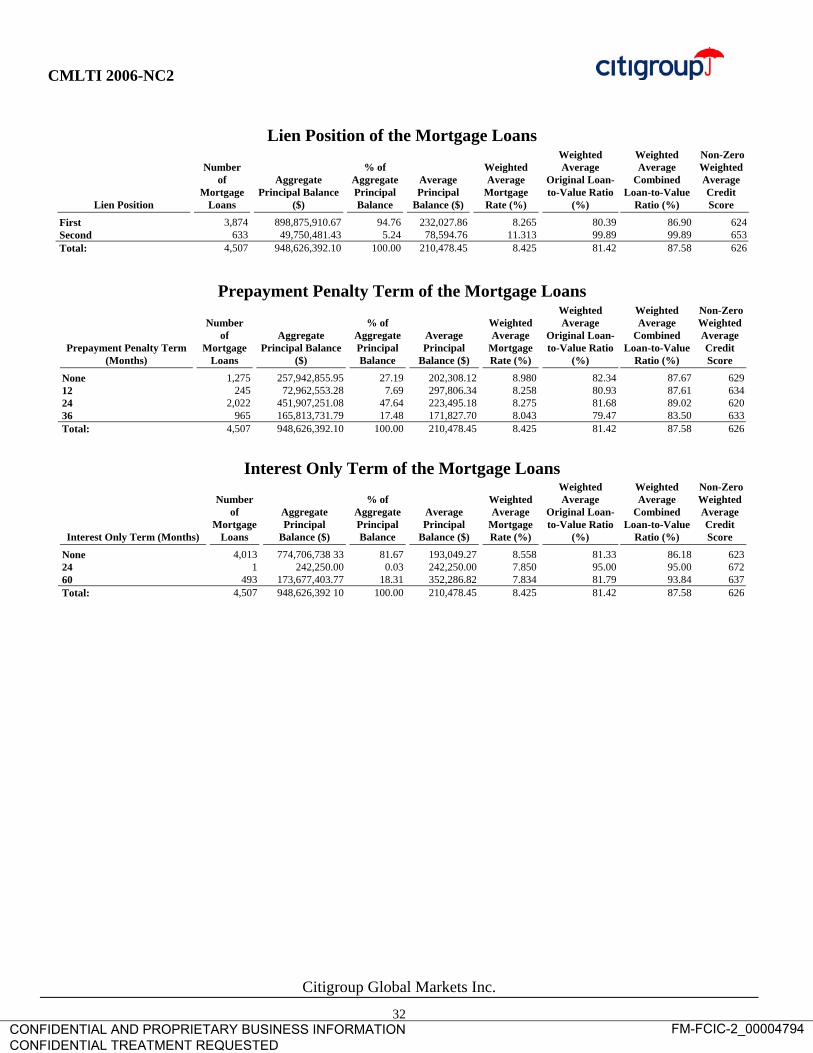
CMLTI 2006-NC2
Citigroup Global Markets Inc.
32
Lien Position of the Mortgage Loans
Lien Position
Number of
Mortgage Loans
Aggregate Principal Balance
($)
% of Aggregate Principal Balance
Average Principal
Balance ($)
Weighted Average
Mortgage Rate (%)
Weighted Average
Original Loan-to-Value Ratio
(%)
Weighted Average
Combined Loan-to-Value
Ratio (%)
Non-Zero Weighted Average Credit Score
First 3,874 898,875,910.67 94.76 232,027.86 8.265 80.39 86.90 624Second 633 49,750,481.43 5.24 78,594.76 11.313 99.89 99.89 653Total: 4,507 948,626,392.10 100.00 210,478.45 8.425 81.42 87.58 626
Prepayment Penalty Term of the Mortgage Loans
Prepayment Penalty Term (Months)
Number of
Mortgage Loans
Aggregate Principal Balance
($)
% of Aggregate Principal Balance
Average Principal
Balance ($)
Weighted Average
Mortgage Rate (%)
Weighted Average
Original Loan-to-Value Ratio
(%)
Weighted Average
Combined Loan-to-Value
Ratio (%)
Non-Zero Weighted Average Credit Score
None 1,275 257,942,855.95 27.19 202,308.12 8.980 82.34 87.67 62912 245 72,962,553.28 7.69 297,806.34 8.258 80.93 87.61 63424 2,022 451,907,251.08 47.64 223,495.18 8.275 81.68 89.02 62036 965 165,813,731.79 17.48 171,827.70 8.043 79.47 83.50 633Total: 4,507 948,626,392.10 100.00 210,478.45 8.425 81.42 87.58 626
Interest Only Term of the Mortgage Loans
Interest Only Term (Months)
Number of
Mortgage Loans
Aggregate Principal
Balance ($)
% of Aggregate Principal Balance
Average Principal
Balance ($)
Weighted Average
Mortgage Rate (%)
Weighted Average
Original Loan-to-Value Ratio
(%)
Weighted Average
Combined Loan-to-Value
Ratio (%)
Non-Zero Weighted Average Credit Score
None 4,013 774,706,738 33 81.67 193,049.27 8.558 81.33 86.18 62324 1 242,250.00 0.03 242,250.00 7.850 95.00 95.00 67260 493 173,677,403.77 18.31 352,286.82 7.834 81.79 93.84 637Total: 4,507 948,626,392 10 100.00 210,478.45 8.425 81.42 87.58 626
CONFIDENTIAL AND PROPRIETARY BUSINESS INFORMATION CONFIDENTIAL TREATMENT REQUESTED
FM-FCIC-2_00004794

CMLTI 2006-NC2
Citigroup Global Markets Inc.
33
Geographic Concentration of the Mortgage Loans
Location
Number of
Mortgage Loans
Aggregate Principal
Balance ($)
% of Aggregate Principal Balance
Average Principal
Balance ($)
Weighted Average
Mortgage Rate (%)
Weighted Average
Original Loan-to-Value Ratio
(%)
Weighted Average
Combined Loan-to-Value
Ratio (%)
Non-Zero Weighted Average Credit Score
California 917 294,888,642.33 31.09 321,579.76 8.157 80.71 87.85 638Florida 565 109,873,083.73 11.58 194,465.63 8.545 80.51 86.17 617New York 214 67,239,064.05 7.09 314,201.23 8.171 81.76 87.53 642Texas 396 44,600,597.02 4.70 112,627.77 8.604 81.38 88.31 619New Jersey 150 39,122,212.78 4.12 260,814.75 8.593 81.53 85.20 625Arizona 181 34,191,431.27 3.60 188,902.94 8.354 79.84 85.27 609Maryland 125 29,871,789.76 3.15 238,974.32 8.522 81.83 85.86 613Illinois 152 25,257,971.55 2.66 166,170.87 8.798 83.19 87.84 629Nevada 113 25,025,074.40 2.64 221,460.84 8.209 81.66 90.12 629Massachusetts 93 22,878,176.14 2.41 246,001.89 8.320 79.63 82.24 617Pennsylvania 132 21,273,017.15 2.24 161,159.22 8.453 79.21 82.79 620Virginia 89 20,728,038.94 2.19 232,899.31 8.338 80.99 87.00 622Washington 93 20,139,663.88 2.12 216,555.53 8.315 81.79 88.87 601Georgia 116 18,101,066.15 1.91 156,043.67 8.841 84.32 91.50 626Minnesota 82 16,714,154.58 1.76 203,831.15 8.511 84.00 94.04 623Connecticut 69 13,914,979.08 1.47 201,666.36 8.471 82.39 88.15 603Hawaii 49 13,332,824.32 1.41 272,098.46 8.168 77.32 84.65 647Michigan 99 11,979,381.97 1.26 121,003.86 9.204 82.69 88.15 595Oregon 53 11,469,671.29 1.21 216,408.89 8.363 83.37 88.66 634Colorado 68 11,224,740.63 1.18 165,069.72 8.602 85.40 95.02 625Ohio 99 10,143,885.00 1.07 102,463.48 9.290 85.15 87.99 595Wisconsin 52 7,565,533.89 0.80 145,491.04 9.103 84.06 88.15 620Rhode Island 31 6,527,966.32 0.69 210,579.56 8.860 83.36 87.90 621Utah 28 6,301,722.66 0.66 225,061.52 8.410 83.42 95.93 637Indiana 54 6,104,307.65 0.64 113,042.73 8.980 84.33 90.20 608Missouri 49 5,462,373.48 0.58 111,477.01 9.215 83.68 90.29 602Tennessee 52 5,349,159.75 0.56 102,868.46 8.752 84.29 93.77 609Arkansas 44 4,354,820.98 0.46 98,973.20 8.763 84.40 96.09 620Idaho 20 4,260,390.58 0.45 213,019.53 7.886 82.41 87.10 614New Hampshire 24 3,932,503.37 0.41 163,854.31 8.784 80.69 84.79 603South Carolina 23 3,614,227.97 0.38 157,140.35 8.764 80.89 84.26 605North Carolina 24 3,398,980.94 0.36 141,624.21 8.909 86.28 89.81 631Alabama 31 3,105,291.88 0.33 100,170.71 9.730 82.48 86.10 592Louisiana 20 2,809,449.70 0.30 140,472.49 8.798 84.42 89.31 625Kansas 16 2,684,546.42 0.28 167,784.15 9.491 86.71 91.32 624Maine 16 2,563,260.35 0.27 160,203.77 8.431 79.01 80.08 592New Mexico 21 2,539,693.53 0.27 120,937.79 8.959 85.62 88.08 631Oklahoma 20 2,217,951.67 0.23 110,897.58 8.874 85.29 93.90 604Mississippi 24 2,076,897.84 0.22 86,537.41 9.253 86.01 89.47 608Iowa 20 1,950,713.68 0.21 97,535.68 10.116 82.02 85.43 575Nebraska 19 1,704,811.46 0.18 89,726.92 9.124 84.69 95.66 608District of Columbia 8 1,701,695.97 0.18 212,712.00 10.008 79.93 81.68 601Kentucky 16 1,605,318.94 0.17 100,332.43 8.500 85.62 88.73 646Alaska 11 1,378,282.19 0.15 125,298.38 10.022 81.90 81.90 553Montana 7 980,555 96 0.10 140,079.42 8.847 80.92 83.24 610Delaware 4 723,267 18 0.08 180,816.80 8.405 86.94 94.30 621West Virginia 5 527,914.60 0.06 105,582.92 9.488 82.34 83.95 605South Dakota 5 470,920.82 0.05 94,184.16 8.749 80.60 95.78 607Wyoming 3 310,832.83 0.03 103,610.94 8.471 78.95 95.19 612North Dakota 2 242,465.05 0.03 121,232.53 10.038 88.65 100.00 645Vermont 3 191,068.42 0.02 63,689.47 9.738 89.12 100.00 618Total: 4,507 948,626,392.10 100.00 210,478.45 8.425 81.42 87.58 626
CONFIDENTIAL AND PROPRIETARY BUSINESS INFORMATION CONFIDENTIAL TREATMENT REQUESTED
FM-FCIC-2_00004795

CMLTI 2006-NC2
Citigroup Global Markets Inc.
34
Credit Score of the Mortgage Loans
Credit Score
Number of
Mortgage Loans
Aggregate Principal
Balance ($)
% of Aggregate Principal Balance
Average Principal
Balance ($)
Weighted Average
Mortgage Rate (%)
Weighted Average
Original Loan-to-Value Ratio
(%)
Weighted Average
Combined Loan-to-Value
Ratio (%)
Non-Zero Weighted Average Credit Score
500 - 524 284 50,116,700.56 5.28 176,467.26 9.388 75.93 76.37 513525 - 549 330 60,500,773.70 6.38 183,335.68 9.112 76.37 77.21 537550 - 574 380 72,863,691.85 7.68 191,746.56 8.761 78.27 78.86 562575 - 599 644 121,567,979.74 12.82 188,770.15 8.569 80.78 85.66 588600 - 624 797 166,499,766.36 17.55 208,908.11 8.268 82.41 88.74 612625 - 649 755 163,188,902.96 17.20 216,144.24 8.340 82.79 91.00 637650 - 674 526 121,790,513.38 12.84 231,540.90 8.278 82.99 92.26 661675 - 699 364 90,336,147.07 9.52 248,176.23 8.018 82.91 91.56 685700 - 724 196 45,100,621.17 4.75 230,105.21 8.024 83.84 92.30 711725 - 749 133 34,018,902.57 3.59 255,781.22 8.206 83.89 93.96 736750 - 774 58 14,134,357.33 1.49 243,695.82 7.989 81.88 87.59 761775 - 799 35 7,277,508.77 0.77 207,928.82 7.805 78.68 83.25 785800 - 816 5 1,230,526.64 0.13 246,105.33 7.613 72.27 72.27 807Total: 4,507 948,626,392.10 100.00 210,478.45 8.425 81.42 87.58 626
The non-zero weighted-average credit score of the mortgage loans as of the cut-off date was 626.
Debt-To-Income Ratio of the Mortgage Loans
Debt-To-Income Ratio (%)
Number of
Mortgage Loans
Aggregate Principal
Balance ($)
% of Aggregate Principal Balance
Average Principal
Balance ($)
Weighted Average
Mortgage Rate (%)
Weighted Average
Original Loan-to-Value Ratio
(%)
Weighted Average
Combined Loan-to-Value
Ratio (%)
Non-Zero Weighted Average Credit Score
0.81 - 10.00 19 2,649,961.29 0.28 139,471.65 8.293 81.28 83.49 60210.01 - 20.00 117 22,501,994.78 2.37 192,324.74 8.237 80.86 86.03 63120.01 - 30.00 464 86,020,270.66 9.07 185,388.51 8.399 79.87 83.44 62030.01 - 40.00 1,145 229,279,264.96 24.17 200,243.90 8.451 81.30 87.28 62740.01 - 50.00 2,504 556,416,660.60 58.65 222,211.13 8.463 82.42 89.56 62850.01 - 59.37 258 51,758,239.81 5.46 200,613.33 8.034 73.95 75.40 601Total: 4,507 948,626,392.10 100.00 210,478.45 8.425 81.42 87.58 626
The non-zero weighted-average debt-to-income ratio of the mortgage loans as of the cut-off date was 41.15%.
Index of the Adjustable-Rate Mortgage Loans
Index
Number of
Mortgage Loans
Aggregate Principal
Balance ($)
% of Aggregate Principal Balance
Average Principal
Balance ($)
Weighted Average
Mortgage Rate (%)
Weighted Average
Original Loan-to-Value Ratio
(%)
Weighted Average
Combined Loan-to-Value
Ratio (%)
Non-Zero Weighted Average Credit Score
Six-Month LIBOR 3,037 758,340,843.24 100.00 249,700.64 8.338 81.04 88.20 622Total: 3,037 758,340,843.24 100.00 249,700.64 8.338 81.04 88.20 622
CONFIDENTIAL AND PROPRIETARY BUSINESS INFORMATION CONFIDENTIAL TREATMENT REQUESTED
FM-FCIC-2_00004796
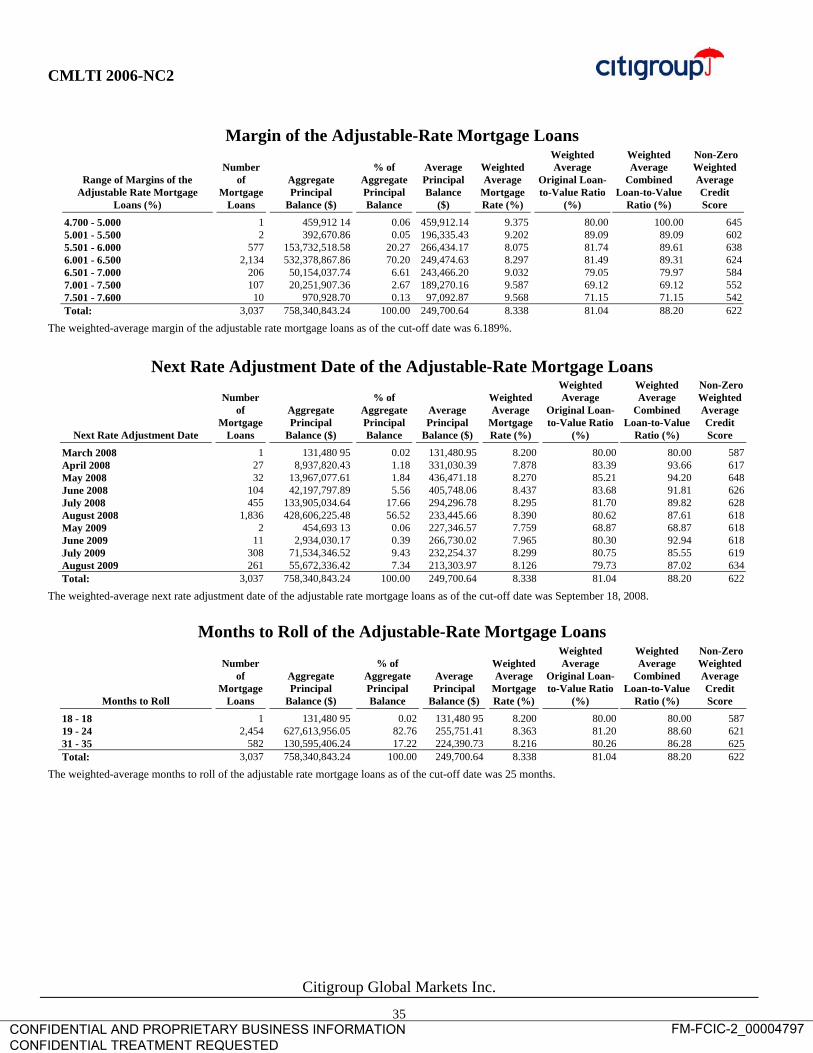
CMLTI 2006-NC2
Citigroup Global Markets Inc.
35
Margin of the Adjustable-Rate Mortgage Loans
Range of Margins of the Adjustable Rate Mortgage
Loans (%)
Number of
Mortgage Loans
Aggregate Principal
Balance ($)
% of Aggregate Principal Balance
Average Principal Balance
($)
Weighted Average
Mortgage Rate (%)
Weighted Average
Original Loan-to-Value Ratio
(%)
Weighted Average
Combined Loan-to-Value
Ratio (%)
Non-Zero Weighted Average Credit Score
4.700 - 5.000 1 459,912 14 0.06 459,912.14 9.375 80.00 100.00 6455.001 - 5.500 2 392,670.86 0.05 196,335.43 9.202 89.09 89.09 6025.501 - 6.000 577 153,732,518.58 20.27 266,434.17 8.075 81.74 89.61 6386.001 - 6.500 2,134 532,378,867.86 70.20 249,474.63 8.297 81.49 89.31 6246.501 - 7.000 206 50,154,037.74 6.61 243,466.20 9.032 79.05 79.97 5847.001 - 7.500 107 20,251,907.36 2.67 189,270.16 9.587 69.12 69.12 5527.501 - 7.600 10 970,928.70 0.13 97,092.87 9.568 71.15 71.15 542Total: 3,037 758,340,843.24 100.00 249,700.64 8.338 81.04 88.20 622
The weighted-average margin of the adjustable rate mortgage loans as of the cut-off date was 6.189%.
Next Rate Adjustment Date of the Adjustable-Rate Mortgage Loans
Next Rate Adjustment Date
Number of
Mortgage Loans
Aggregate Principal
Balance ($)
% of Aggregate Principal Balance
Average Principal
Balance ($)
Weighted Average
Mortgage Rate (%)
Weighted Average
Original Loan-to-Value Ratio
(%)
Weighted Average
Combined Loan-to-Value
Ratio (%)
Non-Zero Weighted Average Credit Score
March 2008 1 131,480 95 0.02 131,480.95 8.200 80.00 80.00 587April 2008 27 8,937,820.43 1.18 331,030.39 7.878 83.39 93.66 617May 2008 32 13,967,077.61 1.84 436,471.18 8.270 85.21 94.20 648June 2008 104 42,197,797.89 5.56 405,748.06 8.437 83.68 91.81 626July 2008 455 133,905,034.64 17.66 294,296.78 8.295 81.70 89.82 628August 2008 1,836 428,606,225.48 56.52 233,445.66 8.390 80.62 87.61 618May 2009 2 454,693 13 0.06 227,346.57 7.759 68.87 68.87 618June 2009 11 2,934,030.17 0.39 266,730.02 7.965 80.30 92.94 618July 2009 308 71,534,346.52 9.43 232,254.37 8.299 80.75 85.55 619August 2009 261 55,672,336.42 7.34 213,303.97 8.126 79.73 87.02 634Total: 3,037 758,340,843.24 100.00 249,700.64 8.338 81.04 88.20 622
The weighted-average next rate adjustment date of the adjustable rate mortgage loans as of the cut-off date was September 18, 2008.
Months to Roll of the Adjustable-Rate Mortgage Loans
Months to Roll
Number of
Mortgage Loans
Aggregate Principal
Balance ($)
% of Aggregate Principal Balance
Average Principal
Balance ($)
Weighted Average
Mortgage Rate (%)
Weighted Average
Original Loan-to-Value Ratio
(%)
Weighted Average
Combined Loan-to-Value
Ratio (%)
Non-Zero Weighted Average Credit Score
18 - 18 1 131,480 95 0.02 131,480 95 8.200 80.00 80.00 58719 - 24 2,454 627,613,956.05 82.76 255,751.41 8.363 81.20 88.60 62131 - 35 582 130,595,406.24 17.22 224,390.73 8.216 80.26 86.28 625Total: 3,037 758,340,843.24 100.00 249,700.64 8.338 81.04 88.20 622
The weighted-average months to roll of the adjustable rate mortgage loans as of the cut-off date was 25 months.
CONFIDENTIAL AND PROPRIETARY BUSINESS INFORMATION CONFIDENTIAL TREATMENT REQUESTED
FM-FCIC-2_00004797

CMLTI 2006-NC2
Citigroup Global Markets Inc.
36
Maximum Mortgage Rate of the Adjustable-Rate Mortgage Loans
Range of Maximum Mortgage Rates of the Adjustable Rate
Mortgage Loans (%)
Number of
Mortgage Loans
Aggregate Principal
Balance ($)
% of Aggregate Principal Balance
Average Principal
Balance ($)
Weighted Average
Mortgage Rate (%)
Weighted Average
Original Loan-to-Value Ratio
(%)
Weighted Average
Combined Loan-to-Value
Ratio (%)
Non-Zero Weighted Average Credit Score
12.500 - 12.500 1 599,842.71 0.08 599,842.71 5.500 77.38 77.38 68812.501 - 13.000 20 6,908,821.69 0.91 345,441.08 5.832 71.11 74.30 67413.001 - 13.500 48 14,572,027.63 1.92 303,583 91 6.371 79.27 84.68 64913.501 - 14.000 168 54,510,153.08 7.19 324,465 20 6.854 76.95 84.45 64414.001 - 14.500 313 95,453,243.71 12.59 304,962.44 7.320 79.42 88.43 64114.501 - 15.000 501 142,521,788.18 18.79 284,474.63 7.782 80.95 91.01 63315.001 - 15.500 497 128,655,647.98 16.97 258,864.48 8.294 80.72 90.33 62415.501 - 16.000 576 134,579,142.79 17.75 233,644 35 8.769 82.08 89.16 61916.001 - 16.500 361 76,682,119.02 10.11 212,415.84 9.273 82.99 86.64 60116.501 - 17.000 301 61,139,328.57 8.06 203,120.69 9.767 83.43 84.80 58817.001 - 17.500 141 25,707,031.04 3.39 182,319 37 10.258 84.06 86.40 58717.501 - 18.000 79 12,117,061.13 1.60 153,380 52 10.705 84.21 84.84 58918.001 - 18.500 21 3,166,839.67 0.42 150,801.89 11.206 77.10 78.24 54418.501 - 19.000 6 1,126,072.94 0.15 187,678.82 11.703 75.84 75.84 54319.001 - 19.400 4 601,723 10 0.08 150,430.78 12.286 71.59 71.59 522Total: 3,037 758,340,843.24 100.00 249,700.64 8.338 81.04 88.20 622
The weighted-average maximum mortgage rate of the adjustable rate mortgage loans as of the cut-off date was 15.336%.
Minimum Mortgage Rate of the Adjustable-Rate Mortgage Loans
Range of Minimum Mortgage Rates of the Adjustable Rate
Mortgage Loans (%)
Number of
Mortgage Loans
Aggregate Principal Balance
($)
% of Aggregate Principal Balance
Average Principal
Balance ($)
Weighted Average
Mortgage Rate (%)
Weighted Average
Original Loan-to-Value Ratio
(%)
Weighted Average
Combined Loan-to-Value
Ratio (%)
Non-Zero Weighted Average Credit Score
4.700 - 5.000 1 459,912.14 0.06 459,912 14 9.375 80.00 100.00 6455.001 - 5.500 2 392,670.86 0.05 196,335.43 9.202 89.09 89.09 6025.501 - 6.000 577 153,732,518.58 20.27 266,434 17 8.075 81.74 89.61 6386.001 - 6.500 2,134 532,378,867.86 70.20 249,474.63 8.297 81.49 89.31 6246.501 - 7.000 206 50,154,037.74 6.61 243,466 20 9.032 79.05 79.97 5847.001 - 7.500 107 20,251,907.36 2.67 189,270 16 9.587 69.12 69.12 5527.501 - 7.600 10 970,928.70 0.13 97,092.87 9.568 71.15 71.15 542Total: 3,037 758,340,843.24 100.00 249,700.64 8.338 81.04 88.20 622
The weighted-average minimum mortgage rate of the adjustable rate mortgage loans as of the cut-off date was 6.189%.
Initial Periodic Cap of the Adjustable-Rate Mortgage Loans
Initial Periodic Cap (%)
Number of
Mortgage Loans
Aggregate Principal Balance
($)
% of Aggregate Principal Balance
Average Principal
Balance ($)
Weighted Average
Mortgage Rate (%)
Weighted Average
Original Loan-to-Value Ratio
(%)
Weighted Average
Combined Loan-to-Value
Ratio (%)
Non-Zero Weighted Average Credit Score
1.000 10 1,593,096.14 0.21 159,309.61 8.824 80.11 81.83 5781.500 247 82,484,909.71 10.88 333,947.00 8.376 82.69 90.65 6232.000 2,780 674,262,837.39 88.91 242,540 59 8.332 80.84 87.91 622Total: 3,037 758,340,843.24 100.00 249,700.64 8.338 81.04 88.20 622
The weighted-average initial periodic cap of the adjustable rate mortgage loans as of the cut-off date was 1.944%.
CONFIDENTIAL AND PROPRIETARY BUSINESS INFORMATION CONFIDENTIAL TREATMENT REQUESTED
FM-FCIC-2_00004798

CMLTI 2006-NC2
Citigroup Global Markets Inc.
37
Subsequent Periodic Cap of the Adjustable-Rate Mortgage Loans
Subsequent Periodic Cap (%)
Number of
Mortgage Loans
Aggregate Principal Balance
($)
% of Aggregate Principal Balance
Average Principal
Balance ($)
Weighted Average
Mortgage Rate (%)
Weighted Average
Original Loan-to-Value Ratio
(%)
Weighted Average
Combined Loan-to-Value
Ratio (%)
Non-Zero Weighted Average Credit Score
1.000 10 1,593,096.14 0.21 159,309.61 8.824 80.11 81.83 5781.500 3,027 756,747,747.10 99.79 249,999 26 8.337 81.04 88.21 622Total: 3,037 758,340,843.24 100.00 249,700.64 8.338 81.04 88.20 622
The weighted-average subsequent periodic cap of the adjustable rate mortgage loans as of the cut-off date was 1.499%.
Historical Delinquency of the Mortgage Loans
Historical Delinquency (Past 12 Months)
Number of
Mortgage Loans
Aggregate Principal Balance
($)
% of Aggregate Principal Balance
Average Principal
Balance ($)
Weighted Average
Mortgage Rate (%)
Weighted Average
Original Loan-to-Value Ratio
(%)
Weighted Average
Combined Loan-to-Value
Ratio (%)
Non-Zero Weighted Average Credit Score
0 X 30 Days Delinquent 4,507 948,626,392.10 100.00 210,478.45 8.425 81.42 87.58 626Total: 4,507 948,626,392.10 100.00 210,478.45 8.425 81.42 87.58 626
CONFIDENTIAL AND PROPRIETARY BUSINESS INFORMATION CONFIDENTIAL TREATMENT REQUESTED
FM-FCIC-2_00004799

CMLTI 2006-NC2
Citigroup Global Markets Inc.
38
Group I Collateral: Summary Statistics for the Mortgage Loans listed below are based on Cut-Off Date scheduled balances.
Minimum Maximum Scheduled Principal Balance: $200,183,326.02
Number of Mortgage Loans 1,190
Average Scheduled Principal Balance: $168,221,28 $29,982.55 $592,000
Weighted Average Gross Coupon: 8.479% 5.800% 12.950%
Non-Zero Weighted Average Original Credit Score: 612 500 796
Weighted Average Original LTV Ratio (1): 79.39% 22.74% 100.00%
Weighted Average Combined LTV Ratio (2): 82.09% 22.74% 100.00%
Weighted Average Stated Remaining Term: 356 118 359
Weighted Average Original Term: 358 120 360
Weighted Average Roll Term: 25 18 35
Weighted Average Gross Margin: 6.260% 5.600% 7.600%
Weighted Average Initial Periodic Rate Cap: 1.967% 1.000% 2.000%
Weighted Average Subsequent Periodic Rate Cap: 1.499% 1.000% 1.500%
Weighted Average Gross Maximum Lifetime Rate: 15.510% 12.800% 19.350%
Weighted Average Gross Minimum Lifetime Rate: 6.260% 5.600% 7.600%
Weighted Average Seasoning: 1 1 6
Weighted Average Origination Date: 07/02/2006 02/21/2006 07/25/2006
Weighted Average First Adjustment Date: 10/02/2008 03/01/2008 08/01/2009 Weighted Average Next Adjustment Date: 10/02/2008 03/01/2008 08/01/2009
Percent Interest Only Loans: 9.60%
Percent Second Liens: 3.04%
Percent of First Lien with Silent Seconds: 14.25%
Non-Zero Weighted Average Debt-To-Income Ratio: 42.08% 20.29% 59 37%
(1) Original LTV = Principal Balance at Origination + Senior Lien Balance (as applicable) / property value (2) Combined LTV = Principal Balance at Origination+ Senior and known Junior Lien Balances (as applicable) / property value
CONFIDENTIAL AND PROPRIETARY BUSINESS INFORMATION CONFIDENTIAL TREATMENT REQUESTED
FM-FCIC-2_00004800

CMLTI 2006-NC2
Citigroup Global Markets Inc.
39
Product Type of the Group I Mortgage Loans
Product Type
Number of
Mortgage Loans
Aggregate Principal Balance
($)
% of Aggregate Principal Balance
Average Principal
Balance ($)
Weighted Average
Mortgage Rate (%)
Weighted Average
Original Loan-to-Value Ratio
(%)
Weighted Average
Combined Loan-to-Value
Ratio (%)
Non-Zero Weighted Average Credit Score
10 Yr Fixed 2 155,419.35 0.08 77,709.67 8.499 66.17 66.17 59215 Yr Fixed 15 1,389,059.92 0.69 92,603 99 8.383 74.66 76.33 63720 Yr Fixed 8 874,131.63 0.44 109,266.45 8.105 74.15 74.15 65525 Yr Fixed 2 473,784.46 0.24 236,892 23 6.956 73.58 73.58 73930 Yr Fixed 317 31,774,897.76 15.87 100,236 27 8.767 79.87 80.95 625Fixed 40/30 Balloon 72 14,764,701.59 7.38 205,065 30 7.599 78.69 80.62 6312/28 Hybrid 234 36,632,955.31 18.30 156,551.09 8.848 79.37 81.79 5892/28 Hybrid Balloon 316 68,967,251.38 34.45 218,250.80 8.470 79.15 81.46 6002/28 Hybrid IO 66 15,408,892.85 7.70 233,468.07 7.907 81.67 91.04 6653/27 Hybrid 90 13,771,163.80 6.88 153,012 93 8.628 78.63 81.38 6193/27 Hybrid Balloon 54 12,156,301.46 6.07 225,116.69 8.548 80.28 81.03 5943/27 Hybrid IO 14 3,814,766.51 1.91 272,483 32 7.976 77.74 87.14 668Total: 1,190 200,183,326.02 100.00 168,221 28 8.479 79.39 82.09 612
Principal Balances of the Group I Mortgage Loans at Origination
Range ($)
Number of
Mortgage Loans
Aggregate Principal Balance
($)
% of Aggregate Principal Balance
Average Principal
Balance ($)
Weighted Average
Mortgage Rate (%)
Weighted Average
Original Loan-to-Value Ratio
(%)
Weighted Average
Combined Loan-to-Value
Ratio (%)
Non-Zero Weighted Average Credit Score
30,000 - 50,000 79 3,165,122.64 1.58 40,064.84 10.933 96.19 96.41 62350,001 - 75,000 150 9,418,627.32 4.71 62,790.85 9.991 84.94 86.91 60475,001 - 100,000 136 11,950,060.09 5.97 87,868.09 8.831 79.10 82.23 612100,001 - 125,000 132 14,914,927.76 7.45 112,991.88 8.722 78.26 82.87 606125,001 - 150,000 115 15,864,027.33 7.92 137,948.06 8.567 76.46 81.10 611150,001 - 175,000 104 16,687,466.19 8.34 160,456.41 8.472 79.85 83.18 608175,001 - 200,000 80 15,056,284.19 7.52 188,203.55 8.394 77.66 80.10 603200,001 - 225,000 93 19,835,710.04 9.91 213,287.20 8.382 78.80 81.23 604225,001 - 250,000 59 14,081,939.38 7.03 238,676.94 8.340 77.48 80.13 606250,001 - 275,000 53 13,893,823.31 6.94 262,147.61 8.007 76.71 78.95 613275,001 - 300,000 57 16,516,393.52 8.25 289,761.29 8.230 78.20 79.34 607300,001 - 333,700 29 9,139,120.82 4.57 315,142.10 8.527 83.60 86.39 630333,701 - 350,000 19 6,517,143.44 3.26 343,007.55 8.390 78.52 81.68 608350,001 - 400,000 64 24,117,998.83 12.05 376,843.73 7.907 79.96 82.26 630400,001 - 500,000 16 6,804,697.99 3.40 425,293.62 8.299 84.71 84.71 629500,001 - 592,000 4 2,219,983.17 1.11 554,995.79 8.433 76.49 81.82 615Total: 1,190 200,183,326.02 100.00 168,221.28 8.479 79.39 82.09 612
The average loan balance of the mortgage loans at origination was $168,328.00.
CONFIDENTIAL AND PROPRIETARY BUSINESS INFORMATION CONFIDENTIAL TREATMENT REQUESTED
FM-FCIC-2_00004801

CMLTI 2006-NC2
Citigroup Global Markets Inc.
40
Principal Balances of the Group I Mortgage Loans as of the Cut-Off Date
Range ($)
Number of
Mortgage Loans
Aggregate Principal Balance
($)
% of Aggregate Principal Balance
Average Principal
Balance ($)
Weighted Average
Mortgage Rate (%)
Weighted Average
Original Loan-to-Value Ratio
(%)
Weighted Average
Combined Loan-to-Value
Ratio (%)
Non-Zero Weighted Average Credit Score
29,982 - 50,000 79 3,165,122.64 1.58 40,064.84 10.933 96.19 96.41 62350,001 - 75,000 151 9,493,601.23 4.74 62,871.53 9.988 84.61 86.56 60475,001 - 100,000 135 11,875,086.18 5.93 87,963.60 8.826 79.33 82.48 612100,001 - 125,000 132 14,914,927.76 7.45 112,991.88 8.722 78.26 82.87 606125,001 - 150,000 115 15,864,027.33 7.92 137,948.06 8.567 76.46 81.10 611150,001 - 175,000 104 16,687,466.19 8.34 160,456.41 8.472 79.85 83.18 608175,001 - 200,000 80 15,056,284.19 7.52 188,203.55 8.394 77.66 80.10 603200,001 - 225,000 93 19,835,710.04 9.91 213,287.20 8.382 78.80 81.23 604225,001 - 250,000 59 14,081,939.38 7.03 238,676.94 8.340 77.48 80.13 606250,001 - 275,000 53 13,893,823.31 6.94 262,147.61 8.007 76.71 78.95 613275,001 - 300,000 57 16,516,393.52 8.25 289,761.29 8.230 78.20 79.34 607300,001 - 325,000 23 7,153,532.00 3.57 311,023.13 8.471 84.94 87.58 636325,001 - 358,700 36 12,395,402.62 6.19 344,316.74 8.246 79.43 83.19 624358,701 - 375,000 16 5,832,535.75 2.91 364,533.48 8.426 79.45 80.69 603375,001 - 425,000 47 18,461,568.27 9.22 392,799.32 7.897 80.83 82.40 630425,001 - 525,000 7 3,244,291.83 1.62 463,470.26 8.106 85.88 85.88 637525,001 - 592,000 3 1,711,613.78 0.86 570,537.93 8.450 72.48 79.40 626Total: 1,190 200,183,326.02 100.00 168,221.28 8.479 79.39 82.09 612
The average loan balance of the mortgage loans as of the cut-off date was $168,221.28.
Gross Mortgage Rates of the Group I Mortgage Loans
Range of Gross Mortgage Rates (%)
Number of
Mortgage Loans
Aggregate Principal Balance
($)
% of Aggregate Principal Balance
Average Principal
Balance ($)
Weighted Average
Mortgage Rate (%)
Weighted Average
Original Loan-to-Value Ratio
(%)
Weighted Average
Combined Loan-to-Value
Ratio (%)
Non-Zero Weighted Average Credit Score
5.800 - 6.000 4 928,093.88 0.46 232,023.47 5.883 64.17 64.17 6456.001 - 6.500 31 7,564,572.20 3.78 244,018.46 6.418 70.95 73.61 6766.501 - 7.000 76 17,637,978.16 8.81 232,078.66 6.816 70.59 72.12 6397.001 - 7.500 118 22,837,742.35 11.41 193,540.19 7.328 75.70 79.95 6297.501 - 8.000 153 29,874,780.43 14.92 195,260.00 7.782 79.61 83.61 6288.001 - 8.500 144 27,976,661.79 13.98 194,282.37 8.279 80.34 84.95 6168.501 - 9.000 178 30,575,366.13 15.27 171,771.72 8.775 80.30 82.93 5979.001 - 9.500 146 23,383,252.19 11.68 160,159.26 9.292 81.44 82.79 5969.501 - 10.000 140 20,404,568.14 10.19 145,746.92 9.777 82.93 83.91 58110.001 - 10.500 62 7,570,038.85 3.78 122,097.40 10.314 85.32 86.93 59310.501 - 11.000 46 5,553,345.98 2.77 120,724.91 10.735 84.13 84.54 57411.001 - 11.500 25 2,467,020.56 1.23 98,680.82 11.221 80.15 80.67 55811.501 - 12.000 30 1,677,687.45 0.84 55,922.92 11.789 99.49 99.49 61912.001 - 12.500 27 1,369,872.29 0.68 50,736.01 12.326 96.17 96.17 59312.501 - 12.950 10 362,345.62 0.18 36,234.56 12.702 100.00 100.00 607Total: 1,190 200,183,326.02 100.00 168,221.28 8.479 79.39 82.09 612
The weighted-average mortgage rate of the mortgage loans as of the cut-off date was 8.479%.
CONFIDENTIAL AND PROPRIETARY BUSINESS INFORMATION CONFIDENTIAL TREATMENT REQUESTED
FM-FCIC-2_00004802

CMLTI 2006-NC2
Citigroup Global Markets Inc.
41
Original Term to Maturity of the Group I Mortgage Loans
Original Term to Maturity (Months)
Number of
Mortgage Loans
Aggregate Principal Balance
($)
% of Aggregate Principal Balance
Average Principal
Balance ($)
Weighted Average
Mortgage Rate (%)
Weighted Average
Original Loan-to-Value Ratio
(%)
Weighted Average
Combined Loan-to-Value
Ratio (%)
Non-Zero Weighted Average Credit Score
120 - 240 25 2,418,610.90 1.21 96,744.44 8.290 73.93 74.89 641241 - 360 1,165 197,764,715.12 98.79 169,755.12 8.481 79.46 82.18 612Total: 1,190 200,183,326.02 100.00 168,221.28 8.479 79.39 82.09 612
The weighted-average original term to maturity of the mortgage loans as of the cut-off date was 358 months.
Remaining Term to Maturity of the Group I Mortgage Loans
Remaining Term to Maturity (Months)
Number of
Mortgage Loans
Aggregate Principal Balance
($)
% of Aggregate Principal Balance
Average Principal
Balance ($)
Weighted Average
Mortgage Rate (%)
Weighted Average
Original Loan-to-Value Ratio
(%)
Weighted Average
Combined Loan-to-Value
Ratio (%)
Non-Zero Weighted Average Credit Score
118 - 120 2 155,419.35 0.08 77,709.67 8.499 66.17 66.17 592121 - 180 15 1,389,059.92 0.69 92,603.99 8.383 74.66 76.33 637181 - 240 8 874,131.63 0.44 109,266.45 8.105 74.15 74.15 655241 - 300 2 473,784.46 0.24 236,892.23 6.956 73.58 73.58 739301 - 359 1,163 197,290,930.66 98.56 169,639.67 8.485 79.48 82.20 612Total: 1,190 200,183,326.02 100.00 168,221.28 8.479 79.39 82.09 612
The weighted-average remaining term to maturity of the mortgage loans as of the cut-off date was 356 months.
Seasoning of the Group I Mortgage Loans
Seasoning (Months)
Number of
Mortgage Loans
Aggregate Principal Balance
($)
% of Aggregate Principal Balance
Average Principal
Balance ($)
Weighted Average
Mortgage Rate (%)
Weighted Average
Original Loan-to-Value Ratio
(%)
Weighted Average
Combined Loan-to-Value
Ratio (%)
Non-Zero Weighted Average Credit Score
1 739 136,340,627.05 68.11 184,493.41 8 320 78.32 81.32 6112 350 50,421,453.22 25.19 144,061.29 8.805 81.00 83.30 6123 69 8,757,073.96 4.37 126,914.12 9.050 85.59 86.51 6304 21 2,964,080.84 1.48 141,146.71 8.727 80.61 80.86 6275 9 1,512,106.39 0.76 168,011.82 8.017 83.33 87.72 6046 2 187,984.56 0.09 93,992.28 9 387 86.01 86.01 596Total: 1,190 200,183,326.02 100.00 168,221.28 8.479 79.39 82.09 612
The weighted-average seasoning of the mortgage loans as of the cut-off date was 1 month.
CONFIDENTIAL AND PROPRIETARY BUSINESS INFORMATION CONFIDENTIAL TREATMENT REQUESTED
FM-FCIC-2_00004803

CMLTI 2006-NC2
Citigroup Global Markets Inc.
42
Original Loan-To-Value Ratio of the Group I Mortgage Loans*
Original Loan-To-Value Ratio (%)
Number of
Mortgage Loans
Aggregate Principal Balance
($)
% of Aggregate Principal Balance
Average Principal
Balance ($)
Weighted Average
Mortgage Rate (%)
Weighted Average
Original Loan-to-Value Ratio
(%)
Weighted Average
Combined Loan-to-Value
Ratio (%)
Non-Zero Weighted Average Credit Score
22.74 - 25.00 1 49,961.76 0.02 49,961.76 7.350 22.74 22.74 65725.01 - 30.00 3 291,324.94 0.15 97,108.31 7.059 27.61 27.61 64030.01 - 35.00 5 1,093,816.98 0.55 218,763.40 7.666 32.44 32.44 58135.01 - 40.00 5 695,242.57 0.35 139,048.51 8.034 38.13 38.13 58940.01 - 45.00 13 1,897,990.27 0.95 145,999.25 7.750 43.31 43.31 57145.01 - 50.00 26 4,150,708.25 2.07 159,642.63 7.846 48.15 48.15 61950.01 - 55.00 29 5,090,833.17 2.54 175,545.97 8.039 53.02 53.02 60055.01 - 60.00 37 6,752,579.01 3.37 182,502.14 7.785 57.73 57.73 59860.01 - 65.00 40 6,785,990.67 3.39 169,649.77 7.735 63.02 63.02 59065.01 - 70.00 67 13,904,385.26 6.95 207,528.14 8.240 68.43 68.67 59970.01 - 75.00 77 16,029,936.31 8.01 208,180.99 8.329 73.76 73.76 58175.01 - 80.00 318 53,576,942.73 26.76 168,480.95 8.278 79.63 89.24 62680.01 - 85.00 159 29,936,815.39 14.95 188,281.86 8.736 84.43 84.91 57885.01 - 90.00 197 36,464,372.77 18.22 185,098.34 8.714 89.66 89.87 62290.01 - 95.00 92 17,461,868.55 8.72 189,802.92 8.542 94.85 94.85 66195.01 - 100.00 121 6,000,557.39 3.00 49,591.38 11.279 99.92 99.92 631Total: 1,190 200,183,326.02 100.00 168,221.28 8.479 79.39 82.09 612
The weighted-average original loan-to-value ratio of the mortgage loans as of the cut-off date was 79.39%.
*Original LTV = Principal Balance at Origination + Senior Lien Balance (as applicable) / property value
Combined Loan-To-Value Ratio of the Group I Mortgage Loans*
Combined Loan-To-Value Ratio (%)
Number of
Mortgage Loans
Aggregate Principal
Balance ($)
% of Aggregate Principal Balance
Average Principal
Balance ($)
Weighted Average
Mortgage Rate (%)
Weighted Average
Original Loan-to-Value Ratio
(%)
Weighted Average
Combined Loan-to-Value
Ratio (%)
Non-Zero Weighted Average Credit Score
22.74 - 25.00 1 49,961.76 0.02 49,961.76 7.350 22.74 22.74 65725.01 - 30.00 3 291,324.94 0.15 97,108.31 7.059 27.61 27.61 64030.01 - 35.00 5 1,093,816.98 0.55 218,763.40 7.666 32.44 32.44 58135.01 - 40.00 5 695,242.57 0.35 139,048.51 8.034 38.13 38.13 58940.01 - 45.00 13 1,897,990.27 0.95 145,999.25 7.750 43.31 43.31 57145.01 - 50.00 26 4,150,708.25 2.07 159,642.63 7.846 48.15 48.15 61950.01 - 55.00 29 5,090,833.17 2.54 175,545.97 8.039 53.02 53.02 60055.01 - 60.00 37 6,752,579.01 3.37 182,502.14 7.785 57.73 57.73 59860.01 - 65.00 40 6,785,990.67 3.39 169,649.77 7.735 63.02 63.02 59065.01 - 70.00 66 13,681,968.58 6.83 207,302.55 8.252 68.44 68.44 59970.01 - 75.00 77 16,029,936.31 8.01 208,180.99 8.329 73.76 73.76 58175.01 - 80.00 161 27,559,901.54 13.77 171,179.51 8.489 79.31 79.31 59680.01 - 85.00 151 28,999,683.78 14.49 192,050.89 8.744 84.28 84.39 57885.01 - 90.00 189 35,579,187.48 17.77 188,249.67 8.678 89.60 89.65 62390.01 - 95.00 106 19,379,125.53 9.68 182,821.94 8.578 93.76 94.86 65995.01 - 100.00 281 32,145,075.18 16.06 114,395.29 8.674 83.98 99.97 650Total: 1,190 200,183,326.02 100.00 168,221.28 8.479 79.39 82.09 612
The weighted-average combined loan-to-value ratio of the mortgage loans as of the cut-off date was 82.09%.
*Combined LTV = Principal Balance at Origination+ Senior and known Junior Lien Balances (as applicable) / property value
CONFIDENTIAL AND PROPRIETARY BUSINESS INFORMATION CONFIDENTIAL TREATMENT REQUESTED
FM-FCIC-2_00004804

CMLTI 2006-NC2
Citigroup Global Markets Inc.
43
Occupancy Type of the Group I Mortgage Loans
Occupancy Type
Number of
Mortgage Loans
Aggregate Principal
Balance ($)
% of Aggregate Principal Balance
Average Principal
Balance ($)
Weighted Average
Mortgage Rate (%)
Weighted Average
Original Loan-to-Value Ratio
(%)
Weighted Average
Combined Loan-to-Value
Ratio (%)
Non-Zero Weighted Average Credit Score
Investor 107 17,520,495 14 8.75 163,742.95 9.331 86.38 86.87 669Primary 1,036 173,848,332 16 86.84 167,807.27 8.389 78.61 80.98 604Second Home 47 8,814,498.72 4.40 187,542.53 8.571 81.00 94.64 664Total: 1,190 200,183,326.02 100.00 168,221.28 8.479 79.39 82.09 612
Property Types of the Group I Mortgage Loans
Property Type
Number of
Mortgage Loans
Aggregate Principal Balance
($)
% of Aggregate Principal Balance
Average Principal
Balance ($)
Weighted Average
Mortgage Rate (%)
Weighted Average
Original Loan-to-Value Ratio
(%)
Weighted Average
Combined Loan-to-Value
Ratio (%)
Non-Zero Weighted Average Credit Score
2-4 Family 73 15,580,298.05 7.78 213,428.74 8.421 76.96 78.42 630Condo 73 11,315,618.45 5.65 155,008.47 8.475 76.89 83.21 637PUD 157 27,233,044.31 13.60 173,458.88 8.566 81.83 85.29 613Single Family 887 146,054,365.21 72.96 164,661.07 8.470 79.40 81.80 608Total: 1,190 200,183,326.02 100.00 168,221.28 8.479 79.39 82.09 612
Loan Purpose of the Group I Mortgage Loans
Loan Purpose
Number of
Mortgage Loans
Aggregate Principal
Balance ($)
% of Aggregate Principal Balance
Average Principal
Balance ($)
Weighted Average
Mortgage Rate (%)
Weighted Average
Original Loan-to-Value Ratio
(%)
Weighted Average
Combined Loan-to-Value
Ratio (%)
Non-Zero Weighted Average Credit Score
Purchase 321 40,263,185.82 20.11 125,430.49 8.993 85 96 94.17 645Cash-Out Refinance 760 140,053,046.84 69.96 184,280.32 8.384 77 12 77.40 599Rate/Term Refinance 109 19,867,093.36 9 92 182,266.91 8.110 82 15 90.72 635Total: 1,190 200,183,326.02 100.00 168,221.28 8.479 79 39 82.09 612
Documentation of the Group I Mortgage Loans
Documentation Type
Number of
Mortgage Loans
Aggregate Principal
Balance ($)
% of Aggregate Principal Balance
Average Principal
Balance ($)
Weighted Average
Mortgage Rate (%)
Weighted Average
Original Loan-to-Value Ratio
(%)
Weighted Average
Combined Loan-to-
Value Ratio (%)
Non-Zero Weighted Average Credit Score
Full / Alt 2 195,345.27 0.10 97,672.64 8.527 80.00 80.00 589Full Doc – 12 Mo. Bk Stmts 37 5,927,248.04 2.96 160,195.89 8.210 73.83 78.89 608Full Doc - 1Yr W2 411 64,768,895.77 32.35 157,588.55 8.172 78.76 80.41 606Full Doc - 24 Mo. Bk Stmts 9 1,917,567.54 0.96 213,063.06 8.322 79.86 83.72 592Full Doc - 2YR W2/Tax Returns 378 56,027,633.52 27.99 148,221.25 8.430 79.50 82.34 597Full Doc – Business Bank Stmts 11 2,632,186.47 1.31 239,289.68 8.926 83.15 85.31 577Limited Doc - 6 Mo. Bk Stmts 13 2,036,623.80 1.02 156,663.37 8.276 84.60 90.23 626Stated Doc 329 66,677,825.61 33.31 202,668.16 8.836 80.10 83.39 634Total: 1,190 200,183,326.02 100.00 168,221.28 8.479 79.39 82.09 612
CONFIDENTIAL AND PROPRIETARY BUSINESS INFORMATION CONFIDENTIAL TREATMENT REQUESTED
FM-FCIC-2_00004805

CMLTI 2006-NC2
Citigroup Global Markets Inc.
44
Lien Position of the Group I Mortgage Loans
Lien Position
Number of
Mortgage Loans
Aggregate Principal Balance
($)
% of Aggregate Principal Balance
Average Principal
Balance ($)
Weighted Average
Mortgage Rate (%)
Weighted Average
Original Loan-to-Value Ratio
(%)
Weighted Average
Combined Loan-to-Value
Ratio (%)
Non-Zero Weighted Average Credit Score
First 1,068 194,102,814.66 96.96 181,744.21 8.391 78.76 81.54 612Second 122 6,080,511.36 3.04 49,840.26 11.289 99.79 99.79 631Total: 1,190 200,183,326.02 100.00 168,221.28 8.479 79.39 82.09 612
Prepayment Penalty Term of the Group I Mortgage Loans
Prepayment Penalty Term (Months)
Number of
Mortgage Loans
Aggregate Principal Balance
($)
% of Aggregate Principal Balance
Average Principal
Balance ($)
Weighted Average
Mortgage Rate (%)
Weighted Average
Original Loan-to-Value Ratio
(%)
Weighted Average
Combined Loan-to-Value
Ratio (%)
Non-Zero Weighted Average Credit Score
None 370 58,026,017.06 28.99 156,827.07 8.916 80.65 83.09 61512 62 14,367,831.20 7.18 231,739.21 8.209 77.19 79.15 62624 478 86,242,068.51 43.08 180,422.74 8.419 79.79 83.02 60036 280 41,547,409.25 20.75 148,383.60 8.087 77.57 79.81 628Total: 1,190 200,183,326.02 100.00 168,221.28 8.479 79.39 82.09 612
Interest Only Term of the Group I Mortgage Loans
Interest Only Term (Months)
Number of
Mortgage Loans
Aggregate Principal
Balance ($)
% of Aggregate Principal Balance
Average Principal
Balance ($)
Weighted Average
Mortgage Rate (%)
Weighted Average
Original Loan-to-Value Ratio
(%)
Weighted Average
Combined Loan-to-Value
Ratio (%)
Non-Zero Weighted Average Credit Score
None 1,110 180,959,666.66 90.40 163,026.73 8.539 79.24 81.23 60660 80 19,223,659 36 9.60 240,295.74 7.920 80.89 90.26 666Total: 1,190 200,183,326.02 100.00 168,221.28 8.479 79.39 82.09 612
CONFIDENTIAL AND PROPRIETARY BUSINESS INFORMATION CONFIDENTIAL TREATMENT REQUESTED
FM-FCIC-2_00004806

CMLTI 2006-NC2
Citigroup Global Markets Inc.
45
Geographic Concentration of the Group I Mortgage Loans
Location
Number of
Mortgage Loans
Aggregate Principal
Balance ($)
% of Aggregate Principal Balance
Average Principal
Balance ($)
Weighted Average
Mortgage Rate (%)
Weighted Average
Original Loan-to-Value Ratio
(%)
Weighted Average
Combined Loan-to-Value
Ratio (%)
Non-Zero Weighted Average Credit Score
California 141 37,913,231.08 18.94 268,888.16 7.887 73.97 75.63 618Florida 146 26,026,153.66 13.00 178,261.33 8.574 79.51 81.87 603New York 42 11,463,959.87 5.73 272,951.43 7.842 76.18 79.16 632Texas 115 10,688,995.78 5.34 92,947.79 8.683 80.48 83.57 608Arizona 61 10,218,530.77 5.10 167,516.90 8.600 79.68 83.64 603New Jersey 43 9,839,217.16 4.92 228,819.00 8.722 81.00 82.35 609Massachusetts 38 8,001,469.21 4.00 210,564.98 8.178 77.17 78.71 612Maryland 39 7,327,270.85 3.66 187,878.74 8.434 77.98 80.78 620Illinois 52 6,401,927.71 3.20 123,113.99 8.819 82.71 85.80 622Pennsylvania 52 5,997,712.04 3.00 115,340.62 8.638 78.57 82.08 609Georgia 40 5,439,272.65 2.72 135,981.82 8.996 86.31 90.04 624Michigan 37 4,693,160.98 2.34 126,842.19 9.462 81.67 83.23 583Virginia 25 4,499,857.75 2.25 179,994.31 8.440 78.20 80.38 607Washington 24 4,392,196.86 2.19 183,008.20 8.262 81.15 84.40 598Nevada 25 4,190,213.96 2.09 167,608.56 8.244 83.30 88.70 622Hawaii 14 3,910,072.86 1.95 279,290.92 8.108 72.60 76.22 644Ohio 38 3,810,549.49 1.90 100,277.62 9.182 86.18 88.78 596Connecticut 19 3,658,464.49 1.83 192,550.76 8.611 82.46 84.65 581Minnesota 22 3,048,970.99 1.52 138,589.59 8.907 82.85 87.40 603Rhode Island 15 3,042,948.94 1.52 202,863.26 9.311 83.31 85.15 613Colorado 21 3,004,404.31 1.50 143,066.87 8.693 86.74 94.29 639New Hampshire 11 1,965,831.46 0.98 178,711.95 8.692 81.48 84.32 609Oregon 11 1,861,451.73 0.93 169,222.88 8.188 80.70 83.70 644Wisconsin 13 1,814,424.42 0.91 139,571.11 9.065 82.48 89.27 627Missouri 18 1,775,333.22 0.89 98,629.62 9.575 85.39 89.55 598Indiana 15 1,692,485.44 0.85 112,832.36 9.165 86.93 87.78 607North Carolina 7 1,570,445.25 0.78 224,349.32 8.383 86.41 89.61 647Alabama 12 1,314,460.02 0.66 109,538.34 9.689 82.77 84.65 560Idaho 6 1,144,737.41 0.57 190,789.57 8.224 79.69 81.62 592Tennessee 13 1,130,205.88 0.56 86,938.91 9.124 82.19 86.42 590New Mexico 7 941,662 24 0.47 134,523.18 8.946 85.95 85.95 628South Carolina 7 865,955 16 0.43 123,707.88 9.048 84.10 88.53 579Iowa 8 796,678 36 0.40 99,584.80 9.704 85.28 87.67 577Maine 4 700,407.07 0.35 175,101.77 7.856 84.19 84.19 612Mississippi 6 639,967.41 0.32 106,661.24 8.815 85.74 85.74 584Arkansas 7 514,755.64 0.26 73,536.52 8.556 83.54 94.46 638Kentucky 6 504,478.09 0.25 84,079.68 8.963 84.20 85.38 675Oklahoma 5 501,904 54 0.25 100,380.91 8.349 88.58 93.77 613District of Columbia 2 484,373 13 0.24 242,186.57 9.377 78.24 78.24 635Kansas 5 453,331.85 0.23 90,666.37 9.709 78.54 78.54 601Louisiana 5 448,024 16 0.22 89,604.83 9.233 84.26 88.90 622Alaska 3 315,807.74 0.16 105,269.25 9.285 84.71 84.71 572Utah 3 298,885 39 0.15 99,628.46 8.673 88.10 96.69 652Montana 2 259,712.61 0.13 129,856.31 8.792 85.61 94.39 628Nebraska 3 251,752 96 0.13 83,917.65 8.831 88.00 96.07 612Delaware 1 237,440 32 0.12 237,440.32 8.450 95.00 95.00 595South Dakota 1 130,233 11 0.07 130,233.11 8.250 80.00 100.00 591Total: 1,190 200,183,326.02 100.00 168,221.28 8.479 79.39 82.09 612
CONFIDENTIAL AND PROPRIETARY BUSINESS INFORMATION CONFIDENTIAL TREATMENT REQUESTED
FM-FCIC-2_00004807

CMLTI 2006-NC2
Citigroup Global Markets Inc.
46
Credit Score of the Group I Mortgage Loans
Credit Score
Number of
Mortgage Loans
Aggregate Principal
Balance ($)
% of Aggregate Principal Balance
Average Principal
Balance ($)
Weighted Average
Mortgage Rate (%)
Weighted Average
Original Loan-to-Value Ratio
(%)
Weighted Average
Combined Loan-to-Value
Ratio (%)
Non-Zero Weighted Average Credit Score
500 - 524 98 16,497,137.38 8.24 168,338.14 9.485 75.66 76.06 513525 - 549 118 20,470,287.38 10.23 173,477.01 9.171 74.54 74.78 537550 - 574 130 22,634,873.77 11.31 174,114.41 8.650 77.41 77.49 562575 - 599 179 26,728,524.01 13.35 149,321.36 8.605 77.90 79.47 588600 - 624 190 29,121,398.60 14.55 153,270.52 8.203 80.80 83.49 612625 - 649 170 29,770,687.50 14.87 175,121.69 8.210 81.05 84.45 637650 - 674 129 22,901,953.14 11.44 177,534.52 8.227 82.58 89.31 660675 - 699 80 14,091,151.75 7.04 176,139.40 8.054 82.01 86.81 685700 - 724 52 10,132,828.92 5.06 194,862.09 7.943 83.77 87.48 711725 - 749 25 3,857,104.53 1.93 154,284.18 8.257 83.46 91.55 735750 - 774 11 2,113,206.68 1.06 192,109.70 7.353 82.47 85.71 760775 - 796 8 1,864,172.36 0.93 233,021.55 7.676 68.39 72.55 784Total: 1,190 200,183,326.02 100.00 168,221.28 8.479 79.39 82.09 612
The non-zero weighted-average credit score of the mortgage loans as of the cut-off date was 612.
Debt-To-Income Ratio of the Group I Mortgage Loans
Debt-To-Income Ratio (%)
Number of
Mortgage Loans
Aggregate Principal
Balance ($)
% of Aggregate Principal Balance
Average Principal
Balance ($)
Weighted Average
Mortgage Rate (%)
Weighted Average
Original Loan-to-Value Ratio
(%)
Weighted Average
Combined Loan-to-Value
Ratio (%)
Non-Zero Weighted Average Credit Score
20.29 - 30.00 126 18,936,113.06 9.46 150,286.61 8.433 76.69 78.10 61130.01 - 40.00 300 47,823,824.44 23.89 159,412.75 8.405 78.01 80.29 61540.01 - 50.00 664 114,941,663.44 57.42 173,104.91 8.561 81.80 85.19 61450.01 - 59.37 100 18,481,725.08 9.23 184,817.25 8.207 70.81 71.58 593Total: 1,190 200,183,326.02 100.00 168,221.28 8.479 79.39 82.09 612
The non-zero weighted-average debt-to-income ratio of the mortgage loans as of the cut-off date was 42.08%.
Index of the Group I Adjustable-Rate Mortgage Loans
Index
Number of
Mortgage Loans
Aggregate Principal
Balance ($)
% of Aggregate Principal Balance
Average Principal
Balance ($)
Weighted Average
Mortgage Rate (%)
Weighted Average
Original Loan-to-Value Ratio
(%)
Weighted Average
Combined Loan-to-Value
Ratio (%)
Non-Zero Weighted Average Credit Score
Six-Month LIBOR 774 150,751,331.31 100.00 194,769 16 8.512 79.47 82.62 607Total: 774 150,751,331.31 100.00 194,769 16 8.512 79.47 82.62 607
CONFIDENTIAL AND PROPRIETARY BUSINESS INFORMATION CONFIDENTIAL TREATMENT REQUESTED
FM-FCIC-2_00004808

CMLTI 2006-NC2
Citigroup Global Markets Inc.
47
Margin of the Group I Adjustable-Rate Mortgage Loans
Range of Margins of the Adjustable Rate Mortgage
Loans (%)
Number of
Mortgage Loans
Aggregate Principal
Balance ($)
% of Aggregate Principal Balance
Average Principal Balance
($)
Weighted Average
Mortgage Rate (%)
Weighted Average
Original Loan-to-Value Ratio
(%)
Weighted Average
Combined Loan-to-Value
Ratio (%)
Non-Zero Weighted Average Credit Score
5.600 - 6.000 126 25,218,857.34 16.73 200,149.66 8.169 80.73 86.22 6316.001 - 6.500 538 102,926,561.54 68.28 191,313.31 8.442 80.54 83.81 6106.501 - 7.000 63 13,960,412.32 9.26 221,593.85 8.938 76.62 76.62 5777.001 - 7.500 42 8,148,667.71 5.41 194,015.90 9.641 67.45 67.45 5467.501 - 7.600 5 496,832.40 0.33 99,366.48 9.989 71.28 71.28 539Total: 774 150,751,331.31 100.00 194,769.16 8.512 79.47 82.62 607
The weighted-average margin of the adjustable rate mortgage loans as of the cut-off date was 6.260%.
Next Rate Adjustment Date of the Group I Adjustable-Rate Mortgage Loans
Next Rate Adjustment Date
Number of
Mortgage Loans
Aggregate Principal
Balance ($)
% of Aggregate Principal Balance
Average Principal
Balance ($)
Weighted Average
Mortgage Rate (%)
Weighted Average
Original Loan-to-Value Ratio
(%)
Weighted Average
Combined Loan-to-Value
Ratio (%)
Non-Zero Weighted Average Credit Score
March 2008 1 131,480 95 0.09 131,480.95 8.200 80.00 80.00 587April 2008 5 870,762 97 0.58 174,152.59 8.678 84.95 92.58 603May 2008 5 965,382 21 0.64 193,076.44 9.037 83.26 83.26 618June 2008 11 2,805,176.34 1.86 255,016.03 8.757 77.83 77.94 625July 2008 92 19,450,020.93 12.90 211,413.27 8.674 80.29 84.28 607August 2008 502 96,786,276.14 64.20 192,801.35 8.467 79.35 82.53 603May 2009 2 454,693 13 0.30 227,346.57 7.759 68.87 68.87 618June 2009 4 468,635.44 0.31 117,158.86 9.603 82.28 91.06 659July 2009 77 14,112,602.54 9.36 183,280.55 8.810 81.37 82.62 603August 2009 75 14,706,300.66 9.76 196,084.01 8.214 77.33 81.47 625Total: 774 150,751,331.31 100.00 194,769.16 8.512 79.47 82.62 607
The weighted-average next rate adjustment date of the adjustable rate mortgage loans as of the cut-off date was October 2, 2008.
Months to Roll of the Group I Adjustable-Rate Mortgage Loans
Months to Roll
Number of
Mortgage Loans
Aggregate Principal
Balance ($)
% of Aggregate Principal Balance
Average Principal
Balance ($)
Weighted Average
Mortgage Rate (%)
Weighted Average
Original Loan-to-Value Ratio
(%)
Weighted Average
Combined Loan-to-Value
Ratio (%)
Non-Zero Weighted Average Credit Score
18 - 18 1 131,480 95 0.09 131,480 95 8.200 80.00 80.00 58719 - 24 615 120,877,618.59 80.18 196,548 97 8.513 79.54 82.78 60531 - 35 158 29,742,231.77 19.73 188,241 97 8.512 79.19 81.98 615Total: 774 150,751,331.31 100.00 194,769 16 8.512 79.47 82.62 607
The weighted-average months to roll of the adjustable rate mortgage loans as of the cut-off date was 25 months.
CONFIDENTIAL AND PROPRIETARY BUSINESS INFORMATION CONFIDENTIAL TREATMENT REQUESTED
FM-FCIC-2_00004809

CMLTI 2006-NC2
Citigroup Global Markets Inc.
48
Maximum Mortgage Rate of the Group I Adjustable-Rate Mortgage Loans
Range of Maximum Mortgage Rates of the Adjustable Rate
Mortgage Loans (%)
Number of
Mortgage Loans
Aggregate Principal
Balance ($)
% of Aggregate Principal Balance
Average Principal
Balance ($)
Weighted Average
Mortgage Rate (%)
Weighted Average
Original Loan-to-Value Ratio
(%)
Weighted Average
Combined Loan-to-Value
Ratio (%)
Non-Zero Weighted Average Credit Score
12.800 - 13.000 4 928,093.88 0.62 232,023.47 5.883 64.17 64.17 64513.001 - 13.500 12 3,448,695.80 2.29 287,391 32 6.431 76.53 82.37 66213.501 - 14.000 39 9,062,448.71 6.01 232,370.48 6.832 70.46 72.32 62714.001 - 14.500 81 16,887,891.09 11.20 208,492.48 7.335 76.16 81.22 62414.501 - 15.000 111 23,287,846.71 15.45 209,800.42 7.795 79.38 83.73 62115.001 - 15.500 117 23,576,815.26 15.64 201,511 24 8.285 80.18 85.40 61715.501 - 16.000 137 25,772,874.75 17.10 188,123 17 8.781 80.35 83.05 59516.001 - 16.500 108 20,071,831.58 13.31 185,850 29 9.295 81.78 83.20 59716.501 - 17.000 95 16,606,395.90 11.02 174,804 17 9.773 83.07 84.11 57817.001 - 17.500 35 5,339,408.29 3.54 152,554 52 10.333 82.65 84.83 59217.501 - 18.000 26 4,285,525.04 2.84 164,827.89 10.721 82.14 82.14 57018.001 - 18.500 8 1,358,537.38 0.90 169,817 17 11.164 73.85 74.79 53419.001 - 19.350 1 124,966 92 0.08 124,966 92 12.350 59.52 59.52 512Total: 774 150,751,331.31 100.00 194,769 16 8.512 79.47 82.62 607
The weighted-average maximum mortgage rate of the adjustable rate mortgage loans as of the cut-off date was 15.510%.
Minimum Mortgage Rate of the Group I Adjustable-Rate Mortgage Loans
Range of Minimum Mortgage Rates of the Adjustable Rate
Mortgage Loans (%)
Number of
Mortgage Loans
Aggregate Principal Balance
($)
% of Aggregate Principal Balance
Average Principal
Balance ($)
Weighted Average
Mortgage Rate (%)
Weighted Average
Original Loan-to-Value Ratio
(%)
Weighted Average
Combined Loan-to-Value
Ratio (%)
Non-Zero Weighted Average Credit Score
5.600 - 6.000 126 25,218,857.34 16.73 200,149.66 8.169 80.73 86.22 6316.001 - 6.500 538 102,926,561.54 68.28 191,313 31 8.442 80.54 83.81 6106.501 - 7.000 63 13,960,412.32 9.26 221,593.85 8.938 76.62 76.62 5777.001 - 7.500 42 8,148,667.71 5.41 194,015 90 9.641 67.45 67.45 5467.501 - 7.600 5 496,832.40 0.33 99,366.48 9.989 71.28 71.28 539Total: 774 150,751,331.31 100.00 194,769 16 8.512 79.47 82.62 607
The weighted-average minimum mortgage rate of the adjustable rate mortgage loans as of the cut-off date was 6.260%.
Initial Periodic Cap of the Group I Adjustable-Rate Mortgage Loans
Initial Periodic Cap (%)
Number of
Mortgage Loans
Aggregate Principal Balance
($)
% of Aggregate Principal Balance
Average Principal
Balance ($)
Weighted Average
Mortgage Rate (%)
Weighted Average
Original Loan-to-Value Ratio
(%)
Weighted Average
Combined Loan-to-Value
Ratio (%)
Non-Zero Weighted Average Credit Score
1.000 2 383,326.77 0.25 191,663 39 7.727 82.05 82.05 5891.500 49 9,249,878.59 6.14 188,773.03 8.642 79.36 82.17 6072.000 723 141,118,125.95 93.61 195,184 13 8.506 79.47 82.65 607Total: 774 150,751,331.31 100.00 194,769 16 8.512 79.47 82.62 607
The weighted-average initial periodic cap of the adjustable rate mortgage loans as of the cut-off date was 1.967%.
CONFIDENTIAL AND PROPRIETARY BUSINESS INFORMATION CONFIDENTIAL TREATMENT REQUESTED
FM-FCIC-2_00004810

CMLTI 2006-NC2
Citigroup Global Markets Inc.
49
Subsequent Periodic Cap of the Group I Adjustable-Rate Mortgage Loans
Subsequent Periodic Cap (%)
Number of
Mortgage Loans
Aggregate Principal Balance
($)
% of Aggregate Principal Balance
Average Principal
Balance ($)
Weighted Average
Mortgage Rate (%)
Weighted Average
Original Loan-to-Value Ratio
(%)
Weighted Average
Combined Loan-to-Value
Ratio (%)
Non-Zero Weighted Average Credit Score
1.000 2 383,326.77 0.25 191,663 39 7.727 82.05 82.05 5891.500 772 150,368,004.54 99.75 194,777 21 8.515 79.46 82.62 607Total: 774 150,751,331.31 100.00 194,769 16 8.512 79.47 82.62 607
The weighted-average subsequent periodic cap of the adjustable rate mortgage loans as of the cut-off date was 1.499%.
Historical Delinquency of the Group I Mortgage Loans
Historical Delinquency (Past 12 Months)
Number of
Mortgage Loans
Aggregate Principal Balance
($)
% of Aggregate Principal Balance
Average Principal
Balance ($)
Weighted Average
Mortgage Rate (%)
Weighted Average
Original Loan-to-Value Ratio
(%)
Weighted Average
Combined Loan-to-Value
Ratio (%)
Non-Zero Weighted Average Credit Score
0 X 30 Days Delinquent 1,190 200,183,326.02 100.00 168,221 28 8.479 79.39 82.09 612Total: 1,190 200,183,326.02 100.00 168,221 28 8.479 79.39 82.09 612
CONFIDENTIAL AND PROPRIETARY BUSINESS INFORMATION CONFIDENTIAL TREATMENT REQUESTED
FM-FCIC-2_00004811

CMLTI 2006-NC2
Citigroup Global Markets Inc.
50
Rating Agency Contacts
Standard & Poor’s
Moody’s DBRS
CONFIDENTIAL AND PROPRIETARY BUSINESS INFORMATION CONFIDENTIAL TREATMENT REQUESTED
FM-FCIC-2_00004812