Cities and Climate Change Initiative Making … About UN-HABITAT’s Cities and Climate Change...
70
Making Carbon Markets Work for Your City: A Guide for Cities in Developing Countries CITIES AND CLIMATE CHANGE INITIATIVE TOOL SERIES
Transcript of Cities and Climate Change Initiative Making … About UN-HABITAT’s Cities and Climate Change...

Making Carbon Markets Work for Your City:A Guide for Cities in Developing Countries
CITIES AND CLIMATE CHANGE INITIATIVETOOL SERIES
UNITED NATIONS HUMAN SETTLEMENTS PROGRAMMECities and Climate Change Initiative P.O. Box 30030, 00100 Nairobi, KenyaTel: +254 20 7625404 • Fax: +254 20 7623715Email: [email protected] • www.unhabitat.org/ccci www.unhabitat.org
“Making Carbon Markets Work for Your City” is part of UN-Habitat’s Cities and Climate Change Initiative tool series for local government officials and urban professionals in developing countries who have to deal with the growing problems of climate change. This work seeks to enhance the capacity of local government officials to initiate, develop and manage greenhouse gas reduction projects, and to get the carbon financing they need. It explains to local governments that although there are many barriers to launching and implementing such projects, there are also many advantages and opportunities to be derived.
Other publications in this series are:
• Local Leadership for Climate Action
• Developing local Climate Change Plans – A Guide for Cities in Developing Countries
• Planning for Climate Change – A Strategic, Values-Based Approach for Urban Planners
• Participatory Climate Change Assessments - A Toolkit Based on the Experience of Sorsogon City, the Philippines
All documents are downloadable from www.unhabitat.org/ccci

Making Carbon Markets Work for Your City:A Guide for Cities in Developing Countries
Copyright © United Nations Human Settlements Programme(UN-HABITAT), 2012
HS Number: HS/013/12E
ISBN Number (Series): 978-92-1-132400-6
ISBN Number (Volume): 978-92-1-132427-3
DIScLAIMER
The designations employed and the presentation of material in this document do not imply the expression of any opinion whatsoever on the part of the Secretariat of the United Nations concerning the legal status of any country, territory, city or area or of its authorities, or concerning the delimitation of its frontiers or boundaries, or regarding its economic system or degree of development. The analysis conclusions and recommendations of this publication do not necessarily reflect the views of the United Nations Human Settlements Programme or its Governing Council.
United Nations Human Settlements Programme (UN-HABITAT)P.O. Box 30030, GPO Nairobi 00100, KenyaTel: + 254 20 762 1234Fax: + 254 20 762 3092Website: www.unhabitat.org
AckNOwLEDGEMENTS
Principal coordinating author: Lucinda Fairhurst
contributors: Bernhard Barth, Anton Cartwright, Iole Isiassaias, David Githaiga, Robert Kehew, Vincent Kitio, Derek Morgan, Debapriya Roy, Andrew Rudd, Raf Tuts
coordinator: Bernhard Barth
Design and layout: Gideon Mureithi/UNON
Editors: Tom Osanjo and Fernando Cabrera Diaz
Printing: UNON, Publishing Services Section, Nairobi, ISO 14001:2004-certified

Making Carbon Markets Work for Your City:A Guide for Cities in Developing Countries

ii
About UN-HABITAT’s Cities and Climate Change Initiative:
Headquarted at UN-Habitat in Nairobi, the Cities and Climate Change Initiative (CCCI) involves the participation of more than 20 cities worldwide. It targets medium-sized cities in developing and least-developed countries and emphasizes good gover nance and practical initiatives for the mu nicipalities and their citizens. The CCCI team has adapted participatory processes developed previously by UN-Habitat so as to specifically address climate change is sues within the city. A complementary set of tools is being developed to support cit ies in raising awareness on the impact of climate change and undertaking mitiga tion and adaptation activities.
Since 2008, CCCI has been generously supported by the Government of Norway, the United Nations Development Account, the Cities Alliance, the Government of Sweden and other sources of global, regional, national and local funding. Newsletters of the Cit ies and Climate Change Initiative are peri odically published electronically.
For more information, or to be added to our mailing list, [email protected] or visit www.unhabitat.org/ccci
About ICLEI – Local Governments for sustainability:
ICLEI Local Governments for Sustainability is an international association of local governments and local government organisation that have made a commitment to sustainable development. Over 1300 cities, towns, counties and their associations worldwide comprise ICLEI’s growing membership. ICLEI works with these and hundreds of other local governments through international performance based, results oriented campaigns and programmes to support local government in the implementation of sustainable development at the local level. In the climate and sustainable energy field.
The ICLEI Africa Secretariat was the lead ICLEI partner in the development of this tool and is one of many ICLEI regional offices. The ICLEI African Secretariat works across the African continent and collaborates closely with the global ICLEI network and other regional offices around the world, in sharing tools, materials, strategies and good practices specifically designed and implemented at the local level.
For more information, see: www.iclei.org

iii
Table of ConTenTs
Acronyms ix
1. IntroduCtIon 1
1.1 Cities and Climate Change 1
1.2 Climate Change Mitigation: an Opportunity for Sustainable Development 1
1.3 The Objectives of this Handbook 2
2 PArt A: overvIeW of the CleAn develoPMent MeChAnIsM And verIfIed eMIssIon reduCtIon MArkets 4
2.1 Overview of the Carbon Market 4
2.2 Overview of the Clean Development Mechanism process 8
2.3 An Overview of the Verified Emission Reduction process 8
2.4 Current thinking regarding the Carbon Market 8
2.5 Why Local Governments might participate in the Carbon Market 10
2.6 How Clean Development Mechanism can contribute towards Sustainable Development 10
2.7 Clean Development Mechanism and Poverty Reduction Opportunities 11
2.8 Carbon Project Participants and Stakeholders 12
3 PArt B: strAtegIC deCIsIons In the ConCePtuAlIzAtIon of A loCAl governMent CArBon trAdIng ProjeCt 14
3.1 Decision 1: Is there a project here? 15
3.2 Decision 2: Is the project “additional” 15
3.3 Decision 3: Which methodology will be used? 16
3.4 Decision 4: What scale will the project be? 20
3.5 Decision 5: Will this be a Clean Development Mechanism or a voluntary market project? 20
3.6 Decision 6: How will the project be financed? 21
4 PArt C: CrItICAl stePs for suCCessful ProjeCt develoPMent And trAdIng 28
4.1 Identify Project Champions and Institutional Arrangements 28
4.1.1 Overcoming financial barriers 31
Making Carbon Markets Work for Your City | A Guide for Cities in Developing Countries

iv
4.1.2 Additional Certification: Environmental and Social Sustainability 35
4.2 The need for project documentation 35
4.3 Securing Designated National Authority approval 37
4.4 Project validation 38
4.5 Registration and Approval from the Executive Board 39
4.6 Credible monitoring 39
4.7 Verification 40
4.7.1 Securing reasonable terms and prices 40
4.8 Issuance 41
5 loCAl governMent ProjeCts As A solutIon to CleAn develoPMent MeChAnIsM BArrIers 42
6 further reAdIng And resourCes 45
7 Annexes 47
7.1 Best Practice Standards 47
7.1.1 The Gold Standard 47
7.1.2 The Voluntary Carbon Standard 47
7.1.3 The Chicago Carbon Exchange 48
7.1.4 The Climate, Community and Biodiversity Standard 48
7.1.5 The Validation and Verification Manual Standard 49
7.2 Roles and Responsibilities of the Designated National Authority 49
7.3 Low Hanging Fruit 51
7.4 Sample Project Idea Note 52

vMaking Carbon Markets Work for Your City | A Guide for Cities in Developing Countries
figures
Figure 1: Cumulative emissions of CO2 by Country 1900-2002 2
Figure 2: Annual Volumes (MtCO2e) of Project-Based Emission Reductions Transactions 4
Figure 3: Volumes (MtCO2e) and Prices for Kyoto offset Transactions (CDM and ERU since 2002) 5
Figure 4: Growth of the Clean Development Mechanism market 2005-2008 5
Figure 5: Location of Clean Development Mechanism Projects 6
Figure 6: A representation of an emissions reduction project 7
Figure 7: Carbon Project Participants and Stakeholders 12
Figure 8: An overview of Project Conceptualisation 14
Figure 9: An overview of financial viability 22
Figure 10: Outline of steps in carbon market development 28
Figure 11: What is the price of a Certified Emission Reduction or Verified Emission Reduction? 40

vi
Case sTudies
Case Study 1: Energy Efficient Street Lights, Madhya Pradesh (India) 25
Case Study 2: Kuyasa Low-Cost Housing Energy Upgrade Project, Cape Town (South Africa) 26
Case Study 3: Landfill Gas and Electricity Generation at Mtoni Dumpsite, Dar es Salaam (Tanzania) 27
Case Study 4: Quezon City Controlled Disposal Facility Biogas Emission Reduction Project, Quezon City (Philippines) 27
Case Study 5: Durban Landfill Gas-to-Electricity, eThekwini (South Africa) 29
Case Study 6: Mwanza City Council Landfill Clean Development Mechanism Project, Nyamagana District (Tanzania) 30
Case Study 7: Bus Rapid Transit in Bangkok, Bangkok (Thailand) 31
Case Study 8: Nelson Mandela Bay: Understanding the Costs of Clean Development Mechanism, Port Elizabeth (South Africa) 32
Case Study 9: Abidjan Municipal Solid Waste-To-Energy Project, Abidjan (Cote d’Ivoire) 33
Case Study 10: Lake Basin Management, Laguna de Bay (Philippines) 34

viiMaking Carbon Markets Work for Your City | A Guide for Cities in Developing Countries
Tables
Table 1: Examples of Sustainable Development Criteria and Indicators for Local Governments 10
Table 2: Approved Small-Scale Methodologies Project Summary August 2009 (Source: http://cdmpipeline.org/) 18
Table 3: Table providing values obtained when applying the GHG calculations formulae 35
Table 4: Number of Clean Development Mechanism projects “registered automatically”, “registered after review” and rejected or withdrawn before and after April 2007 39
Table 5: The Validation and Verification Manual approach to restoring Clean Development Mechanism credibility by introducing a checklist derived from Kyoto 48
Table 6: Evaluation of Project Benefits by Host Countries 51
TexT boxes
Text Box 1: Adaptation and Mitigation 3
Text Box 2: Differences between Verified Emission Reduction and Clean Development Mechanism 3
Text Box 3: Reducing Emissions from Deforestation and Degradation Projects 17
Text Box 4: South African Example 23
Text Box 5: Emissions Reduction Purchase Agreements 41
Text Box 6: How might a Local Government Carbon Portfolio work in Practice? 43
Text Box 7: The importance of the correct geographical spread and technological mix 50

viii
aCronyms
Afolu Agriculture, Forestry and Other Land Use
AMs Approved Small-Scale Methodologies
A&r Afforestation and Reforestation
Cers Certified Emission Reductions
CdM Clean Development Mechanism
CCB Climate, Community and Biodiversity
Co2e Carbon dioxide equivalent
dnA Designated National Authority
doe Designated Operational Entity
erPA Emissions Reduction Purchase Agreements
eru Emission Reduction Unit (Joint Implementation Mechanism)
fdI Foreign Direct Investment
ghg Greenhouse Gas
IPCC Intergovernmental Panel on Climate Change
loA Letter of Approval
luluCf Land use, land use change and forestry
MWh Megawatt hour
nMB New Methodology: Baseline
nMM New Methodology: Monitoring
PACe Promoting Access to Carbon Equity
PIn Project Identification Note
Pdd Project Design Document
redd Reducing Emissions from Deforestation and Degradation
sWh Solar Water Heater
unfCCC United Nations Framework Convention on Climate Change
vCs Voluntary Carbon Standard
vers Verified Emission Reductions
vvM Validation and Verification Manual

1Making Carbon Markets Work for Your City | A Guide for Cities in Developing Countries
1. inTroduCTion
1.1 Cities and Climate Change
In recent years, the impacts of climate change have been experienced by communities and authorities across the world. Higher temperatures caused by rising atmospheric concentrations of greenhouse gases (GHGs) are the catalyst for these impacts. At the local level this has caused greater frequency and intensity of flooding, storm surges and sea-level rise, increased wind speeds and fires. The implications of these impacts tend to be more severe in countries characterised by low levels of physical and institutional infrastructure and, as a result, climate change is having a disproportionately adverse impact on the poor.
The realisation that climate change impacts are already affecting communities and undermining poverty alleviation has seen a growing and necessary emphasis on climate change adaptation. This should not detract, however, from the need to decouple economic development and the emissions of greenhouse gases by introducing renewable energy and energy efficiency measures, improved water and waste management systems, material/resource efficiency, clean coal technologies, etc. Climate change mitigation presents both a necessity for developing countries and an opportunity to develop their economics and societies in ways that are cleaner, safer, potentially cheaper and more sustainable.
Industrialised countries have contributed the bulk of past greenhouse gas emissions (see figure 1) and under the United Nation’s Framework Convention on Climate Change (UNFCCC) it is industrialised countries that have the chief responsibility for reducing their GHG emissions. Furthermore, they are required to finance the transition of less developed countries towards an environmentally sustainable future.
The beginning of the 21st century witnessed, for the first time, a tilt in the world’s population from a predominantly rural based population to an urban one. A decade on, the rate of urbanization in developing countries has skyrocketed and more than 90 per cent of the world’s urban population growth is currently taking place in these countries (UN-HABITAT)1. The
1 UN-HABITAT (2011) Cities and Climate Change. Global Repot on Human Settlements 2011.
2 International Energy Agency (IEA) (2008), World Energy Outlook 2008, IEA, Paris,
growing rate of urbanization has been correlated to increasing rate of greenhouse gas emissions; emissions from activities such as energy consumption, transport and land-use change are typically urban related. As such, cities have an important role to play in the global climate change framework; they are home to over half the world’s population and although they occupy only 2 per cent of the world’s surface, they emit over 70 per cent of greenhouse gases. For example it is estimated that 71 per cent of energy related GHG emissions are from urban areas of industrialized and developing countries (IEA) 2.
With this said, it is within cities that adaptation and mitigation measures will be most effective as cities are the centre of knowledge, financial resources, social transformation and development of ‘green’ technology. Considerable reductions in greenhouse gas emissions can be achieved within cities by influencing consumer choices or introducing clean technologies or simply setting greenhouse gas reduction targets for the city. This is because responses to global climate change policies are more immediate in cities, where the public and decision makers interface more effectively and can influence policy. Through innovation, best practice standards and a commitment to low-carbon growth, cities from both the developed and developing world are emerging as important implementers of climate change mitigation action.
1.2 Climate Change Mitigation: An Opportunity for Sustainable Development
As early as the 1980s, the international community began to recognise that human-induced GHG emissions were contributing to changes in global temperatures and that this was likely to have an impact on Earth’s climate. After the establishment of the International Panel on Climate Change (IPCC), the United Nations entered into negotiations on a framework convention on climate change, which resulted in an international treaty called the United Nations Framework Convention on Climate Change (UNFCCC) which came into effect in 19943. Following the UNFCCC, a legally binding set of obligations were developed for a

2
FIGURE 1: CUMULATIvE EMISSIoNS oF Co2 BY CoUNTrY 1900-2002
number of industrialised countries known as Annex 1 countries (see appendix 8 for a list of these countries), who committed themselves to reducing their GHG emissions. This is known as the Kyoto Protocol and it established various mechanisms by which signatory parties are able to fulfil their obligations.
There are three main mechanisms that have been developed through the Kyoto protocol:
i. International Emissions Trading allows Parties to the Kyoto Protocol4 to trade some of their GHG emission allowances with other countries.
3 UNEP (2004) The UNEP project CD4CDM: Information and Guidebook. Second edition. UNEP: Denmark.
4 Including national and local governments
5 IPCC (2001). Climate Change 2001: Synthesis Report. A Contribution of Working Groups I, II, III to the Third Assessment Report of the Intergovernmental Panel on
Climate Change. Cambridge University Press: Cambridge and New York.
6 For discussion, see Section 2.1, below.
7 Winkler, H. (2008) Cleaner Energy, Cooler Climate: Developing Sustainable Energy Solutions for South Africa. HSRC Press.
8 See for example Cartwright and Cooper, 2006
ii. Joint implementation allows Annex 1 countries of the Kyoto Protocol to claim credits that arise through their investment in other Annex 1 countries.
iii. Clean Development Mechanism allows Parties to the Kyoto Protocol to invest in projects in developing countries which reduce GHG emissions and contribute towards sustainable development.
The Clean Development Mechanism is the only way in which developing countries (termed ‘non-Annex 1 Countries’ under the UNFCCC) can participate in the United Nations regulated emissions trading market; but more importantly, the Clean Development Mechanism is a mechanism by which developed countries can contribute towards both climate change mitigation and sustainable development in developing countries. More specifically, the Clean Development Mechanism presents opportunities for developing countries to embark on a number of projects (classified under 15 sectoral scopes, discussed later in section 3.3) such as energy, manufacturing, transport and waste handling, that are partially financed by any Annex 1 country or countries who are seeking ways to partially reduce their emissions reduction liabilities. Local governments in non-Annex 1 countries should take advantage of this opportunity to contribute to their own development needs and goals.
COP17, held in Durban, between 28 November and 11 December 2011, advanced the implementation of the Kyoto Protocol. Under the so-called “Durban Platform” the Parties agreed to adopt a universal legal agreement on climate change as soon as possible, and no later than 2015. The binding agreement, which is to take effect in 2020, will for the first time include developing countries (such as China and India), as well as the United States which was not a signatory to the Kyoto Protocol.
1.3 The Objectives of this Handbook
The carbon market has evolved rapidly since its formalisation under the UNFCCC in 20026, and now represents a complex, and some would argue impenetrable7, set of procedures and methodologies. There have been a number of calls for local governments to engage more actively in the carbon market8. These calls are based on a growing involvement of local
100,000
303,03486,281
United StatesRussian Federation
ChinaGermany
United KingdomJapan
FranceIndia
UkraineCanadaPoland
ItalySouth Africa
AustraliaKhazakstan
SpainCzech Rep.
BelgiumNetherlands
RomaniaUzbekistan
SwedenBelarusAustria
HungaryDenmarkSlovakiaBulgariaGreece
FinlandSwitzerland
Serbia and MontenegroAzerbaijan
TurkmenistanNorway
PortugalIreland
IsraelNew Zeland
EstoniaLithuania
CroatiaMoldova Rep.
Bosnia and HerzegovinaLuxembourg
SloveniaGeorgia
LatviaTajikistan
KyrgyzstanMacedonia FYR
ArmeniaAlbaniaIcelandMalta
80,80471,729
54,14143,662
27,67823,08323,05322,57220,679
17,01012,38811,2149,5359,2559,1359,0858,1836,5615,6503,9103,7963,7733,7393,2423,0633,0122,3362,2442,2402,1081,8721,6481,6441,5621,5011,3231,2169738317046986416115655475414974013832442108561
Mio tons CO2
timeforchange.org
200,000 300,000 400,000
Source: Timeforchange, 2008

3Making Carbon Markets Work for Your City | A Guide for Cities in Developing Countries
governments in matters of sustainable local socio-economic development. It is without a doubt that focusing on public service productivity and innovation will provide opportunities to use the strong public sector to develop new sustainable forms of economic development to meet local needs and promote social well-being. The reality, however, is that combining the delivery of basic goods and services with developmental activities represents a challenge for which many local governments are ill-prepared due to limited human, fiscal and skill capacity.
The objective of this tool is to inform and capacitate local government officials so as to assist them in initiating, developing and managing Clean Development Mechanism and Verified Emission Reduction projects within their cities, towns or regions. There are a number of key areas of local government competencies that city officials may want to target when implementing carbon trading projects, including town and urban planning, infrastructure development, service provision, waste management, energy provisioning and transportation. It is the objective of this tool to provide environmental, planning and development officials at the local government level with clear guidance on how to develop Clean Development Mechanism and Verified Emission Reduction projects (see Text Box 2 for an overview of the differences between the Clean Development Mechanism and Verified Emission Reduction).
Through this tool, local governments will come to understand that, although confronted with many
barriers when embarking on a Clean Development Mechanism or Verified Emission Reduction project, there are also many opportunities for developing these projects. The tool also aims to improve the facilitation of carbon trading projects developed through partnerships with investors, Non-Governmental Organisations (NGOs) and utility companies, by local governments.
Part A of this document provides an overview of the carbon market. This section describes both Clean Development Mechanism and voluntary market processes, reasons why local governments might want to engage with this market and the potential for carbon market transactions to contribute to environmental sustainability and poverty alleviation. Part A concludes with a mapping of the respective project participants and stakeholders in the carbon market.
Part B describes the strategic decisions that need to be taken in order to identify and assess the potential of embarking on a carbon trading project. By answering these questions, local government officials will be able to answer the question, “is there a project”?
Part C outlines the specific steps to follow in developing a successful carbon trading project, once the initial conceptualisation has been completed.
Throughout this document the emphasis is on the role that local governments might play in supporting and developing carbon trading projects. Case studies are included in the document by way of illustration.
Adaptation and Mitigation According to the IPCC (2001)5, adaptation refers the adjustment in natural or human systems in response to actual or expected climatic stimuli or their effects, which moderates harm or exploits beneficial opportunities. On the other hand, mitigation refers to an anthropogenic intervention to reduce the sources or enhance the sinks of greenhouse gases.
Differences between verified Emission reduction and the Clean Development MechanismIn order to participate in the Clean Development Mechanism, both Parties to the Kyoto Protocol (non-Annex 1 and Annex 1 Parties) must:
(1) Be involved voluntarily, (2) have established a national Clean Development Mechanism authority, and (3) must have ratified the Kyoto Protocol. Furthermore, the project must prove additionality and that it contributes towards sustainable development. The outcome of a United Nations registered Clean Development Mechanism project or programme is Certified Emission Reduction certificates, which can be traded on the carbon market.
On the other hand, Voluntary Emission Reduction projects generate Verified Emission Reduction certificates that are not subject to United Nations approval. These projects can be easier and less costly to develop than Clean Development Mechanism projects.
TExT BOx 1: ADApTATIoN AND MITIGATIoN
TExT BOx 2: ADApTATIoN AND MITIGATIoN

4
2. ParT a: overview of The Clean develoPmenT meChanism and verified emission reduCTion markeTs
2.1 Overview of the Carbon Market
The carbon market involves the trading of Certified Emissions Reductions generated by Clean Development Mechanism projects and Verified Emissions Reductions generated by “voluntary market” projects (figure 2). The Certified Emission Reduction market is not regulated by any specific body, however the United Nations Clean Development Mechanism Executive Board supervises project submissions and serves as the point of contact for Clean Development Mechanism project participants in registration and issuances of Certified Emission Reductions. The Verified Emission Reduction market, which mimics the United Nations Clean Development Mechanism market, is formalised under a variety of certifying bodies.
The Kyoto Protocol, of which the market is a product, establishes legally binding commitments for signatories for the reduction of four greenhouse gases (carbon dioxide, methane, nitrous oxide, sulphur hexafluoride) and two groups of greenhouse gases (hydrofluorocarbons and perfluorocarbons). The different gases have a varying effect on climate change due to their different chemical properties and lifespan in the atmosphere. Guidelines established under the Kyoto Protocol equate the gases to an equivalent-CO
2
value based on the global warming potential9 of the respective gases. One metric tonne of atmospheric CO
2
per year equates to 1 Certified Emission Reduction, but one tonne of methane, which has a much higher global warming potential, provides 21 Certified Emission Reductions, a tonne of Nitrous Oxide provides
2008 2009
volume (mtCO
2e)
value(USD million)
volume (mtCO
2e)
value(USD million)
Primary Clean Development Mechanism
404 6,511 211 2,678
JI 25 367 26 354
Voluntary market 57 419 46 338
Total 486 7,297 283 3,370
FIGURE 2: ANNUAL voLUMES (MtCo2e) AND vALUES (USD) For proJECT-BASED TrANSACTIoNS.11 Joint Implementation (JI) projects involve two Annex 1 countries. It should be noted that records of Verified Emission Reduction transactions are difficult to verify and there are grounds for suspecting that the voluntary market is larger than the data suggest
9 The global warming potential of the tradable gases is itself influenced by the lifetime of the gases, but for CDM purposes the UNFCCC relies on estimates provided by the
Intergovernmental Panel on Climate Change. http://ghg.unfccc.int/gwp.html
10 While at present (December 2009) the CDM just addresses emissions reductions up to 2012, it is very likely that the CDM or some variation on this mechanism will continue
past that year under a new enabling framework.
11 Downloaded from: http://siteresources.worldbank.org/INTCARBONFINANCE/Resources/State_and_Trends_of_the_Carbon_Market_2010_low_res.pdf
(accessed May 2010)
Source: World Bank

5Making Carbon Markets Work for Your City | A Guide for Cities in Developing Countries
310 Certified Emission Reductions and a tonne of the fluoride gases provide 140 – 23,000 Certified Emission Reductions. For the complete list of CO
2 equivalents see:
http://ghg.unfccc.int/gwp.html.
The carbon market is premised on the fact that it makes no difference to the atmospheric concentration of GHGs where in the world emissions of these gases are reduced, but it can be cheaper to reduce them in developing countries than in industrialised countries,. Under the Kyoto Protocol, industrialised country signatories (Annex 1 countries) face varying obligations to curb their emissions, relative to their 1990 level of emissions. On average, this obligation amounts to a 5.2 per cent reduction in GHG emissions by the end of 201210. Developing country signatories face no obligations prior to 2012, but may develop projects that reduce emissions and sell the resulting ‘credits’ to Annex 1 countries so as to assist the developed nations in meeting their obligations. This is the key economic argument for the Clean Development Mechanism wherein, emission-reduction or emission removal projects in developing countries are allowed to earn certified emission reduction credits, each equivalent to one tonne of CO
2 (carbon dioxide).
These Certified Emission Reductions can be traded and sold, and used by industrialized countries to meet
700
2002 2003 2004 2005 2006 2007 2008 2009
Annual average prices(US$ per tCO2e)
Annual volumes(mtCO2e)
18
16
14
12
10
8
6
4
2
0
600
500
400
300
200
100
0
FIGURE 3: voLUMES (MTCo2E) AND prICES For KYoTo oFFSET TrANSACTIoNS (CDM AND ErU SINCE 2002) - Vintage up to end-2009.12
FIGURE 4: GroWTH oF THE CLEAN DEvELopMENT MECHANISM MArKET 2005-2008
May 2005(SB22)
May 2006
May 2007
Nov 2008
0 500 1,000 1,500 2,000 3,000 4,0002,500 3,500 4,500
Registered project activities
Projected Certified Emission Reductions, each equivalent to 1 tonne of carbon dioxide
All figures as at 24 November 2008
Projects in pipeline (includes registered project activities
No. of Projects/Certified Emission Reductions before 2012 (millions)
Growth in projects, pipeline, projected Certified Emission Reductions
0
114
100
39
471
530
183
750
940
December 2005(CMP 1)
685
1,600
1,900
1,231
4,200
2,900
12 Downloaded from: http://siteresources.worldbank.org/INTCARBONFINANCE/Resources/State_and_Trends_of_the_Carbon_Market_2010_low_res.pdf
(accessed May 2010)
Source: World Bank

6
600
500
400
300
200
100
0
China72%
India, 2%
R of Asia, 5%
Africa, 7%
Central Asia, 5%
Brazil, 3%
R of Latin America, 4%
Other & Unsp., 7%
ChinaR of AsiaAfrica Latin AmericaOther & Unsp.
2002-09 2009
Prim
ary
Cle
an D
evel
opm
ent
Mec
hani
sm a
nnua
l vol
umes
tra
nsac
ted
(MtC
O2e
)
2002 2003 2004 2005 2006 2007 2008 2009
a part of their emission reduction targets under the Kyoto Protocol. The mechanism stimulates sustainable development and emission reductions, while giving industrialised countries some flexibility in how they meet their emission reduction targets.
The opportunity for a Clean Development Mechanism or Verified Emission Reduction project arises when an intervention reduces the amount of emissions that would usually be produced by an activity. The emissions reductions that result are represented by the difference between the emissions in the “business as usual” case and the case after the intervention, and can be traded on the carbon market. See figure 6 for a representation of how to calculate emissions reductions. However only emissions reductions from Clean Development Mechanism projects count towards an Annex 1 country’s emission targets as agreed under the Kyoto Protocol.
Figures currently available for 2009, as of end-July (i.e. 7 months), indicate that the Clean Development Mechanism was responsible for removing the equivalent of 315 million tonnes of carbon dioxide from the atmosphere. Cumulative estimates for the voluntary market are hard to come by, but these projects have potentially reduced a further 300 million tons of carbon dioxide. In 2008, the Clean Development Mechanism market was worth approximately USD3.5 billion, while the voluntary market was worth USD1.2 billion.
The Clean Development Mechanism market continues to represent the mainstay of the global carbon market and the number of projects registering in this market has increased progressively over the past three years
(See Figure 4). In May 2005, 100 million Certified Emission Reductions were projected; by November 2008 that figure had risen substantially, to 2900 million Certified Emission Reductions, the equivalent of 2900 million tons of carbon dioxide emissions reductions. Although the amount of GHG reductions seems substantial, in reality the total volume of traded carbon credits represents less than 2 per cent of the volume of GHGs that are emitted every year, and this volume of emissions continues to increase annually.
Figure 5 shows where Clean Development Mechanism projects have been registered internationally, as of 2008. Notable features of carbon trades to date include the concentration of projects in relatively few non-Annex 1 countries; the concentration of projects being in India, China, Brazil and Mexico. Furthermore, less than 2 per cent of the total credits are traded with African countries.
The voluntary carbon market predates the United Nations regulated component of the carbon market, but has evolved rapidly in recent years. In many ways this evolution has been in response to the perceived lack of flexibility and high transaction costs of the Clean Development Mechanism market, but the voluntary market has been criticised for being poorly regulated and unaccountable.
Broadly speaking Verified Emission Reductions can be earned through either:
• The voluntary market, which involves credits that are very similar to those generated by Clean Development Mechanism projects and which are
FIGURE 5: LoCATIoN oF CLEAN DEvELopMENT MECHANISM proJECTS13
13 Downloaded from: http://siteresources.worldbank.org/INTCARBONFINANCE/Resources/State_and_Trends_of_the_Carbon_Market_2010_low_res.pdf
(accessed May 2010)
Source: State and Trends of Carbon market 2010

7Making Carbon Markets Work for Your City | A Guide for Cities in Developing Countries
certified by a recognised agency, but are not subject to United Nations approval. Verified Emission Reduction credits are kept in a number of registries to ensure that total credits are quantified and to prevent developers selling the same credits twice. There are a growing number of institutional buyers (companies, governments and brokers) satisfied with the rigour of the Verified Emission Reduction market and actively buying these credits. These credits are considered as assets and can be traded or sold from one owner/organisation to another and are able to retain, increase or lose value dependent upon the market and the owners’ choice (like other traditional trading commodities such as gold).Verified Emission Reduction credits, in comparison with the following (off-set market), can be purchased and sold on. Most of these Verified Emission Reduction projects still require the involvement of a Designated Operating Entity; which unfortunately retains the chief transaction cost in these projects.
• The voluntary off-set market is another market that is, to a further degree, less formal that those discussed above. This market is often referred to as the ‘charismatic’ market as it tends to involve individuals and small scale transactions from projects that purport to reduce emissions (in the short/immediate time frame) and often deliver
other desirable development outcomes such as afforestation, poverty reduction, biodiversity conservation and soil improvement. The level of rigour and information provided in support of these transactions varies greatly, but the most effective off-set projects apply accepted Clean Development Mechanism methodologies and calculation methods, while avoiding some of the transaction costs associated with Certified Emission Reduction and Verified Emission Reduction projects. Unlike the Verified Emission Reduction market (above), these credits are not traded, they are purchased and retired after purchase to reduce a specific footprint (e.g. an airline reducing their carbon footprint by planting trees).
The number of recorded trades in the Verified Emission Reduction market is reported to have grown by 87 per cent in 2008 and accounted for at least 54 million tonnes of emissions reductions in that year. This figure represents approximately 15 per cent of the total project-based carbon market14. Furthermore, the price of voluntary market credits increased by 20 per cent in 2008 and, unlike with the Clean Development Mechanism, renewable energy projects accounted for over half of all credits traded in the Verified Emission Reduction market, suggesting an orientation away from large industrial projects.
FIGURE 6: A rEprESENTATIoN oF AN EMISSIoNS rEDUCTIoN proJECT. Where a project or programme (A) deliberately reduces the level of GHG emissions relative to the ‘business as usual’ case, the difference can be sold as carbon credits to countries, individuals or companies seeking to reduce their emissions (Promoting Access to Carbon Equity, 2009)
Carbon dioxide equivalent emission
Time
Intervention
Reduced emission rate as a result of intervention
Volume of emission reduction
Baseline - emission that would have taken place if nothing changed
14 Ecosystem Market Place (2009) State of the Voluntary Carbon Market. Available at: www.EcosystemMarketPlace.com

8
When considering whether a project would be best developed for the Clean Development Mechanism or Verified Emission Reduction market, the project developer may want to consider the scale of the project and the extent to which it includes positive social and environmental impacts over and above emission reductions. This is particularly true of smaller projects (less than 3,000 tonnes of emissions reductions per year) that may struggle to finance the transaction costs associated with the Clean Development Mechanism.
At its best, the voluntary market mimics many tenets of the Clean Development Mechanism market. Projects should be additional, emissions savings should be calculated relative to a baseline and all credits and sales should be verified and recorded in a registry. In its first few years (1998-2003) the voluntary market occasionally ignored these rules, selling poorly quantified credits into unregulated markets. After criticism of its approach, the voluntary carbon market sector began formulating rules and developing a process of self-regulation. As a result, most voluntary market credits are now certified under one of a number of certification standards and most European Union countries are only able to trade in these certified credits. One of the challenges of trading these credits is providing enough information to the market to enable buyers to be satisfied with their credibility. Most institutional buyers will insist on independently certified voluntary market standards (see Section 7.1. for more information on voluntary markets).
2.2 Overview of the Clean Development Mechanism process
Clean Development Mechanism projects represent a particular type of carbon market activity. A project requires that an intervention is identified which, if implemented, will lead to a reduction in CO
2
emissions. That volume of emissions reductions can be sold on an international carbon market but will require that a number of formal steps be taken. These steps include those that are taken on conceptualisation of a project, which leads to the initiation and management of a project. The steps, therefore, include a number of different activities including project conceptualisation, choosing a baseline and monitoring methodology, assessing the feasibility of the project, submitting various project documents to national and international bodies for approval, monitoring the project, verification of the Certified Emission Reductions and issuance of the certificates. Section B of this document gives an overview of the decisions that need to be made when conceptualising a Clean Development Mechanism project, whilst Section C contains a step-by-step guide to the implementation of the project.
2.3 An Overview of the Verified Emission Reduction process
For certified Verified Emission Reduction projects the process is very similar to that of Clean Development Mechanism projects, with the exception that the Clean Development Mechanism does not require notification or a registration fee and credits are not issued by the Clean Development Mechanism Executive Board, but by the certifying body.
Where voluntary carbon projects are not certified under one of the recognised standards (See Annex 7 for the most common standards), the onus is on the project developers to provide as much information on the carbon calculus, the beneficiaries, the process of establishing additionality and the carbon registry. See, for example, the video and accompanying information produced by Promoting Access to Carbon Equity in South Africa on one of its uncertified Verified Emission Reduction projects. Visit their web-page at: http://www.carbon.org.za/. Efforts such as these give the project credibility and allow investors to trace the impact of their money.
2.4 Current thinking regarding the Carbon Market
The carbon market is ever changing, evolving and becoming more accepted. In terms of the Clean Development Mechanism market, whereas in the beginning there were issues related to the modalities of implementation, as the Clean Development Mechanism has evolved (together with lessons learnt from the Verified Emission Reduction market) its effectiveness in issuing Certified Emission Reductions has improved; the introduction of small scale project methodologies, the adjustment of registration fees and the creation of the Adaptation funds are all examples of the Clean Development Mechanism’s response to governments and public demands. Furthermore, the fact that the Clean Development Mechanism Executive Board is vigilant about the validation and verification procedures of Certified Emission Reductions, makes project participants and governments more certain of the validity of emission reductions under the Clean Development Mechanism.
Recently, the carbon market has suffered a slight set-back due to i) the global economic crisis and ii) the uncertainty of post-kyoto, i.e. once the first commitment period 2008-2012 under the Protocol comes to an end. There has been progress on this, COP15 adopted a ‘Copenhagen Accord’ which recognised, although did not adopt nor did coutnries agree on legally binding targets, the importance of keeping global temperature rises

9Making Carbon Markets Work for Your City | A Guide for Cities in Developing Countries
below 2°C. COP15 also saw further refinement of the Clean Development Mechanism in terms of the introduction of appeals and shortened time frame in processing Certified Emission Reductions. The following year in Cancun restored confidence in the Kyoto Protocol in particular with the agreement to establish a market and non-market mechanism as well as the 2°C temperature target included in a COP agreement for the first time. During COP17, held in Durban in 2011, the Parties agreed to adopt a new post-Kyoto universal binding agreement on climate change no later than 2015. The agreement will for this first time include developing countries as well as the United States, which had refused to sign the Kyoto Protocol. Furthermore industrialized countries have set ambitious internal targets for reducing GHG emissions which can be met in conjunction with purchasing carbon credits, for example the EU set a target to reducing its emissions by 20 per cent below 1990 levels by 2020 which it is currently achieved half of due in part to the Clean Development Mechanism market. Lastly, the sheer size of the Clean Development Mechanism market of USD 6.5 billion in 2008, though dropping to USD 2.7 billion due to the global crisis, offers a promising future for addressing climate change through financial incentives as happens under a carbon market.
With this said, there are critics of the carbon market who cite a combination of technical and moral problems with carbon trading, in both the Clean Development Mechanism and the voluntary market. Technical opposition refers to high transaction costs and the cumbersome and confusing methodologies. The Clean Development Mechanism has also been cited as delaying the reduction of GHG emissions, and an associated behavioural change in the industrialized countries, and generally failing to contribute significantly to international GHG abatement requirements15. As one critic states, the associated investment and financial flows that are expected through the Clean Development Mechanism have been less than what was originally anticipated16 and the Clean Development Mechanism has failed in many respects to serve the development needs of the developing world and promote technological exchange.
Moral criticisms focus on the ability of rich countries to “buy their way out of trouble”. This has sparked debate about the extent to which developed countries should be allowed to meet their reduction commitments through Clean Development Mechanism activities. Furthermore, notions of neo-imperialism have been mentioned by critics as an outcome of the Clean Development Mechanism due to the exchange of technologies, activities and finance between powerful rich developed countries and poor developing countries; technologies and activities which may serve the interests of the powerful while overlooking the interests of the host country17.
What much of the criticism fails to appreciate is the context in which the market emerged and the original intention of this market. Article 12 of the Kyoto Protocol defines the aim of the Clean Development Mechanism: “The purpose of the Clean Development Mechanism shall be to assist Parties not included in Annex I in achieving sustainable development and in contributing to the ultimate objective of the UNFCCC and to assist Parties included in Annex I in achieving compliance with their quantified emission limitation and reduction commitments under article 3”. If effective, the Clean Development Mechanism will:
i. Provide a means of reducing the cost of switching to renewable energy technologies and meeting GHG emissions reduction targets
ii. Assist in the transfer of sustainable development18 technology that is capable of promoting sustainable development in non-Annex 1 countries.
As such, the carbon market is a means to an end, and not an end in itself. Where effective, the carbon market should simply direct investment to the point of lowest marginal GHG abatement cost. The carbon market is accountable to, but not responsible for, the prevention of climate change and the promotion of sustainable development including poverty alleviation. The prevention of “catastrophic climate change19” will only be achieved on the back of political will to cut GHG emissions. The carbon market should not be
15 Liverman, D. and Boyde, E. (2008) The CDM, Ethics and Development. In Olsen, K.H. and Fenhann, J. (eds) A Reformed CDM – including new mechanisms for
sustainable development. Riso Centre, UNEP. Available at: http://www.cd4cdm.org/Publications/Perspectives/ReformedCDM.pdf
16 Lutken, S.E. (2008) Developing Country Financing for Developed Country Commitments? In Olsen, K.H. and Fenhann, J. (eds) A Reformed CDM – including new
mechanisms for sustainable development. Riso Centre, UNEP.
17 Liverman and Boyde (2008) ibid
18 Sustainable development in this context is defined by the World Commission on Environment and Development (the Brutlandt Commission) as, ‘development that meets the
needs of the present without compromising the ability of future generations to meet their own needs’.
19 The threat of “catastrophic climate change” which is usually linked to the release of methane hydrates from thawing perma-frost and the collapse of the thermo-haline forces
that drive ocean currents has been described by the Pentagon (2004), the Royal Geographic Society (2005) , Friends of the Earth (2005) and The British Antarctic Survey team
(2005) amongst others.

10
burdened with the full responsibility for climate change mitigation, but rather should be supplementary to other approaches to reduce GHG emissions. Furthermore it should be seen as an instrument to reduce greenhouse gas emissions while leap frogging ‘green’ technological advances and their application.
2.5 Why Local Governments might participate in the Carbon Market
In providing an overview, this document explores some of the reasons for the developing world’s absence from this market and provides guidelines to increase the capacity of local governments to engage with this market, specifically with reference to local governments in developing countries. Increased and more effective action in the carbon market is deemed important for local governments in developing countries due to the following:
• Roughly USD 7 billion worth of investment will pass through the market prior to 2012 and local governments in developing countries should compete for their share of this revenue.
• The market has the ability to assist local governments in delivering much needed
renewable energy, energy efficiency and transport technologies to their communities.
• Carbon trading projects are able to contribute to broader sustainable development objectives including biodiversity conservation, air quality improvement, water efficiency and a reduction in energy poverty.
However, it is difficult to conduct a successful carbon trading project, and very easy to naively conduct a carbon project that has financially and environmentally adverse consequences, consequences which may have been overlooked during the project initiation and development stages. Governments and developers looking to enter the carbon market need to equip themselves with all relevant information prior to getting involved.
2.6 How the Clean Development Mechanism can contribute towards Sustainable Development
Contributing to sustainable development in non-Annex 1 countries was implicit in the design of the
TABLE 1: ExAMpLES oF SUSTAINABLE DEvELopMENT CrITErIA AND INDICATorS For LoCAL GovErNMENTS
SUSTAINABLE DEvELopMENT CrITErIA INDICATorS
ECoNoMIC
Local GDP Increase in local businesses and markets
Local employment Growth in long-term and permanent job opportunities
Local economic development Growth in private and public sector
ENvIroNMENTAL
Air pollution Decrease in local air pollution
Water Cleaner rivers and healthy wetlands
Waste Improved waste management
Biodiversity The conservation of local and regional biodiversity
SoCIAL
Water security Access to adequate water and sanitation for all
Energy Security Access to sustainable energy solutions
Food Security Improved urban agriculture and access to markets
Poverty alleviation Improved livelihoods for all
Improve equity Improved distribution of resources
Source: http://www.cairn.info/revue-economie-internationale-2004-3-page-9.htm

11Making Carbon Markets Work for Your City | A Guide for Cities in Developing Countries
Clean Development Mechanism, but a survey of projects registered in 2007 showed that most projects were unlikely to fulfil the objective of sustainable development, even if they were able to reduce GHG emissions20. As an analysis of the Clean Development Mechanism states, “sustainable development in the Clean Development Mechanism relates to the measurement and monitoring of a project’s social, economic and ecological contributions and is currently assessed by the host country, but it is poorly defined”21
The Clean Development Mechanism legislation requires that projects comply with host country sustainability criteria and conform to host country development priorities. It is for this reason that Clean Development Mechanism projects require the approval of the non-Annex 1 country’s Designated National Authority prior to being submitted to the Clean Development Mechanism Executive Board for approval. Some of these host country priorities may include: better and more efficient energy production, biodiversity support, social and economic development and transfer of technologies. In practise, ensuring compliance with local legislation and development priorities is only possible if local authorities are aware of the project and are able to monitor project progress.
2.7 Clean Development Mechanism and Poverty Reduction Opportunities
The Clean Development Mechanism has the potential to contribute to job creation and service delivery at the local level and, by reducing the concentration of atmospheric GHGs, the Clean Development Mechanism makes a contribution to mitigating climate change risks that impact disproportionately on the poor. In reality it has proven very difficult to integrate the Clean Development Mechanism and poverty alleviation. Due to the differing Certified Emission Reduction accreditation schemes, the quality of offsets remains highly variable and low quality, cheaper offsets will be the most price competitive in a market in which standards are hard to monitor and enforce. It would therefore stand to reason that the cheaper, easier to access accreditations (i.e. the Verified Emission Reduction and offset markets) will therefore become the most competitive within the carbon market as they do not hold the same
remunerative constraints upon initiation as the Clean Development Mechanism. To elaborate further, the Clean Development Mechanism market requires a substantial amount of ‘front-end’ funding in order to ensure that the emissions are adequately recognised and certified by the United Nations, and are therefore often associated with long term projects that take time to recuperate the initial investment. The Verified Emission Reduction market on the other hand, enables the credits to be recognised as an asset and thus allowing and enabling trading, so the investment and trade processes are similar to those that are already well established, mainstreamed and well understood. These credits can be accredited through cheaper and locally recognised independent auditors, which therefore means that access to the market and direct remuneration for the credits and thus financial return and/or gain is often a much quicker and simpler process. In the case of the offset market, the transaction is able to be rapid and can therefore serve the immediate purpose abating once-off emission peaks.
The choice of accreditation scheme is often dependent upon the motivation behind the provision of the offset. Where the offset is motivated by profit maximisation, the providers are often deterred from entering the Clean Development Mechanism due to the aforementioned costs and rigorous standards. As stated,this is often due to the high transaction costs, the long turn-around time, but equally the requirement for Clean Development Mechanism projects to be large-scale, or to involve industrial gas emissions, makes it difficult to focus projects on individual needs. The Clean Development Mechanism does have the potential to impact on inter-generational equity and can contribute towards the fulfilment of Millennium Development Goals22; but combining the Clean Development Mechanism with environmental co-benefits whilst also adhering to the strict regulations by the UNFCCC has proven difficult. In other cases where the offset provision is motivated by other goals (i.e. poverty alleviation, and/or conserving biodiversity and natural ecosystems) emissions reduction is not the primary motive, but rather an added benefit and may then be treated as such with resulting lack of knowledge, care and attention. Due to these difficulties, many poverty alleviating and environmentally focussed carbon trading projects would rather trade on the voluntary market where there are a number of different regulators and standards combined with a shorter and more flexible process.
20 Sutter, C. and Parreno, J.C. (2007) Does the Current Clean Development Mechanism deliver its Sustainable Development Claim? An analysis of officially registered CDM
projects. Climatic Change, 84: 75-90.
21 Liverman and Boyde (2008) op cit at pg 48
22 UNEP. CDM Sustainable Development Impacts. UNEP CD4CDM series. UNEP Risø Centre on Energy, Climate and Sustainable Development: Denmark.
12
2.8 Carbon Project Participants and Stakeholders
A Clean Development Mechanism project will engage with, and involve, a number of people or entities. In general, the following project participants and stakeholders will be involved:
• project Initiator or proponent: That person or entity involved in conceptualising and initiating a Clean Development Mechanism project. This part of the project involves assessing whether a potential project is institutionally and financially viable. The Project Initiator will often communicate with a potential Certified Emission Reduction buyer, before initiating a Clean Development Mechanism project, in order to access upfront investments or to guarantee the purchase of credits.
• project Developer or Coordinating/Managing entity: That person or (more commonly) company who manages the development of the project, including the investments in technology and infrastructure required to realise the greenhouse gas saving. This Clean Development Mechanism participant must be recognised by the host country Designated National Authority and has the capacity
to communicate with the Clean Development Mechanism Executive Board. Typically the project developer will also oversee the project monitoring and reporting.
• project Investors or Financiers: Banks or financial institutions that provide loans for project development or invest in a project in exchange for a share of profits or credits. It is not unusual, however, for the same entity who initiates a project to finance or develop a project.
• Beneficiary: The people or entities in the host country that will ultimately benefit from a Clean Development Mechanism project, through the transfer of credits, technology or services. Ideally, but not necessarily, project beneficiaries also receive a portion of Certified Emission Reduction or Verified Emission Reduction revenue and can be considered owners of the future Certified Emission Reductions.
• The Designated National Authority: is the body granted responsibility by a Party (Host country, in this case) to authorise and approve participation in Clean Development Mechanism projects within a country, and that is responsible for the ensuring that the project contributes to
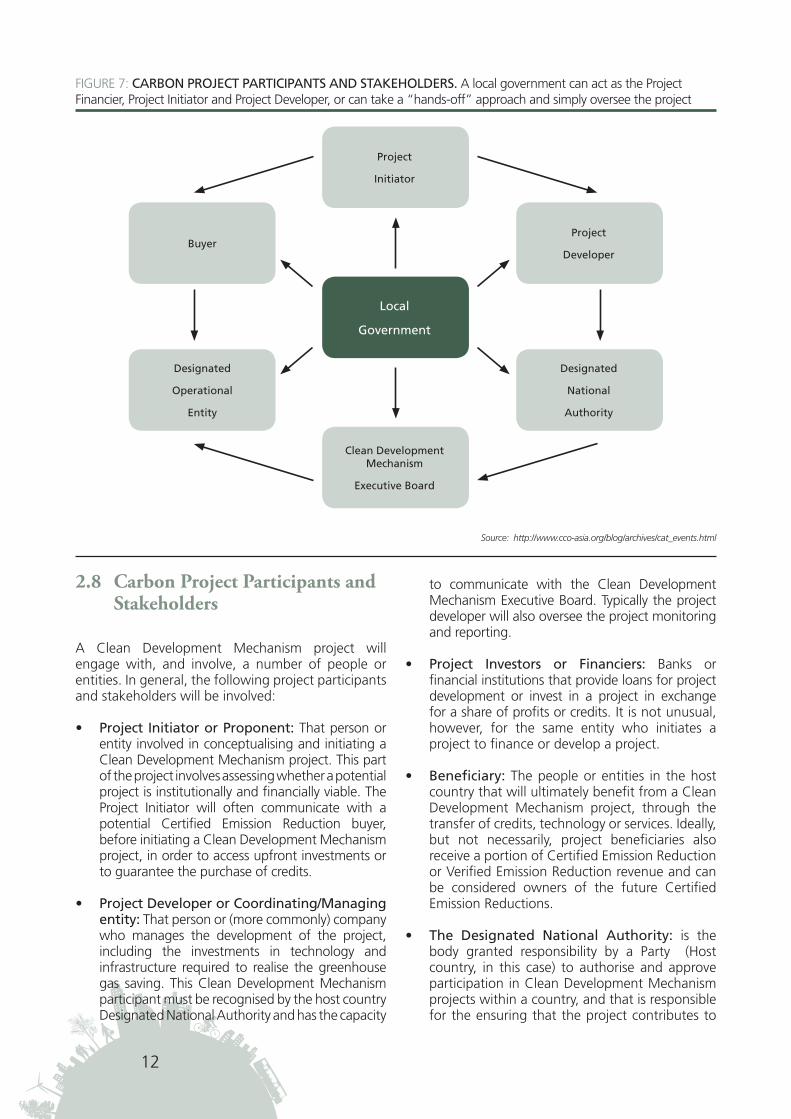
FIGURE 7: CArBoN proJECT pArTICIpANTS AND STAKEHoLDErS. A local government can act as the Project Financier, Project Initiator and Project Developer, or can take a “hands-off” approach and simply oversee the project
project
Initiator
project
Developer
Designated
National
Authority
Buyer
Designated
operational
Entity
Local
Government
Clean Development Mechanism
Executive Board
Source: http://www.cco-asia.org/blog/archives/cat_events.html

13Making Carbon Markets Work for Your City | A Guide for Cities in Developing Countries
the country’s goal of sustainable development and complies with national legislation. Project documentation cannot be approved by the Clean Development Mechanism Executive Board unless it has been previously approved by the host country Designated National Authority.
• Clean Development Mechanism Executive Board: The United Nation’s body, created through the UNFCCC, responsible for registering Clean Development Mechanism projects, maintaining a centrally collated record of issued Certified Emission Reductions and approving project methodologies.
• Designated operating Entity: This entity, typically a private multi-national company, has to be accredited with the Clean Development Mechanism Executive Board and plays the role of an auditor in verifying and certifying actual project GHG reductions.
• Buyer: The person or entity which purchases the Certified Emission Reductions.
Figure 7 illustrates the key players in a typical Clean Development Mechanism or Verified Emission Reduction project and the relationships between them. It is not unusual, however, for the same entity who initiates a project to finance or develop a project.
As a minimum, local governments in host countries have an oversight role; ensuring sustainability criteria are satisfied, participation is adequate and that the project complies with local development objectives. What Figure 7 aims to convey, in addition, is that local governments can play a more central role as project developers, financiers or initiators. This may be crucial in potential Clean Development Mechanism projects which require the use of public space or infrastructure or which relate directly to the provision of services for local communities. For example, local governments may have the mandate to develop transport infrastructure within the urban area. As a core function, the local government
can use its existing transport budget and skilled employees to implement a transport-related Clean Development Mechanism project, such as a mass rapid transit system. Other examples of popular Clean Development Mechanism projects at local government level include waste management, which has resulted in a number of landfill-to-energy projects, and energy efficiency in public buildings. Indeed, when trying to understand why Asian countries have so successfully deployed the Clean Development Mechanism one of the reasons involves the role as initiator, financier and developer played by government departments and agencies in this region relative to those in other countries of the world, especially those in Africa (see Case Study 9 which shows the first Clean Development Mechanism project in West Africa and the only one to date in this region).
Even in projects that will result in carbon revenue, fiscal investment by local govenments holds one of the keys for non-Annex 1 countries to unlock carbon market potential, provided this approach is also able to satisfy the “additionality” criteria.
Part B and Part C of this guidebook will give local governments throughout the developing world guidance on how to identify, conceptualise, implement and manage a Clean Development Mechanism project in their city or town. The ’decision-making trees’ will guide the developers through the critical decisions regarding each step in the process. When barriers may be encountered, these are discussed and case studies provided which indicate ways in which other Clean Development Mechanism project developers have overcome these.
The process of developing a carbon trading project is complex, but similar for both Clean Development Mechanism and Verified Emission Reduction projects. Part B identifies the major decisions that are required during project conceptualisation; and Part C identifies the key steps in project development. Throughout Part B, case studies are used to illustrate how these decisions and steps manifest in practice.

14
3. ParT b: sTraTegiC deCisions in The ConCePTualizaTion of a loCal governmenT Carbon Trading ProjeCT
There are several basic questions which can guide the steps of the Clean Development Mechanism project development process (see figure 8). Depending
on the responses to the basic questions asked, the project development and trading will be guided as such. The essential underlying strategic guides to be
Yes
<5000
no
>30,000
Yes
CertIfIed eMIssIon reduCtIon
Yes
no
verIfIed eMIssIon reduCtIon
no
Is there a project?
Project Development and Trading
(1) Are there “additional” GHC emis-sions reductions
(3) What is the scale
(tCO2/annum
(2) Is there a methodology?
Register a new methodology
Select Verified Emission Reduction standard
(4) Voluntary or Clean Development Mechanism?
(5) Financially viable?
Project Developer equity or bank finance
Donor funding or government funding/ equity
5000-30,000
FIGURE 8: AN ovErvIEW oF proJECT CoNCEpTUALISATIoN

15Making Carbon Markets Work for Your City | A Guide for Cities in Developing Countries
followed are discussed below in detail. The Clean Development Mechanism project development process is summarised in figure 8.
3.1 Decision 1: Is there a project here?
The initial step in any project involves identifying a potential carbon trading opportunity. As awareness of this market grows, so too does the ability to identify the type of potential that is likely to lead to a project. It is a natural progression for initial enthusiasm for the carbon market to be followed by the naive assumption that “everything can be a carbon trading project”, to disillusion over how difficult it can be to turn potential projects into actual projects, followed by an informed ability to identify those opportunities that have a reasonable chance of progressing through the project cycle.
Ideally government officials, businesses and NGOs should have sufficient understanding of the market to identify and conceptualise potential projects. This tool seeks to overcome any deficiencies in the knowledge of local government officials; however, some outside knowledge may be necessary. For example, technical experts can determine whether or not these projects contain sufficient merit to be developed.
Article 12 of the Kyoto Protocol stipulates the four official eligibility criteria with which all projects should comply:
i. Projects must receive approval from the host country and must benefit the host country.
ii. Projects must assist host countries in achieving sustainable development. It is incumbent on the host country to define their sustainable development criteria.
iii. Projects must result in measurable long-term benefits towards climate change mitigation. Leakages – or the potential for adverse effects – must be identified, monitored and accounted for in the carbon calculus.
iv. Projects must result in reductions in emissions that are additional to any that would have occurred in the absence of the certified project activity. This requires the setting of a legitimate baseline.
In practice, projects succeed or fail on more commonplace matters of money and capacity; including institutional capacity. To elaborate; the success of a project is often hindered by a lack of human resources (skills, knowledge, understanding, traingin and access to information), institutional,
organisational and legal support between the different organisations and sectors (public, communities and private).
3.2 Decision 2: Is the project “additional”?
Central to reducing GHG emissions through the Clean Development Mechanism is the concept of additionality. As is illustrated in Figure 8, the initial question to be asked when conceptualising a project is: Does the activity reduce greenhouse gas emissions in a way that departs from ‘business as usual’? Project developers must show that projects or policies in the host countries have not been previously planned or are being considered due to changes in national legislation and policies. Additionality must also be proven by assessing the investment, i.e. that financing through Clean Development Mechanism is the most cost effective route. Lastly, analysis of barriers which would prevent the Clean Development Mechanism project from being implemented, and if there is an alternative scenario, if this is also prevented by the same barrier. The UNFCCC has developed a tool for guiding project developers on assessing and demonstrating additionality (http://cdm.unfccc.int/methodologies/PAmethodologies/tools/am-tool-01-v5.2.pdf)
Without ‘additional’ greenhouse gas savings there can be no project. Savings can take the form of displaced or reduced fossil fuel energy, sequestrated greenhouse gases in vegetation and soil (or possibly underground carbon capture and storage vaults such as deep saline aquifers) or the avoided emission of greenhouse gases, including avoided deforestation.
Additionality has to be ensured in all carbon trading projects. Proving or disproving additionality can be difficult, but a wider understanding of additionality among municipal stakeholders would ensure that additionality compliance is introduced in a number of activities that do not currently qualify for carbon trading.
In a 2009 report, the World Bank described the tools by which additionality can be proven as “clunky and counterproductive”. This opinion reflects a widely held view among practitioners who have developed carbon trading projects. Whilst there can be no doubt that additionality should be the guiding principle for all carbon transactions, scrutiny of the principle reveals inherent contradictions. For example, to be additional a project must not have been planned, or have been possible, without carbon finance. However, carbon finance is seldom sufficient to make a significant financial contribution (although sometimes carbon revenue can be used to address institutional/operation

16
barriers) to a project and investors would be misguided by relying on carbon finance for their returns. Most projects find themselves caught between the need to source alternative funding for project development, while claiming that carbon revenue is the driving incentive for pursuing that investment.
The Clean Development Mechanism is a critical mechanism of the Kyoto Protocol, but there are major issues with processing validation applications for Clean Development Mechanism projects. For future carbon projects in developing countries the solution lies in understanding additionality and precedents for proving additionality. Additionality was reviewed at the Copenhagen COP 15 in December 200923, where the Clean Development Mechanism Executive Board adopted further measures for the simplification of procedures for small-scale Clean Development Mechanism activities in respect of project size, methodologies, determination of additionality, and requirements of documentation. Further, the inclusion of land use, land use change and forestry in the Clean Development Mechanism needs to be discussed. Aspirant carbon market players must always ensure that they know of pending changes to the Clean Development Mechanism conditions and which conditions will be relaxed or simplified.
3.3 Decision 3: Which methodology will be used?
Assuming there is a quantifiable greenhouse gas saving that can be justified as being ‘additional’ to business as usual, the next question project developers will ask is whether the proposed project can comply with an existing ‘project methodology’.26 A project methodology involves a precedent approved by the Clean Development Mechanism Executive Board. Where the proposed project is similar enough to an existing precedent it has the advantage of being able to draw on existing approaches. Where no methodology exists, an application for a new methodology needs to be submitted to the Clean Development Mechanism Methodologies Panel for approval. This is a time - and research - intensive proposal; although once a methodology is approved it is likely that the Clean Development Mechanism-Executive Board will approve the project requiring this methodology.
Each methodology has a clear list of applicability criteria, which the project developer needs to review to ensure that the project being considered is aligned with the specific methodology. The Bangkok Case
Study (Case Study 7) shows an example of how a local government in Thailand considered two types of large-scale methodologies for the improvement of the public transport system, and abandoned both due to problems with calculating emissions reductions and leakage. However, they continued with the project due to the significant benefits beyond Certified Emission Reductions.
It is possible to do certain voluntary market projects without Clean Development Mechanism Executive Board standards and some standards have surpassed the Clean Development Mechanism Executive Board in permitting projects that specifically do not yet have Clean Development Mechanism Executive Board methodologies. However, in general, the voluntary market apply the United Nations approved methodologies, including the title and applicable conditions, and the considerations, with regards to approved methodologies that apply to Certified Emission Reduction projects, also apply to Verified Emission Reduction projects.
Since the inception of the Clean Development Mechanism, more than 200 methodologies have been developed and approved by the UNFCCC. The Clean Development Mechanism methodologies are categorised into 3 broad categories:
• Methodologies for large-scale Clean Development Mechanism project activities
• Methodologies for small-scale Clean Development Mechanism project activities
• Methodologies for afforestation and reforestation Clean Development Mechanism project activities
The entire range of methodologies can be found at: http://cdm.unfccc.int/methodologies/index.html
Large-scale project methodologies are grouped into the following 15 sectoral scopes:
1. Energy industries (renewable - / non-renewable sources)
2. Energy distribution
3. Energy demand
4. Manufacturing industries
5. Chemical industry
23 Muller, B. (2009) Additionality in the CDM. Why and what? Oxford Institute for Energy Studies.
24 The present section focuses on the selection of a single CDM methodology. For a discussion of the possibility of utilizing multiple methodologies under a city-wide
programmatic approach, see below.

17Making Carbon Markets Work for Your City | A Guide for Cities in Developing Countries
6. Construction
7. Transport
8. Mining/Mineral production
9. Metal production
10. Fugitive emissions from fuels (solid, oil and gas)
11. Fugitive emissions from production and consumption of halocarbons and sulphur hexafluoride
12. Solvents use
13. Waste handling and disposal
14. Afforestation and reforestation
15. Agriculture
Within each sectoral scope, methodologies are further sub-divided into project activity types. For example, in the transport sector, there are a number of potential mitigation options available for local governments who would like to develop Clean Development Mechanism projects. These include projects that reduce emissions per kilometre, such as technological changes that result in more efficient vehicles, projects that reduce emissions per unit transported, such as improvements in public transport, and projects that reduce number of trips. There is, at present (December 2009), one approved large scale methodology, one approved consolidated methodology and five approved small scale activities. These include, for example:
• Bus Rapid Transit projects
• Mass Rapid Transit projects
• Cable Cars for Mass Rapid Transit Systems
• Emissions reductions by low greenhouse gas emitting vehicles.
Each methodology provides details on how to calculate baseline emissions and leakages, and comments on additionality and monitoring processes for a specific project activity. The approved methodologies are also accompanied by a number of generic tools to assist project developed in calculating Certified Emission Reduction volumes and drafting coherent Project Design Documents. These generic tools include:
• Tool for the demonstration and assessment of additionality.
• Combined tool to identify the baseline scenario and demonstrate additionality.
• Tool to calculate project or leakage CO2 emissions
from fossil fuel combustion.
• Tool to determine methane emissions avoided from disposal of waste at a solid waste disposal site.
• Tool to calculate baseline, project and/or leakage emissions from electricity consumption.
• Tool to determine project emissions from flaring gases containing methane.
TExT BOx 3: rEDUCING EMISSIoNS FroM proJECTS THAT prEvENT DEForESTATIoN AND DEGrADATIoN
reducing Emissions from projects that prevent Deforestation and Degradation Methods and tools to estimate and monitor changes in forest cover and associated carbon stocks and GHG emissions, incremental changes due to sustainable management of forest and reduction of emissions from deforestation and forest degradation are essential, but not yet approved by the UNFCCC. At the moment, Reducing Emissions from Deforestation and Degradation projects can operate under the Voluntary Market and there is interest shown in extending this to the Clean Development Mechanism market26. The UNDP has, in the interim, established the UNDP Reducing Emissions from Deforestation and Degradation-fund which is administered by the Multi-Donor Trust Fund Office. See the website for more details: http://www.undp.org/mdtf/overview.shtml.
A combination of remote-sensing and ground-based assessments could be one suitable approach for estimating and monitoring reductions in emissions from deforestation and forest degradation. Different methods and tools exist that can be used to estimate emission reductions from deforestation and forest degradation, as well as carbon stock changes associated. Furthermore, new methods and tools are currently emerging.
26 For more on REDD, visit the REDD monitor at www.redd-monitor.org

18
• Tool to calculate the emission factor for an electricity system.
• Tool to determine the mass flow of a greenhouse gas in a gaseous stream.
• Tool to determine the baseline efficiency of thermal or electric energy generation systems25.
Land use, land use change and forestry projects include afforestation and reforestation on land which has not been forested (as defined by the benchmarks set for forests by the host country) for at least 50 years (‘afforestation’) or on land that was not forest before 31 December 1989 (‘reforestation’). Under Article 3.3 of the Kyoto Protocol, Parties to the Protocol decided that greenhouse gas removals and emissions through certain activities, afforestation and reforestation since 1990, are accounted for in meeting the Kyoto Protocol’s emission targets. Conversely, emissions from deforestation activities will be subtracted from the amount of emissions that an Annex I Party may emit over its commitment period.
Afforestation and Reforestation projects sequestrate (remove) carbon from the atmosphere. Sequestration projects that use agricultural crops and soils are not eligible during the 2008-2012 Clean Development Mechanism commitment period. As noted in text box 3, an Afforestation and Reforestation methodology has been developed for small-scale projects. This methodology has been designed specifically for low-income communities and individuals.
Activities in the land use, land use change and forestry sector can provide a relatively cost-effective way of offsetting emissions, either by increasing the removal of greenhouse gases from the atmosphere (e.g. by planting trees or managing forests), or by reducing emissions (e.g. by curbing deforestation). However, there are drawbacks to these methodologies as it may be difficult to estimate greenhouse gas removals and emissions resulting from activities of Land use, land use change and forestry. In addition, greenhouse gases may be unintentionally released into the atmosphere if a sink is damaged or destroyed through a forest fire or disease.
25 See: http://cdm.unfccc.int/methodologies/PAmethodologies/approved.html
TABLE 2: ApprovED SMALL-SCALE METHoDoLoGIES proJECT SUMMArY MArCH 2011
proJECT TYpES SMALL-SCALE Clean Development Mechanism proJECT ACTIvITY CATEGorIES
No
Type I: A. Electricity generation by the user 41
renewable B. Mechanical energy for the user 4
energy projects C. Thermal energy for the user 475
<15 MW D. Renewable electricity generation for a grid 2001
E. Switch from Non-Renewable Biomass for thermal applications by the user 12
F. Renewable electricity generation for captive use and mini-grid 34
Type II: A. Supply side energy efficiency improvements - transmission and distribution 4
Energy efficiency B. Supply side energy efficiency improvements – generation 26
improvement C. Demand-side energy efficiency programmes for specific technologies 27
projects D. Energy efficiency and fuel switching measures for industrial facilities 172
<60 GWh savings E. Energy efficiency and fuel switching measures for buildings 31
F. Energy efficiency and fuel switching measures for agricultural facilities and activities
4
G. Energy Efficiency Measures in thermal applications of Non-Renewable Biomass
7
H. Energy efficiency measures through centralisation of utility provisions of an industrial facility technology
13
J. Demand-side activities for efficient lighting technologies (deemed savings) 41
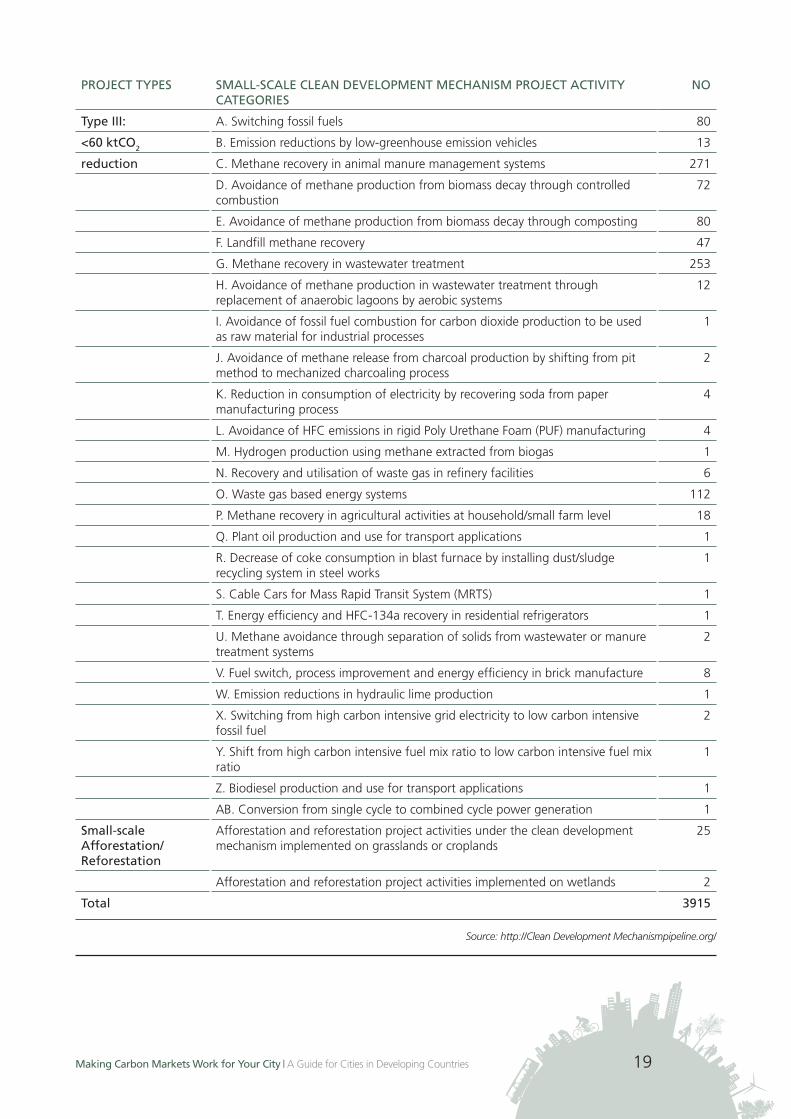
19Making Carbon Markets Work for Your City | A Guide for Cities in Developing Countries
proJECT TYpES SMALL-SCALE CLEAN DEvELopMENT MECHANISM proJECT ACTIvITY CATEGorIES
No
Type III: A. Switching fossil fuels 80
<60 ktCo2 B. Emission reductions by low-greenhouse emission vehicles 13
reduction C. Methane recovery in animal manure management systems 271
D. Avoidance of methane production from biomass decay through controlled combustion
72
E. Avoidance of methane production from biomass decay through composting 80
F. Landfill methane recovery 47
G. Methane recovery in wastewater treatment 253
H. Avoidance of methane production in wastewater treatment through replacement of anaerobic lagoons by aerobic systems
12
I. Avoidance of fossil fuel combustion for carbon dioxide production to be used as raw material for industrial processes
1
J. Avoidance of methane release from charcoal production by shifting from pit method to mechanized charcoaling process
2
K. Reduction in consumption of electricity by recovering soda from paper manufacturing process
4
L. Avoidance of HFC emissions in rigid Poly Urethane Foam (PUF) manufacturing 4
M. Hydrogen production using methane extracted from biogas 1
N. Recovery and utilisation of waste gas in refinery facilities 6
O. Waste gas based energy systems 112
P. Methane recovery in agricultural activities at household/small farm level 18
Q. Plant oil production and use for transport applications 1
R. Decrease of coke consumption in blast furnace by installing dust/sludge recycling system in steel works
1
S. Cable Cars for Mass Rapid Transit System (MRTS) 1
T. Energy efficiency and HFC-134a recovery in residential refrigerators 1
U. Methane avoidance through separation of solids from wastewater or manure treatment systems
2
V. Fuel switch, process improvement and energy efficiency in brick manufacture 8
W. Emission reductions in hydraulic lime production 1
x. Switching from high carbon intensive grid electricity to low carbon intensive fossil fuel
2
Y. Shift from high carbon intensive fuel mix ratio to low carbon intensive fuel mix ratio
1
Z. Biodiesel production and use for transport applications 1
AB. Conversion from single cycle to combined cycle power generation 1
Small-scale Afforestation/ reforestation
Afforestation and reforestation project activities under the clean development mechanism implemented on grasslands or croplands
25
Afforestation and reforestation project activities implemented on wetlands 2
Total 3915
Source: http://Clean Development Mechanismpipeline.org/

20
3.4 Decision 4: What scale will the project be?
Once the potential for additional GHG emissions reductions has been established, and a methodology has been selected or registered, the next project development decision involves the scale of the project. How many tons of Carbon dioxide equivalent will a project save? The scale of a project has many implications. The Clean Development Mechanism Executive Board distinguishes between ‘large-’ and ‘small-scale’ projects:
Approved Small-Scale Methodologies involve streamlined baseline assessment and monitoring procedures and, as a result, are generally quicker and easier to implement. However, they are restricted by the total volume of Certified Emission Reductions for the project activity. As a result Approved Small-Scale Methodologies are sub-divided into the following categories or types:
• Type I: Renewable energy projects, with a energy capacity saving of less than 15 Mega Watt (MW)
• Type II: Energy efficiency projects with energy capacity saving of less than 60 Giga Watt hours/ year (GWh/year)
Type III: Projects with an emission reduction of less than 60 kilotonnes CO
2/year (ktCO
2/year) The total
number of Approved Small-Scale Methodologies registered projects for each methodology in March 2011 is provided in table 3. From this table it is evident that methodologies such as “Renewable electricity generation for a grid”, “Energy efficiency and fuel switching measures for industrial facilities”, “Methane recovery in animal manure managements systems” and “Methane recovery in wastewater treatment” are very popular and have the potential for rapid implementation. See the case study on the Quezon City Biogas project (see Case Study 4), which indicates a relatively simple and popular small-scale project.
Small-scale projects are further able to propose changes to the simplified baseline and monitoring methodologies or propose additional project categories to those already listed for consideration by the Executive Board.
Small-scale projects qualify for reduced registration costs (USD 5,000). In practice, the cost of developing a small-scale project and the revenues that these projects generate is very little and in some cases make it very difficult to finance these projects. The majority of successful small-scale projects have been
developed using some form of public funding and typically do not generate financial profits (see the Kuyasa low cost housing project, Case Study 2, for an example).
A more helpful scale distinction involves identifying projects that are:
• Below 5,000 tCo2e per annum: These are unambiguously small projects. They will not generate enough revenue to cover the transaction costs associated with registering, certifying and validating a Clean Development Mechanism project. They may, however, be well suited to the off-set or voluntary market. In particular the Gold Standard Micro Project Facility (maximum 5,000 tCO
2 per annum) offers relatively low transaction
costs, but also lower Verified Emission Reduction price compared to Certified Emission Reduction price, to small projects that comply with Gold Standard criteria.27
• Between 5,000 and 30,000 tCo2e per annum: These are awkwardly sized projects and, in practice, prove difficult to develop. Too small for Gold Standard Micro, not large enough to cover significant project development, monitoring or validation costs, projects of this scale are often only viable if funded in part by donors or governments.
• Larger than 30,000 tCo2e per annum: These projects are large enough to be considered financial opportunities in their own right. Typically they will seek the formality of the Clean Development Mechanism market, although more and more projects that could qualify for Clean Development Mechanism status are opting to pursue voluntary market certification in order to reduce transaction costs and enable greater flexibility in their approach.
3.5 Decision 5: Will this be a Clean Development Mechanism or a voluntary market project?
The question that follows is whether the project should be developed for the United Nations Clean Development Mechanism market or the voluntary market. The answer depends on scale of the project, which in turn influences financial viability (as discussed above). Crucially, the decision will also depend on whether or not the host country has a registered Designated National Authority capable of approving Clean Development Mechanism projects.
27 For more information about Gold Standard Micro projects see annex, chapter 7.1.1. / page 75.

21Making Carbon Markets Work for Your City | A Guide for Cities in Developing Countries
If there is no Designated National Authority (as continues to be the case in many African countries), it is not possible to develop a Clean Development Mechanism project until a Designated National Authority is established (see section 4.3 for more on the Designated National Authority). In such countries the voluntary market remains the only option for accessing carbon revenue.
Provided that Clean Development Mechanism methodology exists, the project has demonstrated additionality and other criteria, the project developer is likely to go for a Clean Development Mechanism project (even when verified carbon reduction is less under a Clean Development Mechanism because of a more rigorous procedure) since the Certified Emission Reduction prices are higher than Verified Emission Reduction prices. Projects that do not easily fit into an existing Clean Development Mechanism methodology, and which do not have the resources to register their own methodology, may look for voluntary market standards that accommodate their needs. This is the case for a number of forestry and land use projects, for example.
Finally the decision as to whether a project is best suited to the Verified Emission Reduction or Certified Emission Reduction market is a subjective one at the discretion of the project developers. The positive aspect of this discretion is that it provides options to the project developer. Developers can evaluate where their project is most likely to succeed in the Certified Emission Reduction market or the Verified Emission Reduction market, or sell into both markets, as proves most suitable. In practice, this decision is often taken in discussion with buyers. Buyers that are investing up-front may stipulate what type of credits they would like to purchase.
3.6 Decision 6: How will the project be financed?
The next issue confronting project developers relates to financial viability. The answers to questions in this phase determine whether a project should proceed and how it is to be financed. Typically there are two workstreams that require funding. The first relates to the actual project development – the purchase and installation of solar water heaters or the building of a methane capture plant. The second relates to costs of developing a carbon trading project. This includes the research costs, monitoring costs and costs of registration with a certifying body (UNFCCC, Gold Standard, Voluntary Carbon Standard). It is very seldom the case that carbon revenue will be adequate to cover all project costs and generate a profit. Identifying costs and the respective contributions of different project participants and stakeholders early
on in the project is crucial in ensuring project viability, preventing disputes and conflict and in identifying who will end up owning what credits. Time spent at this phase of the project can reduce delays later on.
To be financially viable, the benefits arising from the project should exceed the costs. Current estimates of the cost of gaining Clean Development Mechanism status show approximate values of USD 40,000 per project. This includes project registration, certification and the cost of contracting a Designated Operating Entity. Cheaper consultation and certification may be negotiated, but a minimum non-negotiable registration cost of USD 5,000 is levied by the UNFCCC.
Funds are being developed to assist in meeting project development costs. The European Commission’s Centre for Development of Enterprise is developing a programme that will facilitate grants of up to 50 per cent of the Clean Development Mechanism development costs. The World Bank has created the ‘Prototype Carbon Fund’ and the ‘Community Development Carbon Fund’. Financial consulting firms, operating in environmental commodities, are also willing to finance project development costs and in some cases actual project components, hence reducing the initial barrier for the project developer. Furthermore, it is possible to request investors to pay for the project development costs. Logically, where costs and risks are transferred to investors in this way, they will seek compensation. Local governments too, with the fiscal budgets for existing development programmes and projects, can be well-placed to contribute to project funding, provided they can show that the project does not compromise the ‘additionality’ requirement.
If climate change is the result of market failure – the failure of the market to charge emitters the full cost of their actions – then economic theory suggests a role for public intervention and public finance for the projects that address this market failure. Public funding options for carbon saving projects range from near commercial loans, to concessional loans, grant based funding and guarantees. The difficulty is in administering public funds for projects in a way that does not further distort markets, end up funding the wrong people and having unforeseen consequences. Nowhere is this more apparent than in the funding of residential renewable energy and energy efficiency. Reducing household emissions is one important component of most national mitigation strategies and, where linked to the carbon market, presents the potential for the spread of carbon revenue benefits to households. Houses contribute between 15 per cent and 30 per cent of most country’s emissions (more in poorer countries) and technologies or measures that reduce residential emissions can simultaneously reduce domestic expenditure on energy.

22
The usual impediment for households wanting to invest to reduce their consumption of fossil fuels is the high up-front capital costs for the installation of renewable energy end energy efficiency technologies. Households may want the lower marginal energy costs associated with renewable energy and energy efficiency but typically don’t have the capital required to access it. This is true of solar water heaters, compact fluorescent lightbulbs, insulation and photovoltaic cells. Even where households have the money, the assumption that these capital investments only save money over a 7-12 year period acts as a deterrent for most residents who think that they may move before then. The evidence from the United States shows that most people stay in their houses for an average of 12 years, but when questioned assume they will stay only an average of 7 years. The assumption of a shorter period dissuades people from making an investment that they may not recoup in full. A raft of financing approaches from subsidies, to loans and tax rebates and straight grants have all met with mixed results and proven costly to administer.
In the United States the Federal Government began rolling out a financing scheme to address this impediment that was piloted in San Diego in 2009. Under the scheme the companies that install residential renewable energy and energy efficiency technologies are paid by the local government or city. The owner of the house then pays the local government a monthly addition to their property tax for the duration of the period that they are in the house. If they sell the house, the tax is transferred to the new owner. The local government, because it has a liability secured against the home owner’s assets, is able to issue bonds (treasury or private sector bonds) against the money that is owed to it, thereby obviating any cashflow shortfall it might have as a result of the scheme. In many instances the local energy utility is only too willing to be the financier of the bonds, whilst local governments benefit further from the scheme by expanding their tax base.
Figure 9 gives an overview of some of the questions that a project developer can ask to assess the financial
high
Yes
low
no
Development Costs?
Is there leakage?
small large
Volume GHG emissions reduced?
long short
Timeframe: Investment to Revenue
Yes no
Are there sustainability issues?
high low
What are the transaction costs?
no Yes
Pre registration Revenue?
Project Development and Trading More financially viable
FIGURE 9: AN ovErvIEW oF FINANCIAL vIABILITY

23Making Carbon Markets Work for Your City | A Guide for Cities in Developing Countries
viability of a project. Assessments of financial viability should include:
• Development Costs. Project-related activities, infrastructure, skills and technologies cost money. Financially viable projects have low ‘marginal abatement costs’; that is the money required to develop a project and reduce a ton of CO
2 is relatively low. These projects are
sometimes referred to as ‘low hanging fruit’ (see 7.3 for a discussion on ‘low hanging fruit’). It is very seldom that carbon revenue covers all of the development (and transaction) costs associated with a project. Typically carbon income allows for a recouping of 5 per cent-20 per cent of development costs, but projects that reduce large volumes of GHG for low development costs are more desirable than those that do not. See Case Study 3 on the Mtoni Dumpsite which shows some of the costs involved in project development. Infrastructure costs can be quite high even when a project is simple to implement.
• The amount of GHG reduced. If you are displacing grid energy with renewable energy this is relatively straightforward. The number of tonnes of CO
2 will depend on the national
or regional ‘grid factor’; a figure that shows the tCO
2e produced per kilo Watt hour (kWh)
of grid energy. Where grid energy is not being used, the baseline calculation will depend on the emissions savings for the fuel source that is being displaced (wood, coal, paraffin or cattle manure) or the extent of avoided emissions from landfills, animal waste, factories or mines.
• Projects involving sequestrated CO2
are usually more difficult to quantify accurately, which is one of the factors which make these projects difficult to implement. Typically the approach involves estimating the CO
2 absorbed in biomass on a
permanent basis. This can include soil carbon and carbon stored in roots.
• Both activity and emissions factors may be primary (reflecting direct measurements made internally by someone in the supply chain) or secondary (referring to external measurements that are not specific to the product).
• Checking uncertainty (optional): Uncertainty may arise in calculations from two sources; technical uncertainty and natural variability. Sources of uncertainty should be identified and, where possible, reduced.28
• Leakages. An aspect of GHG volumes that is often overlooked involves including those credits that are lost, sometimes inadvertently, through what is termed ’leakage‘. Leakages arise from emissions that are created in the course of developing and managing the project. Leakage refers to the GHG emitted as a result of a Clean Development Mechanism project activity but they occur outside the project boundary, therefore they must be considered as additional, and deducted from the emissions reduction gained from the project activity. For example, where a forest rehabilitation project causes deforestation of a neighbouring region this source of emission should be deducted from those saved by the project, or if a waste management project is using bricks to construct an small scale anaerobic chamber, and these bricks would not have been manufactured had the project not taken place, then the emissions from the manufacturing of these bricks need to be taken into account. Leakages can be difficult to anticipate and monitor, especially where they take place over displaced spatial scales. Failure to account for leakages can undermine what was thought to be a viable project.
• Transaction costs. There are numerous transaction costs that arise throughout the pre-operational phase of a Clean Development Mechanism project29; including those associated
28 ICLEI website: www.iclei.org and http://www.zerofootprint.net 29 Michaelowa, A., Stronzik, M., Eckerman, F. and Hunt, A. 2003. Transaction costs of the Kyoto Mechanisms. Climate Policy, 3: 261-278.
TExT BOx 4: SoUTH AFrICAN ExAMpLE
Exemplary studies:The best source of emissions reduction data exists in country-specific Project Design Documents, but where unavailable, academic studies can be used to establish baselines. According to Winkler & Spalding-Fecher (2000), 75 per cent of low-income households in South Africa use electricity for space heating (as opposed to 2 per cent that use coal, 19 per cent paraffin and 2 per cent LP Gas). These figures are used in establishing baselines for residential projects in South Africa, but can be adapted and applied elsewhere. Similarly DEFRA’s (2007) “Guidelines to DEFRA’s conversion factors for company reporting” standardise a set of emission factors for a wide range of technologies and presents figures that can be easily adapted to country-specific circumstances.

24
with negotiation, consultation, baseline determination and project registration and monitoring. By far the greatest transaction cost, however, involves securing the services of a Designated Operating Entity. Due to the limited number of certified Designated Operational Entities, the risks that they carry when verifying credits, and the complex nature of their work, Designated Operational Entities typically charge between 20,000-60,000 Euro every year in order to verify credits. Equally problematic is the difficulty in securing the services of Designated Operational Entities for smaller or remote projects. Long delays in securing the services of a Designated Operational Entity can disrupt viability, particularly where projects are being developed with loan finance. Finally there are costs associated with the “issuance” of credits that, if not imputed, can reduce viability.
• price. The anticipated price of a tonne of carbon dioxide equivalent is ultimately set in negotiations with the buyer, but market prices are quoted daily30. Project developers are required to make assumptions about the value of the credits that they hope to generate and assumptions that are too high can hamper viability. One way to overcome this involves securing a price with a buyer in the early stages of the project. This can be accompanied by an upfront investment by the buyer. Securing prices in the beginning provides some certainty but, where buyers contribute early investments, they typically offer lower prices on credits.
• Life of project. Project developers should decide whether it is better for the project to trade in a single ten-year window, or to trade in three seven-year windows; bearing in mind that in the latter option the baseline will be reviewed and adjusted every seven years. The life-span projection will determine the total revenue that a project can expect to generate but the higher revenue associated with 21 year projects is associated with greater costs and higher uncertainty.
• Cash flow and time lags. One of the most common reasons for projects entering financial difficulty relates to unforeseen delays that disrupt cash flows by setting revenue generation back. Delays can be caused by Clean Development Mechanism-Executive Board queries, public participation processes, Designated National Authority inefficiency or queries or any number of unforeseen contingencies. The net impact is the same, however; costs accrue and no revenue
is available. It is for this reason that projects should adopt conservative cash-flow projections, particularly when project developers are embarking on their first project or methodologies have not yet been approved.
• Sustainability. Carbon trading projects are required to comply with local sustainability criteria and, globally, these criteria are becoming more rigorous and more complex. With regards to environmental sustainability criteria, for instance, project developers may have to conduct environmental impact assessments, embark on lengthy consultation processes and implement environmental rehabilitation programmes. Where these activities and associated expenses come as a surprise to the budget and project developers, they can derail viability (see Case Study 5: Durban landfill projects).
The Madhya Pradesh Streetlights Case Study (Case Study 1) shows where very accurate estimations were made of project investments and the payback time. Even a simple project, such as retrofitting streetlights, can have a return-on-investment lag of 2 – 10 years. However, in the street lighting example, the upgrading of the existing street lights was an important priority for the municipalities involved and the Certified Emission Reductions were an added benefit.
The Kuyasa project in South Africa (Case Study 2) is similar to the Indian example. The project struggled to find a financial rationale but presented merits for the City of Cape Town by way of job creation (100 person years), reducing demand on the over-subscribed electricity grid and reducing energy costs for poor households (USD100 per household per year); not to mention social awareness raising around energy issues. It is on these grounds that the City of Cape Town has pursued the project.
It is not uncommon, as is the case at both Kuyasa and Madhya Pradesh projects, that the financial rationale has to be compromised to achieve desirable environmental and social outcomes. This should not be surprising. Markets do not yet adequately price atmospheric carbon and neither do they factor in the social cost of poverty. It is the responsibility of public entities, such as local governments, to finance the under-valued benefits (sustainable development) of CO2
mitigation and poverty alleviation, in order to overcome market failures. Clean Development Mechanism projects represent one means of doing this, and local government involvement in the Clean Development Mechanism, as illustrated by the Kuyasa and Madhya Pradesh projects, should be encouraged on these grounds.
30 See, for example, www.pointcarbon.com

25Making Carbon Markets Work for Your City | A Guide for Cities in Developing Countries
31 http://www.reeep.org/index.php?assetType=project&assetId=72, Project number 10308042 32 UNEP. (no date) CDM Sustainable Development Impacts. UNEP CD4CDM series. UNEP Risø Centre on Energy, Climate and Sustainable Development: Denmark.
Energy Efficient Street Lights - Madhya pradesh, IndiaIn order to reduce the costs of energy consumption, municipalities within the Madhya Pradesh region of India decided to replace their inefficient street lighting system in 14 cities. The objective of the project activity was to reduce the GHG emissions by reducing energy consumption in street lighting by integrating various energy efficiency measures into the street lighting system. The project activity proposed replacement of the existing street light system comprising sodium vapour & mercury vapour lamps and fluorescent tube light across 14 Municipal Corporations of Madhya Pradesh by a combination of energy efficient devices such as T-5 (28 watt) tube lights, electronic ballasts, programmable timer switches and power saver units along with other design considerations.
The energy consumed by streetlights had increased by 68 per cent over a five year period and were consuming between 20 per cent-30 per cent of the electricity in the respective municipalities. The dated system meant that there was non-uniform distribution of illumination, with higher lighting levels than was standard in some areas, poor mounting of street lights and an increase in lighting levels in off-peak hours. The region used a Clean Development Mechanism project to assist in the finance of an upgraded and more efficient system that also cut back on municipal energy costs.
The project entailed a number of energy efficiency technologies including more efficient street light components, computer models for a new mounting design, programmable timing switches and power saving units.
1. The light fittings resulted in an energy saving of nearly 986 686 KWh per annum and a CO2 reduction of
799 tCO2 per year. The pay back period for money invested was approximately 2 years.
2. The power saving device reduced the municipality’s energy bill by 25 per cent-40 per cent, with an emissions reduction of 1651 tCO
2 per year and a payback time of 5 years.
3. The timers resulted in a 5 per cent-10 per cent energy saving, and accounted for a 240 tCO2 (for one city-
Gwalior) per year emissions reduction, with a payback time of 2 years.
The total investment in the project amounted to over USD 6 million, but saved over USD 2 million worth of electricity per year. The emissions reduction potential of the project was calculated at 265 060 tCO
2 over a ten
year accounting window, and is planned to account for USD 2 650 671 worth of carbon revenue over ten years.
The project is insightful on a number of accounts. The first is the high capital amount (USD 6 million) required to make it work and the three year lag before “profits” are made on this investment. The second involves the typically small contribution made by the carbon revenue relative to the capital account and the relatively small contribution made by carbon relative to the unreported Clean Development Mechanism transaction costs. It is unlikely that the USD 2 650 671 generated by the project would cover the cost of registration, monitoring, validation, certification and issuance, particularly when most of these costs are paid up-front while the returns come in over a ten year period. In spite of this there were grounds, mainly related to the municipalities’ electricity bill, to proceed with the project.
CASE STUDY 1: ENErGY EFFICIENT STrEET LIGHTS, MADHYA prADESH, INDIA31
Similarly, where a project has adverse or irreversible impacts on one of the sustainable development criteria, whilst having a positive effect on another, it is incumbent upon local authorities to weigh the trade-
off and limit negative impacts, whilst attempting not to impose undue complexity and costs on the project.32

26
CASE STUDY 2: KUYASA LoW-CoST HoUSING ENErGY UpGrADE proJECT, CApE ToWN (SoUTH AFrICA) CLEAN DEvELopMENT MECHANISM proJECT No. 0079
Kuyasa Low-Cost Housing Energy Upgrade project - Cape Town, South AfricaThis project was initiated by the City of Cape Town Municipality with the aim to improve the thermal performance of existing and future low-cost housing in Kuyasa/Khayelitsha, two informal settlements situated in the jurisdiction of the City. The overall objective of the project is to reduce the current and future electricity consumption of approximately 2300 (in phase 1) and 4000 (in phase 2) households; with secondary benefits which include a reduction in local air pollution and reduction in accidents and damages caused by fires in the local area. Improvements in thermal performance are being achieved through the installation of insulated ceilings, solar water heater installation and energy efficient lighting.
The first phase of the project involved retrofitting approximately 2300 households that had recently been constructed in Khayelitsha, using local emerging contractors. The second phase will involve “greening” another 4,000 houses that are going to be constructed in the near future. Since May 2008, the project has retrofitted 90 houses. In 2006 it was the only registered Clean Development Mechanism project that was using energy efficient lighting as a source of Certified Emission Reductions and has been awarded Gold Standard status from the Gold Standard Foundation.
problems which arose The project has been internationally acclaimed but in reality the lessons that it offers are as much a result of the problems it has experienced as its merits. Having established a baseline, introduced the novel concept of “suppressed demand” and quantified emissions savings per household, it became apparent that even if all credits were to be sold in advance at Gold Standard premium prices, the revenue would be insufficient for the financing of the technology required for the project (Solar Water Heaters, insulated ceilings and CFL light bulbs). This is a common problem for Clean Development Mechanism projects.
Whilst the project had been registered, approved and received Gold Standard certification by 2006, this was on the basis of a few “prototype” houses and the plans to extend the project. Without the City of Cape Town intervening in 2008, and providing some funding for the required technologies in order to allow for the planned roll-out to proceed, the project would never have taken place. However, this raised an unresolved dispute (as of 2009) over ownership of the credits, with the City maintaining that, as the financier, they owned the credits and local resident organisations saying that, as the owners of the houses, the credits belonged to them. In addition, the issue of who was responsible for the significant maintenance costs on the installed technologies became disputed.
These are not abnormal problems and do not provide grounds for choosing not to do these projects or stalling the project. However, where they cause delays, project viability is threatened. Clear institutional and financing arrangements are one of the prerequisites for functional Clean Development Mechanism projects.

27Making Carbon Markets Work for Your City | A Guide for Cities in Developing Countries
CASE STUDY 3: LANDFILL GAS AND ELECTrICITY GENErATIoN AT MToNI DUMpSITE, DAr ES SALAAM (TANzANIA) CLEAN DEvELopMENT MECHANISM proJECT 0908
Landfill Gas and Electricity Generation at Mtoni Dumpsite - Dar es Salaam, TanzaniaThe Mtoni dumpsite project was the first Clean Development Mechanism project in Tanzania, and has been the catalyst for more Clean Development Mechanism projects. Through the Designated National Authority, 14 more projects in Tanzania are in the process of being developed.
The Mtoni dumpsite was opened in 2001, receiving waste from three municipalities until officially closed in 2007. Over this period 1 800 000 tons of waste was disposed of. The dumpsite is approximately 10 km from Dar es Salaam and covers 8.5 ha of land. In 2004, when the City Council of Dar es Salaam was preparing for its closure, they began to do assessments of the leachate management and methane recovery potential of the dumpsite. In 2005, the City was approached by Consorzio Stabile Globus, a firm based in Milan, Italy, to develop a dump gas flaring project.
The project aims to capture 65 per cent of biogas produced at the Mtoni dumpsite. The biogas will be used to generate electricity (roughly 3,5 MW) to be connected to the national grid. The expected reduction in GHG emissions is 2 022 711 tonnes of CO
2. The project is predicted to generate about 200,000 Certified Emission
Reductions annually and contribute an additional USD2.800.000 – 3.400.000 (January 2010) to the revenue from electricity sales. The total investment cost is approximately USD5.700.000, which implies a return on investment of around 2 years, if only calculating carbon credit sales.
As with many landfill site projects it remains to be seen who will finance the infrastructure required to convert the methane gas into electricity. Methane flaring can be relatively cheap, but the true benefits are gained when this methane is used to displace fossil fuel-based electricity. Achieving this, however, can be more expensive even where cogeneration opportunities exist. Investment costs are required upfront, and whilst the two year payback may be reasonable for most financiers, this period will only begin once the project is certified and issuing credits. It is the delays between establishing the infrastructure for the project, and issuing certified credits, that are most risky for investors.
CASE STUDY 4: QUEzoN CITY CoNTroLLED DISpoSAL FACILITY BIoGAS EMISSIoN rEDUCTIoN proJECT, QUEzoN CITY (pHILIppINES) CLEAN DEvELopMENT MECHANISM proJECT No. 1258
Quezon City Controlled Disposal Facility Biogas Emission reduction project - Quezon City, philippinesThe local government of Quezon City, Philippines, was concerned about the impacts the Quezon City Controlled Disposal Facility was having on the immediate surrounding environment and people. As a means to reduce biogas emissions, as well as contribute to supply of electricity in the Facility, a project to extract, collect and process biogas-to-electricity was developed and implemented at the Facility.
The first phase of the project consisted of creating wells to trap the methane emissions from the dumpsite and feed it through main lines to the extraction plant, where it is converted to electricity through high-temperature torch flaring. This electricity is then used to power the entire facility. Currently, this project generates 200 kW of electricity and has reduced GHG emissions by over 31 000 tCO
2. Furthermore, since the project began, there
have been no fires or explosions at the dumpsite.
The project is small and may struggle to generate a reasonable financial return from carbon revenue. There are, however, many reasons other than straight financial profits why such a project is a good idea. The Quezon City project has the potential to reduce the number of explosions at the dumpsite, as well as reduce the negative impacts of the dumpsite on the immediate surrounding environment, including a reduction in the leakage of wastewater and the emission of noxious gasses.

28
4. ParT C: CriTiCal sTePs for suCCessful ProjeCT develoPmenT and Trading
Whilst potential exists for local governments to engage with the carbon market, both Certified Emission Reduction and Verified Emission Reduction, the point has been made that this market is complex and does not guarantee positive outcomes. It would be imprudent for public entities to involve themselves naively, without due awareness of why so many projects fail or take longer than anticipated to generate revenue.
Once project conceptualisation and planning has proceeded as outlined above, there are a number of development steps required. Each of these presents potential pitfalls and barriers, but being informed of each step will assist practitioners and decision-makers in avoiding and overcoming obstacles.
4.1 Identify Project Champions and Institutional Arrangements
Identifying the individuals or units, from within organisations or local governments, that are best placed to engage in Certified Emission Reduction and Verified Emission Reduction projects can be difficult. The multi-disciplinary nature of the carbon market can result in any of a number of units from within a single local government driving Clean Development Mechanism projects; including people from finance, project development, environmental affairs, risk compliance, energy or corporate social responsibility or international market linkages. The most important consideration,
FIGURE 10: oUTLINE oF STEpS IN CArBoN MArKET DEvELopMENT
project Conceptualisation
(1) Institutional Clarity
(2) Project Documentation
(3) Designated National Authority Approval
(4) Project Validation
(5) Registration with Clean Development Mechanism - Executive Board
(6) Monitoring
(7) Verification
(8) Issuance

29Making Carbon Markets Work for Your City | A Guide for Cities in Developing Countries
however, is the individual who will be responsible for the project. The right person should have an awareness of the Clean Development Mechanism and its processes, a commitment to reducing greenhouse gases, sufficient time to allocate to project development and the associated communication and, most critically of all, the person should be senior enough within the local government to make strategic decisions. Alternatively a task force is another good option, whereby the success of the Clean Development Mechanism project is built into the performance appraisal of team members and the team leader to enhance accountability.
Concluding on their experiences in supporting the Nelson Mandela Bay Municipality in South Africa (see Case Study 9) to identify and develop Clean Development Mechanism and voluntary projects, the Promoting Access to Carbon Equity Centre (2009) recorded that the three most important institutional factors affecting project success were:
• A clear and shared understanding of who develops the project, who invests money and who owns the credits.
• Having a designated person (usually the project developer) responsible for keeping the project development process continuing, compiling information and answering queries.
The carbon trading environment is constantly evolving and institutional arrangements need to be based on clear principles, such as who does what and who benefits, and clear, but flexible, decision-making processes. This does not exclude the need for a designated person to keep the project development process progressing.
The success of any Clean Development Mechanism project relies on institutional stability and a dedicated project developer. However, having a clear project developer capable of financing project development, while waiting for the returns in the form of carbon credits, is a common constraint, unless private equity finance is used through a consulting firm to finance the project development cost (as discussed in section 3.6). When introducing a new initiative, using the Clean Development Mechanism, it is necessary to unpack the pre-existing agreements and relationships to accommodate the added complexity of the Clean Development Mechanism. There are a number of active carbon market role players in a given area at any given moment. These role-players will compete for credits, consultancy work in Clean Development Mechanism development and the right to claim ownership of project processes. Competition should be encouraged. However, unless expectations are carefully managed and ownership rights are protected, the same competition can impact
CASE STUDY 5: DUrBAN LANDFILL GAS-To-ELECTrICITY, ETHEKWINI (SoUTH AFrICA) CLEAN DEvELopMENT MECHANISM proJECT NUMBEr 0545
Durban Landfill Gas-to-Electricity - eThekwini (Durban), South AfricaIn 2002, the City of eThekwini (Durban) embarked on an ambitious Clean Development Mechanism landfill gas extraction project composed of two components, the La Mercy and Marianhill component and the Bisasar Road component. The first component was a smaller project that was championed and implemented by an employee of the City. With help from the World Bank, methodology planning and implementation of the project proceeded with limited help from the South African Designated National Authority; who, at the time, did not have the capacity and know-how that they have today. The Clean Development Mechanism project implemented by the City of eThekwini can, therefore, be considered as a pioneering project. In 2006, the project was certified by the Clean Development Mechanism board of the UNFCCC.
Compliance with National Legislation The projects have been, to an extent, kept in house, as the municipality has had the expertise to implement and manage the project. However, outside expertise has been contracted; for instance when ensuring Environmental Impact Assessment (EIA) Record of Decision compliance. The second component of the project is a much bigger component than the first, which has been implemented with new knowledge, skills, technology and best practices learned from component one. This component needed an extensive EIA, as per environmental legislation in South Africa. The need for such a comprehensive EIA had not been anticipated and presented a major challenge to project developers. However, since it has been implemented, it has exceeded all expectations and is now producing 6.5 Mw of electricity, which the project began to produce just a few months after technology was installed.
Currently, the component one landfill projects have resulted in the following emission reductions since their implementation: Mariannhill, 19,458 tCO
2e and La Mercy, 4,254 tCO
2e. The total emission reductions are
23,712 tCO2e. In March 2009, the Bisasar Road landfill was also certified. This second project is expected to
result in the reduction of 343,000 tCO2e per annum.

30
CASE STUDY 6: MWANzA CITY CoUNCIL LANDFILL CLEAN DEvELopMENT MECHANISM proJECT, NYAMAGANA DISTrICT (TANzANIA)
Mwanza City Council Landfill Clean Development Mechanism project - Nyamagana District, TanzaniaThe Mwanza City Council has a number of problems with the collection of waste in the city, which results in approximately 600 tons of waste failing to be collected daily. The City Council has made a decision to implement a landfill Clean Development Mechanism project, a gas flaring project, in the Nyamagana District. This project is anticipated to have a number of environmental and socio-economic benefits. The environmental benefits include improved waste collection, reduction in bad odours and fires, waste water treatment and avoided GHG emissions of approximately 25,000 tCO
2e/year. The socio-economic benefits include avoidance of diseases,
employment, local suppliers’ opportunities, technological transfer, foreign capital investment, rural development and the identification of other potential projects.
In June 2009, the project facilitators, a company called co2focus, together with other project developers, completed the first steps of the project conceptualisation and development phases; including a pilot study on the landfill, the identification of potential partners, the signing of agreements with the Mwanza City Council, the conducting of the feasibility study (with outside company, MGE TEKNIKK, funded by Norway Agency for Development Cooperation) and the development of a framework for organisational and structural project participation. Although the groundwork and planning has been achieved, there is still a long way to go, including project financing and approval by the Designated National Authority.
Institutional Arrangements The most important aspect of this project is the time and effort taken to make decisions regarding the institutional arrangements and participation of various stakeholders; which include the surrounding communities, sub-contractors and Clean Development Mechanism project developers. Decisions were also made regarding the percentage partner share of each stakeholder and the types of agreements necessary to ensure the effective implementation of the project.
The project is being financed through an equity financing system, with partners including Arendal City (Norway) and Aust Agder County (Norway) and other investors getting equal shares. The participants are regulated by a Joint Venture Agreement. The Mwanza City Council is the host party and outside expertise is contracted through various agreements. These agreements include a purchasing agreement, an operational agreement and a maintenance agreement.
CO2 Focus
10 per cent
Arendal City
Part Share
Mwanza City Council Part Share
Landfill operating company
Tanzanian Government Royalty
Fee 2.5 per cent
Gas treatment plant Operational
Support
Technical and Operational
Support
Local Supplier of equipment
Regulated by a Joint Venture Agreement
Purchasing Agreement
Local Community
Operational Agreement Maintenance Agreement
Aust Agder County Part Share
Other Investors Part Share
See: www.co2focus.com for more details.

31Making Carbon Markets Work for Your City | A Guide for Cities in Developing Countries
CASE STUDY 7: BUS rApID TrANSIT IN BANGKoK, BANGKoK (THAILAND)
Bus rapid Transit in Bangkok - Bangkok, ThailandThroughout the years 1983-2000, the City of Bangkok experienced an increase in private motor vehicles which had an impact on the energy consumption patterns, and hence air pollution and climate of the city. In 2008, private motor vehicles accounted for 56 per cent of the 17 million trips that were occurring in the city every day. Considering that transport accounted for more than half (56 per cent) of the CO
2 emissions of the City, and
remained the dominant energy demand sector at that time, an intervention that would decrease the number of motor vehicles on the roads would also reduce the total CO
2 emissions of the city.
The City of Bangkok began to research the feasibility of developing a Bus Rapid Transit (BRT) system in the city, which would result in a modal shift from private motor vehicles and taxis to BRT buses. They considered the advantages and disadvantages of developing a Rail Mass Transit system, as opposed to the Bus Rapid Transit system, and decided that the high investment costs of a Rail system precluded it from being a viable alternative transport system. There are also a number of positive aspects of a BRT system; including the reliability of the system, the reduction in travel time for commuters and the reduction in motor vehicles on the roads. By using more efficient and bigger buses, more people can have access to the BRT system and, by using buses that can use natural gas as opposed to petrol, there will be fewer emissions.
Sustainable Development The City of Bangkok did a thorough sustainable development assessment to ascertain how the BRT would contribute to sustainable development goals in the country. They concluded that the BRT system would have a number of environmental benefits; including reduced CO
2 emissions and better air quality, socio-economic
benefits such as employment of unskilled workers, reduced time lost to congestion, improvements in health, lower noise and a reduction in accidents.
The Clean Development Mechanism potentialThe project developers considered two methodologies, one for the BRT system and another for a Mass Rapid Transit system. At first glance, it seemed that the Mass Rapid Transit system would be easier, as it is a “simplified” alternative to the BRT system, and because many of the applicability conditions for the methodology were met. However, the methodology was not approved due to problems with calculating baseline information and emissions reductions. It was also difficult to calculate leakage. In the end the City decided to go ahead with the BRT system without funding through the Clean Development Mechanism.
negatively on a project. Institutions and companies investing in Clean Development Mechanism development need to be assured of the returns they can expect. See Case Study 6 on the Mwanza City Council landfill project where deliberate care was taken when identifying stakeholders, assigning percentage shares and regulating relationships.
4.1.1 overcoming financial barriers
Funding carbon trading projects is a common challenge. As established above, it need not be the case that all carbon trading projects generate a profit, as many of these initiatives deliver positive co-benefits to the environment, poor households and local governments. However, having a clear plan as to how all project costs will be funded is necessary to avoid delays. The Clean Development Mechanism experience has offered a number of different techniques by which a Clean Development Mechanism project can be funded. They are as follows:
• Unilateral funding. The Clean Development Mechanism project developers take sole responsibility for funding the project. The profits from the sale of the Certified Emission Reductions accrue to them.
• Bilateral funding. The Clean Development Mechanism project developers form partnerships with outside investors. Two ways of collaborating are through credit agreements, whereby the investors make advanced payments to the project, or through equity shares, whereby the investors take equity shares of the project.
• Multilateral funding. Funding for a project is derived from a funding or investment agency.
• open-ended funding. Funding for a project comes from various investors or funding agencies; for example, banks, through grants, through loans or through investors.

32
CASE STUDY 8: NELSoN MANDELA BAY: UNDErSTANDING THE CoSTS oF THE CLEAN DEvELopMENT MECHANISM, porT ELIzABETH (SoUTH AFrICA)
Nelson Mandela Bay: Understanding the Costs of the Clean Development Mechanism - port Elizabeth, South AfricaDuring research conducted in the Nelson Mandela Bay area, businesses were surveyed in order to assess whether any would be interested in accessing renewable energy and energy efficiency opportunities and generating carbon revenue. Many were willing to commit personnel and resources to investigate the potential of the Clean Development Mechanism. However, when presented with the required investment (in both transaction costs and project infrastructure) to initiate a project, the potential returns, the timeframe over which returns could be realised and the inherent uncertainty in having projects approved, the uncertainty of having credits verified and the cost of securing the services of a Designated Operating Entity, the financial incentive for businesses was typically very small and often non-existent. This is particularly true for African businesses, given the relative inexpensive electricity in many African countries and the associated disincentive for replacing this energy with renewable energy or energy efficient technologies. For public institutions, the financial viability of a project is not always the topmost priority. Government departments who were included in the survey were more concerned with the added responsibility of managing Clean Development Mechanism projects than with the potential revenue stream. The entire municipal financial model is geared towards spending rather than receiving revenue. As a result, it was difficult to motivate municipal departments to participate in the Clean Development Mechanism project as the financial incentive was void.
Furthermore, public sector entities are poorly equipped to mobilise people and budget for a novel and unfamiliar concept and concerns over how to account for the revenue under the specific financial management legislation were widespread. There was a frequent shortfall within government when it came to spending the additional resources required to turn an infrastructure project into a carbon trading project, and the tendency to repeat tried and tested industrial development and energy generation technologies is widespread, even if these technologies are inefficient or highly polluting. Even where public officials would like to engage with the carbon market, the lack of precedents as to how to contract services for this market, and how to structure roles and responsibilities, proved a barrier.
Lessons learnt in this case study suggest that not every desirable carbon trading project represents a money making opportunity. High transaction costs prevent smaller Clean Development Mechanism projects from being financially viable. Furthermore, although businesses need fairly accurate information on financial viability before they commit resources to a Clean Development Mechanism project, the financial viability for such a project is not the most important criteria for government structures when deciding to commit to a specific project.
33 Gupta, R., Kazi, S. and Cheatle, J. 2005. Newest Biggest Deal, Down To Earth, November 15 2005 Issue
34 World Bank’s carbon trading plans fail Africa, Bretton Woods Project, July 2, 2007.
In general, the longer the period between the time that investors invest in the project, and the time that Certified Emission Reductions or Verified Emission Reductions are issued, the greater the risk that the investors assume and the more they will expect in return. Where a single project developer (such as a local government) has the ability to pay for all project costs, and accordingly is able to take certified and issued credits to the market, they will receive the highest price for these credits. More typically, projects are required to sell some credits “forward” – in advance of project development, and based on a proposed project plan - in order to secure project development funds. Such credits are riskier and trade at a lower price.
The need for financial viability favours industrial projects with low marginal abatement costs and high volumes of credits. As a market commentator noted as far back as 2005, “the drive for “cheap” reduction is reflected in the kind of projects currently registered
or under validation. More expensive projects such as wind energy, constitute 7 per cent of all projects and constitute less than 3 per cent of Certified Emission Reductions being considered for sale, [in spite of the ecological merits of these projects]. There are no afforestation projects on the anvil. No high-end energy efficiency projects, no urban public transportation projects33.”
The financial viability hurdle is a particular constraint in Africa (World Bank, 2007). Africa accounted for just three per cent of certified emission reduction permit sales in 2008, with the majority going to China and India. The Bank recognized that the Clean Development Mechanism lacks a facility through which developing countries with “obvious energy needs can be rewarded for clean development34.” Case Study 9 from Abidjan shows how financial constraints in West Africa were overcome through investment from private companies.

33Making Carbon Markets Work for Your City | A Guide for Cities in Developing Countries
The Nelson Mandela Bay Case Study (Case Study 8) gives a good overview of some of the financial considerations required for project development and indicates why Clean Development Mechanism projects may be rejected by private sector companies due to the low returns on investment. Public sector institutions such as local governments may find grounds beyond straight financial returns to undertake a project. Project development costs aside, a significant and sometimes under-appreciated component of total project costs involves those associated with contracting a Designated Operating Entity. The Voluntary Carbon Standard allows for projects to be audited by “Certifying Bodies” but in practise these end up being the same companies charging the same costs as Designated Operational Entities.
Two approaches have been introduced by the Clean Development Mechanism – Executive Board in an attempt to reduce project development costs; “bundling” and “programme of activities”.
Bundling of Small-Scale projects: According to the UNFCCC, bundling refers to the: “bringing together of several small-scale Clean Development Mechanism project activities, to form a single Clean Development Mechanism project activity or portfolio without the loss of distinctive characteristics of each project activity. Project activities within a bundle can be arranged in one or more sub-bundles, with each project activities retaining its distinctive characteristics”35.
A number of different projects can be bundled together in order to reduce transaction costs and make small-scale projects more viable and less risky – because risks are spread amongst a number of different projects36. However, bundling of projects usually requires a bundling entity to oversee all the projects registered as part of the bundle. Each project must also take place over the same time period and must remain in the limits of a small-scale project. The Laguna de Bay Case Study (Case Study 10) shows an example of bundling, but in practice the monitoring and reporting requirements of bundling obviate some of the transaction cost benefits.
programmatic projects: At the Montreal COP in 2005, the UNFCCC introduced the notion of Programme of Activities (PoAs), leading to the following statement in 2006: “a local/regional/national policy or standard cannot be considered as a clean development mechanism project activity, but that project activities under a programme of activities can be registered as a single clean development mechanism project activity provided that approved baseline and monitoring methodologies are used that, inter alia, define the appropriate boundary, avoid double counting and account for leakage, ensuring that the emission reductions are real, measurable and verifiable, and additional to any that would occur in the absence of the project activity” (UNFCCC, 2006). ‘Programmes of Activities’ were intended to make project registration and progress easier. The
CASE STUDY 9: ABIDJAN MUNICIpAL SoLID WASTE-To-ENErGY proJECT, ABIDJAN (CoTE D’IvoIrE) CLEAN DEvELopMENT MECHANISM proJECT No. 2250
Abidjan Municipal Solid Waste-To-Energy project - Abidjan, Cote d’IvoireWest Africa has only recently (2009) registered its first Clean Development Mechanism project in Cote d’Ivoire. A company called SITRADE SA was integral in the development of this project, which involves the generation of electricity from Municipal Solid Waste through a process of anaerobic fermentation. A by-product from the process will be the generation of compost, which will be sold to farmers in the area. This project is not only the first Clean Development Mechanism project in the Ivory Coast, but it is also the first municipal solid waste to energy project in West Africa and the first municipal waste management system using the anaerobic fermentation process in the region.
The municipal solid waste treatment plant is based in the Bingerville District of Abidjan and will have positive social (job creation), environmental (methane reduction) and technological (transfers) benefits. The project is expected to avoid 502,318 tCO
2e over the first 7 years crediting period through methane reduction and the production
of energy from a renewable source. No funding from Annex 1 countries was received, and due to the tenuous political situation in Cote d’Ivoire, local investment was sought and secured through SITRADE, who received funding from the Banque d’investissement et de développement de la Communauté économique des Etats d’Afrique de l’Ouest (BIDC), which invests in development in West Africa and Fonds africain des biocarburants et des énergies renouvelables (FABER), which funds African biofuels and renewable energy projects.
For more information, see: http://www.lesafriques.com/actualite/mdp-abidjan-decroche-le-premier-projet-africain.html?Itemid=89?article=18114.
35 See: http://cdm.unfccc.int/EB/021/eb21repan21.pdf
36 Kumar, H.V., Kulkarni, S.V. and Thukral, K. 2004. Bundling Small-Scale CDM Projects. UNEP Risø Centre: Denmark

34
CASE STUDY 10: LAKE BASIN MANAGEMENT, LAGUNA DE BAY (pHILIppINES) CLEAN DEvELopMENT MECHANISM proJECT No. 1547
Lake Basin Management - Laguna de Bay, philippinesThe Laguna de Bay region in the Philippines includes an area of 3,880km2 situated near the Laguna lake. The area is currently experiencing pollution and sedimentation of this lake as a result of urban and economic development. The Carbonshed project, a carbon financing project, was developed in 2004 as a means to, firstly, build the capacity of the Laguna Lake Development Authority (LLDA) as an intermediary for potential carbon projects, and secondly, to implement carbon emissions reduction interventions to address the environmental impacts of development around the lake. An important aspect of this project is the engagement and capacity building of local government officials and lake communities. The benefits will not only be carbon credits, but better environmental governance.
Bundling The Carbonshed project is an example of a bundling of projects. Three distinct bundled projects have been considered in the region: (1) Avoidance of Methane Production from Biomass Decay through Composting; (2) Methane Recovery in Waste Water Treatment; and (3) Watershed Rehabilitation. As of October 2009, the first bundling project has been approved, that of avoidance of methane production. This project involves implementing a number of composting projects in different municipalities across the region. Composting biomass not only reduces the amount of waste taken to the landfills of the municipalities, but it also reduces methane production in these landfills. As mentioned earlier, every ton of methane captured equates to 21 Certified Emission Reduction’s.
Barriers and opportunitiesA number of barriers were encountered which resulted from the inclusion of local government within the project. These required the project developers to obtain political buy-in and surmount bureaucratic red-tape and stringent rules. There was also uncertainty about project staff and political representation, a divergence of priorities amongst the local officials, lack of manpower and capacity and insufficient technical know-how. However, through rigorous and intensive capacity building exercises, including marketing, workshops and monitoring training, the project development team was able to overcome these obstacles.
37 In theory, programmatic projects offer great potential for local government units, as they allow for city-wide (as opposed to single project) approaches to reducing greenhouse
gas emissions. For a practical reference on how cities can develop programmatic CDM projects, see World Bank, Cities and Carbon Finance, 20__ [provisional title;
forthcoming].
World Bank in July 2010 submitted a city-wide PoA for Amman City to the Clean Development Mechanism Executive Board, it is still under consideration (see http://cdm.unfccc.int/workshops/poa/d2s11_fs.ppt for further information). This approach considers many urban sectors and uses the available methodologies under the Clean Development Mechanism to implemented city-wide mitigation projects as part of an overall vision for a city, in the case of Amman it was a Green Growth Plan. If accepted it would allow cities to implement a multitude of GHG reduction projects which would in turn enable them to follow a low carbon development trajectory.
The Gold Standard now permits its Verified Emission Reduction projects to be certified under PoAs. The idea is that a particular technology or activity that reduced atmospheric emissions be registered so that every time this technology is installed or activity is undertaken, new credits can be issued without registering a new project. PoAs offer some potential for streamlining the bureaucratic processes that have evolved in order to comply with Clean Development Mechanism protocols.
The most acute glitch with Clean Development Mechanism projects, however, involves the difficulty in monitoring emissions reductions across potentially wide geographical areas and the premiums that Designated Operational Entities ask in order to take responsibility for certifying these projects37. Thus far (January 2010), this new mechanism has resulted in few registered projects.
As reflected in the preceding discussion, the initial emphasis of Clean Development Mechanism Programmes of Activities has been upon grouping similar projects together in a single sector, which may be dispersed over a wide geographic area. One Clean Development Mechanism methodology would be used for all of these projects, e.g., large-scale replacement of light bulbs. The World Bank’s Carbon Finance Unit refers to this form of programmatic approach as vertical aggregation: “a multiplicity of similar actions in a given sector or sub-sector”. The advantage of grouping similar projects together is that, where small scale projects on their own would not be viable due to high transaction costs, when grouped together under one cost, they become viable.

35Making Carbon Markets Work for Your City | A Guide for Cities in Developing Countries
TABLE 3: TABLE provIDING vALUES oBTAINED WHEN AppLYING THE GHG CALCULATIoNS ForMULAE
CALCULATING EMISSIoNS rEDUCTIoNS
Year Estimation of Project Activity emission reductions (tonnes of carbon dioxide equivalent)
Estimation of baseline emission reductions (tonnes of carbon dioxide equivalent)
Estimation of leakage (tonnes of carbon dioxide equivalent)
Estimation of emissions reductions (tonnes of carbon dioxide equivalent)
Year A
Year B
Year C
Year …
Total (tonnes of carbon
dioxide equivalent)
Recently, however, this Unit has been developing an innovative approach to PoAs in cities that rely upon horizontal aggregation: “a multiplicity of actions coordinated by an agency [such as a municipal government] across a range of sectors or sub-sectors”. As analysts explain: “A [Clean Development Mechanism] program run by a city government could encompass a range of activities in its area of jurisdiction, with direct interventions in its own activities and regulatory and incentive-based initiatives that facilitate the participation of the private sector and the community at large”. Such a multi-sector PoA could utilise more than one Clean Development Mechanism methodology. Some economists believe that such an approach could help to unlock the potential of carbon finance for cities – especially secondary cities – that, at present, cannot access carbon credits because their single-sector projects may be prohibitively small. World Bank officials characterise this innovative approach as a way to “expand the scope of the Clean Development Mechanism PoA”, but caution that “the current rules and guidelines under the Clean Development Mechanism are not directly applicable to this approach”38. At present (June 2010) the World Bank is testing its new “city-wide approach to carbon finance” in Amman, Jordan, with the hopes of eventually getting the Clean Development Mechanism Executive Board to recognise this multi-sector approach as a formal methodology.
4.1.2 Additional Certification: Environmental and Social Sustainability
Once financial viability has been established, other project features should be documented; including the need for an environmental impact assessment,
contributions to employment, biodiversity conservation and social acceptability. This will allow the project developer to establish whether or not the project will qualify for additional accreditation such as “Gold Standard” and Community, Conservation and Biodiversity (see Annex 1: Best Practice Standards).
4.2 The need for project documentation
Developing a carbon trading project requires the compilation and submission of certain documents.
The first official step is to write a letter and Project Identification Note to the UNFCCC’s Executive Board copied to the host country’s Designated National Authority. The letter should:
• Notify the above-mentioned parties of your intention to initiate a project and briefly describe the project content.
• Provide an unambiguous title for the project.
• Complete a Project Identification Note and submit it to the host country Designated National Authority (see Annex 7.439 for a sample Project Identification Note for the Lages Cogeneration Plant in Brazil and for the Project Identification Note template).
The Project Identification Note allows project developers to begin collating information needed for the full project application process. The application for a Project Identification Note is optional but
38 For further background see The World Bank, A City-Wide Approach to Carbon Finance, Washington, D.C., 2010.
39 For more information and further samples, visit: http://wbcarbonfinance.org/Router.cfm
36
40 Muller, B. (2009) Additionality in the CDM. Why and what? Oxford Institute for Energy Studies
recommended for first time project implementers as a means of securing early support from the Designated National Authority and from the Executive Board. The Executive Board can be contacted at http://cdm.unfccc.int/contact.html.
Once the project has submitted a Project Identification Note and been registered, the next step is to compile a Project Design Document. Compiling a Project Design Document is the responsibility of the project developer who may sub-contract this work to a specialist.
The format of the Project Design Document is stipulated by the Executive Board. Project Design Document contents should be entered under the following headings:
• General description. This includes information about interventions or technologies that will be applied, the project participants and designated official contact. Information must also include the host country and investor country, phases of the project and give a technology description. The UNFCCC requires applicants whose Project Design Documents contain confidential information to supply two copies. One is used for general circulation, which will have the confidential items removed (blacked out), and one will be for the Executive Board exclusively. The Executive Board is required to respect and protect project confidentiality.
• Baseline methodology and additionality case. The additionality requirement is a defining attribute of Clean Development Mechanism projects and compliance should be clearly demonstrated in the Project Design Document. Clean Development Mechanism projects are required to show that they “lead to reductions in emissions that are in addition to any that would occur in the absence of the project activity”. The obvious way to show additionality is by demonstrating that the GHG reductions would not have been forthcoming without the activity. Being able to show that the reduction of GHG required additional investment, which results in a lower rate of return or greater financial risk, can be used to support the case for additionality.
African countries have targeted a clause in the Bonn Agreements40 that allows for baselines to account for future emissions above current levels due to, “specific host country circumstances”. This has been used to make a case for including “suppressed demand” considerations in the establishing of African countries’ baselines and claiming additional credits; a successful precedent was established with the
Kuyasa project in Cape Town (Case Study 2). The basic argument is that if it were not for their poverty, the level of energy consumption by many African users would be much higher. As such, Africa’s baselines are currently “suppressed” and renewable technologies result in greater GHG savings (and more money from Clean Development Mechanism transactions) than determined using conventional Clean Development Mechanism carbon calculus. It should be noted as something to consider in all African projects involving energy efficiency or renewable energy. For more literature on “suppressed demand” see: http://www.southsouthnorth.org/library.asp.
Note: If a project wishes to submit a new methodology or baseline (i.e. an approach to emissions reductions or baseline establishment that has not yet been approved) you will be required to submit a Clean Development Mechanism – New Methodology: Baseline document.
• Duration of project activity. The Project Design Document should reflect the decision as to whether the trading period will involve a once-off 10 year period, in which case a single baseline will suffice, or 21 years with the baseline reviewed every 7 years.
• Monitoring methodology and plan. This section of the Project Design Document should outline “by whom” and “when” emission reductions will be monitored and how this monitoring will take place. This involves identifying the parameters that can be measured by an independent auditor to establish the exact volume of emissions that have been saved. Examples include: kilometres travelled by a transport fleet, electricity consumption by household and operating hours for a piece of machinery. It is normal to list a range of parameters so as to ensure accurate measurements.
• Calculation of greenhouse gas emissions reductions by sources. This section of the Project Design Document should calculate the amount of greenhouse gas emissions that will be saved over the lifetime of the project. The responsibility for calculating the reduction in GHG emissions lies with either the project developer or the investor, but the approach and the quantification will later be checked by an independent body. The calculation of GHG emission reductions needs to take into account leakages. Leakage refers to the emissions that are attributable to the project activity, but which occur outside of the project boundary. These “indirect” emissions should be included in the estimate of GHG savings. Where a reforestation project displaces tree felling or
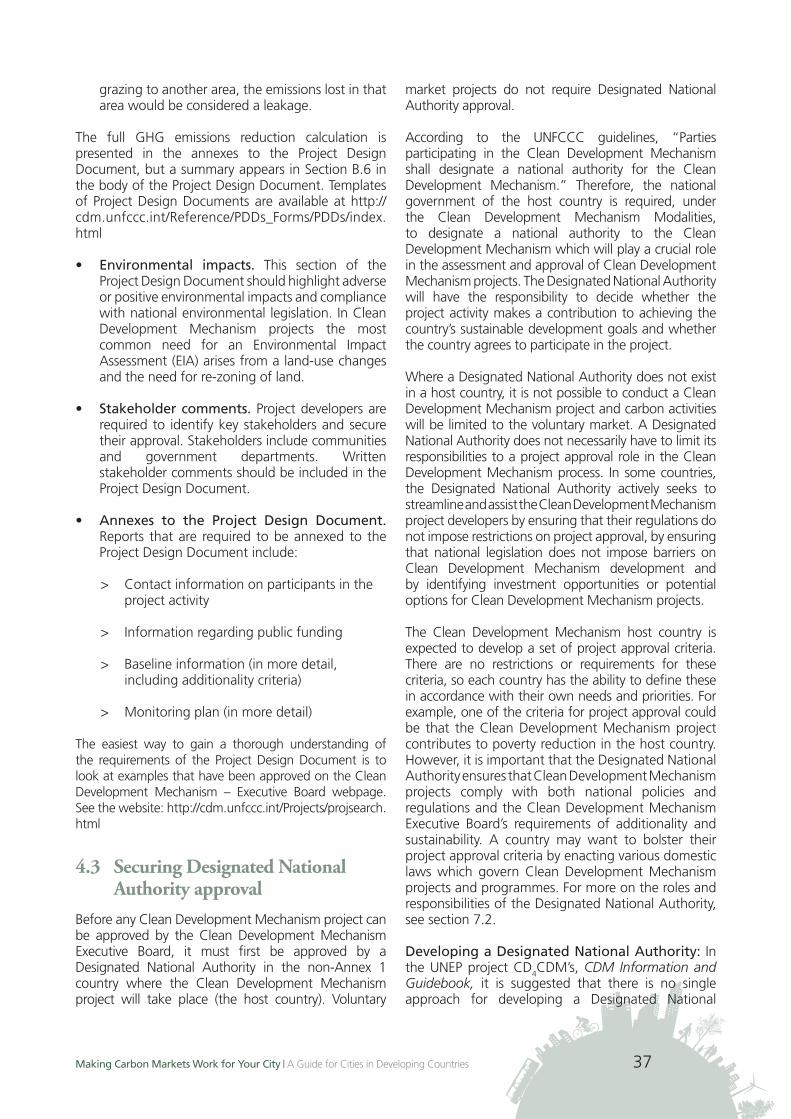
37Making Carbon Markets Work for Your City | A Guide for Cities in Developing Countries
grazing to another area, the emissions lost in that area would be considered a leakage.
The full GHG emissions reduction calculation is presented in the annexes to the Project Design Document, but a summary appears in Section B.6 in the body of the Project Design Document. Templates of Project Design Documents are available at http://cdm.unfccc.int/Reference/PDDs_Forms/PDDs/index.html
• Environmental impacts. This section of the Project Design Document should highlight adverse or positive environmental impacts and compliance with national environmental legislation. In Clean Development Mechanism projects the most common need for an Environmental Impact Assessment (EIA) arises from a land-use changes and the need for re-zoning of land.
• Stakeholder comments. Project developers are required to identify key stakeholders and secure their approval. Stakeholders include communities and government departments. Written stakeholder comments should be included in the Project Design Document.
• Annexes to the project Design Document. Reports that are required to be annexed to the Project Design Document include:
> Contact information on participants in the project activity
> Information regarding public funding
> Baseline information (in more detail, including additionality criteria)
> Monitoring plan (in more detail)
The easiest way to gain a thorough understanding of the requirements of the Project Design Document is to look at examples that have been approved on the Clean Development Mechanism – Executive Board webpage. See the website: http://cdm.unfccc.int/Projects/projsearch.html
4.3 Securing Designated National Authority approval
Before any Clean Development Mechanism project can be approved by the Clean Development Mechanism Executive Board, it must first be approved by a Designated National Authority in the non-Annex 1 country where the Clean Development Mechanism project will take place (the host country). Voluntary
market projects do not require Designated National Authority approval.
According to the UNFCCC guidelines, “Parties participating in the Clean Development Mechanism shall designate a national authority for the Clean Development Mechanism.” Therefore, the national government of the host country is required, under the Clean Development Mechanism Modalities, to designate a national authority to the Clean Development Mechanism which will play a crucial role in the assessment and approval of Clean Development Mechanism projects. The Designated National Authority will have the responsibility to decide whether the project activity makes a contribution to achieving the country’s sustainable development goals and whether the country agrees to participate in the project.
Where a Designated National Authority does not exist in a host country, it is not possible to conduct a Clean Development Mechanism project and carbon activities will be limited to the voluntary market. A Designated National Authority does not necessarily have to limit its responsibilities to a project approval role in the Clean Development Mechanism process. In some countries, the Designated National Authority actively seeks to streamline and assist the Clean Development Mechanism project developers by ensuring that their regulations do not impose restrictions on project approval, by ensuring that national legislation does not impose barriers on Clean Development Mechanism development and by identifying investment opportunities or potential options for Clean Development Mechanism projects.
The Clean Development Mechanism host country is expected to develop a set of project approval criteria. There are no restrictions or requirements for these criteria, so each country has the ability to define these in accordance with their own needs and priorities. For example, one of the criteria for project approval could be that the Clean Development Mechanism project contributes to poverty reduction in the host country. However, it is important that the Designated National Authority ensures that Clean Development Mechanism projects comply with both national policies and regulations and the Clean Development Mechanism Executive Board’s requirements of additionality and sustainability. A country may want to bolster their project approval criteria by enacting various domestic laws which govern Clean Development Mechanism projects and programmes. For more on the roles and responsibilities of the Designated National Authority, see section 7.2.
Developing a Designated National Authority: In the UNEP project CD4
CDM’s, CDM Information and Guidebook, it is suggested that there is no single approach for developing a Designated National

38
Authority. A number of approaches are possible and must take into account the needs and resources of each individual country. Referring to a book, Establishing National Authorities for the Clean Development Mechanism - a Guide for Developing Countries,41
some lessons are drawn on aspects of Designated National Authorities. It is stated that cross-sectoral coordination is indispensable, due to the multi-sectoral nature of the Clean Development Mechanism. It is also stated that institutional stability is an important factor in establishing a Designated National Authority. If no Designated National Authority exists, and the process to develop one proves a hindrance to the initiation of your Clean Development Mechanism project, it may be advisable to register your project on the Voluntary Market instead.
The Designated National Authority models are as follows:
• Single government department model: One department/ministry (most likely environment) undertakes all the activities of the Designated National Authority. The Designated National Authority is then located within the climate change unit or directorate.
• A two unit model: The activities of the Designated National Authority are split into two parts: one located within the department responsible for climate change, the other in an independent unit (to avoid possible conflicts of interest that may arise in a single government department model).
• Inter-departmental government model: This involves the establishment of a structure which allows all relevant government departments to be integrated into the Designated National Authority as permanent members. All member departments undertake project approval, but the ministry of environment may coordinate this structure.
• Foreign Direct Investment piggyback model: Most countries have a Foreign Direct Investment institutional framework, promoting Foreign Direct Investment. This could be used as a Designated National Authority.
• outsourcing model: In this model, the bulk of Designated National Authority services are outsourced to a private agency, which would report to a government agency.
Once the host country has decided how it would like to establish its Designated National Authority, it is
required to register this Designated National Authority with the Clean Development Mechanism Executive Board. See the following website to assess whether your country has a Designated National Authority: http://cdm.unfccc.int/DNA/index.html.
4.4 Project validation
Proposed Clean Development Mechanism projects are required to be certified and validated as eligible projects before they are able to secure financing. Validation requires the approval of the Designated National Authorities and other stakeholders in the transacting countries.
The Designated National Authority is required to issue a Letter of Approval for the project. This Letter of Approval proves that the project satisfies all the requirements of the host country. A Letter of Approval can also be useful for addressing risks associated with Clean Development Mechanism projects by ensuring that the Clean Development Mechanism project developers address key issues that may arise when developing a project. This may inspire investor confidence in the host country, making it more attractive for the implementation of projects.
A Designated Operational Entity is required to certify that the information in the Project Design Document is accurate, that the criteria of additionality and sustainability are upheld, that the project methodologies have been approved and to report on actual emissions saved. This phase of the project process can be the most difficult and costly. However, where a detailed validation process is followed the cost of monitoring and verification can be greatly reduced if the same Designated Operational Entity is used in both processes. A Designated Operational Entity is typically a private company that serves to validate any Clean Development Mechanism projects that have been approved by the Designated National Authority of a country.
A Designated Operational Entity must be accredited by the Clean Development Mechanism Executive Board and will typically be competent in one or more sectoral scopes; for example, energy distribution, metal production or waste handling. For a list of accredited Designated Operational Entities and their respective competencies, see http://cdm.unfccc.int/DOE/list.
41 Figueres, C. (editor) (2002) Establishing national authorities for the CDM. International Institute for Sustainable Development and the Center for Sustainable Development
in the Americas: Washington.

39Making Carbon Markets Work for Your City | A Guide for Cities in Developing Countries
4.5 Registration and Approval from the Executive Board
It is the responsibility of the Designated Operating Entity to submit the project to the Executive Board for Registration. An example of the registration request form that is submitted by the Designated Operational Entity can be found at: http://cdm.unfccc.int/UserManagement/FileStorage/FS_321458508.
This registration document is a synopsis of the Project Design Document prepared by the Designated Operating Entity. The registration costs are stipulated by the Executive Board.
The registration fee, which is paid to the Executive Board, may be deducted from the share of proceeds for administration from the expected annual certified emission reductions for the proposed activity over its crediting period. The registration fee is calculated based on a formula – see below. Registration is an advance payment, based on the issuance of Certified Emission Reductions during the first year. According to the latest guidelines42 by the EB the fees are calculated as follows:-
“The share of proceeds to cover administrative expenses is:
(a) USD 0.10 per certified emission reduction issued for the first 15,000 tonnes of CO
2 equivalent for
which issuance is requested in a given year.
(b) USD 0.20 per certified emission reduction issued for any amount in excess of 15,000 tonnes of CO
2 equivalent for which issuance is requested in a
given year.
(c) No share of proceeds shall be due for project activities hosted in least developed countries. The application of this exemption shall be based on the status of the country on the date of the publication of the request for issuance of certified emissions reductions.“
For project with annual emissions of less than 15,000 tonnes of CO
2 equivalent, no registration needs to be
paid.
Projects seeking approval and registration with the Executive Board are required to be published for public comment. It is not unusual for the Executive Board to query project details with project developers and to return projects for review and resubmission. There is some evidence (see table 6 below) that the Clean Development Mechanism Executive Board is becoming more stringent and screening projects more rigorously.
4.6 Credible monitoring
Monitoring of a Clean Development Mechanism project activity refers to the collection and archiving of all relevant data necessary for determining the baseline emissions, measuring anthropogenic emissions by sources of greenhouse gases within the project boundary activity and leakage, as applicable. Where necessary, projects will need to install additional monitoring equipment or design and implement a monitoring programme based on human measurement and surveys. Monitoring is expected to report back on both emissions reductions and baselines.
If a project wishes to submit a new monitoring methodology (i.e. a monitoring approach that has not yet been approved), then it will be required to submit a Clean Development Mechanism - New Methodology:
TABLE 4: NUMBEr oF CLEAN DEvELopMENT MECHANISM proJECTS “rEGISTErED AUToMATICALLY”, “rEGISTErED AFTEr rEvIEW” AND rEJECTED or WITHDrAWN BEForE AND AFTEr AprIL 2007
Before April 2007(724 projects finalized)
1 April 2007 – 31 october 2008(744 projects finalized)
Registered automatically1 82.0 per cent 41.0 per cent2
Registered after request for review 14.0 per cent 49.0 per cent
Rejected or withdrawn 4.0 per cent 10.0 per cent3
1 A project submission validated by a DOE and submitted to the Executive Board undergoes further vetting as it proceeds to registration ‘automatically’, unless three members
of the Executive Board (or a party) request a review. A request for review can lead ultimately to registration, rejection, or withdrawal. In April 2007, the Board expanded the
UNFCCC secretariat’s role in vetting projects. Please also see the Challenge of Success section of this booklet.
2 This represents an average; the trend is increasing
3 This represents an average; the trend is decreasing
42 CDM EB 54 Report Annex 29 Guidelines on the registration fee schedule for proposed project activities under the clean development mechanism.
40
$ 6.00
$ 4.00
$ 2.00
$ 0.00
ER Buyer takes Registration Risk
Seller takes Registration Risk
Not Kyoto Pre-Compliance Kyoto Pre-Compliance
FIGURE 11: WHAT IS THE prICE oF A CErTIFIED EMISSIoN rEDUCTIoN or vErIFIED EMISSIoN rEDUCTIoN? The price of a ton of CO
2 equivalent (a Certified Emission Reduction) is the subject of supply and demand. In the first
half of 2005 the price increased significantly. What this figure, based on the Prototype Carbon Funds data up to and including 2004, illustrates is that the agreed price of a Certified Emission Reduction depends on who accepts what risks
Monitoring application. Go to the website: http://cdm.unfccc.int/Reference/Documents/Guidel_Pdd/English/Guidelines_CDMPDD_NMB_NMM.pdf.
4.7 Verification
The Designated Operating Entity is responsible for verifying actual emissions in accordance with the monitoring plan, once the project has started. Once emissions have been verified, they can then be issued by the Clean Development Mechanism Executive Board. The easier the monitoring process, the lower the verification costs charged by Designated Operational Entities. In some instances it is worth project developers investing in new monitoring technology simply to facilitate verification.
4.7.1 Securing reasonable terms and prices
It is incumbent on the two transacting parties to negotiate the terms and conditions on which Certified Emission Reductions or Verified Emission Reductions will be traded. It is important to establish who takes the responsibility and risk for specific activities, costs and potential liabilities. Payment for credits can be made in advance of the credits being generated and issued, but this clearly places the risks with the buyer and leads to a lower price being paid for the credits. Figure 11 illustrates how different agreements affect the price of a Certified Emission Reduction.
The terms and conditions of a transaction are recorded in an Emissions Reduction Purchase Agreement (see Text Box 5 on Emissions Reduction Purchase Agreementss). The Emissions Reduction Purchase Agreements stipulates the Certified Emission Reduction price. The price is the outcome of a bargaining process and not necessarily reflective of the project’s marginal abatement costs.
To date, most Certified Emission Reductions have been purchased by institutional buyers. The key players in this market include:
• Prototype Carbon Fund, the World Bank www.prototypecarbonfund.org
• The Netherlands Clean Development Mechanism Facility
• IFC-Netherlands Carbon Facility
• Italian Carbon Fund
• Austrian Carbon Facility
• Finnish Carbon Facility
• Sweden Carbon Facility
As of 2005, it is no longer necessary to have identified an investor in order to register a project; ‘unilateral projects’ are now permissible. By registering a project
Source: http://www.ambientediritto.it/dottrina/Politiche%20energetiche%20ambientali/politiche%20e.a/opportunities_riva_alberti.htm

41Making Carbon Markets Work for Your City | A Guide for Cities in Developing Countries
An Emissions Reduction Purchase Agreement represents the deal between the owner of carbon credits (whether Certified Emission Reductions or Verified Emission Reductions) and the buyer. An Emissions Reduction Purchase Agreement stipulates the quantity of credits that will be traded on a specific date at a specified price. This allows buyers and brokers of credits to enter into forward contracts to sell the credits and removes some risk from the market.
Where Emissions Reduction Purchase Agreement are signed in advance of project certification and issuance (as is often the case), they tend to place the bulk of carbon trade risk onto project developers. Most Emissions Reduction Purchase Agreements require developers or sellers of credits to offer alternative, but similar, credits or incur a penalty equal to the value of the credits plus a premium, if the envisaged volume of credits do not materialise on the given date. This can be very difficult. As complexity of project certification increases, projects can be delayed for an increasing number of reasons; some of them beyond the control of project developers.
One option is for project developers or sellers of credits to stipulate in the Emissions Reduction Purchase Agreement that credits will be supplied to a given buyer as and when they become available. This prevents project developers from selling credits behind an expectant buyer’s back, but allows projects to develop at the most suitable pace. It also removes considerable risk from developing country developers and sellers, where predicting the exact course and timing of a project’s progress can be difficult.
unilaterally, and thereby holding on to Certified Emission Reductions, a better price might be achieved for Certified Emission Reductions.
4.8 Issuance
The final step in project approval involves issuance of Certified Emission Reductions. Issuance requires the instruction by the Executive Board, to the Clean Development Mechanism registry administrator, to issue a specified quantity of Certified Emission Reductions for a project activity into the pending
account of the Executive Board in the Clean Development Mechanism registry. Issuance should occur 35 days after the request for issuance, unless the project goes under Request for Review in which case another 28 days should be expected. All issuances occur through the Executive Board. It is issued credits that represent actual reductions in the greenhouse gases and which form the currency of carbon trading. The registry board will keep track of all issuances. It is not a requirement for the project parties to have finalised Certified Emission Reduction Agreements before issuance.
TExT BOx 5: EMISSIoNS rEDUCTIoN pUrCHASE AGrEEMENTS EMISSIoNS rEDUCTIoN pUrCHASE AGrEEMENTS

42
5. loCal governmenT ProjeCTs as a soluTion To Clean develoPmenT meChanism barriers
This handbook is predicated on the assumption that there is potential for local governments to become more involved in Clean Development Mechanism projects. It might be argued that if the opportunities for local governments were so great, more local government-driven projects would have emerged.
Those carbon trading projects that have been supported by local governments tend to be the more successful, but very few local governments have the knowledge or capacity to undertake such projects. This handbook attempts to draw on existing success stories to create greater capacity for carbon market engagement in local governments.
It is proposed that local governments might pursue carbon trading projects to:
• Fulfil their sustainable development responsibilities
• Access funding and technology that will result in better infrastructure
• Meet provincial and local targets related to the 15 scopes
• Address the global threat of climate change.
Successfully implementing a carbon trading project is not easy, but local governments with their ability to invest for reasons other than short-term financial gain, and their obligation to ensure the long-term integrity of the environment, are well placed to overcome some of the barriers that currently frustrate the progress of carbon trading projects.
In order for local governments to be successful in carbon market activities, including the development of projects, there need to be clear reasons why public sector institutions, and not private businesses, should take responsibility for the Clean Development Mechanism process. Governments in developing countries have a history of “crowding-out” private sector activity and of being persuaded to take on flawed development schemes on behalf of local entrepreneurs.
There are, however, attributes to the climate change threat and the carbon market that render it inherently suitable for government involvement. The rationale for government involvement in this market includes:
• Government service provision: Developing country governments, and local governments in particular, are responsible infrastructure, housing, local economic development, the provision of services (including solid waste removal) and public transport backlogs. Accordingly, government entities will be commissioning a range of activities with inherent carbon trading potential. To commission this work without realising the inherent carbon revenue potential would represent a lost opportunity.
• Government interventions: The key drivers of climate change are all the result of “externalities”; costs that are not brought to bear on the person or company responsible for them. These external costs account for the undesirably high levels of greenhouse gas emissions. Carbon trading projects represent an attempt to redress this and which allows governments to effectively manage these external costs. This was acknowledged in the forging of the Kyoto Protocol, an intergovernmental agreement; but in order to make the Kyoto Protocol effective, non-Annex 1 countries will be required to make use of these instruments in their regular activities.
• Government scope: A number of the best carbon trading opportunities in the developing world are linked to parastatals. The activities of energy utilities and state owned mines, transport companies and forestry companies are, in many instances, linked to developing country governments. Realising the mitigation and carbon trading potential in these companies is unlikely without proactive government involvement.
• Government mandates: The delivery of renewable technologies, including solar water heaters, photovoltaic panels, wind turbines, solid waste management, compact fluorescent

43Making Carbon Markets Work for Your City | A Guide for Cities in Developing Countries
light bulbs and hydrogen cell technologies, can be linked to government-led enterprise support programmes and can be used to create local employment and to support small businesses.
• Government finances: Local governments in developing countries, like businesses, face financial constraints, but typically apply lower discount rates than private sector businesses in assessing the viability of projects.43 Carbon trading projects are characterised by the need for upfront investment and delayed returns and, accordingly, lower discount rates significantly alter the Net Present Value of these initiatives. As a result, the set of carbon projects that is financially viable for public entities is larger than those available to the private sector.
• Spreading risks: Portfolios provide a scale for carbon transactions that is attractive to investors. A portfolio further allows investors to spread their risks across emissions reduction projects in accordance with their preferences. Both attributes strengthen the hand of non-Annex 1 country projects in the negotiation process and will result in better prices for the certified emissions reductions.
• Government accountability: Without the necessary understanding and caution, there is potential for carbon trading projects to give rise to unintended and undesirable outcomes. Accordingly, there is a clear need to steward carbon trading projects. Government, more so than private companies, is well placed to act as the custodian of the national carbon industry and this will prove easier where public sector institutions have a pro-active role in this market. Specific challenges that government is well placed to meet include:
i. Matching supply with demand peaks. The growing number of power cuts in many areas demonstrates the need for new approaches to energy supply, but the needs must be carefully assessed to ensure that the development of renewable energy and energy efficiency is compatible with energy demand. This prevents the stream of renewable technologies becoming supply-driven and incompatible with regional demand.44
ii. Preventing carbon investors harvesting the “low hanging fruit”. Post-2012, non-Annex 1 countries will confront their own UNFCCC
43 The lower discount rates applied by government are the result of the lower financial risk in government projects and the public sector operating environment.
44 While some renewables provide energy on demand (e.g. landfill gas), the availability of others changes according to environmental conditions. Matching the supply of wind,
solar and tidal energy (both over time and in different places) allows utilities to optimise a diverse renewable energy portfolio that provides greater resource reliability and lower
system variability (or intermittency). This in turn affects operational aspects of the electricity grid, such as backup capacity and load following capacity.
TExT BOx 6: HoW MIGHT A LoCAL GovErNMENT CArBoN porTFoLIo WorK IN prACTICE?
How might a Local Government Carbon portfolio work in practice?Local governments in developing countries confront targets with regards to housing, infrastructure and energy delivery and some have set themselves renewable energy targets.
In commissioning a new housing and electrification programme, the local government would insert a clause in the terms of reference stating that the work to be undertaken should realise all carbon market potential and specifying some of the expectations in this regard (ceiling insertion for thermo-regulation, the use of CFL in light fittings, solar passive designs, the inclusion of solar water heaters and the inclusion of a localised mini-grid powered by solar and wind energy, for example).
Contractors unfamiliar with these requirements could be referred to NGOs or consultants for assistance in understanding the requirements, but the intention would be to deliberately facilitate the entry of those companies with proven competencies in the provision of renewable energy and energy efficient technologies, into the mainstream economy. Ensuring that projects are carbon market compliant might require government to pay a premium for the work, but this money would be recouped from the sale of emission reduction certificates.
The contract would only be considered complete once the contracting authority had satisfied itself that whatever carbon market potential existed had been fulfilled. Critically it would be the responsibility of the contracting authority to take the project through the certification process, register the Certified Emission Reductions and to include these in a portfolio of Certified Emission Reductions that would be marketed to potential investors.
The revenue from carbon transactions would accrue to the contracting authority. This revenue could be used to off-set additional costs incurred in project development and could be used at the local authority’s discretion.

44
emissions reduction obligations. Developing countries need to ensure that they do not sell all their low abatement cost options to foreigners in this pre-2012 window, leaving only more difficult and more expensive options for the country itself.
iii. Managing technology transfer. Carbon trading projects have the potential for constructive technology transfers that could assist developing countries attain a future energy supply based on renewables and promote the type of economic growth that will address national priorities. There is, however, equal potential for the off-loading of obsolete or labour substituting technology at high prices indexed in foreign currencies. Local governments are well placed to ensure
that this unwelcome outcome does not ensue.
iv. Some carbon trading projects, particularly small-scale projects, have large development potential. Non-Annex 1 countries need to ensure that these sorts of projects, supported by buyers of carbon credits, go ahead and leverage a style of development that is consistent with local development programmes. In some instances, the contribution of a carbon trading project to social and environmental benefits might make it worthy of local government investment even when it does not generate a profit. In these examples, carbon revenue simply reduces the fiscal burden of desirable development projects.

45Making Carbon Markets Work for Your City | A Guide for Cities in Developing Countries
6. furTher reading and resourCes
Bond, P., Dada, R. and Erion, G. (2007) Climate Change, Carbon Trading and Civil Society: Negative Returns on South African Investment. UKZN Press: Durban.
Brown, K., Adger, W.N., Boyd, E., Corbera-Elizalde, E and Shackley, S. (2004) How do CDM projects contribute to sustainable development? Tyndall Centre for Climate Change Research. Accessed from http://www.tyndall.ac.uk/content/how-do-cdm-projects-contribute-sustainable-development.
Carbon Trade Watch Publications. Available at: http://carbontradewatch.gn.apc.org/index.php?option=com_content&task=view&id=25&Itemid=41
Cartwright, A. and Cooper, D. (2006) Local Government Carbon Portfolios: how can local governments in South Africa benefit from the Kyoto Protocol. Available at: www.carbon.org.za.
Ellis. J. and Levina, E. (2005) The Developing CDM Market. OECD/IEA: France. Accessed from: http://www.oecd.org/dataoecd/62/38/35798536.pdf.
Ellis, J. and Kamel, S. (2007) Overcoming Barriers to Clean Development Mechanism Projects. OECD/IEA: France. Accessed from: http://www.ingentaconnect.com/content/oecd/16091914/2007/00000007/00000001/0207011ec003.
ESCAP. 2007. Climate Change Action in Asia and the Pacific: Lessons Learned and Policy Implications. A Guide to Clean Development Mechanism Projects Related to Municipal Solid Waste Management. United Nation’s Economic and Social Commission for Asia and the Pacific: Thailand. Accessed from: http://www.unescap.org/esd/environment/publications/cdm/Guide.pdf.
Figueres, C. (editor) (2002) Establishing national authorities for the CDM. International Institute for Sustainable Development and the Center for Sustainable Development in the Americas: Washington. Accessed from: http://www.cckn.net/kyoto.asp.
Figueres, C. and Bosi, M. (2006) Achieving Greenhouse Gas Emission Reductions in Developing Countries through Energy Efficient Lighting Projects in the Clean Development Mechanism. Carbon Finance Unit: World Bank. Accessed from: http://figueresonline.com/publications/lighting_and_CDM.pdf.
IOB Evaluations. (2008) Clean and sustainable? An evaluation of the contribution of the Clean Development Mechanism to sustainable development in host countries. The Hague.
Kumar, H.V., Kulkarni, S.V. and Thukral, K. (2004) Bundling Small-Scale CDM Projects. UNEP Risø Centre: Denmark. Accessed from: http://www.risoe.dtu.dk/rispubl/SYS/syspdf/sys_6_2006.pdf.
Monbiot, G. (2006) Heat: how can we stop the planet burning? London, Penguin.
Muller, B. (2009) Additionality in the CDM. Why and what? Oxford Institute for Energy Studies.
Olsen, K. (2007) The Clean Development Mechanism’s Contribution to Sustainable Development: a Review of the Literature. Climatic Change, 84 (1): 59-73.
PACE. (2009) A Framework for carbon revenue generation in Nelson Mandela Bay Municipality. Available at: http://www.carbon.org.za.
Ringius, L., Grohnheit, P.E., Nielsen, L.H., Olivier, A.L., Painuly, J. and Villavicencio, A. (2002) Wind power Projects in CDM: Methodologies and Tools for Baselines, Carbon Financing and Sustainability Analysis. Risø National Laboratory: Denmark. Accessed from: http://uneprisoe.org/WindCDM/index.htm.

46
SouthSouthNorth. (2006) Renewable Energy and Energy Efficiency in Africa: Carbon Finance Guide. SouthSouthNorth, The Gold Standard and Reep: Tanzania and Mozambique. Accessed from http://www.southsouthnorth.org/default.asp?/library.asp.
Spalding-Fecher, R. (editor) (2002) The CDM guidebook: A resource for Clean Development Mechanism Project Developers in Southern Africa. Energy and Development Research Centre: Cape Town. Accessed from: http://www.ahk.org.br/cdmbrazil/imagens/edrc.pdf.
Thorne, S. and Raubenheimer, S. (no date) Sustainable Development (SD) appraisal of Clean Development Mechanism (CDM) projects – experiences from the SouthSouthNorth
(SSN) project. Forum for Economics and Environment – First Conference Proceedings
Accessed from http://www.southsouthnorth.org/default.asp?/library.asp.
UNEP. (no date) CDM Information and Guidebook (2nd edition). UNEP CD4CDM series. UNEP Risø Centre on Energy, Climate and Sustainable Development: Denmark. Accessed from: http://www.cd4cdm.org/Guidebooks.htm.
UNEP. (no date) CDM Sustainable Development Impacts. UNEP CD4CDM series. UNEP Risø Centre on Energy, Climate and Sustainable Development: Denmark. Accessed from: http://www.cd4cdm.org/Guidebooks.htm.
UNEP. (no date) Legal Issues Guidebook to the Clean Development Mechanism. UNEP CD4CDM series. UNEP Risø Centre on Energy, Climate and Sustainable Development: Denmark. Accessed from http://www.cd4cdm.org/Guidebooks.htm.
UNEP. (no date) Wind Power and the CDM: Emerging practices in developing wind power projects for the CDM. UNEP CD4CDM series. UNEP Risø Centre on Energy, Climate and Sustainable Development: Denmark. Accessed from http://www.cd4cdm.org/Guidebooks.htm.
UNEP. (2005) Baseline Methodologies for CDM Projects. UNEP CD4CDM series. UNEP Risø Centre on Energy, Climate and Sustainable Development: Denmark.
Accessed from http://www.cd4cdm.org/Guidebooks.htm.
UNEP. (2005) PDD Guidebook: Navigating the Pitfalls. UNEP CD4CDM series. UNEP Risø Centre on Energy, Climate and Sustainable Development: Denmark.
UNEP. (2007) Guidebook to Financing CDM Projects. UNEP CD4CDM series. UNEP Risø Centre on Energy, Climate and Sustainable Development: Denmark. Accessed from http://www.cd4cdm.org/Guidebooks.htm.
UNEP. (2008) A Reformed CDM – including new Mechanisms for Sustainable Development. UNEP CD4CDM series. UNEP Risø Centre on Energy, Climate and Sustainable Development: Denmark. Accessed from http://www.cd4cdm.org/Guidebooks.htm.
UNEP. (2008) PDD Guidebook: Navigating the Pitfalls (Second edition). UNEP CD4CDM series. UNEP Risø Centre on Energy, Climate and Sustainable Development: Denmark. Accessed from: http://www.cd4cdm.org/Guidebooks.htm.
UNEP. (2009) Implementing CDM Projects: Guidebook to Host Country Legal Issues. UNEP CD4CDM series. UNEP Risø Centre on Energy, Climate and Sustainable Development: Denmark. Accessed from http://www.cd4cdm.org/Guidebooks.htm.
UNEP, UCCEE and UNCTAD. (2002) An emerging market for the environment: A Guide to Emissions Trading (first edition). UNEP Collaborating Centre on Energy and the Environment. Accessed from: http://www.unep.org/publications/search/pub_details_s.asp?ID=113.
Winkler, H., Spalding-Fecher, R., Tiyani, L. and Matibe, K. (2000) Cost-benefit analysis of energy efficiency in low cost housing. ERC: University of Cape Town.

47Making Carbon Markets Work for Your City | A Guide for Cities in Developing Countries
7. annexes
7.1 Best Practice Standards
7.1.1 The Gold Standard
In 2001, a coalition of NGOs, lead by WWF, developed the CDM Gold Standard in response to the perceived poor quality of project proposals. The intention was to ensure that Clean Development Mechanism projects contributed to sustainable development. “The Gold Standard is a methodology to develop high-quality Clean Development Mechanism projects with high environmental integrity and secured local social, environmental and economic benefits” - Michael Schlup, Director, The Gold Standard Foundation. The Gold Standard Foundation is now based in Geneva with an office in Johannesburg. The standard is administered and awarded by an independent Advisory Board consisting of a coalition of international NGOs.
The key requirements of a Gold Standard project include:
i. A “project screen” to ensure that only renewable energy and demand-side energy efficiency projects are eligible (project types A-D and G-I, excluding fuel switches: Appendix B, FCCC/CP/2002/7/Add.3 Annex II) are approved.
ii. An “additionality screen” which ensures a comprehensive means of verifying that emissions reductions and sustainable development impacts are achieved, which is not significantly different from the conventional Clean Development Mechanism requirement, but ensures that the Executive Board’s “Tool for the demonstration and assessment of additionality45” is applied and that the number of Certified Emission Reductions arising from the project is not inflated by artificially high baselines.
iii. The “sustainability screen” which ensures high levels of stakeholder consultation and explicit attention to the environmental, social and economic impacts of the project.
Purchasers of Gold Standard credits can be sure that credits are derived from projects making a genuine
contribution to sustainable development. Project developers can be certain credits will command a fair price. Host governments and local communities see projects reflect their priorities and contribute to sustainable development, through stakeholder participation.
As such, the Gold Standard represents something of a salvage act on the original intentions of the Clean Development Mechanism and has attracted its own criticism for covering up what is perceived by many to be the unsatisfactory manner in which initial Clean Development Mechanism projects have been implemented; “the Gold Standard is insufficient to cure a sickening Clean Development Mechanism” (ECO, 2002)46. Arguably the chief beneficiaries of Gold Standard projects are investors who are able to apply the information to lower the risk and reduce development costs. In some instances this has led to higher prices being paid for Certified Emission Reductions.
A novel addition to the voluntary carbon market has recently been created by the Gold Standard Foundation for projects that involve less than 5,000 tCO
2e per annum. These Gold Standard Micro
projects pay a once-off USD 5,000 fee and a small certification and issuance fee. The Gold Standard Foundation assumes responsibility for the cost of contracting a Designated Operational Entity to verify some of these projects. Currently, Gold Standard Micro certification represents the cheapest means of verifying a voluntary market project; USD 7,500 in the first year and roughly USD 1,500 every year thereafter for a 5,000 tCO
2e per annum project.
7.1.2 The voluntary Carbon Standard
The Voluntary Carbon Standard, based in London, is the voluntary carbon market’s effort to self-regulate, following concerns over the credibility of some voluntary carbon market activities. The Voluntary Carbon Standard Association maintains a centralised Verified Emission Reduction registry and allows some methodologies related to ‘agriculture, forestry and other land use’ (AFOLU) that are not yet permitted under the Clean Development Mechanism. The four categories of Agriculture, Forestry and Other Land
45 See: http://cdm.unfccc.int/EB/Meetings/016/eb16repan1.pdf
46 See: http://www.climatenetwork.org/eco/2002/cop-8-new-delhi-october-2002/Eco8.pdf

48
Use permitted under Voluntary Carbon Standard are:
• Afforestation, Reforestation and Revegetation (ARR)
• Agricultural Land Management (ALM)
• Improved Forest Management (IFM)
• Reducing Emissions from Deforestation and Degradation
Regrettably, Voluntary Carbon Standard projects have not reduced the transaction costs associated with project development and remain dependent on Designated Operational Entities for project verification. The Voluntary Carbon Standard has been successful in introducing greater flexibility in the types of carbon trading projects that are officially recognised.
7.1.3 The Chicago Carbon Exchange
The Chicago Carbon Exchange (CCx) operates North America’s cap and trade system for GHGs and allows the United States to participate in the carbon market while not a signatory to the UNFCCC.
The CCx operates a membership scheme. Emitting members sign a voluntary but legally binding commitment to cap emissions. Purchasers of CCx credits can be located anywhere in the world but the exchange is linked to similar exchanges in Australia, Canada, China and Europe.
The CCx provides a centralised registry that prevents credits from being sold more than once.
In recent months, however, the CCx has lost value in anticipation that the United States’ renewed commitment to climate change will see it enter the United Nations and European based Verified Emission Reduction market. In October 2009, a Verified Emission Reduction on the CCx was valued at USD 0.15.
7.1.4 The Climate, Community and Biodiversity Standard
In a parallel response to the perceived weaknesses in Clean Development Mechanism activities, the Climate, Community and Biodiversity Alliance, developed a set of guidelines for the evaluation of land-based carbon mitigation projects in the early stages of development. The stated aim is to identify projects that:
i. Address climate change, support local communities and conserve biodiversity
ii. Promote excellence and innovation in project design
iii. Help mitigate risk for investors and increase funding opportunities for project developers
The Climate, Community and Biodiversity Alliance has developed a set of indicators, for community involvement and restoring or maintaining biodiversity, which should be satisfied wherever carbon emissions are reduced or absorbed. As a pilot project, the Climate, Community and Biodiversity Alliance has targeted China’s State Forestry Administration which, if successful, will be the first to apply Climate, Community and Biodiversity standards.
TABLE 5: THE vALIDATIoN AND vErIFICATIoN MANUAL ApproACH To rESTorING CLEAN DEvELopMENT MECHANISM CrEDIBILITY BY INTroDUCING A CHECKLIST DErIvED FroM KYoTo
rEQUIrEMENT rEFErENCE
1. The project shall assist Parties included in Annex I in achieving compliance with part of their emission reduction commitment under Art. 3.
Kyoto Protocol Art. 12.2
2. The project shall assist non-Annex I Parties in achieving sustainable development and shall have obtained confirmation by the host country thereof.
Kyoto Protocol Art. 12.2, Simplified Modalities and Procedures for Small Scale Clean Development Mechanism Project Activities §23a
3. The project shall assist non-Annex I Parties in contributing to the ultimate objective of the UNFCCC.
Kyoto Protocol Art. 12.2.
4. The project shall have written approval of voluntary participation from the designated national authorities of each party involved.
Kyoto Protocol Art. 12.5a, Simplified Modalities and Procedures for Small Scale Clean Development Mechanism Project Activities §23a
5. The emission reductions should be real, measurable and give long-term benefits related to the mitigation of climate change.
Kyoto Protocol Art. 12.5b

49Making Carbon Markets Work for Your City | A Guide for Cities in Developing Countries
7.1.5 The validation and verification Manual Standard
The Gold Standard has restored some confidence back to the Clean Development Mechanism, but the ultimate challenge remains to use the Kyoto Protocol to ensure that Clean Development Mechanism projects have their intended impact. The Clean Development Mechanism Validation and Verification Manual47 is a manual that seeks to enable this. The manual presents a list of checks that were intended for Designated Operational Entities but which, if satisfied, are capable of adding integrity and strength to developing country projects.
7.2 Roles and Responsibilities of the Designated National Authority
If developing countries are to fulfil their carbon trading potential, it is essential that the Designated National Authorities act consistently and strategically.
• Don’t second-guess the Executive Board. Decisions as to whether or not projects are ‘additional’, ‘fungible’, ‘verifiable’ or compliant with UNFCCC’s requirements reside with the Clean Development Mechanism Executive Board. It is common for Designated National Authorites in non-Annex 1 countries to attempt to legitimise their position by judging project proposals that they receive in terms of whether they are likely to
rEQUIrEMENT rEFErENCE
6. Reduction in GHG emissions must be additional to any that would occur in absence of the project activity, i.e. a Clean Development Mechanism project activity is additional if anthropogenic emissions of greenhouse gases by sources are reduced below those that would have occurred in the absence of the registered Clean Development Mechanism project activity.
Kyoto Protocol Art. 12.5.c, Simplified Modalities and Procedures for Small Scale Clean Development Mechanism Project Activities §26
7. Potential public funding for the project from Parties in Annex I shall not be a diversion of official development assistance.
Marrakech Accords (Decision 17/CP.7)
8. Parties participating in the Clean Development Mechanism shall designate a national authority for the Clean Development Mechanism.
Marrakech Accords (Clean Development Mechanism modalities§ 29)
9. The host country shall be a Party to the Kyoto Protocol. Marrakech Accords (Clean Development Mechanism modalities§ 30)
10. The proposed project activity shall meet the eligibility criteria for small scale Clean Development Mechanism project activities set out in § 6 (c) of the Marrakech Accords and shall not be a debundled component of a larger project activity.
Simplified Modalities and Procedures for Small Scale Clean Development Mechanism Project Activities §12a,c
11. The project design document shall conform with the Small Scale Clean Development Mechanism Project Design Document format.
Simplified Modalities and Procedures for Small Scale Clean Development Mechanism Project Activities, Appendix A
12. The proposed project activity shall confirm to one of the project categories defined for small scale Clean Development Mechanism project activities and uses the simplified baseline and monitoring methodology for that project category.
Simplified Modalities and Procedures for Small Scale Clean Development Mechanism Project Activities §22e
13. Comments by local stakeholders are invited, and a summary of these provided.
Simplified Modalities and Procedures for Small Scale Clean Development Mechanism Project Activities §22b
14. If required by the host country, an analysis of the environmental impacts of the project activity is carried out and documented.
Simplified Modalities and Procedures for Small Scale Clean Development Mechanism Project Activities §22c
15. Parties, stakeholders and UNFCCC accredited NGOs have been invited to comment on the validation requirements and comments have been made publicly available.
Simplified Modalities and Procedures for Small Scale Clean Development Mechanism Project Activities §23b,c,d
47 See: http://cdm.unfccc.int/public_inputs/2008/VVM/index.html
50
48 The executive board is responsible for approving methodologies, baselines and monitoring procedures. There is an argument in support of this DNA scrutiny of projects,
namely that it will enhance the quality of projects emanating from a country and contribute to that country’s “CDM brand” value.
49 Bond, P. and Dada, R. (eds) (2005) Trouble in the Air: Global warming and the privatised atmosphere. Durban: Centre for Civil Society, University of KwaZulu-Natal and
Amsterdam: Transnational Institute.
50 The Delphi Group (2004) Dealing with the Details around CDM.
meet with Executive Board approval48. Designated National Authority attempts to pre-empt Executive Board decisions provide unnecessary hurdles and delays and come at the expense of the Designated National Authority’s other responsibilities. Based on the stringency applied by the Executive Board to date, there is no justification for trying to pre-empt their decisions nationally.
• Focus on local sustainability criteria. Host country Designated National Authorities are charged with the responsibility of ensuring that the project proposal is compliant with national sustainability criteria and is appropriate in terms of national development initiatives. Ensuring that small-scale projects do not result in environmental degradation is particularly important. Small-scale projects have the most potential to alleviate poverty and contribute to sustainable development, but environmental degradation quickly haemorrhages these benefits by undermining the livelihood strategies of the poor.
• Draw on Environmental Legislation. If Clean Development Mechanism projects are to fulfil their potential, the Designated National Authority must draw on environmental legislation to define
sustainability criteria that can be easily applied to project proposals. Effective application of environmental legislation would address the concerns raised by Bond & Dada49, that carbon trading projects will be used to legitimise pollution activities that should be outlawed under a country’s commitment to the Montreal & Kyoto Protocols, and that they will encourage the transfer of dirty industries and pollution to poor regions in non-Annex 1 countries.
• Clarify sustainability criteria for investors. Clear sustainability criteria, and their consistent application, are important for creating a secure investor environment. Uncertainties over sustainability issues, and their possible implications for projects, are a far greater deterrent to investor countries than stringent but clear criteria (Delphi Group, 2004)50.
• Co-ordinate mix and spread of renewable energy sources. In terms of best practice, the Designated National Authority has a further crucial role to play in co-ordinating the mix and geographical spread of renewable energy projects that are supported by the Clean Development Mechanism (see text box 7). In the next decade,
TExT BOx 7: THE IMporTANCE oF THE CorrECT GEoGrApHICAL SprEAD AND TECHNoLoGICAL MIx
Geographical Spread and Technological MixEnergy from renewable sources is intermittent; the supply of wind, sunshine and waves is highly variable and location specific and it is difficult to match the timing and location of energy from these sources with demand. Research commissioned by the Carbon Trust, and headed by Graham Sinden of Oxford University, reveals that the right mix and spread of renewable energy sources can reduce the need for conventional energy back-up in the United Kingdom by nine-fold. The more widely renewable energy sources (turbines, rooftop photovoltaic cells, tide and wave energy mechanisms and micro-hydro schemes) are dispersed the greater the assurance that energy will be generated somewhere and the more stable the energy supply curve. It is not simply a case of more renewable energy always being better, or putting wind turbines where the wind blows the strongest.
Tidal power, for example, is predictable but variable; tidal power will drop to zero four times a day when the tide turns and power is roughly three times greater during spring tides than during neap tides. Wave energy is less predictable. For example, in Southern Africa, it tends to be greatest in winter and autumn when low pressure systems traverse the coastline. Off-shore wind energy is highly variable but is known to be greater in summer. A judicious combination of tide, wave and off-shore wind could have low variability, be more capable of meeting demand patterns and makes better use of expensive off-shore transmission infrastructure. This mix will not be achieved, however, unless renewable projects are developed in a co-ordinated manner.
As the custodian of the Clean Development Mechanism’s contribution to national sustainability, the Designated National Authority should ensure that what occurs in the name of the Clean Development Mechanism reflects national sustainable development strategies and not the opportunistic and piecemeal efforts of consultants and project developers.

51Making Carbon Markets Work for Your City | A Guide for Cities in Developing Countries
51 Erion, G (2005) Low Hanging Fruit Always Rots First. Cited in “Trouble in the Air” Bond & Dada (2005).
52 This concept is consistent with Endogenous Growth Theories (Nicholas Kaldor 1962, Kenith Arrow 1962, Paul Romer 1986) that are now accepted as having the greatest
explanatory power in predicting economic growth.
developing countries will confront strategic decisions with regard to how they satisfy regional energy demand in the coming half-century. It is crucial that the mix and spread of renewable technologies is appropriate in terms of satisfying future energy demand; an outcome that is unlikely unless the Designated National Authority co-ordinates the development of this sector.
• Monitor technology transfer. A further important focus for developing country Designated National Authorities involves ensuring that the technologies that are transferred via the Clean Development Mechanism are appropriate in terms of their development pathway. The Clean Development Mechanism should not be used to:
> Dump obsolete technologies that Annex 1 companies are not able to sell on the open market.
> Transfer technologies that are inappropriate in terms of the country’s capital/ labour ratios.
> Impose technologies that require imported components and expertise to maintain.
• Engage the Executive Board around domestic priorities. The UNFCCC claims that “no methodology is excluded a priori so that project participants have the opportunity to propose any methodology.” The Designated National Authority should be proactive in lobbying the Clean Development Mechanism Executive Board with regards to methodologies and guidelines that will advance the developing world’s Clean Development Mechanism cause. A successful example of such lobbying – although it did not come from the Designated National Authority – includes the inclusion of suppressed demand considerations at Kuyasa. South Africa’s “suppressed demand” experience illustrates a
principle that other Annex 1 & non-Annex 1 countries have been applying successfully for some time, namely that the evolution of Clean Development Mechanism methodologies and concepts can and should be influenced by national perspectives.
7.3 Low Hanging Fruit
The threat of “harvesting of low hanging fruit” is frequently cited in the context of the Clean Development Mechanism. The criticism is applied in two different contexts, one of which lacks merit and the other of which is worth considering.
The purchasing of the low marginal abatement cost options by industrialised countries is often cited as a risk for non-Annex 1 countries that are expected to confront an emissions reduction target post-2012 (Erion, 2005)51. Where non-Annex 1 countries sell off their low-cost options, they will be left with the more expensive options when complying with their own emissions reduction targets. This conceptualisation of the “low hanging fruit” fails to appreciate the pace and nature by which renewable technologies develop.
Renewable technologies are advancing so quickly that the opportunities that will be available to developing countries, by the time they may be faced with emissions reductions obligations, are likely to be entirely different and cost considerably less than those available today. The leaders in a renewable energy driven economy are likely to be those countries and companies that develop the capacity to manufacture and use renewable technologies. Available Clean Development Mechanism investment and technologies should be applied to initiate a learning-by-doing technological expansion that introduces self-perpetuating (non-linear) returns in the form of experience and skills in the renewable energy sector52. The most appropriate strategy involves realising as many Clean Development Mechanism opportunities
TABLE 6: EvALUATIoN oF proJECT BENEFITS BY HoST CoUNTrIES
project Cost of carbon abatement (USD/tonne Co2)
rural development positive local environmental impacts
Access to state-of-the-art technology
PFBC 1 Low Medium Medium
IGCC 30 Low High High
Wind power 31 Medium–high High High
Source: Gupta & Bhandari (2000) in Bond et al (ibid).

52
as possible with a combination of host country and Annex 1 country Clean Development Mechanism investment prior to 2012. Attempts to withhold Clean Development Mechanism opportunities speculatively will only result in delays to small-scale projects, many of which should be taking place regardless of whether or not Clean Development Mechanism investment is available.
The “low hanging fruit” expression is used in another context that is important. Table 7 illustrates a clear trade-off between low-cost carbon abatement and high sustainable development benefits by using Gupta & Bhandari’s (2000) assessment of PFBC (pressurised fluidised bed combustion), IGCC (integrated gasification combined cycle) and wind-based power generation.
PFBC which offers low (local) environmental, economic and technology benefits may prove more attractive to Clean Development Mechanism investors than renewable energy technologies (such as wind power), which yield substantial gains in terms of improvement in quality of life, market development, energy security and local environmental benefits. From the host country perspective, however, this would be a miss-allocation of Foreign Direct Investment resources.
The attributes that make projects attractive to investors do not necessarily concur with the factors that make for desirable projects from a host country perspective. Developing countries’ Designated National Authorities should define their priorities and criteria for project approval so as to avoid directing Clean Development Mechanism investors to “low-hanging fruits” that do not yield significant or appropriate local benefits.
7.4 Sample: Project Idea Note
ProjeCt IdeA note
A. project description, type, location and schedule
Name of project: Lages Cogeneration Plant
Technical summary of the project Date submitted: 05/06/2003
GENErAL DESCrIpTIoN
project description and proposed activities
The Cogeneration Unit of Lages is a 28 MW installed capacity plant which produces 25 t/h of steam, using as fuel residues from the sawmill industries of the region.
The residues are introduced into the furnace of the boiler through threads installed in a silo. The burning of this biomass generates 120 ton of steam per hour at a pressure of 65 bar and 480°C of temperature. The residues which will be used in the Unit are the green sawdust, shavings with and without bark, wood chips and the dry “maravalha”. These residues, except the dry “maravalha”, have approximate humidity levels of 50 per cent resulting in Lower Heating Value of 1,850 kcal/kg. These residues also require adapted burners. The dry “maravalha” presents humidity levels close to 15 per cent and Lower Heating Value of 3,600 kcal/kg.
The steam generated is sent to a condensation turbine which transforms the thermal energy contained in the steam in mechanical energy, producing rotation movement in its axis of 5.400 rpm. The turbine is coupled to a reducing gear box which in turn is linked to a Synchronous Generator of electric energy.
Through a controlled extraction directly in the turbine and/or in the steam line, it is possible to supply up to 25 ton of steam per hour at 9 bar. After the turbine, the steam at a pressure of 0,1 bar (vacuum) enters in the condenser, turning to hot water. The condenser has a circuit of water comprising of two centrifugal pumps which bring water from the basin of the cooling tower aiming to condensate the steam. The water used to condense the steam is sent to the top of the tower in order be cooled, closing the circuit of the cooling tower. All water used in the steam generation process will be supplied from the Caveiras river near the plant.
The cold water is stored in tanks, being pumped into the walls of the boiler, becoming steam again and ending the cycle.
The mitigation of greenhouse gases will result from two processes. In the elimination of wood residues stockpiles which produce CH
4 during the decomposition process
(80,000 ton carbon dioxide equivalent/year) and also in the substitution of natural gas in the electricity generation (38,500 ton carbon dioxide equivalent/ano).

53Making Carbon Markets Work for Your City | A Guide for Cities in Developing Countries
Technology to be employed The biomass is burnt in a high pressure boiler (65 bar), where the water becomes steam (120 t/h at 65 bar, 480ºC). The steam will be expanded in a turbine of 28 MW.
This technology is regularly used in the Brazilian sugar/ethanol mills to produce both steam to the industrial process and electricity.
project proponent submitting the project Identification Note
Name Tractebel Energia S.A.
organizational category Private company
other function(s) of the project developer in the project
Sponsor
Summary of relevant experience Tractebel Energia S.A., located in Florianópolis city, Santa Catarina State, has been arisen from Centrais Elétricas do Sul do Brasil S.A. – ELETROSUL (a subsidiary of ELETROBRÁS, the federal holding company) created in December 23th, 1968 in order to generate, transmit and commercialize electricity.
Operating 11 power plants, hydro and thermal, installed in several Brazilian States, Tractebel Energia continues investing in new enterprises that, in the past 5 years, extended its installed power from 3,500 to 5,953 MW. With the commitment to contribute for the continuity of Brazilian development, Tractebel Energia is the private electricity generator which has invested more in the enlargement of electricity supply in the country. Tractebel Energia has a vast generation estate, with 75 per cent of hydropower plants and 25 per cent of thermal power plants, spread out in Santa Catarina, Rio Grande do Sul, Paraná, Mato Grosso do Sul and Goiás States, being responsible for up to 7 per cent of the Brazilian installed capacity.
Tractebel Energia provides electricity to the distributors responsible to Santa Catarina, Rio Grande do Sul, Paraná and Mato Grosso do Sul, besides providing to Furnas a share of its electricity sold to the Southeast Region.
Address Antônio Dib MussiStreet, 366 Florianópolis, Santa CatarinaZip Code 88015-110
Contact person Carlos Alberto de Verney Gothe
Telephone / fax Telephone number: + 55 48 221 7072
E-mail and web address [email protected]
project sponsor(s) financing the project
Name BRDE – Banco Regional de Desenvolvimento do Extremo Sul
organizational category Government agency
Address www.brde.com.brUruguai Street, 155 – 4th floorZip Code: 90010-140 Porto Alegre - RS - Brazil Phone Number: + 55 51 3215-5000 Facsimile: +55 51 3215-5050 e-mail address: [email protected]

54
Main activities BRDE is a state-owned financial institution founded by the States of Rio Grande do Sul, Santa Catarina and Paraná on December 22, 1961 to promote development. The bank was set up as an interstate government agency and has its own administrative autonomy and legal personality. As a government agency, with capital shared equally between the member states, its total assets are included in the equity of these States, and as subsidiaries are liable for its obligations. Its operating area is the southern region of Brazil with agencies in Porto Alegre (Rio de Grande do Sul), where its headquarters are also situated, Florianópolis (Santa Catarina) and Curitiba (Paraná). Each agency is responsible for running the business in its own State.
As a governmental tool to promote the development of the Region, BRDE has financed, in 40 years, a cumulated amount of USD 15.6 billion, inducing total investments of USD 36.2 billion, distributed between more than 40 thousand projects, resulting in generation and maintenance of 1.3 million jobs and a additional collection, for the controller States, up to USD 4.7 billion.
Summary of the financials In (R 1,000)Equity 380.697Equity capital 85.303 Capital reserve 709 Earned surplus 304.632 Net worth and equity 1.845.918
Type of project
Greenhouse gases targeted CO2 / CH
4
Type of activities Abatement
Field of activitiesa. Energy supply Biomass
Location of the project
region South America
Country Brazil
Nearest city Lages – Santa Catarina
precise location Lages – Santa Catarina
Expected schedule
Earliest project start date 2004
Estimate of time required before becoming operational after approval of the project Identification Note
Time required for financial commitments: 0 monthsTime required for legal matters: 0 monthsTime required for negotiations: 0 monthsTime required for establishment: 12 months
Expected first year of CErTIFIED EMISSIoN rEDUCTIoN / ErU / rMU / vErIFIED EMISSIoN rEDUCTIoN delivery
2005
project lifetime 20 years
Current status or phase of the project
Identification and pre-selection phase
Current status of the acceptance of the Host Country
Memorandum of Understanding is under discussion
The position of the Host Country with regard to the Kyoto protocol
The Host Country a. signed and ratified the Kyoto Protocol

55Making Carbon Markets Work for Your City | A Guide for Cities in Developing Countries
B. Expected environmental and social benefits
Estimate of carbon sequestered or conserved (in metric tonnes of Co2 equivalent or tCo2e)
Up to and including 2012: 944.000 tCO2e
Up to a period of 10 years: 1.180.000 tCO2e
Up to a period of 7 years: 826.000 tCO2e
Up to a period of 14 years: 1.652.000 tCO2e
Baseline scenario The distribution of electricity in Brasil is centralised. Hydroelectricity is responsible for about 82 per cent of the electricity produced. In peak consumption hours and dry seasons the thermal plants (mainly natural gas, diesel oil and coal) are activated. This scenario includes the operation of the Lages Power Plant that is the object of this study.
The non accomplishment of this project would result in an increase of carbon emissions of up to 38,000 tCO
2eq per year, resulting from electricity
production.
Almost the whole biomass that will be used as fuel in the plant, is current deposited in stockpiles around the sawmills, emitting large amounts of CH
4,
resulting from the decomposition process.
When these residues are burnt in a boiler, emissions of 80.000 tCO2eq per
year are avoided.
Existing vegetation and land use All the wood residues considered in this project come from existent reforestations which supply the local sawmill industry with raw material.
According to estimates, the project will consume less than 10 per cent of the residues available in the region.
Specific environmental benefits
Local benefits Even if in that study the substitution of the natural gas is being considered, almost the totality of mineral coal plants of the country are located in this region, due to the proximity of the reserves.
The installation of this enterprise presents a renewable alternative to the use of the mineral coal as fuel, reducing not only the greenhouse gases emissions but also SO
x emissions, which contribute to acid rain formation
and the consequent depreciation of the local environmental quality. The mineral coal of these reserves presents high sulphur levels.
The use of wood residues as fuel collaborates to the improvement of local environmental quality, due to the reduction of residues stockpiles in the area.
In general, residue stockpiles are left in the environment, often being burnt outdoors. This practice is prohibited by law, but in some cases the residues are thrown away into the rivers, degrading the water.
Global benefits It contributes to the decrease of greenhouse gas emissions.
Socio-economic aspects The most important socioeconomic aspect of the project is related to the development of a regional market for the collection and preparation of the biomass residues.
Nowadays the deposits of this type of residues represent a serious environmental problem in the area.
The entrepreneur intends to outsource the collection of the residues and its transportation to the plant.
What are the direct effects? Another direct benefit of the enterprise is related to the technology to be used.
Most of the equipment used in biomass generation systems are produced or assembled in Brazil whereas the equipment for the natural gas based thermal power plants are imported.
This implies in a positive impact in the balance of trade, besides the development of the national industry.

56
What are other effects?
Consistency between the project and the environmental strategy or priorities of the Host Country
There is a great effort of the Brazilian government in order to diversify the energy matrix for electricity production in the country.
Nowadays, approximately 90 per cent of whole electric energy of the country is of hydraulic origin. In relation to greenhouse gas emissions this represents a great advantage. However, in recent years the country has suffered a shortage related to a hydro deficiency which has impacted the electricity generation.
There are efforts of the Government to increase the generation of natural gas based thermal, even though the construction of these plants has not attracted private investors due to the fact that the fuel is to be paid in USD and the price of the energy in Brazilian Reals.
The proposal of this project coincides with the energy and environmental strategies of the Brazilian government.
C. Finance
project costs
preparation costs 0,76 USD million
Establishment costs 15,70 USD million
other costs 15,70 USD million
Total project costs 20,20 USD million (Base Fx rate 1 USD = 3.50 R)
Sources of finance to be sought or already identified
Equity TRACTEBEL – 8,00 USD million
Debt – Long-term BRDE – 12,2 USD million
Debt – Short term
Not identified
Contribution sought from the BioCarbon Fund
BioCarbon Fund contribution sought in upfront payment
Sources of carbon finance
Indicative Certified Emission reduction / ErU / rMU / verified Emission reduction price
4 USD/ton CO2 eq
Emission reductions value USD 7,080,000 in 15 years.
Until 2012 USD 3,776,000
For 10 years USD 4,720,000
For 7 years USD 3,304,000
For 14 years USD 6,608,000
Financial analysis FIRR without carbon:
FIRR with carbon:

57Making Carbon Markets Work for Your City | A Guide for Cities in Developing Countries
annex 8 - CounTries inCluded in annex b To The kyoTo ProToCol and Their emissions TargeTs
Country Target (1990** - 2008/2012)
EU-15* (Austria, Belgium, Denmark, Finland, France, Germany, Greece, Ireland, Italy, Luxembourg, Netherlands, Portugal, Spain, Sweden, United Kingdom), Bulgaria, Czech Republic, Estonia, Latvia,Liechtenstein, Lithuania, Monaco, Romania,Slovakia,Slovenia, Switzerland - 8 per cent
US*** - 7 per cent
Canada, Hungary, Japan, Poland - 6 per cent
Croatia - 5 per cent
New Zealand, Russian Federation, Ukraine
0
Norway + 1 per cent
Australia + 8 per cent
Iceland + 10 per cent


Making Carbon Markets Work for Your City:A Guide for Cities in Developing Countries
Copyright © United Nations Human Settlements Programme(UN-HABITAT), 2012
HS/
DIScLAIMER
The designations employed and the presentation of material in this document do not imply the expression of any opinion whatsoever on the part of the Secretariat of the United Nations concerning the legal status of any country, territory, city or area or of its authorities, or concerning the delimitation of its frontiers or boundaries, or regarding its economic system or degree of development. The analysis conclusions and recommendations of this publication do not necessarily reflect the views of the United Nations Human Settlements Programme or its Governing Council.
United Nations Human Settlements Programme (UN-HABITAT)P.O. Box 30030, GPO Nairobi 00100, KenyaTel: + 254 20 762 1234Fax: + 254 20 762 3092Website: www.unhabitat.org
AckNOwLEDGEMENTS
Principal coordinating author: Lucinda Fairhurst
contributors: Bernhard Barth, Anton Cartwright, Iole Isiassaias, David Githaiga, Robert Kehew, Vincent Kitio, Derek Morgan, Debapriya Roy, Andrew Rudd, Raf Tuts
coordinator: Bernhard Barth
Design and layout: Gideon Mureithi/UNON
Editors: Tom Osanjo and Fernando Cabrera Diaz
Printing: UNON, Publishing Services Section, Nairobi, ISO 14001:2004-certified

Making Carbon Markets Work for Your City:A Guide for Cities in Developing Countries
CITIES AND CLIMATE CHANGE INITIATIVETOOL SERIES
UNITED NATIONS HUMAN SETTLEMENTS PROGRAMMECities and Climate Change Initiative P.O. Box 30030, 00100 Nairobi, KenyaTel: +254 20 7625404 • Fax: +254 20 7623715Email: [email protected] • www.unhabitat.org/ccci www.unhabitat.org
“Making Carbon Markets Work for Your City” is part of UN-Habitat’s Cities and Climate Change Initiative tool series for local government officials and urban professionals in developing countries who have to deal with the growing problems of climate change. This work seeks to enhance the capacity of local government officials to initiate, develop and manage greenhouse gas reduction projects, and to get the carbon financing they need. It explains to local governments that although there are many barriers to launching and implementing such projects, there are also many advantages and opportunities to be derived.
Other publications in this series are:
• Local Leadership for Climate Action
• Developing local Climate Change Plans – A Guide for Cities in Developing Countries
• Planning for Climate Change – A Strategic, Values-Based Approach for Urban Planners
• Participatory Climate Change Assessments - A Toolkit Based on the Experience of Sorsogon City, the Philippines
All documents are downloadable from www.unhabitat.org/ccci