Citi 2017 Global Property CEO Conference - The Park Hotels/media/Files/P/Park-Hotels-IR-V2/... ·...
50
MARCH 6-8, 2017 Waldorf Astoria Orlando Hilton Chicago Hilton Hawaiian Village Waikiki Beach Resort Citi 2017 Global Property CEO Conference
-
Upload
truongtuyen -
Category
Documents
-
view
217 -
download
1
Transcript of Citi 2017 Global Property CEO Conference - The Park Hotels/media/Files/P/Park-Hotels-IR-V2/... ·...

MARCH 6-8, 2017
Waldorf Astoria Orlando Hilton Chicago Hilton Hawaiian Village Waikiki Beach Resort
Citi 2017 Global Property CEO Conference
To be the preeminent Lodging REIT,focused on consistently delivering superior,
risk-adjusted returns for shareholders throughactive asset management and a thoughtful external
growth strategy, while maintaining a strongand flexible balance sheet
Mission
2 |

3 |
Park Hotels & Resorts OverviewCasa Marina, a Waldorf Astoria Resort
4 |
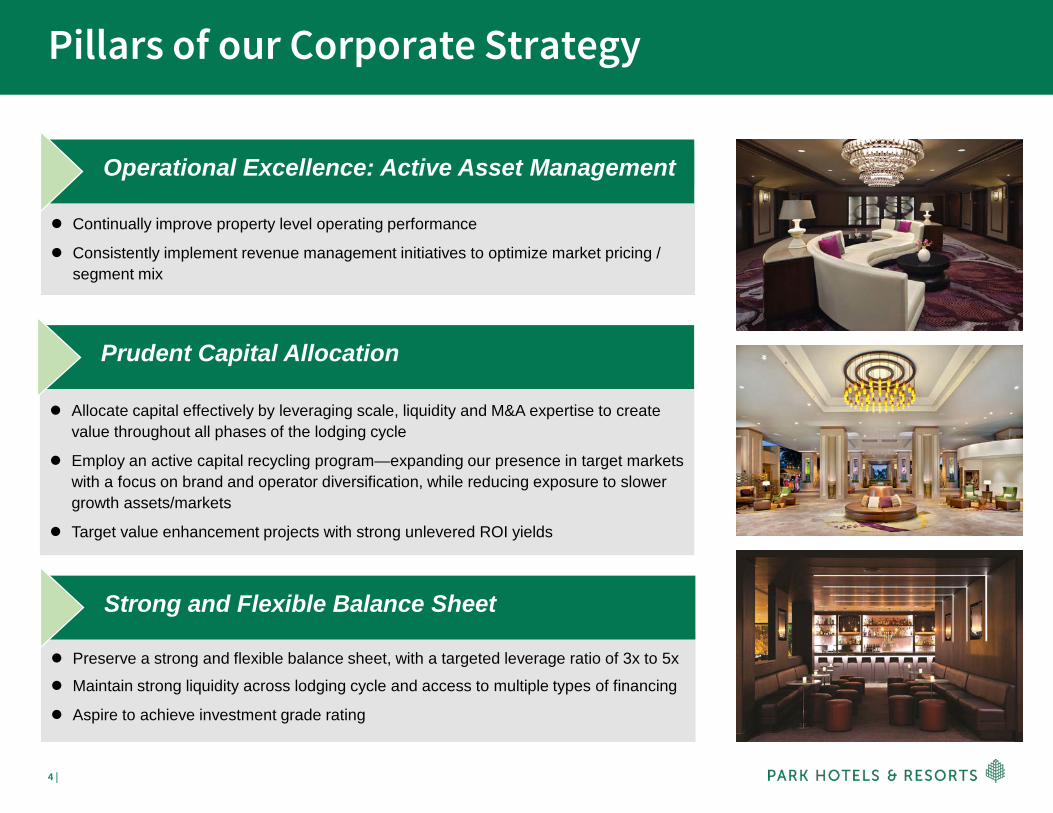
Preserve a strong and flexible balance sheet, with a targeted leverage ratio of 3x to 5x
Maintain strong liquidity across lodging cycle and access to multiple types of financing
Aspire to achieve investment grade rating
Strong and Flexible Balance Sheet
Continually improve property level operating performance
Consistently implement revenue management initiatives to optimize market pricing / segment mix
Allocate capital effectively by leveraging scale, liquidity and M&A expertise to create value throughout all phases of the lodging cycle
Employ an active capital recycling program—expanding our presence in target markets with a focus on brand and operator diversification, while reducing exposure to slower growth assets/markets
Target value enhancement projects with strong unlevered ROI yields
Pillars of our Corporate Strategy
Operational Excellence: Active Asset Management
Prudent Capital Allocation
5 |
Company Highlights
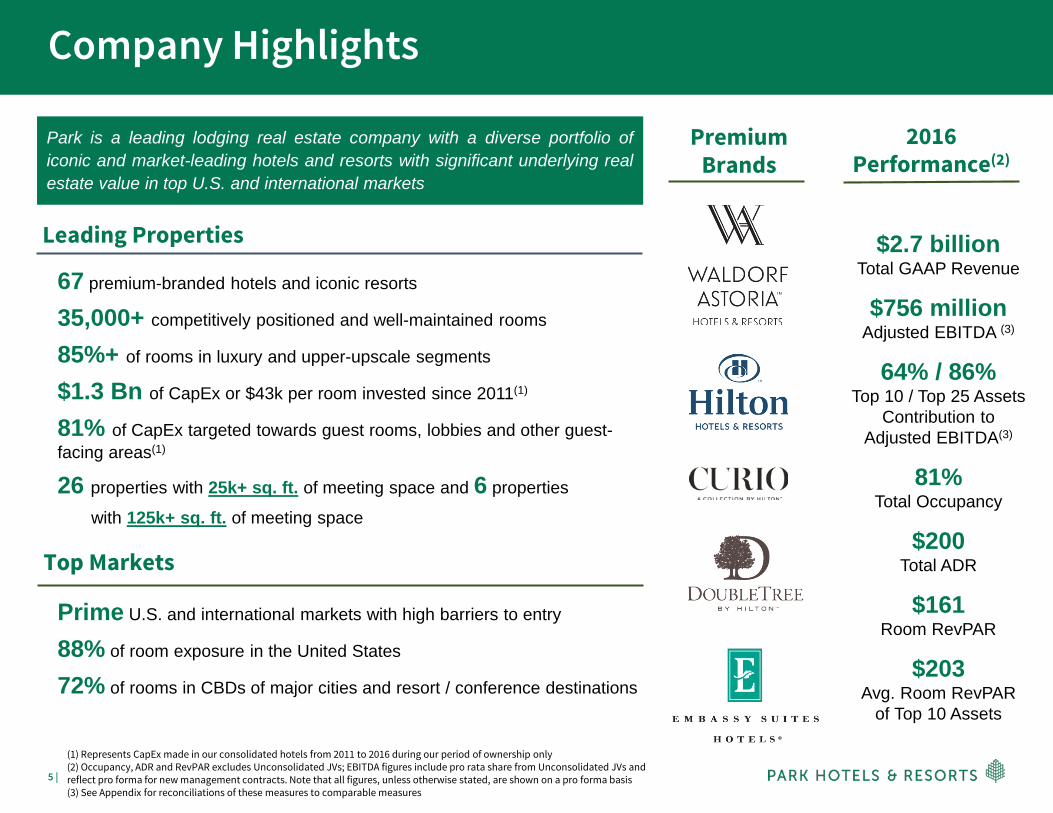
Park is a leading lodging real estate company with a diverse portfolio oficonic and market-leading hotels and resorts with significant underlying realestate value in top U.S. and international markets
Leading Properties
67 premium-branded hotels and iconic resorts
35,000+ competitively positioned and well-maintained rooms
85%+ of rooms in luxury and upper-upscale segments
$1.3 Bn of CapEx or $43k per room invested since 2011(1)
81% of CapEx targeted towards guest rooms, lobbies and other guest-facing areas(1)
26 properties with 25k+ sq. ft. of meeting space and 6 properties
with 125k+ sq. ft. of meeting space
Top Markets
Prime U.S. and international markets with high barriers to entry
88% of room exposure in the United States
72% of rooms in CBDs of major cities and resort / conference destinations
PremiumBrands
2016Performance(2)
$2.7 billionTotal GAAP Revenue
$756 millionAdjusted EBITDA (3)
64% / 86%Top 10 / Top 25 Assets
Contribution to Adjusted EBITDA(3)
81%Total Occupancy
$200Total ADR
$161Room RevPAR
$203Avg. Room RevPAR
of Top 10 Assets
(1) Represents CapEx made in our consolidated hotels from 2011 to 2016 during our period of ownership only(2) Occupancy, ADR and RevPAR excludes Unconsolidated JVs; EBITDA figures include pro rata share from Unconsolidated JVs and reflect pro forma for new management contracts. Note that all figures, unless otherwise stated, are shown on a pro forma basis (3) See Appendix for reconciliations of these measures to comparable measures
6 |
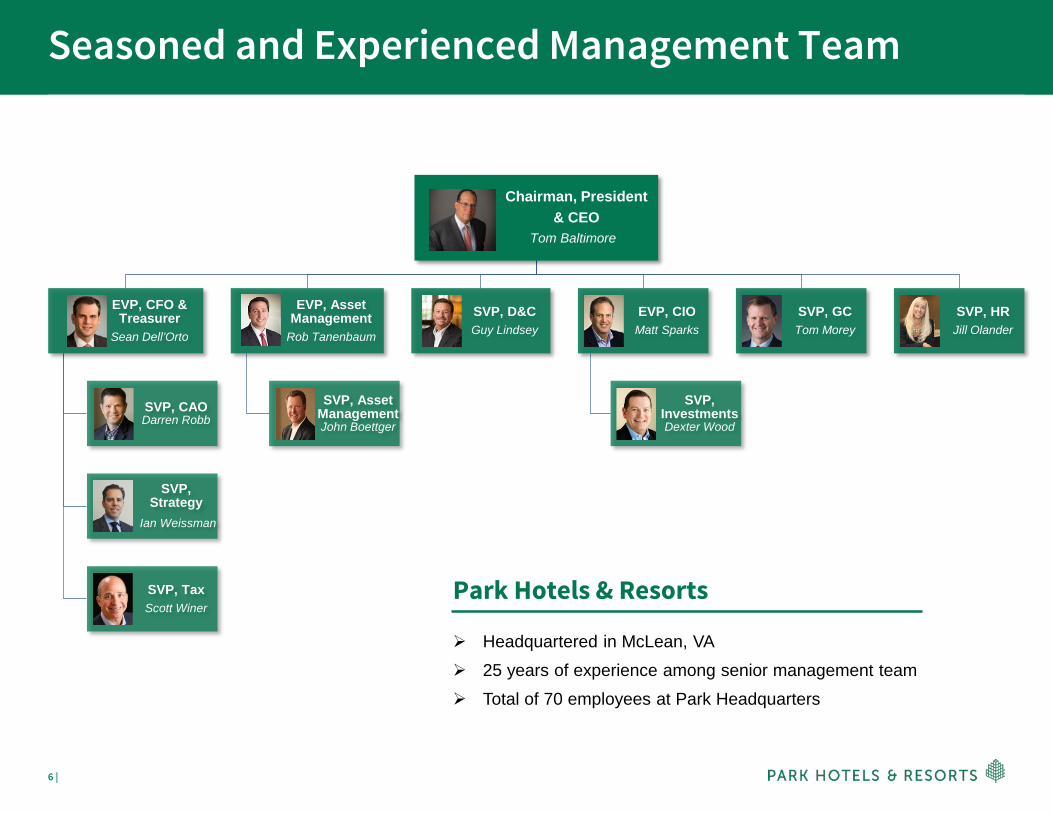
Seasoned and Experienced Management Team
Chairman, President & CEO
Tom Baltimore
SVP, HRJill Olander
SVP, GC Tom Morey
EVP, CIO Matt Sparks
SVP, Investments Dexter Wood
SVP, D&CGuy Lindsey
EVP, Asset Management
Rob Tanenbaum
SVP, Asset Management John Boettger
EVP, CFO & Treasurer
Sean Dell’Orto
SVP, CAO Darren Robb
SVP, Strategy
Ian Weissman
SVP, Tax Scott Winer
Headquartered in McLean, VA 25 years of experience among senior management team Total of 70 employees at Park Headquarters
Park Hotels & Resorts

7 |
Portfolio Overview
Hilton San Francisco Union Square

8 |
New York Hilton Midtown1,929 rooms (1)
Hilton San Francisco Union Square1,919 rooms
Hilton Chicago1,544 rooms
Hilton New Orleans1,622 rooms
Hilton Hawaiian Village 2,860 rooms
Hilton Waikoloa Village1,243 rooms (2)
Waldorf Astoria Casa Marina311 rooms
Waldorf Astoria Orlando /Hilton Orlando Bonnet Creek1,499 rooms
Hilton Short Hills304 Rooms
Hilton Boston Logan599 rooms
Hilton Miami Airport508 rooms
Hilton McLean, VA458 rooms
Diversified Exposure to Attractive MarketsHigh Barrier to Entry Urban
and Convention Hotels Landmark ResortsSelect Suburban and
Strategic Airport Hotels
(1) As of 12/31/16; includes approximately 25 rooms that became part of Hilton Grand Vacations as part of the spin-off
(2) As of 12/31/16; includes approximately 600 rooms that became part of Hilton Grand Vacations as part of the spin-off (see slide 33 for more details)
9 |
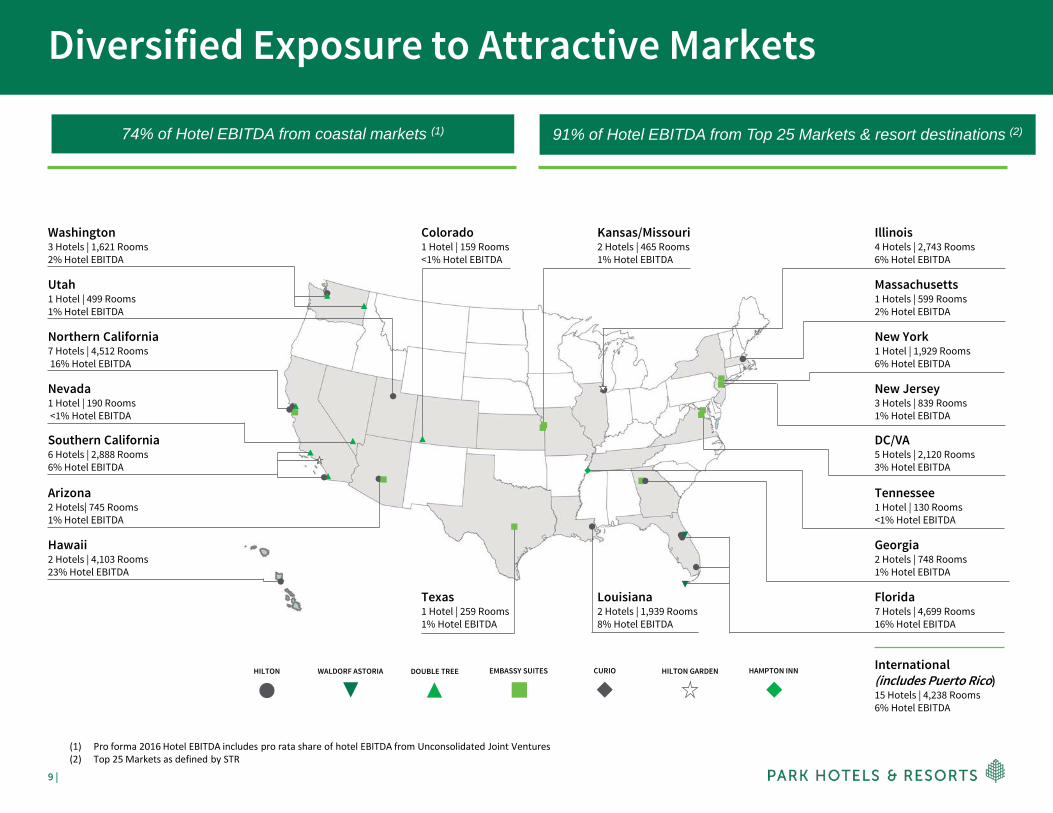
Diversified Exposure to Attractive Markets
Washington3 Hotels | 1,621 Rooms2% Hotel EBITDA
Utah1 Hotel | 499 Rooms1% Hotel EBITDA
Northern California7 Hotels | 4,512 Rooms16% Hotel EBITDA
Nevada1 Hotel | 190 Rooms<1% Hotel EBITDA
Southern California6 Hotels | 2,888 Rooms6% Hotel EBITDA
Arizona2 Hotels| 745 Rooms1% Hotel EBITDA
Hawaii2 Hotels | 4,103 Rooms23% Hotel EBITDA
Illinois4 Hotels | 2,743 Rooms6% Hotel EBITDA
Massachusetts1 Hotels | 599 Rooms2% Hotel EBITDA
New York1 Hotel | 1,929 Rooms6% Hotel EBITDA
New Jersey3 Hotels | 839 Rooms1% Hotel EBITDA
DC/VA5 Hotels | 2,120 Rooms3% Hotel EBITDA
Tennessee1 Hotel | 130 Rooms<1% Hotel EBITDA
Georgia2 Hotels | 748 Rooms1% Hotel EBITDA
Colorado1 Hotel | 159 Rooms<1% Hotel EBITDA
Kansas/Missouri2 Hotels | 465 Rooms1% Hotel EBITDA
WALDORF ASTORIAHILTON DOUBLE TREE EMBASSY SUITES CURIO HILTON GARDEN HAMPTON INN
Florida7 Hotels | 4,699 Rooms16% Hotel EBITDA
International (includes Puerto Rico)15 Hotels | 4,238 Rooms6% Hotel EBITDA
Texas1 Hotel | 259 Rooms1% Hotel EBITDA
Louisiana2 Hotels | 1,939 Rooms8% Hotel EBITDA
74% of Hotel EBITDA from coastal markets (1) 91% of Hotel EBITDA from Top 25 Markets & resort destinations (2)
(1) Pro forma 2016 Hotel EBITDA includes pro rata share of hotel EBITDA from Unconsolidated Joint Ventures(2) Top 25 Markets as defined by STR
10 |
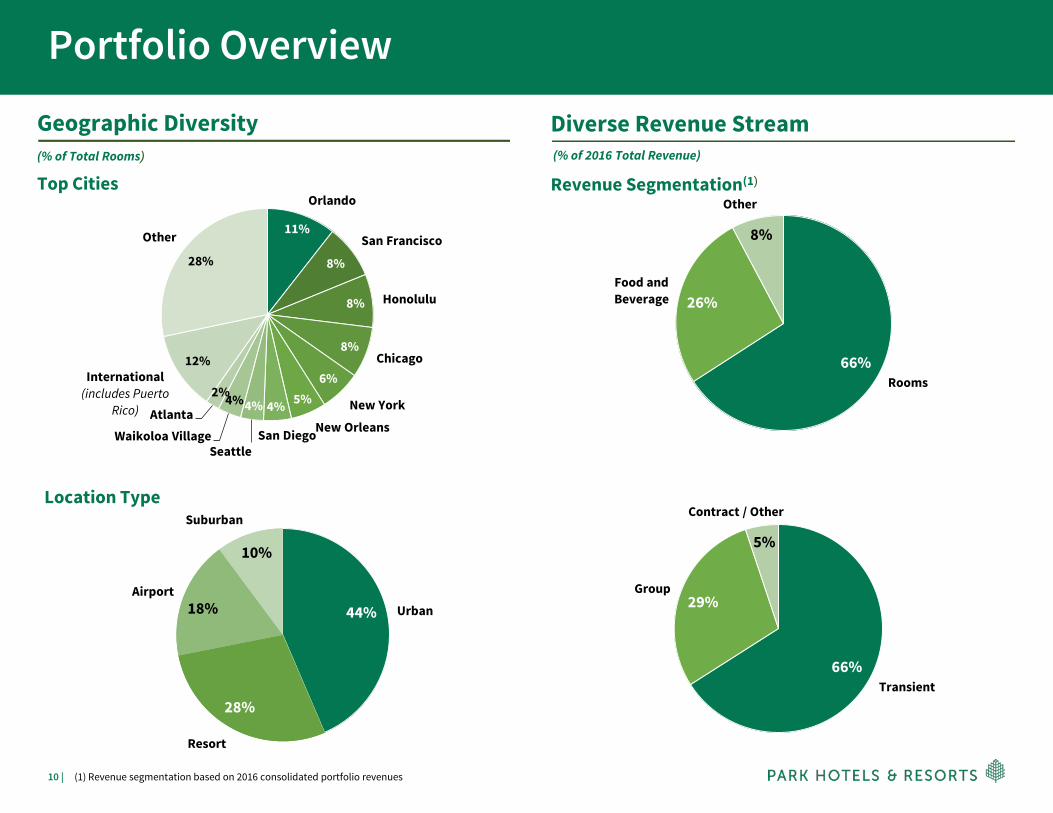
Rooms
Food and Beverage
Other
66%
26%
8%
Urban
Resort
Airport
Suburban
44%
28%
18%
10%
Orlando
San Francisco
Honolulu
Chicago
New York
New OrleansSan DiegoSeattle
Waikoloa VillageAtlanta
International(includes Puerto
Rico)
Other 11%
8%
8%
8%
6%5%4%4%4%2%
12%
28%
Portfolio Overview
Geographic Diversity(% of Total Rooms)
Top Cities
Location Type
Diverse Revenue Stream(% of 2016 Total Revenue)
Revenue Segmentation(1)
Transient
Group
Contract / Other
66%
29%
5%
(1) Revenue segmentation based on 2016 consolidated portfolio revenues
11 |
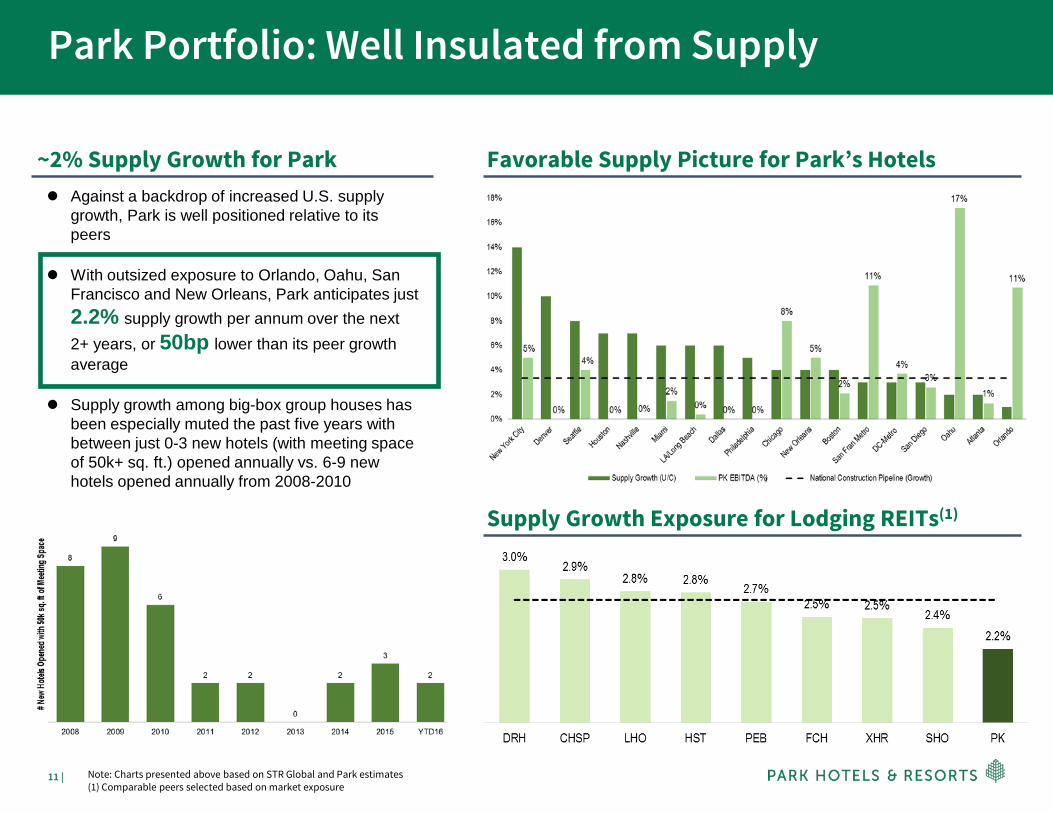
Park Portfolio: Well Insulated from Supply
~2% Supply Growth for Park Against a backdrop of increased U.S. supply
growth, Park is well positioned relative to its peers
With outsized exposure to Orlando, Oahu, San Francisco and New Orleans, Park anticipates just 2.2% supply growth per annum over the next 2+ years, or 50bp lower than its peer growth average
Supply growth among big-box group houses has been especially muted the past five years with between just 0-3 new hotels (with meeting space of 50k+ sq. ft.) opened annually vs. 6-9 new hotels opened annually from 2008-2010
Favorable Supply Picture for Park’s Hotels
Supply Growth Exposure for Lodging REITs(1)
Note: Charts presented above based on STR Global and Park estimates(1) Comparable peers selected based on market exposure
12 |
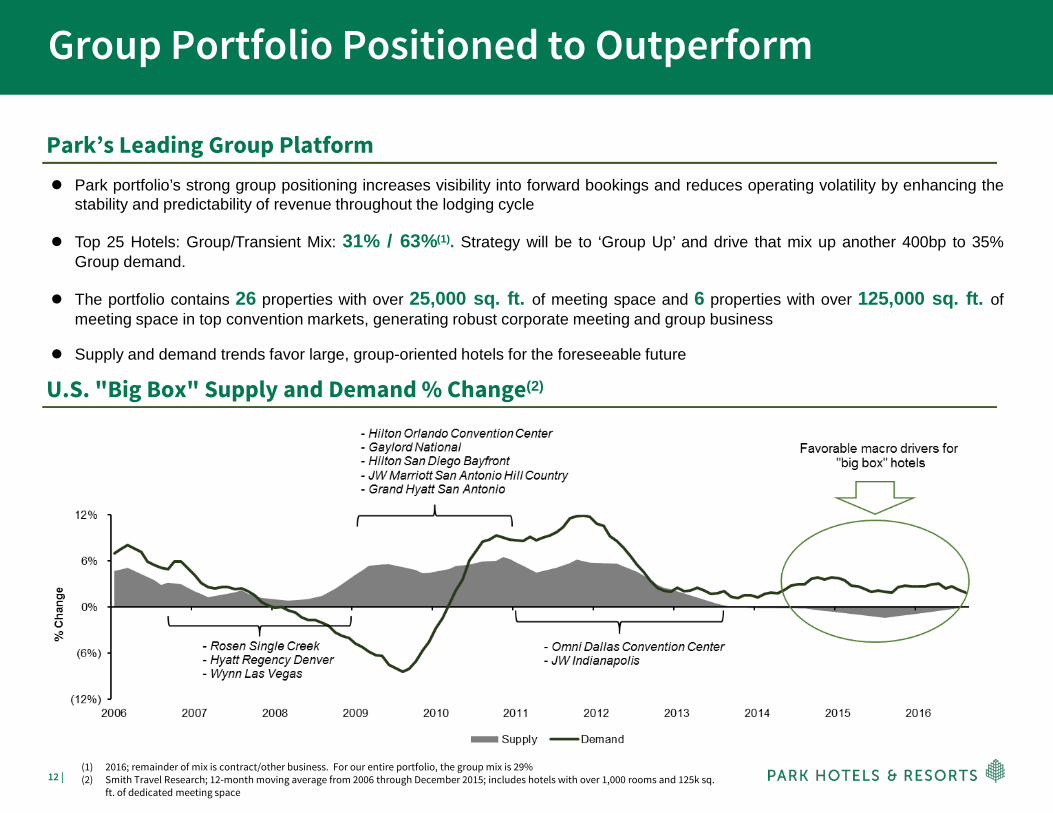
Group Portfolio Positioned to Outperform
Park’s Leading Group Platform Park portfolio’s strong group positioning increases visibility into forward bookings and reduces operating volatility by enhancing the
stability and predictability of revenue throughout the lodging cycle
Top 25 Hotels: Group/Transient Mix: 31% / 63%(1). Strategy will be to ‘Group Up’ and drive that mix up another 400bp to 35%Group demand.
The portfolio contains 26 properties with over 25,000 sq. ft. of meeting space and 6 properties with over 125,000 sq. ft. ofmeeting space in top convention markets, generating robust corporate meeting and group business
Supply and demand trends favor large, group-oriented hotels for the foreseeable future
U.S. "Big Box" Supply and Demand % Change(2)
(1) 2016; remainder of mix is contract/other business. For our entire portfolio, the group mix is 29%(2) Smith Travel Research; 12-month moving average from 2006 through December 2015; includes hotels with over 1,000 rooms and 125k sq.
ft. of dedicated meeting space

13 |
Investment Highlights
Hilton New York Midtown
14 |
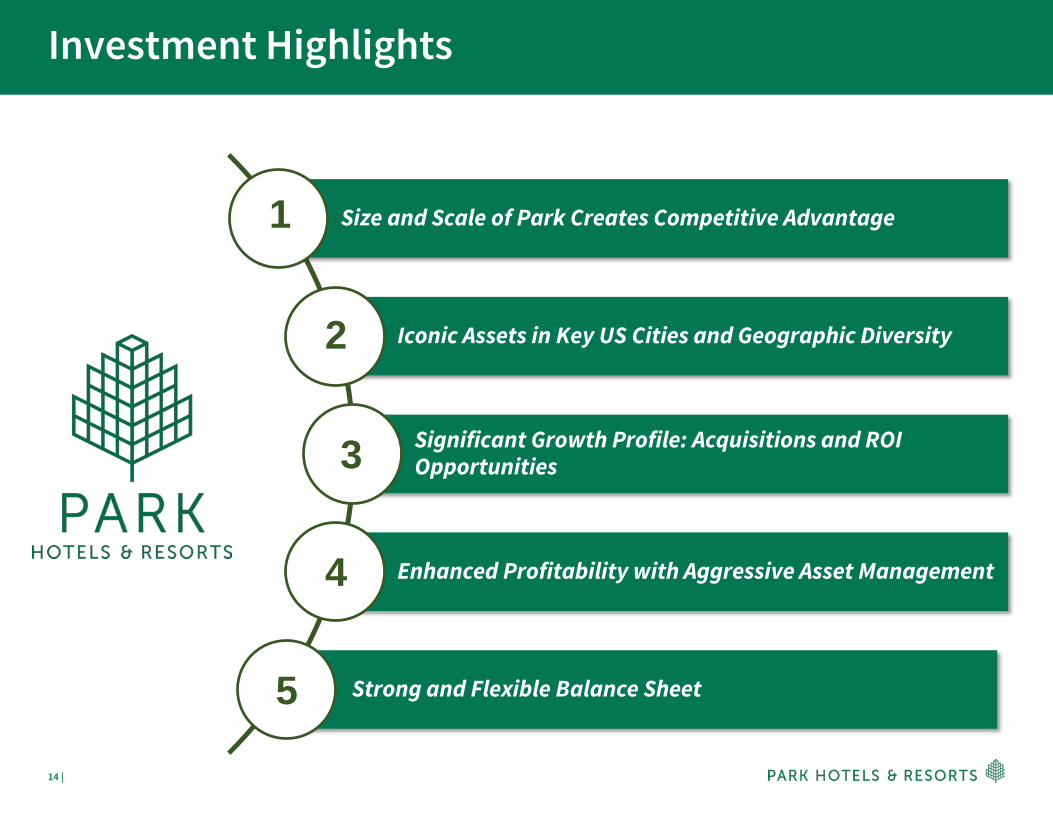
Investment Highlights
Size and Scale of Park Creates Competitive Advantage
Iconic Assets in Key US Cities and Geographic Diversity
Significant Growth Profile: Acquisitions and ROI Opportunities
Enhanced Profitability with Aggressive Asset Management
Strong and Flexible Balance Sheet
1
2
3
4
5
15 |
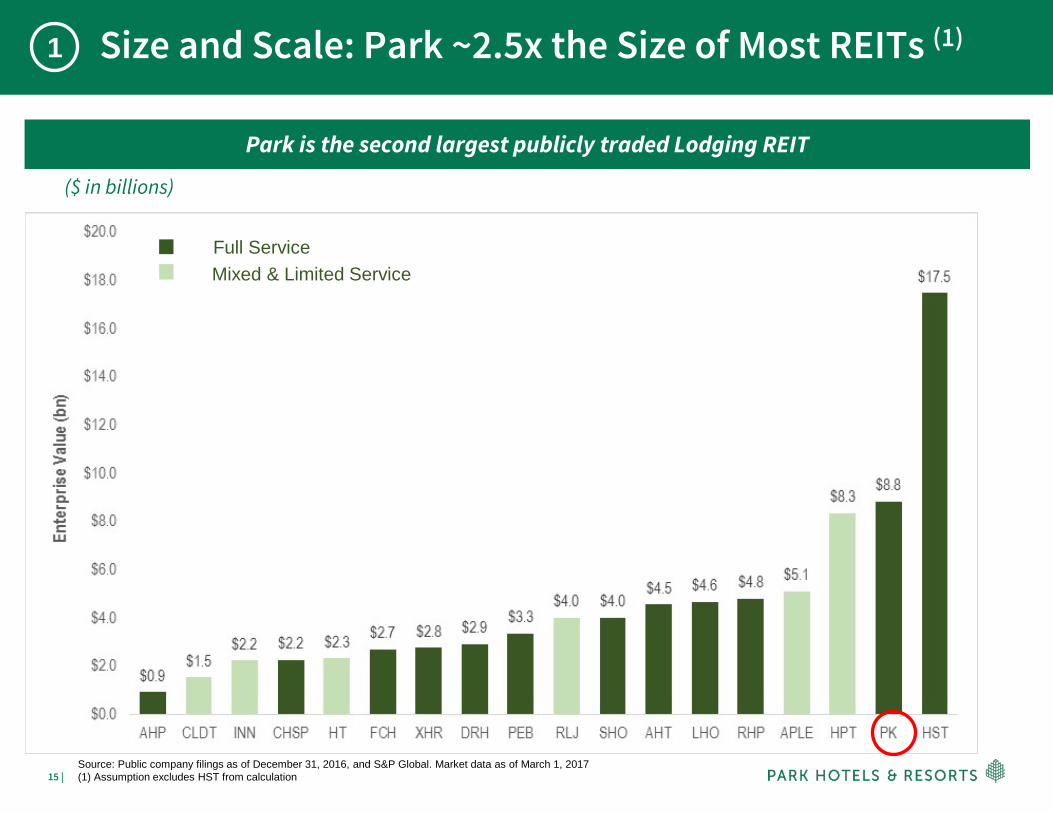
Full ServiceMixed & Limited Service
Park is the second largest publicly traded Lodging REIT
1 Size and Scale: Park ~2.5x the Size of Most REITs (1)
Source: Public company filings as of December 31, 2016, and S&P Global. Market data as of March 1, 2017(1) Assumption excludes HST from calculation
($ in billions)
16 |
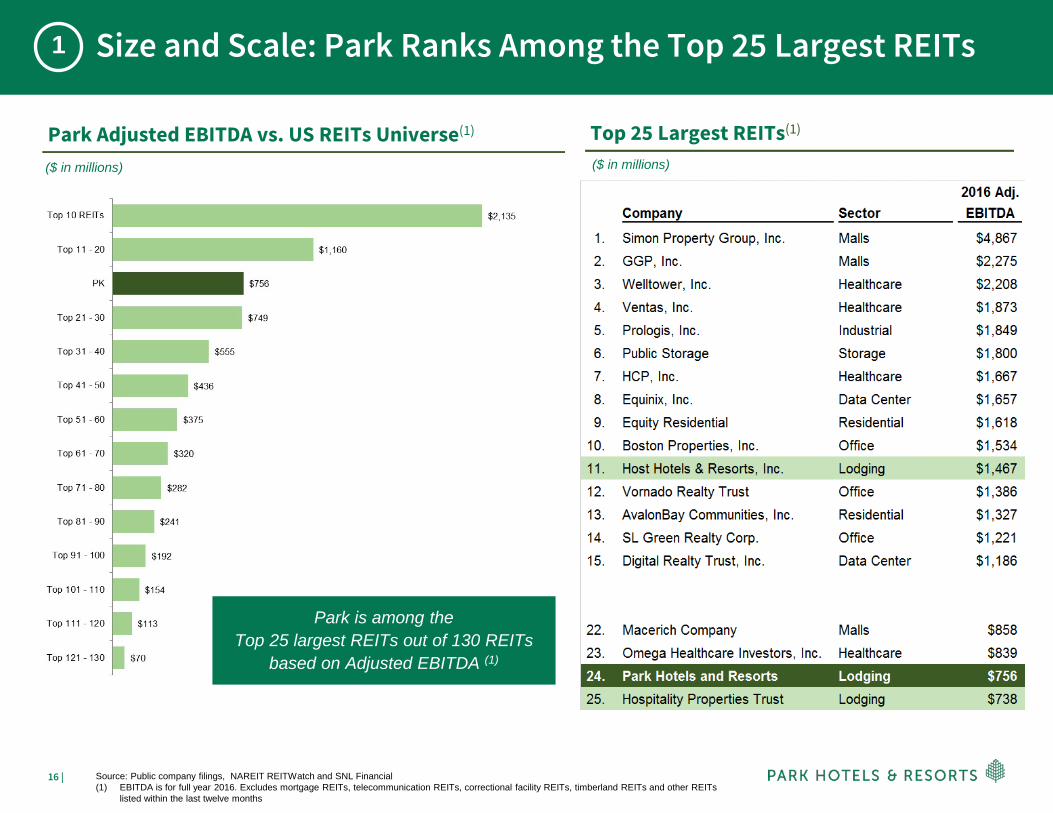
Size and Scale: Park Ranks Among the Top 25 Largest REITs
Park Adjusted EBITDA vs. US REITs Universe(1)
($ in millions)
Top 25 Largest REITs(1)
($ in millions)
Park is among the Top 25 largest REITs out of 130 REITs
based on Adjusted EBITDA (1)
1
Source: Public company filings, NAREIT REITWatch and SNL Financial(1) EBITDA is for full year 2016. Excludes mortgage REITs, telecommunication REITs, correctional facility REITs, timberland REITs and other REITs
listed within the last twelve months
17 |
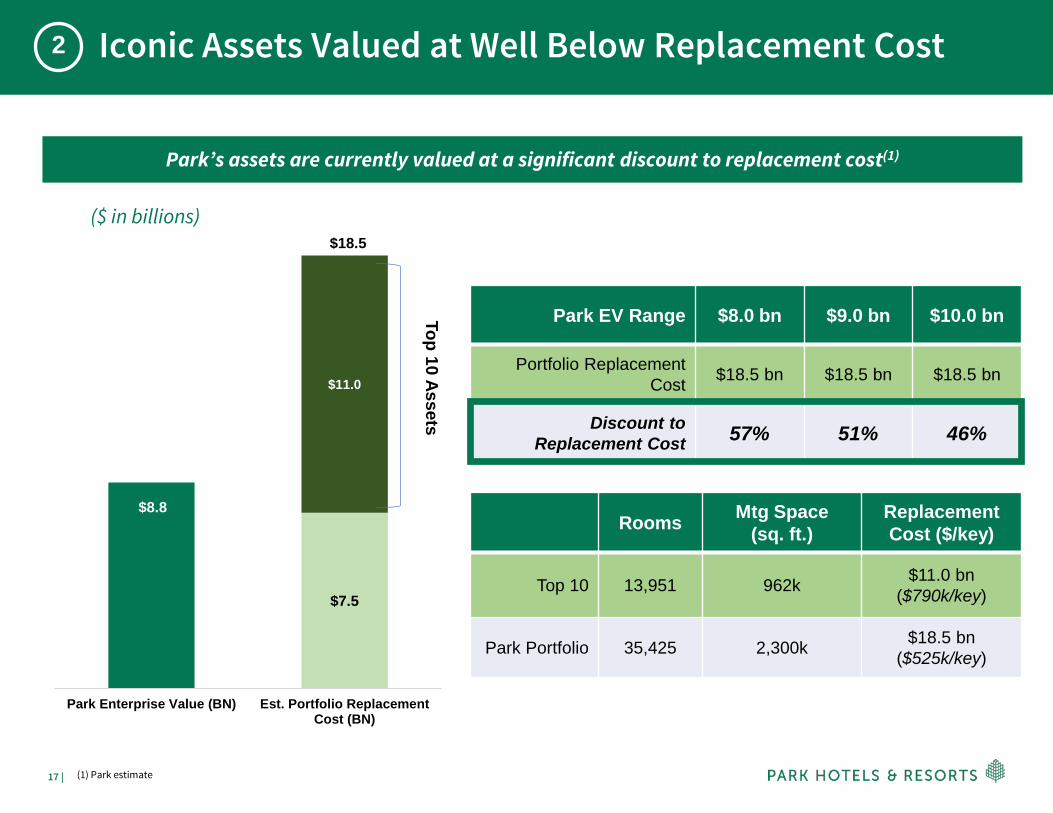
Iconic Assets Valued at Well Below Replacement Cost2
Park’s assets are currently valued at a significant discount to replacement cost(1)
$8.8
$7.5
$11.0
$0
$2
$4
$6
$8
$10
$12
$14
$16
$18
$20
Park Enterprise Value (BN) Est. Portfolio ReplacementCost (BN)
$18.5
Park EV Range $8.0 bn $9.0 bn $10.0 bn
Portfolio Replacement Cost $18.5 bn $18.5 bn $18.5 bn
Discount to Replacement Cost 57% 51% 46%
Rooms Mtg Space (sq. ft.)
ReplacementCost ($/key)
Top 10 13,951 962k $11.0 bn($790k/key)
Park Portfolio 35,425 2,300k $18.5 bn($525k/key)
Top 10 Assets
(1) Park estimate
($ in billions)
18 |
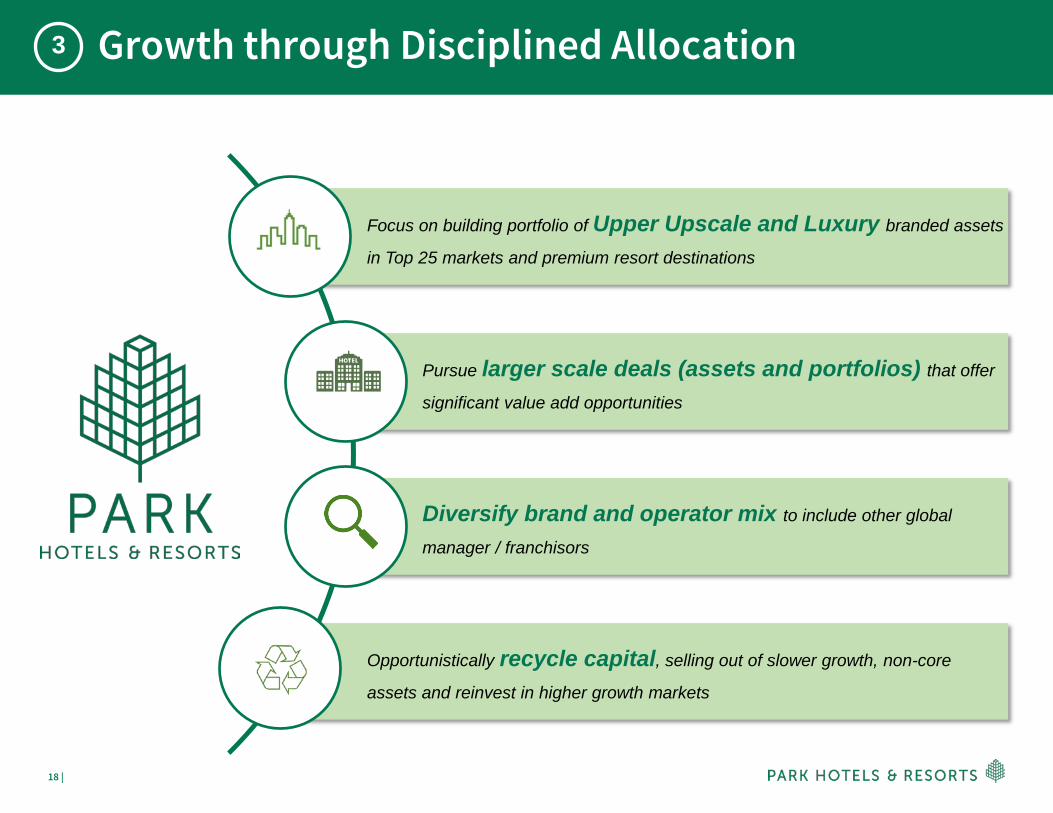
Growth through Disciplined Allocation
Focus on building portfolio of Upper Upscale and Luxury branded assets
in Top 25 markets and premium resort destinations
Pursue larger scale deals (assets and portfolios) that offer
significant value add opportunities
Diversify brand and operator mix to include other global
manager / franchisors
Opportunistically recycle capital, selling out of slower growth, non-core
assets and reinvest in higher growth markets
3
19 |
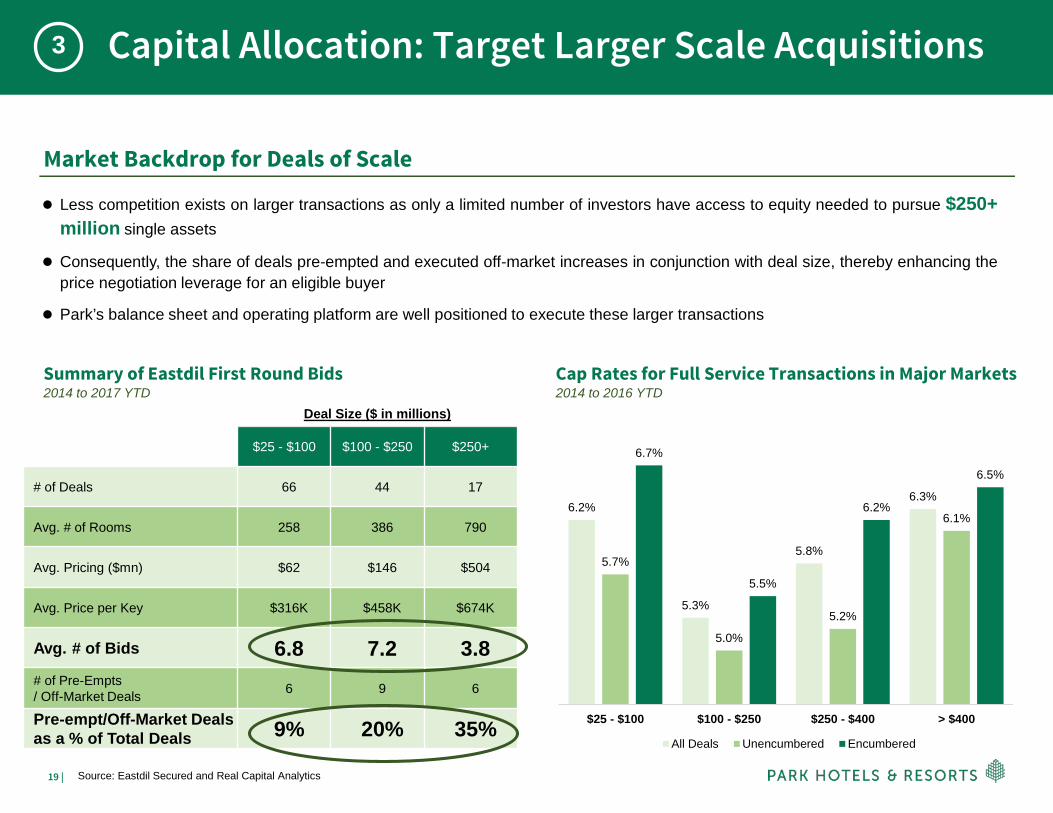
Capital Allocation: Target Larger Scale Acquisitions
Market Backdrop for Deals of Scale
Less competition exists on larger transactions as only a limited number of investors have access to equity needed to pursue $250+million single assets
Consequently, the share of deals pre-empted and executed off-market increases in conjunction with deal size, thereby enhancing theprice negotiation leverage for an eligible buyer
Park’s balance sheet and operating platform are well positioned to execute these larger transactions
Summary of Eastdil First Round Bids2014 to 2017 YTD
Deal Size ($ in millions)
$25 - $100 $100 - $250 $250+
# of Deals 66 44 17
Avg. # of Rooms 258 386 790
Avg. Pricing ($mn) $62 $146 $504
Avg. Price per Key $316K $458K $674K
Avg. # of Bids 6.8 7.2 3.8# of Pre-Empts / Off-Market Deals 6 9 6
Pre-empt/Off-Market Deals as a % of Total Deals 9% 20% 35%
Cap Rates for Full Service Transactions in Major Markets2014 to 2016 YTD
6.2%
5.3%
5.8%
6.3%
5.7%
5.0%
5.2%
6.1%
6.7%
5.5%
6.2%
6.5%
$25 - $100 $100 - $250 $250 - $400 > $400
All Deals Unencumbered Encumbered
3
Source: Eastdil Secured and Real Capital Analytics
20 |
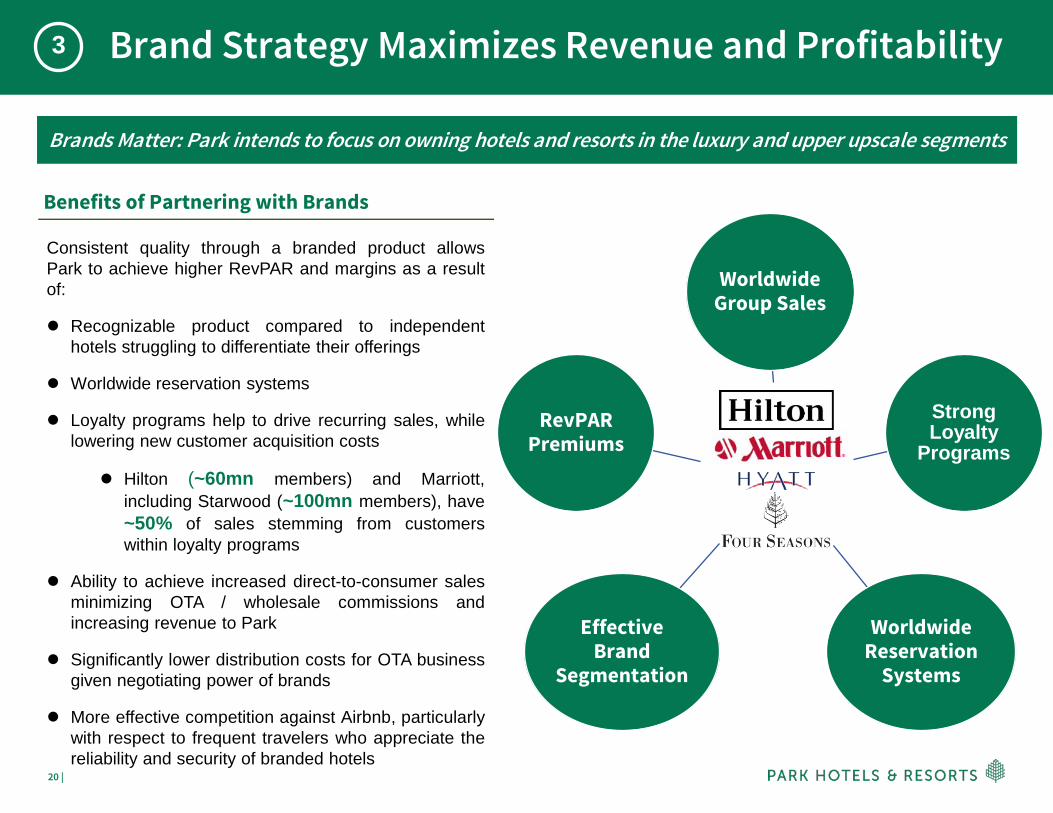
Brand Strategy Maximizes Revenue and Profitability
Brands Matter: Park intends to focus on owning hotels and resorts in the luxury and upper upscale segments
Benefits of Partnering with Brands
Consistent quality through a branded product allowsPark to achieve higher RevPAR and margins as a resultof:
Recognizable product compared to independenthotels struggling to differentiate their offerings
Worldwide reservation systems
Loyalty programs help to drive recurring sales, whilelowering new customer acquisition costs
Hilton (~60mn members) and Marriott,including Starwood (~100mn members), have~50% of sales stemming from customerswithin loyalty programs
Ability to achieve increased direct-to-consumer salesminimizing OTA / wholesale commissions andincreasing revenue to Park
Significantly lower distribution costs for OTA businessgiven negotiating power of brands
More effective competition against Airbnb, particularlywith respect to frequent travelers who appreciate thereliability and security of branded hotels
Worldwide Group Sales
Strong Loyalty
Programs
Worldwide Reservation
Systems
Effective Brand
Segmentation
RevPAR Premiums
3

21 |
Asset ManagementWaldorf Astoria Orlando
22 |
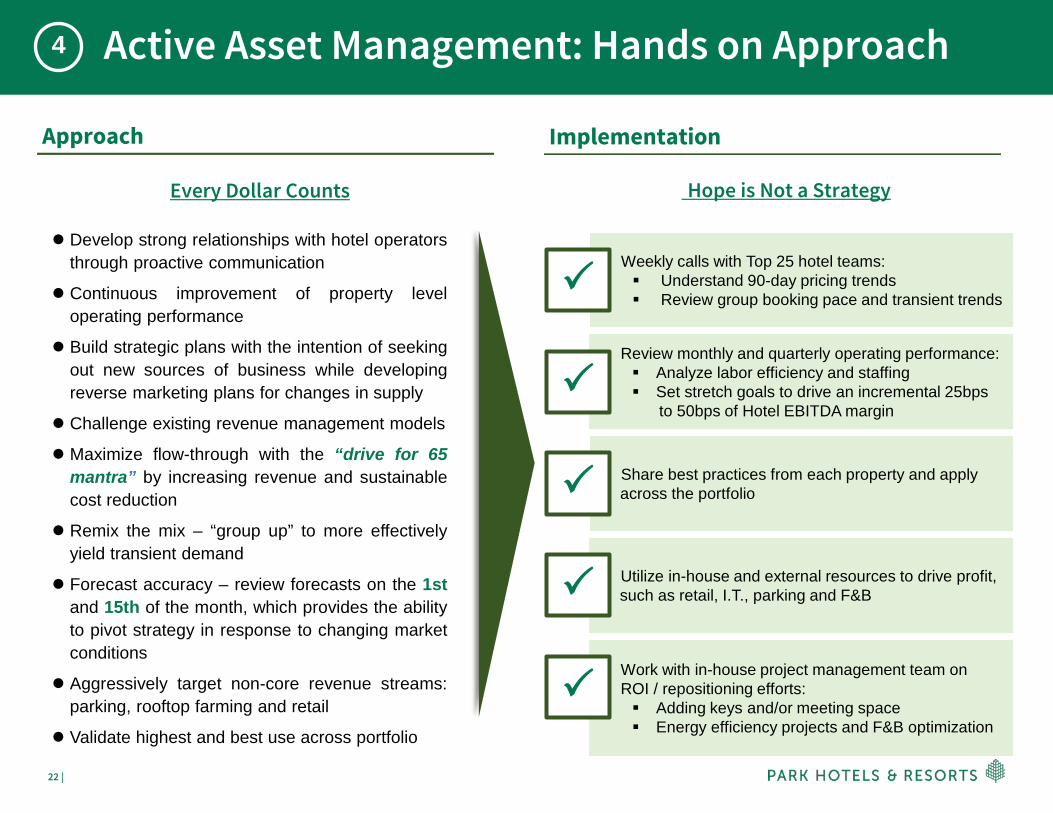
Work with in-house project management team on ROI / repositioning efforts: Adding keys and/or meeting space Energy efficiency projects and F&B optimization
Utilize in-house and external resources to drive profit, such as retail, I.T., parking and F&B
Share best practices from each property and apply across the portfolio
Review monthly and quarterly operating performance: Analyze labor efficiency and staffing Set stretch goals to drive an incremental 25bps
to 50bps of Hotel EBITDA margin
Weekly calls with Top 25 hotel teams: Understand 90-day pricing trends Review group booking pace and transient trends
Active Asset Management: Hands on Approach
Approach
Develop strong relationships with hotel operatorsthrough proactive communication
Continuous improvement of property leveloperating performance
Build strategic plans with the intention of seekingout new sources of business while developingreverse marketing plans for changes in supply
Challenge existing revenue management models
Maximize flow-through with the “drive for 65mantra” by increasing revenue and sustainablecost reduction
Remix the mix – “group up” to more effectivelyyield transient demand
Forecast accuracy – review forecasts on the 1stand 15th of the month, which provides the abilityto pivot strategy in response to changing marketconditions
Aggressively target non-core revenue streams:parking, rooftop farming and retail
Validate highest and best use across portfolio
Implementation
Hope is Not a Strategy
Every Dollar Counts
4
23 |
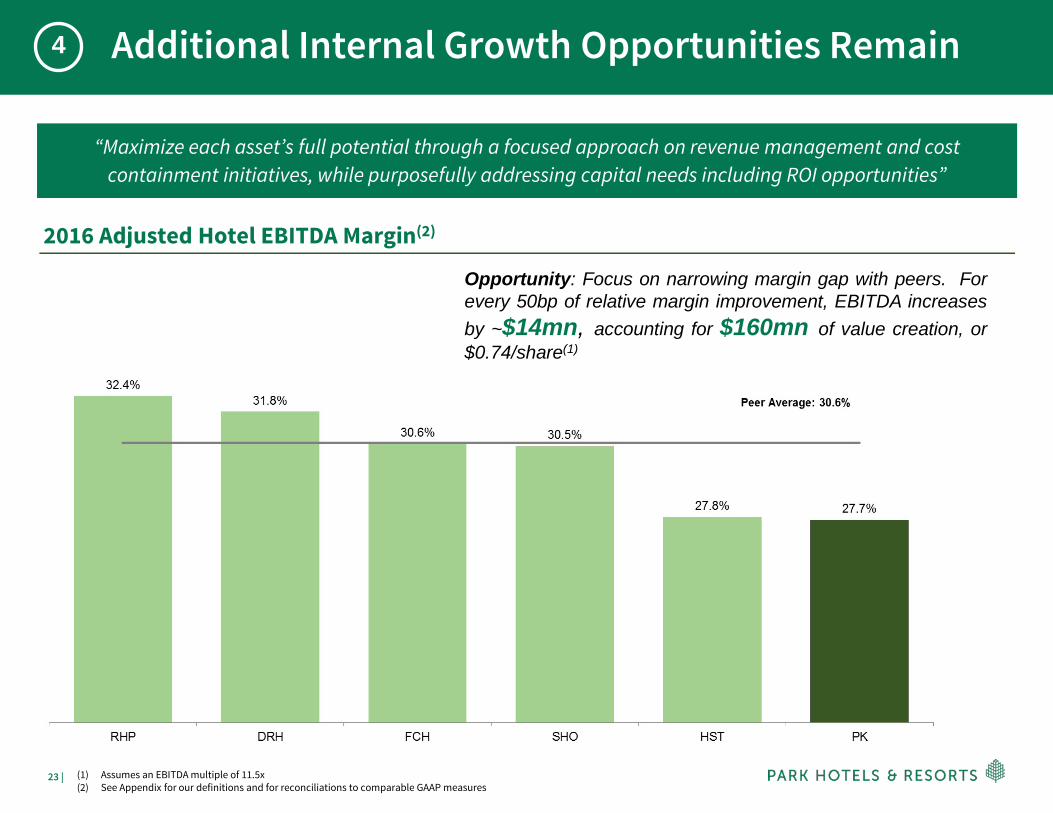
Additional Internal Growth Opportunities Remain
“Maximize each asset’s full potential through a focused approach on revenue management and cost containment initiatives, while purposefully addressing capital needs including ROI opportunities”
2016 Adjusted Hotel EBITDA Margin(2)
Opportunity: Focus on narrowing margin gap with peers. Forevery 50bp of relative margin improvement, EBITDA increasesby ~$14mn, accounting for $160mn of value creation, or$0.74/share(1)
4
(1) Assumes an EBITDA multiple of 11.5x(2) See Appendix for our definitions and for reconciliations to comparable GAAP measures
24 |
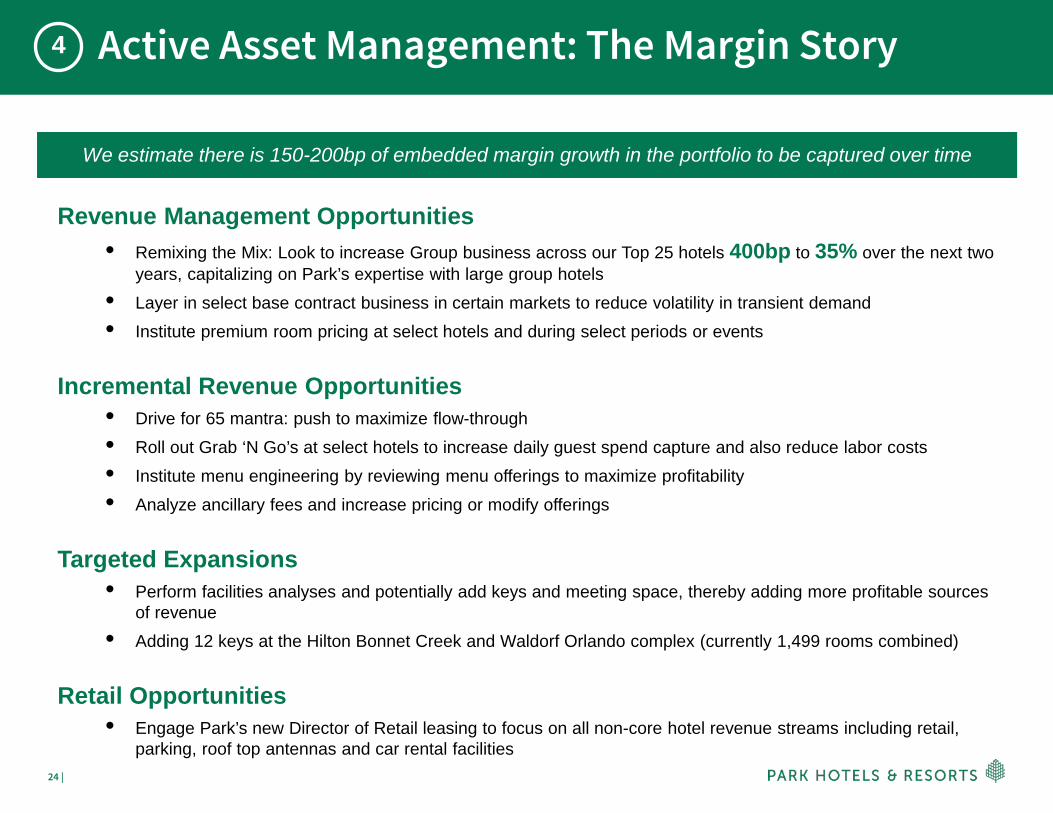
Active Asset Management: The Margin Story4
Revenue Management Opportunities• Remixing the Mix: Look to increase Group business across our Top 25 hotels 400bp to 35% over the next two
years, capitalizing on Park’s expertise with large group hotels• Layer in select base contract business in certain markets to reduce volatility in transient demand• Institute premium room pricing at select hotels and during select periods or events
Incremental Revenue Opportunities• Drive for 65 mantra: push to maximize flow-through• Roll out Grab ‘N Go’s at select hotels to increase daily guest spend capture and also reduce labor costs• Institute menu engineering by reviewing menu offerings to maximize profitability• Analyze ancillary fees and increase pricing or modify offerings
Targeted Expansions• Perform facilities analyses and potentially add keys and meeting space, thereby adding more profitable sources
of revenue• Adding 12 keys at the Hilton Bonnet Creek and Waldorf Orlando complex (currently 1,499 rooms combined)
Retail Opportunities• Engage Park’s new Director of Retail leasing to focus on all non-core hotel revenue streams including retail,
parking, roof top antennas and car rental facilities
We estimate there is 150-200bp of embedded margin growth in the portfolio to be captured over time
25 |
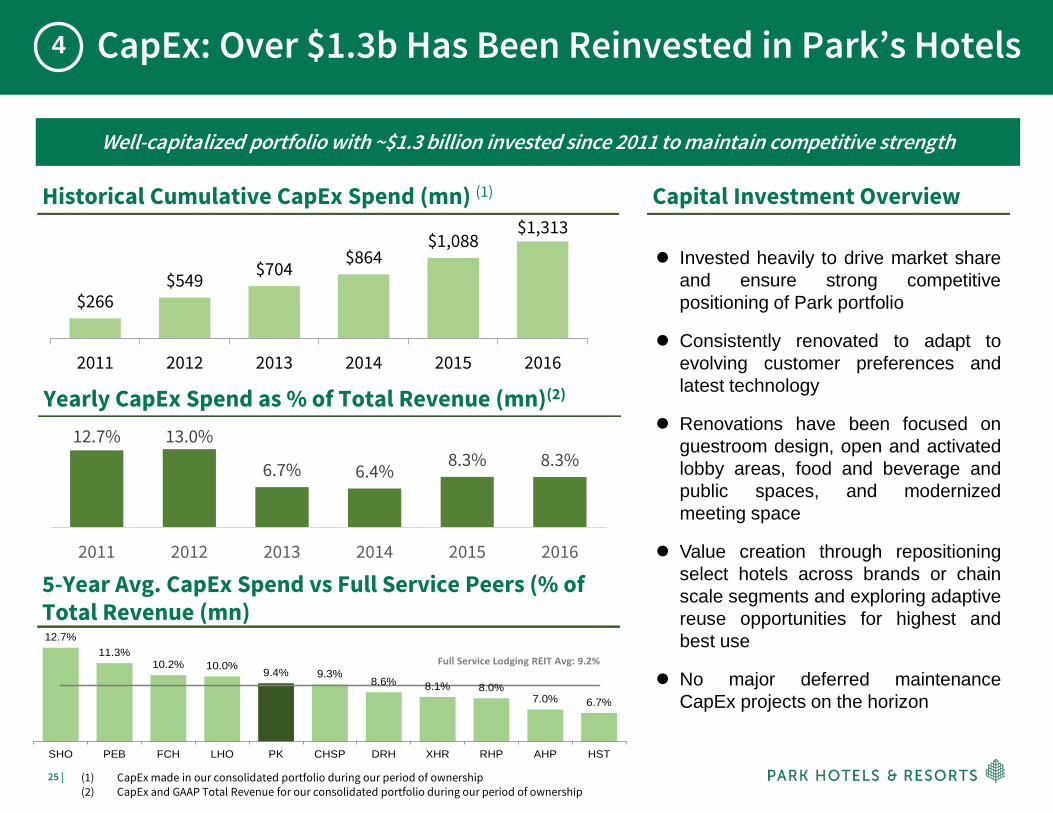
CapEx: Over $1.3b Has Been Reinvested in Park’s Hotels4
Well-capitalized portfolio with ~$1.3 billion invested since 2011 to maintain competitive strength
Historical Cumulative CapEx Spend (mn) (1)
Yearly CapEx Spend as % of Total Revenue (mn)(2)
5-Year Avg. CapEx Spend vs Full Service Peers (% of Total Revenue (mn)12.7%
11.3%10.2% 10.0% 9.4% 9.3%
8.6% 8.1% 8.0%7.0% 6.7%
SHO PEB FCH LHO PK CHSP DRH XHR RHP AHP HST
Full Service Lodging REIT Avg: 9.2%
Capital Investment Overview
Invested heavily to drive market shareand ensure strong competitivepositioning of Park portfolio
Consistently renovated to adapt toevolving customer preferences andlatest technology
Renovations have been focused onguestroom design, open and activatedlobby areas, food and beverage andpublic spaces, and modernizedmeeting space
Value creation through repositioningselect hotels across brands or chainscale segments and exploring adaptivereuse opportunities for highest andbest use
No major deferred maintenanceCapEx projects on the horizon
$266$549 $704 $864
$1,088$1,313
2011 2012 2013 2014 2015 2016
12.7% 13.0%
6.7% 6.4% 8.3% 8.3%
2011 2012 2013 2014 2015 2016
(1) CapEx made in our consolidated portfolio during our period of ownership(2) CapEx and GAAP Total Revenue for our consolidated portfolio during our period of ownership
26 |
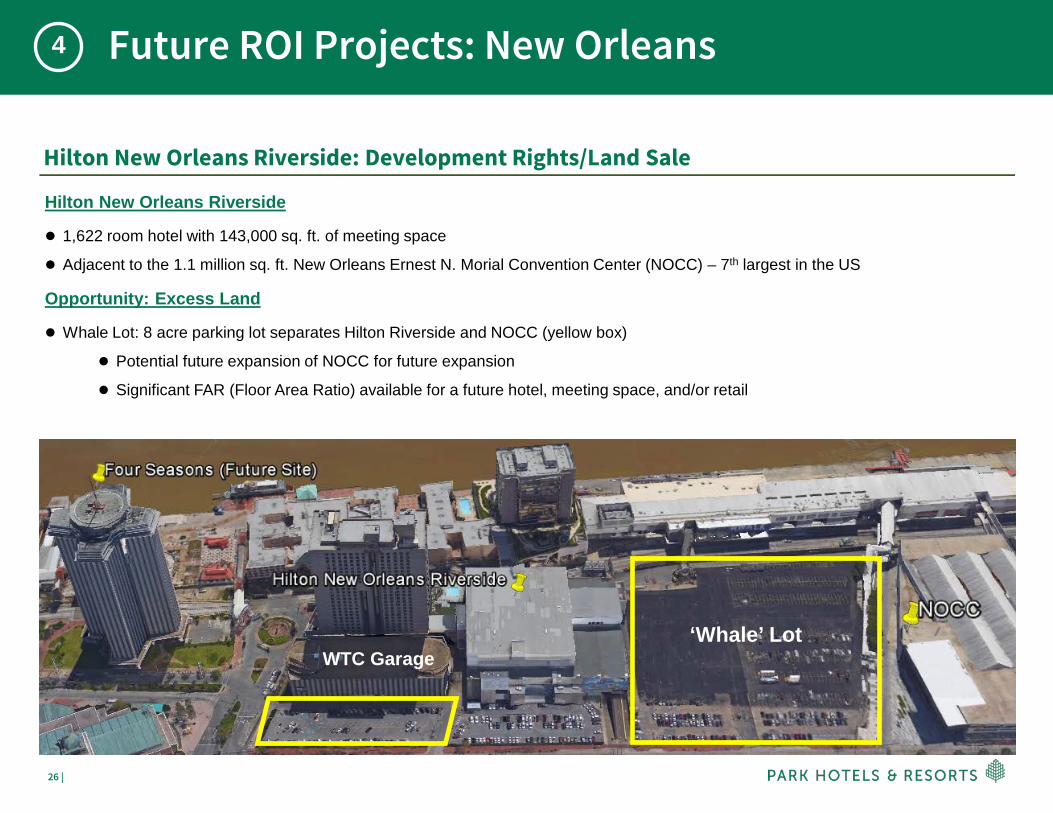
Future ROI Projects: New Orleans
Hilton New Orleans Riverside: Development Rights/Land Sale
Hilton New Orleans Riverside
1,622 room hotel with 143,000 sq. ft. of meeting space
Adjacent to the 1.1 million sq. ft. New Orleans Ernest N. Morial Convention Center (NOCC) – 7th largest in the US
Opportunity: Excess Land
Whale Lot: 8 acre parking lot separates Hilton Riverside and NOCC (yellow box)
Potential future expansion of NOCC for future expansion
Significant FAR (Floor Area Ratio) available for a future hotel, meeting space, and/or retail
WTC Garage‘Whale’ Lot
4
27 |
Future ROI Projects: Orlando
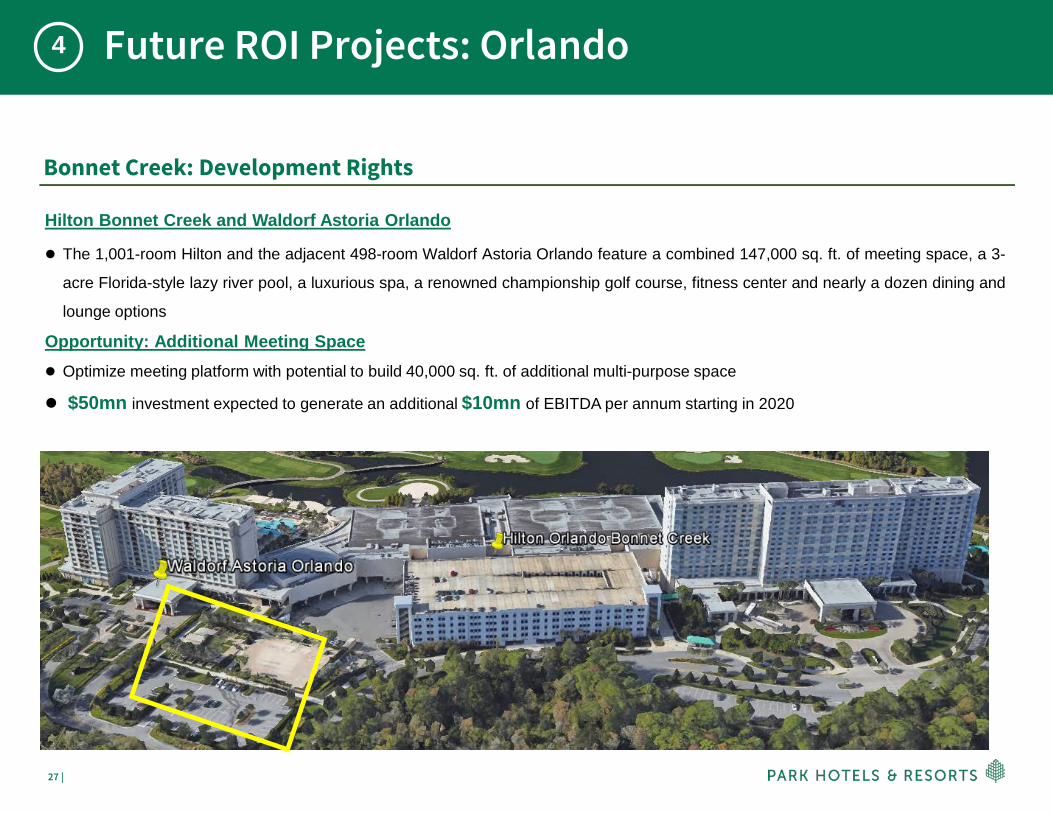
Bonnet Creek: Development Rights
Hilton Bonnet Creek and Waldorf Astoria Orlando
The 1,001-room Hilton and the adjacent 498-room Waldorf Astoria Orlando feature a combined 147,000 sq. ft. of meeting space, a 3-
acre Florida-style lazy river pool, a luxurious spa, a renowned championship golf course, fitness center and nearly a dozen dining and
lounge options
Opportunity: Additional Meeting Space Optimize meeting platform with potential to build 40,000 sq. ft. of additional multi-purpose space
$50mn investment expected to generate an additional $10mn of EBITDA per annum starting in 2020
4

28 |
Balance SheetHilton New Orleans Riverside
29 |
Strong and Flexible Balance Sheet5
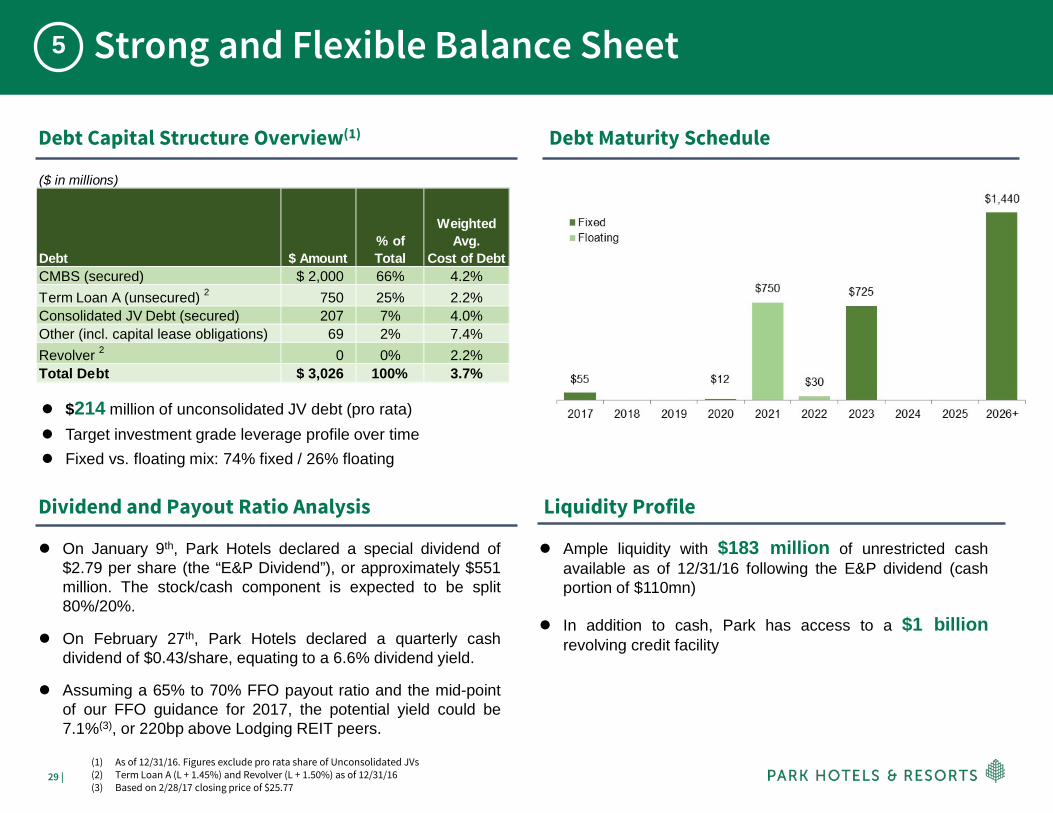
Debt Capital Structure Overview(1)
$214 million of unconsolidated JV debt (pro rata) Target investment grade leverage profile over time Fixed vs. floating mix: 74% fixed / 26% floating
Dividend and Payout Ratio Analysis
On January 9th, Park Hotels declared a special dividend of$2.79 per share (the “E&P Dividend”), or approximately $551million. The stock/cash component is expected to be split80%/20%.
On February 27th, Park Hotels declared a quarterly cashdividend of $0.43/share, equating to a 6.6% dividend yield.
Assuming a 65% to 70% FFO payout ratio and the mid-pointof our FFO guidance for 2017, the potential yield could be7.1%(3), or 220bp above Lodging REIT peers.
Debt Maturity Schedule
Liquidity Profile
Ample liquidity with $183 million of unrestricted cashavailable as of 12/31/16 following the E&P dividend (cashportion of $110mn)
In addition to cash, Park has access to a $1 billionrevolving credit facility
(1) As of 12/31/16. Figures exclude pro rata share of Unconsolidated JVs(2) Term Loan A (L + 1.45%) and Revolver (L + 1.50%) as of 12/31/16(3) Based on 2/28/17 closing price of $25.77
($ in millions)
Debt $ Amount% of Total
Weighted Avg.
Cost of DebtCMBS (secured) $ 2,000 66% 4.2%Term Loan A (unsecured) 2 750 25% 2.2%Consolidated JV Debt (secured) 207 7% 4.0%Other (incl. capital lease obligations) 69 2% 7.4%Revolver 2 0 0% 2.2%Total Debt $ 3,026 100% 3.7%

30 |
In Focus: HawaiiCasa Marina, The Waldorf Astoria Collection
31 |
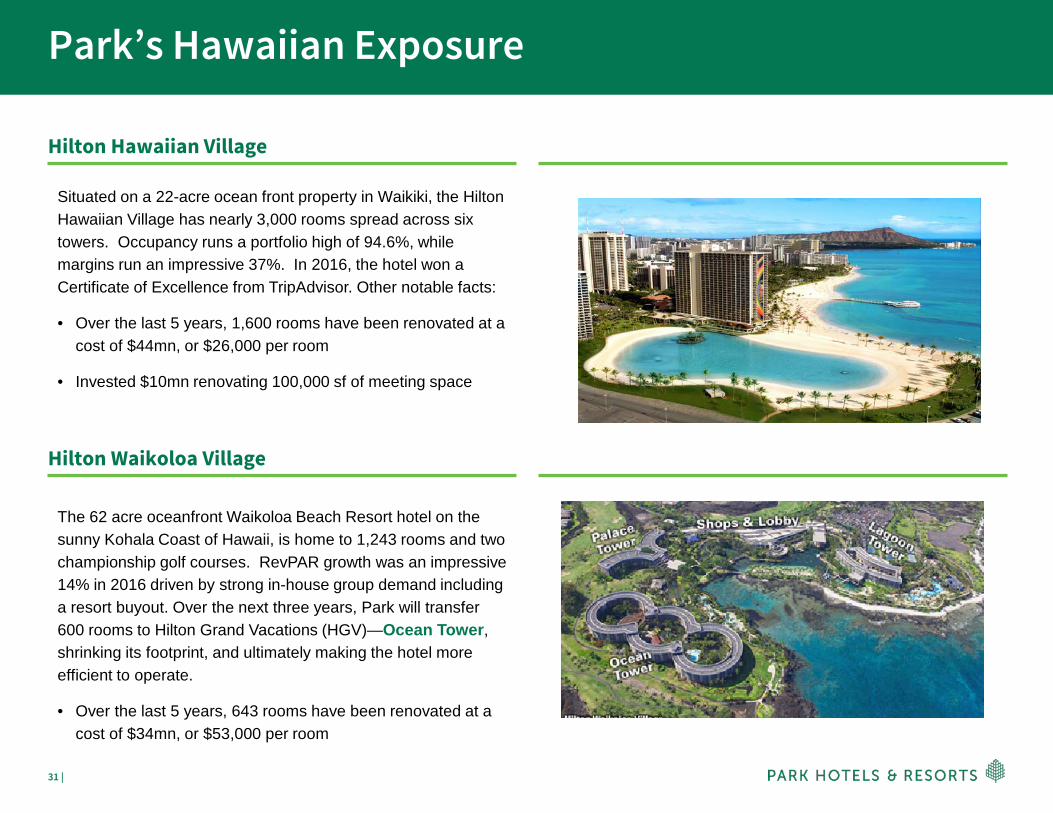
Park’s Hawaiian Exposure
Situated on a 22-acre ocean front property in Waikiki, the Hilton Hawaiian Village has nearly 3,000 rooms spread across six towers. Occupancy runs a portfolio high of 94.6%, while margins run an impressive 37%. In 2016, the hotel won a Certificate of Excellence from TripAdvisor. Other notable facts:
• Over the last 5 years, 1,600 rooms have been renovated at a cost of $44mn, or $26,000 per room
• Invested $10mn renovating 100,000 sf of meeting space
Hilton Hawaiian Village
The 62 acre oceanfront Waikoloa Beach Resort hotel on the sunny Kohala Coast of Hawaii, is home to 1,243 rooms and two championship golf courses. RevPAR growth was an impressive 14% in 2016 driven by strong in-house group demand including a resort buyout. Over the next three years, Park will transfer 600 rooms to Hilton Grand Vacations (HGV)—Ocean Tower, shrinking its footprint, and ultimately making the hotel more efficient to operate.
• Over the last 5 years, 643 rooms have been renovated at a cost of $34mn, or $53,000 per room
Hilton Waikoloa Village
32 |
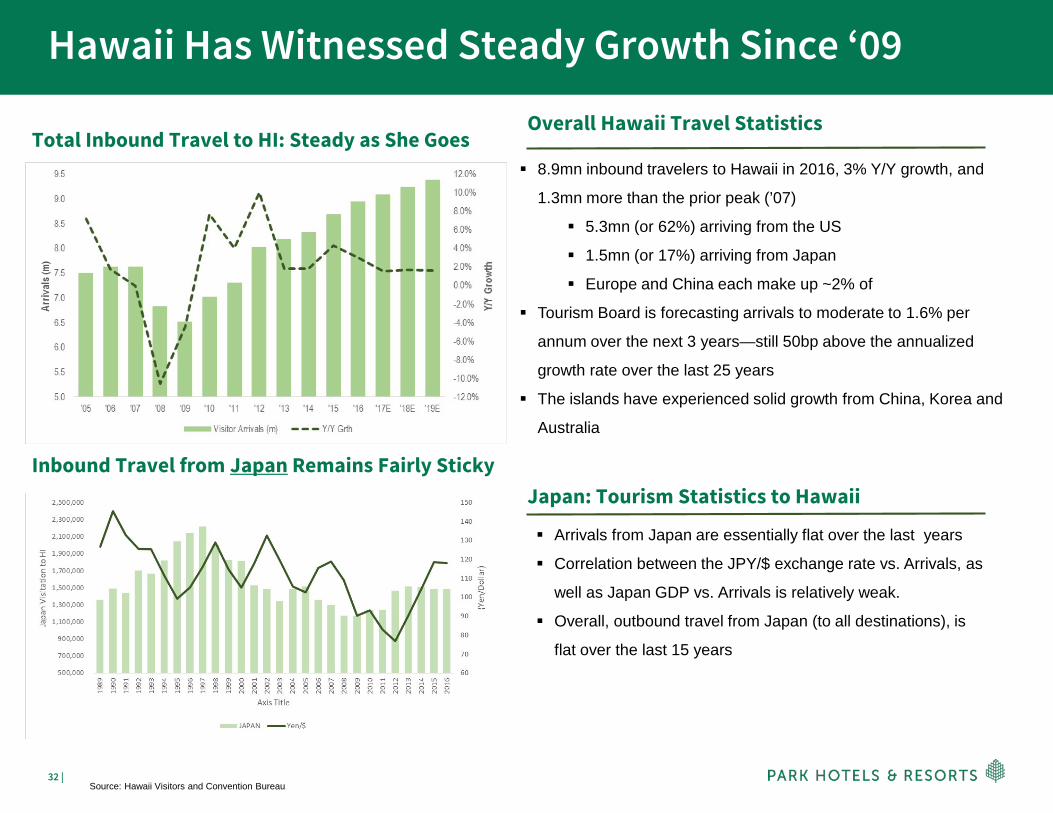
Hawaii Has Witnessed Steady Growth Since ‘09
8.9mn inbound travelers to Hawaii in 2016, 3% Y/Y growth, and
1.3mn more than the prior peak (’07)
5.3mn (or 62%) arriving from the US
1.5mn (or 17%) arriving from Japan
Europe and China each make up ~2% of
Tourism Board is forecasting arrivals to moderate to 1.6% per
annum over the next 3 years—still 50bp above the annualized
growth rate over the last 25 years
The islands have experienced solid growth from China, Korea and
Australia
Arrivals from Japan are essentially flat over the last years
Correlation between the JPY/$ exchange rate vs. Arrivals, as
well as Japan GDP vs. Arrivals is relatively weak.
Overall, outbound travel from Japan (to all destinations), is
flat over the last 15 years
Total Inbound Travel to HI: Steady as She Goes
Inbound Travel from Japan Remains Fairly Sticky
Source: Hawaii Visitors and Convention Bureau
Overall Hawaii Travel Statistics
Japan: Tourism Statistics to Hawaii
33 |
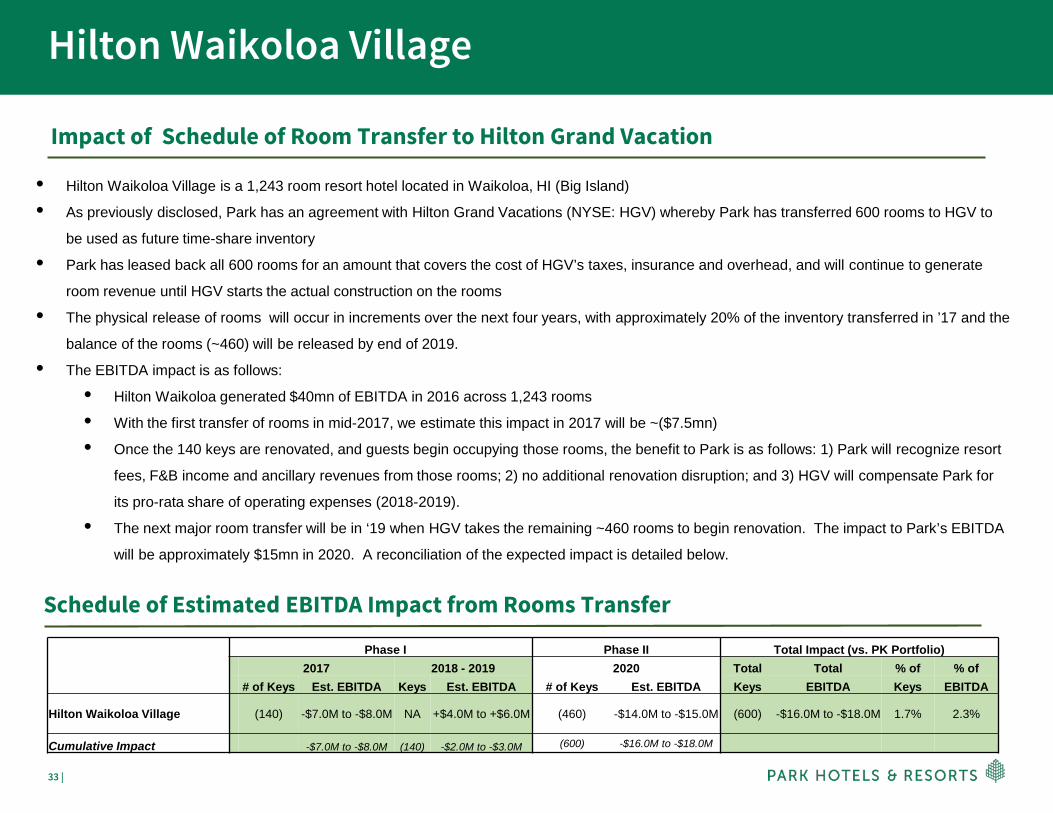
Hilton Waikoloa Village
• Hilton Waikoloa Village is a 1,243 room resort hotel located in Waikoloa, HI (Big Island)
• As previously disclosed, Park has an agreement with Hilton Grand Vacations (NYSE: HGV) whereby Park has transferred 600 rooms to HGV to
be used as future time-share inventory
• Park has leased back all 600 rooms for an amount that covers the cost of HGV’s taxes, insurance and overhead, and will continue to generate
room revenue until HGV starts the actual construction on the rooms
• The physical release of rooms will occur in increments over the next four years, with approximately 20% of the inventory transferred in ’17 and the
balance of the rooms (~460) will be released by end of 2019.
• The EBITDA impact is as follows:
• Hilton Waikoloa generated $40mn of EBITDA in 2016 across 1,243 rooms
• With the first transfer of rooms in mid-2017, we estimate this impact in 2017 will be ~($7.5mn)
• Once the 140 keys are renovated, and guests begin occupying those rooms, the benefit to Park is as follows: 1) Park will recognize resort
fees, F&B income and ancillary revenues from those rooms; 2) no additional renovation disruption; and 3) HGV will compensate Park for
its pro-rata share of operating expenses (2018-2019).
• The next major room transfer will be in ‘19 when HGV takes the remaining ~460 rooms to begin renovation. The impact to Park’s EBITDA
will be approximately $15mn in 2020. A reconciliation of the expected impact is detailed below.
Impact of Schedule of Room Transfer to Hilton Grand Vacation
Schedule of Estimated EBITDA Impact from Rooms Transfer
Phase I Phase II Total Impact (vs. PK Portfolio)2017 2018 - 2019 2020 Total Total % of % of
# of Keys Est. EBITDA Keys Est. EBITDA # of Keys Est. EBITDA Keys EBITDA Keys EBITDA
Hilton Waikoloa Village (140) -$7.0M to -$8.0M NA +$4.0M to +$6.0M (460) -$14.0M to -$15.0M (600) -$16.0M to -$18.0M 1.7% 2.3%
Cumulative Impact -$7.0M to -$8.0M (140) -$2.0M to -$3.0M (600) -$16.0M to -$18.0M
34 |
In Focus: San FranciscoParc 55 San Francisco
35 |
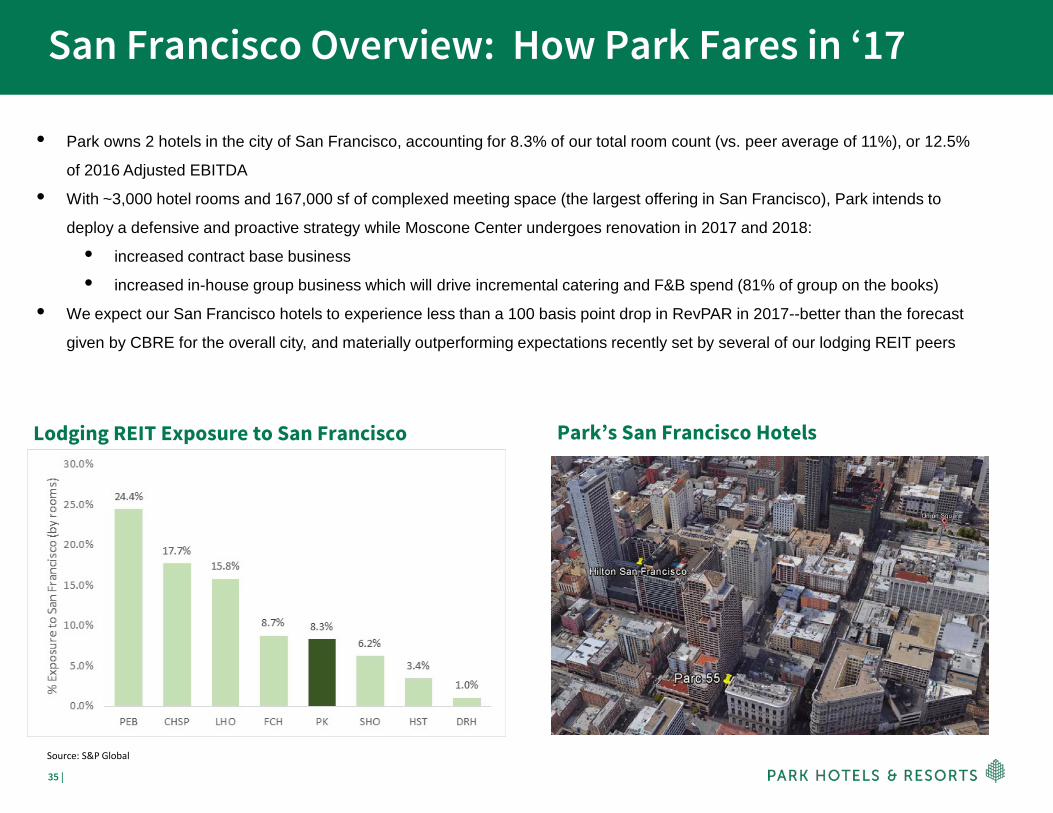
San Francisco Overview: How Park Fares in ‘17
• Park owns 2 hotels in the city of San Francisco, accounting for 8.3% of our total room count (vs. peer average of 11%), or 12.5%
of 2016 Adjusted EBITDA
• With ~3,000 hotel rooms and 167,000 sf of complexed meeting space (the largest offering in San Francisco), Park intends to
deploy a defensive and proactive strategy while Moscone Center undergoes renovation in 2017 and 2018:
• increased contract base business
• increased in-house group business which will drive incremental catering and F&B spend (81% of group on the books)
• We expect our San Francisco hotels to experience less than a 100 basis point drop in RevPAR in 2017--better than the forecast
given by CBRE for the overall city, and materially outperforming expectations recently set by several of our lodging REIT peers
Lodging REIT Exposure to San Francisco
Source: S&P Global
Park’s San Francisco Hotels

36 |
AppendixCasa Marina, The Waldorf Astoria Collection
37 |
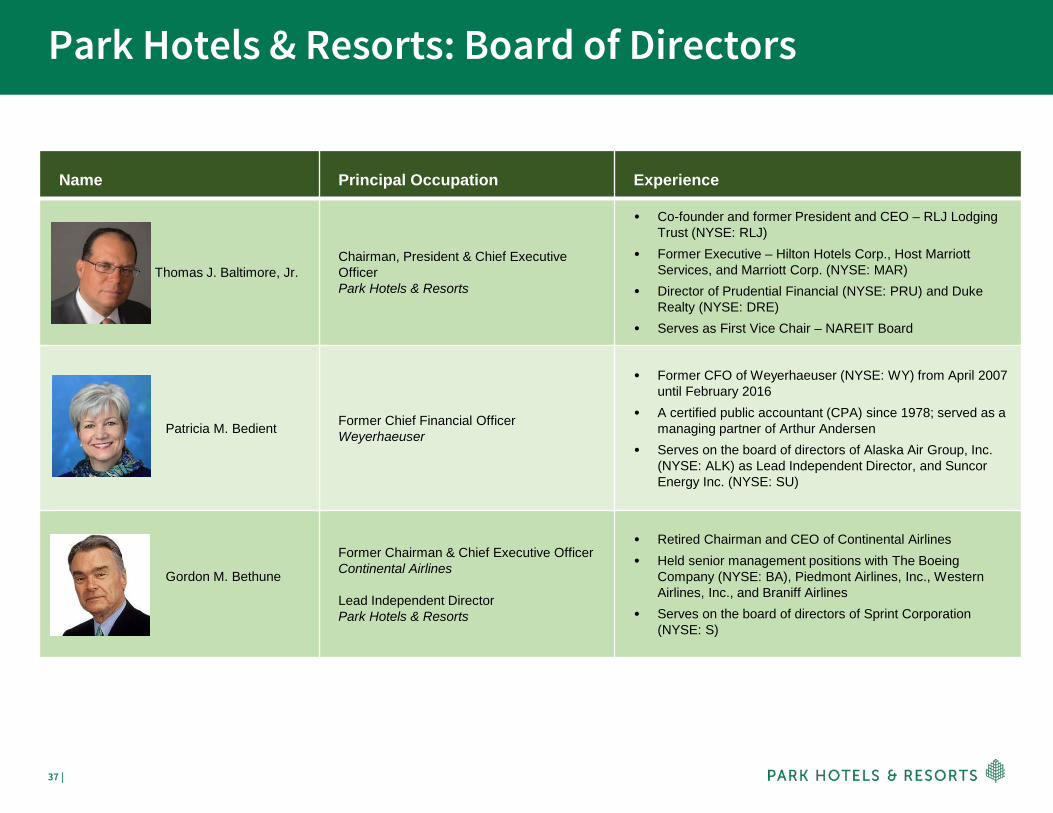
Park Hotels & Resorts: Board of Directors
Name Principal Occupation Experience
Thomas J. Baltimore, Jr. Chairman, President & Chief Executive OfficerPark Hotels & Resorts
• Co-founder and former President and CEO – RLJ Lodging Trust (NYSE: RLJ)
• Former Executive – Hilton Hotels Corp., Host Marriott Services, and Marriott Corp. (NYSE: MAR)
• Director of Prudential Financial (NYSE: PRU) and Duke Realty (NYSE: DRE)
• Serves as First Vice Chair – NAREIT Board
Patricia M. Bedient Former Chief Financial Officer Weyerhaeuser
• Former CFO of Weyerhaeuser (NYSE: WY) from April 2007 until February 2016
• A certified public accountant (CPA) since 1978; served as a managing partner of Arthur Andersen
• Serves on the board of directors of Alaska Air Group, Inc. (NYSE: ALK) as Lead Independent Director, and Suncor Energy Inc. (NYSE: SU)
Gordon M. Bethune
Former Chairman & Chief Executive OfficerContinental Airlines
Lead Independent DirectorPark Hotels & Resorts
• Retired Chairman and CEO of Continental Airlines • Held senior management positions with The Boeing
Company (NYSE: BA), Piedmont Airlines, Inc., Western Airlines, Inc., and Braniff Airlines
• Serves on the board of directors of Sprint Corporation (NYSE: S)
38 |
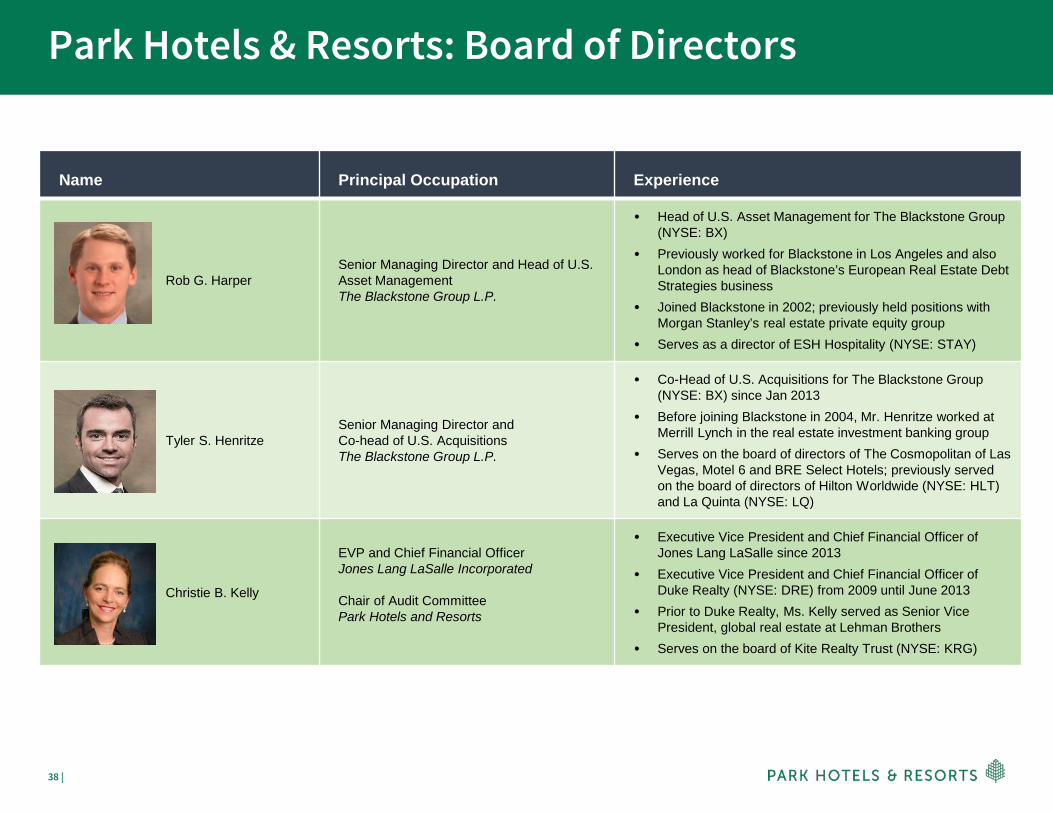
Park Hotels & Resorts: Board of Directors
Name Principal Occupation Experience
Rob G. Harper Senior Managing Director and Head of U.S. Asset Management The Blackstone Group L.P.
• Head of U.S. Asset Management for The Blackstone Group (NYSE: BX)
• Previously worked for Blackstone in Los Angeles and also London as head of Blackstone’s European Real Estate Debt Strategies business
• Joined Blackstone in 2002; previously held positions with Morgan Stanley’s real estate private equity group
• Serves as a director of ESH Hospitality (NYSE: STAY)
Tyler S. Henritze Senior Managing Director and Co-head of U.S. Acquisitions The Blackstone Group L.P.
• Co-Head of U.S. Acquisitions for The Blackstone Group (NYSE: BX) since Jan 2013
• Before joining Blackstone in 2004, Mr. Henritze worked at Merrill Lynch in the real estate investment banking group
• Serves on the board of directors of The Cosmopolitan of Las Vegas, Motel 6 and BRE Select Hotels; previously served on the board of directors of Hilton Worldwide (NYSE: HLT) and La Quinta (NYSE: LQ)
Christie B. Kelly
EVP and Chief Financial Officer Jones Lang LaSalle Incorporated
Chair of Audit CommitteePark Hotels and Resorts
• Executive Vice President and Chief Financial Officer of Jones Lang LaSalle since 2013
• Executive Vice President and Chief Financial Officer of Duke Realty (NYSE: DRE) from 2009 until June 2013
• Prior to Duke Realty, Ms. Kelly served as Senior Vice President, global real estate at Lehman Brothers
• Serves on the board of Kite Realty Trust (NYSE: KRG)
39 |
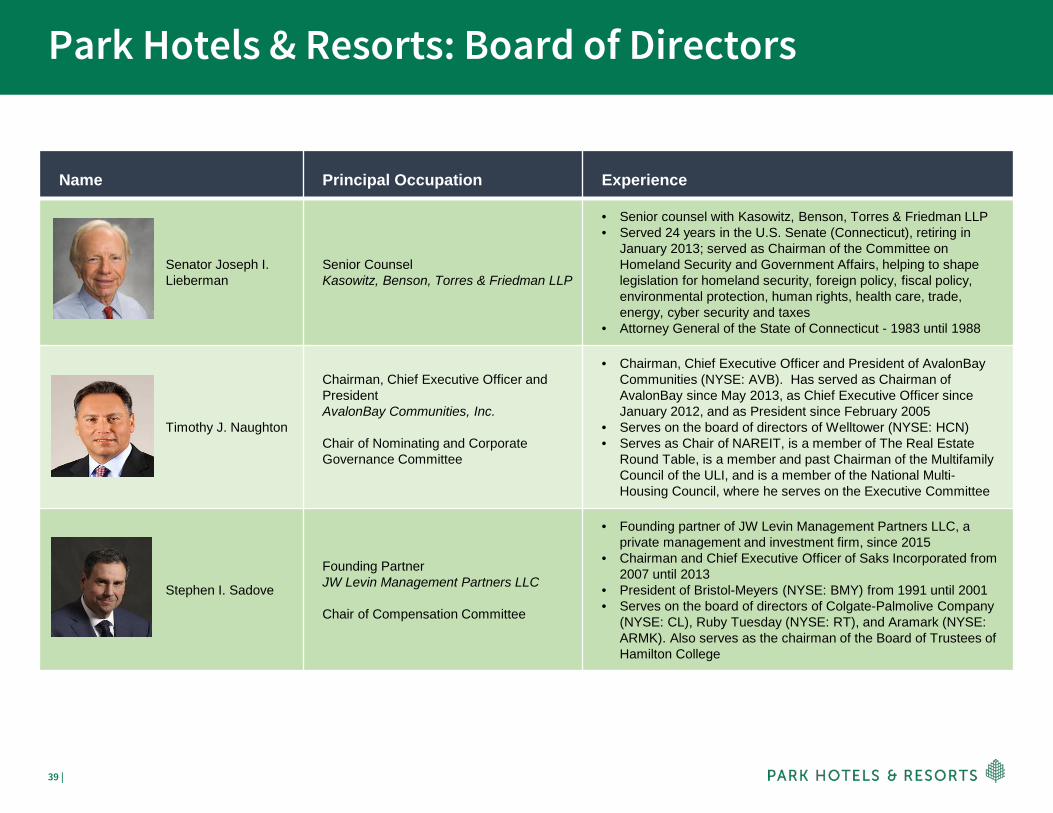
Park Hotels & Resorts: Board of Directors
Name Principal Occupation Experience
Senator Joseph I. Lieberman
Senior Counsel Kasowitz, Benson, Torres & Friedman LLP
• Senior counsel with Kasowitz, Benson, Torres & Friedman LLP • Served 24 years in the U.S. Senate (Connecticut), retiring in
January 2013; served as Chairman of the Committee on Homeland Security and Government Affairs, helping to shape legislation for homeland security, foreign policy, fiscal policy, environmental protection, human rights, health care, trade, energy, cyber security and taxes
• Attorney General of the State of Connecticut - 1983 until 1988
Timothy J. Naughton
Chairman, Chief Executive Officer and President AvalonBay Communities, Inc.
Chair of Nominating and Corporate Governance Committee
• Chairman, Chief Executive Officer and President of AvalonBay Communities (NYSE: AVB). Has served as Chairman of AvalonBay since May 2013, as Chief Executive Officer since January 2012, and as President since February 2005
• Serves on the board of directors of Welltower (NYSE: HCN) • Serves as Chair of NAREIT, is a member of The Real Estate
Round Table, is a member and past Chairman of the Multifamily Council of the ULI, and is a member of the National Multi-Housing Council, where he serves on the Executive Committee
Stephen I. Sadove
Founding PartnerJW Levin Management Partners LLC
Chair of Compensation Committee
• Founding partner of JW Levin Management Partners LLC, a private management and investment firm, since 2015
• Chairman and Chief Executive Officer of Saks Incorporated from 2007 until 2013
• President of Bristol-Meyers (NYSE: BMY) from 1991 until 2001• Serves on the board of directors of Colgate-Palmolive Company
(NYSE: CL), Ruby Tuesday (NYSE: RT), and Aramark (NYSE:ARMK). Also serves as the chairman of the Board of Trustees of Hamilton College
40 |
Guidance
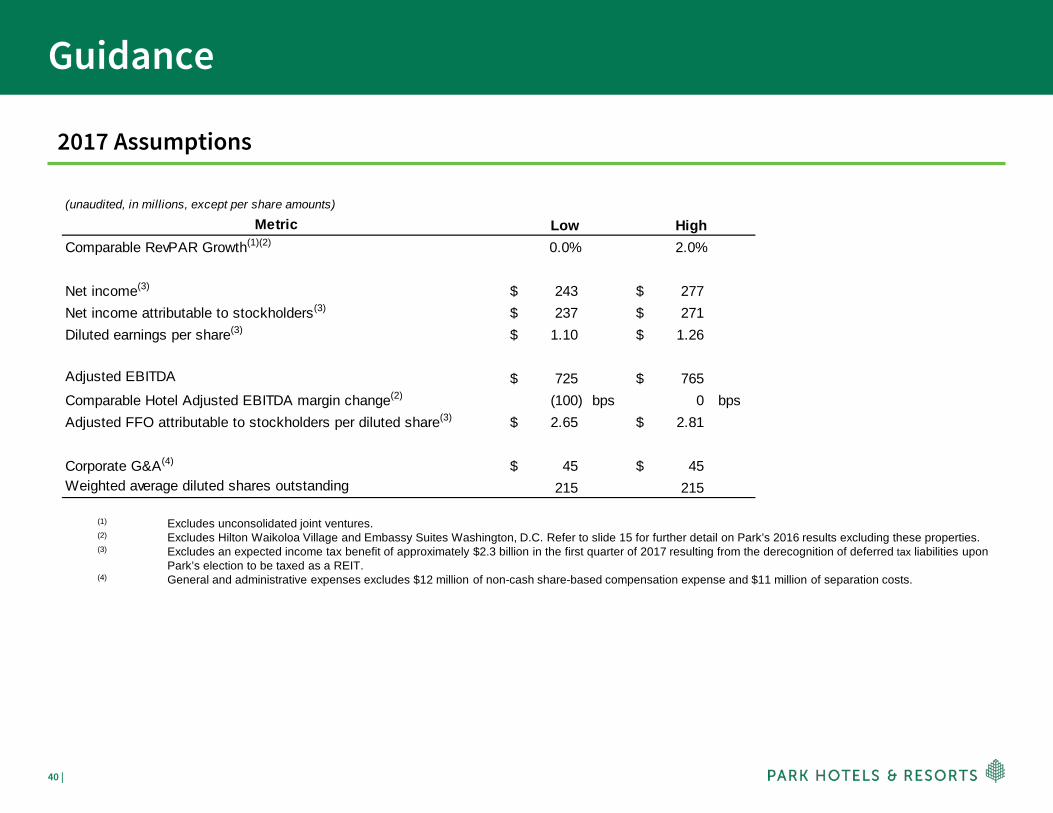
2017 Assumptions
(1) Excludes unconsolidated joint ventures.(2) Excludes Hilton Waikoloa Village and Embassy Suites Washington, D.C. Refer to slide 15 for further detail on Park’s 2016 results excluding these properties. (3) Excludes an expected income tax benefit of approximately $2.3 billion in the first quarter of 2017 resulting from the derecognition of deferred tax liabilities upon
Park’s election to be taxed as a REIT.(4) General and administrative expenses excludes $12 million of non-cash share-based compensation expense and $11 million of separation costs.
MetricComparable RevPAR Growth(1)(2) 0.0% 2.0%
Net income(3) 243$ 277$ Net income attributable to stockholders(3) 237$ 271$ Diluted earnings per share(3) 1.10$ 1.26$
Adjusted EBITDA 725$ 765$ Comparable Hotel Adjusted EBITDA margin change(2) (100) bps 0 bpsAdjusted FFO attributable to stockholders per diluted share(3) 2.65$ 2.81$
Corporate G&A(4) 45$ 45$ Weighted average diluted shares outstanding 215 215
(unaudited, in millions, except per share amounts)
HighLow
41 |
Guidance (cont’d)
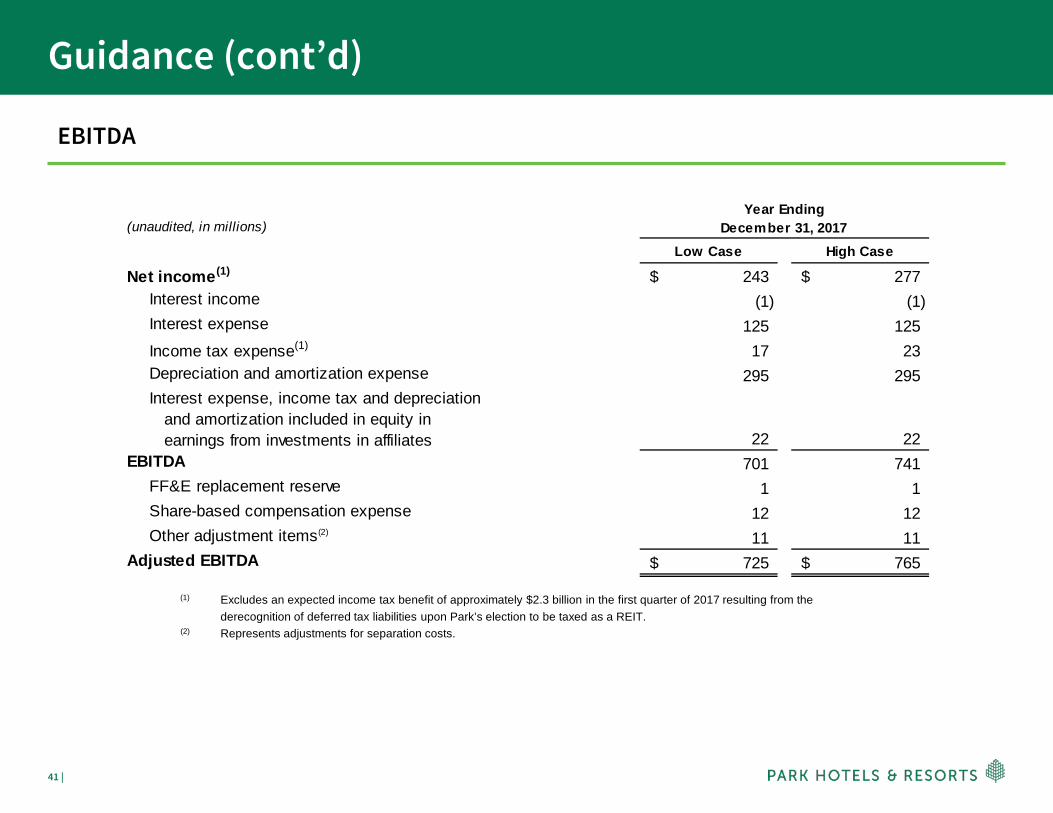
EBITDA
(1) Excludes an expected income tax benefit of approximately $2.3 billion in the first quarter of 2017 resulting from the derecognition of deferred tax liabilities upon Park’s election to be taxed as a REIT.
(2) Represents adjustments for separation costs.
(unaudited, in millions)
Low Case High Case
Net income(1) 243$ 277$ Interest income (1) (1)Interest expense 125 125Income tax expense(1) 17 23Depreciation and amortization expense 295 295Interest expense, income tax and depreciation and amortization included in equity in earnings from investments in affiliates 22 22
EBITDA 701 741FF&E replacement reserve 1 1Share-based compensation expense 12 12Other adjustment items(2) 11 11
Adjusted EBITDA 725$ 765$
Year EndingDecember 31, 2017
42 |
Guidance (cont’d)
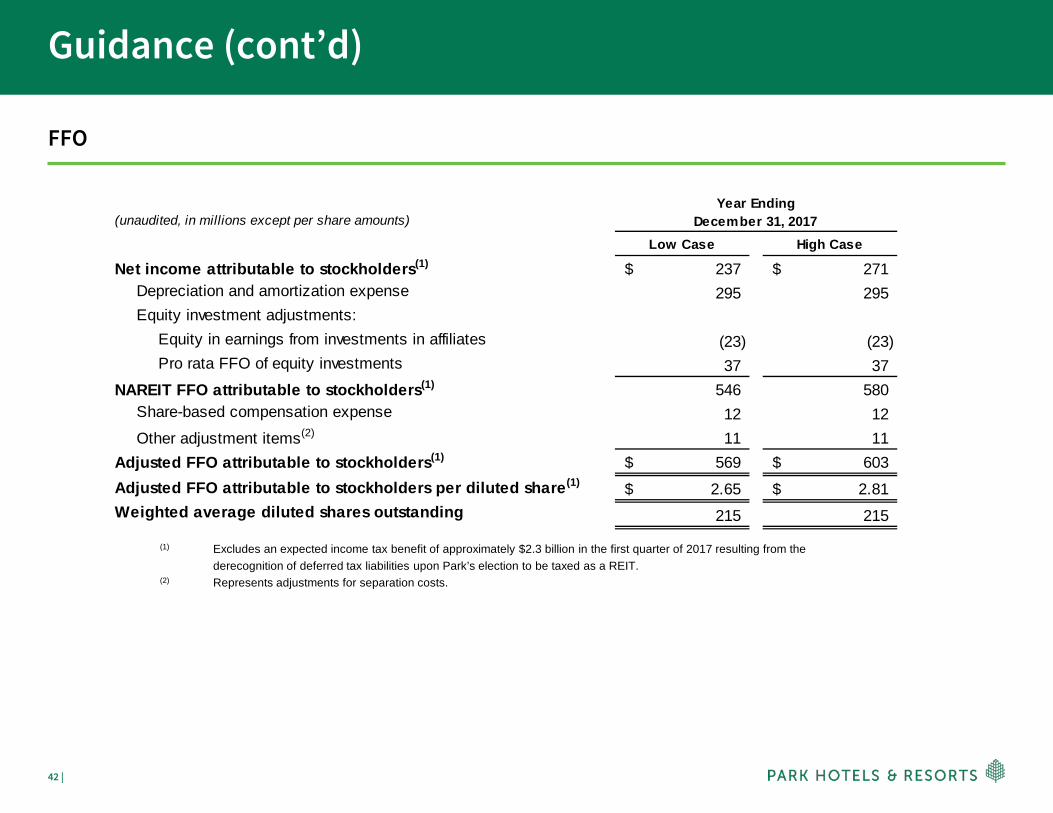
FFO
(unaudited, in millions except per share amounts)
Low Case High Case
Net income attributable to stockholders(1) 237$ 271$ Depreciation and amortization expense 295 295Equity investment adjustments:
Equity in earnings from investments in affiliates (23) (23)Pro rata FFO of equity investments 37 37
NAREIT FFO attributable to stockholders(1) 546 580Share-based compensation expense 12 12Other adjustment items(2) 11 11
Adjusted FFO attributable to stockholders(1) 569$ 603$ Adjusted FFO attributable to stockholders per diluted share(1) 2.65$ 2.81$ Weighted average diluted shares outstanding 215 215
Year EndingDecember 31, 2017
(1) Excludes an expected income tax benefit of approximately $2.3 billion in the first quarter of 2017 resulting from the derecognition of deferred tax liabilities upon Park’s election to be taxed as a REIT.
(2) Represents adjustments for separation costs.
43 |
Guidance (cont’d)
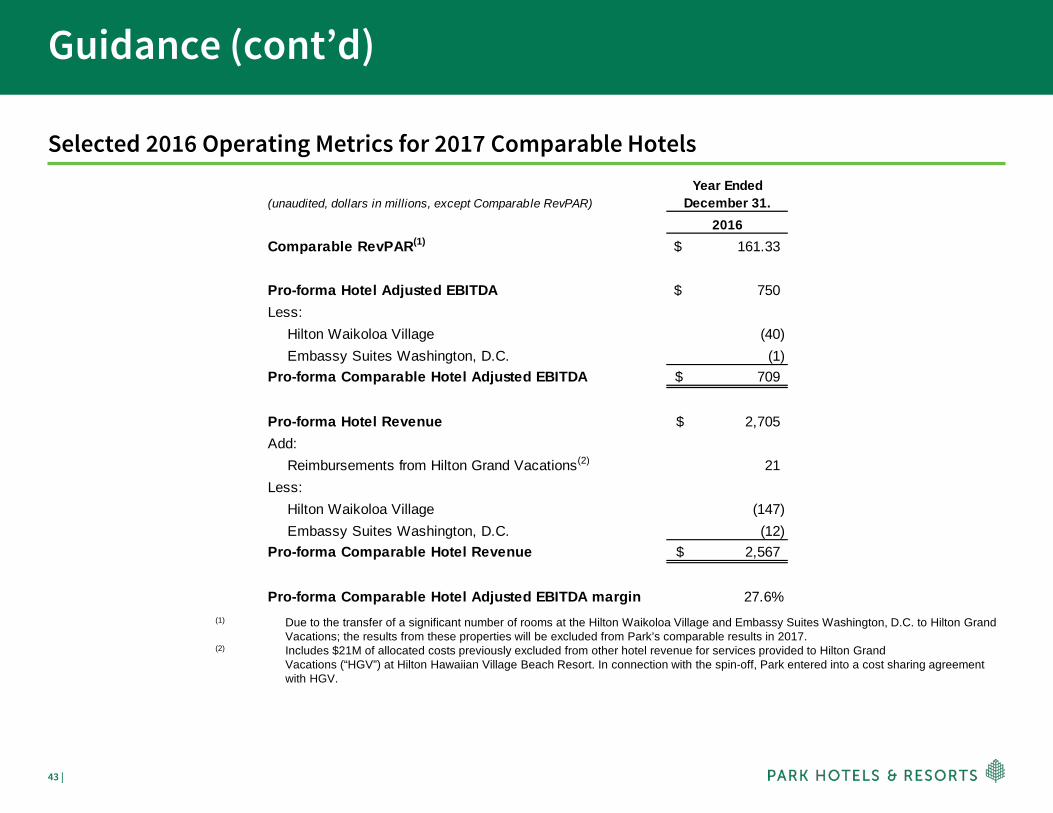
Selected 2016 Operating Metrics for 2017 Comparable Hotels
(1) Due to the transfer of a significant number of rooms at the Hilton Waikoloa Village and Embassy Suites Washington, D.C. to Hilton Grand Vacations; the results from these properties will be excluded from Park’s comparable results in 2017.
(2) Includes $21M of allocated costs previously excluded from other hotel revenue for services provided to Hilton Grand Vacations (“HGV”) at Hilton Hawaiian Village Beach Resort. In connection with the spin-off, Park entered into a cost sharing agreement with HGV.
(unaudited, dollars in millions, except Comparable RevPAR)Year Ended
December 31.2016
Comparable RevPAR(1) 161.33$
Pro-forma Hotel Adjusted EBITDA 750$ Less:
Hilton Waikoloa Village (40) Embassy Suites Washington, D.C. (1)
Pro-forma Comparable Hotel Adjusted EBITDA 709$
Pro-forma Hotel Revenue 2,705$ Add:
Reimbursements from Hilton Grand Vacations(2) 21 Less:
Hilton Waikoloa Village (147) Embassy Suites Washington, D.C. (12)
Pro-forma Comparable Hotel Revenue 2,567$
Pro-forma Comparable Hotel Adjusted EBITDA margin 27.6%
44 |
Non-GAAP Financial Measures
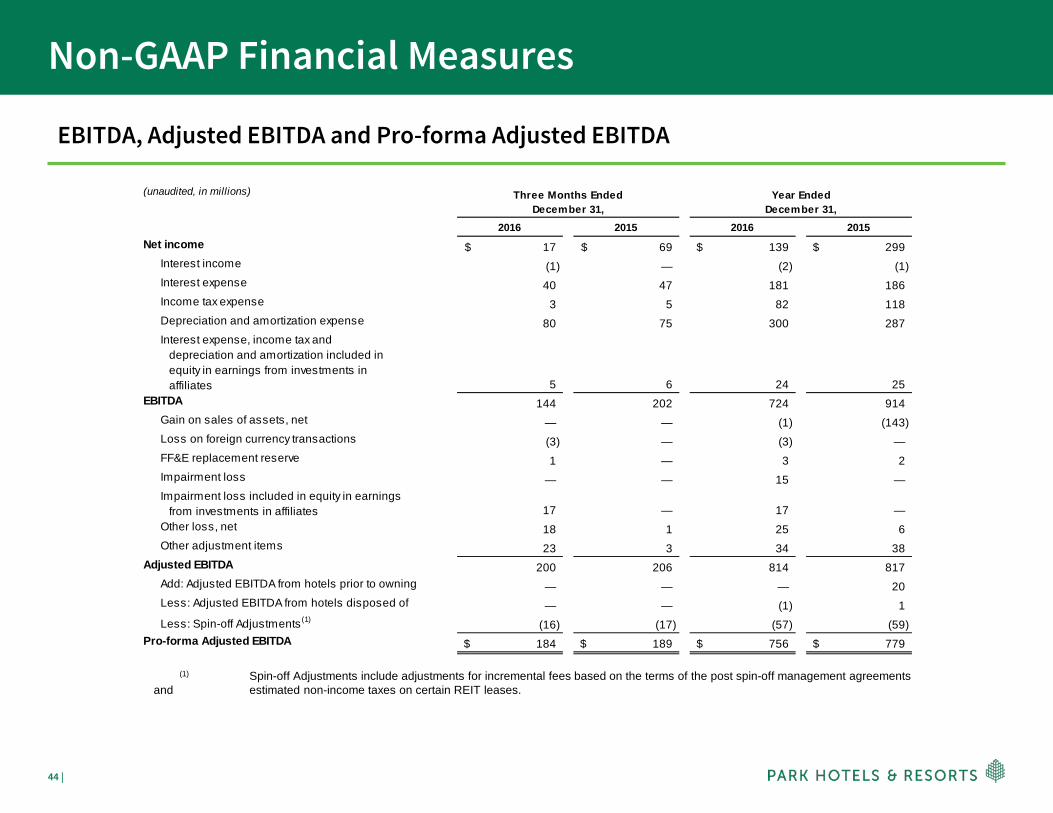
EBITDA, Adjusted EBITDA and Pro-forma Adjusted EBITDA
(unaudited, in millions)
2016 2015 2016 2015Net income 17$ 69$ 139$ 299$
Interest income (1) — (2) (1)Interest expense 40 47 181 186Income tax expense 3 5 82 118Depreciation and amortization expense 80 75 300 287Interest expense, income tax and depreciation and amortization included in equity in earnings from investments in affiliates 5 6 24 25
EBITDA 144 202 724 914Gain on sales of assets, net — — (1) (143)Loss on foreign currency transactions (3) — (3) —FF&E replacement reserve 1 — 3 2Impairment loss — — 15 —Impairment loss included in equity in earnings from investments in affiliates 17 — 17 —Other loss, net 18 1 25 6Other adjustment items 23 3 34 38
Adjusted EBITDA 200 206 814 817Add: Adjusted EBITDA from hotels prior to owning — — — 20Less: Adjusted EBITDA from hotels disposed of — — (1) 1Less: Spin-off Adjustments(1) (16) (17) (57) (59)
Pro-forma Adjusted EBITDA 184$ 189$ 756$ 779$
Year Ended December 31,
Three Months Ended December 31,
(1) Spin-off Adjustments include adjustments for incremental fees based on the terms of the post spin-off management agreements and estimated non-income taxes on certain REIT leases.
45 |
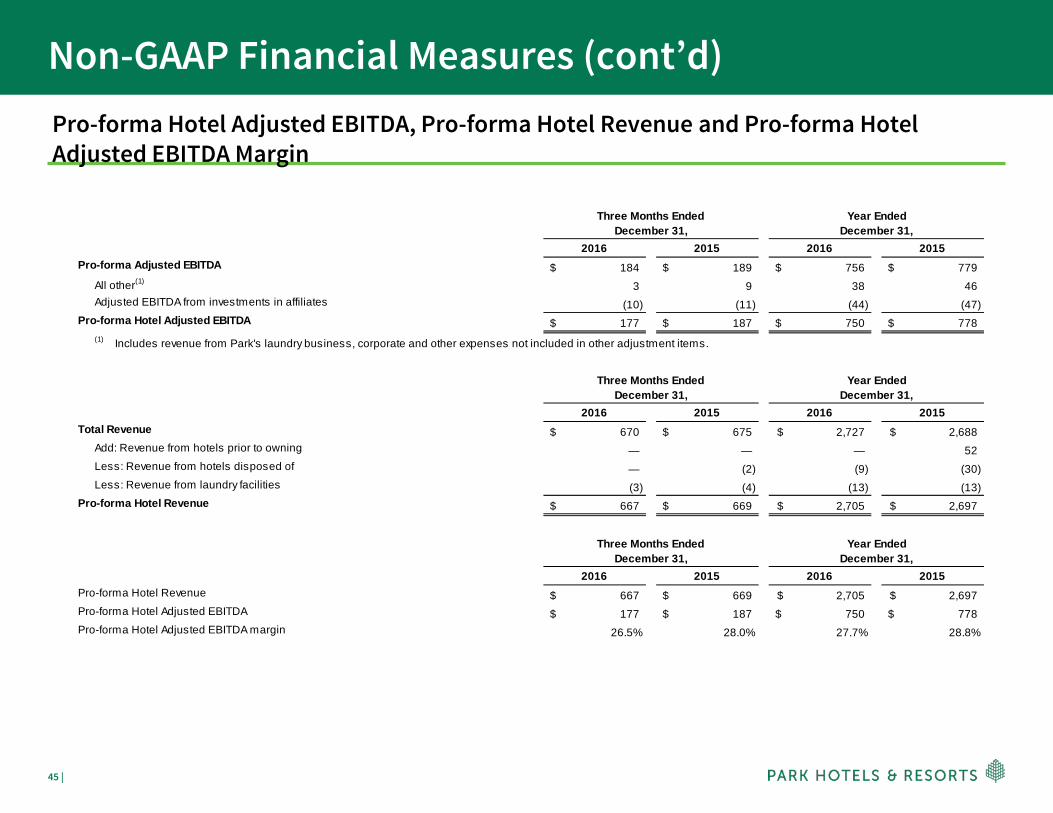
Non-GAAP Financial Measures (cont’d)Pro-forma Hotel Adjusted EBITDA, Pro-forma Hotel Revenue and Pro-forma Hotel Adjusted EBITDA Margin
2016 2015 2016 2015Pro-forma Adjusted EBITDA 184$ 189$ 756$ 779$
All other(1) 3 9 38 46Adjusted EBITDA from investments in affiliates (10) (11) (44) (47)
Pro-forma Hotel Adjusted EBITDA 177$ 187$ 750$ 778$
2016 2015 2016 2015Total Revenue 670$ 675$ 2,727$ 2,688$
Add: Revenue from hotels prior to owning — — — 52Less: Revenue from hotels disposed of — (2) (9) (30)Less: Revenue from laundry facilities (3) (4) (13) (13)
Pro-forma Hotel Revenue 667$ 669$ 2,705$ 2,697$
2016 2015 2016 2015Pro-forma Hotel Revenue 667$ 669$ 2,705$ 2,697$ Pro-forma Hotel Adjusted EBITDA 177$ 187$ 750$ 778$ Pro-forma Hotel Adjusted EBITDA margin 26.5% 28.0% 27.7% 28.8%
Three Months Ended December 31,
Year Ended December 31,
Year Ended December 31,
(1) Includes revenue from Park's laundry business, corporate and other expenses not included in other adjustment items.
Three Months Ended December 31,
Year Ended December 31,
Three Months Ended December 31,
46 |
Definitions
EBITDA, Adjusted EBITDA, Hotel Adjusted EBITDA and Hotel Adjusted EBITDA Margin
Earnings before interest expense, taxes and depreciation and amortization (“EBITDA”), presented herein, reflects net income (loss), excluding interestexpense, a provision for income taxes and depreciation and amortization. The Company considers EBITDA to be a useful measure for investors inevaluating and facilitating comparisons of its operating performance between periods and between REITs by removing the impact of the Company’s capitalstructure (primarily interest expense) and asset base (primarily depreciation and amortization) from its operating results.
Adjusted EBITDA, presented herein, is calculated as EBITDA, as previously defined, further adjusted to exclude gains, losses and expenses in connectionwith: (i) asset dispositions for both consolidated and unconsolidated investments; (ii) foreign currency transactions; (iii) debt restructurings/retirements; (iv)non-cash impairment losses; (v) furniture, fixtures and equipment (“FF&E”) replacement reserves required by certain lease agreements; (vi) reorganizationcosts; (vii) share-based and certain other compensation expenses; (viii) severance, relocation and other expenses; and (ix) other items.
Hotel Adjusted EBITDA measures property-level results before debt service, depreciation and corporate expenses of the Company’s consolidatedproperties, including both comparable and non-comparable hotels but excluding properties owned by unconsolidated affiliates, and is a key measure of theCompany’s profitability. The Company presents Hotel Adjusted EBITDA to help the Company and its investors evaluate the ongoing operating performanceof the Company’s consolidated properties.
Hotel Adjusted EBITDA margin, is calculated as Hotel Adjusted EBITDA as a percentage of Total Hotel Revenue.
EBITDA, Adjusted EBITDA, Hotel Adjusted EBITDA and Hotel Adjusted EBITDA margin are not recognized terms under United States (“U.S.”) GAAP andshould not be considered as alternatives to net income (loss) or other measures of financial performance or liquidity derived in accordance with U.S.GAAP. In addition, the Company’s definitions of EBITDA, Adjusted EBITDA, Hotel Adjusted EBITDA and Hotel Adjusted EBITDA margin may not becomparable to similarly titled measures of other companies.
The Company believes that EBITDA, Adjusted EBITDA, Hotel Adjusted EBITDA and Hotel Adjusted EBITDA margin provide useful information to investorsabout the Company and its financial condition and results of operations for the following reasons: (i) EBITDA, Adjusted EBITDA, Hotel Adjusted EBITDAand Hotel Adjusted EBITDA margin are among the measures used by the Company’s management team to evaluate its operating performance and makeday-to-day operating decisions; and (ii) EBITDA, Adjusted EBITDA, Hotel Adjusted EBITDA and Hotel Adjusted EBITDA margin are frequently used bysecurities analysts, investors and other interested parties as a common performance measure to compare results or estimate valuations across companiesin the industry.
EBITDA, Adjusted EBITDA, Hotel Adjusted EBITDA and Hotel Adjusted EBITDA margin have limitations as analytical tools and should not be consideredeither in isolation or as a substitute for net income (loss) or other methods of analyzing results as reported under U.S. GAAP.
47 |
Definitions (cont’d)
NAREIT FFO attributable to Parent, or stockholders, and Adjusted FFO attributable to Parent, or stockholders
NAREIT FFO attributable to Parent, or stockholders, presented herein, is calculated as net income (loss) attributable to Parent, or stockholders,(calculated in accordance with U.S. GAAP), excluding gains (losses) from sales of real estate, the cumulative effect of changes in accountingprinciples, real estate-related depreciation, amortization and impairments and adjustments for unconsolidated joint ventures. Adjustments forunconsolidated joint ventures are calculated to reflect the Company’s pro rata share of the FFO of those entities on the same basis. The Companycalculates NAREIT FFO attributable to Parent, or stockholders, for a given operating period in accordance with the guidelines of the NationalAssociation of Real Estate Investment Trusts (“NAREIT”). As noted by NAREIT in its April 2002 “White Paper on Funds From Operations,” since realestate values historically have risen or fallen with market conditions, many industry investors have considered presentation of operating results forreal estate companies that use historical cost accounting to be insufficient by themselves. For these reasons, NAREIT adopted the FFO metric inorder to promote an industry-wide measure of REIT operating performance.
Adjusted FFO attributable to Parent, or stockholders, presented herein, is NAREIT FFO attributable to Parent, or stockholders, as previouslydefined, further adjusted to exclude: (i) foreign currency (gains) losses; (ii) acquisition costs; (iii) litigation gains and losses; and (iv) other items. Incertain circumstances, the Company may also adjust NAREIT FFO attributable to parent, or stockholders, attributable for additional gains or lossesthat the Company’s management believes are not representative of its current operating performance.
NAREIT FFO attributable to Parent, or stockholders, and Adjusted FFO attributable to Parent, or stockholders, are not recognized terms under U.S.GAAP and should not be considered as alternatives to net income (loss) or other measures of financial performance or liquidity derived inaccordance with U.S. GAAP. In addition, the Company’s definitions of NAREIT FFO attributable to Parent, or stockholders, and Adjusted FFOattributable to Parent, or stockholders, may not be comparable to similarly titled measures of other companies.
The Company believes that NAREIT FFO attributable to Parent, or stockholders, and Adjusted FFO attributable to Parent, or stockholders, provideuseful information to investors about the Company and its financial condition and results of operations for the following reasons: (i) these measuresare among the measures used by the Company’s management team to evaluate its operating performance and make day-to-day operatingdecisions; and (ii) these measures are frequently used by securities analysts, investors and other interested parties as a common performancemeasure to compare results or estimate valuations across companies in the industry.
NAREIT FFO attributable to Parent, or stockholders, and Adjusted FFO attributable to Parent, or stockholders, have limitations as analytical toolsand should not be considered either in isolation or as a substitute for net income (loss), cash flow or other methods of analyzing results as reportedunder U.S. GAAP.
48 |
Definitions (cont’d)
Net Debt
Net debt, presented herein, is a non-GAAP financial measure that the Company uses to evaluate its financial leverage. Net debt is calculated as (i)long-term debt, including current maturities and excluding unamortized deferred financing costs; and (ii) the Company’s share of investments inaffiliate debt, excluding unamortized deferred financing costs; reduced by (a) cash and cash equivalents; and (b) restricted cash and cashequivalents.
The Company believes Net debt provides useful information about its indebtedness to investors as it is frequently used by securities analysts,investors and other interested parties to compare the indebtedness of companies. Net debt should not be considered as a substitute to debtpresented in accordance with U.S. GAAP. Net debt may not be comparable to a similarly titled measure of other companies.
Net Debt to Adjusted EBITDA Ratio
Net debt to Adjusted EBITDA ratio, presented herein, is a non-GAAP financial measure and is included as it is frequently used by securitiesanalysts, investors and other interested parties to compare the financial condition of companies. Net debt to Adjusted EBITDA ratio should not beconsidered as an alternative to measures of financial condition derived in accordance with U.S. GAAP and it may not be comparable to a similarlytitled measure of other companies.
Comparable Hotels
The Company presents certain data for its properties on a comparable hotel basis as supplemental information for investors. The Company definesits comparable hotels as those hotels that: (i) were active and operating in the Company’s portfolio since January 1st of the previous year; and (ii)have not sustained substantial property damage, business interruption, undergone large-scale capital projects or for which comparable results arenot available. The Company presents comparable hotel results to help the Company and its investors evaluate the ongoing operating performanceof its comparable hotels.
49 |
Definitions (cont’d)
Occupancy
Occupancy represents the total number of room nights sold divided by the total number of room nights available at a property or group of properties.Occupancy measures the utilization of the Company’s properties available capacity. Management uses occupancy to gauge demand at a specificproperty or group of properties in a given period. Occupancy levels also help management determine achievable Average Daily Rate (“ADR”) levelsas demand for hotel rooms increases or decreases.
Average Daily Rate
ADR represents rooms revenue divided by total number of room nights sold in a given period. ADR measures average room price attained by aproperty and ADR trends provide useful information concerning the pricing environment and the nature of the customer base of a property or groupof properties. ADR is a commonly used performance measure in the hotel industry, and management uses ADR to assess pricing levels that theCompany is able to generate by type of customer, as changes in rates have a different effect on overall revenues and incremental profitability thanchanges in occupancy, as described above.
Revenue per Available Room
Revenue per Available Room (“RevPAR”) represents rooms revenue divided by total number of room nights available to guests for a given period.Management considers RevPAR to be a meaningful indicator of the Company’s performance as it provides a metric correlated to two primary andkey drivers of operations at a property or group of properties: occupancy and ADR. RevPAR is also a useful indicator in measuring performance overcomparable periods for comparable hotels.
References to RevPAR and ADR are presented on a currency neutral basis (all periods use the same exchange rates), unless otherwise noted.
Pro-forma
Certain financial measures and other information have been adjusted for the Company’s historical debt and related balances and interest expense togive the net effect to financing transactions that were completed prior to spin-off, incremental fees based on the terms of the post spin-offmanagement agreements, adjustments to income tax expense based on the Company’s post spin-off REIT tax structure, the removal of costsincurred related to the spin-off and the establishment of Park as a separate public company and the estimated excise taxes on certain REIT leases.Further adjustments have been made to reflect the effects of hotels disposed of or acquired during the periods presented. When presenting suchinformation, the amounts are identified as “Pro-forma.”
50 |
About Park Hotels & Resorts Inc. and Safe Harbor Disclosure
About Park Hotels & Resorts Inc.Park (NYSE: PK) is a leading lodging real estate company with a diverse portfolio of market-leading hotels and resorts with significant underlyingreal estate value. Park’s portfolio consists of 67 premium-branded hotels and resorts with over 35,000 rooms located in prime U.S. andinternational markets with high barriers to entry. Over 85% of Park’s rooms are luxury and upper upscale and nearly 90% are located in theUnited States, including 14 of the top 25 markets as defined by Smith Travel Research (“STR”). Over 70% of Park’s rooms are located in thecentral business districts of major cities and resort/conference destinations. Park is focused on driving premium long-term total returns bycontinuing to enhance the value of its existing properties and utilizing its scale to efficiently allocate capital to drive growth while maintaining astrong and flexible balance sheet. Visit www.pkhotelsandresorts.com for more information.
Forward-Looking StatementsThis presentation contains forward-looking statements within the meaning of Section 27A of the Securities Act of 1933, as amended, and Section21E of the Securities Exchange Act of 1934, as amended. Forward-looking statements include, but are not limited to, statements related to Park’scurrent expectations regarding the performance of its business, financial results, liquidity and capital resources, the effects of competition and theeffects of future legislation or regulations and other non-historical statements. Forward-looking statements include all statements that are nothistorical facts and, in some cases, can be identified by the use of forward-looking terminology such as the words “outlook,” “believes,” “expects,”“potential,” “continues,” “may,” “will,” “should,” “could,” “seeks,” “approximately,” “projects,” “predicts,” “intends,” “plans,” “estimates,” “anticipates”or the negative version of these words or other comparable words. Forward-looking statements involve risks, uncertainties and assumptions.Actual results may differ materially from those expressed in these forward-looking statements. You should not put undue reliance on any forward-looking statements in this presentation. Additional factors that could cause Park’s results to differ materially from those described in the forward-looking statements can be found under the sections entitled “Forward-Looking Statements,” “Risk Factors” and “Management’s Discussion andAnalysis of Financial Condition and Results of Operations” (or similar captions) in Park’s Annual Report on Form 10K, filed with the SEC onMarch 2, 2017, as such factors may be updated from time to time in Park’s periodic filings with the SEC, which are accessible on the SEC’swebsite at www.sec.gov. Forward-looking statements speak only as of the date on which they are made, and, except as otherwise may berequired by law. Park undertakes no obligation to update or revise publicly any guidance or other forward-looking statement, whether as a resultof new information, future developments or otherwise, except as required by law.