Cisco Visual Networking Index and VNI Service Adoption 2014–2019 - Argentina
85
May 2015 Cisco Visual Networking Index and VNI Service Adoption 2014–2019 Gonzalo Valverde Director Service Providers & Enterprise Argentina, Uruguay y Paraguay.
-
Upload
oscar-romano -
Category
Technology
-
view
71 -
download
2
Transcript of Cisco Visual Networking Index and VNI Service Adoption 2014–2019 - Argentina
May 2015
Cisco Visual Networking Index and VNI Service Adoption2014–2019
Gonzalo Valverde
Director Service Providers & Enterprise Argentina, Uruguay y Paraguay.

2© 2015 Cisco and/or its affiliates. All rights reserved. Cisco Confidential
Cisco Visual Networking Index (VNI)Global Service Adoption & IP Traffic Growth
Cisco VNI Forecasts are complementary and statistically aligned.
VNI
Service Adoption Forecast
Fixed & Mobile IP Traffic Forecast
FIXED MOBILE RESIDENTIAL MOBILE BUSINESS

3© 2015 Cisco and/or its affiliates. All rights reserved. Cisco Confidential
Global IP Traffic & Service Adoption Drivers
More Devices & Connections
More Internet Users
Faster Broadband Speeds
More VideoViewing
Source: Cisco VNI Global IP Traffic Forecast, 2014–2019
By 2019:
2014 201914.2 Billion 24.4 Billion
2014 201920.3 Mbps 42.5 Mbps
2014 20192.8 Billion 3.9 Billion
2014 201967% of Traffic
80% of Traffic
IP Broadband Growth Drivers

4© 2015 Cisco and/or its affiliates. All rights reserved. Cisco Confidential
LATAM IP Traffic & Service Adoption Drivers
More Devices & Connections
More Internet Users
Faster Broadband Speeds
More VideoViewing
Source: Cisco VNI Global IP Traffic Forecast, 2014–2019
By 2019:
2014 20191.2 Billion 1.9 Billion
2014 20197.2 Mbps 17 Mbps
2014 2019260 Million 371 Million
2014 201961% of Traffic
82% of Traffic
IP Broadband Growth Drivers

5© 2015 Cisco and/or its affiliates. All rights reserved. Cisco Confidential
Overview

6© 2015 Cisco and/or its affiliates. All rights reserved. Cisco Confidential
2009-2014 CAGR0%
5%
10%
15%
20%
25%
30%
35%
40%
34.2%Projected in 2010Actual
35.6%
Source: Cisco VNI Global IP Traffic Forecast, 2014–2019
VNI Projections and Actuals (Global)Actual Growth Has Been Within 10% of Projected Growth
Compound Annual
Growth Rate (CAGR)

7© 2015 Cisco and/or its affiliates. All rights reserved. Cisco Confidential
Global IP Traffic Growth / Top-LineGlobal IP Traffic will Increase 3-Fold from 2014─2019
23% CAGR 2014–2019
2014 2015 2016 2017 2018 20190
20,000,000,000
40,000,000,000
60,000,000,000
80,000,000,000
100,000,000,000
120,000,000,000
140,000,000,000
160,000,000,000
180,000,000,000
59,850,764,107.7
72,433,677,711.9
88,442,868,703.8
108,998,838,457.9
135,488,580,765.3
167,972,892,365.9
Exabytes per Month
Source: Cisco VNI Global IP Traffic Forecast, 2014–2019

8© 2015 Cisco and/or its affiliates. All rights reserved. Cisco Confidential
2014 2015 2016 2017 2018 20190
2,000,000,000
4,000,000,000
6,000,000,000
8,000,000,000
10,000,000,000
12,000,000,000
14,000,000,000 Chile (23% CAGR)
Argentina (21% CAGR)
Mexico (29% CAGR)
Rest of LATAM (31% CAGR)
Brazil (19% CAGR)
LATAM IP Traffic Growth / RegionsRest of LATAM has the Highest Growth Rate (31%) from 2014–2019
Exabytes per Month
Source: Cisco VNI Global IP Traffic Forecast, 2014–2019
25% CAGR 2014–2019
27%
34%
24%
9%6%

9© 2015 Cisco and/or its affiliates. All rights reserved. Cisco Confidential
2014 2015 2016 2017 2018 20190
20,000,000,000
40,000,000,000
60,000,000,000
80,000,000,000
100,000,000,000
120,000,000,000
140,000,000,000
160,000,000,000
180,000,000,000 Middle East and Africa (MEA) (44% CAGR)
Latin America (LATAM) (25% CAGR)
Central and Eastern Europe (CEE) (33% CAGR)
Western Europe (WE) (21% CAGR)
North America (NA) (20% CAGR)
Asia Pacific (APAC) (21% CAGR)
Global IP Traffic Growth / RegionsMEA has the Highest Growth Rate (44%) from 2014–2019APAC will Generate 32% of all IP Traffic by 2019
29.6%
32.4%
10.0%
5.6%
14.7%
Exabytes per Month
7.7%
Source: Cisco VNI Global IP Traffic Forecast, 2014–2019
23% CAGR 2014–2019

10© 2015 Cisco and/or its affiliates. All rights reserved. Cisco Confidential
Drivers

11© 2015 Cisco and/or its affiliates. All rights reserved. Cisco Confidential
Global Internet UsersFrom 2.8 Billion in 2014 to 3.9 Billion by 2019 at 6.9% CAGR
North America Western Europe Central/Eastern Europe
Latin America Middle East & Africa Asia Pacific
319 Million by 2019CAGR 1.0%
350 Million by 2019CAGR 0.9%
336 Million by 2019CAGR 5.3%
371 Million by 2019CAGR 7.4%
425 Million by 2019CAGR 10.3%
2.1 Billion by 2019CAGR 8.7%
Source: Cisco VNI Global IP Traffic Forecast, 2014–2019

12© 2015 Cisco and/or its affiliates. All rights reserved. Cisco Confidential
Global Device and ConnectionsFrom 14.2 Billion in 2014 to 24.4 Billion by 2019 at 12% CAGR
North America Western Europe Central/Eastern Europe
Latin America Middle East & Africa Asia Pacific
4.3 Billion by 2019CAGR 14%
3.5 Billion by 2019CAGR 13%
2.1 Billion by 2019CAGR 12%
1.9 Billion by 2019CAGR 9%
2.1 Billion by 2019CAGR 9%
10.5 Billion by 2019CAGR 11%
Source: Cisco VNI Global IP Traffic Forecast, 2014–2019

13© 2015 Cisco and/or its affiliates. All rights reserved. Cisco Confidential
Global Fixed Broadband Speed GrowthAverage Broadband Speed Will More Than Double from 20.3 Mbps (2014) to 42.5 Mbps (2019)
North America Western Europe Central/Eastern Europe
Latin America Middle East & Africa Asia Pacific
2.0-fold Growth21.8 to 43.7 Mbps
2.3-fold Growth21.8 to 49.1 Mbps
2.0-fold Growth22.2 to 45.3 Mbps
2.3-fold Growth7.2 to 16.9 Mbps
2.4-fold Growth6.1 to 14.9 Mbps
2.1-fold Growth23.2 to 48.9 Mbps
Source: Cisco VNI Global IP Traffic Forecast, 2014–2019

14© 2015 Cisco and/or its affiliates. All rights reserved. Cisco Confidential
Global IP Traffic – Increasing Video ViewingBy 2019, Video Will Drive 80% of IP Traffic, Up from 67% in 2014
North America Western Europe Central/Eastern Europe
Latin America Middle East & Africa Asia Pacific
84% of traffic by 201922% CAGR
80% of traffic by 201928% CAGR
72% of traffic by 201945% CAGR
82% of traffic by 201932% CAGR
78% of traffic by 201955% CAGR
79% of traffic by 201926% CAGR
Source: Cisco VNI Global IP Traffic Forecast, 2014–2019

15© 2015 Cisco and/or its affiliates. All rights reserved. Cisco Confidential
Top Trends

16© 2015 Cisco and/or its affiliates. All rights reserved. Cisco Confidential
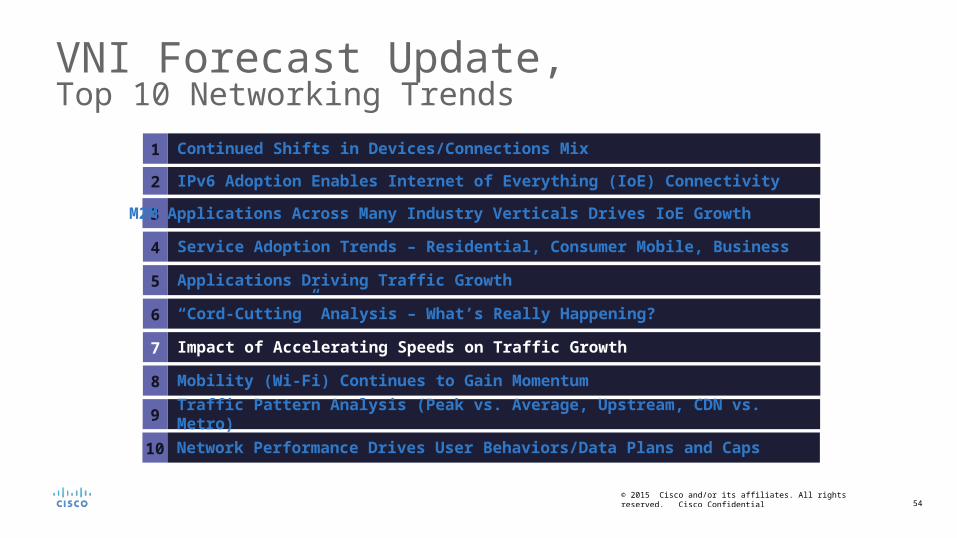
VNI Forecast Update, 2014–2019 Top 10 Networking Trends
1 Continued Shifts in Devices/Connections Mix
2 IPv6 Adoption Enables Internet of Everything (IoE) Connectivity
3
4 Service Adoption Trends – Residential, Consumer Mobile, Business
5 Applications Driving Traffic Growth
6 “Cord-Cutting” Analysis – What’s Really Happening?
7 Impact of Accelerating Speeds on Traffic Growth
8 Mobility (Wi-Fi) Continues to Gain Momentum
9 Traffic Pattern Analysis (Peak vs. Average, Upstream, CDN vs. Metro)
10 Network Performance Drives User Behaviors/Data Plans and Caps
M2M Applications Across Many Industry Verticals Drives IoE Growth

17© 2015 Cisco and/or its affiliates. All rights reserved. Cisco Confidential
Global Device/Connection Growth by TypeBy 2019, M2M Connections Will be More Than 40% of Total Connections
2014 2015 2016 2017 2018 20190
5,000,000,000
10,000,000,000
15,000,000,000
20,000,000,000
25,000,000,000
30,000,000,000
Other (4.9%,3.6%)
Tablets (3%,4%)
PCs (11%,6%)
TVs (11%,12%)
Non-Smartphones (32%,13%)
Smartphones (15%,19%)
M2M (24%,43%)
Billions of Devices
* Figures (n) refer to 2014, 2019 device share Source: Cisco VNI Global IP Traffic Forecast, 2014–2019
12% CAGR 2014–2019

18© 2015 Cisco and/or its affiliates. All rights reserved. Cisco Confidential
LATAM Device/Connection Growth by TypeBy 2019, M2M Connections Will be More Than 30% of Total Connections
2014 2015 2016 2017 2018 20190.0
500,000,000.0
1,000,000,000.0
1,500,000,000.0
2,000,000,000.0
2,500,000,000.0
Other (3.3%,4.1%)
Tablets (3%,5%)
PCs (13%,8%)
TVs (6%,14%)
Non-Smartphones (40%,14%)
Smartphones (17%,24%)
M2M (18%,31%)
Billions of Devices
* Figures (n) refer to 2014, 2019 device share Source: Cisco VNI Global IP Traffic Forecast, 2014–2019
9% CAGR 2014–2019

19© 2015 Cisco and/or its affiliates. All rights reserved. Cisco Confidential
SD 2 Mbps
HD 7.2 Mbps
UHD 18 Mbps
2014 2015 2016 2017 2018 20190
50,000,000
100,000,000
150,000,000
200,000,000
250,000,000
300,000,000
350,000,000
400,000,000
9,935,743 33,335,708
76,827,402
146,440,003
244,732,995
371,454,498
Connected 4K TV Sets
(M)
Source: Cisco VNI Global IP Traffic Forecast, 2014–2019
Increasing Video DefinitionBy 2019, More than 31% of Connected Flat Panel TV Sets will be 4K

20© 2015 Cisco and/or its affiliates. All rights reserved. Cisco Confidential
Global Average IP Traffic Per Device2014 2019
Wearable Device
Smartphone
Tablet
MBs per Month MBs per Month
1,640 8,419
6,213 14,800
6,258 34,880
23,824 36,311
22,415 50,177
M2M Module
Internet Set-Top or Dongle
Smartphone
Tablet
Laptop / PC
92 433
Ultra High Definition TV*
Source: Cisco VNI Global IP Traffic Forecast, 2014–2019
*Note: Includes IP VoD traffic

21© 2015 Cisco and/or its affiliates. All rights reserved. Cisco Confidential
LATAM Average IP Traffic Per Device2014 2019
Wearable Device
Smartphone
Tablet
MBs per Month MBs per Month
942 5,312
4,717 11,271
6,608 32,113
21,577 34,056
9,979 11,778
M2M Module
Internet Set-Top or Dongle
Smartphone
Tablet
Laptop / PC
49 409
Ultra High Definition TV*
Source: Cisco VNI Global IP Traffic Forecast, 2014–2019
*Note: Includes IP VoD traffic
22© 2015 Cisco and/or its affiliates. All rights reserved. Cisco Confidential
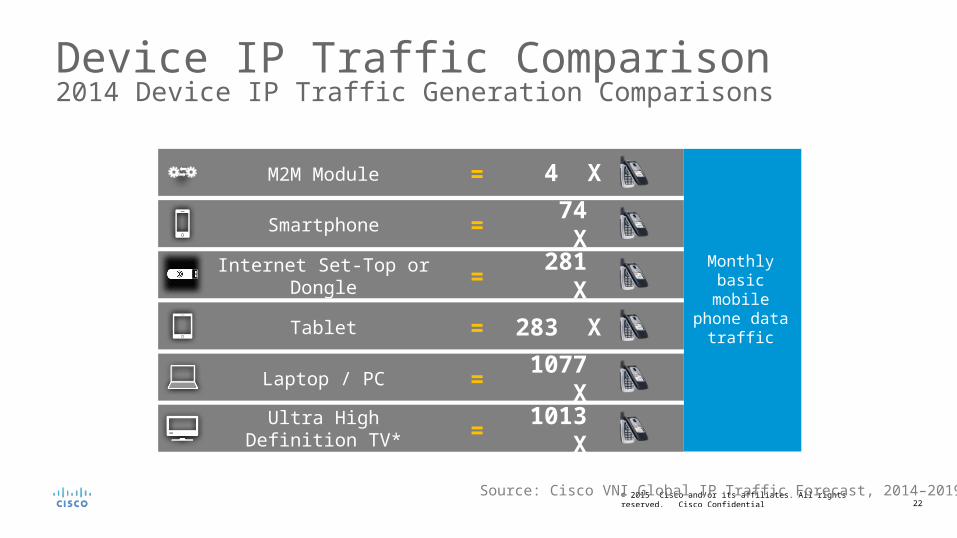
Device IP Traffic Comparison2014 Device IP Traffic Generation Comparisons
Source: Cisco VNI Global IP Traffic Forecast, 2014–2019
Wearable Device
Smartphone
Tablet
M2M Module
Internet Set-Top or Dongle
Smartphone
Tablet
Laptop / PC
Ultra High Definition TV*
Monthly basic mobile phone
data traffic
1077 X =
283 X =
281 X =
74 X =
4 X =
1013 X =
23© 2015 Cisco and/or its affiliates. All rights reserved. Cisco Confidential
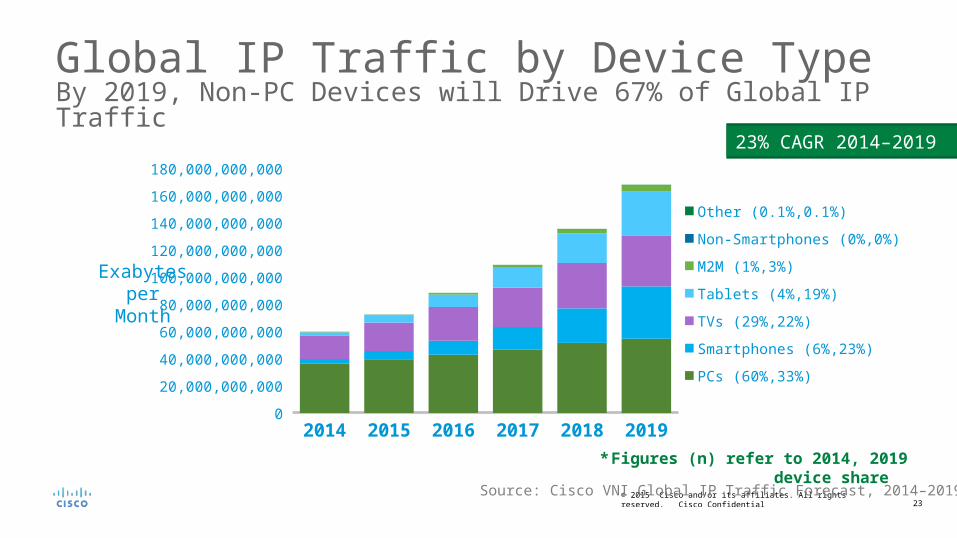
Global IP Traffic by Device TypeBy 2019, Non-PC Devices will Drive 67% of Global IP Traffic
2014 2015 2016 2017 2018 20190
20,000,000,000
40,000,000,000
60,000,000,000
80,000,000,000
100,000,000,000
120,000,000,000
140,000,000,000
160,000,000,000
180,000,000,000
Other (0.1%,0.1%)
Non-Smartphones (0%,0%)
M2M (1%,3%)
Tablets (4%,19%)
TVs (29%,22%)
Smartphones (6%,23%)
PCs (60%,33%)
Source: Cisco VNI Global IP Traffic Forecast, 2014–2019
23% CAGR 2014–2019
Exabytes per Month
* Figures (n) refer to 2014, 2019 device share

24© 2015 Cisco and/or its affiliates. All rights reserved. Cisco Confidential
LATAM IP Traffic by Device TypeBy 2019, Non-PC Devices will Drive 59% of LATAM IP Traffic
2014 2015 2016 2017 2018 20190
2,000,000,000
4,000,000,000
6,000,000,000
8,000,000,000
10,000,000,000
12,000,000,000
14,000,000,000
Other (0.05%,0.1%)
Non-Smartphones (0.08%,0.08%)
M2M (0.3%,2%)
Tablets (5%,24%)
TVs (7%,14%)
Smartphones (4%,19%)
PCs (83%,41%)
Source: Cisco VNI Global IP Traffic Forecast, 2014–2019
25% CAGR 2014–2019
Exabytes per Month
* Figures (n) refer to 2014, 2019 device share

25© 2015 Cisco and/or its affiliates. All rights reserved. Cisco Confidential
Global Internet Traffic by Device TypeBy 2019, Non-PC Devices will Drive 64% of Global Internet Traffic
2014 2015 2016 2017 2018 20190
20,000,000,000
40,000,000,000
60,000,000,000
80,000,000,000
100,000,000,000
120,000,000,000
140,000,000,000
160,000,000,000
Other (0.1%,0.1%)
Non-Smartphones (0%,0%)
M2M (1%,3%)
TVs (7%,8%)
Tablets (6%,24%)
Smartphones (8%,28%)
PCs (78%,36%)
Source: Cisco VNI Global IP Traffic Forecast, 2014–2019
26% CAGR 2014–2019
* Figures (n) refer to 2014, 2019 device share
Exabytes per Month

26© 2015 Cisco and/or its affiliates. All rights reserved. Cisco Confidential
VNI Forecast Update, 2014–2019 Top 10 Networking Trends
1 Continued Shifts in Devices/Connections Mix
2 IPv6 Adoption Enables Internet of Everything (IoE) Connectivity
3
4 Service Adoption Trends – Residential , Consumer Mobile, Business
5 Applications Driving Traffic Growth
6 “Cord-Cutting” Analysis – What’s Really Happening?
7 Impact of Accelerating Speeds on Traffic Growth
8 Mobility (Wi-Fi) Continues to Gain Momentum
9 Traffic Pattern Analysis (Peak vs. Average, Upstream, CDN vs. Metro)
10 Network Performance Drives User Behaviors/Data Plans and Caps
M2M Applications Across Many Industry Verticals Drives IoE Growth

27© 2015 Cisco and/or its affiliates. All rights reserved. Cisco Confidential
Global IPv6 Enabled Content
US 46%
Australia 49%Brazil 57%
UK 46%
Spain 49%
TodayProjected in 2019
25%
6.6%
Source: Cisco IPv6 Labs

28© 2015 Cisco and/or its affiliates. All rights reserved. Cisco Confidential
VNI Forecast Update, 2014–2019 Top 10 Networking Trends
1 Continued Shifts in Devices/Connections Mix
2 IPv6 Adoption Enables Internet of Everything (IoE) Connectivity
3
4 Service Adoption Trends – Residential , Consumer Mobile, Business
5 Applications Driving Traffic Growth
6 “Cord-Cutting” Analysis – What’s Really Happening?
7 Impact of Accelerating Speeds on Traffic Growth
8 Mobility (Wi-Fi) Continues to Gain Momentum
9 Traffic Pattern Analysis (Peak vs. Average, Upstream, CDN vs. Metro)
10 Network Performance Drives User Behaviors/Data Plans and Caps
M2M Applications Across Many Industry Verticals Drives IoE Growth
29© 2015 Cisco and/or its affiliates. All rights reserved. Cisco Confidential
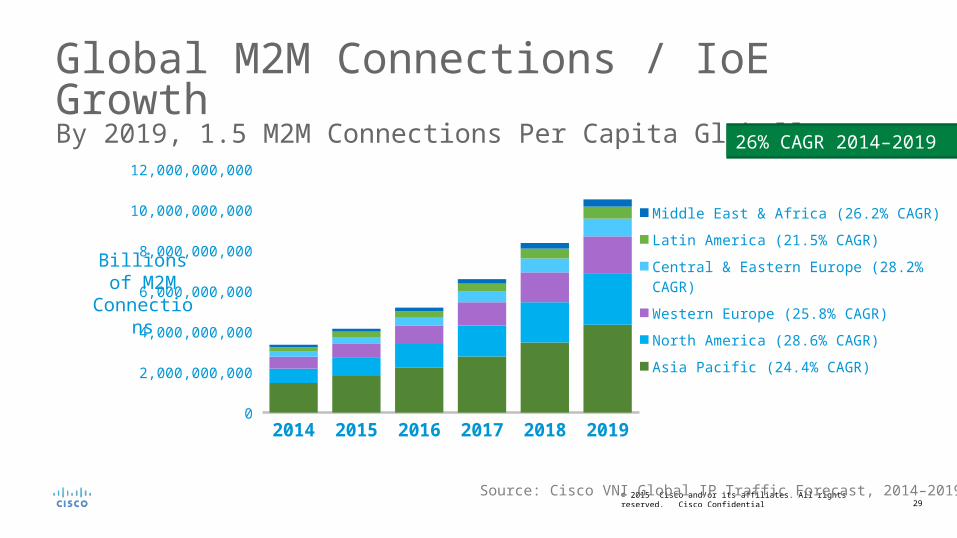
Global M2M Connections / IoE GrowthBy 2019, 1.5 M2M Connections Per Capita Globally
2014 2015 2016 2017 2018 20190
2,000,000,000
4,000,000,000
6,000,000,000
8,000,000,000
10,000,000,000
12,000,000,000
Middle East & Africa (26.2% CAGR)
Latin America (21.5% CAGR)
Central & Eastern Europe (28.2% CAGR)
Western Europe (25.8% CAGR)
North America (28.6% CAGR)
Asia Pacific (24.4% CAGR)
Source: Cisco VNI Global IP Traffic Forecast, 2014–2019
26% CAGR 2014–2019
Billions of M2M
Connections
30© 2015 Cisco and/or its affiliates. All rights reserved. Cisco Confidential
Source: Cisco VNI Global IP Traffic Forecast, 2014–2019
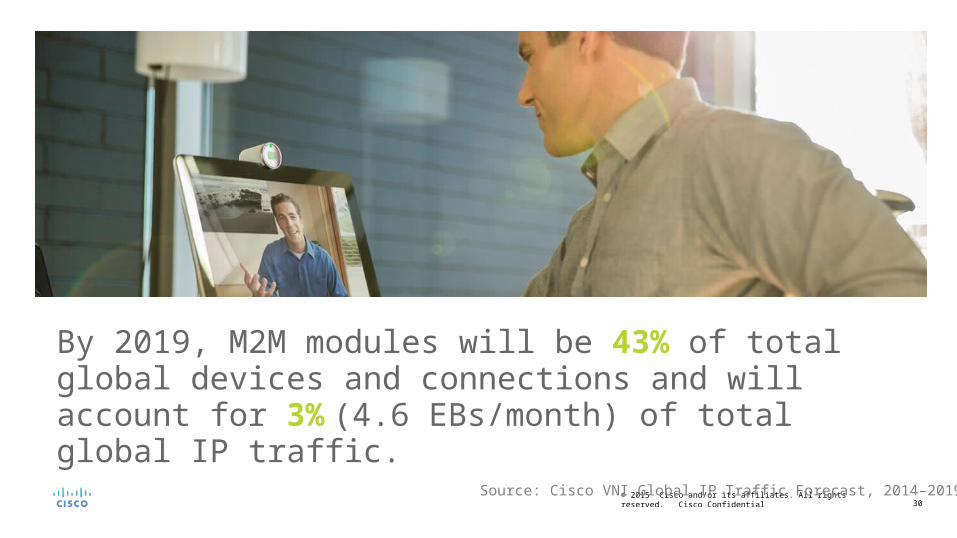
By 2019, M2M modules will be 43% of total global devices and connections and will account for 3% (4.6 EBs/month) of total global IP traffic.
31© 2015 Cisco and/or its affiliates. All rights reserved. Cisco Confidential
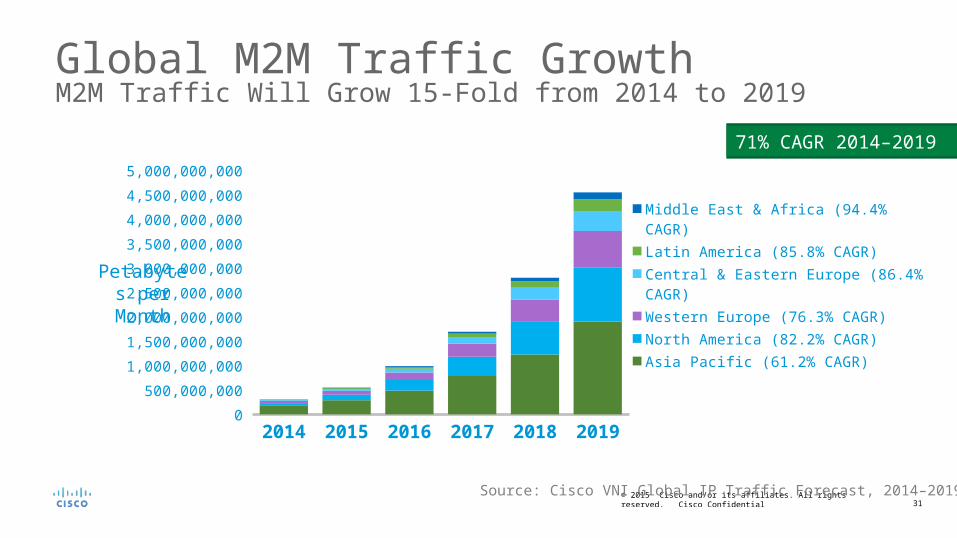
Global M2M Traffic GrowthM2M Traffic Will Grow 15-Fold from 2014 to 2019
2014 2015 2016 2017 2018 20190
500,000,000
1,000,000,000
1,500,000,000
2,000,000,000
2,500,000,000
3,000,000,000
3,500,000,000
4,000,000,000
4,500,000,000
5,000,000,000
Middle East & Africa (94.4% CAGR)
Latin America (85.8% CAGR)
Central & Eastern Europe (86.4% CAGR)
Western Europe (76.3% CAGR)
North America (82.2% CAGR)
Asia Pacific (61.2% CAGR)
Source: Cisco VNI Global IP Traffic Forecast, 2014–2019
71% CAGR 2014–2019
Petabytes per Month

32© 2015 Cisco and/or its affiliates. All rights reserved. Cisco Confidential
Source: Cisco VNI Global IP Traffic Forecast, 2014–2019
In LATAM, by 2019, M2M modules will be 31% of total devices and connections and will account for 1.9% (0.2 EBs/month) of total IP traffic.
33© 2015 Cisco and/or its affiliates. All rights reserved. Cisco Confidential
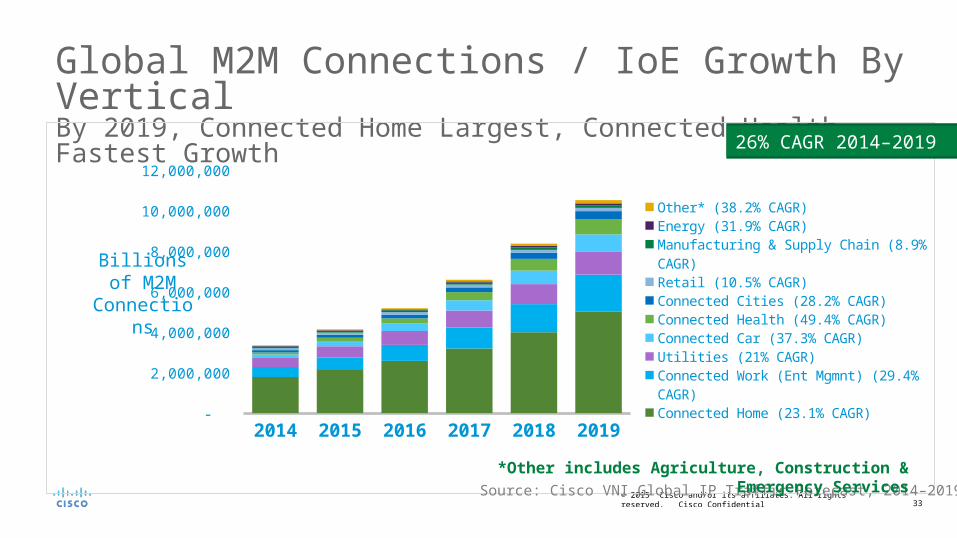
Global M2M Connections / IoE Growth By VerticalBy 2019, Connected Home Largest, Connected Health Fastest Growth
2014 2015 2016 2017 2018 2019 -
2,000,000
4,000,000
6,000,000
8,000,000
10,000,000
12,000,000
Other* (38.2% CAGR)
Energy (31.9% CAGR)
Manufacturing & Supply Chain (8.9% CAGR)
Retail (10.5% CAGR)
Connected Cities (28.2% CAGR)
Connected Health (49.4% CAGR)
Connected Car (37.3% CAGR)
Utilities (21% CAGR)
Connected Work (Ent Mgmnt) (29.4% CAGR)
Connected Home (23.1% CAGR)
Source: Cisco VNI Global IP Traffic Forecast, 2014–2019
26% CAGR 2014–2019
Billions of M2M
Connections
*Other includes Agriculture, Construction & Emergency Services

34© 2015 Cisco and/or its affiliates. All rights reserved. Cisco Confidential
VNI Forecast Update, 2014–2019 Top 10 Networking Trends
1 Continued Shifts in Devices/Connections Mix
2 IPv6 Adoption Enables Internet of Everything (IoE) Connectivity
3
4 Service Adoption Trends – Residential, Consumer Mobile, Business
5 Applications Driving Traffic Growth
6 “Cord-Cutting” Analysis – What’s Really Happening?
7 Impact of Accelerating Speeds on Traffic Growth
8 Mobility (Wi-Fi) Continues to Gain Momentum
9 Traffic Pattern Analysis (Peak vs. Average, Upstream, CDN vs. Metro)
10 Network Performance Drives User Behaviors/Data Plans and Caps
M2M Applications Across Many Industry Verticals Drives IoE Growth
35© 2015 Cisco and/or its affiliates. All rights reserved. Cisco Confidential
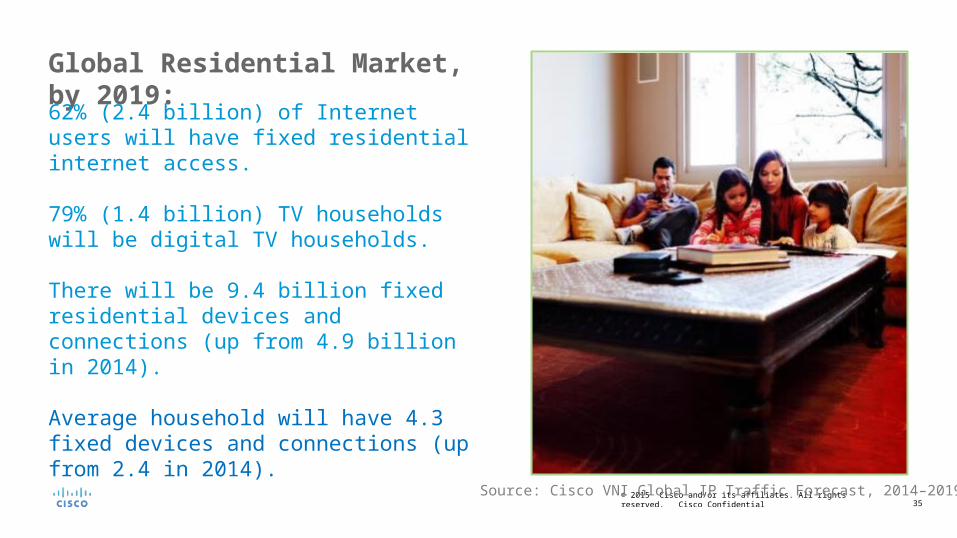
Global Residential Market, by 2019:62% (2.4 billion) of Internet users will have fixed residential internet access.
79% (1.4 billion) TV households will be digital TV households.
There will be 9.4 billion fixed residential devices and connections (up from 4.9 billion in 2014).
Average household will have 4.3 fixed devices and connections (up from 2.4 in 2014).
Source: Cisco VNI Global IP Traffic Forecast, 2014–2019

36© 2015 Cisco and/or its affiliates. All rights reserved. Cisco Confidential
Note: By 2019, the global residential fixed Internet population will be 2.4 billion; the number of global TV households will be 1.8 billion
Global Residential ServicesBy 2019, Time Delayed TV Will Grow the Fastest; Digital TV Will Have Highest Adoption
CAGR 2014–2019
0% 20% 40% 60% 80% 100%0%
2%
4%
6%
8%
10% Online Music
Social Network-
ing
Online VideoOnline Gam-ing
VoIP
Digital TVVideo on Demand
Time De-layed TV
2019 % Adoption
Source: Cisco VNI Service Adoption Forecast, 2014–2019

37© 2015 Cisco and/or its affiliates. All rights reserved. Cisco Confidential
Residential ServicesImplications / Opportunities
Residential Market Dynamics Residential Opportunities for Service Providers
• More / new connections
• Preference for mobility
• Need to monetize increased network demand
• Extend content / service reach across new devices and connections
• Partner and form new eco-systems with OTTPs
• Develop Wi-Fi / mobility plans
• Bolster service portfolio with value-added IoE / M2M applications

38© 2015 Cisco and/or its affiliates. All rights reserved. Cisco Confidential
Source: Cisco VNI Global IP Traffic Forecast, 2014–2019
Global Consumer Mobile Market, by 2019:
There will be 4.9 billion consumer mobile users (64% of population).
There will be 9.8 billion consumer mobile devices and connections.
Average consumer mobile user will have 2.0 mobile devices and connections (up from 1.5 in 2014).
39© 2015 Cisco and/or its affiliates. All rights reserved. Cisco Confidential
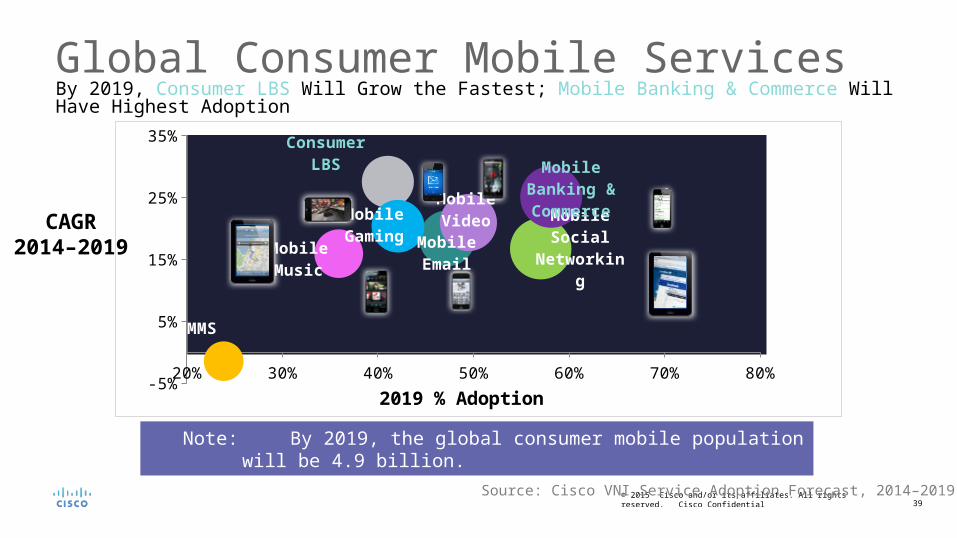
Note: By 2019, the global consumer mobile population will be 4.9 billion.
Global Consumer Mobile ServicesBy 2019, Consumer LBS Will Grow the Fastest; Mobile Banking & Commerce Will Have Highest Adoption
CAGR 2014–2019
Source: Cisco VNI Service Adoption Forecast, 2014–2019
20% 30% 40% 50% 60% 70% 80%-5%
5%
15%
25%
35%
MMS
Mobile So-cial Network-
ingMobile Email
Consumer LBS
Mobile Gam-ing
Mobile Bank-ing & Com-
merceMobile Video
Mobile Music
2019 % Adoption

40© 2015 Cisco and/or its affiliates. All rights reserved. Cisco Confidential
Consumer MobileImplications / Opportunities
Consumer Mobile Market Dynamics
Consumer Mobile Opportunities
for Service Providers
• More / new devices and connections
• Demand for seamless transition / experience between fixed and mobile
• Demand for Wi-Fi offload and faster speeds
• Need to monetize increased network demand
• Extend reach of traditional / brick and mortar services
• Shared data plans
• Blend service offers with online services / content
• Developing / monetizing Wi-Fi offers
• Partner with device manufacturers / content creators (consider busy /peak demands)

41© 2015 Cisco and/or its affiliates. All rights reserved. Cisco Confidential
Source: Cisco VNI Global IP Traffic Forecast, 2014–2019
Global Business Market, by 2019:
There will be 2.2 billion business Internet users
(63% of global work force).
There will be 582 million business mobile users
(17% of global work force).
There will be 5.3 billion business devices and connections (up from 2.8 billion in 2014). Average business internet user will have
2.4 devices and connections
There will be 1.7 billion business mobile device and connections (up from 943 million in 2014).
Average business mobile user will have 2.9 mobile devices and connections

42© 2015 Cisco and/or its affiliates. All rights reserved. Cisco Confidential
VNI Forecast Update, 2014–2019 Top 10 Networking Trends
1 Continued Shifts in Devices/Connections Mix
2 IPv6 Adoption Enables Internet of Everything (IoE) Connectivity
3
4 Service Adoption Trends – Residential, Consumer Mobile, Business
5 Applications Driving Traffic Growth
6 “Cord-Cutting” Analysis – What’s Really Happening?
7 Impact of Accelerating Speeds on Traffic Growth
8 Mobility (Wi-Fi) Continues to Gain Momentum
9 Traffic Pattern Analysis (Peak vs. Average, Upstream, CDN vs. Metro)
10 Network Performance Drives User Behaviors/Data Plans and Caps
M2M Applications Across Many Industry Verticals Drives IoE Growth

43© 2015 Cisco and/or its affiliates. All rights reserved. Cisco Confidential
2014 2015 2016 2017 2018 20190
20,000,000,000
40,000,000,000
60,000,000,000
80,000,000,000
100,000,000,000
120,000,000,000
140,000,000,000
160,000,000,000
180,000,000,000 Gaming (0.05% , 0.08% )File Sharing (11.6% , 4.3% )Web/Data (21.3% , 15.5% )IP VoD (23.6% , 16.0% )Internet Video (43.4% , 64.1% )
Global IP Video Traffic GrowthIP Video Will Account for 80% of Global IP Traffic by 2019
Source: Cisco VNI Global IP Traffic Forecast, 2014–2019
23% CAGR 2014–2019
Exabytes per Month
* Figures (n) refer to 2014, 2019 traffic shares

44© 2015 Cisco and/or its affiliates. All rights reserved. Cisco Confidential
2014 2015 2016 2017 2018 20190
2,000,000,000
4,000,000,000
6,000,000,000
8,000,000,000
10,000,000,000
12,000,000,000
14,000,000,000 Gaming (0.03% , 0.05% )File Sharing (16.0% , 5.2% )Web/Data (23.2% , 13.2% )IP VoD (6.0% , 10.3% )Internet Video (54.8% , 71.2% )
LATAM IP Video Traffic GrowthIP Video Will Account for 82% of LATAM IP Traffic by 2019
Source: Cisco VNI Global IP Traffic Forecast, 2014–2019
25% CAGR 2014–2019
Exabytes per Month
* Figures (n) refer to 2014, 2019 traffic shares

45© 2015 Cisco and/or its affiliates. All rights reserved. Cisco Confidential
Global Video Users/ SubscribersOnline & Mobile Video Growing Faster Than Digital TV
2014 2015 2016 2017 2018 2019 1,000,000,000
1,500,000,000
2,000,000,000
2,500,000,000
3,000,000,000 Online Video ( 7.3% CAGR) Digital TV HH ( 4.9% CAGR)
Mobile Video ( 21.0% CAGR)
Users/ Subscriptions
(M)

46© 2015 Cisco and/or its affiliates. All rights reserved. Cisco Confidential
2014 2015 2016 2017 2018 20190
20,000,000,000
40,000,000,000
60,000,000,000
80,000,000,000
100,000,000,000
120,000,000,000
140,000,000,000
160,000,000,000 Gaming (0.07% , 0.10% )
File Sharing (16.3% , 5.3% )
Web/Data (24.7% , 17.5% )
Internet Video (58.9% , 77.1% )
Global Internet Video Traffic GrowthInternet Video Will Account for 77 Percent of Global Internet Traffic by 2019
Source: Cisco VNI Global IP Traffic Forecast, 2014–2019
* Figures (n) refer to 2014, 2019 traffic shares
Exabytes per Month
26% CAGR 2014–2019
47© 2015 Cisco and/or its affiliates. All rights reserved. Cisco Confidential
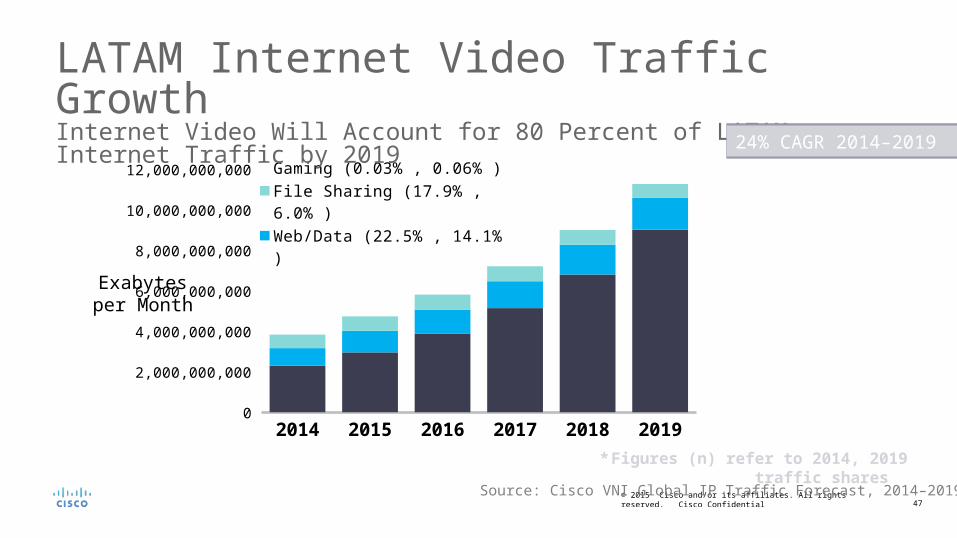
2014 2015 2016 2017 2018 20190
2,000,000,000
4,000,000,000
6,000,000,000
8,000,000,000
10,000,000,000
12,000,000,000 Gaming (0.03% , 0.06% )
File Sharing (17.9% , 6.0% )
Web/Data (22.5% , 14.1% )
Internet Video (59.6% , 79.9% )
LATAM Internet Video Traffic GrowthInternet Video Will Account for 80 Percent of LATAM Internet Traffic by 2019
Source: Cisco VNI Global IP Traffic Forecast, 2014–2019
* Figures (n) refer to 2014, 2019 traffic shares
Exabytes per Month
24% CAGR 2014–2019

48© 2015 Cisco and/or its affiliates. All rights reserved. Cisco Confidential
2014 2015 2016 2017 2018 20190
20,000,000,000
40,000,000,000
60,000,000,000
80,000,000,000
100,000,000,000
120,000,000,000
140,000,000,000
160,000,000,000 Ultra-High Def (UHD) Video (0.6% , 13.9% )
High Def (HD) Video (38.6% , 53.5% )
Standard Def (SD) Video (60.8% , 32.6% )
Higher Definition Content Impacts Global IP Video GrowthUltra-HD IP Video Will Account for 14% of Global IP Video Traffic by 2019
Source: Cisco VNI Global IP Traffic Forecast, 2014–2019
27% CAGR 2014–2019
Exabytes per Month
* Figures (n) refer to 2014, 2019 traffic shares

49© 2015 Cisco and/or its affiliates. All rights reserved. Cisco Confidential
2014 2015 2016 2017 2018 20190
2,000,000,000
4,000,000,000
6,000,000,000
8,000,000,000
10,000,000,000
12,000,000,000 Ultra-High Def (UHD) Video (0.1% , 4.1% )
High Def (HD) Video (15.8% , 38.6% )
Standard Def (SD) Video (84.2% , 57.3% )
Higher Definition Content Impacts LATAM IP Video GrowthUltra-HD IP Video Will Account for 4% of LATAM IP Video Traffic by 2019
Source: Cisco VNI Global IP Traffic Forecast, 2014–2019
32% CAGR 2014–2019
Exabytes per Month
* Figures (n) refer to 2014, 2019 traffic shares
50© 2015 Cisco and/or its affiliates. All rights reserved. Cisco Confidential
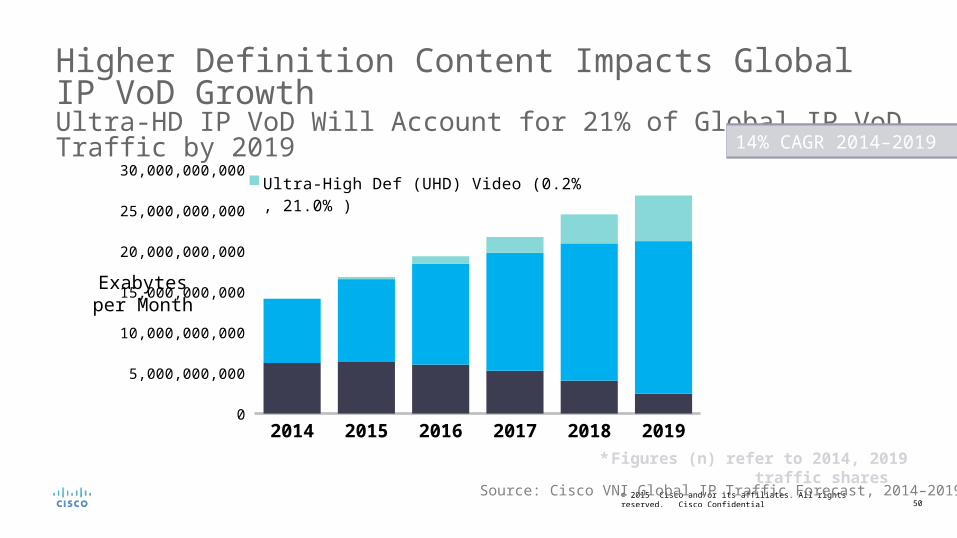
2014 2015 2016 2017 2018 20190
5,000,000,000
10,000,000,000
15,000,000,000
20,000,000,000
25,000,000,000
30,000,000,000 Ultra-High Def (UHD) Video (0.2% , 21.0% )
High Def (HD) Video (55.8% , 69.9% )
Standard Def (SD) Video (44.0% , 9.1% )
Higher Definition Content Impacts Global IP VoD GrowthUltra-HD IP VoD Will Account for 21% of Global IP VoD Traffic by 2019
Source: Cisco VNI Global IP Traffic Forecast, 2014–2019
14% CAGR 2014–2019
Exabytes per Month
* Figures (n) refer to 2014, 2019 traffic shares

51© 2015 Cisco and/or its affiliates. All rights reserved. Cisco Confidential
VNI Forecast Update, 2014–2019 Top 10 Networking Trends
1 Continued Shifts in Devices/Connections Mix
2 IPv6 Adoption Enables Internet of Everything (IoE) Connectivity
3
4 Service Adoption Trends – Residential, Consumer Mobile, Business
5 Applications Driving Traffic Growth
6 “Cord-Cutting” Analysis – What’s Really Happening?
7 Impact of Accelerating Speeds on Traffic Growth
8 Mobility (Wi-Fi) Continues to Gain Momentum
9 Traffic Pattern Analysis (Peak vs. Average, Upstream, CDN vs. Metro)
10 Network Performance Drives User Behaviors/Data Plans and Caps
M2M Applications Across Many Industry Verticals Drives IoE Growth

52© 2015 Cisco and/or its affiliates. All rights reserved. Cisco Confidential
Global Video Users/ SubscribersOnline & Mobile Video Growing Faster Than Digital TV
2014 2015 2016 2017 2018 2019 -
1,000,000,000
2,000,000,000
3,000,000,000
Online Video ( 7.3% CAGR) Digital TV HH ( 4.9% CAGR)
Mobile Video ( 21.0% CAGR)
Users/ Subscriptions
(M)
Source: Cisco VNI Global IP Traffic Forecast, 2014–2019

53© 2015 Cisco and/or its affiliates. All rights reserved. Cisco Confidential
Global Internet and TV Users/ SubscribersGlobal Residential Internet Growing; TV Household Penetration Flattening
2014 2015 2016 2017 2018 2019 1,000,000,000
2,000,000,000
3,000,000,000
4,000,000,000
Residential Internet* ( 6.8% CAGR) Total TV HH ( 1.8% CAGR)
Users/ Subscriptions
(M)
Source: Cisco VNI Global IP Traffic Forecast, 2014–2019
* Residential Internet users include fixed and mobile Internet users
54© 2015 Cisco and/or its affiliates. All rights reserved. Cisco Confidential
VNI Forecast Update, 2014–2019 Top 10 Networking Trends
1 Continued Shifts in Devices/Connections Mix
2 IPv6 Adoption Enables Internet of Everything (IoE) Connectivity
3
4 Service Adoption Trends – Residential, Consumer Mobile, Business
5 Applications Driving Traffic Growth
6 “Cord-Cutting” Analysis – What’s Really Happening?
7 Impact of Accelerating Speeds on Traffic Growth
8 Mobility (Wi-Fi) Continues to Gain Momentum
9 Traffic Pattern Analysis (Peak vs. Average, Upstream, CDN vs. Metro)
10 Network Performance Drives User Behaviors/Data Plans and Caps
M2M Applications Across Many Industry Verticals Drives IoE Growth

55© 2015 Cisco and/or its affiliates. All rights reserved. Cisco Confidential
Global Average Fixed Broadband SpeedsDoubling in Speeds From 2014-2019
2014 2019
Global Mbps
BY REGION
North America
Western Europe
Asia-Pacific
Central & Eastern Europe
Middle East & Africa
20.3
21.8
21.8
7.2
23.2
22.2
6.1
42.5
43.7
49.1
16.9
48.9
45.3
14.9
Latin America
GLOBAL
Source: Cisco VNI Global IP Traffic Forecast, 2014–2019

56© 2015 Cisco and/or its affiliates. All rights reserved. Cisco Confidential
LATAM Average Fixed Broadband SpeedsDoubling in Speeds From 2014-2019
2014 2019
Latin America Mbps
BY COUNTRY
Argentina
Brazil
7.2
4.4
8.3
16.9
14.9
18.6
REGION
Source: Cisco VNI Global IP Traffic Forecast, 2014–2019
Chile 13.4 27.8
Mexico 7.3 19.1

57© 2015 Cisco and/or its affiliates. All rights reserved. Cisco Confidential
Global Average Wi-Fi SpeedsWi-Fi Exceeds Average Mobile (Cell) Speeds During 2014-2019
2014 2019
Global Mbps
BY REGION
North America
Western Europe
Asia-Pacific
Central & Eastern Europe
Middle East & Africa
10.6
14.3
13.0
5.8
10.3
11.7
3.9
18.5
29.0
20.9
8.6
15.6
22.0
4.7
Latin America
GLOBAL
Source: Cisco VNI Global IP Traffic Forecast, 2014–2019

58© 2015 Cisco and/or its affiliates. All rights reserved. Cisco Confidential
Mobile Network Speeds Increase 2.4X by 2019Average Cell Connection Speed (1.7 Mbps in 2014) Will Grow at a 19% CAGR—Reaching Nearly 4.0 Mbps by 2019
2014 2019
Global Mbps
BY REGION
North America
Western Europe
Asia-Pacific
Central & Eastern Europe
Middle East & Africa
1.7
2.8
2.0
1.4
2.0
1.6
0.6
3.9
6.4
4.7
2.9
3.5
3.7
2.1
Latin America
GLOBAL
Source: Cisco VNI Global IP Traffic Forecast, 2014–2019

59© 2015 Cisco and/or its affiliates. All rights reserved. Cisco Confidential
VNI Forecast Update, 2014–2019 Top 10 Networking Trends
1 Continued Shifts in Devices/Connections Mix
2 IPv6 Adoption Enables Internet of Everything (IoE) Connectivity
3
4 Service Adoption Trends – Residential, Consumer Mobile, Business
5 Applications Driving Traffic Growth
6 “Cord-Cutting” Analysis – What’s Really Happening?
7 Impact of Accelerating Speeds on Traffic Growth
8 Mobility (Wi-Fi) Continues to Gain Momentum
9 Traffic Pattern Analysis (Peak vs. Average, Upstream, CDN vs. Metro)
10 Network Performance Drives User Behaviors/Data Plans and Caps
M2M Applications Across Many Industry Verticals Drives IoE Growth

60© 2015 Cisco and/or its affiliates. All rights reserved. Cisco Confidential
Surge of Hotspots
Globally, there will be 341 million hotspots by 2018
• By 2018, the US leads in total number of hotspots, followed by China and France
• Europe is the “continent of Wi-Fi” with 50% of the world’s Wi-Fi estate in 2014. By 2018, Asia will lead.
• Today, China has 5 times more commercial Wi-Fi hotspots than any other country
• Community Wi-Fi has been driven by Europe and then North America, but Asia will catch up in 2018
Source: Maravedis Rethink and iPass Inc.

61© 2015 Cisco and/or its affiliates. All rights reserved. Cisco Confidential
Future of Wi-Fi as Wired Complement
1997 1998 1999 2000 2001 2002 2003 2004 2005 2006 2007 2008 2009 2010 2011 2012
802.112 Mbps Max
Applications Enabled Basic internet
802.11b11 Mbps Max
Applications Enabled Email
802.11b11 Mbps Max
Applications Enabled Rich Media Web
802.11ac3.6 Gbps Max
Applications Enabled High Resolution Video
Wired Complement
802.11n600 Mbps Max
Applications Enabled Medium Resolution Video
Number of 802.11ac Home CPE to Increase 20-fold from 2014 to 2019

62© 2015 Cisco and/or its affiliates. All rights reserved. Cisco Confidential
2014 2015 2016 2017 2018 20190
20,000,000,000
40,000,000,000
60,000,000,000
80,000,000,000
100,000,000,000
120,000,000,000
140,000,000,000
160,000,000,000
180,000,000,000 Mobile Data (57.3% CAGR)Fixed/Wired (11.4% CAGR)Fixed/Wi-Fi from Mobile Devices (67.5% CAGR)Fixed/Wi-Fi from Wi-Fi Only Devices (21.1% CAGR)
17%
Global IP Traffic by Local Access TechnologyBy 2019, Two-Thirds of Total IP Traffic Will Be Wireless*
33%
36%
14%
Source: Cisco VNI Global IP Traffic Forecast, 2014–2019
23% CAGR 2014–2019
Exabytes per Month
* Wireless traffic includes Wi-Fi and mobile

63© 2015 Cisco and/or its affiliates. All rights reserved. Cisco Confidential
2014 2015 2016 2017 2018 20190
2,000,000,000
4,000,000,000
6,000,000,000
8,000,000,000
10,000,000,000
12,000,000,000
14,000,000,000 Mobile Data (58.9% CAGR)Fixed/Wired (12.9% CAGR)Fixed/Wi-Fi from Mobile Devices (74.5% CAGR)Fixed/Wi-Fi from Wi-Fi Only Devices (20.8% CAGR)
14%
LATAM IP Traffic by Local Access TechnologyBy 2019, 77% of Total LATAM IP Traffic Will Be Wireless*
23%
47%
16%
Source: Cisco VNI Global IP Traffic Forecast, 2014–2019
25% CAGR 2014–2019
Exabytes per Month
* Wireless traffic includes Wi-Fi and mobile

64© 2015 Cisco and/or its affiliates. All rights reserved. Cisco Confidential
2014 2015 2016 2017 2018 20190
20,000,000,000
40,000,000,000
60,000,000,000
80,000,000,000
100,000,000,000
120,000,000,000
140,000,000,000
160,000,000,000 Mobile Data (57.3% CAGR)
Fixed/Wired (9.9% CAGR)
Fixed/Wi-Fi from Mobile Devices (67.5% CAGR)
Fixed/Wi-Fi from Wi-Fi Only Devices (21.7% CAGR)
Global Internet Traffic by Local Access TechnologyWireless Traffic Dominates Internet Traffic
19%
42%
18%
21%
Source: Cisco VNI Global IP Traffic Forecast, 2014–2019
Exabytes per Month
26% CAGR 2014–2019

65© 2015 Cisco and/or its affiliates. All rights reserved. Cisco Confidential
VNI Forecast Update, 2014–2019 Top 10 Networking Trends
1 Continued Shifts in Devices/Connections Mix
2 IPv6 Adoption Enables Internet of Everything (IoE) Connectivity
3
4 Service Adoption Trends – Residential, Consumer Mobile, Business
5 Applications Driving Traffic Growth
6 “Cord-Cutting” Analysis – What’s Really Happening?
7 Impact of Accelerating Speeds on Traffic Growth
8 Mobility (Wi-Fi) Continues to Gain Momentum
9 Traffic Pattern Analysis (Peak vs. Average, Upstream, CDN vs. Metro)
10 Network Performance Drives User Behaviors/Data Plans and Caps
M2M Applications Across Many Industry Verticals Drives IoE Growth
66© 2015 Cisco and/or its affiliates. All rights reserved. Cisco Confidential
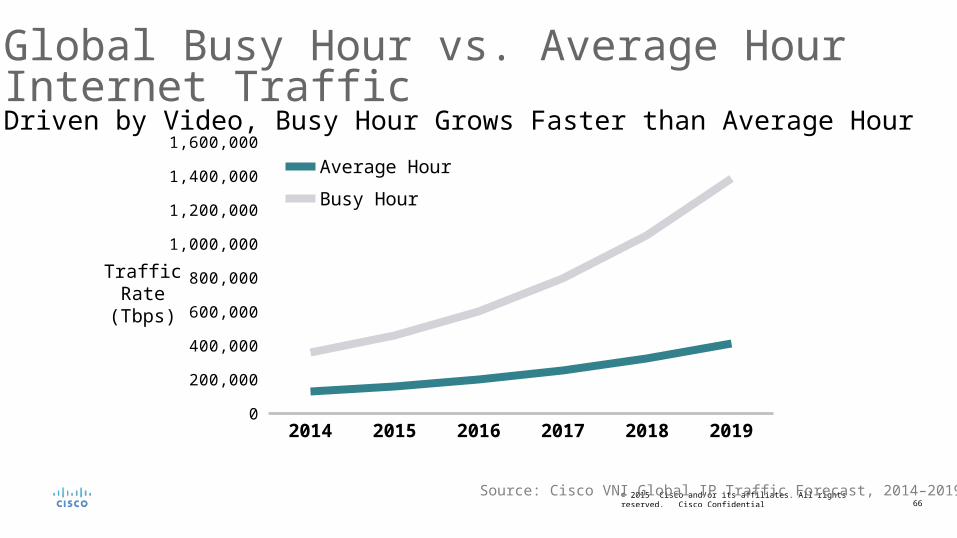
Global Busy Hour vs. Average Hour Internet TrafficDriven by Video, Busy Hour Grows Faster than Average Hour
2014 2015 2016 2017 2018 20190
200,000
400,000
600,000
800,000
1,000,000
1,200,000
1,400,000
1,600,000
Average Hour
Busy Hour
Source: Cisco VNI Global IP Traffic Forecast, 2014–2019
Traffic Rate (Tbps)

67© 2015 Cisco and/or its affiliates. All rights reserved. Cisco Confidential
LATAM Busy Hour vs. Average Hour Internet TrafficDriven by Video, Busy Hour Grows Faster than Average Hour
2014 2015 2016 2017 2018 20190
10,000
20,000
30,000
40,000
50,000
60,000
70,000
80,000
90,000
100,000
Average Hour
Busy Hour
Source: Cisco VNI Global IP Traffic Forecast, 2014–2019
Traffic Rate (Tbps)
68© 2015 Cisco and/or its affiliates. All rights reserved. Cisco Confidential
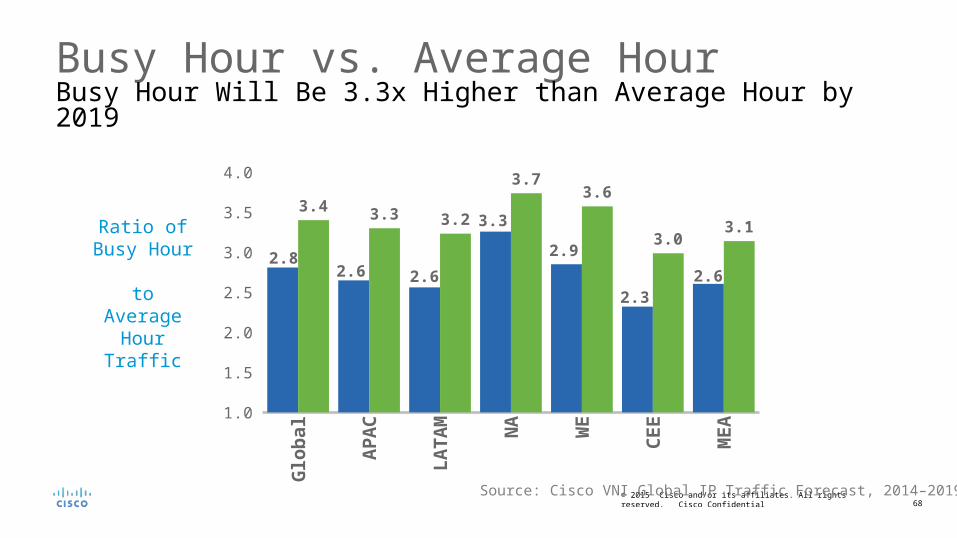
Busy Hour vs. Average HourBusy Hour Will Be 3.3x Higher than Average Hour by 2019
Glo
ba
l
AP
AC L
NA
WE
CE
E
ME
A
1.0
1.5
2.0
2.5
3.0
3.5
4.0
2.82.6 2.6
3.3
2.9
2.32.6
3.4 3.3 3.2
3.73.6
3.03.1
Axis Title
Source: Cisco VNI Global IP Traffic Forecast, 2014–2019
Ratio of Busy Hour to Average Hour Traffic
69© 2015 Cisco and/or its affiliates. All rights reserved. Cisco Confidential
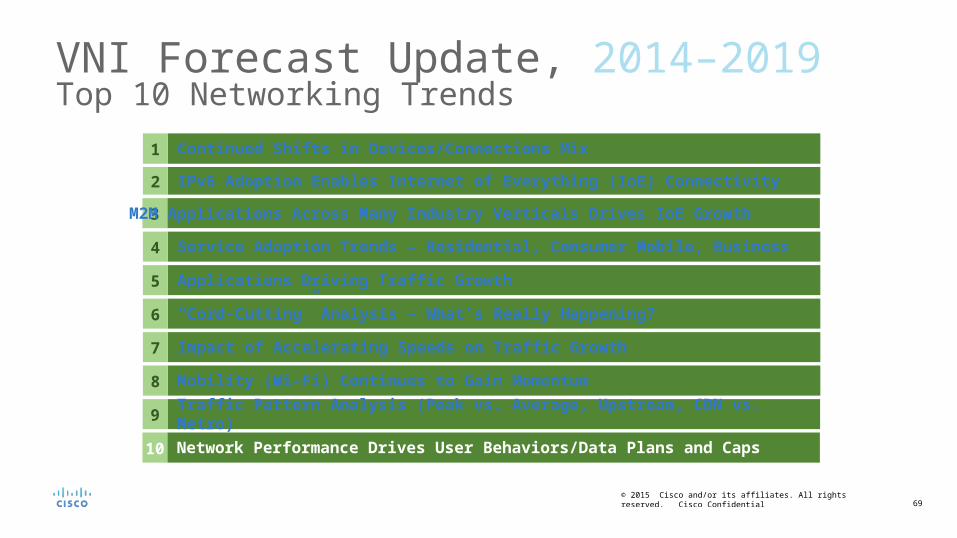
VNI Forecast Update, 2014–2019 Top 10 Networking Trends
1 Continued Shifts in Devices/Connections Mix
2 IPv6 Adoption Enables Internet of Everything (IoE) Connectivity
3
4 Service Adoption Trends – Residential, Consumer Mobile, Business
5 Applications Driving Traffic Growth
6 “Cord-Cutting” Analysis – What’s Really Happening?
7 Impact of Accelerating Speeds on Traffic Growth
8 Mobility (Wi-Fi) Continues to Gain Momentum
9 Traffic Pattern Analysis (Peak vs. Average, Upstream, CDN vs. Metro)
10 Network Performance Drives User Behaviors/Data Plans and Caps
M2M Applications Across Many Industry Verticals Drives IoE Growth
70© 2015 Cisco and/or its affiliates. All rights reserved. Cisco Confidential
Source: Cisco VNI Global IP Traffic Forecast, 2014–2019
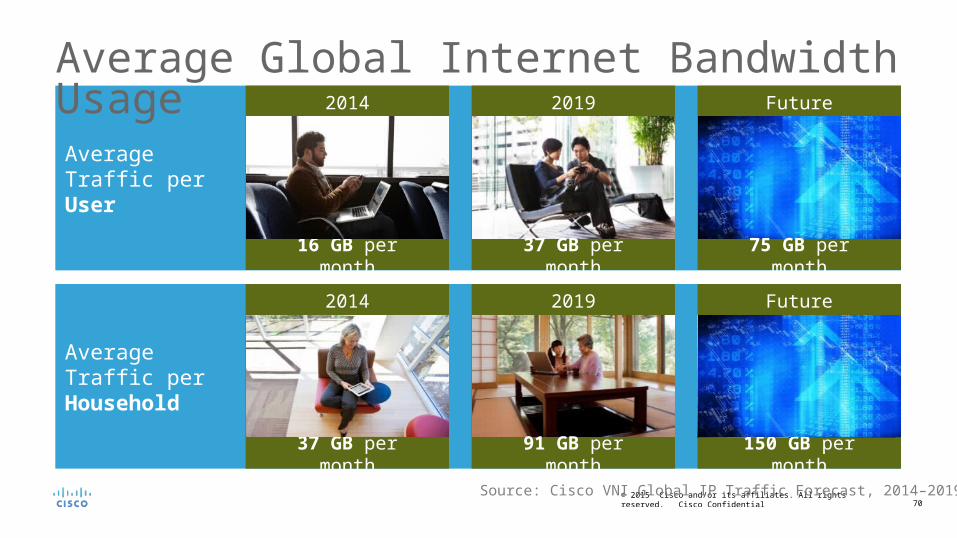
Average Global Internet Bandwidth Usage
Average Traffic per User
2014
16 GB per month
2019
37 GB per month
Future
75 GB per month
Average Traffic per Household
2014
37 GB per month
2019
91 GB per month
Future
150 GB per month

71© 2015 Cisco and/or its affiliates. All rights reserved. Cisco Confidential
Source: Cisco VNI Global IP Traffic Forecast, 2014–2019
Average LATAM Internet Bandwidth Usage
Average Traffic per User
2014
15 GB per month
2019
34 GB per month
Future
75 GB per month
Average Traffic per Household
2014
44 GB per month
2019
97 GB per month
Future
150 GB per month

72© 2015 Cisco and/or its affiliates. All rights reserved. Cisco Confidential
Higher Fixed Speeds Enable Greater Video ConsumptionVideo Behaviors are Consistent Across Multiple Countries
- 10 20 30 40 50 60 -
500
1,000
1,500
2,000
2,500
3,000
Video Minutes per Viewer
Linear (Video Minutes per Viewer)
Fixed Broadband Speeds (Mbps)
Indonesia
India
Argentina
Italy
Mexico
Brazil
Australia
Chile
Russia
Canada
U.K.
Japan
Germany
China
New Zealand
France
Spain
U.S.
Source: Cisco VNI Global IP Traffic Forecast, 2014–2019
Video Minutes
per Viewer

73© 2015 Cisco and/or its affiliates. All rights reserved. Cisco Confidential
Argentina Forecast (2014-2019)

Cisco Confidential 74© 2013-2014 Cisco and/or its affiliates. All rights reserved.
Argentina IP Traffic
In Argentina, IP traffic will grow 3-fold from 2014 to 2019, a compound annual growth rate of 21%.
In Argentina, IP traffic will reach 1.1 Exabytes per month in 2019, up from 431 Petabytes per month in 2014.
In Argentina's IP networks will carry 37 Petabytes per day in 2019, up from 14 Petabytes per day in 2014.
In Argentina, IP traffic will reach an annual run rate of 13.4 Exabytes in 2019, up from an annual run rate of 5.2 Exabytes in 2014
In Argentina, IP traffic will reach 26 Gigabytes per capita in 2019, up from 10 Gigabytes per capita in 2014.
In 2019, the gigabyte equivalent of all movies ever made will cross Argentina's IP networks every 5 hours.

Cisco Confidential 75© 2013-2014 Cisco and/or its affiliates. All rights reserved.
Argentina Fixed Network Speed
In Argentina, the average fixed broadband speed will grow 3.4-fold from 2014 to 2019, from 4.4 Mbps to 15 Mbps.
In Argentina, the average fixed broadband speed grew 7% from 2013 to 2014, from 4.1 Mbps to 4.4 Mbps.
In Argentina, 51% of fixed broadband connections will be faster than 5 Mbps in 2019, up from 34% today.
In Argentina, 21% of fixed broadband connections will be faster than 10 Mbps in 2019, up from 13% today.
In Argentina, 4.1% of fixed broadband connections will be faster than 25 Mbps in 2019, up from 3.0% today.
In Argentina, 2.2% of fixed broadband connections will be faster than 50 Mbps in 2019, up from .5% today.

Cisco Confidential 76© 2013-2014 Cisco and/or its affiliates. All rights reserved.
Argentina Mobile Network Speed
In Argentina, the average mobile connection speed was 323 kbps in 2014.
In Argentina, the average mobile connection speed will grow 4-fold from 2014 to 2019, reaching 1,228 kbps in 2019.
In Argentina, the average smartphone connection speed was 2,743 kbps in 2014.
In Argentina, the average smartphone connection speed will grow 2-fold from 2014 to 2019, reaching 4,674 kbps in 2019.

Cisco Confidential 77© 2013-2014 Cisco and/or its affiliates. All rights reserved.
Argentina VoD
In Argentina, Ultra HD will be 7.4% of IP VOD traffic in 2019, up from 0.0% in 2014 (399.0% CAGR).
In Argentina, HD will be 52.7% of IP VOD traffic in 2019, up from 14.9% in 2014 (75.1% CAGR).
In Argentina, SD will be 39.9% of IP VOD traffic in 2019, compared to 85.1% in 2014 (16.9% CAGR).
Cisco Confidential 78© 2013-2014 Cisco and/or its affiliates. All rights reserved.
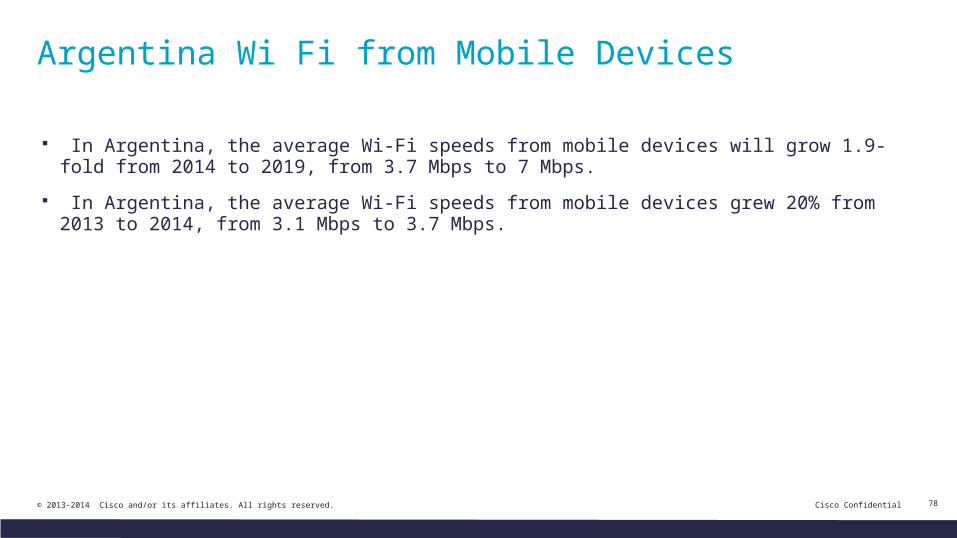
Argentina Wi Fi from Mobile Devices
In Argentina, the average Wi-Fi speeds from mobile devices will grow 1.9-fold from 2014 to 2019, from 3.7 Mbps to 7 Mbps.
In Argentina, the average Wi-Fi speeds from mobile devices grew 20% from 2013 to 2014, from 3.1 Mbps to 3.7 Mbps.
Cisco Confidential 79© 2013-2014 Cisco and/or its affiliates. All rights reserved.
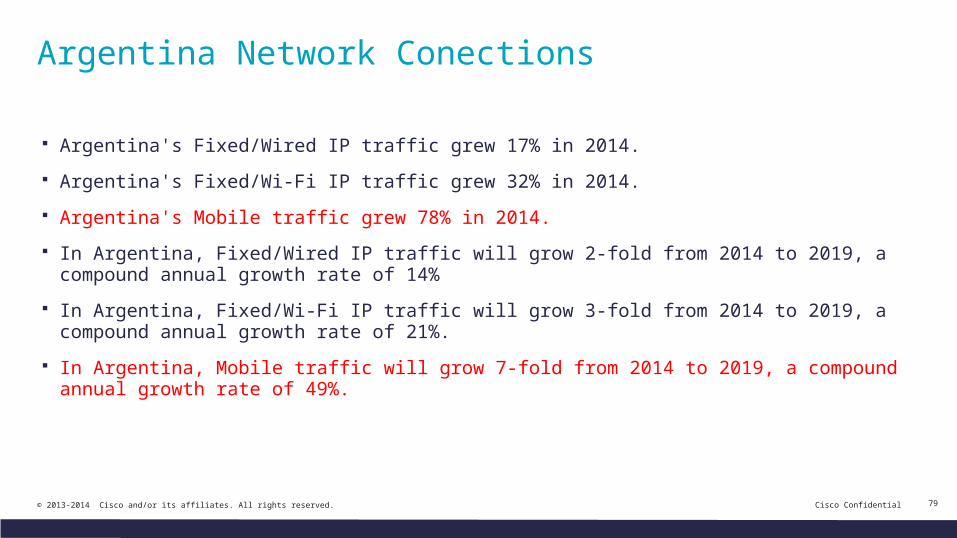
Argentina Network Conections
Argentina's Fixed/Wired IP traffic grew 17% in 2014.
Argentina's Fixed/Wi-Fi IP traffic grew 32% in 2014.
Argentina's Mobile traffic grew 78% in 2014.
In Argentina, Fixed/Wired IP traffic will grow 2-fold from 2014 to 2019, a compound annual growth rate of 14%
In Argentina, Fixed/Wi-Fi IP traffic will grow 3-fold from 2014 to 2019, a compound annual growth rate of 21%.
In Argentina, Mobile traffic will grow 7-fold from 2014 to 2019, a compound annual growth rate of 49%.

80© 2015 Cisco and/or its affiliates. All rights reserved. Cisco Confidential
Conclusion
81© 2015 Cisco and/or its affiliates. All rights reserved. Cisco Confidential
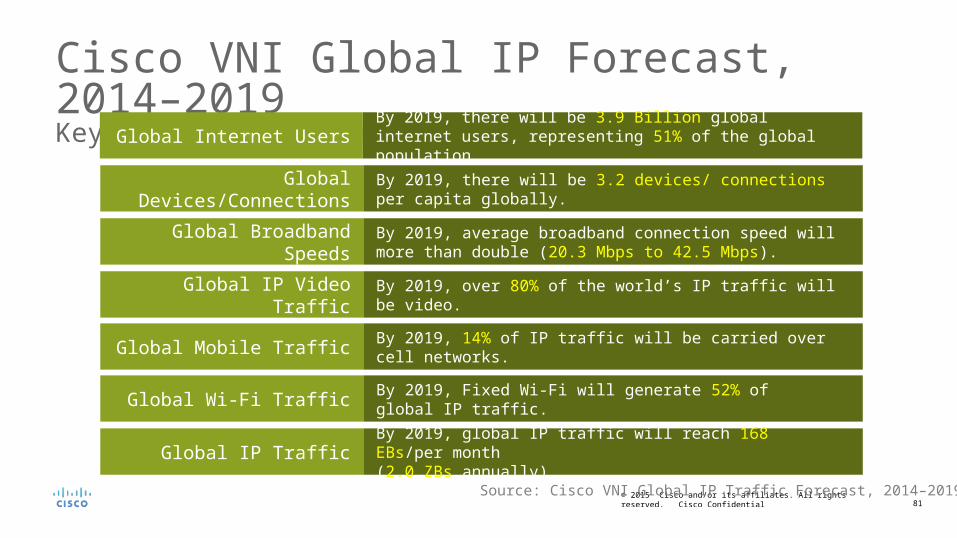
Cisco VNI Global IP Forecast, 2014–2019Key Takeaways / Summary
Global IP TrafficBy 2019, global IP traffic will reach 168 EBs/per month (2.0 ZBs annually).
Global Mobile Traffic By 2019, 14% of IP traffic will be carried over cell networks.
Global Wi-Fi Traffic By 2019, Fixed Wi-Fi will generate 52% of global IP traffic.
Global IP Video Traffic By 2019, over 80% of the world’s IP traffic will be video.
Global Broadband SpeedsBy 2019, average broadband connection speed will more than double (20.3 Mbps to 42.5 Mbps).
Global Devices/Connections By 2019, there will be 3.2 devices/ connections per capita globally.
Global Internet UsersBy 2019, there will be 3.9 Billion global internet users, representing 51% of the global population.
Source: Cisco VNI Global IP Traffic Forecast, 2014–2019

82© 2015 Cisco and/or its affiliates. All rights reserved. Cisco Confidential
Cisco VNI LATAM IP Forecast, 2014–2019Key Takeaways / Summary
LATAM IP TrafficBy 2019, LATAM IP traffic will reach 12.9 EBs/per month (155 EBs annually).
LATAM Mobile Traffic By 2019, 16% of IP traffic will be carried over cell networks.
LATAM Wi-Fi Traffic By 2019, Fixed Wi-Fi will generate 61% of LATAM IP traffic.
LATAM IP Video Traffic By 2019, over 82% of the LATAM IP traffic will be video.
LATAM Broadband SpeedsBy 2019, average broadband connection speed will more than double (7.2 Mbps to 17 Mbps).
LATAM Devices/Connections
By 2019, there will be 2.9 devices/ connections per capita in LATAM.
LATAM Internet UsersBy 2019, there will be 371 Million LATAM internet users, representing 57% of the LATAM population.
Source: Cisco VNI Global IP Traffic Forecast, 2014–2019
83© 2015 Cisco and/or its affiliates. All rights reserved. Cisco Confidential
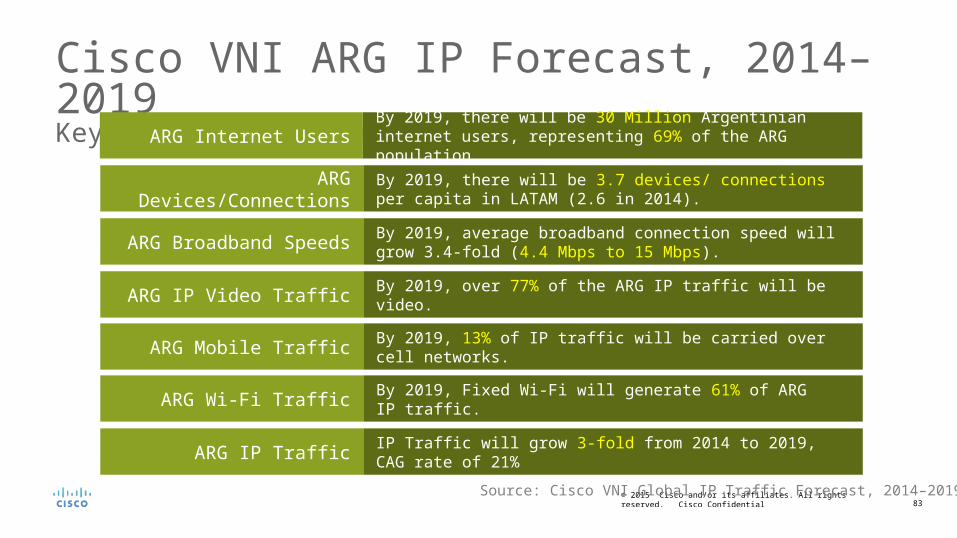
Cisco VNI ARG IP Forecast, 2014–2019Key Takeaways / Summary
ARG IP Traffic IP Traffic will grow 3-fold from 2014 to 2019, CAG rate of 21%
ARG Mobile Traffic By 2019, 13% of IP traffic will be carried over cell networks.
ARG Wi-Fi Traffic By 2019, Fixed Wi-Fi will generate 61% of ARG IP traffic.
ARG IP Video Traffic By 2019, over 77% of the ARG IP traffic will be video.
ARG Broadband SpeedsBy 2019, average broadband connection speed will grow 3.4-fold (4.4 Mbps to 15 Mbps).
ARG Devices/ConnectionsBy 2019, there will be 3.7 devices/ connections per capita in LATAM (2.6 in 2014).
ARG Internet UsersBy 2019, there will be 30 Million Argentinian internet users, representing 69% of the ARG population.
Source: Cisco VNI Global IP Traffic Forecast, 2014–2019
84© 2015 Cisco and/or its affiliates. All rights reserved. Cisco Confidential
Cisco VNI Web Sites
• Press Release
• White Papers / FAQs
• Cisco VNI Web-based Tools / Free Apps
IP Traffic Forecast inquiries: [email protected] Service Adoption Forecast inquiries: [email protected]
IP Traffic Forecast: http://www.cisco.com/go/vni Service Adoption Forecast: http://www.cisco.com/go/vnisa