Towards a Segment Based Mapping System Rolf Lakaemper Temple University, Philadelphia,PA,USA.
Upload
morris-boothCategory
view
227download
1
CIS 601
Image ENHANCEMENTin the
SPATIAL DOMAIN
Dr. Rolf Lakaemper

Most of these slides base on the book
Digital Image Processingby Gonzales/Woods
Chapter 3
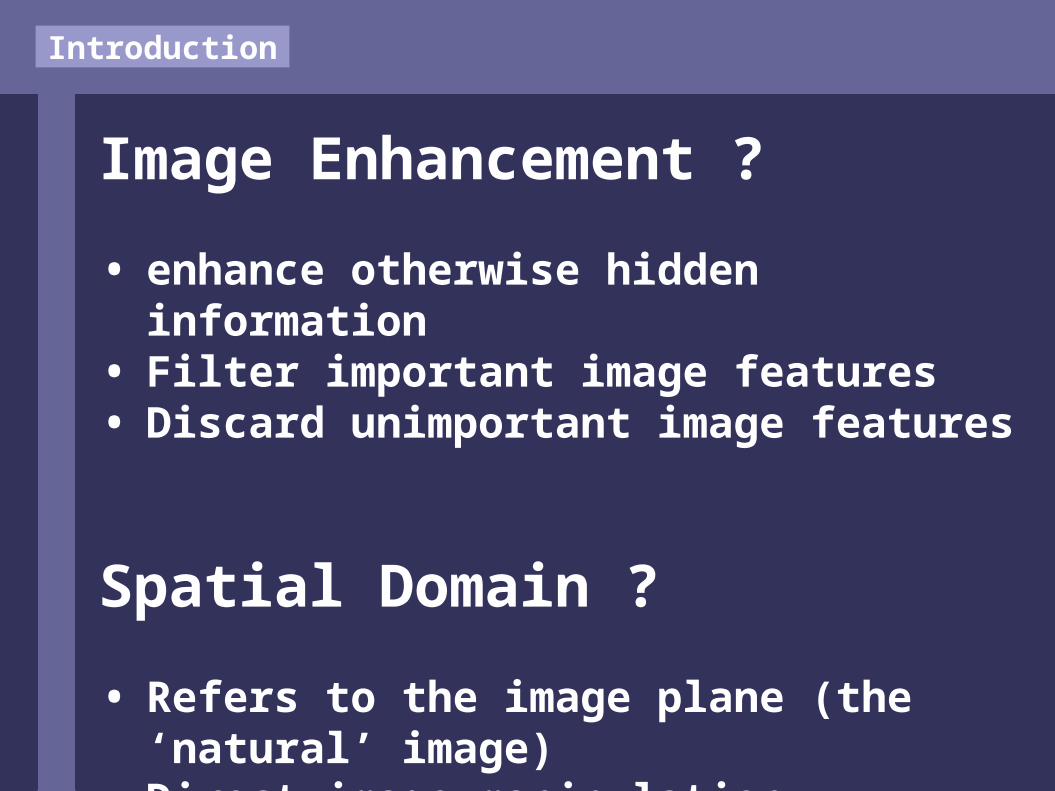
Introduction
Image Enhancement ?
• enhance otherwise hidden information• Filter important image features• Discard unimportant image features
Spatial Domain ?
• Refers to the image plane (the ‘natural’ image)
• Direct image manipulation

Remember ?
A 2D grayvalue - image is a 2D -> 1D function,
v = f(x,y)

Remember ?
As we have a function, we can apply operators to this function, e.g.
T(f(x,y)) = f(x,y) / 2
Operator Image (= function !)
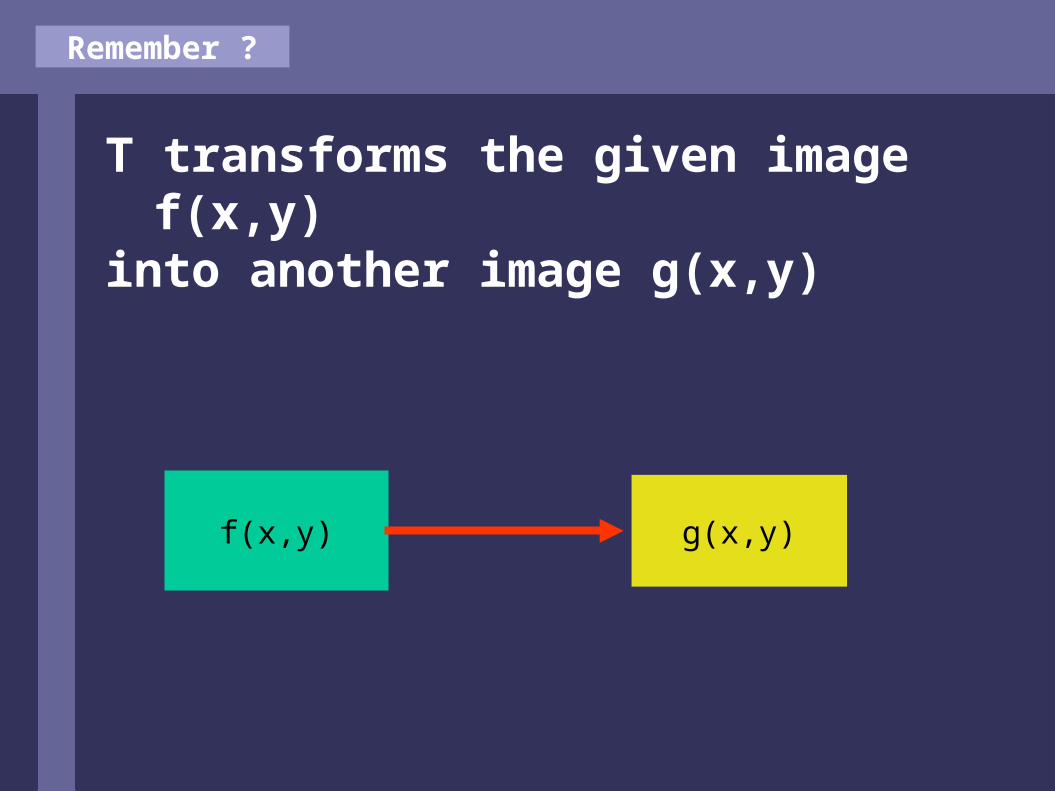
Remember ?
T transforms the given image f(x,y)into another image g(x,y)
f(x,y) g(x,y)

Spatial Domain
The operator T can be defined over
• The set of pixels (x,y) of the image• The set of ‘neighborhoods’ N(x,y) of
each pixel• A set of images f1,f2,f3,…

Operation on the set of image-pixels
6 8 2 0
12 200 20 10
3 4 1 0
6 100 10 5
Spatial Domain
(Operator: Div. by 2)
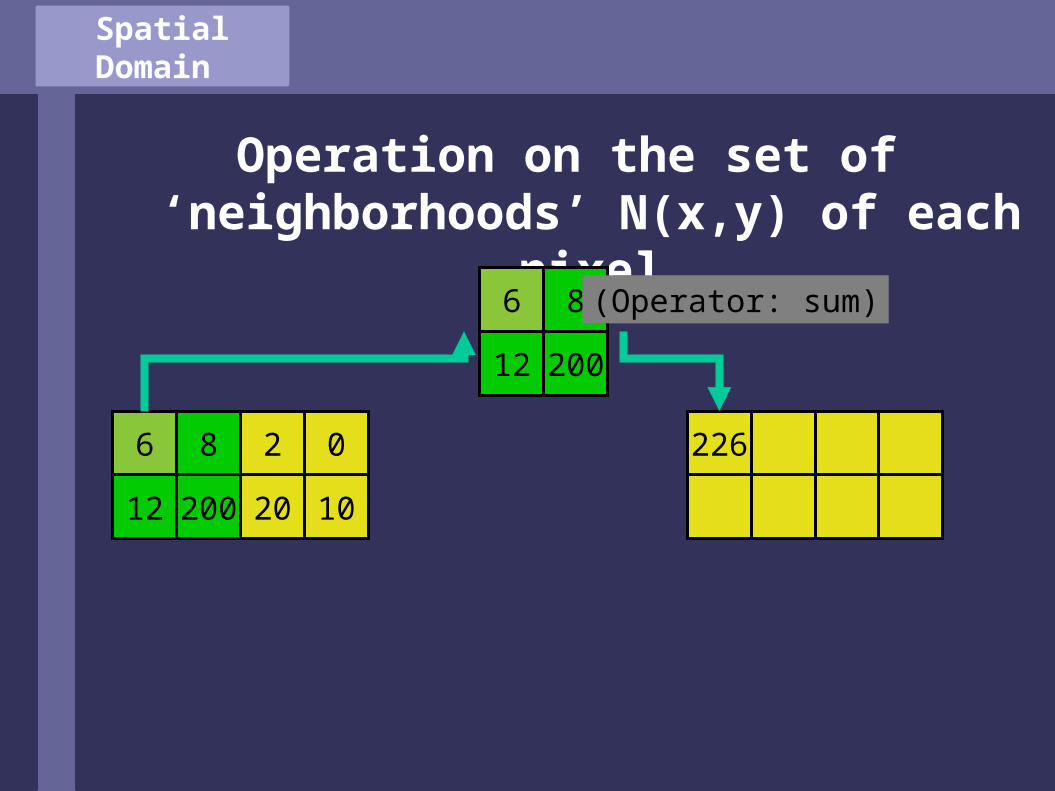
Operation on the set of ‘neighborhoods’ N(x,y) of each pixel
6 8 2 0
12 200 20 10
226
Spatial Domain
6 8
12 200
(Operator: sum)
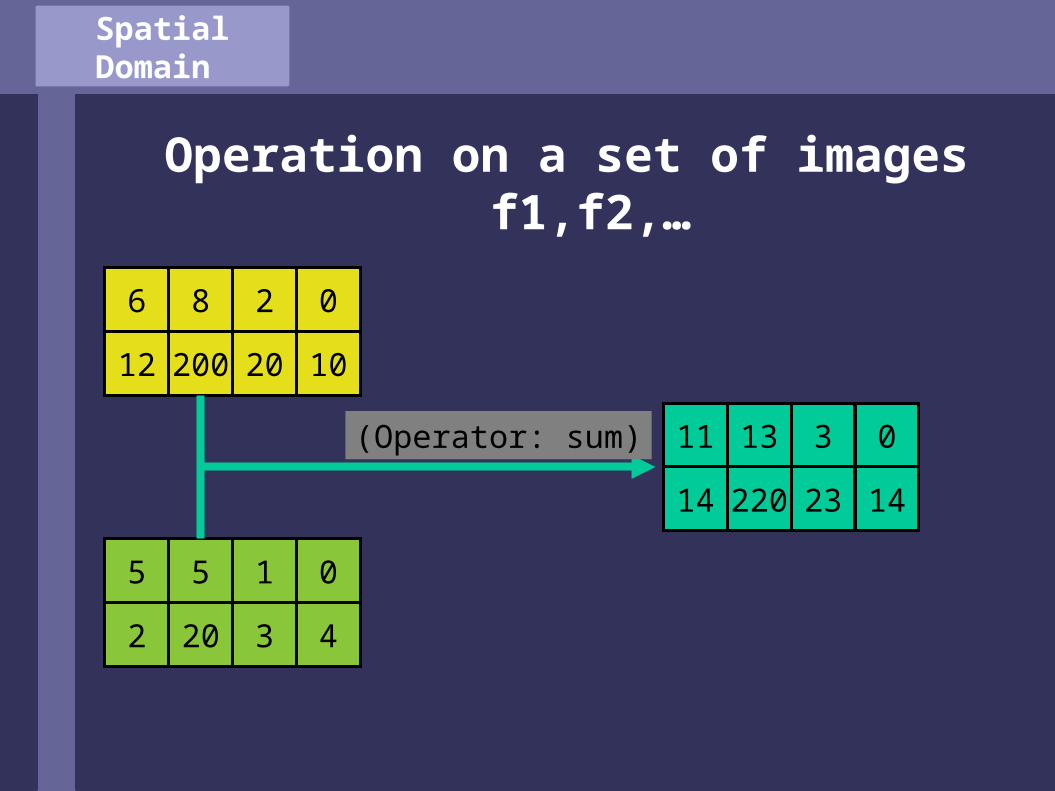
Operation on a set of images f1,f2,…
6 8 2 0
12 200 20 10
Spatial Domain
5 5 1 0
2 20 3 4
11 13 3 0
14 220 23 14
(Operator: sum)
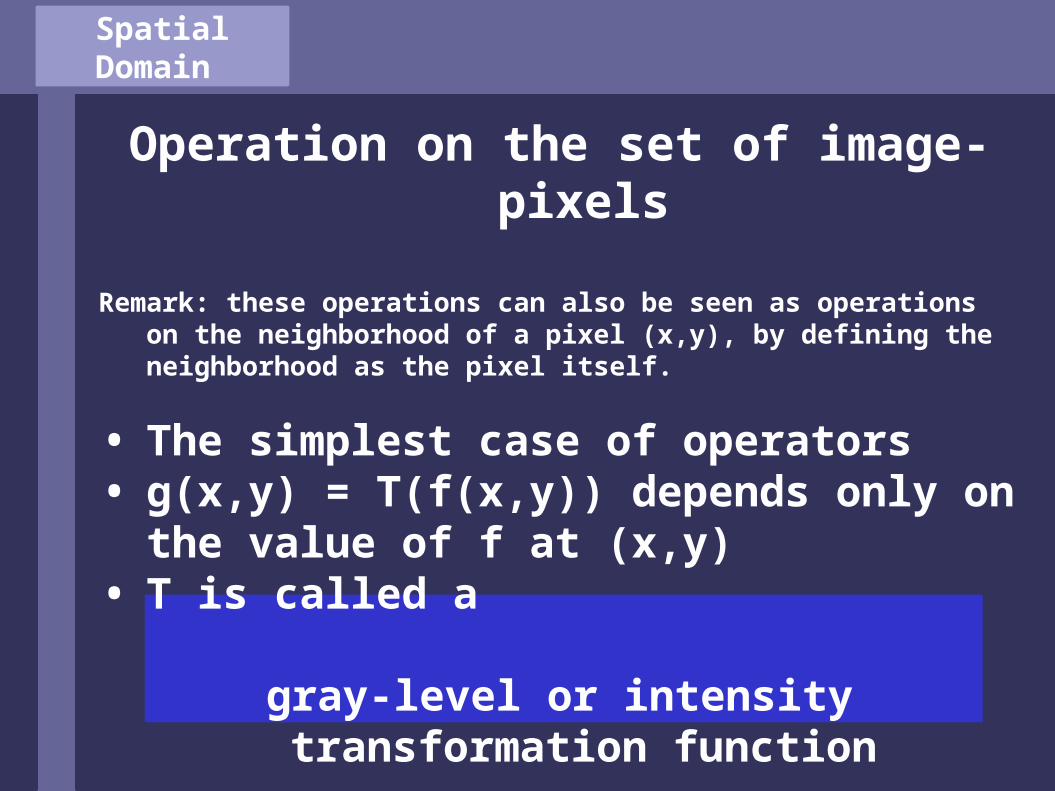
Operation on the set of image-pixels
Remark: these operations can also be seen as operations on the neighborhood of a pixel (x,y), by defining the neighborhood as the pixel itself.
• The simplest case of operators• g(x,y) = T(f(x,y)) depends only on the value
of f at (x,y)• T is called a
gray-level or intensity transformation function
Spatial Domain
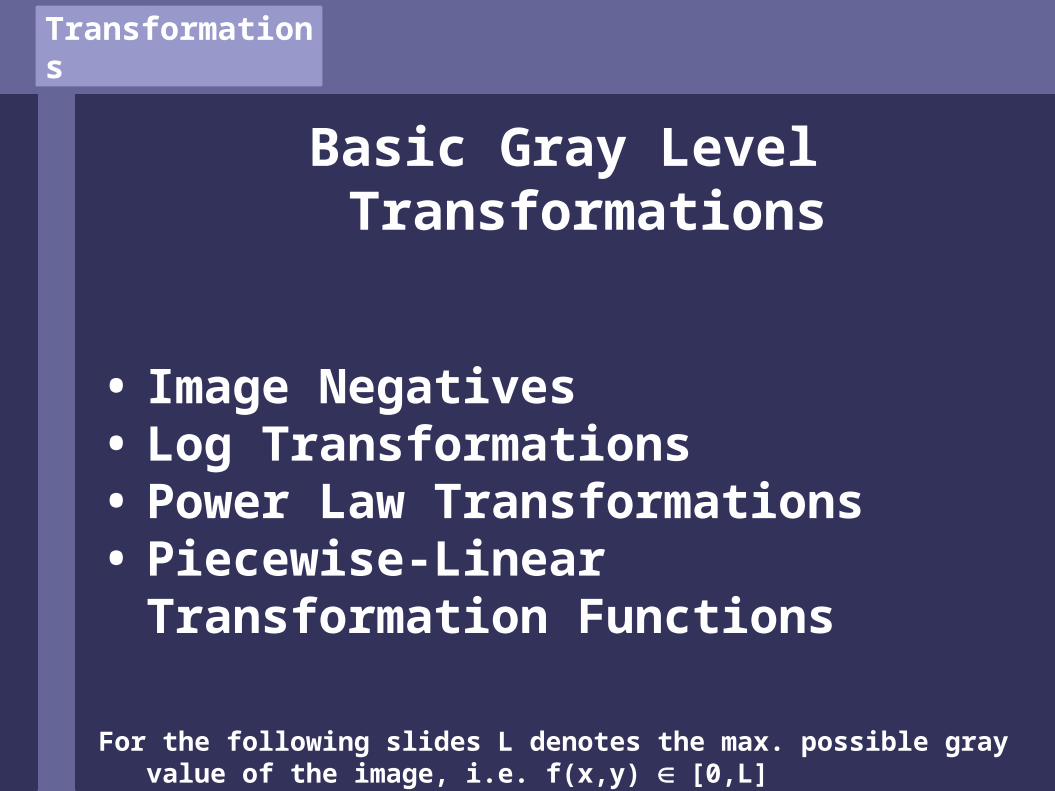
Basic Gray Level Transformations
• Image Negatives• Log Transformations• Power Law Transformations• Piecewise-Linear Transformation
Functions
For the following slides L denotes the max. possible gray value of the image, i.e. f(x,y) [0,L]
Transformations
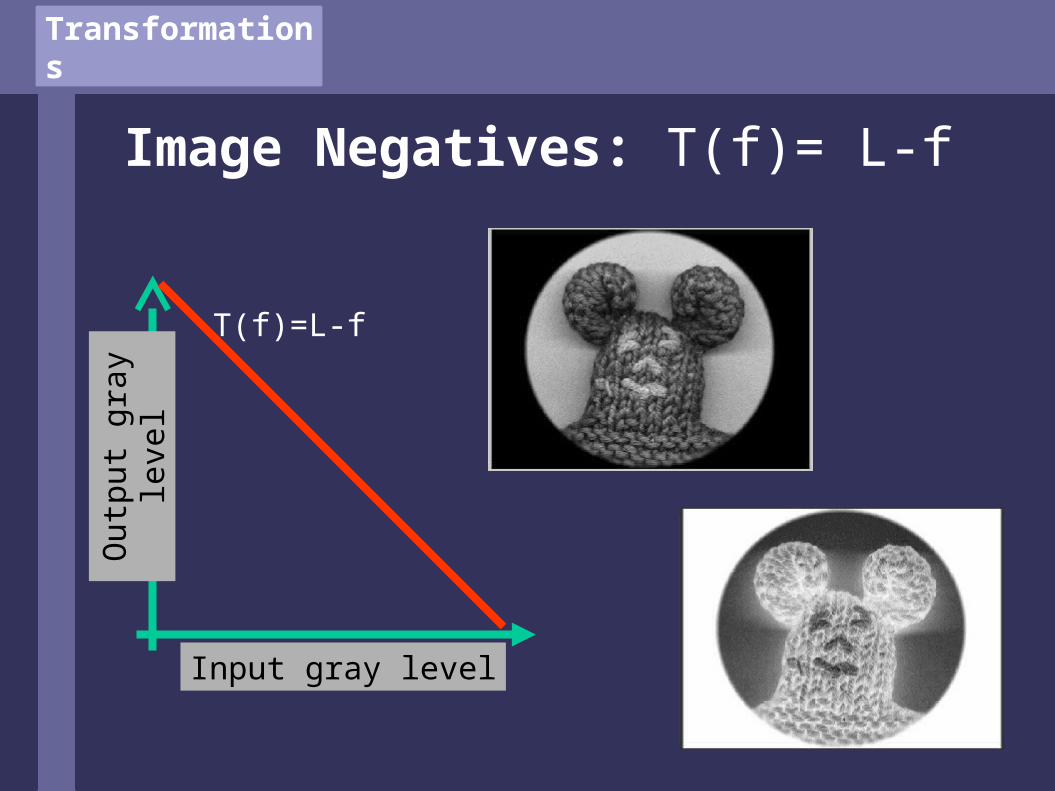
Image Negatives: T(f)= L-f
Transformations
Input gray level
Out
put g
ray
leve
l T(f)=L-f

Log Transformations:T(f) = c * log (1+ f)
Transformations

Log Transformations
Transformations
InvLog Log

Log Transformations
Transformations

Power Law TransformationsT(f) = c*f
Transformations
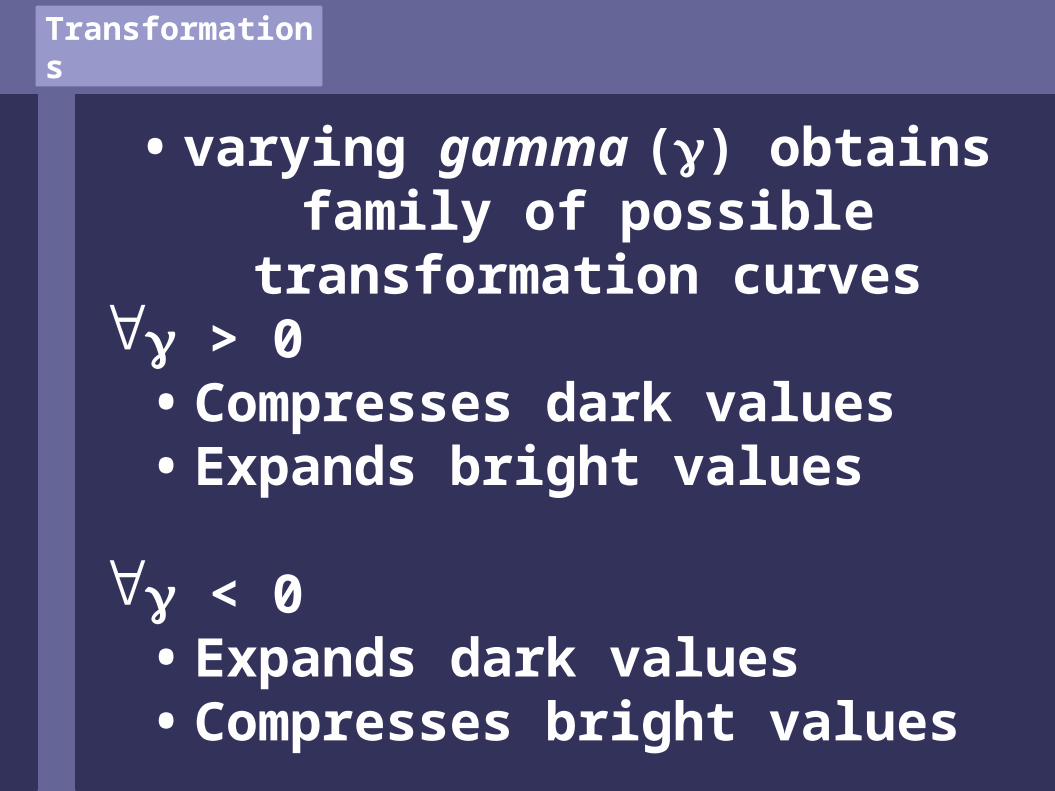
• varying gamma () obtains family of possible transformation curves
> 0 • Compresses dark values• Expands bright values
< 0 • Expands dark values• Compresses bright values
Transformations

• Used for gamma-correction
Transformations
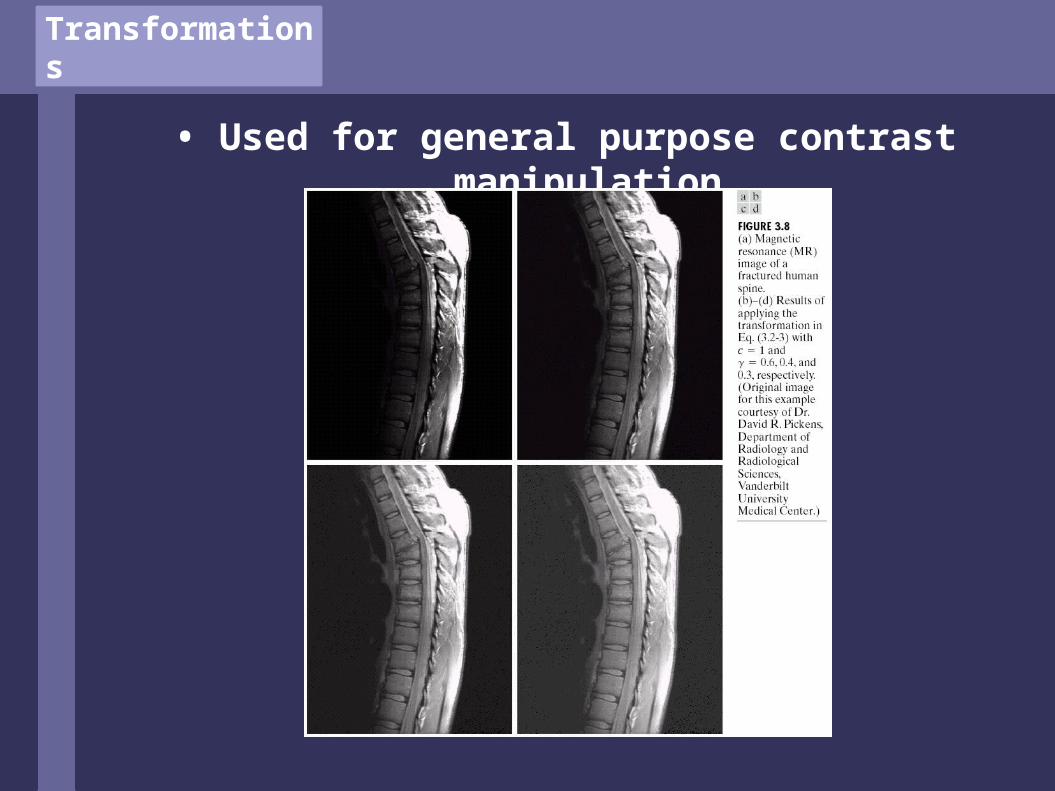
• Used for general purpose contrast manipulation
Transformations

Piecewise Linear Transformations
Transformations

Thresholding Function
g(x,y) = L if f(x,y) > t,0 else
t = ‘threshold level’
Piecewise Linear Transformations
Input gray level
Out
put g
ray
leve
l
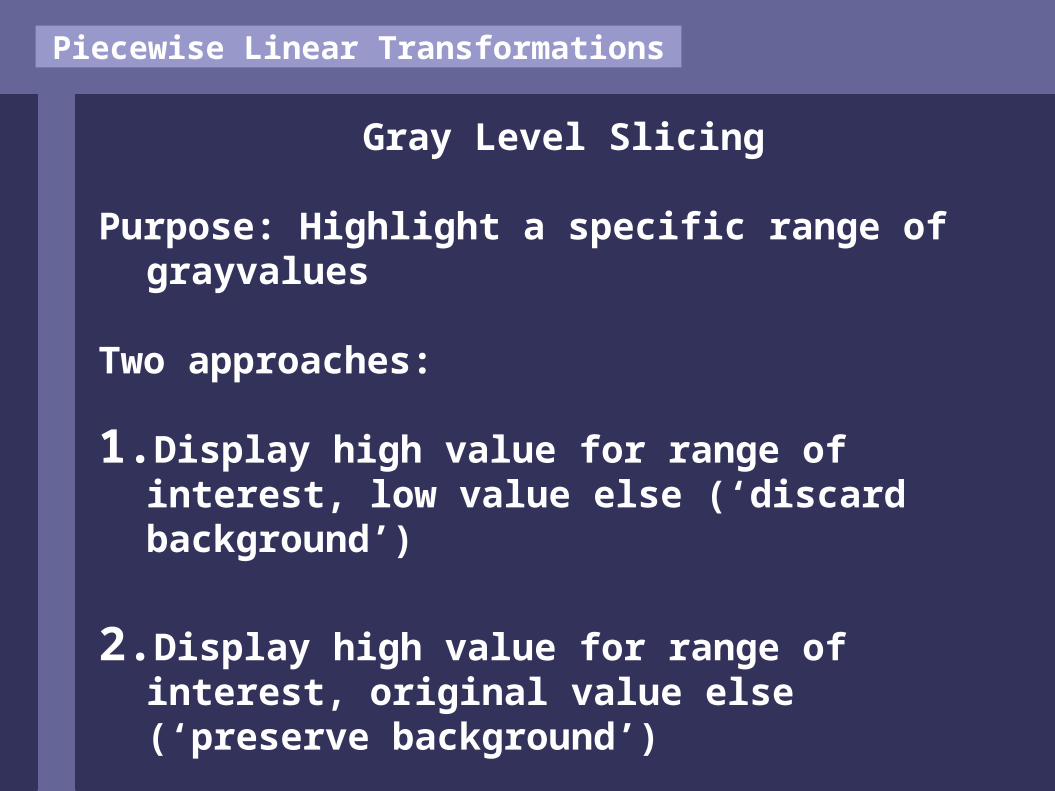
Gray Level Slicing
Purpose: Highlight a specific range of grayvalues
Two approaches:
1. Display high value for range of interest, low value else (‘discard background’)
2. Display high value for range of interest, original value else (‘preserve background’)
Piecewise Linear Transformations

Gray Level Slicing
Piecewise Linear Transformations

Bitplane Slicing
Extracts the information of a single bitplane
Piecewise Linear Transformations

Piecewise Linear Transformations
BP 7
BP 5
BP 0

Exercise:
• How does the transformation function look for bitplanes 0,1,… ?
• What is the easiest way to filter a single bitplane (e.g. in MATLAB) ?
Piecewise Linear Transformations

Histograms
Histogram Processing
gray level
Num
ber
of P
ixel
s1 4 5 0
3 1 5 1

Histograms
Histogram Equalization:
• Preprocessing technique to enhance contrast in ‘natural’ images
• Target: find gray level transformation function T to transform image f such that the histogram of T(f) is ‘equalized’

Histogram Equalization
Equalized Histogram:
The image consists of an equal number of pixels for every gray-
value, the histogram is constant !

Histogram Equalization
Example:
We are looking forthis transformation !
T

Histogram Equalization
Target: Find a transformation T to transform the
grayvalues g1[0..1] of an image I to grayvalues g2 = T(g1) such that the histogram is equalized, i.e. there’s an equal amount of pixels for each grayvalue.
Observation (continous model !):Assumption: Total image area = 1 (normalized). Then:
The area(!) of pixels of the transformed image in the gray-value range 0..g2 equals the gray-value g2.

Histogram Equalization
The area(!) of pixels of the transformed image in the gray-value range 0..g2 equals the gray-value g2.
Every g1 is transformed to a grayvalue that equals the area (discrete: number of pixels) in the image covered by pixels having gray-values from 0 to g1.
The transformation T function t is the
area- integral: T: g2 = 0..g1 I da
Histogram Equalization
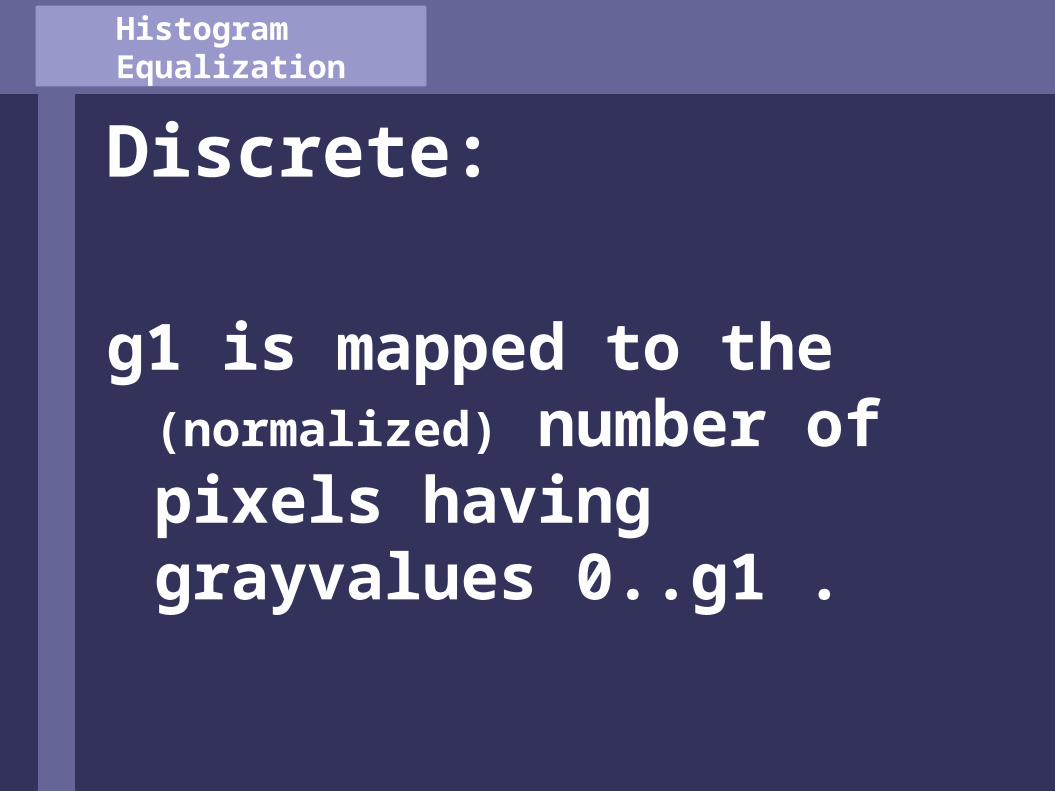
Discrete:
g1 is mapped to the (normalized) number of pixels having grayvalues 0..g1 .

Histogram Equalization
Mathematically the transformation is deducted by theorems in
continous (not discrete) spaces.
The results achieved do NOT hold for discrete spaces !
(Why ?)
However, it’s visually close.

Histogram Equalization
Conclusion:
• The transformation function that yields an image having an equalized histogram is the integral of the histogram of the source-image
• The discrete integral is given by the cumulative sum, MATLAB function: cumsum()
• The function transforms an image into an image, NOT a histogram into a histogram ! The histogram is just a control tool !
• In general the transformation does not create an image with an equalized histogram in the discrete case !

Operations on a set of images
Operation on a set of images f1,f2,…
6 8 2 0
12 200 20 10
5 5 1 0
2 20 3 4
11 13 3 0
14 220 23 14
(Operator: sum)

Operations on a set of images
Logic (Bitwise) Operations
ANDOR
NOT
Operations on a set of images
The operators AND,OR,NOT are functionally complete:
Any logic operator can be implemented using only these 3 operators
Operations on a set of images
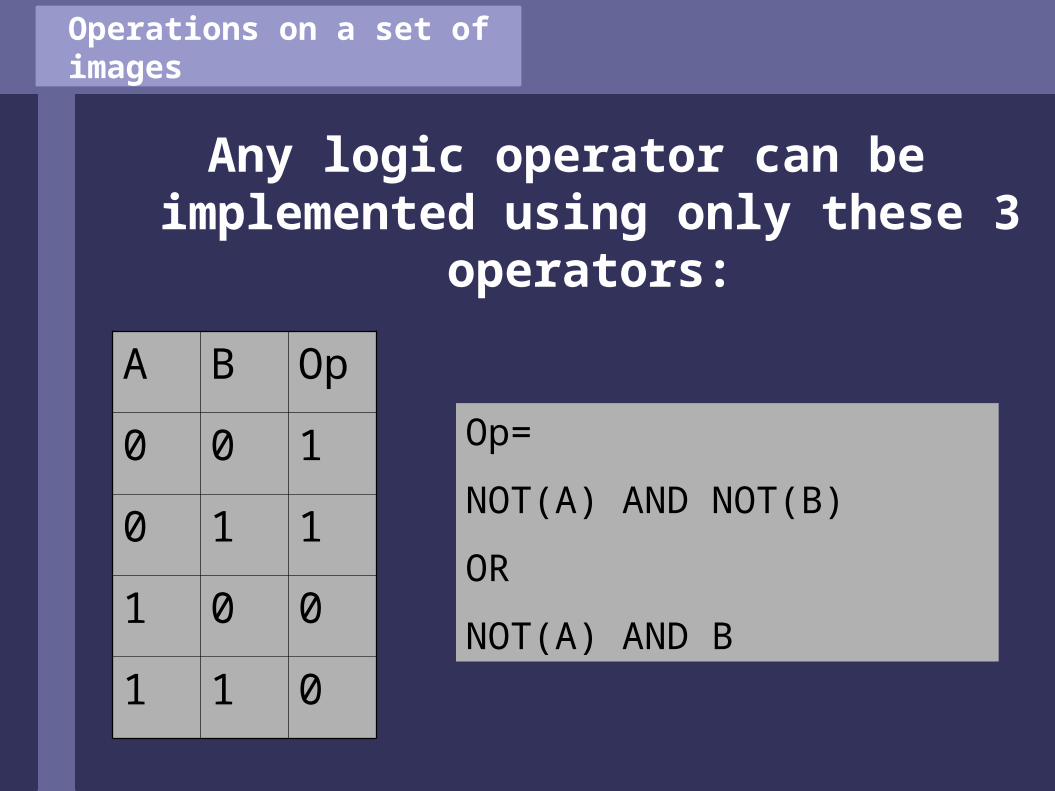
Any logic operator can be implemented using only these 3 operators:
A B Op
0 0 1
0 1 1
1 0 0
1 1 0
Op=
NOT(A) AND NOT(B)
OR
NOT(A) AND B
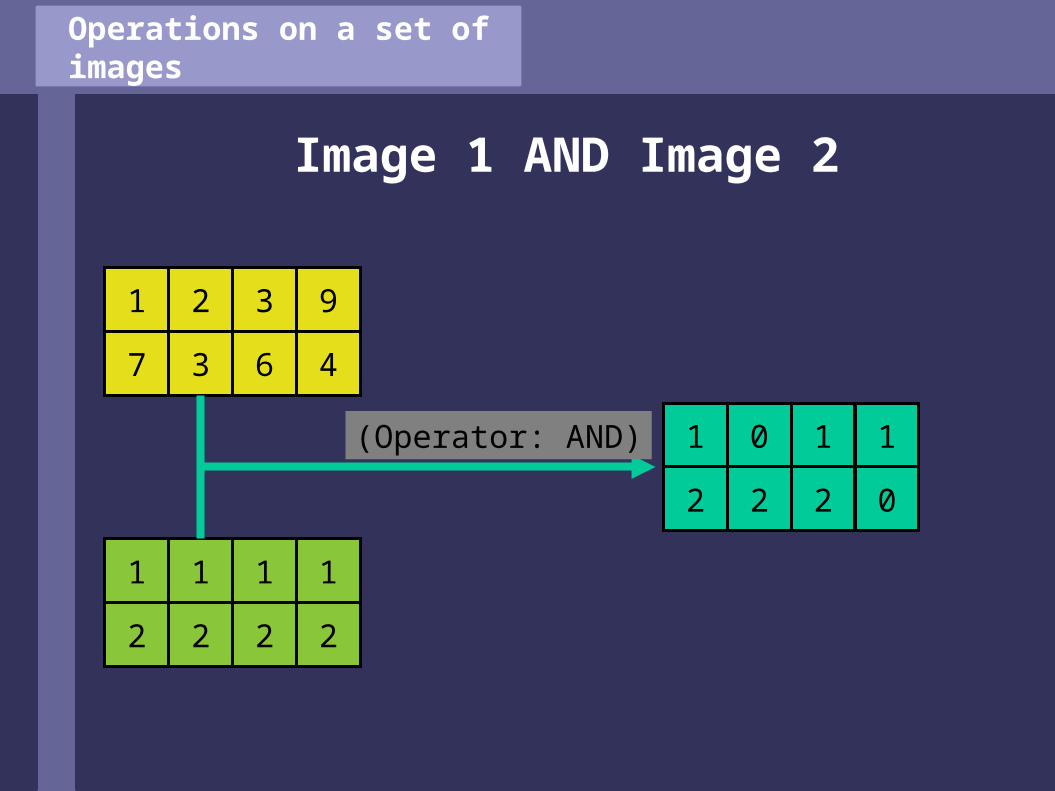
Operations on a set of images
Image 1 AND Image 2
1 2 3 9
7 3 6 4
1 1 1 1
2 2 2 2
1 0 1 1
2 2 2 0
(Operator: AND)
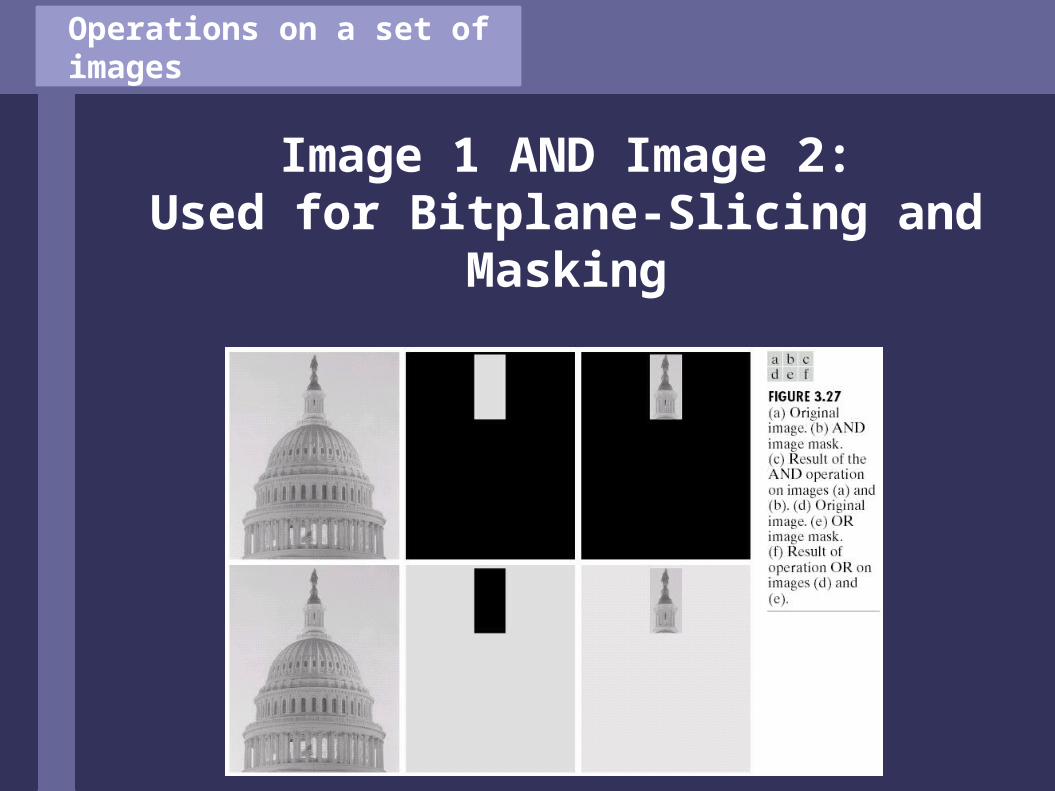
Operations on a set of images
Image 1 AND Image 2:Used for Bitplane-Slicing and
Masking

Operations on a set of images
Exercise: Define the mask-image, that transforms image1 into image2 using
the OR operand
1 2 3 9
7 3 6 4
255 2 7 255
255 3 7 255
(Operator: OR)

Operations
Arithmetic Operations on a set of images
1 2 3 9
7 3 6 4
1 1 1 1
2 2 2 2
2 3 4 10
9 5 8 6
(Operator: +)
Operations
Exercise:
What could the operators + and – be used for ?
Operations
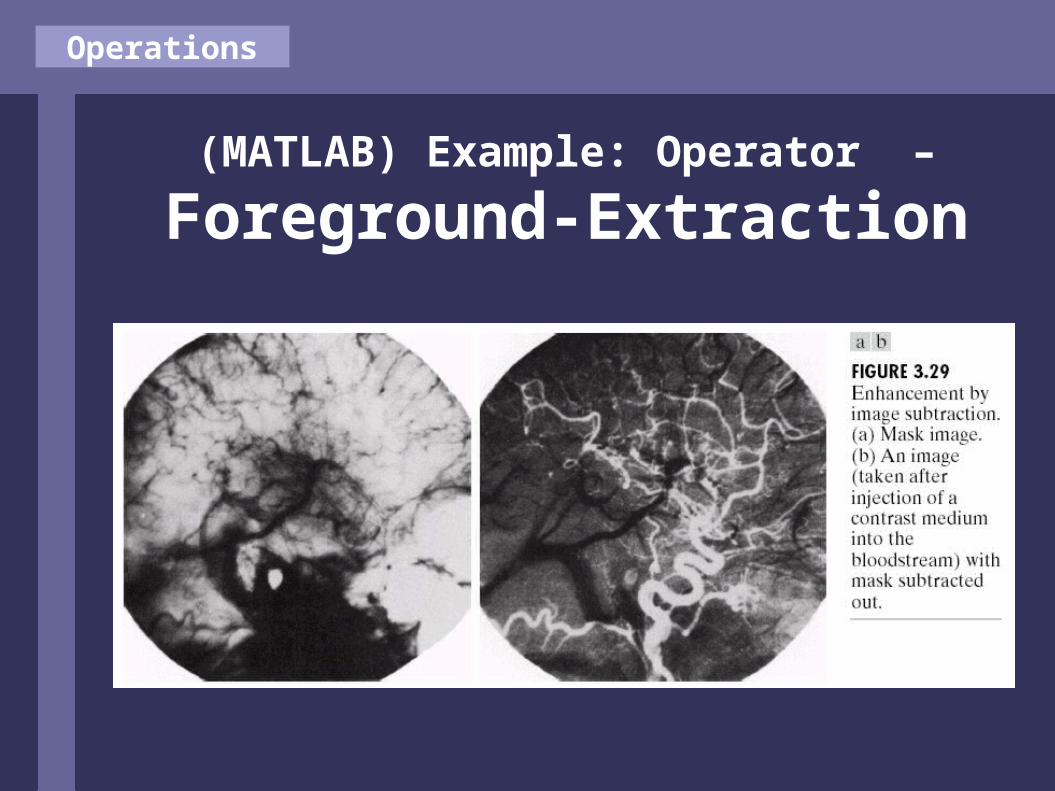
(MATLAB) Example: Operator –
Foreground-Extraction

Operations
(MATLAB)Example: Operator +
Image Averaging

Part 2
CIS 601
Image ENHANCEMENTin the
SPATIAL DOMAIN

Histograms
So far (part 1) :
• Histogram definition• Histogram equalization
Now:
• Histogram statistics
Histograms
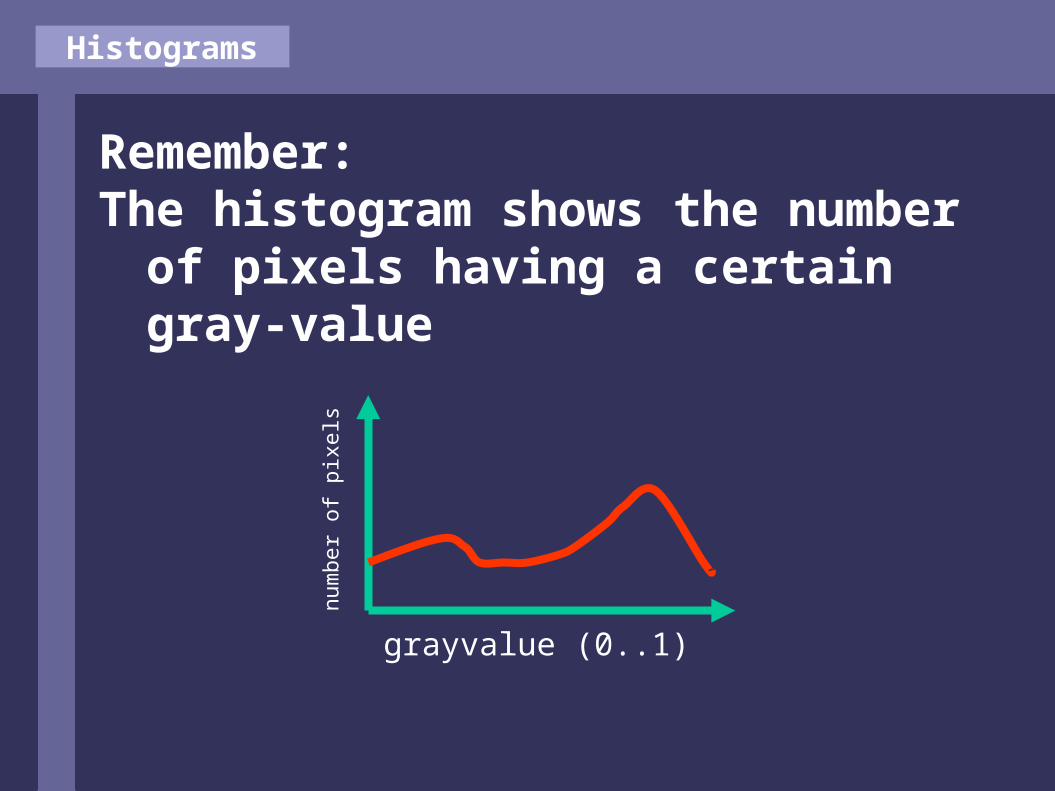
Remember:The histogram shows the number of
pixels having a certain gray-value
nu
mbe
r of
pix
els
grayvalue (0..1)

Histograms
The NORMALIZED histogram is the histogram divided by the total number of pixels in the source image.
The sum of all values in the normalized histogram is 1.
The value given by the normalized histogram for a certain gray value can be read as the probability of randomly picking a pixel having that gray value

Histograms
What can the (normalized) histogram tell about the
image ?

Histograms
1.The MEAN VALUE (or average gray level)
M = g g h(g)
1*0.3+2*0.1+3*0.2+4*0.1+5*0.2+6*0.1=2.6
0.30.20.10.0
1 2 3 4 5 6

Histograms
The MEAN value is the average gray
value of the image, the ‘overall brightness appearance’.

Histograms
2. The VARIANCE
V = g (g-M)2 h(g)
(with M = mean)or similar:
The STANDARD DEVIATION
D = sqrt(V)

Histograms
VARIANCE gives a measure about the distribution of the histogram values around the mean.
0.30.20.10.0
0.30.20.10.0
V1 > V2

Histograms
The STANDARD DEVIATION is a value on the gray level axis, showing the average distance of all pixels to the mean
0.30.20.10.0
0.30.20.10.0
D1 > D2

Histograms
VARIANCE and STANDARD DEVIATION of the histogram tell us about the average contrast of the image !
The higher the VARIANCE (=the higher the STANDARD DEVIATION), the
higher the image’s contrast !

Histograms
Example:
Image and blurred version
Histograms
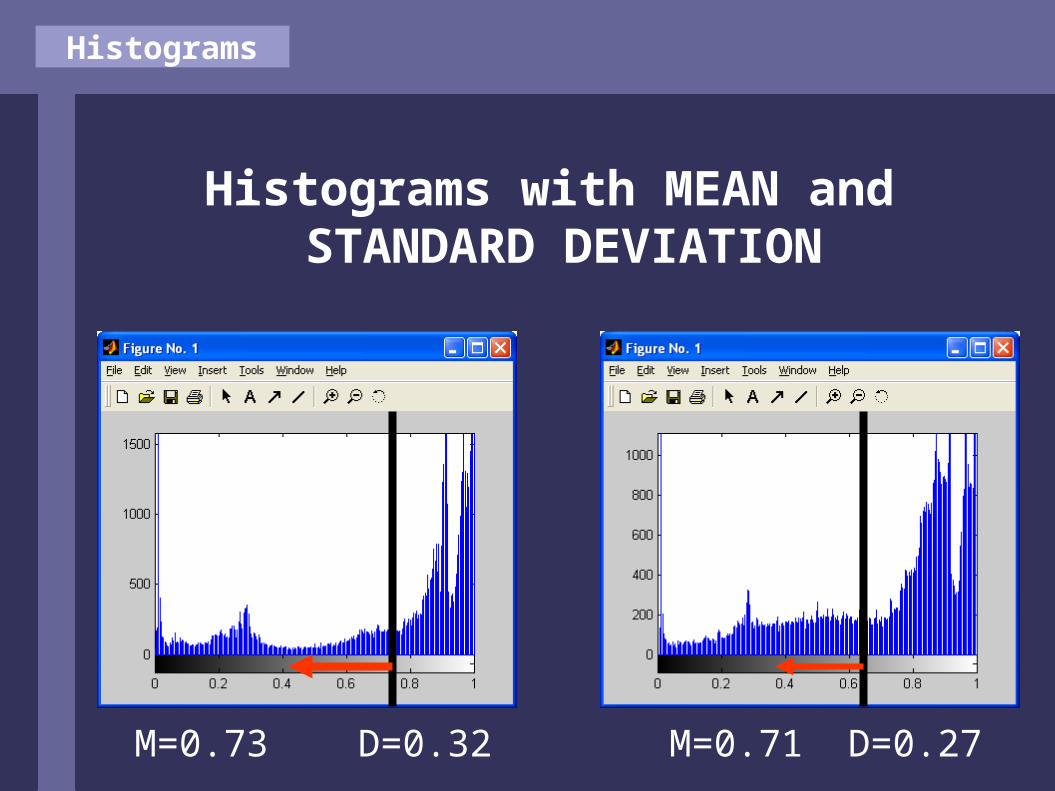
Histograms with MEAN and STANDARD DEVIATION
M=0.73 D=0.32 M=0.71 D=0.27
Histograms
Exercise:
Design an autofocus system for a digital camera !
The system should analyse an area in the middle of the picture and automatically adjust the lens such that this area is sharp.
Histograms
In between the basics…
…histograms can give us a first hint how to create image databases:
Feature Based Coding
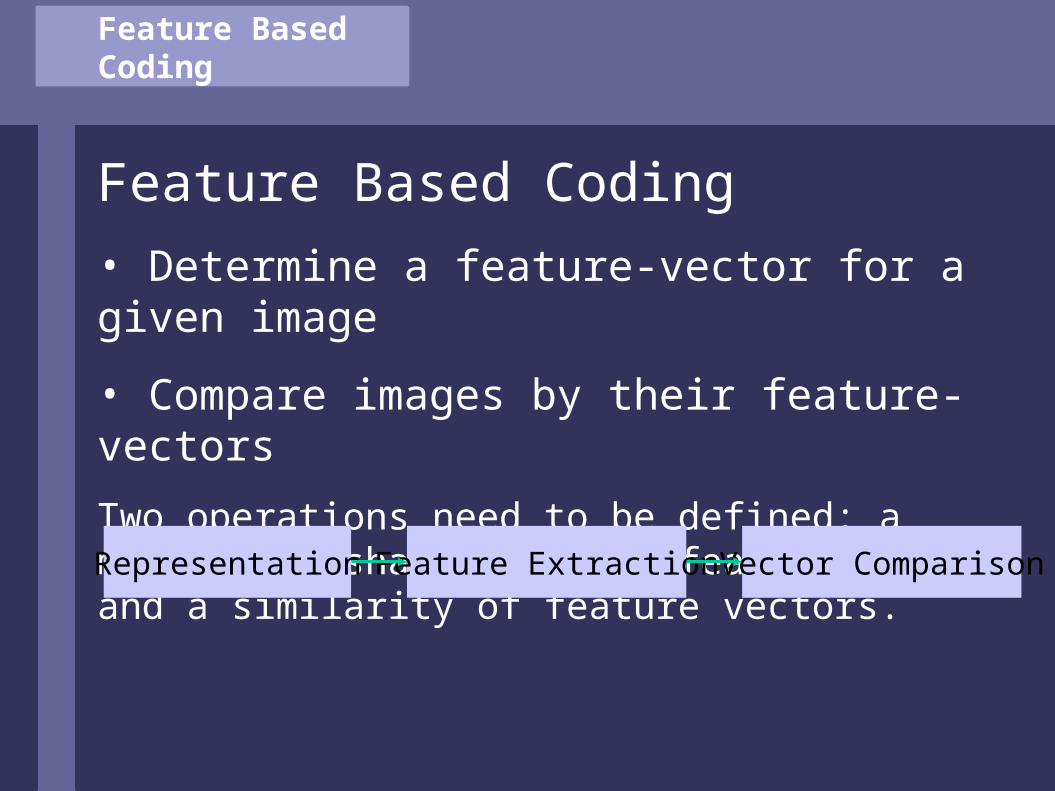
Feature Based Coding
• Determine a feature-vector for a given image
• Compare images by their feature-vectors
Two operations need to be defined: a mapping of shape into the feature space and a similarity of feature vectors.
Where are the histograms ?
Representation Feature Extraction Vector Comparison
Feature Based Coding
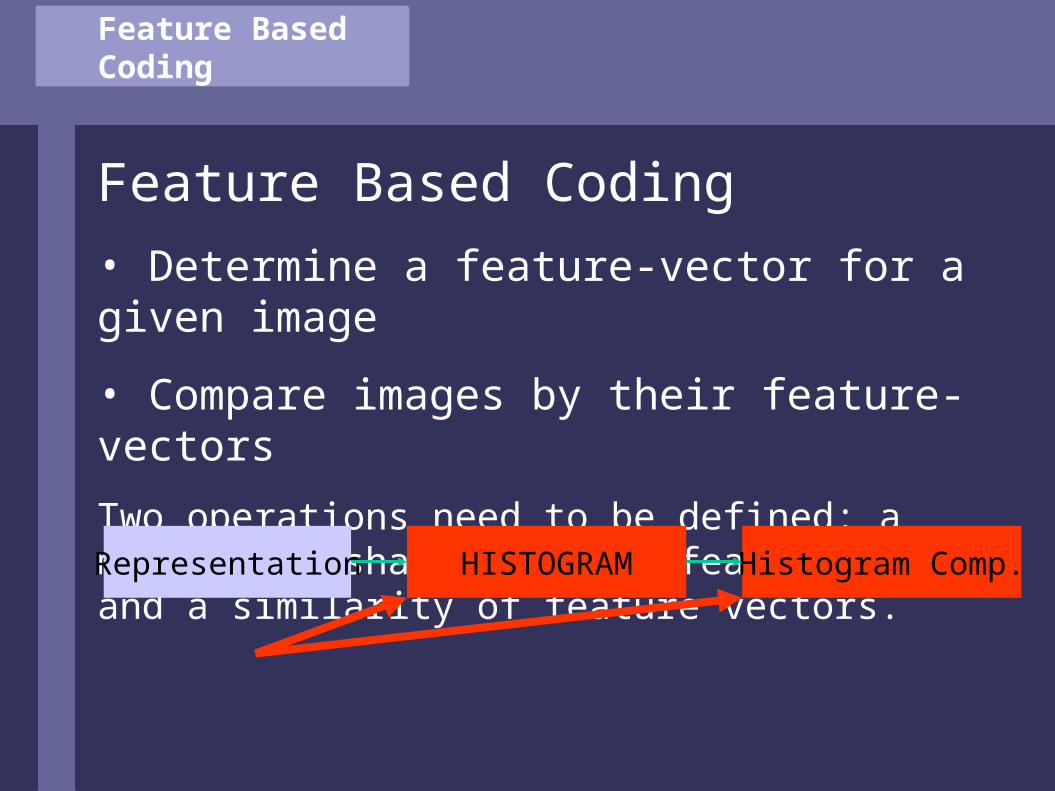
Feature Based Coding
• Determine a feature-vector for a given image
• Compare images by their feature-vectors
Two operations need to be defined: a mapping of shape into the feature space and a similarity of feature vectors.
HERE !
Question: how can we compare histograms (vectors) ?
Representation HISTOGRAM Histogram Comp.
Vector Comparison
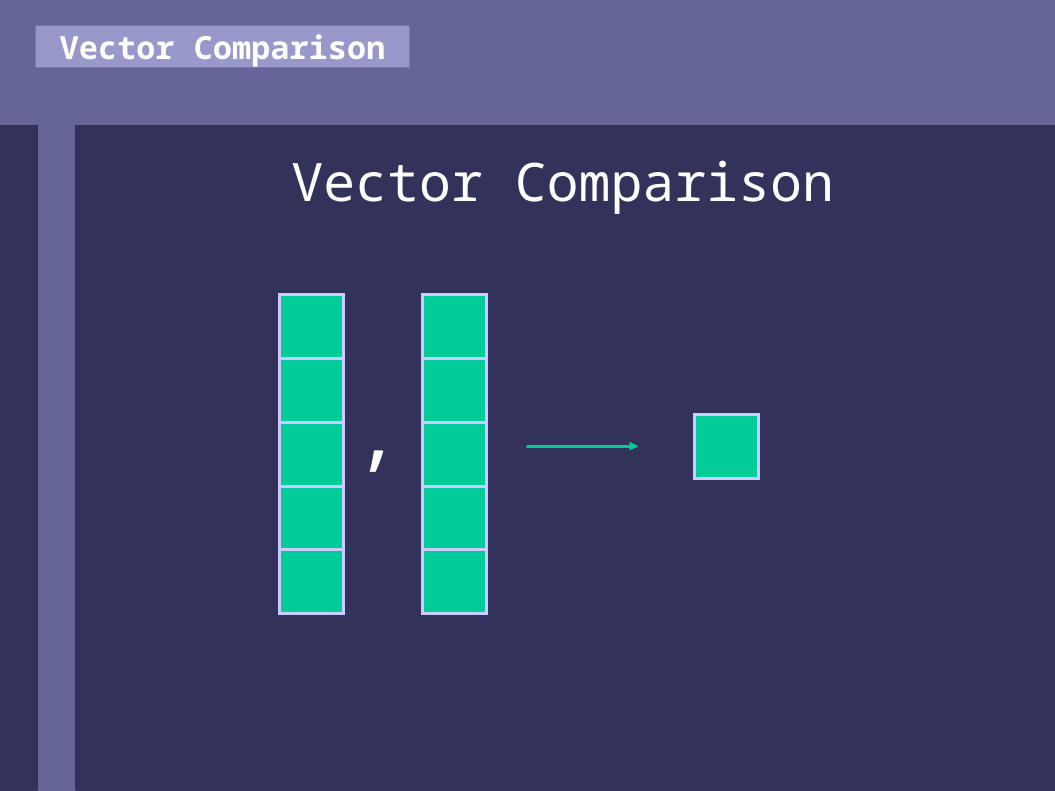
Vector Comparison
,

Vector Comparison
Vector Comparison

Vector Comparison
What’s the meaning of the Cosine Distance with respect to histograms ?
i.e.: what’s the consequence of eliminating the vector’s length information ?

Vector Comparison
More Vector Distances:
• Quadratic Form Distance
• Earth Movers Distance
• Proportional Transportation Distance
• …

Vector Comparison
Histogram Intersection
(non symmetric):
d(h1,h2) = 1 - min(h1 ,h2 ) / h1
Ex.: What could be a huge drawback of image comparison using histogram intersection ?
i i i ii
Histograms
Exercise:
Outline an image database system, using statistical (histogram)
information

Histograms
Discussion:
Which problems could occur if the database consists of the following
images ?

Histograms

Spatial Filtering
End of histograms.
And now to something completely
different …