CIRP Theme Reports
53
1.2 CIRP Theme Reports First-time, Full-time Freshmen Comparison group 1: Public Universities Comparison group 2: All universities 2020 CIRP Freshman Survey University of California-San Diego
Transcript of CIRP Theme Reports
1.2
CIRP Theme ReportsFirst-time, Full-time Freshmen
Comparison group 1: Public UniversitiesComparison group 2: All universities
2020 CIRP Freshman Survey
University of California-San Diego
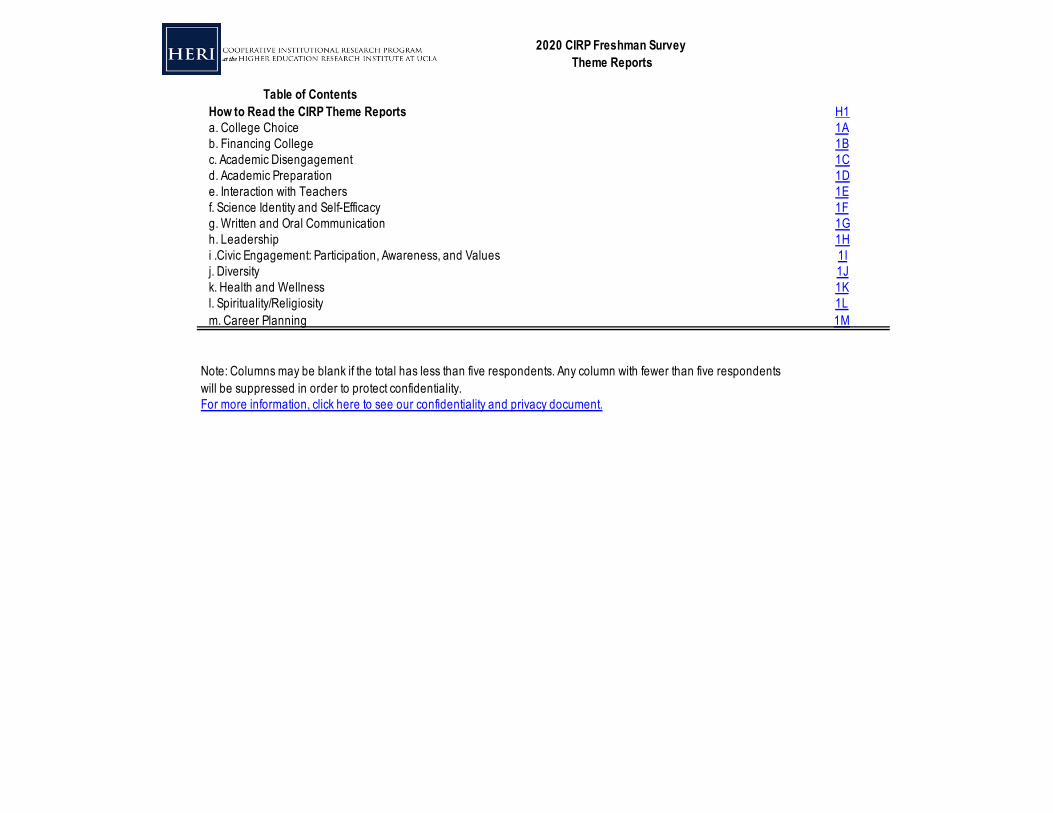
Table of ContentsHow to Read the CIRP Theme Reports H1a. College Choice 1Ab. Financing College 1Bc. Academic Disengagement 1Cd. Academic Preparation 1De. Interaction with Teachers 1Ef. Science Identity and Self-Efficacy 1Fg. Written and Oral Communication 1Gh. Leadership 1Hi .Civic Engagement: Participation, Awareness, and Values 1Ij. Diversity 1Jk. Health and Wellness 1Kl. Spirituality/Religiosity 1Lm. Career Planning 1M
Note: Columns may be blank if the total has less than five respondents. Any column with fewer than five respondents will be suppressed in order to protect confidentiality. For more information, click here to see our confidentiality and privacy document.
2020 CIRP Freshman Survey Theme Reports
H1
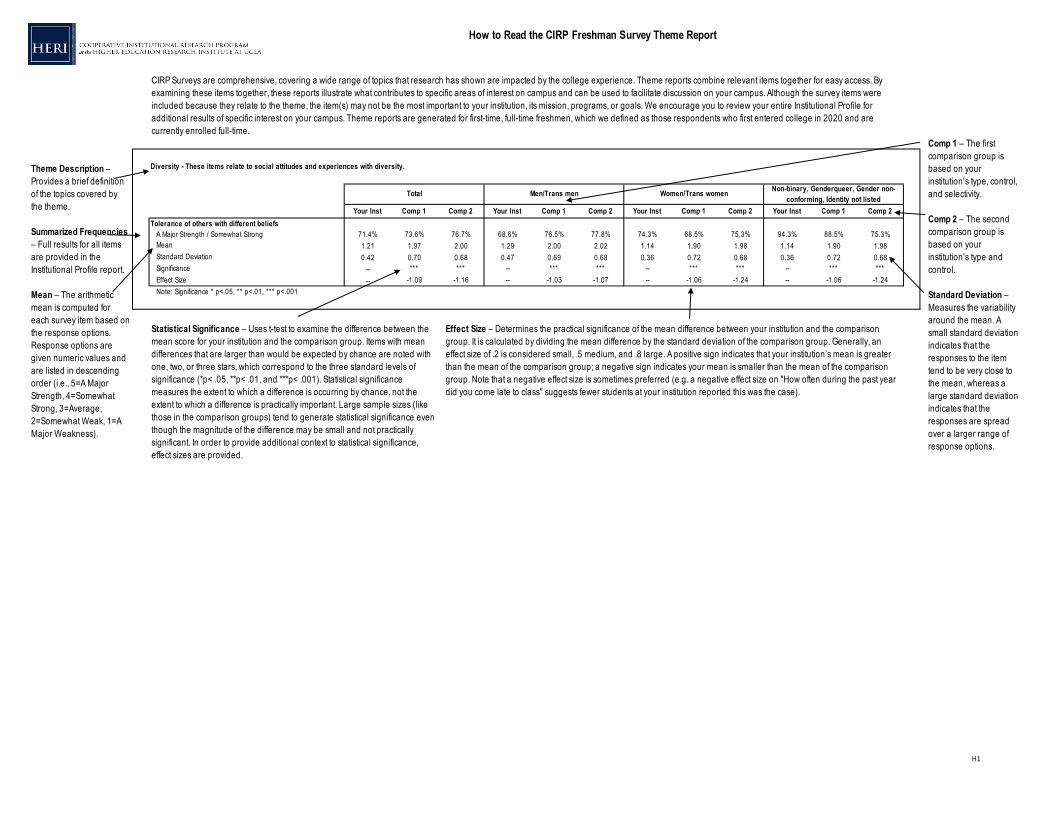
Your Inst Comp 1 Comp 2 Your Inst Comp 1 Comp 2 Your Inst Comp 1 Comp 2 Your Inst Comp 1 Comp 2Tolerance of others with different beliefs A Major Strength / Somewhat Strong 71.4% 73.6% 76.7% 68.6% 76.5% 77.8% 74.3% 68.5% 75.3% 94.3% 88.5% 75.3%
Mean 1.21 1.97 2.00 1.29 2.00 2.02 1.14 1.90 1.98 1.14 1.90 1.98Standard Deviation 0.42 0.70 0.68 0.47 0.69 0.68 0.36 0.72 0.68 0.36 0.72 0.68Significance -- *** *** -- *** *** -- *** *** -- *** ***Effect Size -- -1.09 -1.16 -- -1.03 -1.07 -- -1.06 -1.24 -- -1.06 -1.24
Comp 1 – The first comparison group is based on your institution's type, control, and selectivity.
Comp 2 – The second comparison group is based on your institution's type and control.
Standard Deviation – Measures the variability around the mean. A small standard deviation indicates that the responses to the item tend to be very close to the mean, whereas a large standard deviation indicates that the responses are spread over a larger range of response options.
How to Read the CIRP Freshman Survey Theme Report
Total Men/Trans men Non-binary, Genderqueer, Gender non-conforming, Identity not listed
CIRP Surveys are comprehensive, covering a wide range of topics that research has shown are impacted by the college experience. Theme reports combine relevant items together for easy access. By examining these items together, these reports illustrate what contributes to specific areas of interest on campus and can be used to facilitate discussion on your campus. Although the survey items were included because they relate to the theme, the item(s) may not be the most important to your institution, its mission, programs, or goals. We encourage you to review your entire Institutional Profile for additional results of specific interest on your campus. Theme reports are generated for first-time, full-time freshmen, which we defined as those respondents who first entered college in 2020 and are currently enrolled full-time.
Theme Description – Provides a brief definition of the topics covered by the theme.
Summarized Frequencies – Full results for all items are provided in the Institutional Profile report.
Mean – The arithmetic mean is computed for each survey item based on the response options. Response options are given numeric values and are listed in descending order (i.e., 5=A Major Strength, 4=Somewhat Strong, 3=Average, 2=Somewhat Weak, 1=A Major Weakness).
Note: Significance * p<.05, ** p<.01, *** p<.001
Diversity - These items relate to social attitudes and experiences with diversity.
Statistical Significance – Uses t-test to examine the difference between the mean score for your institution and the comparison group. Items with mean differences that are larger than would be expected by chance are noted with one, two, or three stars, which correspond to the three standard levels of significance (*p< .05, **p< .01, and ***p< .001). Statistical significance measures the extent to which a difference is occurring by chance, not the extent to which a difference is practically important. Large sample sizes (like those in the comparison groups) tend to generate statistical significance even though the magnitude of the difference may be small and not practically significant. In order to provide additional context to statistical significance, effect sizes are provided.
Effect Size – Determines the practical significance of the mean difference between your institution and the comparison group. It is calculated by dividing the mean difference by the standard deviation of the comparison group. Generally, an effect size of .2 is considered small, .5 medium, and .8 large. A positive sign indicates that your institution’s mean is greater than the mean of the comparison group; a negative sign indicates your mean is smaller than the mean of the comparison group. Note that a negative effect size is sometimes preferred (e.g. a negative effect size on "How often during the past year did you come late to class" suggests fewer students at your institution reported this was the case).
Women/Trans women
Note: Significance * p<.05, ** p<.01, *** p<.001 Page 4 of 10 1A
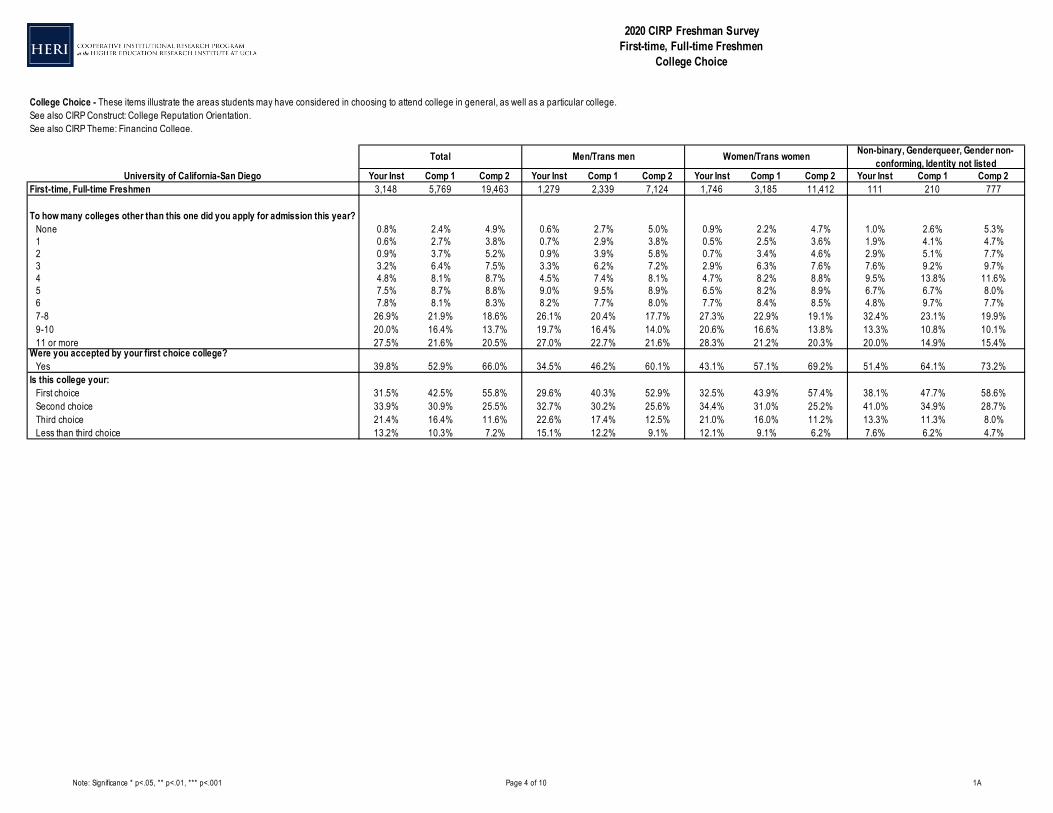
University of California-San Diego Your Inst Comp 1 Comp 2 Your Inst Comp 1 Comp 2 Your Inst Comp 1 Comp 2 Your Inst Comp 1 Comp 2First-time, Full-time Freshmen 3,148 5,769 19,463 1,279 2,339 7,124 1,746 3,185 11,412 111 210 777
To how many colleges other than this one did you apply for admission this year? None 0.8% 2.4% 4.9% 0.6% 2.7% 5.0% 0.9% 2.2% 4.7% 1.0% 2.6% 5.3%
1 0.6% 2.7% 3.8% 0.7% 2.9% 3.8% 0.5% 2.5% 3.6% 1.9% 4.1% 4.7%2 0.9% 3.7% 5.2% 0.9% 3.9% 5.8% 0.7% 3.4% 4.6% 2.9% 5.1% 7.7%3 3.2% 6.4% 7.5% 3.3% 6.2% 7.2% 2.9% 6.3% 7.6% 7.6% 9.2% 9.7%4 4.8% 8.1% 8.7% 4.5% 7.4% 8.1% 4.7% 8.2% 8.8% 9.5% 13.8% 11.6%5 7.5% 8.7% 8.8% 9.0% 9.5% 8.9% 6.5% 8.2% 8.9% 6.7% 6.7% 8.0%6 7.8% 8.1% 8.3% 8.2% 7.7% 8.0% 7.7% 8.4% 8.5% 4.8% 9.7% 7.7%7-8 26.9% 21.9% 18.6% 26.1% 20.4% 17.7% 27.3% 22.9% 19.1% 32.4% 23.1% 19.9%9-10 20.0% 16.4% 13.7% 19.7% 16.4% 14.0% 20.6% 16.6% 13.8% 13.3% 10.8% 10.1%11 or more 27.5% 21.6% 20.5% 27.0% 22.7% 21.6% 28.3% 21.2% 20.3% 20.0% 14.9% 15.4%
Were you accepted by your first choice college? Yes 39.8% 52.9% 66.0% 34.5% 46.2% 60.1% 43.1% 57.1% 69.2% 51.4% 64.1% 73.2%Is this college your: First choice 31.5% 42.5% 55.8% 29.6% 40.3% 52.9% 32.5% 43.9% 57.4% 38.1% 47.7% 58.6%
Second choice 33.9% 30.9% 25.5% 32.7% 30.2% 25.6% 34.4% 31.0% 25.2% 41.0% 34.9% 28.7%Third choice 21.4% 16.4% 11.6% 22.6% 17.4% 12.5% 21.0% 16.0% 11.2% 13.3% 11.3% 8.0%Less than third choice 13.2% 10.3% 7.2% 15.1% 12.2% 9.1% 12.1% 9.1% 6.2% 7.6% 6.2% 4.7%
2020 CIRP Freshman SurveyFirst-time, Full-time Freshmen
College Choice
College Choice - These items illustrate the areas students may have considered in choosing to attend college in general, as well as a particular college.See also CIRP Construct: College Reputation Orientation. See also CIRP Theme: Financing College.
Total Men/Trans men Women/Trans women Non-binary, Genderqueer, Gender non-conforming, Identity not listed

Note: Significance * p<.05, ** p<.01, *** p<.001 Page 5 of 10 1A
University of California-San Diego Your Inst Comp 1 Comp 2 Your Inst Comp 1 Comp 2 Your Inst Comp 1 Comp 2 Your Inst Comp 1 Comp 2
2020 CIRP Freshman SurveyFirst-time, Full-time Freshmen
College Choice
College Choice - These items illustrate the areas students may have considered in choosing to attend college in general, as well as a particular college.See also CIRP Construct: College Reputation Orientation. See also CIRP Theme: Financing College.
Total Men/Trans men Women/Trans women Non-binary, Genderqueer, Gender non-conforming, Identity not listed
In deciding to go to college, how important to you was each of the following reasons?
To be able to get a better job Very important 83.2% 83.8% 82.0% 81.5% 82.1% 81.0% 84.6% 85.3% 82.9% 81.1% 81.4% 79.1%
Mean 2.81 2.82 2.80 2.80 2.80 2.79 2.83 2.84 2.81 2.77 2.78 2.76Standard deviation 0.43 0.43 0.45 0.44 0.44 0.46 0.42 0.41 0.44 0.51 0.49 0.50Significance - - - - Effect size - -0.02 0.02 - 0.00 0.02 - -0.02 0.05 - -0.02 0.02
In deciding to go to college, how important to you was each of the following reasons?
To gain a general education and appreciation of ideas Very important 79.4% 78.2% 79.8% 74.9% 73.5% 74.2% 82.9% 82.0% 83.5% 78.9% 76.2% 78.2%
Mean 2.78 2.77 2.78 2.73 2.71 2.72 2.82 2.81 2.83 2.77 2.74 2.76Standard deviation 0.45 0.46 0.44 0.50 0.50 0.49 0.40 0.41 0.40 0.47 0.48 0.48Significance - - - - Effect size - 0.02 0.00 - 0.04 0.02 - 0.02 -0.03 - 0.06 0.02
To make me a more cultured person Very important 57.8% 55.8% 60.5% 49.1% 46.1% 50.3% 64.1% 62.7% 66.8% 61.1% 59.3% 63.3%
Mean 2.50 2.47 2.54 2.37 2.32 2.39 2.60 2.58 2.63 2.55 2.52 2.56Standard deviation 0.63 0.65 0.62 0.69 0.70 0.68 0.57 0.58 0.56 0.61 0.63 0.62Significance - * ** - - - Effect size - 0.05 -0.06 - 0.07 -0.03 - 0.03 -0.05 - 0.05 -0.02
To be able to make more money Very important 68.9% 68.0% 63.5% 71.2% 69.9% 66.9% 67.9% 66.7% 61.5% 56.8% 64.0% 62.7%
Mean 2.66 2.64 2.59 2.68 2.66 2.63 2.65 2.63 2.57 2.46 2.56 2.55Standard deviation 0.54 0.55 0.58 0.53 0.54 0.56 0.54 0.56 0.59 0.68 0.64 0.63Significance - *** - ** - *** - Effect size - 0.04 0.12 - 0.04 0.09 - 0.04 0.14 - -0.16 -0.14
Note: Significance * p<.05, ** p<.01, *** p<.001 Page 6 of 10 1A
University of California-San Diego Your Inst Comp 1 Comp 2 Your Inst Comp 1 Comp 2 Your Inst Comp 1 Comp 2 Your Inst Comp 1 Comp 2
2020 CIRP Freshman SurveyFirst-time, Full-time Freshmen
College Choice
College Choice - These items illustrate the areas students may have considered in choosing to attend college in general, as well as a particular college.See also CIRP Construct: College Reputation Orientation. See also CIRP Theme: Financing College.
Total Men/Trans men Women/Trans women Non-binary, Genderqueer, Gender non-conforming, Identity not listed
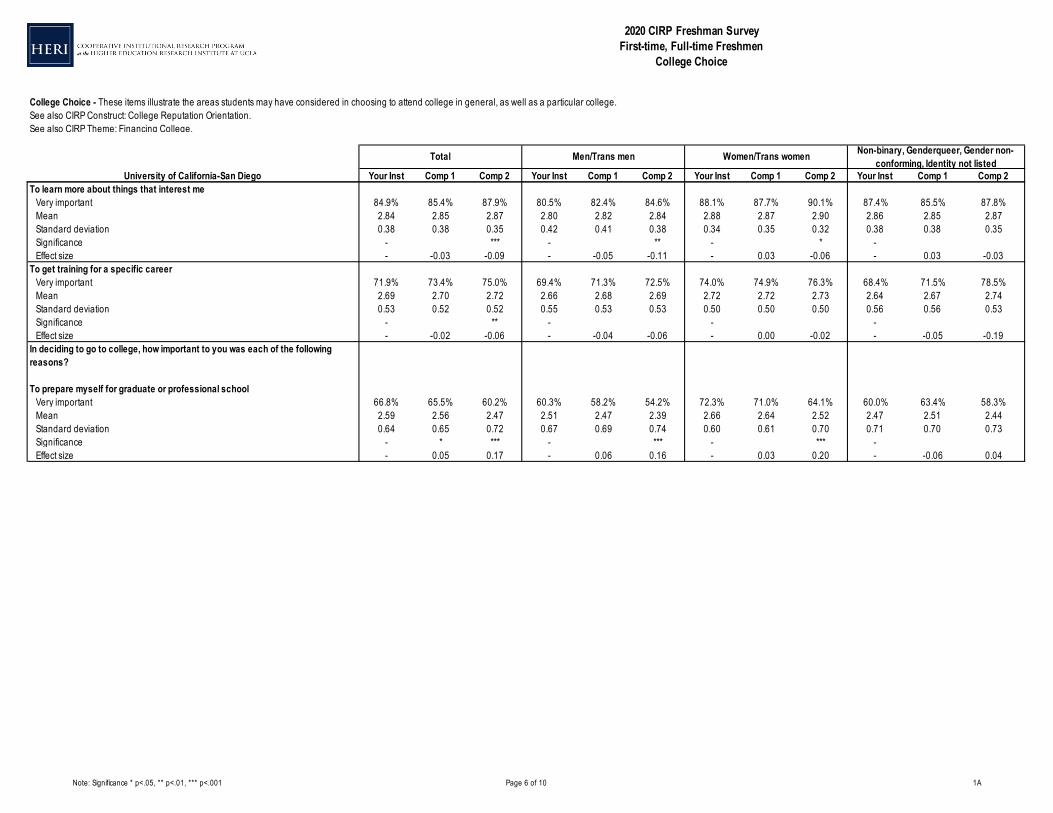
To learn more about things that interest me Very important 84.9% 85.4% 87.9% 80.5% 82.4% 84.6% 88.1% 87.7% 90.1% 87.4% 85.5% 87.8%
Mean 2.84 2.85 2.87 2.80 2.82 2.84 2.88 2.87 2.90 2.86 2.85 2.87Standard deviation 0.38 0.38 0.35 0.42 0.41 0.38 0.34 0.35 0.32 0.38 0.38 0.35Significance - *** - ** - * - Effect size - -0.03 -0.09 - -0.05 -0.11 - 0.03 -0.06 - 0.03 -0.03
To get training for a specific career Very important 71.9% 73.4% 75.0% 69.4% 71.3% 72.5% 74.0% 74.9% 76.3% 68.4% 71.5% 78.5%
Mean 2.69 2.70 2.72 2.66 2.68 2.69 2.72 2.72 2.73 2.64 2.67 2.74Standard deviation 0.53 0.52 0.52 0.55 0.53 0.53 0.50 0.50 0.50 0.56 0.56 0.53Significance - ** - - - Effect size - -0.02 -0.06 - -0.04 -0.06 - 0.00 -0.02 - -0.05 -0.19
In deciding to go to college, how important to you was each of the following reasons?
To prepare myself for graduate or professional school Very important 66.8% 65.5% 60.2% 60.3% 58.2% 54.2% 72.3% 71.0% 64.1% 60.0% 63.4% 58.3%
Mean 2.59 2.56 2.47 2.51 2.47 2.39 2.66 2.64 2.52 2.47 2.51 2.44Standard deviation 0.64 0.65 0.72 0.67 0.69 0.74 0.60 0.61 0.70 0.71 0.70 0.73Significance - * *** - *** - *** - Effect size - 0.05 0.17 - 0.06 0.16 - 0.03 0.20 - -0.06 0.04

Note: Significance * p<.05, ** p<.01, *** p<.001 Page 7 of 10 1A
University of California-San Diego Your Inst Comp 1 Comp 2 Your Inst Comp 1 Comp 2 Your Inst Comp 1 Comp 2 Your Inst Comp 1 Comp 2
2020 CIRP Freshman SurveyFirst-time, Full-time Freshmen
College Choice
College Choice - These items illustrate the areas students may have considered in choosing to attend college in general, as well as a particular college.See also CIRP Construct: College Reputation Orientation. See also CIRP Theme: Financing College.
Total Men/Trans men Women/Trans women Non-binary, Genderqueer, Gender non-conforming, Identity not listed
To please my family Very important 35.4% 31.8% 28.1% 33.8% 29.2% 27.1% 36.8% 33.3% 28.4% 29.5% 37.2% 32.7%
Mean 2.17 2.08 2.01 2.13 2.02 1.98 2.20 2.13 2.03 2.02 2.14 2.04Standard deviation 0.72 0.74 0.74 0.72 0.75 0.75 0.71 0.72 0.73 0.76 0.77 0.78Significance - *** *** - *** *** - ** *** - Effect size - 0.12 0.22 - 0.15 0.20 - 0.10 0.23 - -0.16 -0.03
How important was each reason in your decision to come here?
My parents/relatives wanted me to come here Very Important 16.6% 16.6% 13.9% 15.7% 14.9% 12.7% 17.2% 18.1% 14.6% 18.7% 15.3% 15.7%
Mean 1.84 1.82 1.74 1.80 1.77 1.70 1.86 1.85 1.76 1.79 1.76 1.71Standard deviation 0.69 0.70 0.69 0.69 0.69 0.68 0.68 0.70 0.69 0.74 0.70 0.72Significance - *** - *** - *** - Effect size - 0.03 0.14 - 0.04 0.15 - 0.01 0.14 - 0.04 0.11
My teacher advised me Very important 4.7% 4.9% 4.2% 5.3% 5.3% 4.5% 4.5% 4.7% 3.9% 3.3% 3.1% 6.6%
Mean 1.41 1.41 1.36 1.43 1.42 1.38 1.39 1.40 1.35 1.47 1.40 1.44Standard deviation 0.58 0.58 0.56 0.59 0.59 0.57 0.57 0.58 0.55 0.56 0.55 0.61Significance - *** - ** - ** - Effect size - 0.00 0.09 - 0.02 0.09 - -0.02 0.07 - 0.13 0.05
Note: Significance * p<.05, ** p<.01, *** p<.001 Page 8 of 10 1A
University of California-San Diego Your Inst Comp 1 Comp 2 Your Inst Comp 1 Comp 2 Your Inst Comp 1 Comp 2 Your Inst Comp 1 Comp 2
2020 CIRP Freshman SurveyFirst-time, Full-time Freshmen
College Choice
College Choice - These items illustrate the areas students may have considered in choosing to attend college in general, as well as a particular college.See also CIRP Construct: College Reputation Orientation. See also CIRP Theme: Financing College.
Total Men/Trans men Women/Trans women Non-binary, Genderqueer, Gender non-conforming, Identity not listed
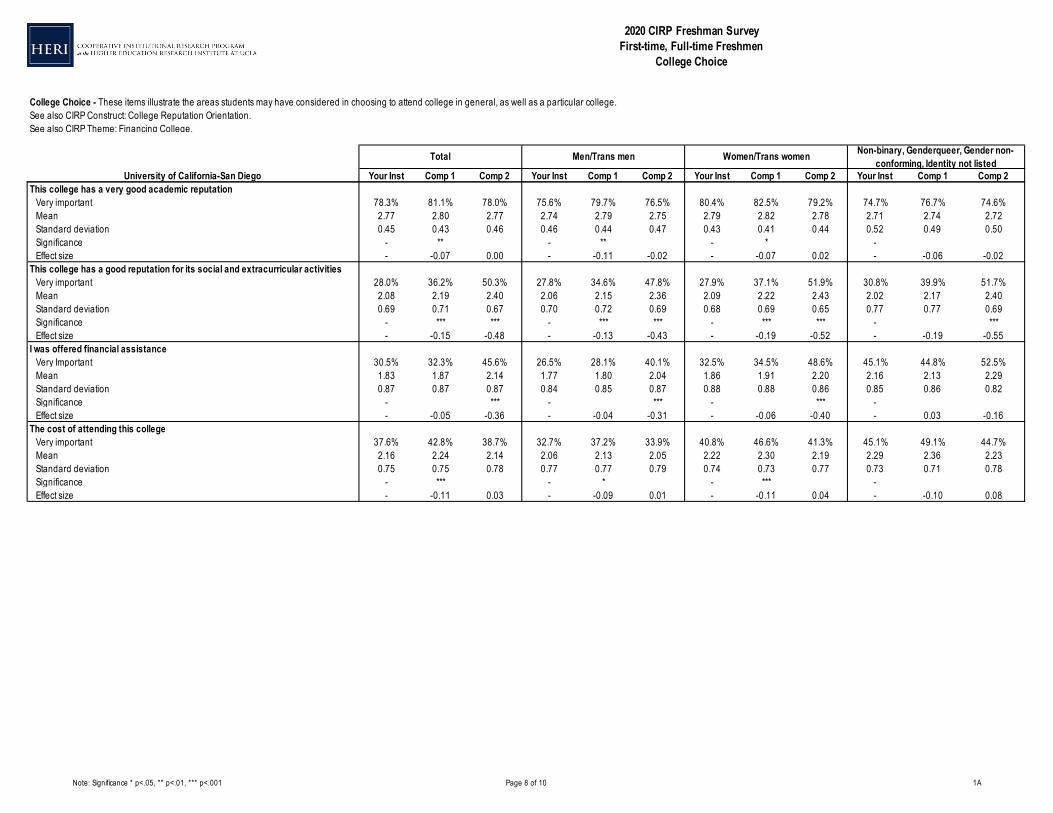
This college has a very good academic reputation Very important 78.3% 81.1% 78.0% 75.6% 79.7% 76.5% 80.4% 82.5% 79.2% 74.7% 76.7% 74.6%
Mean 2.77 2.80 2.77 2.74 2.79 2.75 2.79 2.82 2.78 2.71 2.74 2.72Standard deviation 0.45 0.43 0.46 0.46 0.44 0.47 0.43 0.41 0.44 0.52 0.49 0.50Significance - ** - ** - * - Effect size - -0.07 0.00 - -0.11 -0.02 - -0.07 0.02 - -0.06 -0.02
This college has a good reputation for its social and extracurricular activities Very important 28.0% 36.2% 50.3% 27.8% 34.6% 47.8% 27.9% 37.1% 51.9% 30.8% 39.9% 51.7%
Mean 2.08 2.19 2.40 2.06 2.15 2.36 2.09 2.22 2.43 2.02 2.17 2.40Standard deviation 0.69 0.71 0.67 0.70 0.72 0.69 0.68 0.69 0.65 0.77 0.77 0.69Significance - *** *** - *** *** - *** *** - ***Effect size - -0.15 -0.48 - -0.13 -0.43 - -0.19 -0.52 - -0.19 -0.55
I was offered financial assistance Very Important 30.5% 32.3% 45.6% 26.5% 28.1% 40.1% 32.5% 34.5% 48.6% 45.1% 44.8% 52.5%
Mean 1.83 1.87 2.14 1.77 1.80 2.04 1.86 1.91 2.20 2.16 2.13 2.29Standard deviation 0.87 0.87 0.87 0.84 0.85 0.87 0.88 0.88 0.86 0.85 0.86 0.82Significance - *** - *** - *** - Effect size - -0.05 -0.36 - -0.04 -0.31 - -0.06 -0.40 - 0.03 -0.16
The cost of attending this college Very important 37.6% 42.8% 38.7% 32.7% 37.2% 33.9% 40.8% 46.6% 41.3% 45.1% 49.1% 44.7%
Mean 2.16 2.24 2.14 2.06 2.13 2.05 2.22 2.30 2.19 2.29 2.36 2.23Standard deviation 0.75 0.75 0.78 0.77 0.77 0.79 0.74 0.73 0.77 0.73 0.71 0.78Significance - *** - * - *** - Effect size - -0.11 0.03 - -0.09 0.01 - -0.11 0.04 - -0.10 0.08
Note: Significance * p<.05, ** p<.01, *** p<.001 Page 9 of 10 1A
University of California-San Diego Your Inst Comp 1 Comp 2 Your Inst Comp 1 Comp 2 Your Inst Comp 1 Comp 2 Your Inst Comp 1 Comp 2
2020 CIRP Freshman SurveyFirst-time, Full-time Freshmen
College Choice
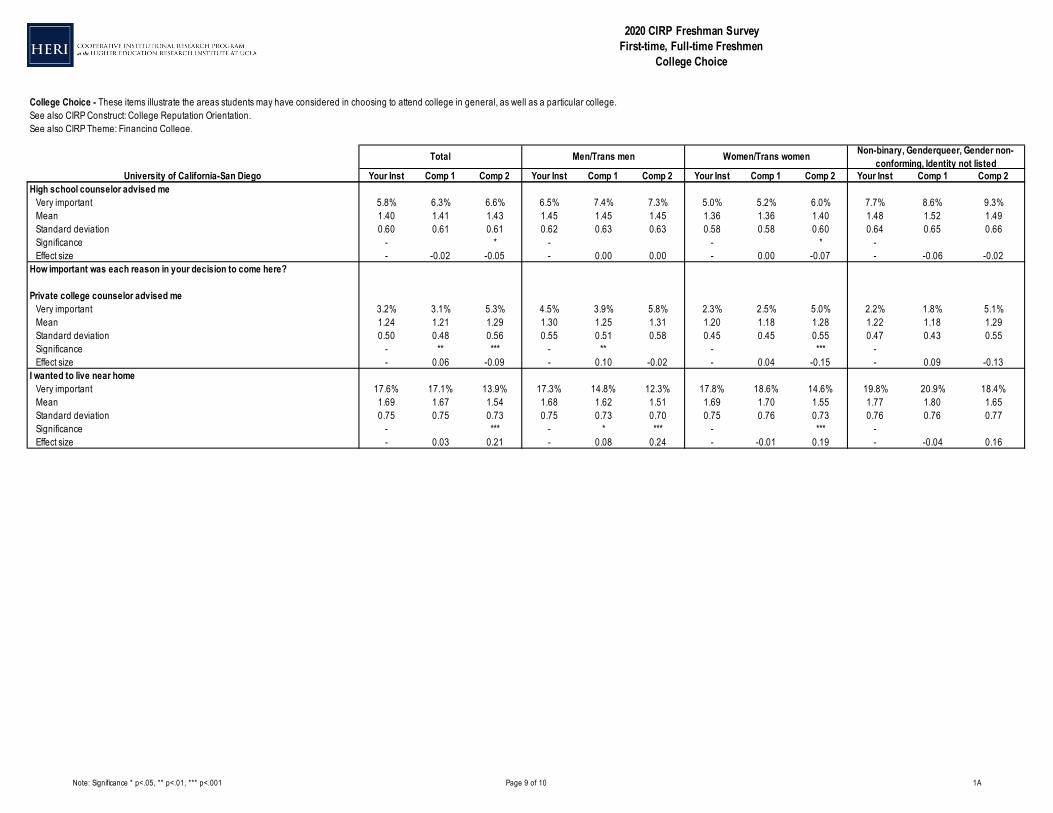
College Choice - These items illustrate the areas students may have considered in choosing to attend college in general, as well as a particular college.See also CIRP Construct: College Reputation Orientation. See also CIRP Theme: Financing College.
Total Men/Trans men Women/Trans women Non-binary, Genderqueer, Gender non-conforming, Identity not listed
High school counselor advised me Very important 5.8% 6.3% 6.6% 6.5% 7.4% 7.3% 5.0% 5.2% 6.0% 7.7% 8.6% 9.3%
Mean 1.40 1.41 1.43 1.45 1.45 1.45 1.36 1.36 1.40 1.48 1.52 1.49Standard deviation 0.60 0.61 0.61 0.62 0.63 0.63 0.58 0.58 0.60 0.64 0.65 0.66Significance - * - - * - Effect size - -0.02 -0.05 - 0.00 0.00 - 0.00 -0.07 - -0.06 -0.02
How important was each reason in your decision to come here?
Private college counselor advised me Very important 3.2% 3.1% 5.3% 4.5% 3.9% 5.8% 2.3% 2.5% 5.0% 2.2% 1.8% 5.1%
Mean 1.24 1.21 1.29 1.30 1.25 1.31 1.20 1.18 1.28 1.22 1.18 1.29Standard deviation 0.50 0.48 0.56 0.55 0.51 0.58 0.45 0.45 0.55 0.47 0.43 0.55Significance - ** *** - ** - *** - Effect size - 0.06 -0.09 - 0.10 -0.02 - 0.04 -0.15 - 0.09 -0.13
I wanted to live near home Very important 17.6% 17.1% 13.9% 17.3% 14.8% 12.3% 17.8% 18.6% 14.6% 19.8% 20.9% 18.4%
Mean 1.69 1.67 1.54 1.68 1.62 1.51 1.69 1.70 1.55 1.77 1.80 1.65Standard deviation 0.75 0.75 0.73 0.75 0.73 0.70 0.75 0.76 0.73 0.76 0.76 0.77Significance - *** - * *** - *** - Effect size - 0.03 0.21 - 0.08 0.24 - -0.01 0.19 - -0.04 0.16
Note: Significance * p<.05, ** p<.01, *** p<.001 Page 10 of 10 1A
University of California-San Diego Your Inst Comp 1 Comp 2 Your Inst Comp 1 Comp 2 Your Inst Comp 1 Comp 2 Your Inst Comp 1 Comp 2
2020 CIRP Freshman SurveyFirst-time, Full-time Freshmen
College Choice
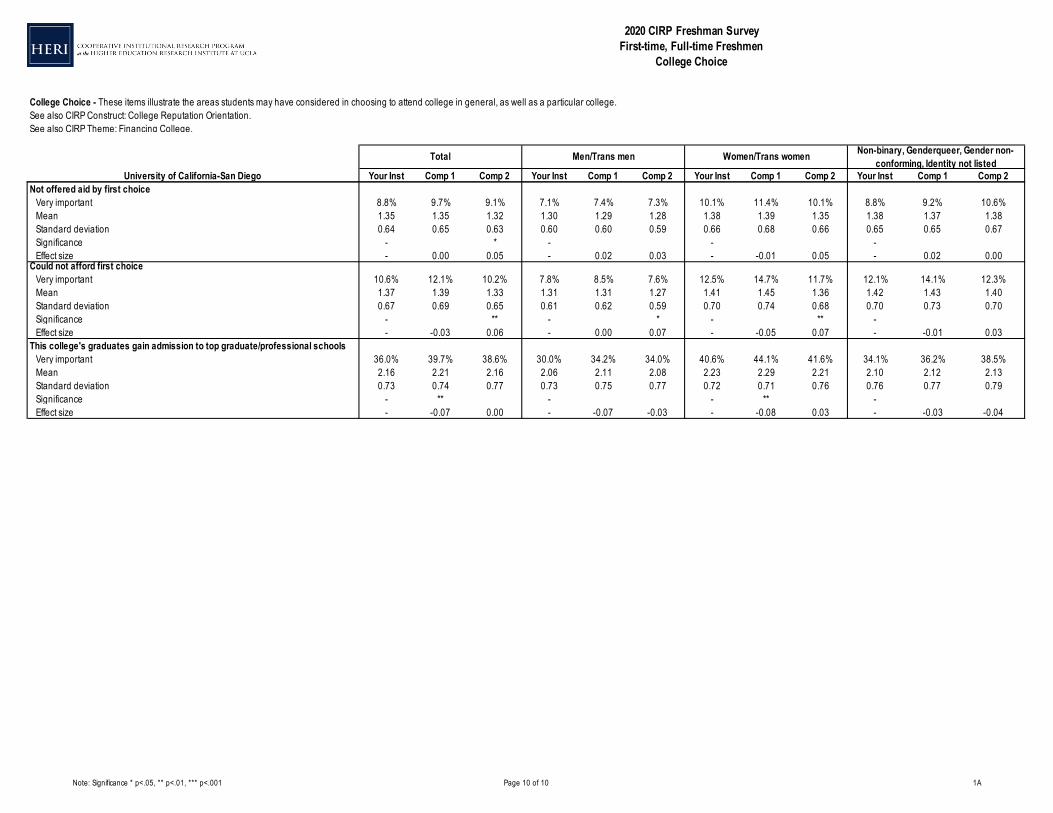
College Choice - These items illustrate the areas students may have considered in choosing to attend college in general, as well as a particular college.See also CIRP Construct: College Reputation Orientation. See also CIRP Theme: Financing College.
Total Men/Trans men Women/Trans women Non-binary, Genderqueer, Gender non-conforming, Identity not listed
Not offered aid by first choice Very important 8.8% 9.7% 9.1% 7.1% 7.4% 7.3% 10.1% 11.4% 10.1% 8.8% 9.2% 10.6%
Mean 1.35 1.35 1.32 1.30 1.29 1.28 1.38 1.39 1.35 1.38 1.37 1.38Standard deviation 0.64 0.65 0.63 0.60 0.60 0.59 0.66 0.68 0.66 0.65 0.65 0.67Significance - * - - - Effect size - 0.00 0.05 - 0.02 0.03 - -0.01 0.05 - 0.02 0.00
Could not afford first choice Very important 10.6% 12.1% 10.2% 7.8% 8.5% 7.6% 12.5% 14.7% 11.7% 12.1% 14.1% 12.3%
Mean 1.37 1.39 1.33 1.31 1.31 1.27 1.41 1.45 1.36 1.42 1.43 1.40Standard deviation 0.67 0.69 0.65 0.61 0.62 0.59 0.70 0.74 0.68 0.70 0.73 0.70Significance - ** - * - ** - Effect size - -0.03 0.06 - 0.00 0.07 - -0.05 0.07 - -0.01 0.03
This college's graduates gain admission to top graduate/professional schools Very important 36.0% 39.7% 38.6% 30.0% 34.2% 34.0% 40.6% 44.1% 41.6% 34.1% 36.2% 38.5%
Mean 2.16 2.21 2.16 2.06 2.11 2.08 2.23 2.29 2.21 2.10 2.12 2.13Standard deviation 0.73 0.74 0.77 0.73 0.75 0.77 0.72 0.71 0.76 0.76 0.77 0.79Significance - ** - - ** - Effect size - -0.07 0.00 - -0.07 -0.03 - -0.08 0.03 - -0.03 -0.04

Note: Significance * p<.05, ** p<.01, *** p<.001 Page 11 of 10 1A
University of California-San Diego Your Inst Comp 1 Comp 2 Your Inst Comp 1 Comp 2 Your Inst Comp 1 Comp 2 Your Inst Comp 1 Comp 2
2020 CIRP Freshman SurveyFirst-time, Full-time Freshmen
College Choice
College Choice - These items illustrate the areas students may have considered in choosing to attend college in general, as well as a particular college.See also CIRP Construct: College Reputation Orientation. See also CIRP Theme: Financing College.
Total Men/Trans men Women/Trans women Non-binary, Genderqueer, Gender non-conforming, Identity not listed
How important was each reason in your decision to come here?
This college's graduates get good jobs Very important 55.3% 62.7% 66.5% 50.9% 59.4% 62.7% 58.8% 65.2% 69.1% 50.5% 58.9% 64.2%
Mean 2.47 2.56 2.61 2.41 2.51 2.56 2.52 2.60 2.64 2.34 2.44 2.56Standard deviation 0.65 0.62 0.60 0.67 0.65 0.62 0.63 0.59 0.57 0.75 0.74 0.64Significance - *** *** - *** *** - *** *** - **Effect size - -0.15 -0.23 - -0.15 -0.24 - -0.14 -0.21 - -0.14 -0.34
I was attracted by the religious affiliation/orientation of this college Very important 1.8% 1.6% 8.3% 2.2% 1.7% 6.8% 1.6% 1.5% 9.2% 2.2% 1.8% 9.2%
Mean 1.12 1.12 1.32 1.14 1.12 1.28 1.11 1.12 1.34 1.20 1.18 1.37Standard deviation 0.38 0.37 0.62 0.40 0.38 0.58 0.36 0.36 0.64 0.45 0.43 0.65Significance - *** - *** - *** - *Effect size - 0.00 -0.32 - 0.05 -0.24 - -0.03 -0.36 - 0.05 -0.26
I wanted to go to a school about the size of this college Very important 16.0% 19.7% 34.5% 15.8% 17.5% 28.1% 16.0% 21.2% 38.6% 15.4% 20.2% 34.6%
Mean 1.83 1.89 2.14 1.83 1.85 2.04 1.82 1.91 2.20 1.81 1.85 2.12Standard deviation 0.68 0.70 0.73 0.68 0.69 0.72 0.68 0.71 0.73 0.68 0.73 0.74Significance - *** *** - *** - *** *** - ***Effect size - -0.09 -0.42 - -0.03 -0.29 - -0.13 -0.52 - -0.05 -0.42
Rankings in national magazines Very important 32.6% 33.7% 29.6% 33.2% 34.8% 31.0% 32.0% 33.0% 29.1% 34.1% 29.4% 25.4%
Mean 2.15 2.13 2.04 2.18 2.16 2.07 2.13 2.11 2.03 2.15 2.02 1.92Standard deviation 0.69 0.73 0.74 0.68 0.72 0.74 0.70 0.73 0.74 0.71 0.76 0.76Significance - *** - *** - *** - **Effect size - 0.03 0.15 - 0.03 0.15 - 0.03 0.14 - 0.17 0.30
Note: Significance * p<.05, ** p<.01, *** p<.001 Page 12 of 10 1A
University of California-San Diego Your Inst Comp 1 Comp 2 Your Inst Comp 1 Comp 2 Your Inst Comp 1 Comp 2 Your Inst Comp 1 Comp 2
2020 CIRP Freshman SurveyFirst-time, Full-time Freshmen
College Choice
College Choice - These items illustrate the areas students may have considered in choosing to attend college in general, as well as a particular college.See also CIRP Construct: College Reputation Orientation. See also CIRP Theme: Financing College.
Total Men/Trans men Women/Trans women Non-binary, Genderqueer, Gender non-conforming, Identity not listed
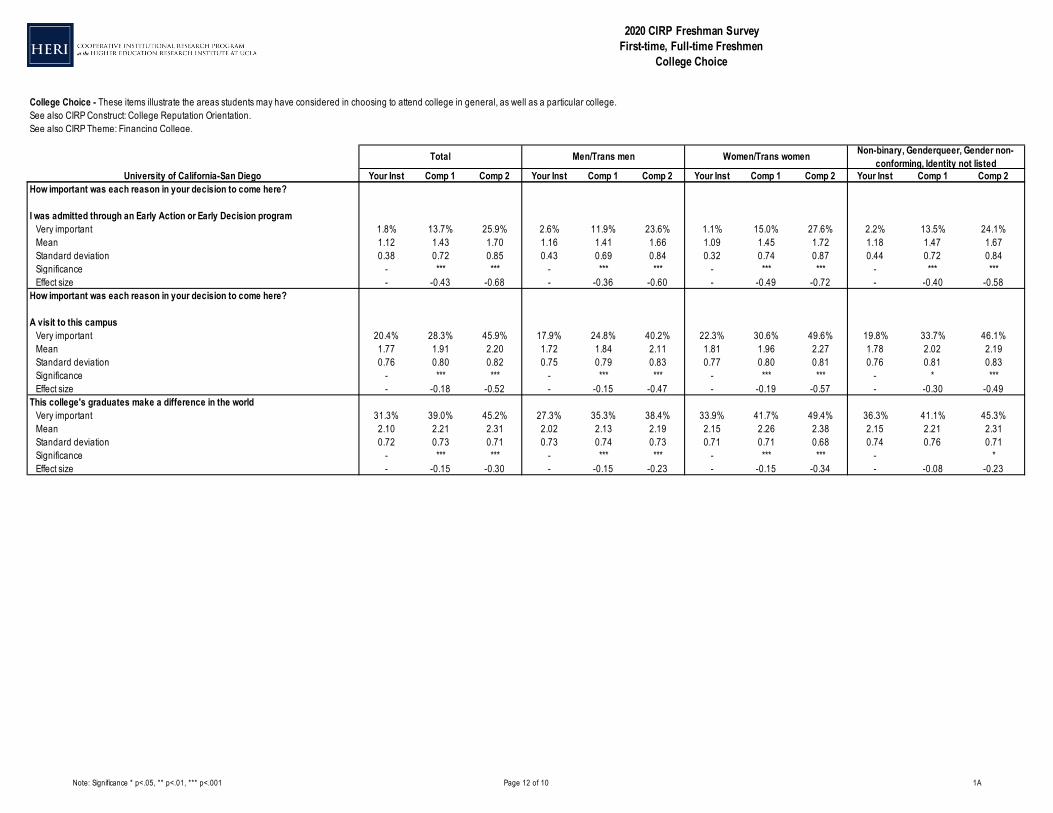
How important was each reason in your decision to come here?
I was admitted through an Early Action or Early Decision program Very important 1.8% 13.7% 25.9% 2.6% 11.9% 23.6% 1.1% 15.0% 27.6% 2.2% 13.5% 24.1%
Mean 1.12 1.43 1.70 1.16 1.41 1.66 1.09 1.45 1.72 1.18 1.47 1.67Standard deviation 0.38 0.72 0.85 0.43 0.69 0.84 0.32 0.74 0.87 0.44 0.72 0.84Significance - *** *** - *** *** - *** *** - *** ***Effect size - -0.43 -0.68 - -0.36 -0.60 - -0.49 -0.72 - -0.40 -0.58
How important was each reason in your decision to come here?
A visit to this campus Very important 20.4% 28.3% 45.9% 17.9% 24.8% 40.2% 22.3% 30.6% 49.6% 19.8% 33.7% 46.1%
Mean 1.77 1.91 2.20 1.72 1.84 2.11 1.81 1.96 2.27 1.78 2.02 2.19Standard deviation 0.76 0.80 0.82 0.75 0.79 0.83 0.77 0.80 0.81 0.76 0.81 0.83Significance - *** *** - *** *** - *** *** - * ***Effect size - -0.18 -0.52 - -0.15 -0.47 - -0.19 -0.57 - -0.30 -0.49
This college's graduates make a difference in the world Very important 31.3% 39.0% 45.2% 27.3% 35.3% 38.4% 33.9% 41.7% 49.4% 36.3% 41.1% 45.3%
Mean 2.10 2.21 2.31 2.02 2.13 2.19 2.15 2.26 2.38 2.15 2.21 2.31Standard deviation 0.72 0.73 0.71 0.73 0.74 0.73 0.71 0.71 0.68 0.74 0.76 0.71Significance - *** *** - *** *** - *** *** - *Effect size - -0.15 -0.30 - -0.15 -0.23 - -0.15 -0.34 - -0.08 -0.23
Note: Significance * p<.05, ** p<.01, *** p<.001 Page 13 of 5 1B
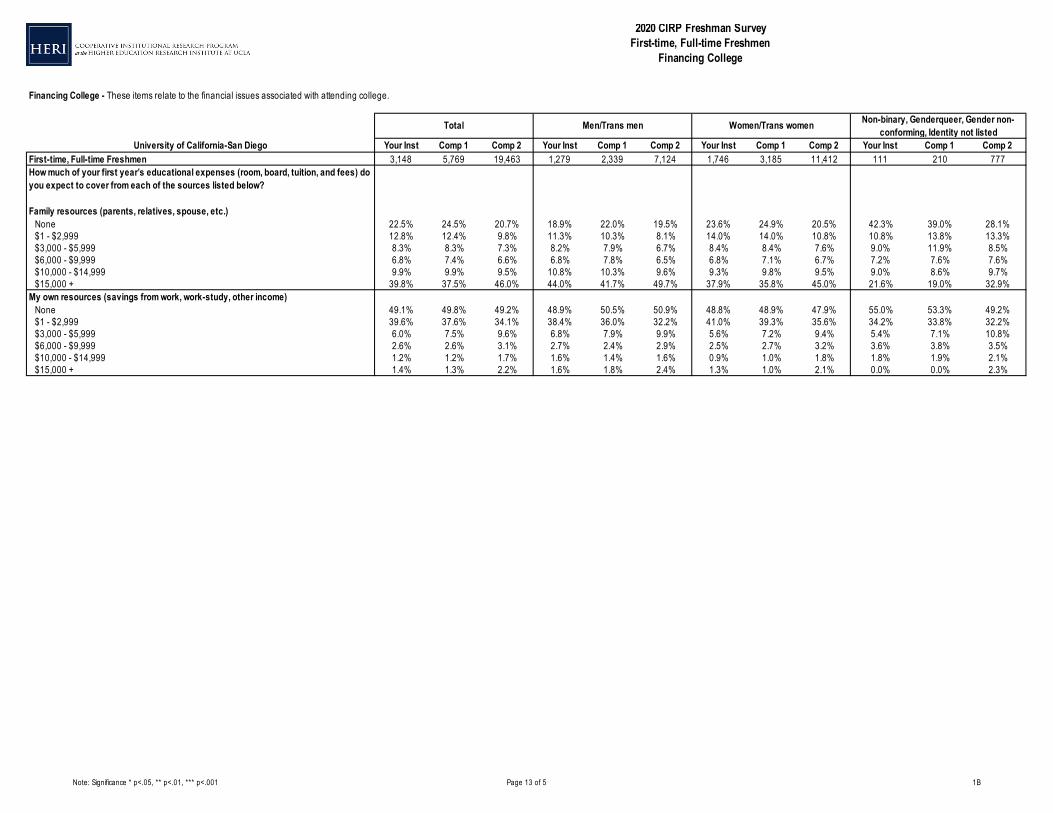
University of California-San Diego Your Inst Comp 1 Comp 2 Your Inst Comp 1 Comp 2 Your Inst Comp 1 Comp 2 Your Inst Comp 1 Comp 2First-time, Full-time Freshmen 3,148 5,769 19,463 1,279 2,339 7,124 1,746 3,185 11,412 111 210 777How much of your first year’s educational expenses (room, board, tuition, and fees) do you expect to cover from each of the sources listed below?
Family resources (parents, relatives, spouse, etc.) None 22.5% 24.5% 20.7% 18.9% 22.0% 19.5% 23.6% 24.9% 20.5% 42.3% 39.0% 28.1%
$1 - $2,999 12.8% 12.4% 9.8% 11.3% 10.3% 8.1% 14.0% 14.0% 10.8% 10.8% 13.8% 13.3%$3,000 - $5,999 8.3% 8.3% 7.3% 8.2% 7.9% 6.7% 8.4% 8.4% 7.6% 9.0% 11.9% 8.5%$6,000 - $9,999 6.8% 7.4% 6.6% 6.8% 7.8% 6.5% 6.8% 7.1% 6.7% 7.2% 7.6% 7.6%$10,000 - $14,999 9.9% 9.9% 9.5% 10.8% 10.3% 9.6% 9.3% 9.8% 9.5% 9.0% 8.6% 9.7%$15,000 + 39.8% 37.5% 46.0% 44.0% 41.7% 49.7% 37.9% 35.8% 45.0% 21.6% 19.0% 32.9%
My own resources (savings from work, work-study, other income) None 49.1% 49.8% 49.2% 48.9% 50.5% 50.9% 48.8% 48.9% 47.9% 55.0% 53.3% 49.2%
$1 - $2,999 39.6% 37.6% 34.1% 38.4% 36.0% 32.2% 41.0% 39.3% 35.6% 34.2% 33.8% 32.2%$3,000 - $5,999 6.0% 7.5% 9.6% 6.8% 7.9% 9.9% 5.6% 7.2% 9.4% 5.4% 7.1% 10.8%$6,000 - $9,999 2.6% 2.6% 3.1% 2.7% 2.4% 2.9% 2.5% 2.7% 3.2% 3.6% 3.8% 3.5%$10,000 - $14,999 1.2% 1.2% 1.7% 1.6% 1.4% 1.6% 0.9% 1.0% 1.8% 1.8% 1.9% 2.1%$15,000 + 1.4% 1.3% 2.2% 1.6% 1.8% 2.4% 1.3% 1.0% 2.1% 0.0% 0.0% 2.3%
Total Men/Trans men Non-binary, Genderqueer, Gender non-conforming, Identity not listed
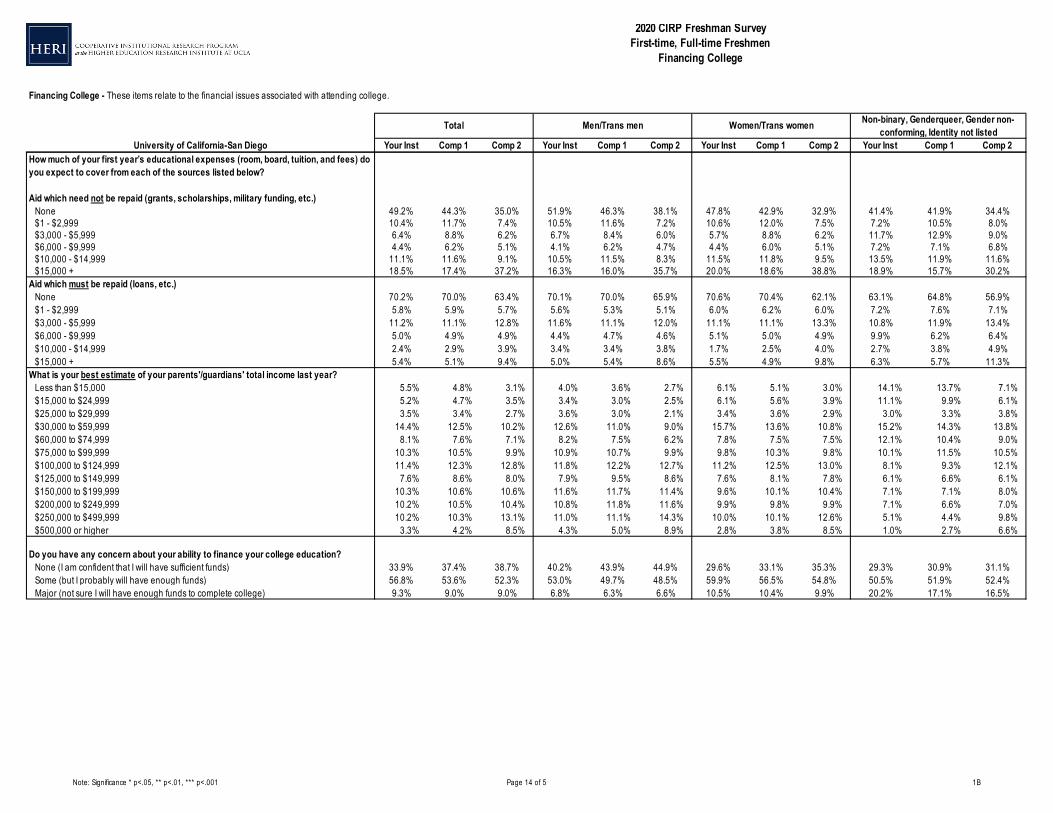
Financing College - These items relate to the financial issues associated with attending college.
2020 CIRP Freshman SurveyFirst-time, Full-time Freshmen
Financing College
Women/Trans women
Note: Significance * p<.05, ** p<.01, *** p<.001 Page 14 of 5 1B
University of California-San Diego Your Inst Comp 1 Comp 2 Your Inst Comp 1 Comp 2 Your Inst Comp 1 Comp 2 Your Inst Comp 1 Comp 2
Total Men/Trans men Non-binary, Genderqueer, Gender non-conforming, Identity not listed
Financing College - These items relate to the financial issues associated with attending college.
2020 CIRP Freshman SurveyFirst-time, Full-time Freshmen
Financing College
Women/Trans women
How much of your first year’s educational expenses (room, board, tuition, and fees) do you expect to cover from each of the sources listed below?
Aid which need not be repaid (grants, scholarships, military funding, etc.) None 49.2% 44.3% 35.0% 51.9% 46.3% 38.1% 47.8% 42.9% 32.9% 41.4% 41.9% 34.4%
$1 - $2,999 10.4% 11.7% 7.4% 10.5% 11.6% 7.2% 10.6% 12.0% 7.5% 7.2% 10.5% 8.0%$3,000 - $5,999 6.4% 8.8% 6.2% 6.7% 8.4% 6.0% 5.7% 8.8% 6.2% 11.7% 12.9% 9.0%$6,000 - $9,999 4.4% 6.2% 5.1% 4.1% 6.2% 4.7% 4.4% 6.0% 5.1% 7.2% 7.1% 6.8%$10,000 - $14,999 11.1% 11.6% 9.1% 10.5% 11.5% 8.3% 11.5% 11.8% 9.5% 13.5% 11.9% 11.6%$15,000 + 18.5% 17.4% 37.2% 16.3% 16.0% 35.7% 20.0% 18.6% 38.8% 18.9% 15.7% 30.2%
Aid which must be repaid (loans, etc.) None 70.2% 70.0% 63.4% 70.1% 70.0% 65.9% 70.6% 70.4% 62.1% 63.1% 64.8% 56.9%
$1 - $2,999 5.8% 5.9% 5.7% 5.6% 5.3% 5.1% 6.0% 6.2% 6.0% 7.2% 7.6% 7.1%$3,000 - $5,999 11.2% 11.1% 12.8% 11.6% 11.1% 12.0% 11.1% 11.1% 13.3% 10.8% 11.9% 13.4%$6,000 - $9,999 5.0% 4.9% 4.9% 4.4% 4.7% 4.6% 5.1% 5.0% 4.9% 9.9% 6.2% 6.4%$10,000 - $14,999 2.4% 2.9% 3.9% 3.4% 3.4% 3.8% 1.7% 2.5% 4.0% 2.7% 3.8% 4.9%$15,000 + 5.4% 5.1% 9.4% 5.0% 5.4% 8.6% 5.5% 4.9% 9.8% 6.3% 5.7% 11.3%
What is your best estimate of your parents'/guardians' total income last year? Less than $15,000 5.5% 4.8% 3.1% 4.0% 3.6% 2.7% 6.1% 5.1% 3.0% 14.1% 13.7% 7.1%
$15,000 to $24,999 5.2% 4.7% 3.5% 3.4% 3.0% 2.5% 6.1% 5.6% 3.9% 11.1% 9.9% 6.1%$25,000 to $29,999 3.5% 3.4% 2.7% 3.6% 3.0% 2.1% 3.4% 3.6% 2.9% 3.0% 3.3% 3.8%$30,000 to $59,999 14.4% 12.5% 10.2% 12.6% 11.0% 9.0% 15.7% 13.6% 10.8% 15.2% 14.3% 13.8%$60,000 to $74,999 8.1% 7.6% 7.1% 8.2% 7.5% 6.2% 7.8% 7.5% 7.5% 12.1% 10.4% 9.0%$75,000 to $99,999 10.3% 10.5% 9.9% 10.9% 10.7% 9.9% 9.8% 10.3% 9.8% 10.1% 11.5% 10.5%$100,000 to $124,999 11.4% 12.3% 12.8% 11.8% 12.2% 12.7% 11.2% 12.5% 13.0% 8.1% 9.3% 12.1%$125,000 to $149,999 7.6% 8.6% 8.0% 7.9% 9.5% 8.6% 7.6% 8.1% 7.8% 6.1% 6.6% 6.1%$150,000 to $199,999 10.3% 10.6% 10.6% 11.6% 11.7% 11.4% 9.6% 10.1% 10.4% 7.1% 7.1% 8.0%$200,000 to $249,999 10.2% 10.5% 10.4% 10.8% 11.8% 11.6% 9.9% 9.8% 9.9% 7.1% 6.6% 7.0%$250,000 to $499,999 10.2% 10.3% 13.1% 11.0% 11.1% 14.3% 10.0% 10.1% 12.6% 5.1% 4.4% 9.8%$500,000 or higher 3.3% 4.2% 8.5% 4.3% 5.0% 8.9% 2.8% 3.8% 8.5% 1.0% 2.7% 6.6%
Do you have any concern about your ability to finance your college education? None (I am confident that I will have sufficient funds) 33.9% 37.4% 38.7% 40.2% 43.9% 44.9% 29.6% 33.1% 35.3% 29.3% 30.9% 31.1%
Some (but I probably will have enough funds) 56.8% 53.6% 52.3% 53.0% 49.7% 48.5% 59.9% 56.5% 54.8% 50.5% 51.9% 52.4%Major (not sure I will have enough funds to complete college) 9.3% 9.0% 9.0% 6.8% 6.3% 6.6% 10.5% 10.4% 9.9% 20.2% 17.1% 16.5%
Note: Significance * p<.05, ** p<.01, *** p<.001 Page 15 of 5 1B
University of California-San Diego Your Inst Comp 1 Comp 2 Your Inst Comp 1 Comp 2 Your Inst Comp 1 Comp 2 Your Inst Comp 1 Comp 2
Total Men/Trans men Non-binary, Genderqueer, Gender non-conforming, Identity not listed
Financing College - These items relate to the financial issues associated with attending college.
2020 CIRP Freshman SurveyFirst-time, Full-time Freshmen
Financing College
Women/Trans women
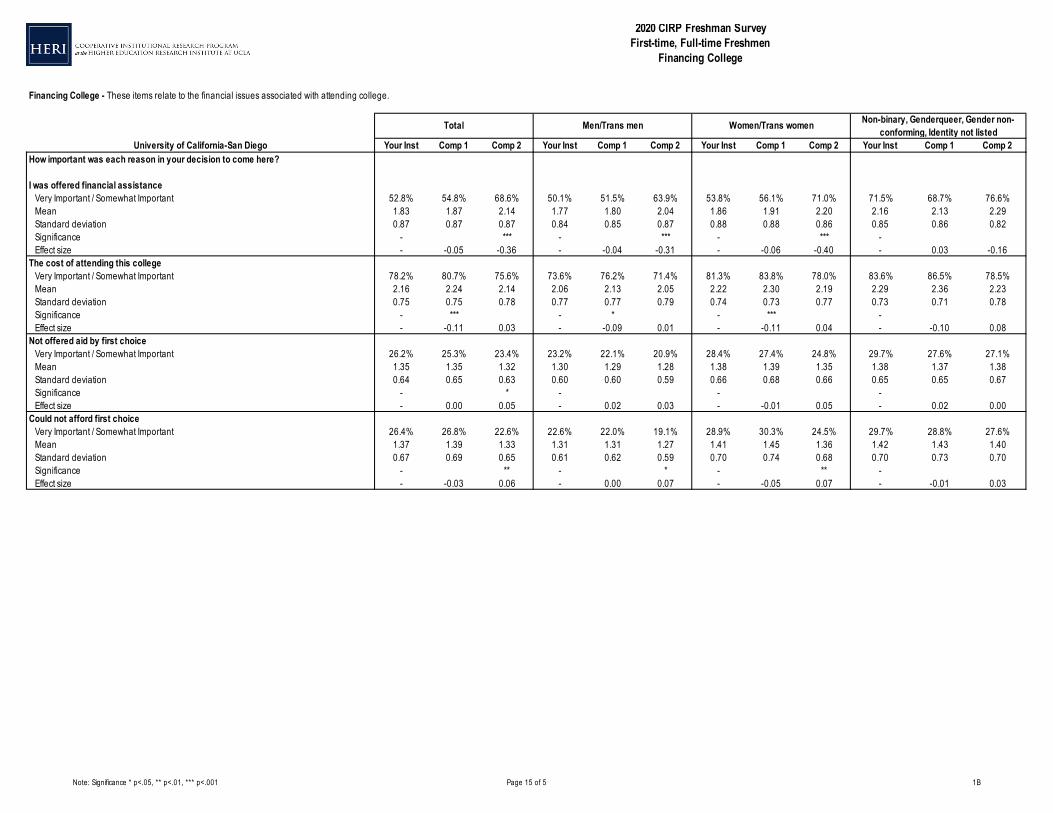
How important was each reason in your decision to come here?
I was offered financial assistance Very Important / Somewhat Important 52.8% 54.8% 68.6% 50.1% 51.5% 63.9% 53.8% 56.1% 71.0% 71.5% 68.7% 76.6%
Mean 1.83 1.87 2.14 1.77 1.80 2.04 1.86 1.91 2.20 2.16 2.13 2.29Standard deviation 0.87 0.87 0.87 0.84 0.85 0.87 0.88 0.88 0.86 0.85 0.86 0.82Significance - *** - *** - *** - Effect size - -0.05 -0.36 - -0.04 -0.31 - -0.06 -0.40 - 0.03 -0.16
The cost of attending this college Very Important / Somewhat Important 78.2% 80.7% 75.6% 73.6% 76.2% 71.4% 81.3% 83.8% 78.0% 83.6% 86.5% 78.5%
Mean 2.16 2.24 2.14 2.06 2.13 2.05 2.22 2.30 2.19 2.29 2.36 2.23Standard deviation 0.75 0.75 0.78 0.77 0.77 0.79 0.74 0.73 0.77 0.73 0.71 0.78Significance - *** - * - *** - Effect size - -0.11 0.03 - -0.09 0.01 - -0.11 0.04 - -0.10 0.08
Not offered aid by first choice Very Important / Somewhat Important 26.2% 25.3% 23.4% 23.2% 22.1% 20.9% 28.4% 27.4% 24.8% 29.7% 27.6% 27.1%
Mean 1.35 1.35 1.32 1.30 1.29 1.28 1.38 1.39 1.35 1.38 1.37 1.38Standard deviation 0.64 0.65 0.63 0.60 0.60 0.59 0.66 0.68 0.66 0.65 0.65 0.67Significance - * - - - Effect size - 0.00 0.05 - 0.02 0.03 - -0.01 0.05 - 0.02 0.00
Could not afford first choice Very Important / Somewhat Important 26.4% 26.8% 22.6% 22.6% 22.0% 19.1% 28.9% 30.3% 24.5% 29.7% 28.8% 27.6%
Mean 1.37 1.39 1.33 1.31 1.31 1.27 1.41 1.45 1.36 1.42 1.43 1.40Standard deviation 0.67 0.69 0.65 0.61 0.62 0.59 0.70 0.74 0.68 0.70 0.73 0.70Significance - ** - * - ** - Effect size - -0.03 0.06 - 0.00 0.07 - -0.05 0.07 - -0.01 0.03
Note: Significance * p<.05, ** p<.01, *** p<.001 Page 16 of 5 1B
University of California-San Diego Your Inst Comp 1 Comp 2 Your Inst Comp 1 Comp 2 Your Inst Comp 1 Comp 2 Your Inst Comp 1 Comp 2
Total Men/Trans men Non-binary, Genderqueer, Gender non-conforming, Identity not listed
Financing College - These items relate to the financial issues associated with attending college.
2020 CIRP Freshman SurveyFirst-time, Full-time Freshmen
Financing College
Women/Trans women
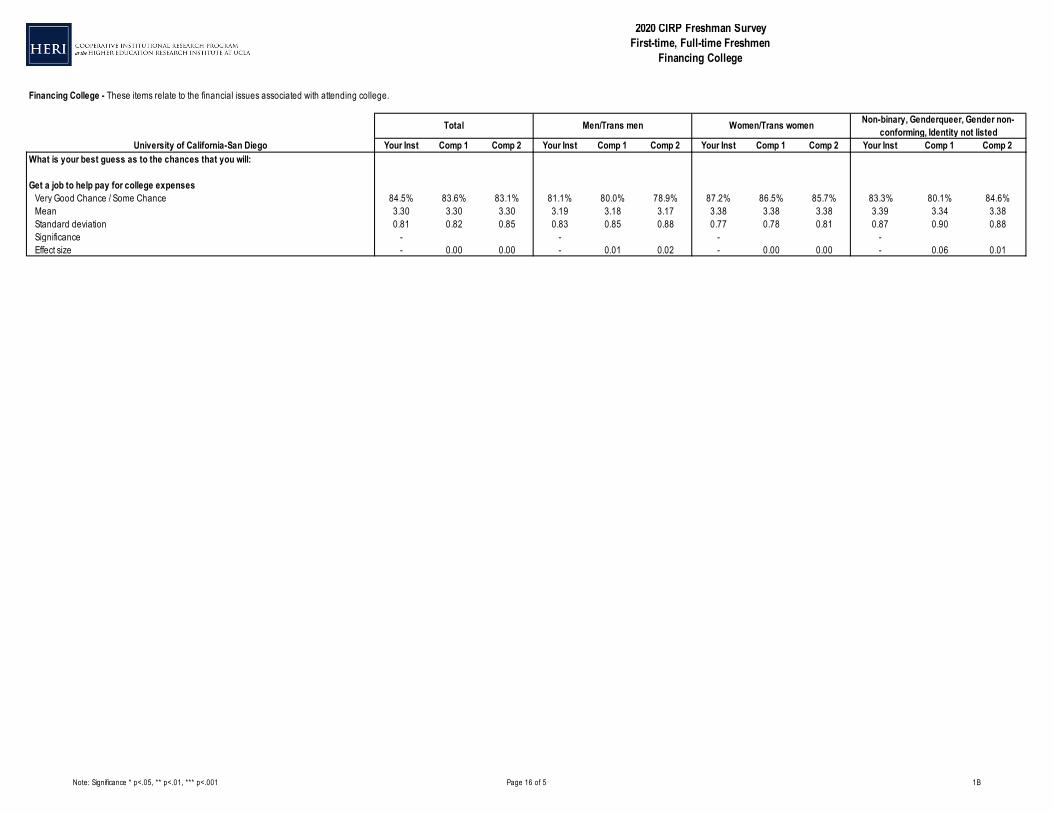
What is your best guess as to the chances that you will:
Get a job to help pay for college expenses Very Good Chance / Some Chance 84.5% 83.6% 83.1% 81.1% 80.0% 78.9% 87.2% 86.5% 85.7% 83.3% 80.1% 84.6%
Mean 3.30 3.30 3.30 3.19 3.18 3.17 3.38 3.38 3.38 3.39 3.34 3.38Standard deviation 0.81 0.82 0.85 0.83 0.85 0.88 0.77 0.78 0.81 0.87 0.90 0.88Significance - - - - Effect size - 0.00 0.00 - 0.01 0.02 - 0.00 0.00 - 0.06 0.01
Note: Significance * p<.05, ** p<.01, *** p<.001 Page 17 of 1 1C
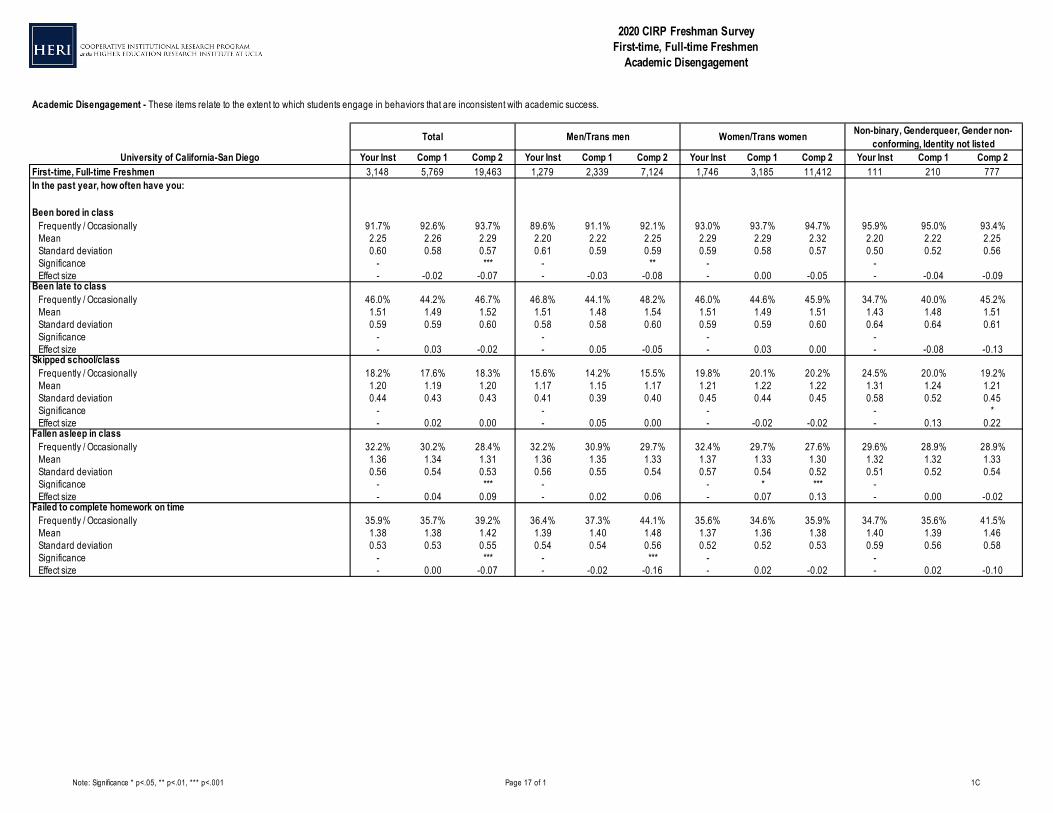
University of California-San Diego Your Inst Comp 1 Comp 2 Your Inst Comp 1 Comp 2 Your Inst Comp 1 Comp 2 Your Inst Comp 1 Comp 2First-time, Full-time Freshmen 3,148 5,769 19,463 1,279 2,339 7,124 1,746 3,185 11,412 111 210 777In the past year, how often have you:
Been bored in class Frequently / Occasionally 91.7% 92.6% 93.7% 89.6% 91.1% 92.1% 93.0% 93.7% 94.7% 95.9% 95.0% 93.4%
Mean 2.25 2.26 2.29 2.20 2.22 2.25 2.29 2.29 2.32 2.20 2.22 2.25Standard deviation 0.60 0.58 0.57 0.61 0.59 0.59 0.59 0.58 0.57 0.50 0.52 0.56Significance - *** - ** - - Effect size - -0.02 -0.07 - -0.03 -0.08 - 0.00 -0.05 - -0.04 -0.09
Been late to class Frequently / Occasionally 46.0% 44.2% 46.7% 46.8% 44.1% 48.2% 46.0% 44.6% 45.9% 34.7% 40.0% 45.2%
Mean 1.51 1.49 1.52 1.51 1.48 1.54 1.51 1.49 1.51 1.43 1.48 1.51Standard deviation 0.59 0.59 0.60 0.58 0.58 0.60 0.59 0.59 0.60 0.64 0.64 0.61Significance - - - - Effect size - 0.03 -0.02 - 0.05 -0.05 - 0.03 0.00 - -0.08 -0.13
Skipped school/class Frequently / Occasionally 18.2% 17.6% 18.3% 15.6% 14.2% 15.5% 19.8% 20.1% 20.2% 24.5% 20.0% 19.2%
Mean 1.20 1.19 1.20 1.17 1.15 1.17 1.21 1.22 1.22 1.31 1.24 1.21Standard deviation 0.44 0.43 0.43 0.41 0.39 0.40 0.45 0.44 0.45 0.58 0.52 0.45Significance - - - - *Effect size - 0.02 0.00 - 0.05 0.00 - -0.02 -0.02 - 0.13 0.22
Fallen asleep in class Frequently / Occasionally 32.2% 30.2% 28.4% 32.2% 30.9% 29.7% 32.4% 29.7% 27.6% 29.6% 28.9% 28.9%
Mean 1.36 1.34 1.31 1.36 1.35 1.33 1.37 1.33 1.30 1.32 1.32 1.33Standard deviation 0.56 0.54 0.53 0.56 0.55 0.54 0.57 0.54 0.52 0.51 0.52 0.54Significance - *** - - * *** - Effect size - 0.04 0.09 - 0.02 0.06 - 0.07 0.13 - 0.00 -0.02
Failed to complete homework on time Frequently / Occasionally 35.9% 35.7% 39.2% 36.4% 37.3% 44.1% 35.6% 34.6% 35.9% 34.7% 35.6% 41.5%
Mean 1.38 1.38 1.42 1.39 1.40 1.48 1.37 1.36 1.38 1.40 1.39 1.46Standard deviation 0.53 0.53 0.55 0.54 0.54 0.56 0.52 0.52 0.53 0.59 0.56 0.58Significance - *** - *** - - Effect size - 0.00 -0.07 - -0.02 -0.16 - 0.02 -0.02 - 0.02 -0.10
Total Men/Trans men Non-binary, Genderqueer, Gender non-conforming, Identity not listed
Academic Disengagement - These items relate to the extent to which students engage in behaviors that are inconsistent with academic success.
2020 CIRP Freshman SurveyFirst-time, Full-time Freshmen
Academic Disengagement
Women/Trans women
Note: Significance * p<.05, ** p<.01, *** p<.001 Page 18 of 7 1D
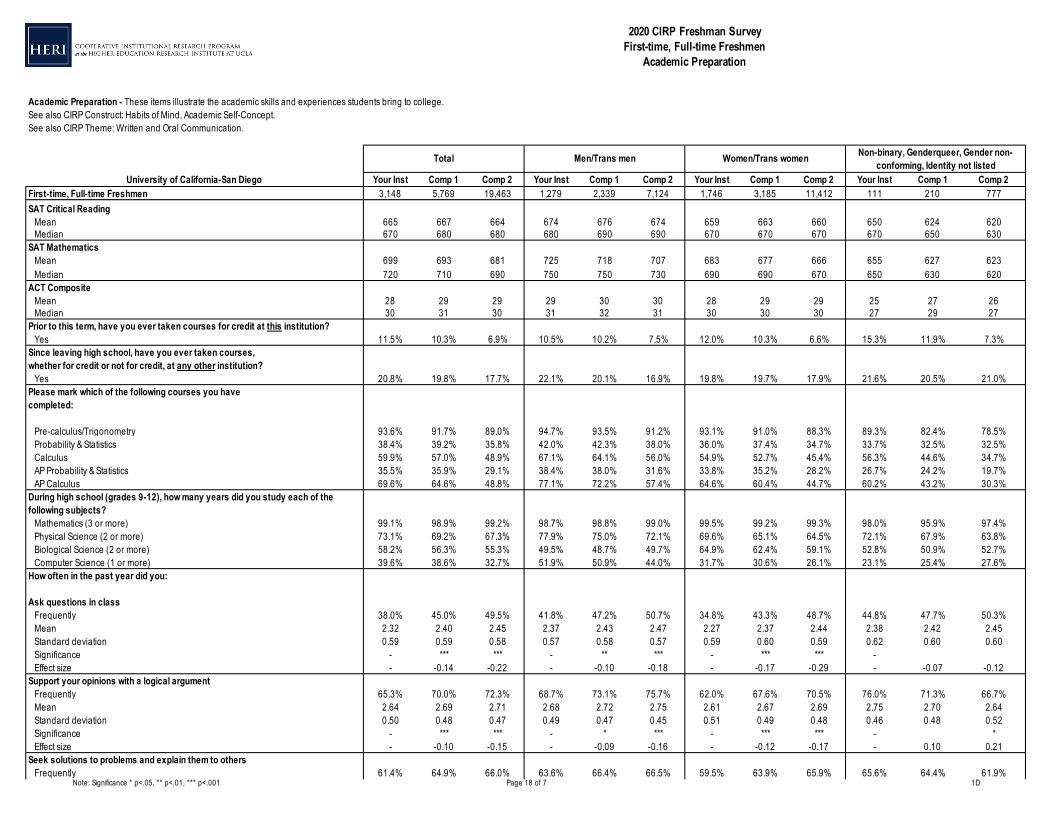
University of California-San Diego Your Inst Comp 1 Comp 2 Your Inst Comp 1 Comp 2 Your Inst Comp 1 Comp 2 Your Inst Comp 1 Comp 2First-time, Full-time Freshmen 3,148 5,769 19,463 1,279 2,339 7,124 1,746 3,185 11,412 111 210 777SAT Critical Reading Mean 665 667 664 674 676 674 659 663 660 650 624 620
Median 670 680 680 680 690 690 670 670 670 670 650 630SAT Mathematics Mean 699 693 681 725 718 707 683 677 666 655 627 623
Median 720 710 690 750 750 730 690 690 670 650 630 620ACT Composite Mean 28 29 29 29 30 30 28 29 29 25 27 26
Median 30 31 30 31 32 31 30 30 30 27 29 27Prior to this term, have you ever taken courses for credit at this institution? Yes 11.5% 10.3% 6.9% 10.5% 10.2% 7.5% 12.0% 10.3% 6.6% 15.3% 11.9% 7.3%Since leaving high school, have you ever taken courses,whether for credit or not for credit, at any other institution? Yes 20.8% 19.8% 17.7% 22.1% 20.1% 16.9% 19.8% 19.7% 17.9% 21.6% 20.5% 21.0%Please mark which of the following courses you havecompleted:
Pre-calculus/Trigonometry 93.6% 91.7% 89.0% 94.7% 93.5% 91.2% 93.1% 91.0% 88.3% 89.3% 82.4% 78.5%Probability & Statistics 38.4% 39.2% 35.8% 42.0% 42.3% 38.0% 36.0% 37.4% 34.7% 33.7% 32.5% 32.5%Calculus 59.9% 57.0% 48.9% 67.1% 64.1% 56.0% 54.9% 52.7% 45.4% 56.3% 44.6% 34.7%AP Probability & Statistics 35.5% 35.9% 29.1% 38.4% 38.0% 31.6% 33.8% 35.2% 28.2% 26.7% 24.2% 19.7%AP Calculus 69.6% 64.6% 48.8% 77.1% 72.2% 57.4% 64.6% 60.4% 44.7% 60.2% 43.2% 30.3%
During high school (grades 9-12), how many years did you study each of the following subjects? Mathematics (3 or more) 99.1% 98.9% 99.2% 98.7% 98.8% 99.0% 99.5% 99.2% 99.3% 98.0% 95.9% 97.4%
Physical Science (2 or more) 73.1% 69.2% 67.3% 77.9% 75.0% 72.1% 69.6% 65.1% 64.5% 72.1% 67.9% 63.8%Biological Science (2 or more) 58.2% 56.3% 55.3% 49.5% 48.7% 49.7% 64.9% 62.4% 59.1% 52.8% 50.9% 52.7%Computer Science (1 or more) 39.6% 38.6% 32.7% 51.9% 50.9% 44.0% 31.7% 30.6% 26.1% 23.1% 25.4% 27.6%
How often in the past year did you:
Ask questions in class Frequently 38.0% 45.0% 49.5% 41.8% 47.2% 50.7% 34.8% 43.3% 48.7% 44.8% 47.7% 50.3%
Mean 2.32 2.40 2.45 2.37 2.43 2.47 2.27 2.37 2.44 2.38 2.42 2.45Standard deviation 0.59 0.59 0.58 0.57 0.58 0.57 0.59 0.60 0.59 0.62 0.60 0.60Significance - *** *** - ** *** - *** *** - Effect size - -0.14 -0.22 - -0.10 -0.18 - -0.17 -0.29 - -0.07 -0.12
Support your opinions with a logical argument Frequently 65.3% 70.0% 72.3% 68.7% 73.1% 75.7% 62.0% 67.6% 70.5% 76.0% 71.3% 66.7%
Mean 2.64 2.69 2.71 2.68 2.72 2.75 2.61 2.67 2.69 2.75 2.70 2.64Standard deviation 0.50 0.48 0.47 0.49 0.47 0.45 0.51 0.49 0.48 0.46 0.48 0.52Significance - *** *** - * *** - *** *** - *Effect size - -0.10 -0.15 - -0.09 -0.16 - -0.12 -0.17 - 0.10 0.21
Seek solutions to problems and explain them to others Frequently 61.4% 64.9% 66.0% 63.6% 66.4% 66.5% 59.5% 63.9% 65.9% 65.6% 64.4% 61.9%
2020 CIRP Freshman SurveyFirst-time, Full-time Freshmen
Academic Preparation
Academic Preparation - These items illustrate the academic skills and experiences students bring to college.See also CIRP Construct: Habits of Mind, Academic Self-Concept.See also CIRP Theme: Written and Oral Communication.
Total Men/Trans men Non-binary, Genderqueer, Gender non-conforming, Identity not listedWomen/Trans women
Note: Significance * p<.05, ** p<.01, *** p<.001 Page 19 of 7 1D
University of California-San Diego Your Inst Comp 1 Comp 2 Your Inst Comp 1 Comp 2 Your Inst Comp 1 Comp 2 Your Inst Comp 1 Comp 2
2020 CIRP Freshman SurveyFirst-time, Full-time Freshmen
Academic Preparation
Academic Preparation - These items illustrate the academic skills and experiences students bring to college.See also CIRP Construct: Habits of Mind, Academic Self-Concept.See also CIRP Theme: Written and Oral Communication.
Total Men/Trans men Non-binary, Genderqueer, Gender non-conforming, Identity not listedWomen/Trans women
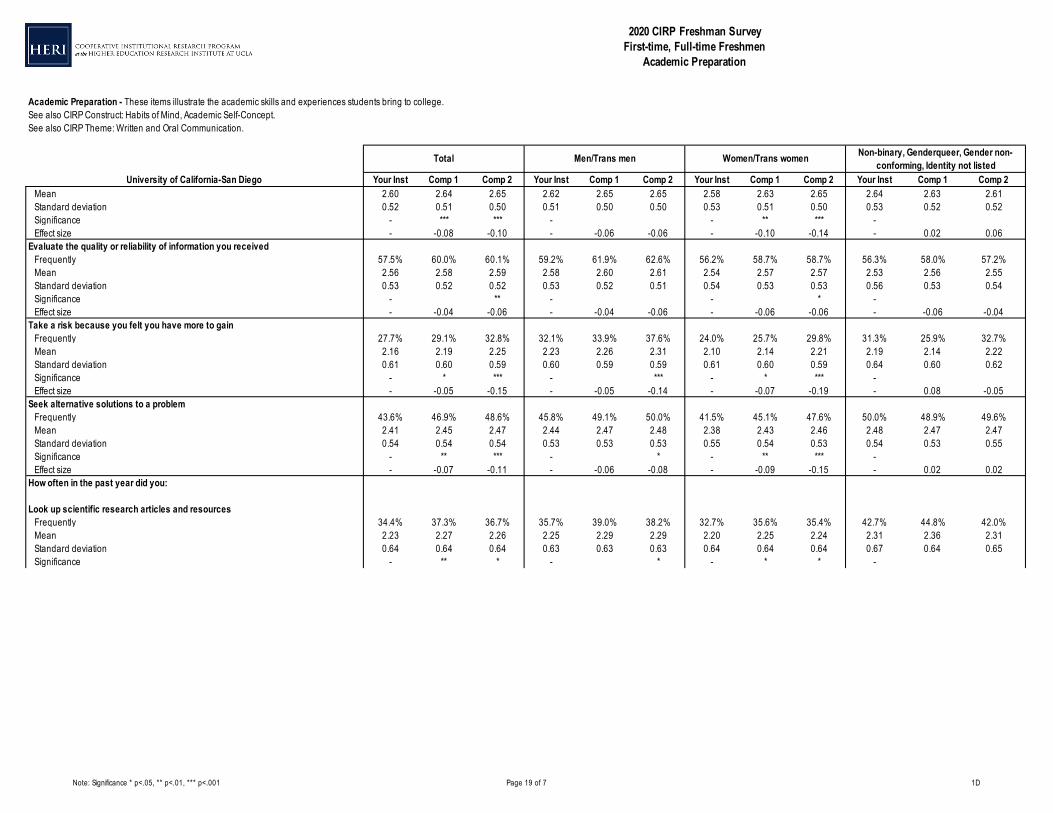
Mean 2.60 2.64 2.65 2.62 2.65 2.65 2.58 2.63 2.65 2.64 2.63 2.61Standard deviation 0.52 0.51 0.50 0.51 0.50 0.50 0.53 0.51 0.50 0.53 0.52 0.52Significance - *** *** - - ** *** - Effect size - -0.08 -0.10 - -0.06 -0.06 - -0.10 -0.14 - 0.02 0.06
Evaluate the quality or reliability of information you received Frequently 57.5% 60.0% 60.1% 59.2% 61.9% 62.6% 56.2% 58.7% 58.7% 56.3% 58.0% 57.2%
Mean 2.56 2.58 2.59 2.58 2.60 2.61 2.54 2.57 2.57 2.53 2.56 2.55Standard deviation 0.53 0.52 0.52 0.53 0.52 0.51 0.54 0.53 0.53 0.56 0.53 0.54Significance - ** - - * - Effect size - -0.04 -0.06 - -0.04 -0.06 - -0.06 -0.06 - -0.06 -0.04
Take a risk because you felt you have more to gain Frequently 27.7% 29.1% 32.8% 32.1% 33.9% 37.6% 24.0% 25.7% 29.8% 31.3% 25.9% 32.7%
Mean 2.16 2.19 2.25 2.23 2.26 2.31 2.10 2.14 2.21 2.19 2.14 2.22Standard deviation 0.61 0.60 0.59 0.60 0.59 0.59 0.61 0.60 0.59 0.64 0.60 0.62Significance - * *** - *** - * *** - Effect size - -0.05 -0.15 - -0.05 -0.14 - -0.07 -0.19 - 0.08 -0.05
Seek alternative solutions to a problem Frequently 43.6% 46.9% 48.6% 45.8% 49.1% 50.0% 41.5% 45.1% 47.6% 50.0% 48.9% 49.6%
Mean 2.41 2.45 2.47 2.44 2.47 2.48 2.38 2.43 2.46 2.48 2.47 2.47Standard deviation 0.54 0.54 0.54 0.53 0.53 0.53 0.55 0.54 0.53 0.54 0.53 0.55Significance - ** *** - * - ** *** - Effect size - -0.07 -0.11 - -0.06 -0.08 - -0.09 -0.15 - 0.02 0.02
How often in the past year did you:
Look up scientific research articles and resources Frequently 34.4% 37.3% 36.7% 35.7% 39.0% 38.2% 32.7% 35.6% 35.4% 42.7% 44.8% 42.0%
Mean 2.23 2.27 2.26 2.25 2.29 2.29 2.20 2.25 2.24 2.31 2.36 2.31Standard deviation 0.64 0.64 0.64 0.63 0.63 0.63 0.64 0.64 0.64 0.67 0.64 0.65Significance - ** * - * - * * -
Note: Significance * p<.05, ** p<.01, *** p<.001 Page 20 of 7 1D
University of California-San Diego Your Inst Comp 1 Comp 2 Your Inst Comp 1 Comp 2 Your Inst Comp 1 Comp 2 Your Inst Comp 1 Comp 2
2020 CIRP Freshman SurveyFirst-time, Full-time Freshmen
Academic Preparation
Academic Preparation - These items illustrate the academic skills and experiences students bring to college.See also CIRP Construct: Habits of Mind, Academic Self-Concept.See also CIRP Theme: Written and Oral Communication.
Total Men/Trans men Non-binary, Genderqueer, Gender non-conforming, Identity not listedWomen/Trans women
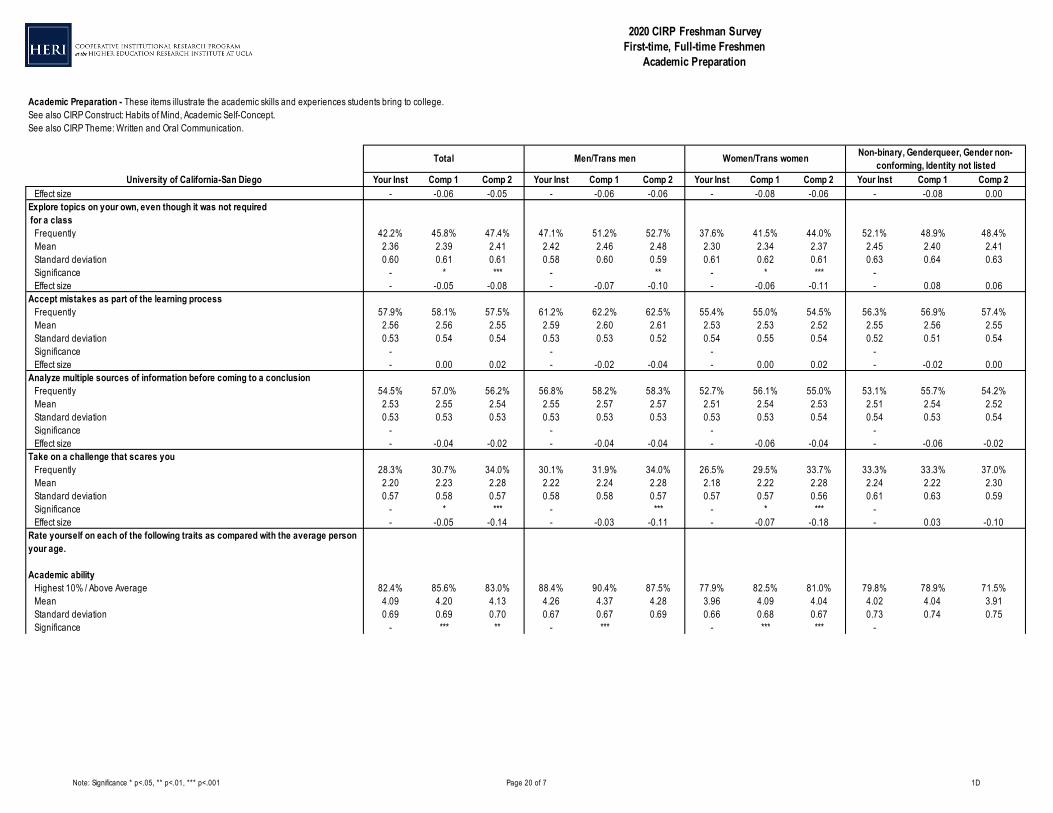
Effect size - -0.06 -0.05 - -0.06 -0.06 - -0.08 -0.06 - -0.08 0.00Explore topics on your own, even though it was not required for a class Frequently 42.2% 45.8% 47.4% 47.1% 51.2% 52.7% 37.6% 41.5% 44.0% 52.1% 48.9% 48.4%
Mean 2.36 2.39 2.41 2.42 2.46 2.48 2.30 2.34 2.37 2.45 2.40 2.41Standard deviation 0.60 0.61 0.61 0.58 0.60 0.59 0.61 0.62 0.61 0.63 0.64 0.63Significance - * *** - ** - * *** - Effect size - -0.05 -0.08 - -0.07 -0.10 - -0.06 -0.11 - 0.08 0.06
Accept mistakes as part of the learning process Frequently 57.9% 58.1% 57.5% 61.2% 62.2% 62.5% 55.4% 55.0% 54.5% 56.3% 56.9% 57.4%
Mean 2.56 2.56 2.55 2.59 2.60 2.61 2.53 2.53 2.52 2.55 2.56 2.55Standard deviation 0.53 0.54 0.54 0.53 0.53 0.52 0.54 0.55 0.54 0.52 0.51 0.54Significance - - - - Effect size - 0.00 0.02 - -0.02 -0.04 - 0.00 0.02 - -0.02 0.00
Analyze multiple sources of information before coming to a conclusion Frequently 54.5% 57.0% 56.2% 56.8% 58.2% 58.3% 52.7% 56.1% 55.0% 53.1% 55.7% 54.2%
Mean 2.53 2.55 2.54 2.55 2.57 2.57 2.51 2.54 2.53 2.51 2.54 2.52Standard deviation 0.53 0.53 0.53 0.53 0.53 0.53 0.53 0.53 0.54 0.54 0.53 0.54Significance - - - - Effect size - -0.04 -0.02 - -0.04 -0.04 - -0.06 -0.04 - -0.06 -0.02
Take on a challenge that scares you Frequently 28.3% 30.7% 34.0% 30.1% 31.9% 34.0% 26.5% 29.5% 33.7% 33.3% 33.3% 37.0%
Mean 2.20 2.23 2.28 2.22 2.24 2.28 2.18 2.22 2.28 2.24 2.22 2.30Standard deviation 0.57 0.58 0.57 0.58 0.58 0.57 0.57 0.57 0.56 0.61 0.63 0.59Significance - * *** - *** - * *** - Effect size - -0.05 -0.14 - -0.03 -0.11 - -0.07 -0.18 - 0.03 -0.10
Rate yourself on each of the following traits as compared with the average person your age.
Academic ability Highest 10% / Above Average 82.4% 85.6% 83.0% 88.4% 90.4% 87.5% 77.9% 82.5% 81.0% 79.8% 78.9% 71.5%
Mean 4.09 4.20 4.13 4.26 4.37 4.28 3.96 4.09 4.04 4.02 4.04 3.91Standard deviation 0.69 0.69 0.70 0.67 0.67 0.69 0.66 0.68 0.67 0.73 0.74 0.75Significance - *** ** - *** - *** *** -
Note: Significance * p<.05, ** p<.01, *** p<.001 Page 21 of 7 1D
University of California-San Diego Your Inst Comp 1 Comp 2 Your Inst Comp 1 Comp 2 Your Inst Comp 1 Comp 2 Your Inst Comp 1 Comp 2
2020 CIRP Freshman SurveyFirst-time, Full-time Freshmen
Academic Preparation
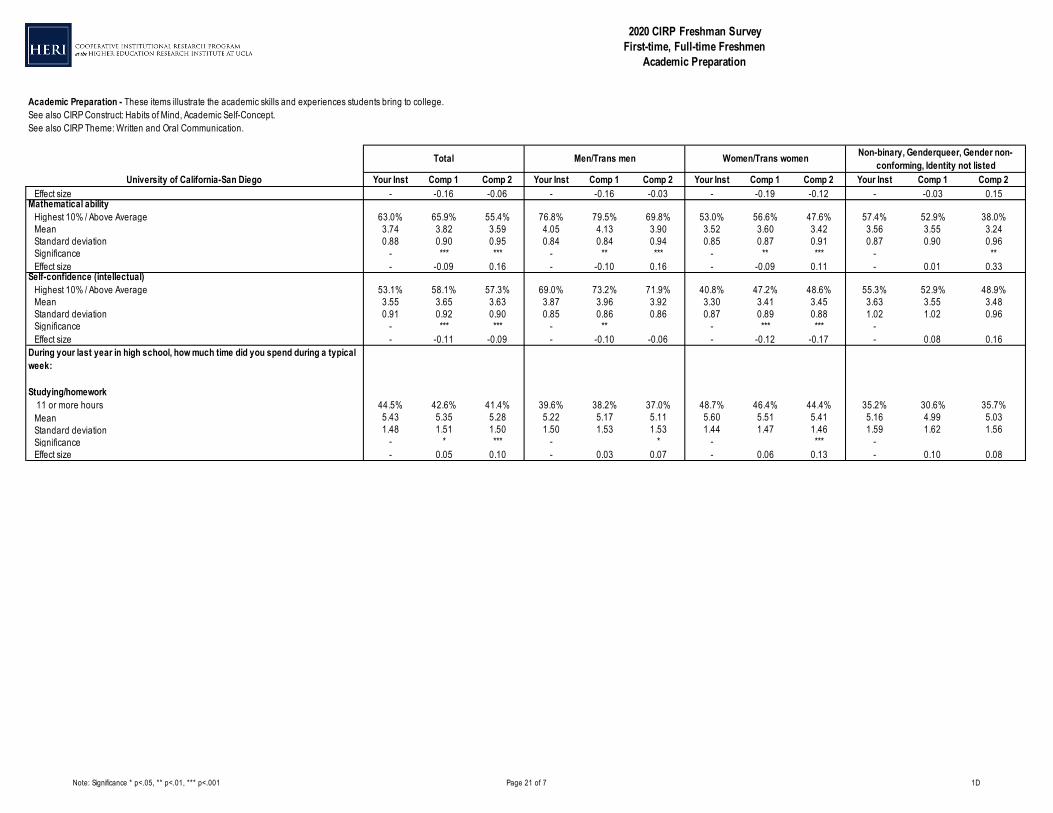
Academic Preparation - These items illustrate the academic skills and experiences students bring to college.See also CIRP Construct: Habits of Mind, Academic Self-Concept.See also CIRP Theme: Written and Oral Communication.
Total Men/Trans men Non-binary, Genderqueer, Gender non-conforming, Identity not listedWomen/Trans women
Effect size - -0.16 -0.06 - -0.16 -0.03 - -0.19 -0.12 - -0.03 0.15Mathematical ability Highest 10% / Above Average 63.0% 65.9% 55.4% 76.8% 79.5% 69.8% 53.0% 56.6% 47.6% 57.4% 52.9% 38.0%
Mean 3.74 3.82 3.59 4.05 4.13 3.90 3.52 3.60 3.42 3.56 3.55 3.24Standard deviation 0.88 0.90 0.95 0.84 0.84 0.94 0.85 0.87 0.91 0.87 0.90 0.96Significance - *** *** - ** *** - ** *** - **Effect size - -0.09 0.16 - -0.10 0.16 - -0.09 0.11 - 0.01 0.33
Self-confidence (intellectual) Highest 10% / Above Average 53.1% 58.1% 57.3% 69.0% 73.2% 71.9% 40.8% 47.2% 48.6% 55.3% 52.9% 48.9%
Mean 3.55 3.65 3.63 3.87 3.96 3.92 3.30 3.41 3.45 3.63 3.55 3.48Standard deviation 0.91 0.92 0.90 0.85 0.86 0.86 0.87 0.89 0.88 1.02 1.02 0.96Significance - *** *** - ** - *** *** - Effect size - -0.11 -0.09 - -0.10 -0.06 - -0.12 -0.17 - 0.08 0.16
During your last year in high school, how much time did you spend during a typical week:
Studying/homework 11 or more hours 44.5% 42.6% 41.4% 39.6% 38.2% 37.0% 48.7% 46.4% 44.4% 35.2% 30.6% 35.7%
Mean 5.43 5.35 5.28 5.22 5.17 5.11 5.60 5.51 5.41 5.16 4.99 5.03Standard deviation 1.48 1.51 1.50 1.50 1.53 1.53 1.44 1.47 1.46 1.59 1.62 1.56Significance - * *** - * - *** - Effect size - 0.05 0.10 - 0.03 0.07 - 0.06 0.13 - 0.10 0.08
Note: Significance * p<.05, ** p<.01, *** p<.001 Page 22 of 2 1E
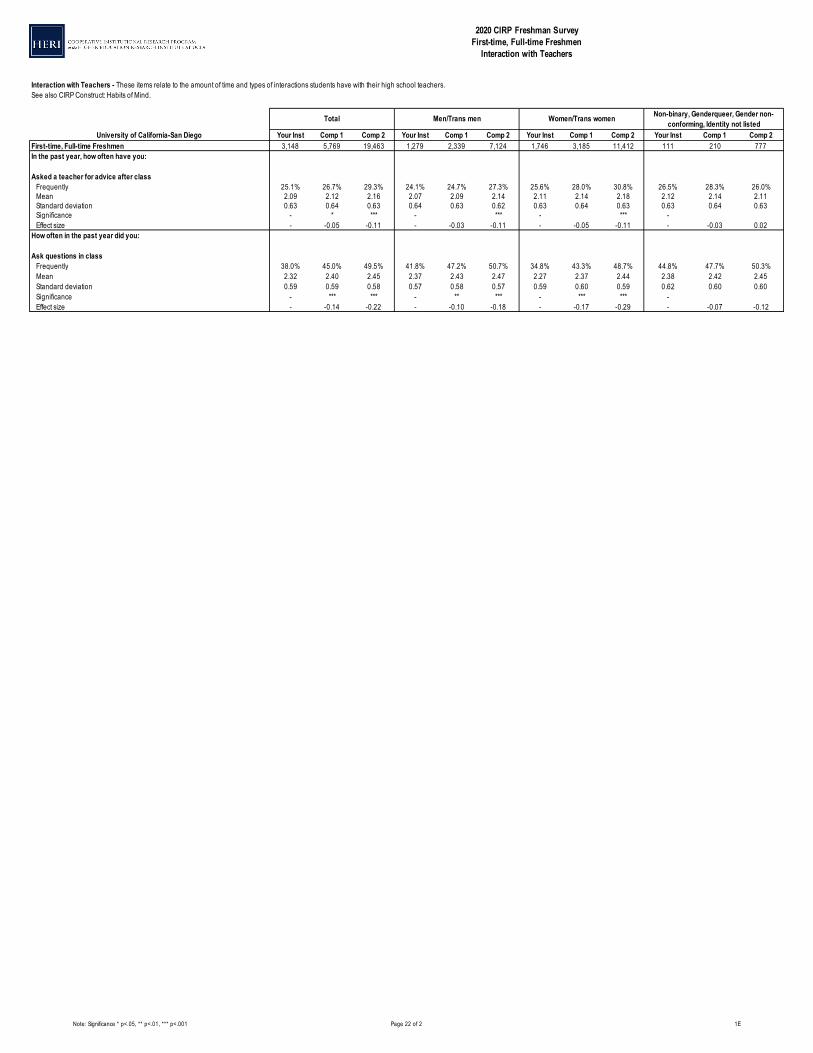
University of California-San Diego Your Inst Comp 1 Comp 2 Your Inst Comp 1 Comp 2 Your Inst Comp 1 Comp 2 Your Inst Comp 1 Comp 2First-time, Full-time Freshmen 3,148 5,769 19,463 1,279 2,339 7,124 1,746 3,185 11,412 111 210 777In the past year, how often have you:
Asked a teacher for advice after class Frequently 25.1% 26.7% 29.3% 24.1% 24.7% 27.3% 25.6% 28.0% 30.8% 26.5% 28.3% 26.0%
Mean 2.09 2.12 2.16 2.07 2.09 2.14 2.11 2.14 2.18 2.12 2.14 2.11Standard deviation 0.63 0.64 0.63 0.64 0.63 0.62 0.63 0.64 0.63 0.63 0.64 0.63Significance - * *** - *** - *** - Effect size - -0.05 -0.11 - -0.03 -0.11 - -0.05 -0.11 - -0.03 0.02
How often in the past year did you:
Ask questions in class Frequently 38.0% 45.0% 49.5% 41.8% 47.2% 50.7% 34.8% 43.3% 48.7% 44.8% 47.7% 50.3%
Mean 2.32 2.40 2.45 2.37 2.43 2.47 2.27 2.37 2.44 2.38 2.42 2.45Standard deviation 0.59 0.59 0.58 0.57 0.58 0.57 0.59 0.60 0.59 0.62 0.60 0.60Significance - *** *** - ** *** - *** *** - Effect size - -0.14 -0.22 - -0.10 -0.18 - -0.17 -0.29 - -0.07 -0.12
2020 CIRP Freshman SurveyFirst-time, Full-time Freshmen
Interaction with Teachers
Total Men/Trans men Non-binary, Genderqueer, Gender non-conforming, Identity not listed
Interaction with Teachers - These items relate to the amount of time and types of interactions students have with their high school teachers.See also CIRP Construct: Habits of Mind.
Women/Trans women
Note: Significance * p<.05, ** p<.01, *** p<.001 Page 23 of 2 1E
University of California-San Diego Your Inst Comp 1 Comp 2 Your Inst Comp 1 Comp 2 Your Inst Comp 1 Comp 2 Your Inst Comp 1 Comp 2
2020 CIRP Freshman SurveyFirst-time, Full-time Freshmen
Interaction with Teachers
Total Men/Trans men Non-binary, Genderqueer, Gender non-conforming, Identity not listed
Interaction with Teachers - These items relate to the amount of time and types of interactions students have with their high school teachers.See also CIRP Construct: Habits of Mind.
Women/Trans women
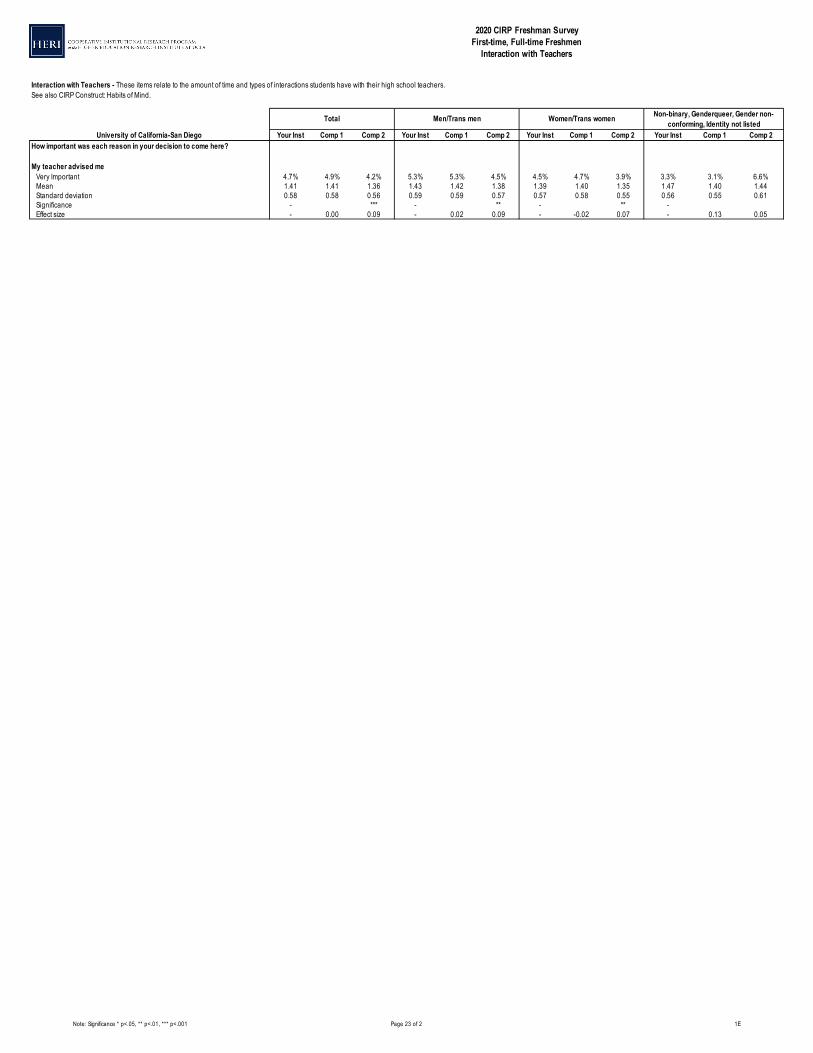
How important was each reason in your decision to come here?
My teacher advised me Very Important 4.7% 4.9% 4.2% 5.3% 5.3% 4.5% 4.5% 4.7% 3.9% 3.3% 3.1% 6.6%
Mean 1.41 1.41 1.36 1.43 1.42 1.38 1.39 1.40 1.35 1.47 1.40 1.44Standard deviation 0.58 0.58 0.56 0.59 0.59 0.57 0.57 0.58 0.55 0.56 0.55 0.61Significance - *** - ** - ** - Effect size - 0.00 0.09 - 0.02 0.09 - -0.02 0.07 - 0.13 0.05
Note: Significance * p<.05, ** p<.01, *** p<.001 Page 24 of 1 1F
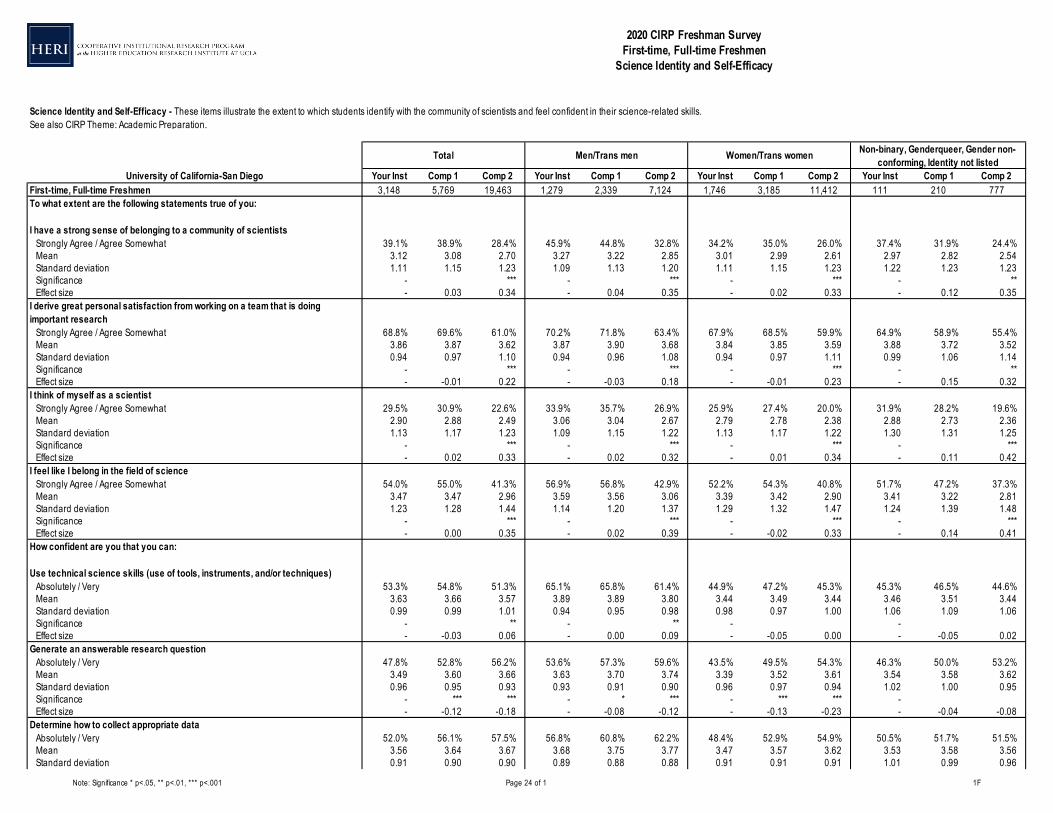
University of California-San Diego Your Inst Comp 1 Comp 2 Your Inst Comp 1 Comp 2 Your Inst Comp 1 Comp 2 Your Inst Comp 1 Comp 2First-time, Full-time Freshmen 3,148 5,769 19,463 1,279 2,339 7,124 1,746 3,185 11,412 111 210 777To what extent are the following statements true of you:
I have a strong sense of belonging to a community of scientists Strongly Agree / Agree Somewhat 39.1% 38.9% 28.4% 45.9% 44.8% 32.8% 34.2% 35.0% 26.0% 37.4% 31.9% 24.4%
Mean 3.12 3.08 2.70 3.27 3.22 2.85 3.01 2.99 2.61 2.97 2.82 2.54Standard deviation 1.11 1.15 1.23 1.09 1.13 1.20 1.11 1.15 1.23 1.22 1.23 1.23Significance - *** - *** - *** - **Effect size - 0.03 0.34 - 0.04 0.35 - 0.02 0.33 - 0.12 0.35
I derive great personal satisfaction from working on a team that is doing important research Strongly Agree / Agree Somewhat 68.8% 69.6% 61.0% 70.2% 71.8% 63.4% 67.9% 68.5% 59.9% 64.9% 58.9% 55.4%
Mean 3.86 3.87 3.62 3.87 3.90 3.68 3.84 3.85 3.59 3.88 3.72 3.52Standard deviation 0.94 0.97 1.10 0.94 0.96 1.08 0.94 0.97 1.11 0.99 1.06 1.14Significance - *** - *** - *** - **Effect size - -0.01 0.22 - -0.03 0.18 - -0.01 0.23 - 0.15 0.32
I think of myself as a scientist Strongly Agree / Agree Somewhat 29.5% 30.9% 22.6% 33.9% 35.7% 26.9% 25.9% 27.4% 20.0% 31.9% 28.2% 19.6%
Mean 2.90 2.88 2.49 3.06 3.04 2.67 2.79 2.78 2.38 2.88 2.73 2.36Standard deviation 1.13 1.17 1.23 1.09 1.15 1.22 1.13 1.17 1.22 1.30 1.31 1.25Significance - *** - *** - *** - ***Effect size - 0.02 0.33 - 0.02 0.32 - 0.01 0.34 - 0.11 0.42
I feel like I belong in the field of science Strongly Agree / Agree Somewhat 54.0% 55.0% 41.3% 56.9% 56.8% 42.9% 52.2% 54.3% 40.8% 51.7% 47.2% 37.3%
Mean 3.47 3.47 2.96 3.59 3.56 3.06 3.39 3.42 2.90 3.41 3.22 2.81Standard deviation 1.23 1.28 1.44 1.14 1.20 1.37 1.29 1.32 1.47 1.24 1.39 1.48Significance - *** - *** - *** - ***Effect size - 0.00 0.35 - 0.02 0.39 - -0.02 0.33 - 0.14 0.41
How confident are you that you can:
Use technical science skills (use of tools, instruments, and/or techniques) Absolutely / Very 53.3% 54.8% 51.3% 65.1% 65.8% 61.4% 44.9% 47.2% 45.3% 45.3% 46.5% 44.6%
Mean 3.63 3.66 3.57 3.89 3.89 3.80 3.44 3.49 3.44 3.46 3.51 3.44Standard deviation 0.99 0.99 1.01 0.94 0.95 0.98 0.98 0.97 1.00 1.06 1.09 1.06Significance - ** - ** - - Effect size - -0.03 0.06 - 0.00 0.09 - -0.05 0.00 - -0.05 0.02
Generate an answerable research question Absolutely / Very 47.8% 52.8% 56.2% 53.6% 57.3% 59.6% 43.5% 49.5% 54.3% 46.3% 50.0% 53.2%
Mean 3.49 3.60 3.66 3.63 3.70 3.74 3.39 3.52 3.61 3.54 3.58 3.62Standard deviation 0.96 0.95 0.93 0.93 0.91 0.90 0.96 0.97 0.94 1.02 1.00 0.95Significance - *** *** - * *** - *** *** - Effect size - -0.12 -0.18 - -0.08 -0.12 - -0.13 -0.23 - -0.04 -0.08
Determine how to collect appropriate data Absolutely / Very 52.0% 56.1% 57.5% 56.8% 60.8% 62.2% 48.4% 52.9% 54.9% 50.5% 51.7% 51.5%
Mean 3.56 3.64 3.67 3.68 3.75 3.77 3.47 3.57 3.62 3.53 3.58 3.56Standard deviation 0.91 0.90 0.90 0.89 0.88 0.88 0.91 0.91 0.91 1.01 0.99 0.96
2020 CIRP Freshman SurveyFirst-time, Full-time Freshmen
Science Identity and Self-Efficacy
Total Men/Trans men Non-binary, Genderqueer, Gender non-conforming, Identity not listed
Science Identity and Self-Efficacy - These items illustrate the extent to which students identify with the community of scientists and feel confident in their science-related skills. See also CIRP Theme: Academic Preparation.
Women/Trans women
Note: Significance * p<.05, ** p<.01, *** p<.001 Page 25 of 1 1F
University of California-San Diego Your Inst Comp 1 Comp 2 Your Inst Comp 1 Comp 2 Your Inst Comp 1 Comp 2 Your Inst Comp 1 Comp 2
2020 CIRP Freshman SurveyFirst-time, Full-time Freshmen
Science Identity and Self-Efficacy
Total Men/Trans men Non-binary, Genderqueer, Gender non-conforming, Identity not listed
Science Identity and Self-Efficacy - These items illustrate the extent to which students identify with the community of scientists and feel confident in their science-related skills. See also CIRP Theme: Academic Preparation.
Women/Trans women
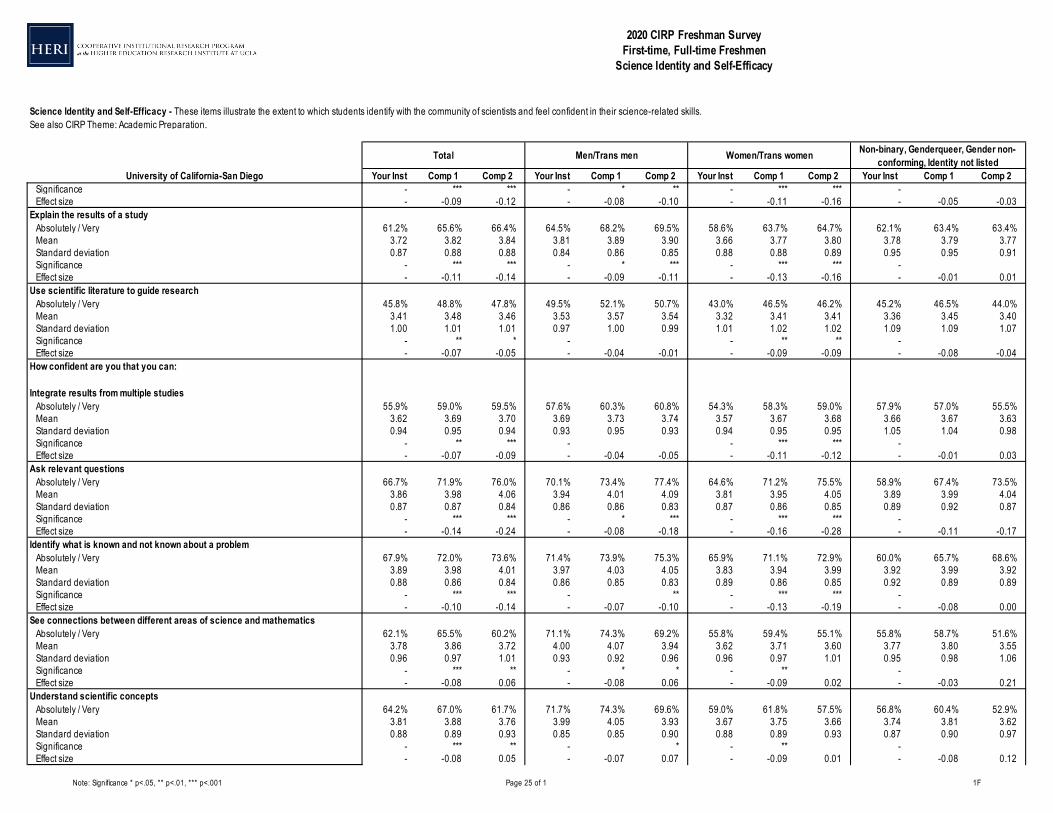
Significance - *** *** - * ** - *** *** - Effect size - -0.09 -0.12 - -0.08 -0.10 - -0.11 -0.16 - -0.05 -0.03
Explain the results of a study Absolutely / Very 61.2% 65.6% 66.4% 64.5% 68.2% 69.5% 58.6% 63.7% 64.7% 62.1% 63.4% 63.4%
Mean 3.72 3.82 3.84 3.81 3.89 3.90 3.66 3.77 3.80 3.78 3.79 3.77Standard deviation 0.87 0.88 0.88 0.84 0.86 0.85 0.88 0.88 0.89 0.95 0.95 0.91Significance - *** *** - * *** - *** *** - Effect size - -0.11 -0.14 - -0.09 -0.11 - -0.13 -0.16 - -0.01 0.01
Use scientific literature to guide research Absolutely / Very 45.8% 48.8% 47.8% 49.5% 52.1% 50.7% 43.0% 46.5% 46.2% 45.2% 46.5% 44.0%
Mean 3.41 3.48 3.46 3.53 3.57 3.54 3.32 3.41 3.41 3.36 3.45 3.40Standard deviation 1.00 1.01 1.01 0.97 1.00 0.99 1.01 1.02 1.02 1.09 1.09 1.07Significance - ** * - - ** ** - Effect size - -0.07 -0.05 - -0.04 -0.01 - -0.09 -0.09 - -0.08 -0.04
How confident are you that you can:
Integrate results from multiple studies Absolutely / Very 55.9% 59.0% 59.5% 57.6% 60.3% 60.8% 54.3% 58.3% 59.0% 57.9% 57.0% 55.5%
Mean 3.62 3.69 3.70 3.69 3.73 3.74 3.57 3.67 3.68 3.66 3.67 3.63Standard deviation 0.94 0.95 0.94 0.93 0.95 0.93 0.94 0.95 0.95 1.05 1.04 0.98Significance - ** *** - - *** *** - Effect size - -0.07 -0.09 - -0.04 -0.05 - -0.11 -0.12 - -0.01 0.03
Ask relevant questions Absolutely / Very 66.7% 71.9% 76.0% 70.1% 73.4% 77.4% 64.6% 71.2% 75.5% 58.9% 67.4% 73.5%
Mean 3.86 3.98 4.06 3.94 4.01 4.09 3.81 3.95 4.05 3.89 3.99 4.04Standard deviation 0.87 0.87 0.84 0.86 0.86 0.83 0.87 0.86 0.85 0.89 0.92 0.87Significance - *** *** - * *** - *** *** - Effect size - -0.14 -0.24 - -0.08 -0.18 - -0.16 -0.28 - -0.11 -0.17
Identify what is known and not known about a problem Absolutely / Very 67.9% 72.0% 73.6% 71.4% 73.9% 75.3% 65.9% 71.1% 72.9% 60.0% 65.7% 68.6%
Mean 3.89 3.98 4.01 3.97 4.03 4.05 3.83 3.94 3.99 3.92 3.99 3.92Standard deviation 0.88 0.86 0.84 0.86 0.85 0.83 0.89 0.86 0.85 0.92 0.89 0.89Significance - *** *** - ** - *** *** - Effect size - -0.10 -0.14 - -0.07 -0.10 - -0.13 -0.19 - -0.08 0.00
See connections between different areas of science and mathematics Absolutely / Very 62.1% 65.5% 60.2% 71.1% 74.3% 69.2% 55.8% 59.4% 55.1% 55.8% 58.7% 51.6%
Mean 3.78 3.86 3.72 4.00 4.07 3.94 3.62 3.71 3.60 3.77 3.80 3.55Standard deviation 0.96 0.97 1.01 0.93 0.92 0.96 0.96 0.97 1.01 0.95 0.98 1.06Significance - *** ** - * * - ** - Effect size - -0.08 0.06 - -0.08 0.06 - -0.09 0.02 - -0.03 0.21
Understand scientific concepts Absolutely / Very 64.2% 67.0% 61.7% 71.7% 74.3% 69.6% 59.0% 61.8% 57.5% 56.8% 60.4% 52.9%
Mean 3.81 3.88 3.76 3.99 4.05 3.93 3.67 3.75 3.66 3.74 3.81 3.62Standard deviation 0.88 0.89 0.93 0.85 0.85 0.90 0.88 0.89 0.93 0.87 0.90 0.97Significance - *** ** - * - ** - Effect size - -0.08 0.05 - -0.07 0.07 - -0.09 0.01 - -0.08 0.12
Note: Significance * p<.05, ** p<.01, *** p<.001 Page 26 of 1 1F
University of California-San Diego Your Inst Comp 1 Comp 2 Your Inst Comp 1 Comp 2 Your Inst Comp 1 Comp 2 Your Inst Comp 1 Comp 2
2020 CIRP Freshman SurveyFirst-time, Full-time Freshmen
Science Identity and Self-Efficacy
Total Men/Trans men Non-binary, Genderqueer, Gender non-conforming, Identity not listed
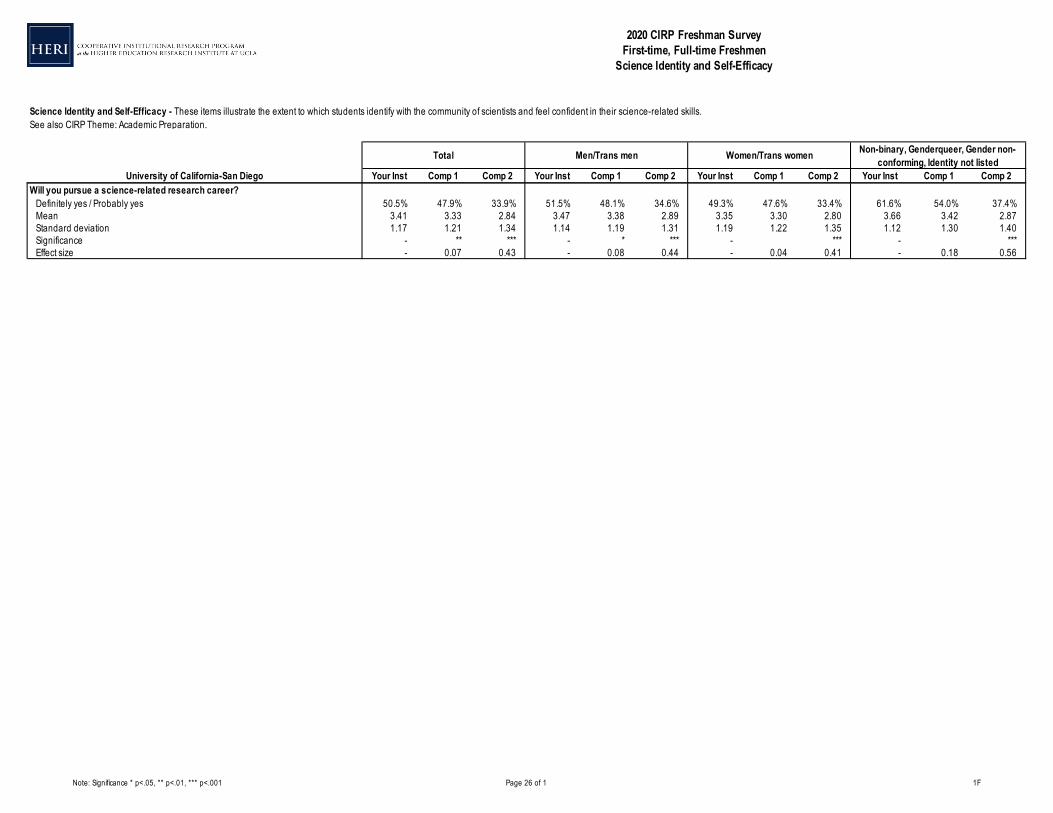
Science Identity and Self-Efficacy - These items illustrate the extent to which students identify with the community of scientists and feel confident in their science-related skills. See also CIRP Theme: Academic Preparation.
Women/Trans women
Will you pursue a science-related research career? Definitely yes / Probably yes 50.5% 47.9% 33.9% 51.5% 48.1% 34.6% 49.3% 47.6% 33.4% 61.6% 54.0% 37.4%
Mean 3.41 3.33 2.84 3.47 3.38 2.89 3.35 3.30 2.80 3.66 3.42 2.87Standard deviation 1.17 1.21 1.34 1.14 1.19 1.31 1.19 1.22 1.35 1.12 1.30 1.40Significance - ** *** - * *** - *** - ***Effect size - 0.07 0.43 - 0.08 0.44 - 0.04 0.41 - 0.18 0.56
Note: Significance * p<.05, ** p<.01, *** p<.001 Page 27 of 1 1G
University of California-San Diego Your Inst Comp 1 Comp 2 Your Inst Comp 1 Comp 2 Your Inst Comp 1 Comp 2 Your Inst Comp 1 Comp 2First-time, Full-time Freshmen 3,148 5,769 19,463 1,279 2,339 7,124 1,746 3,185 11,412 111 210 777SAT Critical Reading Mean 665 667 664 674 676 674 659 663 660 650 624 620
Median 670 680 680 680 690 690 670 670 670 670 650 630Rate yourself on each of the following traits as compared with the average person your age.
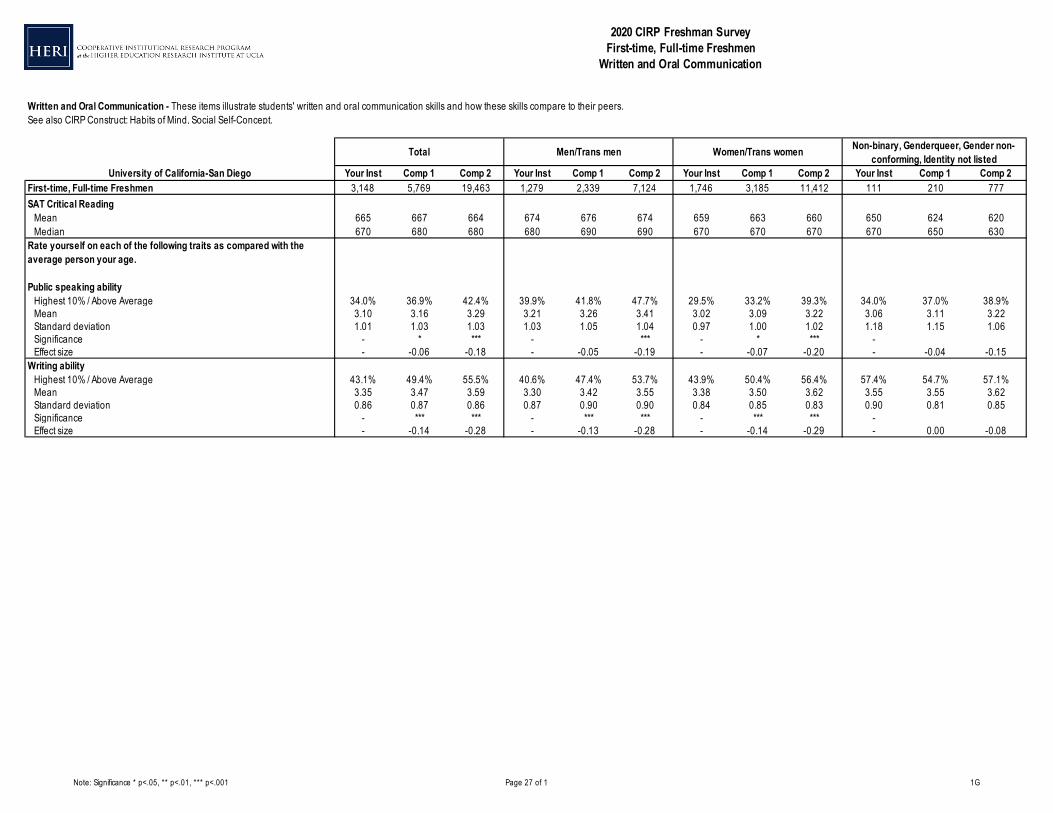
Public speaking ability Highest 10% / Above Average 34.0% 36.9% 42.4% 39.9% 41.8% 47.7% 29.5% 33.2% 39.3% 34.0% 37.0% 38.9%
Mean 3.10 3.16 3.29 3.21 3.26 3.41 3.02 3.09 3.22 3.06 3.11 3.22Standard deviation 1.01 1.03 1.03 1.03 1.05 1.04 0.97 1.00 1.02 1.18 1.15 1.06Significance - * *** - *** - * *** - Effect size - -0.06 -0.18 - -0.05 -0.19 - -0.07 -0.20 - -0.04 -0.15
Writing ability Highest 10% / Above Average 43.1% 49.4% 55.5% 40.6% 47.4% 53.7% 43.9% 50.4% 56.4% 57.4% 54.7% 57.1%
Mean 3.35 3.47 3.59 3.30 3.42 3.55 3.38 3.50 3.62 3.55 3.55 3.62Standard deviation 0.86 0.87 0.86 0.87 0.90 0.90 0.84 0.85 0.83 0.90 0.81 0.85Significance - *** *** - *** *** - *** *** - Effect size - -0.14 -0.28 - -0.13 -0.28 - -0.14 -0.29 - 0.00 -0.08
2020 CIRP Freshman SurveyFirst-time, Full-time Freshmen
Written and Oral Communication
Total Men/Trans men Non-binary, Genderqueer, Gender non-conforming, Identity not listed
Written and Oral Communication - These items illustrate students' written and oral communication skills and how these skills compare to their peers.See also CIRP Construct: Habits of Mind, Social Self-Concept.
Women/Trans women
Note: Significance * p<.05, ** p<.01, *** p<.001 Page 28 of 2 1H
University of California-San Diego Your Inst Comp 1 Comp 2 Your Inst Comp 1 Comp 2 Your Inst Comp 1 Comp 2 Your Inst Comp 1 Comp 2First-time, Full-time Freshmen 3,148 5,769 19,463 1,279 2,339 7,124 1,746 3,185 11,412 111 210 777Rate yourself on each of the following traits as compared with the average person your age.
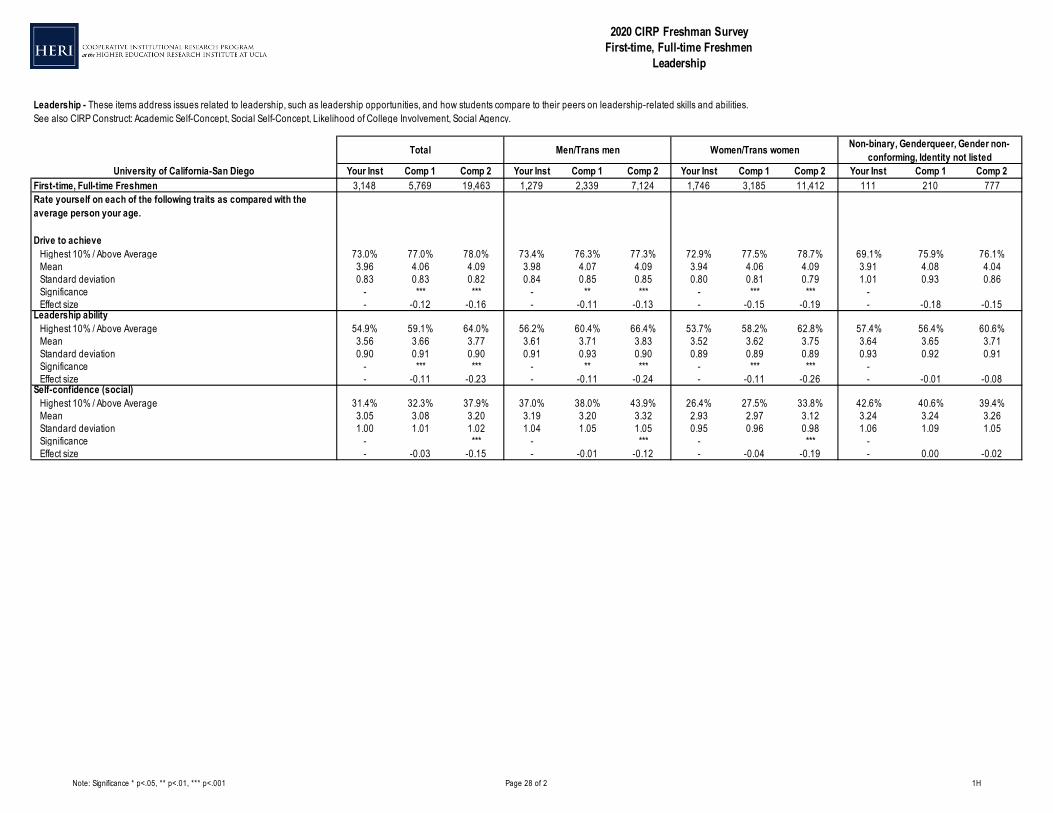
Drive to achieve Highest 10% / Above Average 73.0% 77.0% 78.0% 73.4% 76.3% 77.3% 72.9% 77.5% 78.7% 69.1% 75.9% 76.1%
Mean 3.96 4.06 4.09 3.98 4.07 4.09 3.94 4.06 4.09 3.91 4.08 4.04Standard deviation 0.83 0.83 0.82 0.84 0.85 0.85 0.80 0.81 0.79 1.01 0.93 0.86Significance - *** *** - ** *** - *** *** - Effect size - -0.12 -0.16 - -0.11 -0.13 - -0.15 -0.19 - -0.18 -0.15
Leadership ability Highest 10% / Above Average 54.9% 59.1% 64.0% 56.2% 60.4% 66.4% 53.7% 58.2% 62.8% 57.4% 56.4% 60.6%
Mean 3.56 3.66 3.77 3.61 3.71 3.83 3.52 3.62 3.75 3.64 3.65 3.71Standard deviation 0.90 0.91 0.90 0.91 0.93 0.90 0.89 0.89 0.89 0.93 0.92 0.91Significance - *** *** - ** *** - *** *** - Effect size - -0.11 -0.23 - -0.11 -0.24 - -0.11 -0.26 - -0.01 -0.08
Self-confidence (social) Highest 10% / Above Average 31.4% 32.3% 37.9% 37.0% 38.0% 43.9% 26.4% 27.5% 33.8% 42.6% 40.6% 39.4%
Mean 3.05 3.08 3.20 3.19 3.20 3.32 2.93 2.97 3.12 3.24 3.24 3.26Standard deviation 1.00 1.01 1.02 1.04 1.05 1.05 0.95 0.96 0.98 1.06 1.09 1.05Significance - *** - *** - *** - Effect size - -0.03 -0.15 - -0.01 -0.12 - -0.04 -0.19 - 0.00 -0.02
2020 CIRP Freshman SurveyFirst-time, Full-time Freshmen
Leadership
Total Men/Trans men Non-binary, Genderqueer, Gender non-conforming, Identity not listed
Leadership - These items address issues related to leadership, such as leadership opportunities, and how students compare to their peers on leadership-related skills and abilities.See also CIRP Construct: Academic Self-Concept, Social Self-Concept, Likelihood of College Involvement, Social Agency.
Women/Trans women
Note: Significance * p<.05, ** p<.01, *** p<.001 Page 29 of 2 1H
University of California-San Diego Your Inst Comp 1 Comp 2 Your Inst Comp 1 Comp 2 Your Inst Comp 1 Comp 2 Your Inst Comp 1 Comp 2
2020 CIRP Freshman SurveyFirst-time, Full-time Freshmen
Leadership
Total Men/Trans men Non-binary, Genderqueer, Gender non-conforming, Identity not listed
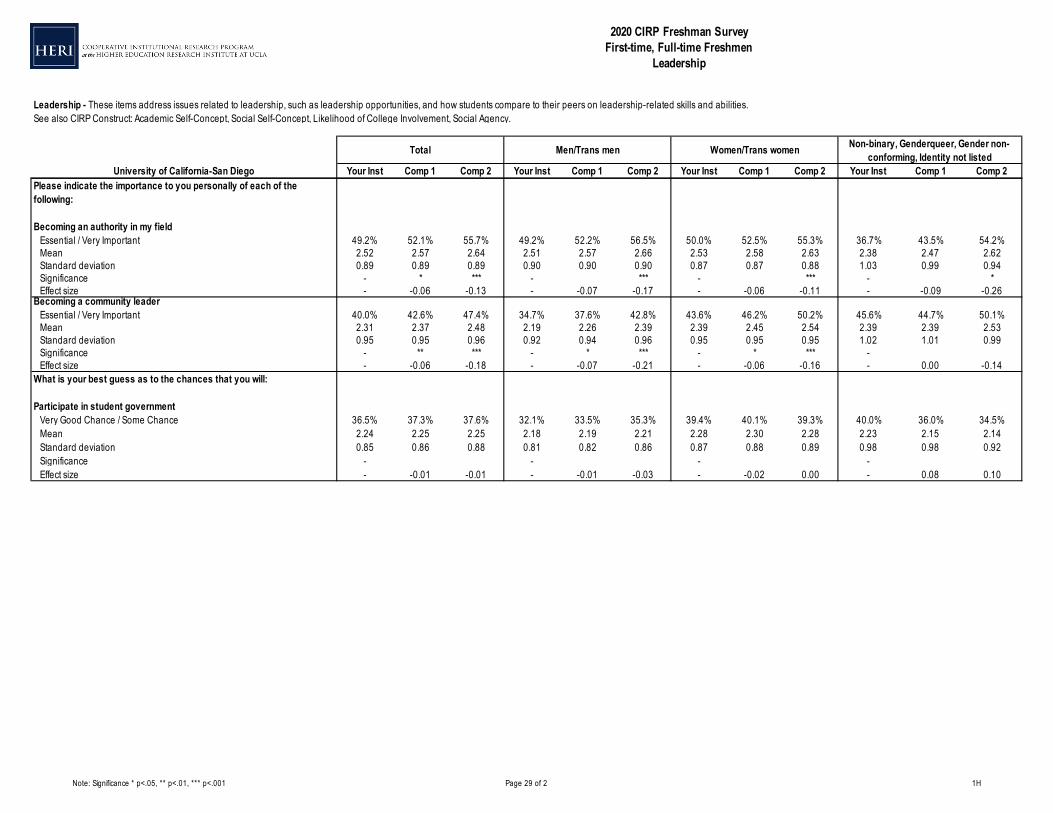
Leadership - These items address issues related to leadership, such as leadership opportunities, and how students compare to their peers on leadership-related skills and abilities.See also CIRP Construct: Academic Self-Concept, Social Self-Concept, Likelihood of College Involvement, Social Agency.
Women/Trans women
Please indicate the importance to you personally of each of the following:
Becoming an authority in my field Essential / Very Important 49.2% 52.1% 55.7% 49.2% 52.2% 56.5% 50.0% 52.5% 55.3% 36.7% 43.5% 54.2%
Mean 2.52 2.57 2.64 2.51 2.57 2.66 2.53 2.58 2.63 2.38 2.47 2.62Standard deviation 0.89 0.89 0.89 0.90 0.90 0.90 0.87 0.87 0.88 1.03 0.99 0.94Significance - * *** - *** - *** - *Effect size - -0.06 -0.13 - -0.07 -0.17 - -0.06 -0.11 - -0.09 -0.26
Becoming a community leader Essential / Very Important 40.0% 42.6% 47.4% 34.7% 37.6% 42.8% 43.6% 46.2% 50.2% 45.6% 44.7% 50.1%
Mean 2.31 2.37 2.48 2.19 2.26 2.39 2.39 2.45 2.54 2.39 2.39 2.53Standard deviation 0.95 0.95 0.96 0.92 0.94 0.96 0.95 0.95 0.95 1.02 1.01 0.99Significance - ** *** - * *** - * *** - Effect size - -0.06 -0.18 - -0.07 -0.21 - -0.06 -0.16 - 0.00 -0.14
What is your best guess as to the chances that you will:
Participate in student government Very Good Chance / Some Chance 36.5% 37.3% 37.6% 32.1% 33.5% 35.3% 39.4% 40.1% 39.3% 40.0% 36.0% 34.5%
Mean 2.24 2.25 2.25 2.18 2.19 2.21 2.28 2.30 2.28 2.23 2.15 2.14Standard deviation 0.85 0.86 0.88 0.81 0.82 0.86 0.87 0.88 0.89 0.98 0.98 0.92Significance - - - - Effect size - -0.01 -0.01 - -0.01 -0.03 - -0.02 0.00 - 0.08 0.10
Note: Significance * p<.05, ** p<.01, *** p<.001 Page 30 of 7 1I
University of California-San Diego Your Inst Comp 1 Comp 2 Your Inst Comp 1 Comp 2 Your Inst Comp 1 Comp 2 Your Inst Comp 1 Comp 2First-time, Full-time Freshmen 3,148 5,769 19,463 1,279 2,339 7,124 1,746 3,185 11,412 111 210 777In the past year, how often have you:
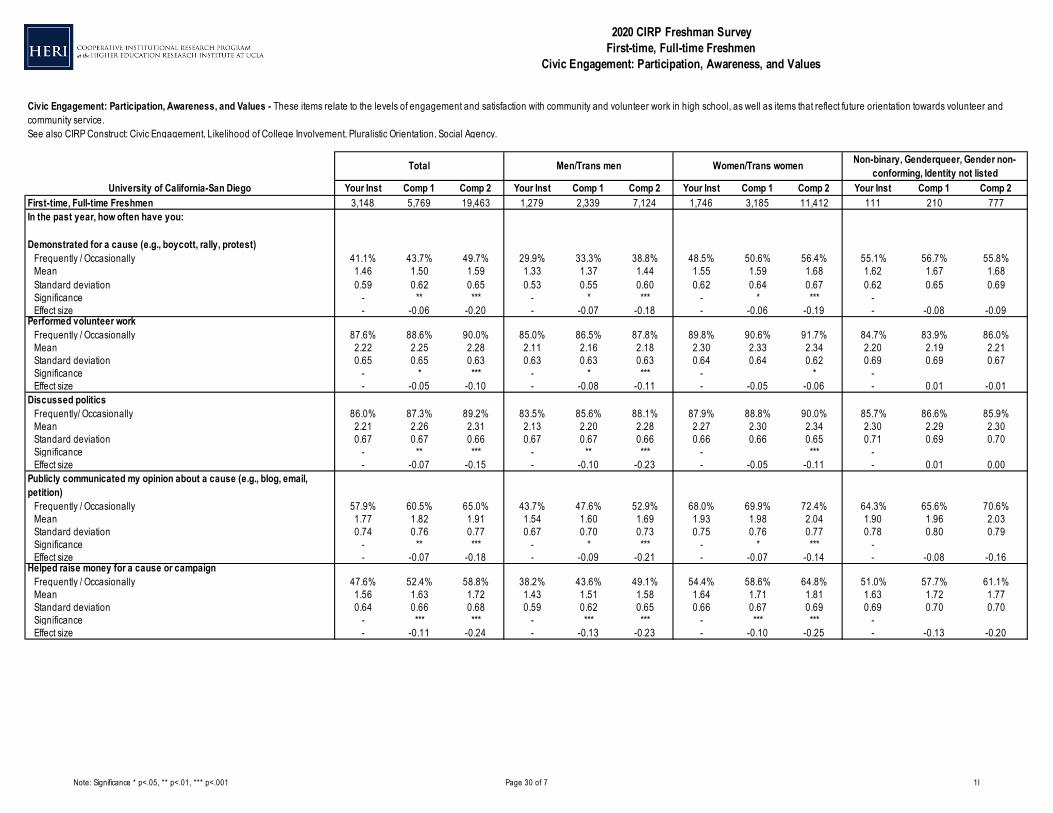
Demonstrated for a cause (e.g., boycott, rally, protest) Frequently / Occasionally 41.1% 43.7% 49.7% 29.9% 33.3% 38.8% 48.5% 50.6% 56.4% 55.1% 56.7% 55.8%
Mean 1.46 1.50 1.59 1.33 1.37 1.44 1.55 1.59 1.68 1.62 1.67 1.68Standard deviation 0.59 0.62 0.65 0.53 0.55 0.60 0.62 0.64 0.67 0.62 0.65 0.69Significance - ** *** - * *** - * *** - Effect size - -0.06 -0.20 - -0.07 -0.18 - -0.06 -0.19 - -0.08 -0.09
Performed volunteer work Frequently / Occasionally 87.6% 88.6% 90.0% 85.0% 86.5% 87.8% 89.8% 90.6% 91.7% 84.7% 83.9% 86.0%
Mean 2.22 2.25 2.28 2.11 2.16 2.18 2.30 2.33 2.34 2.20 2.19 2.21Standard deviation 0.65 0.65 0.63 0.63 0.63 0.63 0.64 0.64 0.62 0.69 0.69 0.67Significance - * *** - * *** - * - Effect size - -0.05 -0.10 - -0.08 -0.11 - -0.05 -0.06 - 0.01 -0.01
Discussed politics Frequently/ Occasionally 86.0% 87.3% 89.2% 83.5% 85.6% 88.1% 87.9% 88.8% 90.0% 85.7% 86.6% 85.9%
Mean 2.21 2.26 2.31 2.13 2.20 2.28 2.27 2.30 2.34 2.30 2.29 2.30Standard deviation 0.67 0.67 0.66 0.67 0.67 0.66 0.66 0.66 0.65 0.71 0.69 0.70Significance - ** *** - ** *** - *** - Effect size - -0.07 -0.15 - -0.10 -0.23 - -0.05 -0.11 - 0.01 0.00
Publicly communicated my opinion about a cause (e.g., blog, email, petition) Frequently / Occasionally 57.9% 60.5% 65.0% 43.7% 47.6% 52.9% 68.0% 69.9% 72.4% 64.3% 65.6% 70.6%
Mean 1.77 1.82 1.91 1.54 1.60 1.69 1.93 1.98 2.04 1.90 1.96 2.03Standard deviation 0.74 0.76 0.77 0.67 0.70 0.73 0.75 0.76 0.77 0.78 0.80 0.79Significance - ** *** - * *** - * *** - Effect size - -0.07 -0.18 - -0.09 -0.21 - -0.07 -0.14 - -0.08 -0.16
Helped raise money for a cause or campaign Frequently / Occasionally 47.6% 52.4% 58.8% 38.2% 43.6% 49.1% 54.4% 58.6% 64.8% 51.0% 57.7% 61.1%
Mean 1.56 1.63 1.72 1.43 1.51 1.58 1.64 1.71 1.81 1.63 1.72 1.77Standard deviation 0.64 0.66 0.68 0.59 0.62 0.65 0.66 0.67 0.69 0.69 0.70 0.70Significance - *** *** - *** *** - *** *** - Effect size - -0.11 -0.24 - -0.13 -0.23 - -0.10 -0.25 - -0.13 -0.20
2020 CIRP Freshman SurveyFirst-time, Full-time Freshmen
Civic Engagement: Participation, Awareness, and Values
Total Men/Trans men Non-binary, Genderqueer, Gender non-conforming, Identity not listed
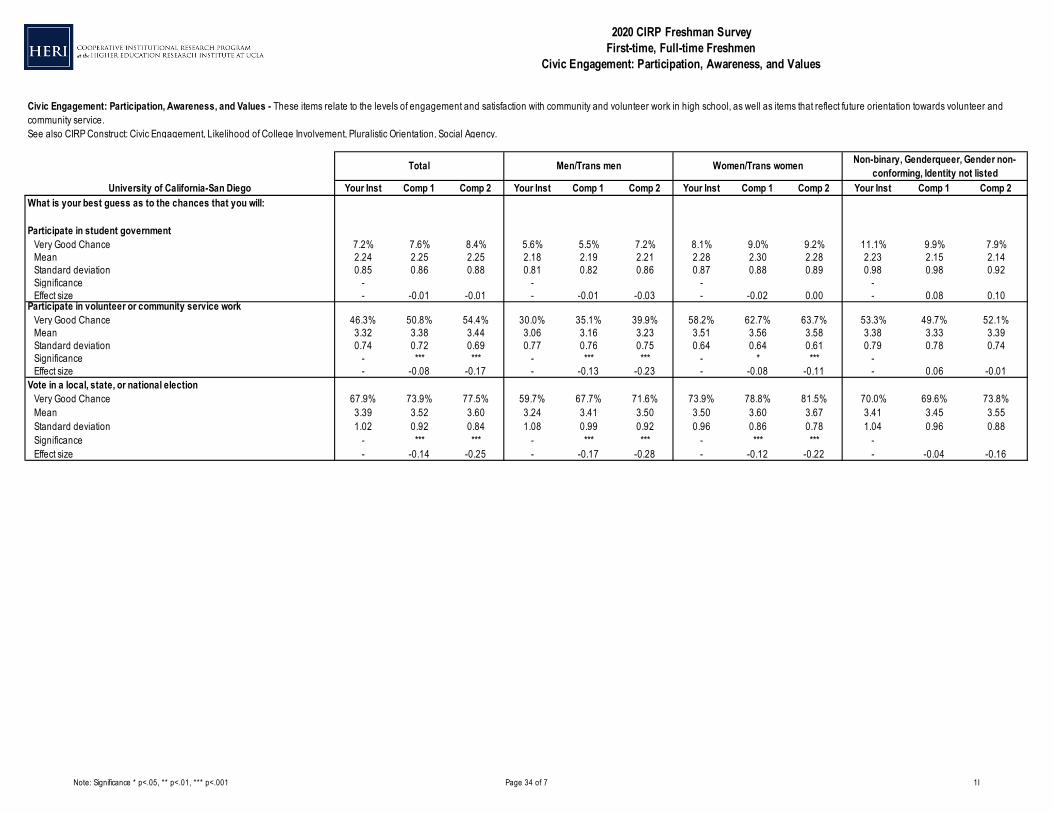
Civic Engagement: Participation, Awareness, and Values - These items relate to the levels of engagement and satisfaction with community and volunteer work in high school, as well as items that reflect future orientation towards volunteer and community service. See also CIRP Construct: Civic Engagement, Likelihood of College Involvement, Pluralistic Orientation, Social Agency.
Women/Trans women
Note: Significance * p<.05, ** p<.01, *** p<.001 Page 31 of 7 1I
University of California-San Diego Your Inst Comp 1 Comp 2 Your Inst Comp 1 Comp 2 Your Inst Comp 1 Comp 2 Your Inst Comp 1 Comp 2
2020 CIRP Freshman SurveyFirst-time, Full-time Freshmen
Civic Engagement: Participation, Awareness, and Values
Total Men/Trans men Non-binary, Genderqueer, Gender non-conforming, Identity not listed
Civic Engagement: Participation, Awareness, and Values - These items relate to the levels of engagement and satisfaction with community and volunteer work in high school, as well as items that reflect future orientation towards volunteer and community service. See also CIRP Construct: Civic Engagement, Likelihood of College Involvement, Pluralistic Orientation, Social Agency.
Women/Trans women
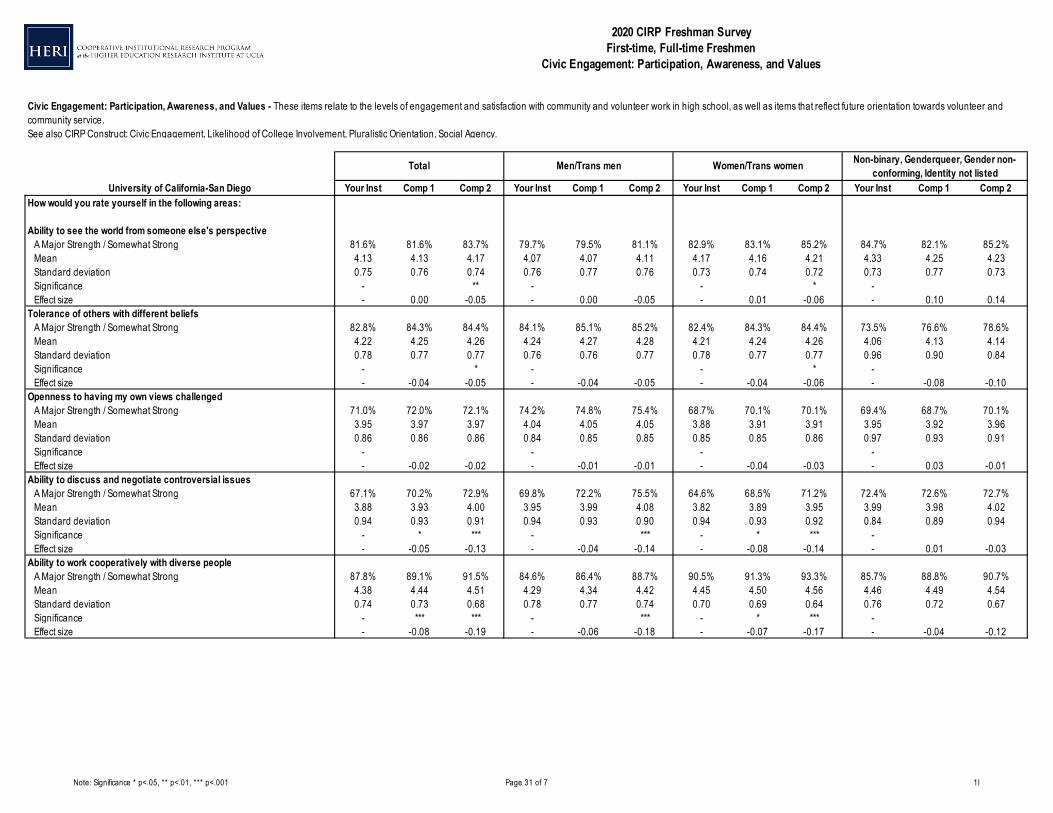
How would you rate yourself in the following areas:
Ability to see the world from someone else's perspective A Major Strength / Somewhat Strong 81.6% 81.6% 83.7% 79.7% 79.5% 81.1% 82.9% 83.1% 85.2% 84.7% 82.1% 85.2%
Mean 4.13 4.13 4.17 4.07 4.07 4.11 4.17 4.16 4.21 4.33 4.25 4.23Standard deviation 0.75 0.76 0.74 0.76 0.77 0.76 0.73 0.74 0.72 0.73 0.77 0.73Significance - ** - - * - Effect size - 0.00 -0.05 - 0.00 -0.05 - 0.01 -0.06 - 0.10 0.14
Tolerance of others with different beliefs A Major Strength / Somewhat Strong 82.8% 84.3% 84.4% 84.1% 85.1% 85.2% 82.4% 84.3% 84.4% 73.5% 76.6% 78.6%
Mean 4.22 4.25 4.26 4.24 4.27 4.28 4.21 4.24 4.26 4.06 4.13 4.14Standard deviation 0.78 0.77 0.77 0.76 0.76 0.77 0.78 0.77 0.77 0.96 0.90 0.84Significance - * - - * - Effect size - -0.04 -0.05 - -0.04 -0.05 - -0.04 -0.06 - -0.08 -0.10
Openness to having my own views challenged A Major Strength / Somewhat Strong 71.0% 72.0% 72.1% 74.2% 74.8% 75.4% 68.7% 70.1% 70.1% 69.4% 68.7% 70.1%
Mean 3.95 3.97 3.97 4.04 4.05 4.05 3.88 3.91 3.91 3.95 3.92 3.96Standard deviation 0.86 0.86 0.86 0.84 0.85 0.85 0.85 0.85 0.86 0.97 0.93 0.91Significance - - - - Effect size - -0.02 -0.02 - -0.01 -0.01 - -0.04 -0.03 - 0.03 -0.01
Ability to discuss and negotiate controversial issues A Major Strength / Somewhat Strong 67.1% 70.2% 72.9% 69.8% 72.2% 75.5% 64.6% 68.5% 71.2% 72.4% 72.6% 72.7%
Mean 3.88 3.93 4.00 3.95 3.99 4.08 3.82 3.89 3.95 3.99 3.98 4.02Standard deviation 0.94 0.93 0.91 0.94 0.93 0.90 0.94 0.93 0.92 0.84 0.89 0.94Significance - * *** - *** - * *** - Effect size - -0.05 -0.13 - -0.04 -0.14 - -0.08 -0.14 - 0.01 -0.03
Ability to work cooperatively with diverse people A Major Strength / Somewhat Strong 87.8% 89.1% 91.5% 84.6% 86.4% 88.7% 90.5% 91.3% 93.3% 85.7% 88.8% 90.7%
Mean 4.38 4.44 4.51 4.29 4.34 4.42 4.45 4.50 4.56 4.46 4.49 4.54Standard deviation 0.74 0.73 0.68 0.78 0.77 0.74 0.70 0.69 0.64 0.76 0.72 0.67Significance - *** *** - *** - * *** - Effect size - -0.08 -0.19 - -0.06 -0.18 - -0.07 -0.17 - -0.04 -0.12
Note: Significance * p<.05, ** p<.01, *** p<.001 Page 32 of 7 1I
University of California-San Diego Your Inst Comp 1 Comp 2 Your Inst Comp 1 Comp 2 Your Inst Comp 1 Comp 2 Your Inst Comp 1 Comp 2
2020 CIRP Freshman SurveyFirst-time, Full-time Freshmen
Civic Engagement: Participation, Awareness, and Values
Total Men/Trans men Non-binary, Genderqueer, Gender non-conforming, Identity not listed
Civic Engagement: Participation, Awareness, and Values - These items relate to the levels of engagement and satisfaction with community and volunteer work in high school, as well as items that reflect future orientation towards volunteer and community service. See also CIRP Construct: Civic Engagement, Likelihood of College Involvement, Pluralistic Orientation, Social Agency.
Women/Trans women
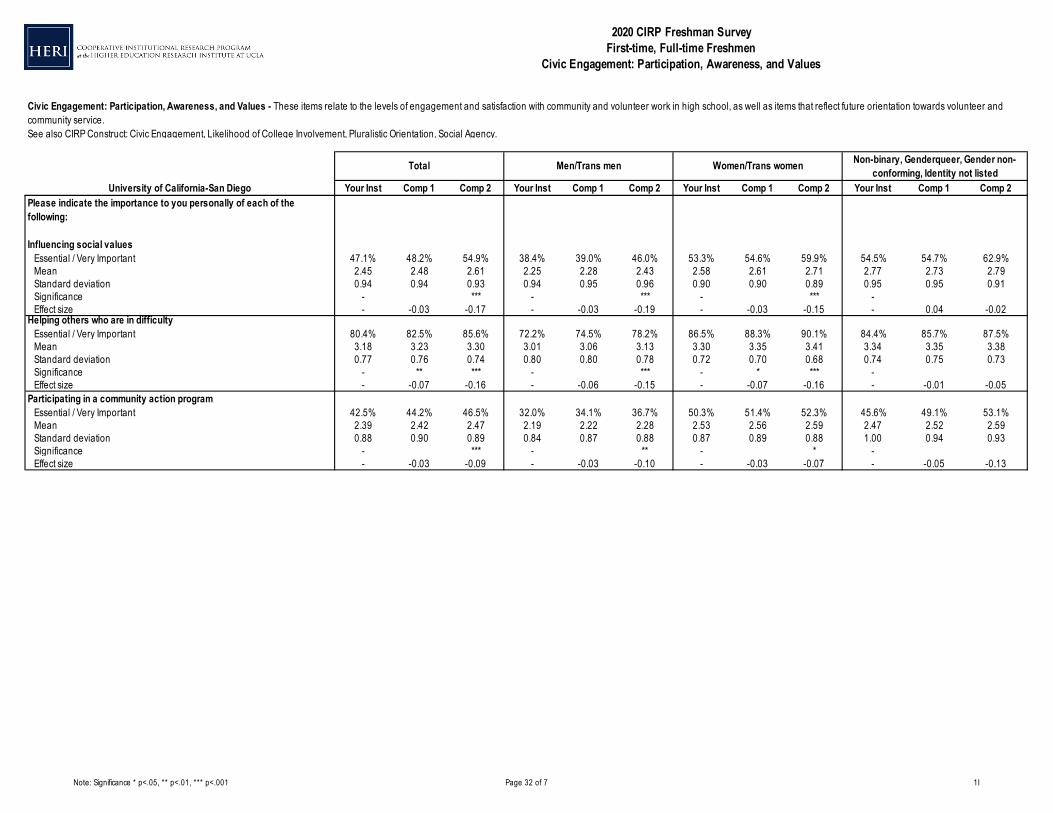
Please indicate the importance to you personally of each of the following:
Influencing social values Essential / Very Important 47.1% 48.2% 54.9% 38.4% 39.0% 46.0% 53.3% 54.6% 59.9% 54.5% 54.7% 62.9%
Mean 2.45 2.48 2.61 2.25 2.28 2.43 2.58 2.61 2.71 2.77 2.73 2.79Standard deviation 0.94 0.94 0.93 0.94 0.95 0.96 0.90 0.90 0.89 0.95 0.95 0.91Significance - *** - *** - *** - Effect size - -0.03 -0.17 - -0.03 -0.19 - -0.03 -0.15 - 0.04 -0.02
Helping others who are in difficulty Essential / Very Important 80.4% 82.5% 85.6% 72.2% 74.5% 78.2% 86.5% 88.3% 90.1% 84.4% 85.7% 87.5%
Mean 3.18 3.23 3.30 3.01 3.06 3.13 3.30 3.35 3.41 3.34 3.35 3.38Standard deviation 0.77 0.76 0.74 0.80 0.80 0.78 0.72 0.70 0.68 0.74 0.75 0.73Significance - ** *** - *** - * *** - Effect size - -0.07 -0.16 - -0.06 -0.15 - -0.07 -0.16 - -0.01 -0.05
Participating in a community action program Essential / Very Important 42.5% 44.2% 46.5% 32.0% 34.1% 36.7% 50.3% 51.4% 52.3% 45.6% 49.1% 53.1%
Mean 2.39 2.42 2.47 2.19 2.22 2.28 2.53 2.56 2.59 2.47 2.52 2.59Standard deviation 0.88 0.90 0.89 0.84 0.87 0.88 0.87 0.89 0.88 1.00 0.94 0.93Significance - *** - ** - * - Effect size - -0.03 -0.09 - -0.03 -0.10 - -0.03 -0.07 - -0.05 -0.13
Note: Significance * p<.05, ** p<.01, *** p<.001 Page 33 of 7 1I
University of California-San Diego Your Inst Comp 1 Comp 2 Your Inst Comp 1 Comp 2 Your Inst Comp 1 Comp 2 Your Inst Comp 1 Comp 2
2020 CIRP Freshman SurveyFirst-time, Full-time Freshmen
Civic Engagement: Participation, Awareness, and Values
Total Men/Trans men Non-binary, Genderqueer, Gender non-conforming, Identity not listed
Civic Engagement: Participation, Awareness, and Values - These items relate to the levels of engagement and satisfaction with community and volunteer work in high school, as well as items that reflect future orientation towards volunteer and community service. See also CIRP Construct: Civic Engagement, Likelihood of College Involvement, Pluralistic Orientation, Social Agency.
Women/Trans women
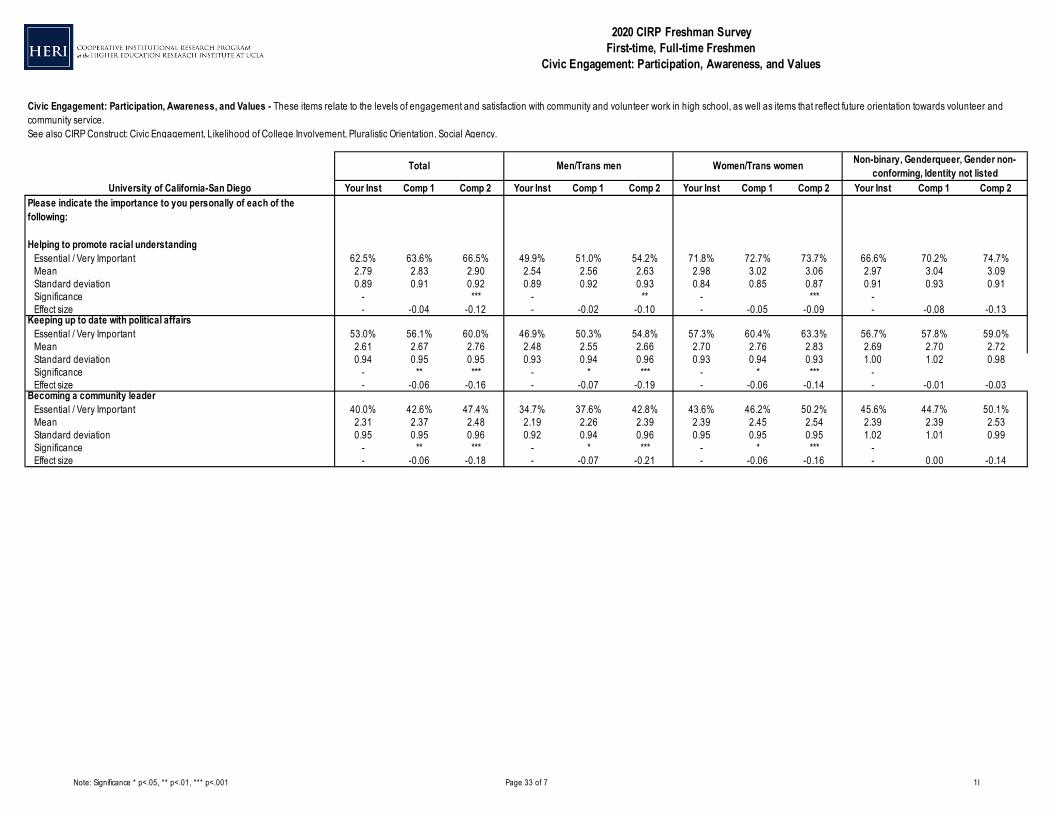
Please indicate the importance to you personally of each of the following:
Helping to promote racial understanding Essential / Very Important 62.5% 63.6% 66.5% 49.9% 51.0% 54.2% 71.8% 72.7% 73.7% 66.6% 70.2% 74.7%
Mean 2.79 2.83 2.90 2.54 2.56 2.63 2.98 3.02 3.06 2.97 3.04 3.09Standard deviation 0.89 0.91 0.92 0.89 0.92 0.93 0.84 0.85 0.87 0.91 0.93 0.91Significance - *** - ** - *** - Effect size - -0.04 -0.12 - -0.02 -0.10 - -0.05 -0.09 - -0.08 -0.13
Keeping up to date with political affairs Essential / Very Important 53.0% 56.1% 60.0% 46.9% 50.3% 54.8% 57.3% 60.4% 63.3% 56.7% 57.8% 59.0%
Mean 2.61 2.67 2.76 2.48 2.55 2.66 2.70 2.76 2.83 2.69 2.70 2.72Standard deviation 0.94 0.95 0.95 0.93 0.94 0.96 0.93 0.94 0.93 1.00 1.02 0.98Significance - ** *** - * *** - * *** - Effect size - -0.06 -0.16 - -0.07 -0.19 - -0.06 -0.14 - -0.01 -0.03
Becoming a community leader Essential / Very Important 40.0% 42.6% 47.4% 34.7% 37.6% 42.8% 43.6% 46.2% 50.2% 45.6% 44.7% 50.1%
Mean 2.31 2.37 2.48 2.19 2.26 2.39 2.39 2.45 2.54 2.39 2.39 2.53Standard deviation 0.95 0.95 0.96 0.92 0.94 0.96 0.95 0.95 0.95 1.02 1.01 0.99Significance - ** *** - * *** - * *** - Effect size - -0.06 -0.18 - -0.07 -0.21 - -0.06 -0.16 - 0.00 -0.14
Note: Significance * p<.05, ** p<.01, *** p<.001 Page 34 of 7 1I
University of California-San Diego Your Inst Comp 1 Comp 2 Your Inst Comp 1 Comp 2 Your Inst Comp 1 Comp 2 Your Inst Comp 1 Comp 2
2020 CIRP Freshman SurveyFirst-time, Full-time Freshmen
Civic Engagement: Participation, Awareness, and Values
Total Men/Trans men Non-binary, Genderqueer, Gender non-conforming, Identity not listed
Civic Engagement: Participation, Awareness, and Values - These items relate to the levels of engagement and satisfaction with community and volunteer work in high school, as well as items that reflect future orientation towards volunteer and community service. See also CIRP Construct: Civic Engagement, Likelihood of College Involvement, Pluralistic Orientation, Social Agency.
Women/Trans women
What is your best guess as to the chances that you will:
Participate in student government Very Good Chance 7.2% 7.6% 8.4% 5.6% 5.5% 7.2% 8.1% 9.0% 9.2% 11.1% 9.9% 7.9%
Mean 2.24 2.25 2.25 2.18 2.19 2.21 2.28 2.30 2.28 2.23 2.15 2.14Standard deviation 0.85 0.86 0.88 0.81 0.82 0.86 0.87 0.88 0.89 0.98 0.98 0.92Significance - - - - Effect size - -0.01 -0.01 - -0.01 -0.03 - -0.02 0.00 - 0.08 0.10
Participate in volunteer or community service work Very Good Chance 46.3% 50.8% 54.4% 30.0% 35.1% 39.9% 58.2% 62.7% 63.7% 53.3% 49.7% 52.1%
Mean 3.32 3.38 3.44 3.06 3.16 3.23 3.51 3.56 3.58 3.38 3.33 3.39Standard deviation 0.74 0.72 0.69 0.77 0.76 0.75 0.64 0.64 0.61 0.79 0.78 0.74Significance - *** *** - *** *** - * *** - Effect size - -0.08 -0.17 - -0.13 -0.23 - -0.08 -0.11 - 0.06 -0.01
Vote in a local, state, or national election Very Good Chance 67.9% 73.9% 77.5% 59.7% 67.7% 71.6% 73.9% 78.8% 81.5% 70.0% 69.6% 73.8%
Mean 3.39 3.52 3.60 3.24 3.41 3.50 3.50 3.60 3.67 3.41 3.45 3.55Standard deviation 1.02 0.92 0.84 1.08 0.99 0.92 0.96 0.86 0.78 1.04 0.96 0.88Significance - *** *** - *** *** - *** *** - Effect size - -0.14 -0.25 - -0.17 -0.28 - -0.12 -0.22 - -0.04 -0.16
Note: Significance * p<.05, ** p<.01, *** p<.001 Page 35 of 5 1J
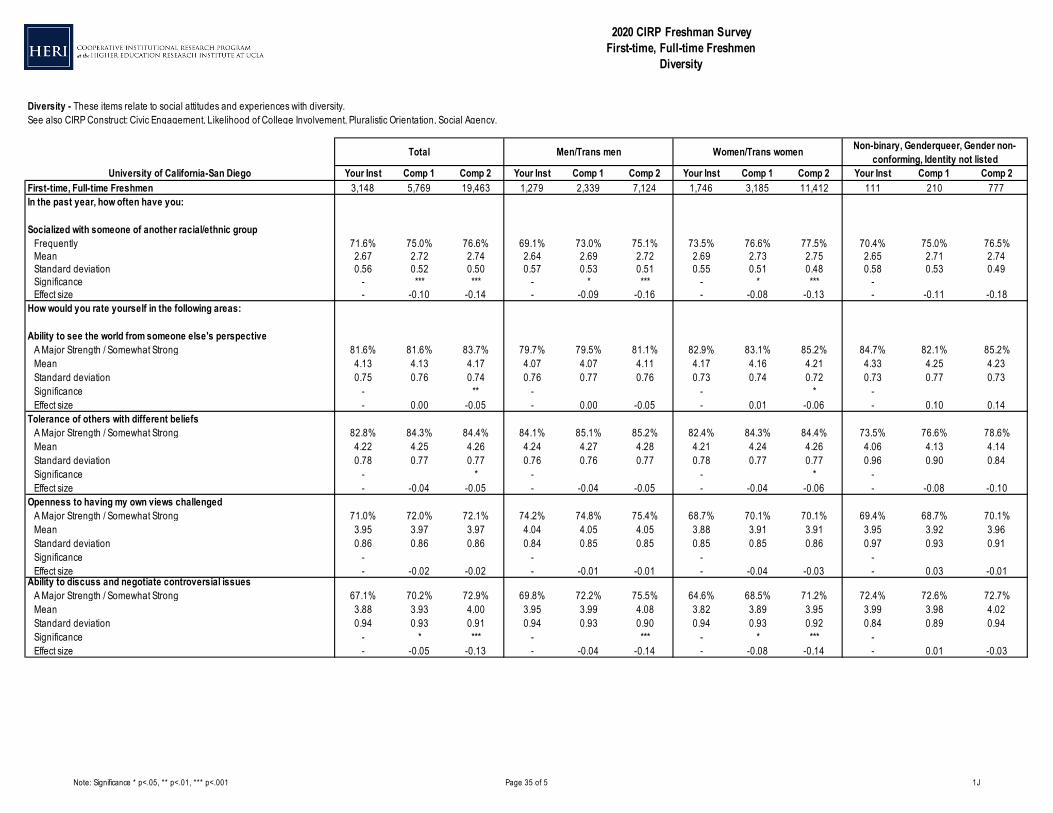
University of California-San Diego Your Inst Comp 1 Comp 2 Your Inst Comp 1 Comp 2 Your Inst Comp 1 Comp 2 Your Inst Comp 1 Comp 2First-time, Full-time Freshmen 3,148 5,769 19,463 1,279 2,339 7,124 1,746 3,185 11,412 111 210 777In the past year, how often have you:
Socialized with someone of another racial/ethnic group Frequently 71.6% 75.0% 76.6% 69.1% 73.0% 75.1% 73.5% 76.6% 77.5% 70.4% 75.0% 76.5%
Mean 2.67 2.72 2.74 2.64 2.69 2.72 2.69 2.73 2.75 2.65 2.71 2.74Standard deviation 0.56 0.52 0.50 0.57 0.53 0.51 0.55 0.51 0.48 0.58 0.53 0.49Significance - *** *** - * *** - * *** - Effect size - -0.10 -0.14 - -0.09 -0.16 - -0.08 -0.13 - -0.11 -0.18
How would you rate yourself in the following areas:
Ability to see the world from someone else's perspective A Major Strength / Somewhat Strong 81.6% 81.6% 83.7% 79.7% 79.5% 81.1% 82.9% 83.1% 85.2% 84.7% 82.1% 85.2%
Mean 4.13 4.13 4.17 4.07 4.07 4.11 4.17 4.16 4.21 4.33 4.25 4.23Standard deviation 0.75 0.76 0.74 0.76 0.77 0.76 0.73 0.74 0.72 0.73 0.77 0.73Significance - ** - - * - Effect size - 0.00 -0.05 - 0.00 -0.05 - 0.01 -0.06 - 0.10 0.14
Tolerance of others with different beliefs A Major Strength / Somewhat Strong 82.8% 84.3% 84.4% 84.1% 85.1% 85.2% 82.4% 84.3% 84.4% 73.5% 76.6% 78.6%
Mean 4.22 4.25 4.26 4.24 4.27 4.28 4.21 4.24 4.26 4.06 4.13 4.14Standard deviation 0.78 0.77 0.77 0.76 0.76 0.77 0.78 0.77 0.77 0.96 0.90 0.84Significance - * - - * - Effect size - -0.04 -0.05 - -0.04 -0.05 - -0.04 -0.06 - -0.08 -0.10
Openness to having my own views challenged A Major Strength / Somewhat Strong 71.0% 72.0% 72.1% 74.2% 74.8% 75.4% 68.7% 70.1% 70.1% 69.4% 68.7% 70.1%
Mean 3.95 3.97 3.97 4.04 4.05 4.05 3.88 3.91 3.91 3.95 3.92 3.96Standard deviation 0.86 0.86 0.86 0.84 0.85 0.85 0.85 0.85 0.86 0.97 0.93 0.91Significance - - - - Effect size - -0.02 -0.02 - -0.01 -0.01 - -0.04 -0.03 - 0.03 -0.01
Ability to discuss and negotiate controversial issues A Major Strength / Somewhat Strong 67.1% 70.2% 72.9% 69.8% 72.2% 75.5% 64.6% 68.5% 71.2% 72.4% 72.6% 72.7%
Mean 3.88 3.93 4.00 3.95 3.99 4.08 3.82 3.89 3.95 3.99 3.98 4.02Standard deviation 0.94 0.93 0.91 0.94 0.93 0.90 0.94 0.93 0.92 0.84 0.89 0.94Significance - * *** - *** - * *** - Effect size - -0.05 -0.13 - -0.04 -0.14 - -0.08 -0.14 - 0.01 -0.03
2020 CIRP Freshman SurveyFirst-time, Full-time Freshmen
Diversity
Total Men/Trans men Non-binary, Genderqueer, Gender non-conforming, Identity not listed
Diversity - These items relate to social attitudes and experiences with diversity.See also CIRP Construct: Civic Engagement, Likelihood of College Involvement, Pluralistic Orientation, Social Agency.
Women/Trans women
Note: Significance * p<.05, ** p<.01, *** p<.001 Page 36 of 5 1J
University of California-San Diego Your Inst Comp 1 Comp 2 Your Inst Comp 1 Comp 2 Your Inst Comp 1 Comp 2 Your Inst Comp 1 Comp 2
2020 CIRP Freshman SurveyFirst-time, Full-time Freshmen
Diversity
Total Men/Trans men Non-binary, Genderqueer, Gender non-conforming, Identity not listed
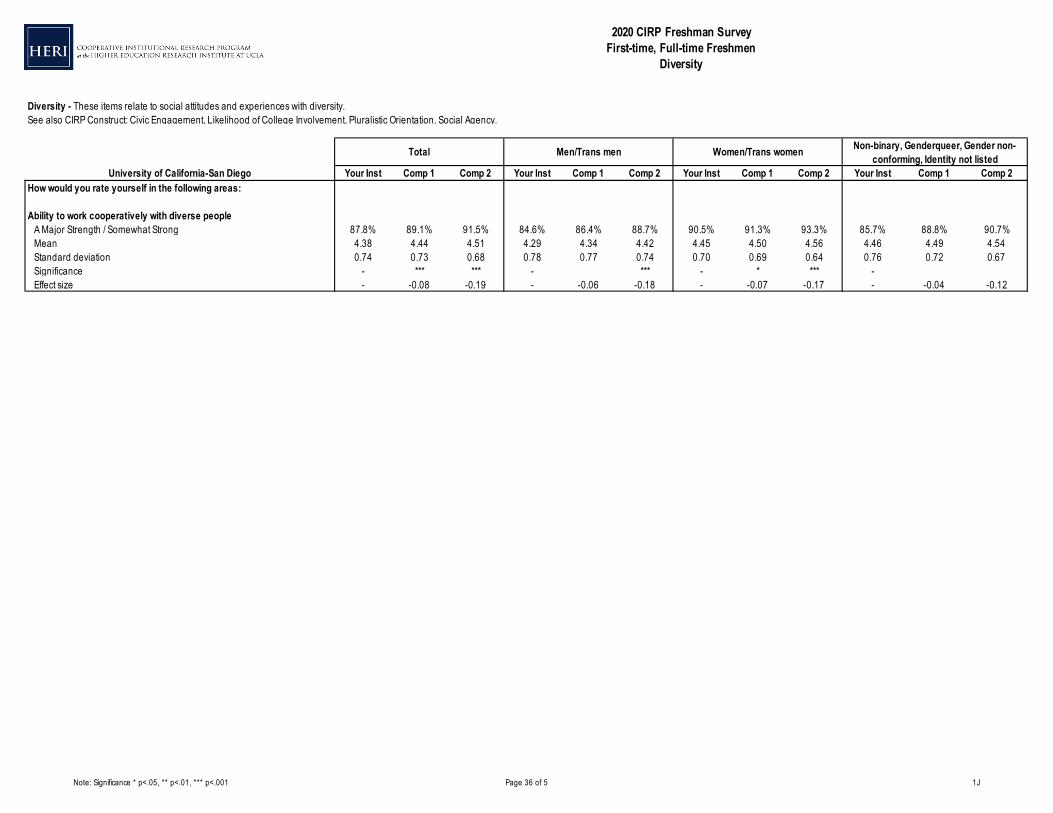
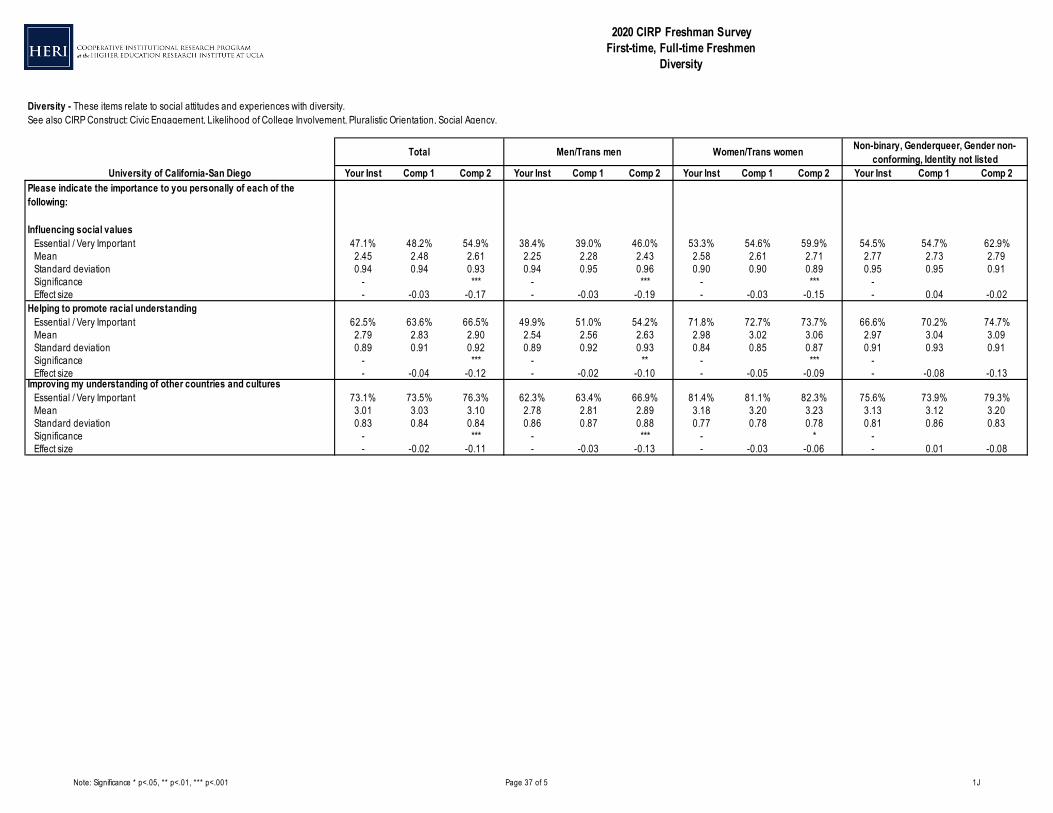
Diversity - These items relate to social attitudes and experiences with diversity.See also CIRP Construct: Civic Engagement, Likelihood of College Involvement, Pluralistic Orientation, Social Agency.
Women/Trans women
How would you rate yourself in the following areas:
Ability to work cooperatively with diverse people A Major Strength / Somewhat Strong 87.8% 89.1% 91.5% 84.6% 86.4% 88.7% 90.5% 91.3% 93.3% 85.7% 88.8% 90.7%
Mean 4.38 4.44 4.51 4.29 4.34 4.42 4.45 4.50 4.56 4.46 4.49 4.54Standard deviation 0.74 0.73 0.68 0.78 0.77 0.74 0.70 0.69 0.64 0.76 0.72 0.67Significance - *** *** - *** - * *** - Effect size - -0.08 -0.19 - -0.06 -0.18 - -0.07 -0.17 - -0.04 -0.12
Note: Significance * p<.05, ** p<.01, *** p<.001 Page 37 of 5 1J
University of California-San Diego Your Inst Comp 1 Comp 2 Your Inst Comp 1 Comp 2 Your Inst Comp 1 Comp 2 Your Inst Comp 1 Comp 2
2020 CIRP Freshman SurveyFirst-time, Full-time Freshmen
Diversity
Total Men/Trans men Non-binary, Genderqueer, Gender non-conforming, Identity not listed
Diversity - These items relate to social attitudes and experiences with diversity.See also CIRP Construct: Civic Engagement, Likelihood of College Involvement, Pluralistic Orientation, Social Agency.
Women/Trans women
Please indicate the importance to you personally of each of the following:
Influencing social values Essential / Very Important 47.1% 48.2% 54.9% 38.4% 39.0% 46.0% 53.3% 54.6% 59.9% 54.5% 54.7% 62.9%
Mean 2.45 2.48 2.61 2.25 2.28 2.43 2.58 2.61 2.71 2.77 2.73 2.79Standard deviation 0.94 0.94 0.93 0.94 0.95 0.96 0.90 0.90 0.89 0.95 0.95 0.91Significance - *** - *** - *** - Effect size - -0.03 -0.17 - -0.03 -0.19 - -0.03 -0.15 - 0.04 -0.02
Helping to promote racial understanding Essential / Very Important 62.5% 63.6% 66.5% 49.9% 51.0% 54.2% 71.8% 72.7% 73.7% 66.6% 70.2% 74.7%
Mean 2.79 2.83 2.90 2.54 2.56 2.63 2.98 3.02 3.06 2.97 3.04 3.09Standard deviation 0.89 0.91 0.92 0.89 0.92 0.93 0.84 0.85 0.87 0.91 0.93 0.91Significance - *** - ** - *** - Effect size - -0.04 -0.12 - -0.02 -0.10 - -0.05 -0.09 - -0.08 -0.13
Improving my understanding of other countries and cultures Essential / Very Important 73.1% 73.5% 76.3% 62.3% 63.4% 66.9% 81.4% 81.1% 82.3% 75.6% 73.9% 79.3%
Mean 3.01 3.03 3.10 2.78 2.81 2.89 3.18 3.20 3.23 3.13 3.12 3.20Standard deviation 0.83 0.84 0.84 0.86 0.87 0.88 0.77 0.78 0.78 0.81 0.86 0.83Significance - *** - *** - * - Effect size - -0.02 -0.11 - -0.03 -0.13 - -0.03 -0.06 - 0.01 -0.08
Note: Significance * p<.05, ** p<.01, *** p<.001 Page 38 of 3 1K
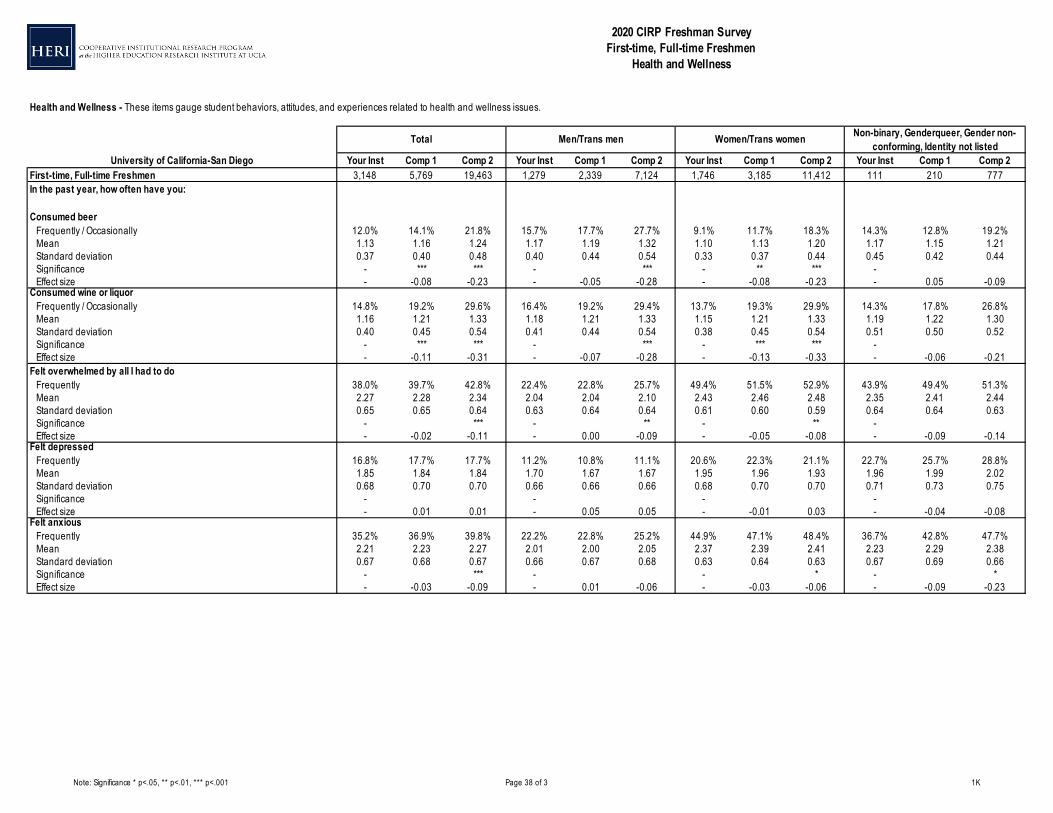
University of California-San Diego Your Inst Comp 1 Comp 2 Your Inst Comp 1 Comp 2 Your Inst Comp 1 Comp 2 Your Inst Comp 1 Comp 2First-time, Full-time Freshmen 3,148 5,769 19,463 1,279 2,339 7,124 1,746 3,185 11,412 111 210 777In the past year, how often have you:
Consumed beer Frequently / Occasionally 12.0% 14.1% 21.8% 15.7% 17.7% 27.7% 9.1% 11.7% 18.3% 14.3% 12.8% 19.2%
Mean 1.13 1.16 1.24 1.17 1.19 1.32 1.10 1.13 1.20 1.17 1.15 1.21Standard deviation 0.37 0.40 0.48 0.40 0.44 0.54 0.33 0.37 0.44 0.45 0.42 0.44Significance - *** *** - *** - ** *** - Effect size - -0.08 -0.23 - -0.05 -0.28 - -0.08 -0.23 - 0.05 -0.09
Consumed wine or liquor Frequently / Occasionally 14.8% 19.2% 29.6% 16.4% 19.2% 29.4% 13.7% 19.3% 29.9% 14.3% 17.8% 26.8%
Mean 1.16 1.21 1.33 1.18 1.21 1.33 1.15 1.21 1.33 1.19 1.22 1.30Standard deviation 0.40 0.45 0.54 0.41 0.44 0.54 0.38 0.45 0.54 0.51 0.50 0.52Significance - *** *** - *** - *** *** - Effect size - -0.11 -0.31 - -0.07 -0.28 - -0.13 -0.33 - -0.06 -0.21
Felt overwhelmed by all I had to do Frequently 38.0% 39.7% 42.8% 22.4% 22.8% 25.7% 49.4% 51.5% 52.9% 43.9% 49.4% 51.3%
Mean 2.27 2.28 2.34 2.04 2.04 2.10 2.43 2.46 2.48 2.35 2.41 2.44Standard deviation 0.65 0.65 0.64 0.63 0.64 0.64 0.61 0.60 0.59 0.64 0.64 0.63Significance - *** - ** - ** - Effect size - -0.02 -0.11 - 0.00 -0.09 - -0.05 -0.08 - -0.09 -0.14
Felt depressed Frequently 16.8% 17.7% 17.7% 11.2% 10.8% 11.1% 20.6% 22.3% 21.1% 22.7% 25.7% 28.8%
Mean 1.85 1.84 1.84 1.70 1.67 1.67 1.95 1.96 1.93 1.96 1.99 2.02Standard deviation 0.68 0.70 0.70 0.66 0.66 0.66 0.68 0.70 0.70 0.71 0.73 0.75Significance - - - - Effect size - 0.01 0.01 - 0.05 0.05 - -0.01 0.03 - -0.04 -0.08
Felt anxious Frequently 35.2% 36.9% 39.8% 22.2% 22.8% 25.2% 44.9% 47.1% 48.4% 36.7% 42.8% 47.7%
Mean 2.21 2.23 2.27 2.01 2.00 2.05 2.37 2.39 2.41 2.23 2.29 2.38Standard deviation 0.67 0.68 0.67 0.66 0.67 0.68 0.63 0.64 0.63 0.67 0.69 0.66Significance - *** - - * - *Effect size - -0.03 -0.09 - 0.01 -0.06 - -0.03 -0.06 - -0.09 -0.23
2020 CIRP Freshman SurveyFirst-time, Full-time Freshmen
Health and Wellness
Total Men/Trans men Non-binary, Genderqueer, Gender non-conforming, Identity not listed
Health and Wellness - These items gauge student behaviors, attitudes, and experiences related to health and wellness issues.
Women/Trans women
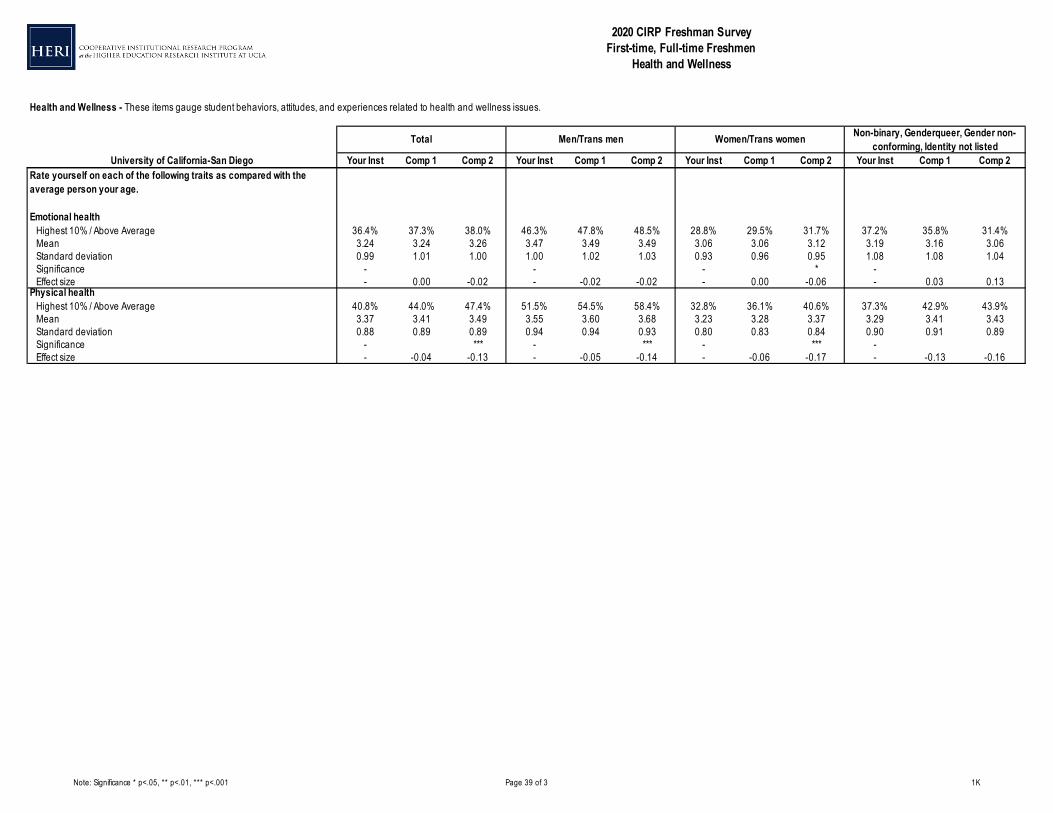
Note: Significance * p<.05, ** p<.01, *** p<.001 Page 39 of 3 1K
University of California-San Diego Your Inst Comp 1 Comp 2 Your Inst Comp 1 Comp 2 Your Inst Comp 1 Comp 2 Your Inst Comp 1 Comp 2
2020 CIRP Freshman SurveyFirst-time, Full-time Freshmen
Health and Wellness
Total Men/Trans men Non-binary, Genderqueer, Gender non-conforming, Identity not listed
Health and Wellness - These items gauge student behaviors, attitudes, and experiences related to health and wellness issues.
Women/Trans women
Rate yourself on each of the following traits as compared with the average person your age.
Emotional health Highest 10% / Above Average 36.4% 37.3% 38.0% 46.3% 47.8% 48.5% 28.8% 29.5% 31.7% 37.2% 35.8% 31.4%
Mean 3.24 3.24 3.26 3.47 3.49 3.49 3.06 3.06 3.12 3.19 3.16 3.06Standard deviation 0.99 1.01 1.00 1.00 1.02 1.03 0.93 0.96 0.95 1.08 1.08 1.04Significance - - - * - Effect size - 0.00 -0.02 - -0.02 -0.02 - 0.00 -0.06 - 0.03 0.13
Physical health Highest 10% / Above Average 40.8% 44.0% 47.4% 51.5% 54.5% 58.4% 32.8% 36.1% 40.6% 37.3% 42.9% 43.9%
Mean 3.37 3.41 3.49 3.55 3.60 3.68 3.23 3.28 3.37 3.29 3.41 3.43Standard deviation 0.88 0.89 0.89 0.94 0.94 0.93 0.80 0.83 0.84 0.90 0.91 0.89Significance - *** - *** - *** - Effect size - -0.04 -0.13 - -0.05 -0.14 - -0.06 -0.17 - -0.13 -0.16
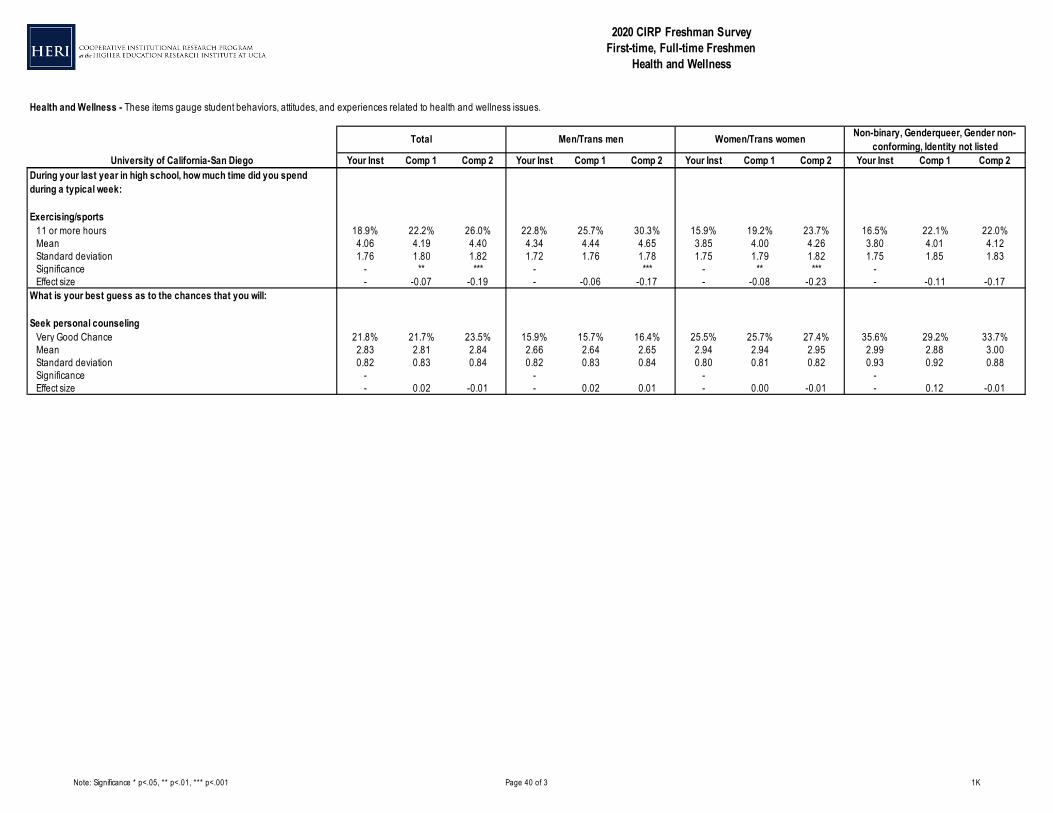
Note: Significance * p<.05, ** p<.01, *** p<.001 Page 40 of 3 1K
University of California-San Diego Your Inst Comp 1 Comp 2 Your Inst Comp 1 Comp 2 Your Inst Comp 1 Comp 2 Your Inst Comp 1 Comp 2
2020 CIRP Freshman SurveyFirst-time, Full-time Freshmen
Health and Wellness
Total Men/Trans men Non-binary, Genderqueer, Gender non-conforming, Identity not listed
Health and Wellness - These items gauge student behaviors, attitudes, and experiences related to health and wellness issues.
Women/Trans women
During your last year in high school, how much time did you spend during a typical week:
Exercising/sports 11 or more hours 18.9% 22.2% 26.0% 22.8% 25.7% 30.3% 15.9% 19.2% 23.7% 16.5% 22.1% 22.0%
Mean 4.06 4.19 4.40 4.34 4.44 4.65 3.85 4.00 4.26 3.80 4.01 4.12Standard deviation 1.76 1.80 1.82 1.72 1.76 1.78 1.75 1.79 1.82 1.75 1.85 1.83Significance - ** *** - *** - ** *** - Effect size - -0.07 -0.19 - -0.06 -0.17 - -0.08 -0.23 - -0.11 -0.17
What is your best guess as to the chances that you will:
Seek personal counseling Very Good Chance 21.8% 21.7% 23.5% 15.9% 15.7% 16.4% 25.5% 25.7% 27.4% 35.6% 29.2% 33.7%
Mean 2.83 2.81 2.84 2.66 2.64 2.65 2.94 2.94 2.95 2.99 2.88 3.00Standard deviation 0.82 0.83 0.84 0.82 0.83 0.84 0.80 0.81 0.82 0.93 0.92 0.88Significance - - - - Effect size - 0.02 -0.01 - 0.02 0.01 - 0.00 -0.01 - 0.12 -0.01

Note: Significance * p<.05, ** p<.01, *** p<.001 Page 41 of 5 1L
University of California-San Diego Your Inst Comp 1 Comp 2 Your Inst Comp 1 Comp 2 Your Inst Comp 1 Comp 2 Your Inst Comp 1 Comp 2First-time, Full-time Freshmen 3,148 5,769 19,463 1,279 2,339 7,124 1,746 3,185 11,412 111 210 777Your probable major Theology/Religion 0.0% 0.0% 0.2% 0.1% 0.1% 0.2% 0.0% 0.0% 0.2% 0.0% 0.0% 0.0%Intended Career Clergy 0.0% 0.0% 0.1% 0.0% 0.0% 0.1% 0.0% 0.0% 0.0% 0.0% 0.0% 0.1%Your current religious preference: Agnostic 14.2% 14.4% 13.4% 15.7% 15.9% 15.4% 13.0% 13.3% 12.1% 14.4% 14.8% 15.4%
Atheist 14.7% 14.0% 11.1% 17.1% 16.6% 13.1% 13.1% 12.2% 10.0% 11.3% 10.2% 9.6%Baptist 1.4% 4.6% 4.8% 1.4% 4.6% 4.7% 1.3% 4.5% 4.9% 2.1% 4.5% 4.4%Buddhist 4.3% 2.9% 1.7% 3.7% 2.4% 1.6% 4.9% 3.3% 1.9% 3.1% 1.7% 1.0%Church of Christ 2.6% 2.6% 2.9% 2.3% 2.4% 2.9% 2.8% 2.5% 2.8% 4.1% 4.5% 4.7%Eastern Orthodox 0.7% 0.7% 0.7% 0.7% 0.9% 0.8% 0.8% 0.6% 0.7% 0.0% 0.0% 0.3%Episcopalian 0.2% 1.0% 1.1% 0.1% 0.7% 0.8% 0.3% 1.1% 1.2% 1.0% 1.7% 1.3%Hindu 4.4% 4.6% 3.0% 5.4% 5.9% 3.5% 3.8% 3.8% 2.7% 2.1% 1.1% 1.2%Jewish 1.3% 1.4% 4.1% 1.5% 1.6% 4.2% 1.3% 1.4% 4.0% 0.0% 0.6% 3.0%Lutheran 0.6% 0.8% 1.4% 0.8% 0.8% 1.3% 0.5% 0.8% 1.5% 1.0% 1.1% 1.8%Methodist 0.3% 1.9% 2.0% 0.3% 1.5% 1.7% 0.4% 2.3% 2.2% 0.0% 2.8% 2.1%Muslim 2.1% 1.9% 2.0% 2.0% 1.7% 1.8% 2.3% 2.1% 2.1% 2.1% 1.7% 2.4%Presbyterian 1.4% 2.1% 2.4% 1.4% 1.8% 2.3% 1.6% 2.4% 2.6% 0.0% 0.6% 1.2%Quaker 0.0% 0.1% 0.1% 0.0% 0.0% 0.0% 0.0% 0.1% 0.1% 0.0% 0.6% 0.1%Roman Catholic 14.6% 13.6% 18.1% 12.9% 12.9% 18.0% 15.7% 14.1% 18.3% 17.5% 13.1% 17.5%Seventh-day Adventist 0.2% 0.2% 0.2% 0.1% 0.1% 0.1% 0.2% 0.2% 0.2% 1.0% 0.6% 0.6%The Church of Jesus Christ of Latter-day Saints 0.2% 0.3% 0.3% 0.2% 0.2% 0.3% 0.3% 0.3% 0.2% 1.0% 0.6% 0.1%United Church of Christ/Congregational 0.1% 0.2% 0.3% 0.0% 0.2% 0.3% 0.1% 0.2% 0.4% 0.0% 0.0% 0.1%Other Christian 9.1% 10.5% 11.8% 9.0% 9.3% 9.6% 9.0% 11.1% 13.0% 11.3% 14.2% 12.6%Other religion(s)/belief(s) 3.1% 3.0% 3.0% 2.9% 2.5% 2.6% 3.0% 3.0% 3.1% 7.2% 6.8% 5.8%None 24.2% 19.4% 15.6% 22.8% 18.1% 15.1% 25.6% 20.5% 15.9% 20.6% 18.8% 14.8%
2020 CIRP Freshman SurveyFirst-time, Full-time Freshmen
Spirituality/Religiosity
Total Men/Trans men Non-binary, Genderqueer, Gender non-conforming, Identity not listed
Spirituality/Religiosity - These items relate to religious and spiritual practices and beliefs.
Women/Trans women
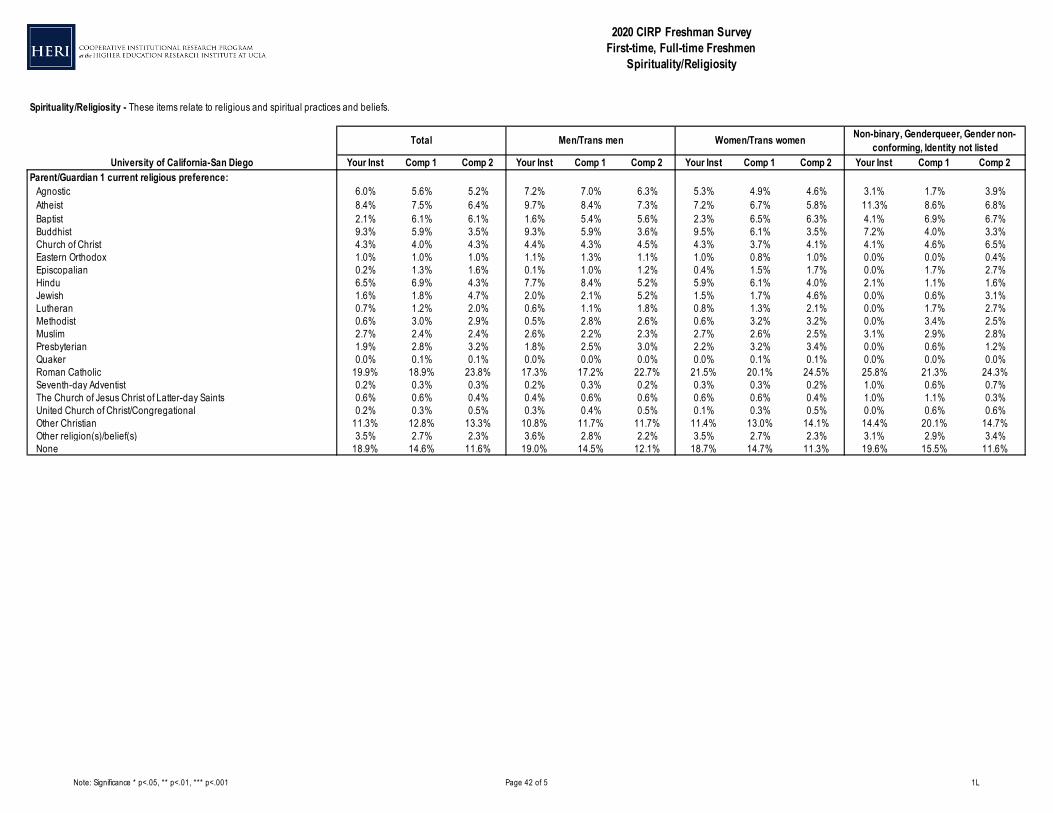
Note: Significance * p<.05, ** p<.01, *** p<.001 Page 42 of 5 1L
University of California-San Diego Your Inst Comp 1 Comp 2 Your Inst Comp 1 Comp 2 Your Inst Comp 1 Comp 2 Your Inst Comp 1 Comp 2
2020 CIRP Freshman SurveyFirst-time, Full-time Freshmen
Spirituality/Religiosity
Total Men/Trans men Non-binary, Genderqueer, Gender non-conforming, Identity not listed
Spirituality/Religiosity - These items relate to religious and spiritual practices and beliefs.
Women/Trans women
Parent/Guardian 1 current religious preference: Agnostic 6.0% 5.6% 5.2% 7.2% 7.0% 6.3% 5.3% 4.9% 4.6% 3.1% 1.7% 3.9%
Atheist 8.4% 7.5% 6.4% 9.7% 8.4% 7.3% 7.2% 6.7% 5.8% 11.3% 8.6% 6.8%Baptist 2.1% 6.1% 6.1% 1.6% 5.4% 5.6% 2.3% 6.5% 6.3% 4.1% 6.9% 6.7%Buddhist 9.3% 5.9% 3.5% 9.3% 5.9% 3.6% 9.5% 6.1% 3.5% 7.2% 4.0% 3.3%Church of Christ 4.3% 4.0% 4.3% 4.4% 4.3% 4.5% 4.3% 3.7% 4.1% 4.1% 4.6% 6.5%Eastern Orthodox 1.0% 1.0% 1.0% 1.1% 1.3% 1.1% 1.0% 0.8% 1.0% 0.0% 0.0% 0.4%Episcopalian 0.2% 1.3% 1.6% 0.1% 1.0% 1.2% 0.4% 1.5% 1.7% 0.0% 1.7% 2.7%Hindu 6.5% 6.9% 4.3% 7.7% 8.4% 5.2% 5.9% 6.1% 4.0% 2.1% 1.1% 1.6%Jewish 1.6% 1.8% 4.7% 2.0% 2.1% 5.2% 1.5% 1.7% 4.6% 0.0% 0.6% 3.1%Lutheran 0.7% 1.2% 2.0% 0.6% 1.1% 1.8% 0.8% 1.3% 2.1% 0.0% 1.7% 2.7%Methodist 0.6% 3.0% 2.9% 0.5% 2.8% 2.6% 0.6% 3.2% 3.2% 0.0% 3.4% 2.5%Muslim 2.7% 2.4% 2.4% 2.6% 2.2% 2.3% 2.7% 2.6% 2.5% 3.1% 2.9% 2.8%Presbyterian 1.9% 2.8% 3.2% 1.8% 2.5% 3.0% 2.2% 3.2% 3.4% 0.0% 0.6% 1.2%Quaker 0.0% 0.1% 0.1% 0.0% 0.0% 0.0% 0.0% 0.1% 0.1% 0.0% 0.0% 0.0%Roman Catholic 19.9% 18.9% 23.8% 17.3% 17.2% 22.7% 21.5% 20.1% 24.5% 25.8% 21.3% 24.3%Seventh-day Adventist 0.2% 0.3% 0.3% 0.2% 0.3% 0.2% 0.3% 0.3% 0.2% 1.0% 0.6% 0.7%The Church of Jesus Christ of Latter-day Saints 0.6% 0.6% 0.4% 0.4% 0.6% 0.6% 0.6% 0.6% 0.4% 1.0% 1.1% 0.3%United Church of Christ/Congregational 0.2% 0.3% 0.5% 0.3% 0.4% 0.5% 0.1% 0.3% 0.5% 0.0% 0.6% 0.6%Other Christian 11.3% 12.8% 13.3% 10.8% 11.7% 11.7% 11.4% 13.0% 14.1% 14.4% 20.1% 14.7%Other religion(s)/belief(s) 3.5% 2.7% 2.3% 3.6% 2.8% 2.2% 3.5% 2.7% 2.3% 3.1% 2.9% 3.4%None 18.9% 14.6% 11.6% 19.0% 14.5% 12.1% 18.7% 14.7% 11.3% 19.6% 15.5% 11.6%
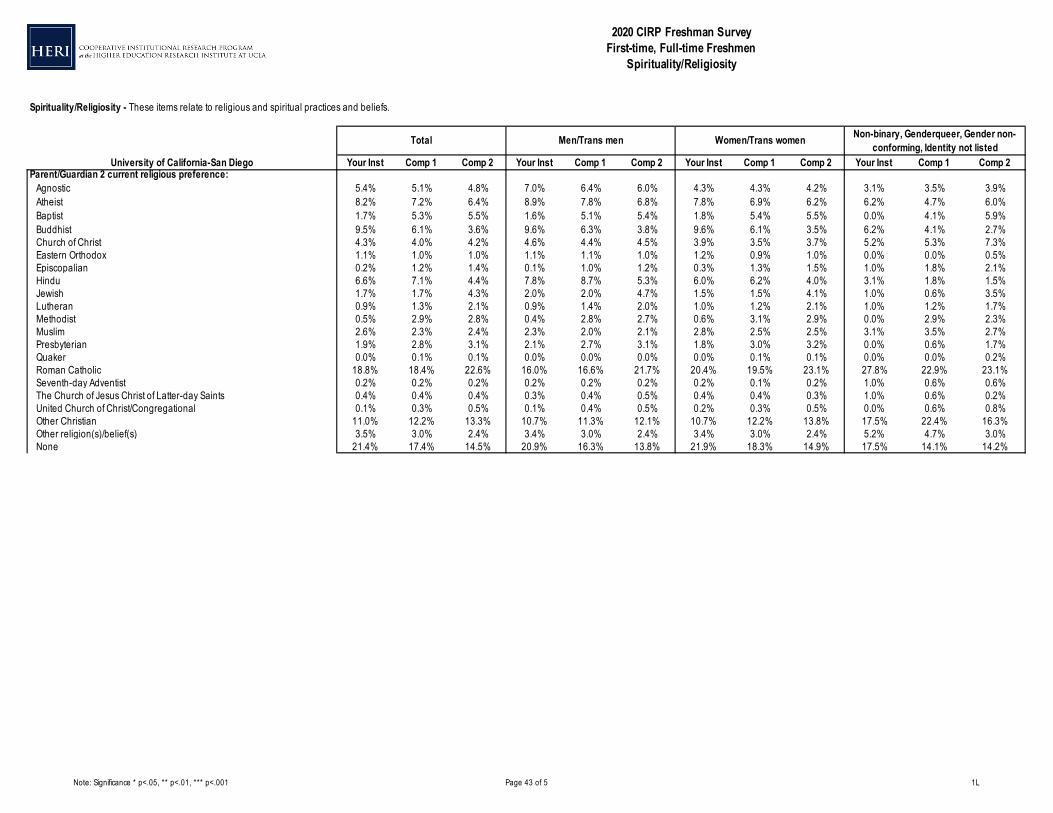
Note: Significance * p<.05, ** p<.01, *** p<.001 Page 43 of 5 1L
University of California-San Diego Your Inst Comp 1 Comp 2 Your Inst Comp 1 Comp 2 Your Inst Comp 1 Comp 2 Your Inst Comp 1 Comp 2
2020 CIRP Freshman SurveyFirst-time, Full-time Freshmen
Spirituality/Religiosity
Total Men/Trans men Non-binary, Genderqueer, Gender non-conforming, Identity not listed
Spirituality/Religiosity - These items relate to religious and spiritual practices and beliefs.
Women/Trans women
Parent/Guardian 2 current religious preference: Agnostic 5.4% 5.1% 4.8% 7.0% 6.4% 6.0% 4.3% 4.3% 4.2% 3.1% 3.5% 3.9%
Atheist 8.2% 7.2% 6.4% 8.9% 7.8% 6.8% 7.8% 6.9% 6.2% 6.2% 4.7% 6.0%Baptist 1.7% 5.3% 5.5% 1.6% 5.1% 5.4% 1.8% 5.4% 5.5% 0.0% 4.1% 5.9%Buddhist 9.5% 6.1% 3.6% 9.6% 6.3% 3.8% 9.6% 6.1% 3.5% 6.2% 4.1% 2.7%Church of Christ 4.3% 4.0% 4.2% 4.6% 4.4% 4.5% 3.9% 3.5% 3.7% 5.2% 5.3% 7.3%Eastern Orthodox 1.1% 1.0% 1.0% 1.1% 1.1% 1.0% 1.2% 0.9% 1.0% 0.0% 0.0% 0.5%Episcopalian 0.2% 1.2% 1.4% 0.1% 1.0% 1.2% 0.3% 1.3% 1.5% 1.0% 1.8% 2.1%Hindu 6.6% 7.1% 4.4% 7.8% 8.7% 5.3% 6.0% 6.2% 4.0% 3.1% 1.8% 1.5%Jewish 1.7% 1.7% 4.3% 2.0% 2.0% 4.7% 1.5% 1.5% 4.1% 1.0% 0.6% 3.5%Lutheran 0.9% 1.3% 2.1% 0.9% 1.4% 2.0% 1.0% 1.2% 2.1% 1.0% 1.2% 1.7%Methodist 0.5% 2.9% 2.8% 0.4% 2.8% 2.7% 0.6% 3.1% 2.9% 0.0% 2.9% 2.3%Muslim 2.6% 2.3% 2.4% 2.3% 2.0% 2.1% 2.8% 2.5% 2.5% 3.1% 3.5% 2.7%Presbyterian 1.9% 2.8% 3.1% 2.1% 2.7% 3.1% 1.8% 3.0% 3.2% 0.0% 0.6% 1.7%Quaker 0.0% 0.1% 0.1% 0.0% 0.0% 0.0% 0.0% 0.1% 0.1% 0.0% 0.0% 0.2%Roman Catholic 18.8% 18.4% 22.6% 16.0% 16.6% 21.7% 20.4% 19.5% 23.1% 27.8% 22.9% 23.1%Seventh-day Adventist 0.2% 0.2% 0.2% 0.2% 0.2% 0.2% 0.2% 0.1% 0.2% 1.0% 0.6% 0.6%The Church of Jesus Christ of Latter-day Saints 0.4% 0.4% 0.4% 0.3% 0.4% 0.5% 0.4% 0.4% 0.3% 1.0% 0.6% 0.2%United Church of Christ/Congregational 0.1% 0.3% 0.5% 0.1% 0.4% 0.5% 0.2% 0.3% 0.5% 0.0% 0.6% 0.8%Other Christian 11.0% 12.2% 13.3% 10.7% 11.3% 12.1% 10.7% 12.2% 13.8% 17.5% 22.4% 16.3%Other religion(s)/belief(s) 3.5% 3.0% 2.4% 3.4% 3.0% 2.4% 3.4% 3.0% 2.4% 5.2% 4.7% 3.0%None 21.4% 17.4% 14.5% 20.9% 16.3% 13.8% 21.9% 18.3% 14.9% 17.5% 14.1% 14.2%
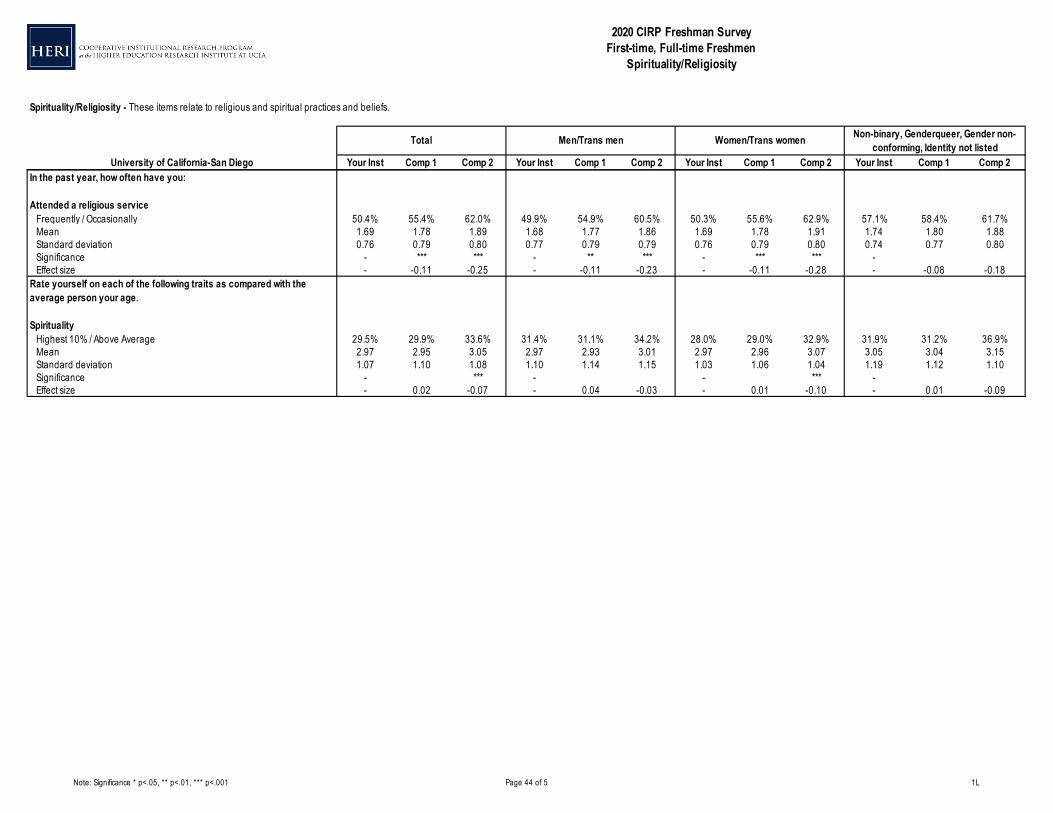
Note: Significance * p<.05, ** p<.01, *** p<.001 Page 44 of 5 1L
University of California-San Diego Your Inst Comp 1 Comp 2 Your Inst Comp 1 Comp 2 Your Inst Comp 1 Comp 2 Your Inst Comp 1 Comp 2
2020 CIRP Freshman SurveyFirst-time, Full-time Freshmen
Spirituality/Religiosity
Total Men/Trans men Non-binary, Genderqueer, Gender non-conforming, Identity not listed
Spirituality/Religiosity - These items relate to religious and spiritual practices and beliefs.
Women/Trans women
In the past year, how often have you:
Attended a religious service Frequently / Occasionally 50.4% 55.4% 62.0% 49.9% 54.9% 60.5% 50.3% 55.6% 62.9% 57.1% 58.4% 61.7%
Mean 1.69 1.78 1.89 1.68 1.77 1.86 1.69 1.78 1.91 1.74 1.80 1.88Standard deviation 0.76 0.79 0.80 0.77 0.79 0.79 0.76 0.79 0.80 0.74 0.77 0.80Significance - *** *** - ** *** - *** *** - Effect size - -0.11 -0.25 - -0.11 -0.23 - -0.11 -0.28 - -0.08 -0.18
Rate yourself on each of the following traits as compared with the average person your age.
Spirituality Highest 10% / Above Average 29.5% 29.9% 33.6% 31.4% 31.1% 34.2% 28.0% 29.0% 32.9% 31.9% 31.2% 36.9%
Mean 2.97 2.95 3.05 2.97 2.93 3.01 2.97 2.96 3.07 3.05 3.04 3.15Standard deviation 1.07 1.10 1.08 1.10 1.14 1.15 1.03 1.06 1.04 1.19 1.12 1.10Significance - *** - - *** - Effect size - 0.02 -0.07 - 0.04 -0.03 - 0.01 -0.10 - 0.01 -0.09
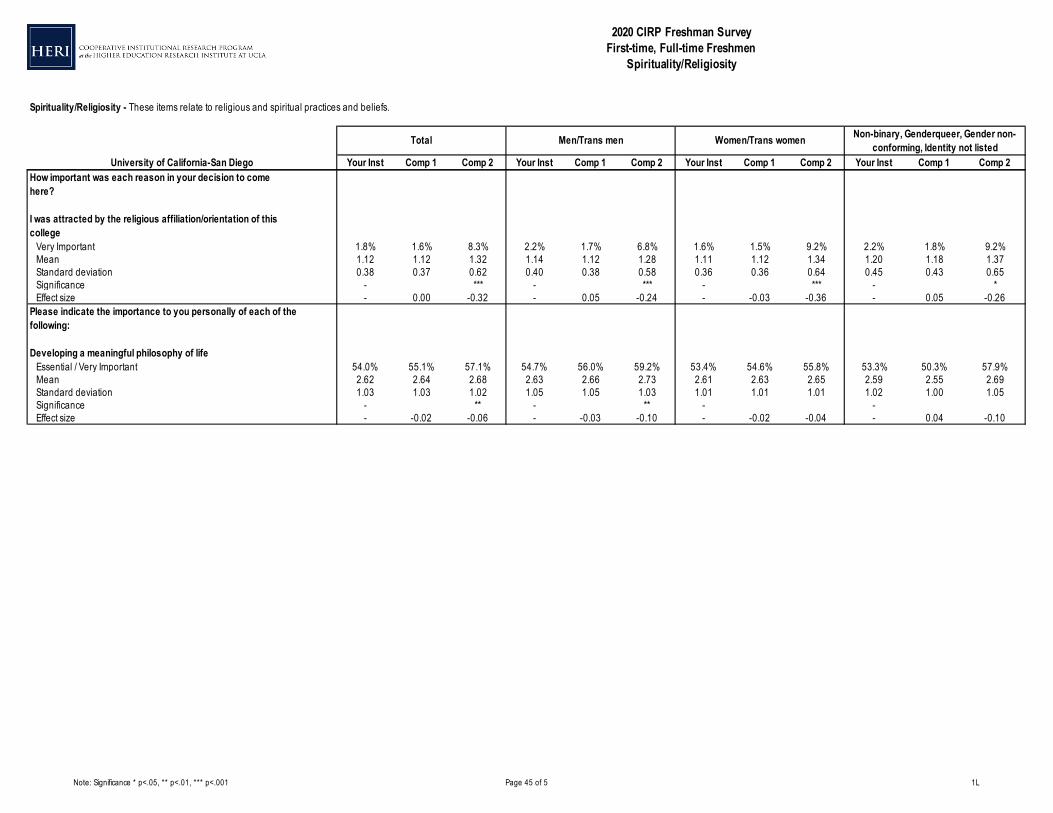
Note: Significance * p<.05, ** p<.01, *** p<.001 Page 45 of 5 1L
University of California-San Diego Your Inst Comp 1 Comp 2 Your Inst Comp 1 Comp 2 Your Inst Comp 1 Comp 2 Your Inst Comp 1 Comp 2
2020 CIRP Freshman SurveyFirst-time, Full-time Freshmen
Spirituality/Religiosity
Total Men/Trans men Non-binary, Genderqueer, Gender non-conforming, Identity not listed
Spirituality/Religiosity - These items relate to religious and spiritual practices and beliefs.
Women/Trans women
How important was each reason in your decision to comehere?
I was attracted by the religious affiliation/orientation of thiscollege Very Important 1.8% 1.6% 8.3% 2.2% 1.7% 6.8% 1.6% 1.5% 9.2% 2.2% 1.8% 9.2%
Mean 1.12 1.12 1.32 1.14 1.12 1.28 1.11 1.12 1.34 1.20 1.18 1.37Standard deviation 0.38 0.37 0.62 0.40 0.38 0.58 0.36 0.36 0.64 0.45 0.43 0.65Significance - *** - *** - *** - *Effect size - 0.00 -0.32 - 0.05 -0.24 - -0.03 -0.36 - 0.05 -0.26
Please indicate the importance to you personally of each of the following:
Developing a meaningful philosophy of life Essential / Very Important 54.0% 55.1% 57.1% 54.7% 56.0% 59.2% 53.4% 54.6% 55.8% 53.3% 50.3% 57.9%
Mean 2.62 2.64 2.68 2.63 2.66 2.73 2.61 2.63 2.65 2.59 2.55 2.69Standard deviation 1.03 1.03 1.02 1.05 1.05 1.03 1.01 1.01 1.01 1.02 1.00 1.05Significance - ** - ** - - Effect size - -0.02 -0.06 - -0.03 -0.10 - -0.02 -0.04 - 0.04 -0.10
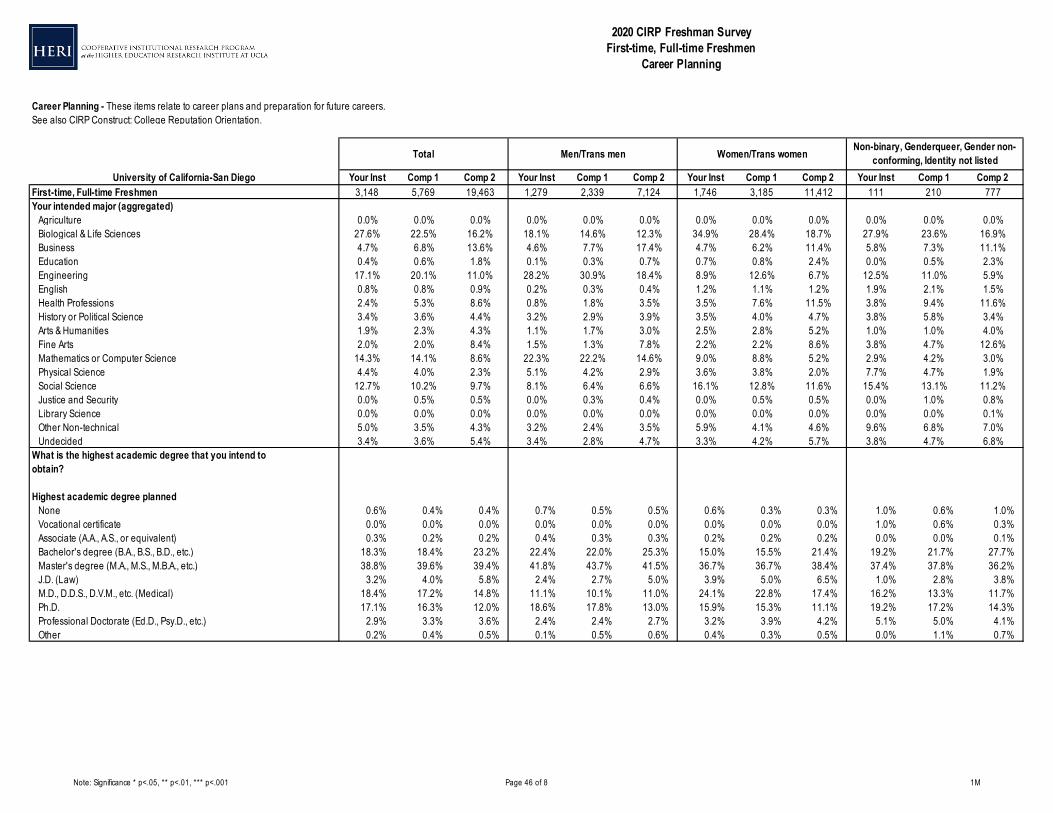
Note: Significance * p<.05, ** p<.01, *** p<.001 Page 46 of 8 1M
University of California-San Diego Your Inst Comp 1 Comp 2 Your Inst Comp 1 Comp 2 Your Inst Comp 1 Comp 2 Your Inst Comp 1 Comp 2First-time, Full-time Freshmen 3,148 5,769 19,463 1,279 2,339 7,124 1,746 3,185 11,412 111 210 777Your intended major (aggregated) Agriculture 0.0% 0.0% 0.0% 0.0% 0.0% 0.0% 0.0% 0.0% 0.0% 0.0% 0.0% 0.0%
Biological & Life Sciences 27.6% 22.5% 16.2% 18.1% 14.6% 12.3% 34.9% 28.4% 18.7% 27.9% 23.6% 16.9%Business 4.7% 6.8% 13.6% 4.6% 7.7% 17.4% 4.7% 6.2% 11.4% 5.8% 7.3% 11.1%Education 0.4% 0.6% 1.8% 0.1% 0.3% 0.7% 0.7% 0.8% 2.4% 0.0% 0.5% 2.3%Engineering 17.1% 20.1% 11.0% 28.2% 30.9% 18.4% 8.9% 12.6% 6.7% 12.5% 11.0% 5.9%English 0.8% 0.8% 0.9% 0.2% 0.3% 0.4% 1.2% 1.1% 1.2% 1.9% 2.1% 1.5%Health Professions 2.4% 5.3% 8.6% 0.8% 1.8% 3.5% 3.5% 7.6% 11.5% 3.8% 9.4% 11.6%History or Political Science 3.4% 3.6% 4.4% 3.2% 2.9% 3.9% 3.5% 4.0% 4.7% 3.8% 5.8% 3.4%Arts & Humanities 1.9% 2.3% 4.3% 1.1% 1.7% 3.0% 2.5% 2.8% 5.2% 1.0% 1.0% 4.0%Fine Arts 2.0% 2.0% 8.4% 1.5% 1.3% 7.8% 2.2% 2.2% 8.6% 3.8% 4.7% 12.6%Mathematics or Computer Science 14.3% 14.1% 8.6% 22.3% 22.2% 14.6% 9.0% 8.8% 5.2% 2.9% 4.2% 3.0%Physical Science 4.4% 4.0% 2.3% 5.1% 4.2% 2.9% 3.6% 3.8% 2.0% 7.7% 4.7% 1.9%Social Science 12.7% 10.2% 9.7% 8.1% 6.4% 6.6% 16.1% 12.8% 11.6% 15.4% 13.1% 11.2%Justice and Security 0.0% 0.5% 0.5% 0.0% 0.3% 0.4% 0.0% 0.5% 0.5% 0.0% 1.0% 0.8%Library Science 0.0% 0.0% 0.0% 0.0% 0.0% 0.0% 0.0% 0.0% 0.0% 0.0% 0.0% 0.1%Other Non-technical 5.0% 3.5% 4.3% 3.2% 2.4% 3.5% 5.9% 4.1% 4.6% 9.6% 6.8% 7.0%Undecided 3.4% 3.6% 5.4% 3.4% 2.8% 4.7% 3.3% 4.2% 5.7% 3.8% 4.7% 6.8%
What is the highest academic degree that you intend toobtain?
Highest academic degree planned None 0.6% 0.4% 0.4% 0.7% 0.5% 0.5% 0.6% 0.3% 0.3% 1.0% 0.6% 1.0%
Vocational certificate 0.0% 0.0% 0.0% 0.0% 0.0% 0.0% 0.0% 0.0% 0.0% 1.0% 0.6% 0.3%Associate (A.A., A.S., or equivalent) 0.3% 0.2% 0.2% 0.4% 0.3% 0.3% 0.2% 0.2% 0.2% 0.0% 0.0% 0.1%Bachelor's degree (B.A., B.S., B.D., etc.) 18.3% 18.4% 23.2% 22.4% 22.0% 25.3% 15.0% 15.5% 21.4% 19.2% 21.7% 27.7%Master's degree (M.A., M.S., M.B.A., etc.) 38.8% 39.6% 39.4% 41.8% 43.7% 41.5% 36.7% 36.7% 38.4% 37.4% 37.8% 36.2%J.D. (Law) 3.2% 4.0% 5.8% 2.4% 2.7% 5.0% 3.9% 5.0% 6.5% 1.0% 2.8% 3.8%M.D., D.D.S., D.V.M., etc. (Medical) 18.4% 17.2% 14.8% 11.1% 10.1% 11.0% 24.1% 22.8% 17.4% 16.2% 13.3% 11.7%Ph.D. 17.1% 16.3% 12.0% 18.6% 17.8% 13.0% 15.9% 15.3% 11.1% 19.2% 17.2% 14.3%Professional Doctorate (Ed.D., Psy.D., etc.) 2.9% 3.3% 3.6% 2.4% 2.4% 2.7% 3.2% 3.9% 4.2% 5.1% 5.0% 4.1%Other 0.2% 0.4% 0.5% 0.1% 0.5% 0.6% 0.4% 0.3% 0.5% 0.0% 1.1% 0.7%
2020 CIRP Freshman SurveyFirst-time, Full-time Freshmen
Career Planning
Total Men/Trans men Non-binary, Genderqueer, Gender non-conforming, Identity not listed
Career Planning - These items relate to career plans and preparation for future careers.See also CIRP Construct: College Reputation Orientation.
Women/Trans women
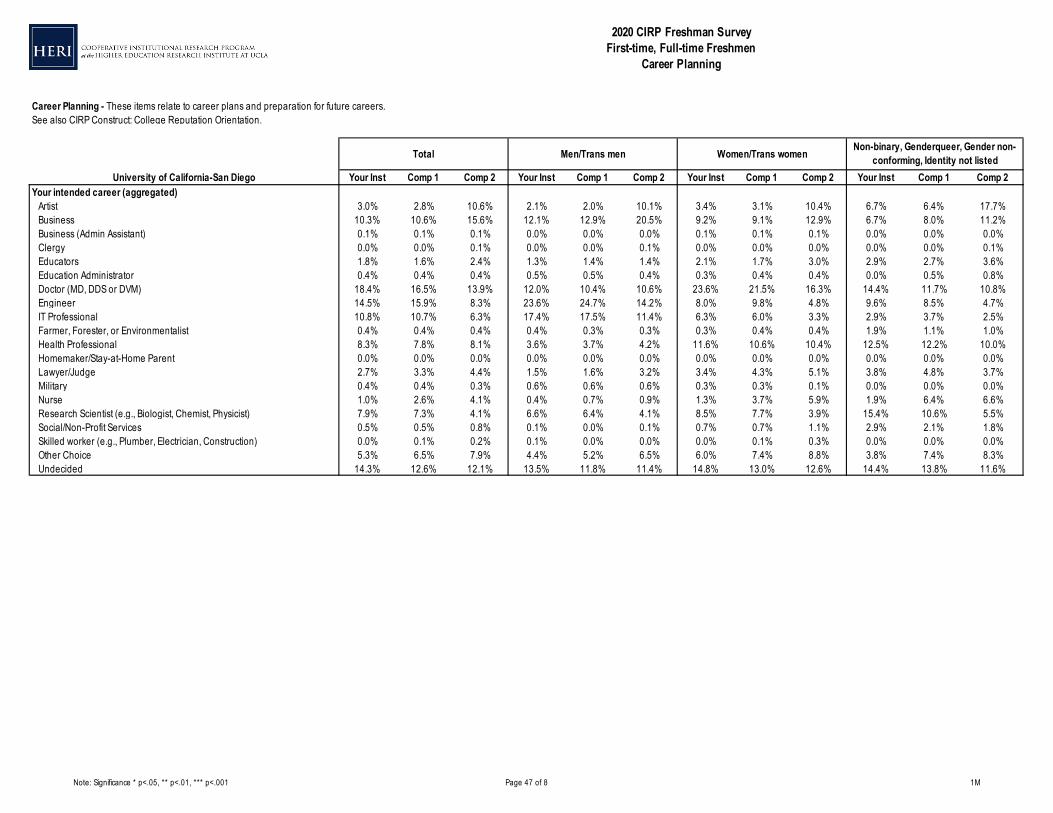
Note: Significance * p<.05, ** p<.01, *** p<.001 Page 47 of 8 1M
University of California-San Diego Your Inst Comp 1 Comp 2 Your Inst Comp 1 Comp 2 Your Inst Comp 1 Comp 2 Your Inst Comp 1 Comp 2
2020 CIRP Freshman SurveyFirst-time, Full-time Freshmen
Career Planning
Total Men/Trans men Non-binary, Genderqueer, Gender non-conforming, Identity not listed
Career Planning - These items relate to career plans and preparation for future careers.See also CIRP Construct: College Reputation Orientation.
Women/Trans women
Your intended career (aggregated) Artist 3.0% 2.8% 10.6% 2.1% 2.0% 10.1% 3.4% 3.1% 10.4% 6.7% 6.4% 17.7%
Business 10.3% 10.6% 15.6% 12.1% 12.9% 20.5% 9.2% 9.1% 12.9% 6.7% 8.0% 11.2%Business (Admin Assistant) 0.1% 0.1% 0.1% 0.0% 0.0% 0.0% 0.1% 0.1% 0.1% 0.0% 0.0% 0.0%Clergy 0.0% 0.0% 0.1% 0.0% 0.0% 0.1% 0.0% 0.0% 0.0% 0.0% 0.0% 0.1%Educators 1.8% 1.6% 2.4% 1.3% 1.4% 1.4% 2.1% 1.7% 3.0% 2.9% 2.7% 3.6%Education Administrator 0.4% 0.4% 0.4% 0.5% 0.5% 0.4% 0.3% 0.4% 0.4% 0.0% 0.5% 0.8%Doctor (MD, DDS or DVM) 18.4% 16.5% 13.9% 12.0% 10.4% 10.6% 23.6% 21.5% 16.3% 14.4% 11.7% 10.8%Engineer 14.5% 15.9% 8.3% 23.6% 24.7% 14.2% 8.0% 9.8% 4.8% 9.6% 8.5% 4.7%IT Professional 10.8% 10.7% 6.3% 17.4% 17.5% 11.4% 6.3% 6.0% 3.3% 2.9% 3.7% 2.5%Farmer, Forester, or Environmentalist 0.4% 0.4% 0.4% 0.4% 0.3% 0.3% 0.3% 0.4% 0.4% 1.9% 1.1% 1.0%Health Professional 8.3% 7.8% 8.1% 3.6% 3.7% 4.2% 11.6% 10.6% 10.4% 12.5% 12.2% 10.0%Homemaker/Stay-at-Home Parent 0.0% 0.0% 0.0% 0.0% 0.0% 0.0% 0.0% 0.0% 0.0% 0.0% 0.0% 0.0%Lawyer/Judge 2.7% 3.3% 4.4% 1.5% 1.6% 3.2% 3.4% 4.3% 5.1% 3.8% 4.8% 3.7%Military 0.4% 0.4% 0.3% 0.6% 0.6% 0.6% 0.3% 0.3% 0.1% 0.0% 0.0% 0.0%Nurse 1.0% 2.6% 4.1% 0.4% 0.7% 0.9% 1.3% 3.7% 5.9% 1.9% 6.4% 6.6%Research Scientist (e.g., Biologist, Chemist, Physicist) 7.9% 7.3% 4.1% 6.6% 6.4% 4.1% 8.5% 7.7% 3.9% 15.4% 10.6% 5.5%Social/Non-Profit Services 0.5% 0.5% 0.8% 0.1% 0.0% 0.1% 0.7% 0.7% 1.1% 2.9% 2.1% 1.8%Skilled worker (e.g., Plumber, Electrician, Construction) 0.0% 0.1% 0.2% 0.1% 0.0% 0.0% 0.0% 0.1% 0.3% 0.0% 0.0% 0.0%Other Choice 5.3% 6.5% 7.9% 4.4% 5.2% 6.5% 6.0% 7.4% 8.8% 3.8% 7.4% 8.3%Undecided 14.3% 12.6% 12.1% 13.5% 11.8% 11.4% 14.8% 13.0% 12.6% 14.4% 13.8% 11.6%
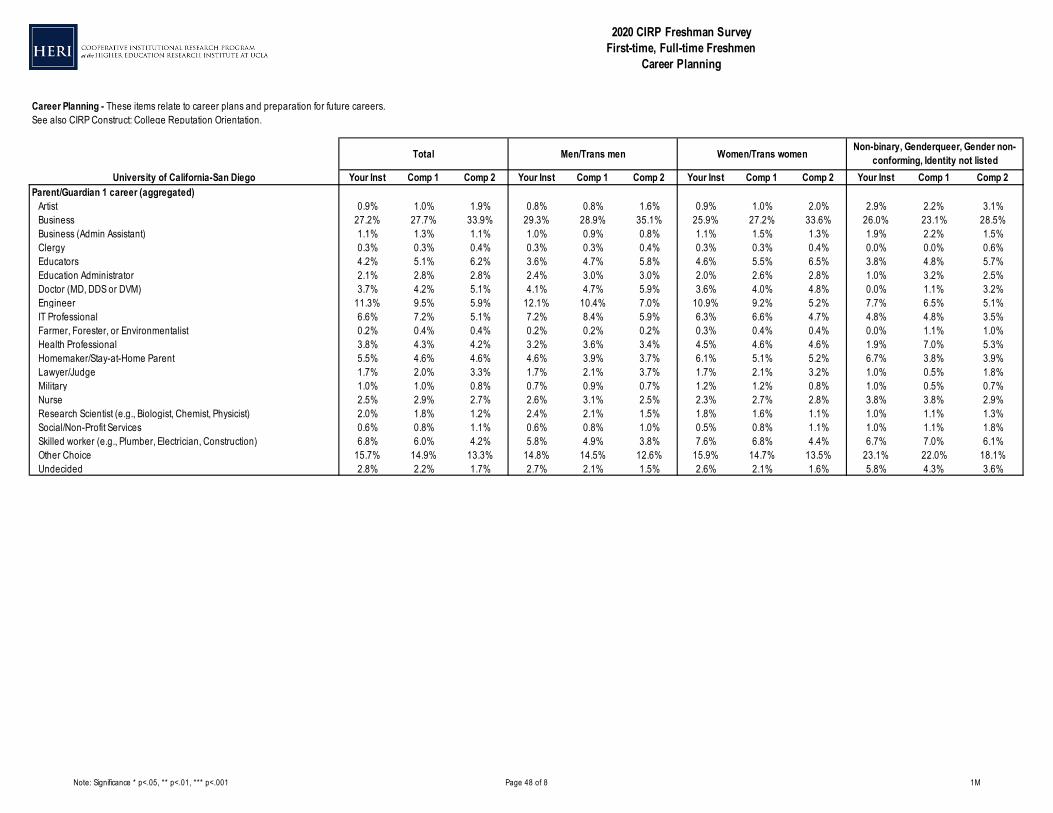
Note: Significance * p<.05, ** p<.01, *** p<.001 Page 48 of 8 1M
University of California-San Diego Your Inst Comp 1 Comp 2 Your Inst Comp 1 Comp 2 Your Inst Comp 1 Comp 2 Your Inst Comp 1 Comp 2
2020 CIRP Freshman SurveyFirst-time, Full-time Freshmen
Career Planning
Total Men/Trans men Non-binary, Genderqueer, Gender non-conforming, Identity not listed
Career Planning - These items relate to career plans and preparation for future careers.See also CIRP Construct: College Reputation Orientation.
Women/Trans women
Parent/Guardian 1 career (aggregated) Artist 0.9% 1.0% 1.9% 0.8% 0.8% 1.6% 0.9% 1.0% 2.0% 2.9% 2.2% 3.1%
Business 27.2% 27.7% 33.9% 29.3% 28.9% 35.1% 25.9% 27.2% 33.6% 26.0% 23.1% 28.5%Business (Admin Assistant) 1.1% 1.3% 1.1% 1.0% 0.9% 0.8% 1.1% 1.5% 1.3% 1.9% 2.2% 1.5%Clergy 0.3% 0.3% 0.4% 0.3% 0.3% 0.4% 0.3% 0.3% 0.4% 0.0% 0.0% 0.6%Educators 4.2% 5.1% 6.2% 3.6% 4.7% 5.8% 4.6% 5.5% 6.5% 3.8% 4.8% 5.7%Education Administrator 2.1% 2.8% 2.8% 2.4% 3.0% 3.0% 2.0% 2.6% 2.8% 1.0% 3.2% 2.5%Doctor (MD, DDS or DVM) 3.7% 4.2% 5.1% 4.1% 4.7% 5.9% 3.6% 4.0% 4.8% 0.0% 1.1% 3.2%Engineer 11.3% 9.5% 5.9% 12.1% 10.4% 7.0% 10.9% 9.2% 5.2% 7.7% 6.5% 5.1%IT Professional 6.6% 7.2% 5.1% 7.2% 8.4% 5.9% 6.3% 6.6% 4.7% 4.8% 4.8% 3.5%Farmer, Forester, or Environmentalist 0.2% 0.4% 0.4% 0.2% 0.2% 0.2% 0.3% 0.4% 0.4% 0.0% 1.1% 1.0%Health Professional 3.8% 4.3% 4.2% 3.2% 3.6% 3.4% 4.5% 4.6% 4.6% 1.9% 7.0% 5.3%Homemaker/Stay-at-Home Parent 5.5% 4.6% 4.6% 4.6% 3.9% 3.7% 6.1% 5.1% 5.2% 6.7% 3.8% 3.9%Lawyer/Judge 1.7% 2.0% 3.3% 1.7% 2.1% 3.7% 1.7% 2.1% 3.2% 1.0% 0.5% 1.8%Military 1.0% 1.0% 0.8% 0.7% 0.9% 0.7% 1.2% 1.2% 0.8% 1.0% 0.5% 0.7%Nurse 2.5% 2.9% 2.7% 2.6% 3.1% 2.5% 2.3% 2.7% 2.8% 3.8% 3.8% 2.9%Research Scientist (e.g., Biologist, Chemist, Physicist) 2.0% 1.8% 1.2% 2.4% 2.1% 1.5% 1.8% 1.6% 1.1% 1.0% 1.1% 1.3%Social/Non-Profit Services 0.6% 0.8% 1.1% 0.6% 0.8% 1.0% 0.5% 0.8% 1.1% 1.0% 1.1% 1.8%Skilled worker (e.g., Plumber, Electrician, Construction) 6.8% 6.0% 4.2% 5.8% 4.9% 3.8% 7.6% 6.8% 4.4% 6.7% 7.0% 6.1%Other Choice 15.7% 14.9% 13.3% 14.8% 14.5% 12.6% 15.9% 14.7% 13.5% 23.1% 22.0% 18.1%Undecided 2.8% 2.2% 1.7% 2.7% 2.1% 1.5% 2.6% 2.1% 1.6% 5.8% 4.3% 3.6%

Note: Significance * p<.05, ** p<.01, *** p<.001 Page 49 of 8 1M
University of California-San Diego Your Inst Comp 1 Comp 2 Your Inst Comp 1 Comp 2 Your Inst Comp 1 Comp 2 Your Inst Comp 1 Comp 2
2020 CIRP Freshman SurveyFirst-time, Full-time Freshmen
Career Planning
Total Men/Trans men Non-binary, Genderqueer, Gender non-conforming, Identity not listed
Career Planning - These items relate to career plans and preparation for future careers.See also CIRP Construct: College Reputation Orientation.
Women/Trans women
Parent/Guardian 2 career (aggregated) Artist 1.3% 1.1% 1.7% 1.5% 1.1% 1.8% 1.2% 1.1% 1.6% 1.9% 1.1% 2.6%
Business 21.3% 21.8% 25.1% 22.3% 21.9% 24.8% 20.9% 22.0% 25.5% 18.3% 20.0% 22.0%Business (Admin Assistant) 1.0% 1.2% 1.2% 0.7% 1.1% 1.1% 1.3% 1.3% 1.2% 1.0% 0.5% 0.7%Clergy 0.1% 0.2% 0.3% 0.2% 0.2% 0.3% 0.1% 0.2% 0.3% 0.0% 0.5% 0.7%Educators 3.7% 4.2% 4.7% 4.4% 5.1% 5.6% 3.2% 3.5% 4.2% 2.9% 3.2% 4.6%Education Administrator 1.5% 1.8% 2.3% 1.9% 2.2% 2.7% 1.3% 1.6% 2.1% 0.0% 0.5% 2.4%Doctor (MD, DDS or DVM) 2.3% 2.8% 3.2% 2.8% 3.2% 3.7% 2.0% 2.7% 3.0% 0.0% 0.5% 1.7%Engineer 6.4% 5.7% 4.6% 6.6% 5.9% 4.4% 6.5% 5.8% 4.8% 4.8% 3.8% 3.3%IT Professional 5.6% 6.0% 4.8% 4.8% 5.7% 4.6% 6.2% 6.3% 5.0% 5.8% 5.4% 4.6%Farmer, Forester, or Environmentalist 0.2% 0.4% 0.4% 0.2% 0.3% 0.3% 0.1% 0.4% 0.4% 1.0% 1.6% 0.8%Health Professional 2.6% 3.0% 3.2% 2.8% 3.4% 3.4% 2.6% 2.8% 3.0% 1.0% 1.6% 3.3%Homemaker/Stay-at-Home Parent 15.1% 13.0% 12.0% 14.3% 13.0% 12.8% 16.0% 13.1% 11.6% 9.6% 10.8% 9.9%Lawyer/Judge 1.0% 1.3% 2.3% 1.0% 1.4% 2.2% 1.0% 1.2% 2.4% 1.9% 1.6% 2.1%Military 0.7% 0.7% 0.6% 0.4% 0.4% 0.5% 0.9% 0.9% 0.7% 0.0% 0.5% 0.7%Nurse 2.0% 2.1% 2.0% 2.8% 2.7% 2.4% 1.3% 1.7% 1.8% 1.9% 1.6% 1.7%Research Scientist (e.g., Biologist, Chemist, Physicist) 1.9% 1.6% 1.2% 2.5% 2.1% 1.5% 1.5% 1.3% 1.2% 1.9% 1.1% 0.6%Social/Non-Profit Services 0.5% 0.9% 1.0% 0.2% 0.8% 1.0% 0.8% 0.8% 0.9% 0.0% 1.1% 1.0%Skilled worker (e.g., Plumber, Electrician, Construction) 7.7% 7.2% 5.8% 7.1% 6.3% 5.4% 8.0% 7.9% 6.1% 8.7% 5.9% 4.0%Other Choice 18.2% 18.6% 18.1% 17.6% 17.8% 17.0% 18.1% 18.7% 18.5% 26.0% 27.0% 23.4%Undecided 6.8% 6.4% 5.6% 5.9% 5.4% 4.6% 7.0% 6.7% 5.8% 13.5% 11.4% 9.9%
Current employment status:
Parent/Guardian 1 Employed 82.9% 84.7% 84.8% 84.3% 86.0% 86.2% 82.2% 84.0% 84.0% 76.9% 81.4% 83.7%
Seasonally employed 1.9% 1.9% 2.0% 1.9% 2.1% 1.6% 1.8% 1.8% 2.2% 1.9% 1.6% 3.0%Not employed 8.6% 7.7% 7.7% 6.7% 6.1% 6.1% 9.7% 8.8% 8.6% 14.4% 11.2% 9.3%Retired 3.5% 3.1% 3.4% 3.5% 3.0% 3.7% 3.5% 3.2% 3.2% 3.8% 2.1% 2.4%Unknown/Not Applicable 3.1% 2.5% 2.0% 3.5% 2.7% 2.3% 2.8% 2.2% 1.9% 2.9% 3.7% 1.7%
Parent/Guardian 2 Employed 61.3% 65.0% 65.5% 62.9% 65.9% 65.6% 60.5% 64.5% 65.9% 58.7% 61.0% 60.7%
Seasonally employed 3.1% 3.3% 3.8% 3.0% 3.3% 3.9% 3.2% 3.4% 3.7% 1.9% 1.6% 4.7%Not employed 19.9% 17.4% 16.6% 19.2% 17.4% 16.9% 20.5% 17.4% 16.4% 19.2% 17.6% 16.9%Retired 4.9% 4.6% 5.1% 5.3% 4.8% 5.7% 4.5% 4.3% 4.7% 5.8% 4.8% 5.1%Unknown/Not Applicable 10.8% 9.8% 8.9% 9.7% 8.5% 7.9% 11.4% 10.4% 9.2% 14.4% 15.0% 12.6%
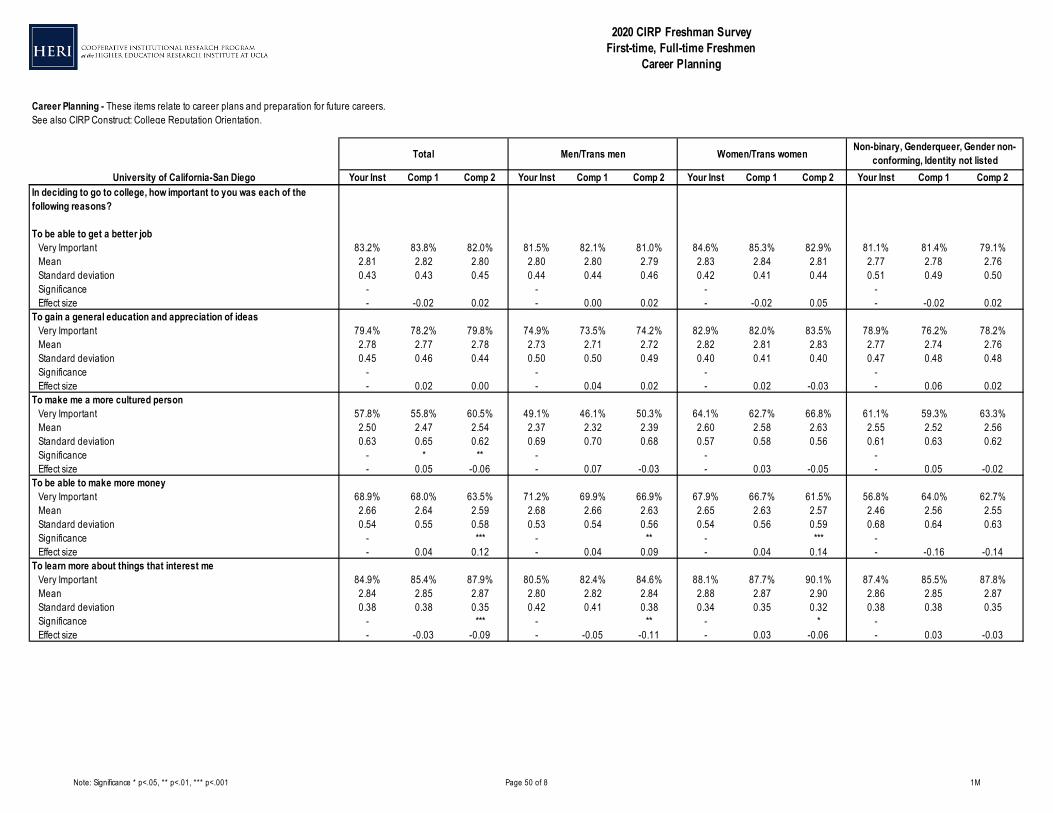
Note: Significance * p<.05, ** p<.01, *** p<.001 Page 50 of 8 1M
University of California-San Diego Your Inst Comp 1 Comp 2 Your Inst Comp 1 Comp 2 Your Inst Comp 1 Comp 2 Your Inst Comp 1 Comp 2
2020 CIRP Freshman SurveyFirst-time, Full-time Freshmen
Career Planning
Total Men/Trans men Non-binary, Genderqueer, Gender non-conforming, Identity not listed
Career Planning - These items relate to career plans and preparation for future careers.See also CIRP Construct: College Reputation Orientation.
Women/Trans women
In deciding to go to college, how important to you was each of the following reasons?
To be able to get a better job Very Important 83.2% 83.8% 82.0% 81.5% 82.1% 81.0% 84.6% 85.3% 82.9% 81.1% 81.4% 79.1%
Mean 2.81 2.82 2.80 2.80 2.80 2.79 2.83 2.84 2.81 2.77 2.78 2.76Standard deviation 0.43 0.43 0.45 0.44 0.44 0.46 0.42 0.41 0.44 0.51 0.49 0.50Significance - - - - Effect size - -0.02 0.02 - 0.00 0.02 - -0.02 0.05 - -0.02 0.02
To gain a general education and appreciation of ideas Very Important 79.4% 78.2% 79.8% 74.9% 73.5% 74.2% 82.9% 82.0% 83.5% 78.9% 76.2% 78.2%
Mean 2.78 2.77 2.78 2.73 2.71 2.72 2.82 2.81 2.83 2.77 2.74 2.76Standard deviation 0.45 0.46 0.44 0.50 0.50 0.49 0.40 0.41 0.40 0.47 0.48 0.48Significance - - - - Effect size - 0.02 0.00 - 0.04 0.02 - 0.02 -0.03 - 0.06 0.02
To make me a more cultured person Very Important 57.8% 55.8% 60.5% 49.1% 46.1% 50.3% 64.1% 62.7% 66.8% 61.1% 59.3% 63.3%
Mean 2.50 2.47 2.54 2.37 2.32 2.39 2.60 2.58 2.63 2.55 2.52 2.56Standard deviation 0.63 0.65 0.62 0.69 0.70 0.68 0.57 0.58 0.56 0.61 0.63 0.62Significance - * ** - - - Effect size - 0.05 -0.06 - 0.07 -0.03 - 0.03 -0.05 - 0.05 -0.02
To be able to make more money Very Important 68.9% 68.0% 63.5% 71.2% 69.9% 66.9% 67.9% 66.7% 61.5% 56.8% 64.0% 62.7%
Mean 2.66 2.64 2.59 2.68 2.66 2.63 2.65 2.63 2.57 2.46 2.56 2.55Standard deviation 0.54 0.55 0.58 0.53 0.54 0.56 0.54 0.56 0.59 0.68 0.64 0.63Significance - *** - ** - *** - Effect size - 0.04 0.12 - 0.04 0.09 - 0.04 0.14 - -0.16 -0.14
To learn more about things that interest me Very Important 84.9% 85.4% 87.9% 80.5% 82.4% 84.6% 88.1% 87.7% 90.1% 87.4% 85.5% 87.8%
Mean 2.84 2.85 2.87 2.80 2.82 2.84 2.88 2.87 2.90 2.86 2.85 2.87Standard deviation 0.38 0.38 0.35 0.42 0.41 0.38 0.34 0.35 0.32 0.38 0.38 0.35Significance - *** - ** - * - Effect size - -0.03 -0.09 - -0.05 -0.11 - 0.03 -0.06 - 0.03 -0.03
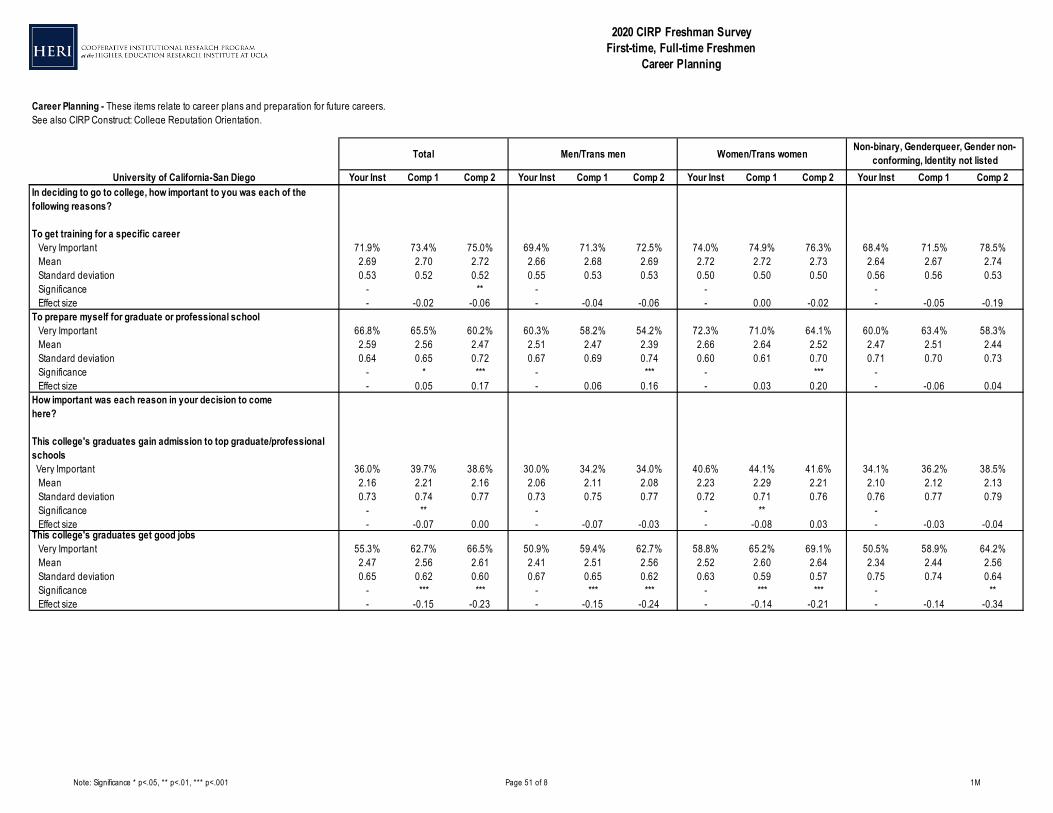
Note: Significance * p<.05, ** p<.01, *** p<.001 Page 51 of 8 1M
University of California-San Diego Your Inst Comp 1 Comp 2 Your Inst Comp 1 Comp 2 Your Inst Comp 1 Comp 2 Your Inst Comp 1 Comp 2
2020 CIRP Freshman SurveyFirst-time, Full-time Freshmen
Career Planning
Total Men/Trans men Non-binary, Genderqueer, Gender non-conforming, Identity not listed
Career Planning - These items relate to career plans and preparation for future careers.See also CIRP Construct: College Reputation Orientation.
Women/Trans women
In deciding to go to college, how important to you was each of the following reasons?
To get training for a specific career Very Important 71.9% 73.4% 75.0% 69.4% 71.3% 72.5% 74.0% 74.9% 76.3% 68.4% 71.5% 78.5%
Mean 2.69 2.70 2.72 2.66 2.68 2.69 2.72 2.72 2.73 2.64 2.67 2.74Standard deviation 0.53 0.52 0.52 0.55 0.53 0.53 0.50 0.50 0.50 0.56 0.56 0.53Significance - ** - - - Effect size - -0.02 -0.06 - -0.04 -0.06 - 0.00 -0.02 - -0.05 -0.19
To prepare myself for graduate or professional school Very Important 66.8% 65.5% 60.2% 60.3% 58.2% 54.2% 72.3% 71.0% 64.1% 60.0% 63.4% 58.3%
Mean 2.59 2.56 2.47 2.51 2.47 2.39 2.66 2.64 2.52 2.47 2.51 2.44Standard deviation 0.64 0.65 0.72 0.67 0.69 0.74 0.60 0.61 0.70 0.71 0.70 0.73Significance - * *** - *** - *** - Effect size - 0.05 0.17 - 0.06 0.16 - 0.03 0.20 - -0.06 0.04
How important was each reason in your decision to comehere?
This college's graduates gain admission to top graduate/professional schools Very Important 36.0% 39.7% 38.6% 30.0% 34.2% 34.0% 40.6% 44.1% 41.6% 34.1% 36.2% 38.5%
Mean 2.16 2.21 2.16 2.06 2.11 2.08 2.23 2.29 2.21 2.10 2.12 2.13Standard deviation 0.73 0.74 0.77 0.73 0.75 0.77 0.72 0.71 0.76 0.76 0.77 0.79Significance - ** - - ** - Effect size - -0.07 0.00 - -0.07 -0.03 - -0.08 0.03 - -0.03 -0.04
This college's graduates get good jobs Very Important 55.3% 62.7% 66.5% 50.9% 59.4% 62.7% 58.8% 65.2% 69.1% 50.5% 58.9% 64.2%
Mean 2.47 2.56 2.61 2.41 2.51 2.56 2.52 2.60 2.64 2.34 2.44 2.56Standard deviation 0.65 0.62 0.60 0.67 0.65 0.62 0.63 0.59 0.57 0.75 0.74 0.64Significance - *** *** - *** *** - *** *** - **Effect size - -0.15 -0.23 - -0.15 -0.24 - -0.14 -0.21 - -0.14 -0.34
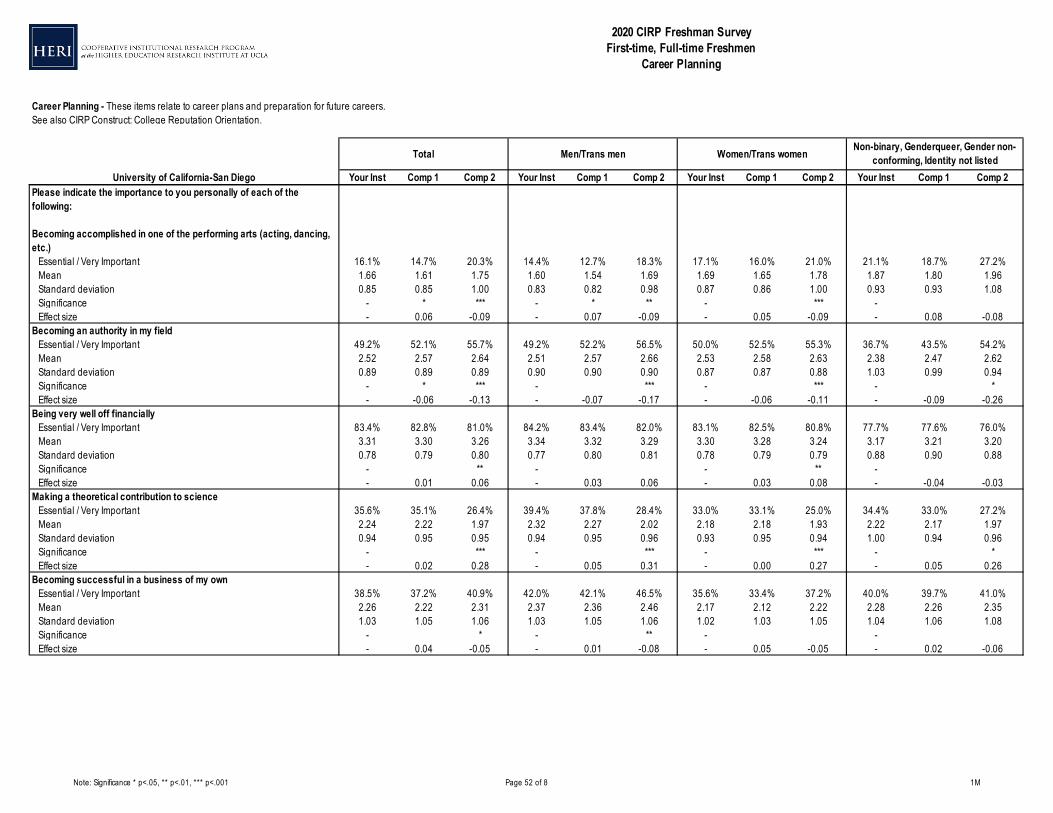
Note: Significance * p<.05, ** p<.01, *** p<.001 Page 52 of 8 1M
University of California-San Diego Your Inst Comp 1 Comp 2 Your Inst Comp 1 Comp 2 Your Inst Comp 1 Comp 2 Your Inst Comp 1 Comp 2
2020 CIRP Freshman SurveyFirst-time, Full-time Freshmen
Career Planning
Total Men/Trans men Non-binary, Genderqueer, Gender non-conforming, Identity not listed
Career Planning - These items relate to career plans and preparation for future careers.See also CIRP Construct: College Reputation Orientation.
Women/Trans women
Please indicate the importance to you personally of each of the following:
Becoming accomplished in one of the performing arts (acting, dancing, etc.) Essential / Very Important 16.1% 14.7% 20.3% 14.4% 12.7% 18.3% 17.1% 16.0% 21.0% 21.1% 18.7% 27.2%
Mean 1.66 1.61 1.75 1.60 1.54 1.69 1.69 1.65 1.78 1.87 1.80 1.96Standard deviation 0.85 0.85 1.00 0.83 0.82 0.98 0.87 0.86 1.00 0.93 0.93 1.08Significance - * *** - * ** - *** - Effect size - 0.06 -0.09 - 0.07 -0.09 - 0.05 -0.09 - 0.08 -0.08
Becoming an authority in my field Essential / Very Important 49.2% 52.1% 55.7% 49.2% 52.2% 56.5% 50.0% 52.5% 55.3% 36.7% 43.5% 54.2%
Mean 2.52 2.57 2.64 2.51 2.57 2.66 2.53 2.58 2.63 2.38 2.47 2.62Standard deviation 0.89 0.89 0.89 0.90 0.90 0.90 0.87 0.87 0.88 1.03 0.99 0.94Significance - * *** - *** - *** - *Effect size - -0.06 -0.13 - -0.07 -0.17 - -0.06 -0.11 - -0.09 -0.26
Being very well off financially Essential / Very Important 83.4% 82.8% 81.0% 84.2% 83.4% 82.0% 83.1% 82.5% 80.8% 77.7% 77.6% 76.0%
Mean 3.31 3.30 3.26 3.34 3.32 3.29 3.30 3.28 3.24 3.17 3.21 3.20Standard deviation 0.78 0.79 0.80 0.77 0.80 0.81 0.78 0.79 0.79 0.88 0.90 0.88Significance - ** - - ** - Effect size - 0.01 0.06 - 0.03 0.06 - 0.03 0.08 - -0.04 -0.03
Making a theoretical contribution to science Essential / Very Important 35.6% 35.1% 26.4% 39.4% 37.8% 28.4% 33.0% 33.1% 25.0% 34.4% 33.0% 27.2%
Mean 2.24 2.22 1.97 2.32 2.27 2.02 2.18 2.18 1.93 2.22 2.17 1.97Standard deviation 0.94 0.95 0.95 0.94 0.95 0.96 0.93 0.95 0.94 1.00 0.94 0.96Significance - *** - *** - *** - *Effect size - 0.02 0.28 - 0.05 0.31 - 0.00 0.27 - 0.05 0.26
Becoming successful in a business of my own Essential / Very Important 38.5% 37.2% 40.9% 42.0% 42.1% 46.5% 35.6% 33.4% 37.2% 40.0% 39.7% 41.0%
Mean 2.26 2.22 2.31 2.37 2.36 2.46 2.17 2.12 2.22 2.28 2.26 2.35Standard deviation 1.03 1.05 1.06 1.03 1.05 1.06 1.02 1.03 1.05 1.04 1.06 1.08Significance - * - ** - - Effect size - 0.04 -0.05 - 0.01 -0.08 - 0.05 -0.05 - 0.02 -0.06

Note: Significance * p<.05, ** p<.01, *** p<.001 Page 53 of 8 1M
University of California-San Diego Your Inst Comp 1 Comp 2 Your Inst Comp 1 Comp 2 Your Inst Comp 1 Comp 2 Your Inst Comp 1 Comp 2
2020 CIRP Freshman SurveyFirst-time, Full-time Freshmen
Career Planning
Total Men/Trans men Non-binary, Genderqueer, Gender non-conforming, Identity not listed
Career Planning - These items relate to career plans and preparation for future careers.See also CIRP Construct: College Reputation Orientation.
Women/Trans women
What is your best guess as to the chances that you will:
Change major field Very Good Chance 12.8% 12.3% 11.0% 11.5% 9.8% 8.9% 13.2% 13.7% 12.3% 22.2% 19.9% 12.9%
Mean 2.53 2.50 2.46 2.48 2.42 2.42 2.57 2.55 2.48 2.66 2.60 2.43Standard deviation 0.84 0.84 0.84 0.84 0.83 0.82 0.83 0.84 0.85 0.96 0.94 0.91Significance - *** - * - *** - *Effect size - 0.04 0.08 - 0.07 0.07 - 0.02 0.11 - 0.06 0.25
Change career choice Very Good Chance 16.6% 16.8% 15.5% 12.9% 13.4% 12.9% 19.1% 19.2% 17.2% 23.3% 21.1% 16.7%
Mean 2.77 2.74 2.68 2.69 2.67 2.63 2.83 2.80 2.71 2.81 2.70 2.61Standard deviation 0.79 0.82 0.84 0.78 0.81 0.82 0.79 0.81 0.85 0.91 0.94 0.90Significance - *** - * - *** - *Effect size - 0.04 0.11 - 0.02 0.07 - 0.04 0.14 - 0.12 0.22