
Cirebon IPP 600MW Coal Fired Power Station - Amazon S3s3.amazonaws.com/zanran_storage/ · Marine...
82
Cirebon IPP 600MW Coal Fired Power Station MARINE ENVIRONMENT Rev 1 8 February 2008
Transcript of Cirebon IPP 600MW Coal Fired Power Station - Amazon S3s3.amazonaws.com/zanran_storage/ · Marine...

Cirebon IPP 600MW Coal Fired Power Station
MARINE ENVIRONMENT Rev 1 8 February 2008

The SKM logo trade mark is a registered trade mark of Sinclair Knight Merz Pty Ltd.
Cirebon IPP 600MW Coal Fired Power Station
MARINE ENVIRONMENT Rev 1 8 February 2008
Sinclair Knight Merz ABN 37 001 024 095 369 Ann Street, Brisbane 4000 PO Box 246 Spring Hill QLD 4004 Australia Tel: +61 7 3244 7100 Fax: +61 7 3244 7307 Web: www.skmconsulting.com COPYRIGHT: The concepts and information contained in this document are the property of Sinclair Knight Merz Pty Ltd. Use or copying of this document in whole or in part without the written permission of Sinclair Knight Merz constitutes an infringement of copyright.
LIMITATION: This report has been prepared on behalf of and for the exclusive use of Sinclair Knight Merz Pty Ltd’s Client, and is subject to and issued in connection with the provisions of the agreement between Sinclair Knight Merz and its Client. Sinclair Knight Merz accepts no liability or responsibility whatsoever for or in respect of any use of or reliance upon this report by any third party.


Marine Environment
SINCLAIR KNIGHT MERZ D:\Documents and Settings\runsworth\Local Settings\Temporary Internet Files\OLK8B\R1_QE09421_Cirebon_Marine_Environment.doc PAGE i
Contents
1. Introduction 1 1.1 Marine environmental statement limitations and assumptions 1
2. Proposed Development 2 2.1 Location and spatial area of the development 2 2.2 Proposed Earthworks 3 2.3 Proposed Jetty 4 2.4 Wastewater treatment and water intake 4
3. Description of the Existing Environment 5 3.1 Oceanography and Climate 5 3.2 Water Quality 7 3.2.1 Methodology 7 3.2.2 Results 9 3.2.3 Discussion 14 3.3 Sediment Quality 16 3.3.1 Methodology 16 3.3.2 Results 17 3.3.3 Discussion 20 3.4 Biological Contamination 20 3.4.1 Introduction 20 3.4.2 Methodology 21 3.4.3 Results 21 3.4.4 Discussion 22 3.5 Mangrove Communities 23 3.5.1 Methodology 23 3.5.2 Results 24 3.5.3 Discussion 27 3.6 Intertidal and Subtidal Benthos 29 3.6.1 Methodology 29 3.6.2 Results 30 3.6.3 Discussion 32 3.7 Fisheries 33 3.7.1 Methodology 33 3.7.2 Results 34 3.7.3 Discussion 37
4. Environmental Impact Assessment 38 4.1 Water Quality 38

Marine Ecology
SINCLAIR KNIGHT MERZ
PAGE ii D:\Documents and Settings\runsworth\Local Settings\Temporary Internet Files\OLK8B\R1_QE09421_Cirebon_Marine_Environment.doc
4.1.1 Wastewater Effluent 38 4.1.1.1 Temperature and salinity 38 4.1.1.2 Contaminants 43 4.1.2 Jetty Construction 46 4.1.3 Stormwater 46 4.1.4 Vessel Discharges 46 4.1.5 Earthworks Discharges 46 4.2 Sediment Quality 47 4.2.1 Construction Impacts 47 4.2.2 Operational Impacts 48 4.3 Biological Contamination 48 4.4 Mangroves 48 4.4.1 Mangrove Removal 49 4.4.2 Water circulation changes 50 4.4.3 Sediment impacts of earthworks and construction 50 4.4.4 Coal and coal dust during plant operation 50 4.5 Intertidal and Subtidal Benthos 50 4.5.1 Jetty Construction 51 4.5.2 Jetty Operation 51 4.6 Fisheries 51 4.6.1 Jetty construction and operation 51 4.6.2 Impacts of site personnel 52
5. Mitigation Measures 54 5.1 Water Quality 54 5.1.1 Construction Phase 54 5.1.2 Operational Phase 54 5.2 Sediment Quality and Benthos 55 5.3 Mangroves 56 5.3.1 Construction Phase 56 5.3.2 Operational Phase 56 5.3.3 Benthos 56 5.4 Fisheries 57
6. Monitoring and suggested additional work 58 6.1 Compliance monitoring 58 6.2 Environmental quality monitoring 58
7. References 60
Appendix A Comparison of World Bank / IFC Guidelines with Indonesian Standards 64
Marine Ecology
SINCLAIR KNIGHT MERZ
D:\Documents and Settings\runsworth\Local Settings\Temporary Internet Files\OLK8B\R1_QE09421_Cirebon_Marine_Environment.doc PAGE iii
Appendix B Indonesian sea water standards for marine biota and ports68
Appendix C Water Quality Data 70
Appendix D Results of infauna sampling 72
List of Figures
Figure 2-1 Location of the proposed power development in Cirebon, North Java, Indonesia 2
Figure 2-2 Footprint of proposed Cirebon power plant development with jetty extending out to sea 3
Figure 3-1 Seasonal winds roses at Cirebon (from Cardno Lawson Treloar 2008) 6
Figure 3-2 Location of water and sediment quality sampling sites 8
Figure 3-3 Mean biological (BOD) and chemical oxygen demand (COD) compared to Indonesian standards, European Union (EU EPA) standards, and WHO guidelines (from Chapman 1996) 11
Figure 3-4 Mean Total Coliforms compared to Indonesian standards and World Bank guidelines 12
Figure 3-5 Mean (±SE) nutrient, fluoride and sulphide concentrations compared to Indonesian standards and ANZECC threshold values for 80% species protection 13
Figure 3-6 Mean (± SE) heavy metal concentrations (n=10) averaged across sites compared to Indonesian standards and ANZECC threshold values for 80% species protection 14
Figure 3-7 Cumulative percentage sediment size fractions relative to Phi from the mouth of the rivers Kanci and Waru Duwur and at three distances from the shore 18
Figure 3-8 Sediment grab samples 18
Figure 3-9 Distribution of mangrove vegetation in the vicinity of the Project and location of mangrove sampling transects 24
Figure 3-10 Images illustrating the variability of mangrove (inter-mixed with aquaculture ponds) within the area to the east and west of the Kanci River (within the vicinity of the proposed power development) 26
Figure 3-11 Images illustrating the immaturity (low height) of the mangrove assemblage in the area to the east and west of the Kanci River in the vicinity of the proposed power development 26
Figure 3-12 Photos illustrating extensive use of mangrove for fire wood and construction27
Marine Ecology
SINCLAIR KNIGHT MERZ
PAGE iv D:\Documents and Settings\runsworth\Local Settings\Temporary Internet Files\OLK8B\R1_QE09421_Cirebon_Marine_Environment.doc
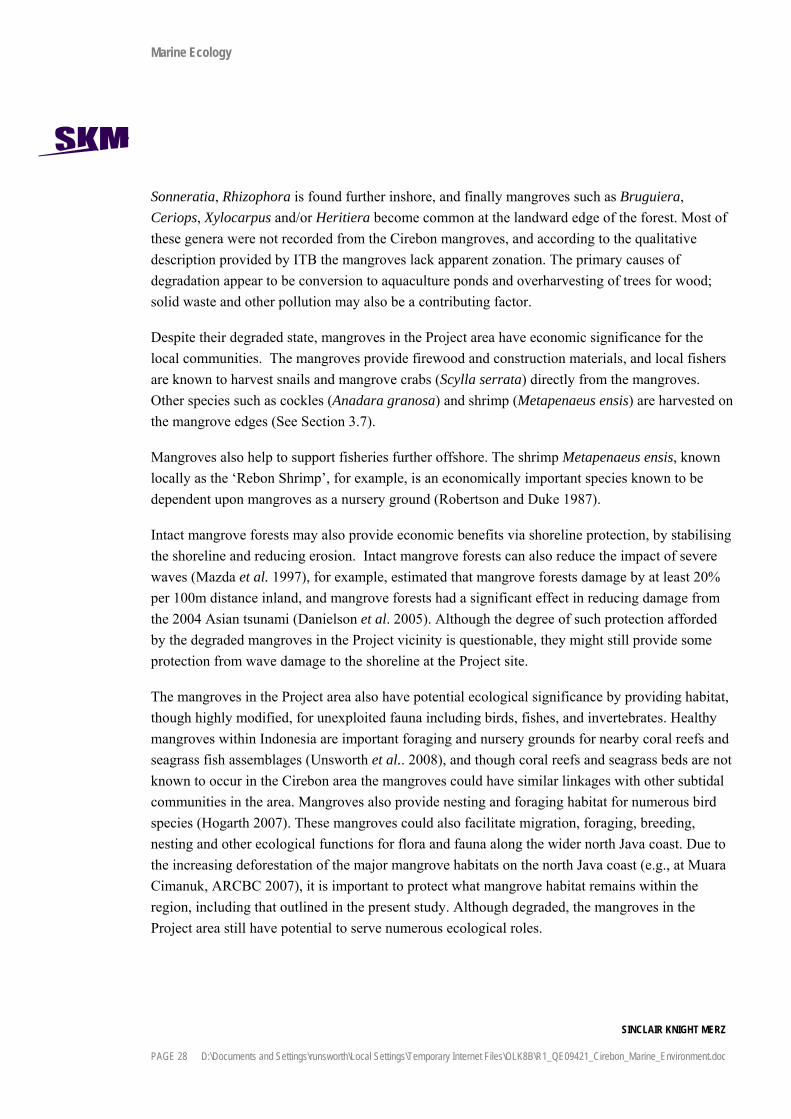
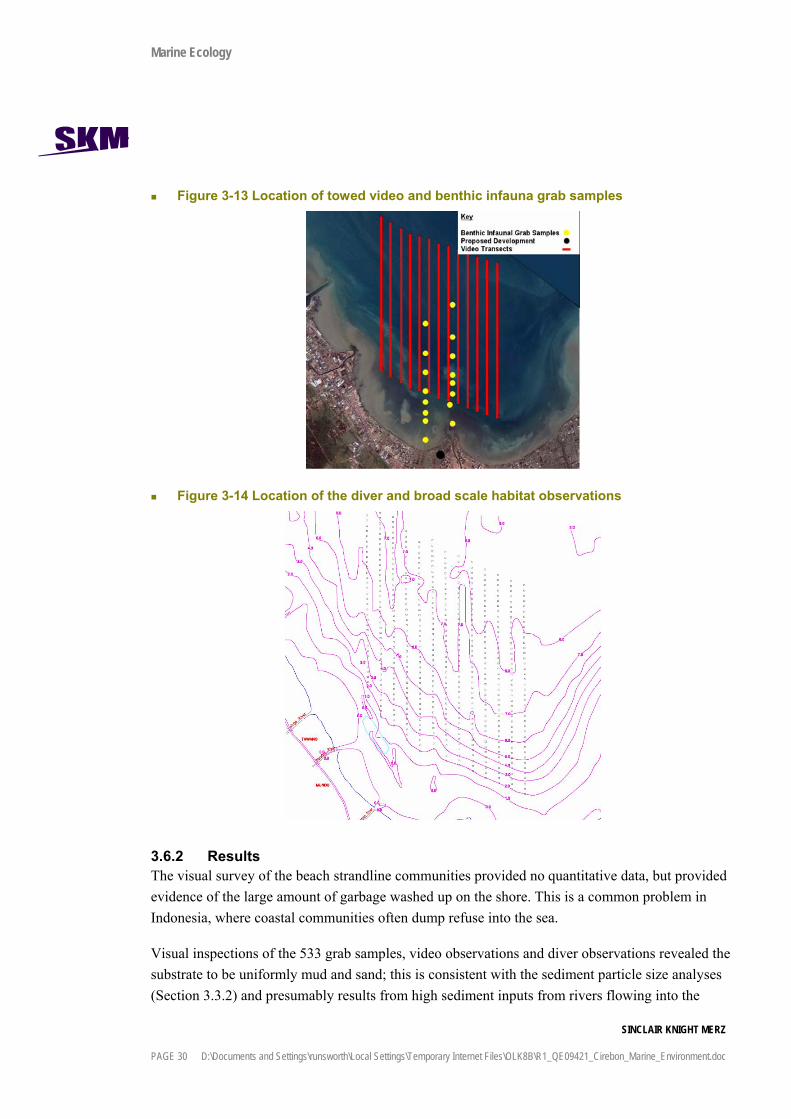
Figure 3-13 Location of towed video and benthic infauna grab samples 30
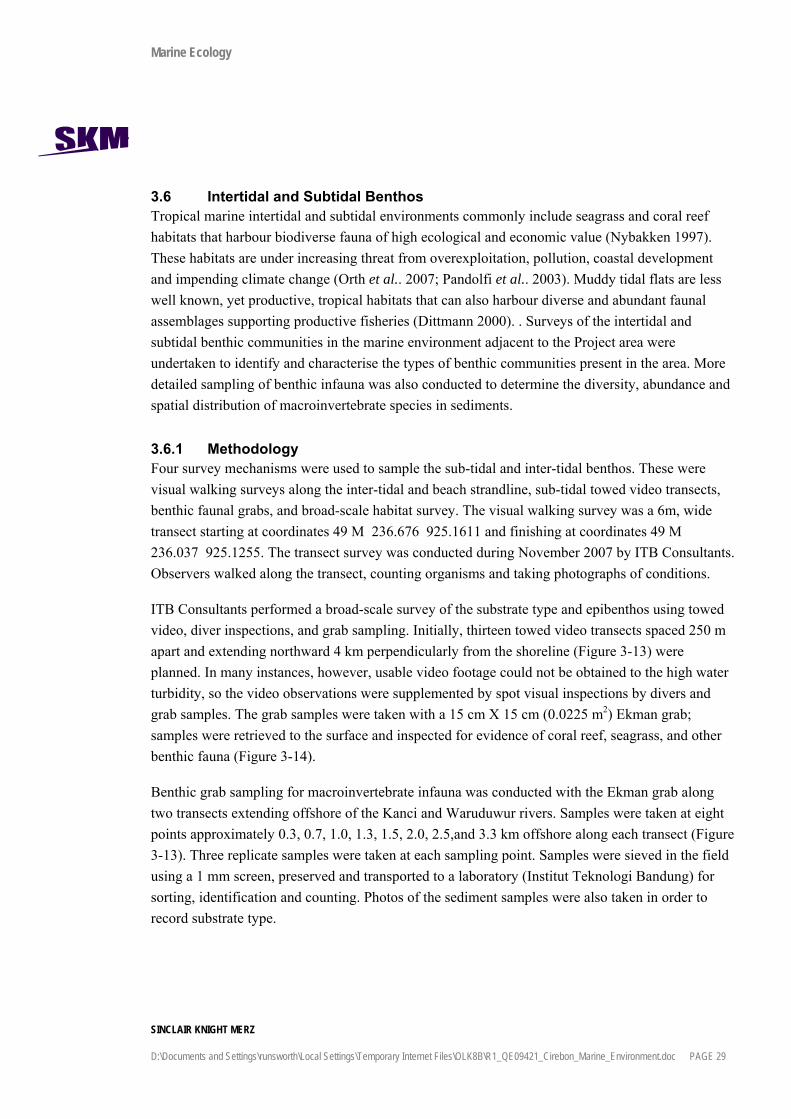
Figure 3-14 Location of the diver and broad scale habitat observations 30
Figure 3-15 Infaunal abundance and species richness at eight marine sampling sites of increasing distance from the shoreline leading out from the mouth of the rivers Kanci and Waruduwur within the vicinity of the proposed development. 32
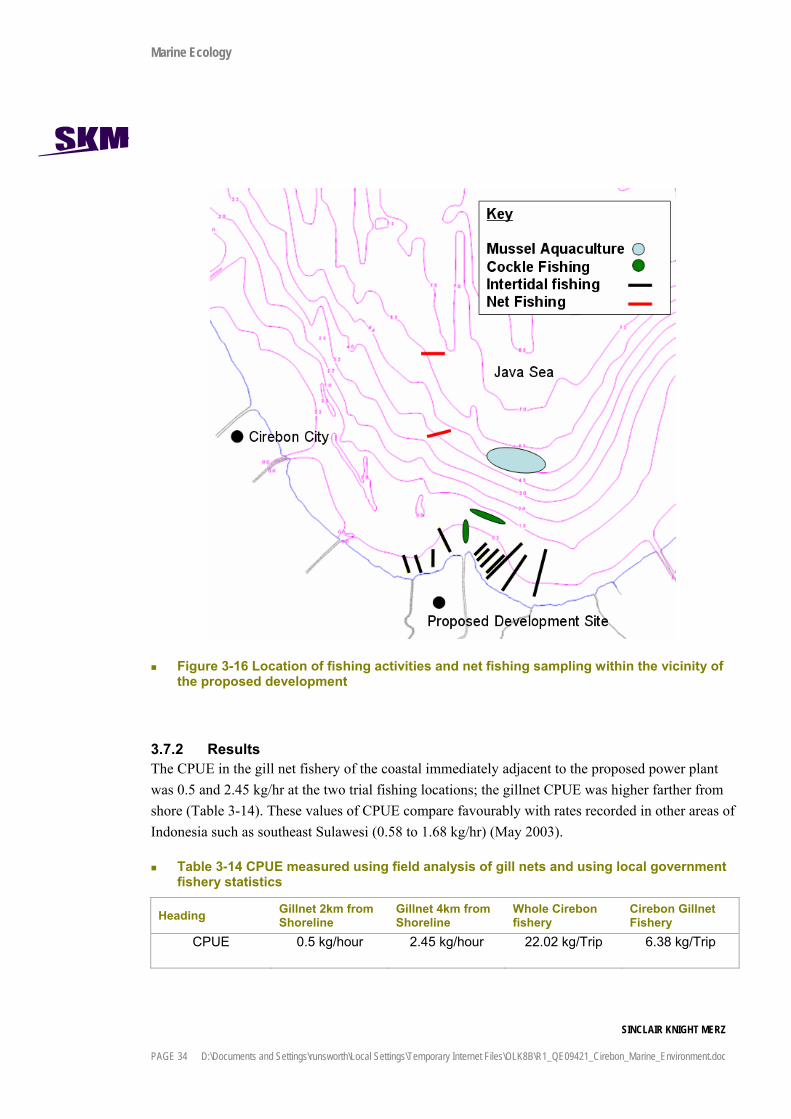
Figure 3-16 Location of fishing activities and net fishing sampling within the vicinity of the proposed development 34
Figure 3-17 Large sediment plumes visible from unknown fishing trawls 36
Figure 3-18 Inter-tidal fishing close to the proposed power development site 36
Figure 4-1 Model results for mean discharge plumes for (A) surface temperature (B) bottom temperature (C) surface salinity (D) bottom salinity (taken from Cardno Lawson Treloar 2008). The red lines in C and D indicate the mean the mixing zone 41
Figure 4-2 Modelled mean discharge plumes for (A) surface BOD and (B) bottom BOD. Dilution factors corresponding to the absolute modelled BOD values are shown for the 1/10, 1/20, and 1/50 dilution factors (from Cardno Lawson Treloar 2008) 45
Figure 4-3 Probable and possible mangrove loss caused by proposed power plant development (zone of mangrove loss along jetty not to scale) 49
List of Tables
Table 3-1 Climate characteristics for the Cirebon region calculated from available data for 1993-2003 (Meteorological and Geofisical Agency, Jakarta 2007) 5
Table 3-2 Water quality parameters quantified from marine waters surrounding the proposed Project site 8
Table 3-3 Mean water quality results by site 10
Table 3-4 Parameters analysed in sediment samples 16
Table 3-5 Sediment analysis results for homogenised samples. Values highlighted in red exceed the ANZECC Guidelines ISQG-Low trigger values 19
Table 3-6 Heavy metal concentrations in tissue of marine organisms harvested in the proximity to the Project site. Values highlighted in red exceed ANZFA generally expected levels (GELS) of contamination. 21
Table 3-7 Comparison of metal accumulation in fishes from different regions (taken from Mallampati et al. (2007)) 22
Table 3-8 Coordinates and lengths of line transects at Cirebon Project Site 24

Marine Ecology
SINCLAIR KNIGHT MERZ
D:\Documents and Settings\runsworth\Local Settings\Temporary Internet Files\OLK8B\R1_QE09421_Cirebon_Marine_Environment.doc PAGE v
Table 3-9 Spatial extent of mangrove around the proposed development in context of the local region 24
Table 3-10 Floral species found in the mangrove area during the field survey 25
Table 3-11 Densities of mangroves above head height (individuals/m2) recorded in belt transects in the Project vicinity. 27
Table 3-12 Relative abundance (%) of mangrove species in belt transects in the Project vicinity (individuals above head height) 27
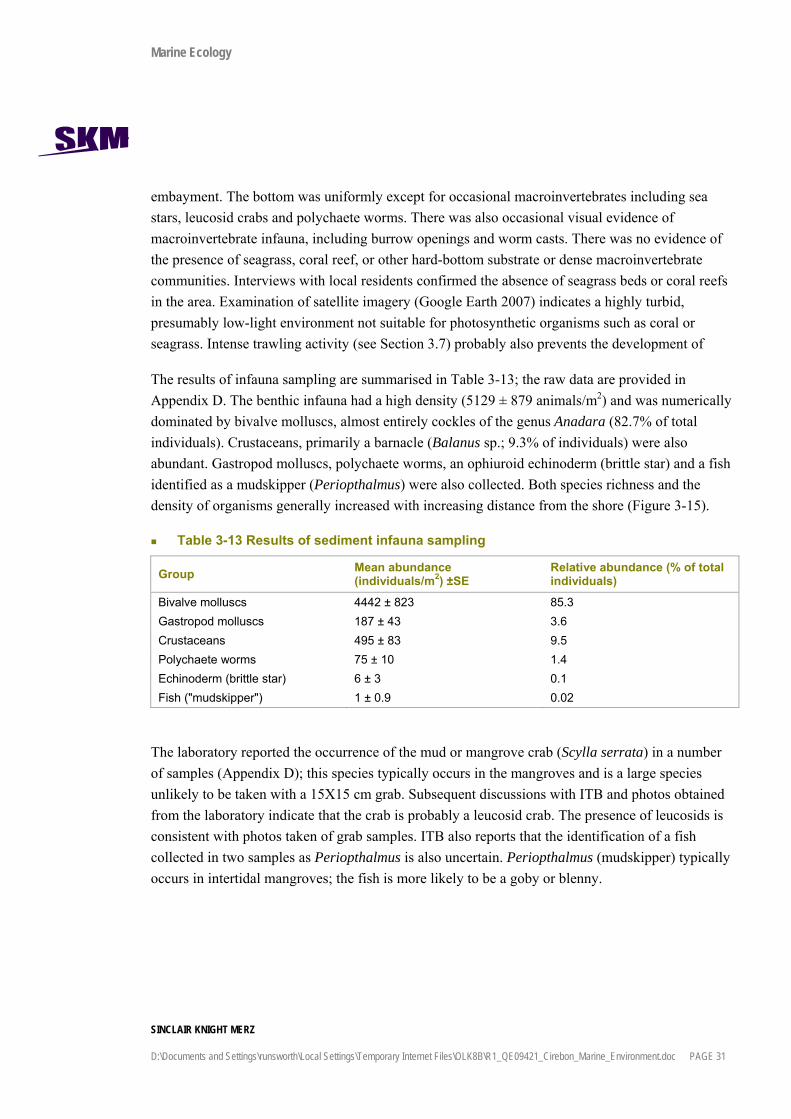
Table 3-13 Results of sediment infauna sampling 31
Table 3-14 CPUE measured using field analysis of gill nets and using local government fishery statistics 34
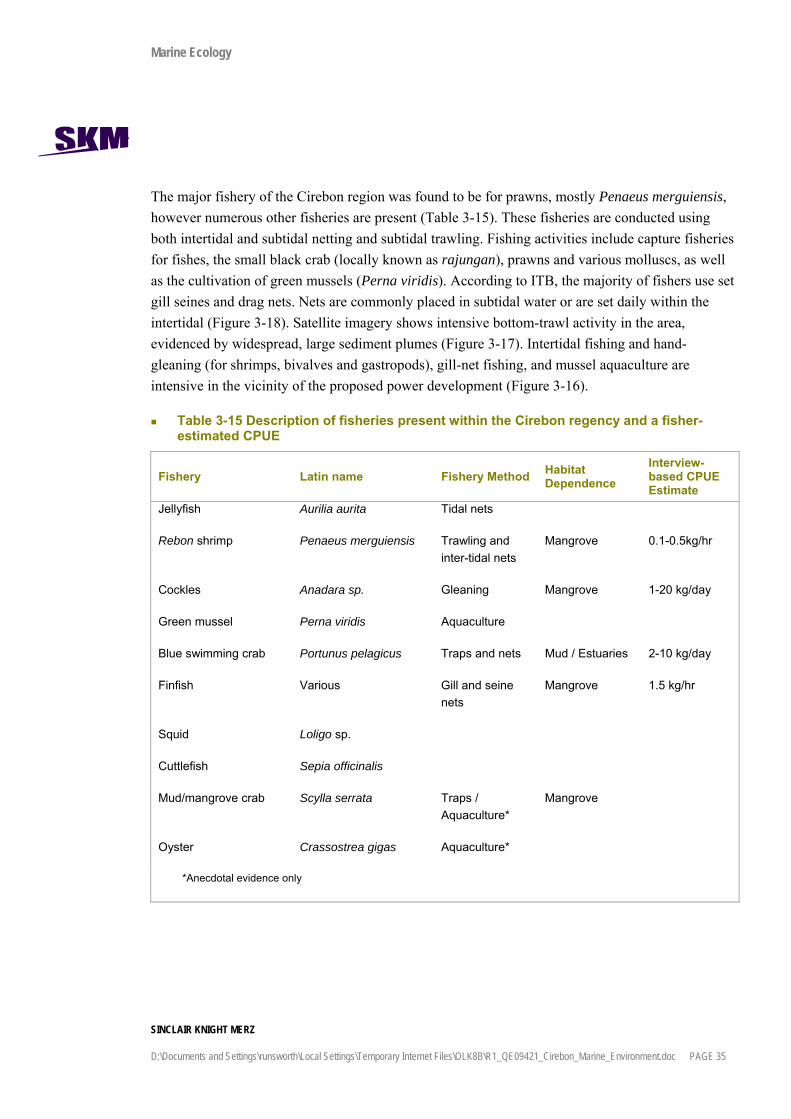
Table 3-15 Description of fisheries present within the Cirebon regency and a fisher-estimated CPUE 35
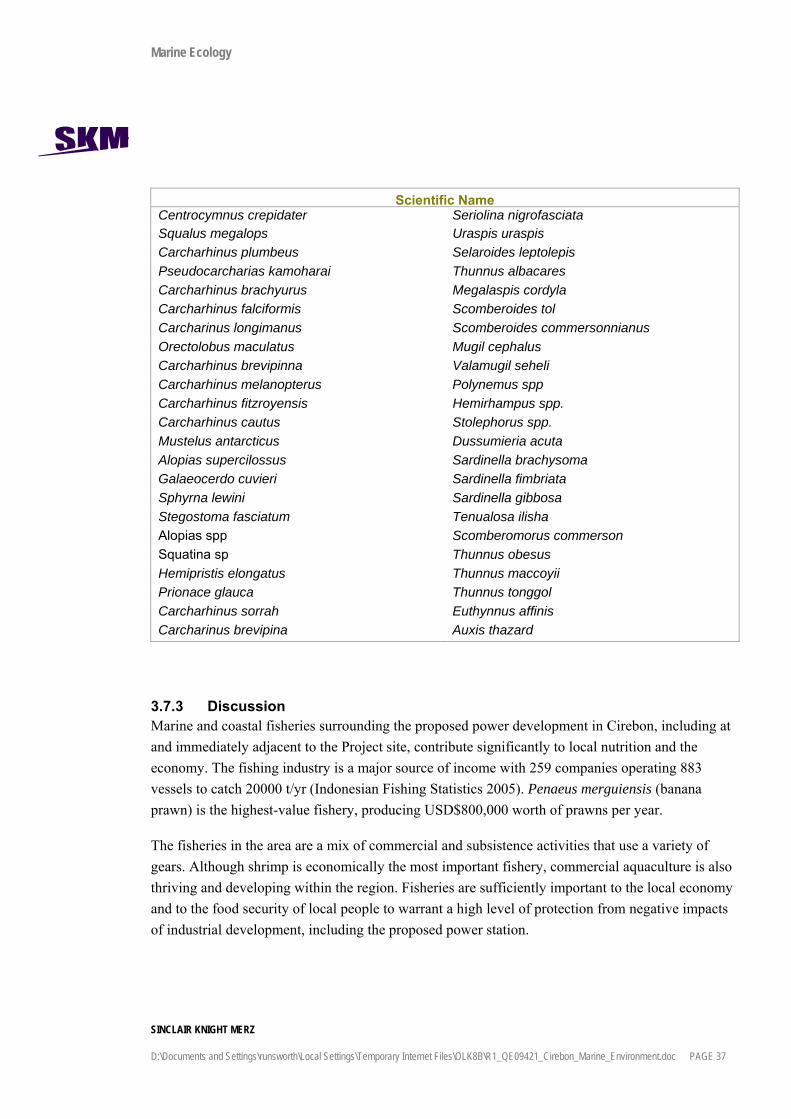
Table 3-16 List of species caught using a gillnet in the vicinity of the proposed development 36
Table 4.1 Discharge Flow rates, temperature, salinity and contaminant concentrations for each component of the Cirebon Power Plant wastewater effluent 39

Marine Environment
SINCLAIR KNIGHT MERZ D:\Documents and Settings\runsworth\Local Settings\Temporary Internet Files\OLK8B\R1_QE09421_Cirebon_Marine_Environment.doc PAGE vi
Document history and status Revision Date issued Reviewed by Approved by Date approved Revision type
A1 21/1/08 M Huber M Huber 30/1/08 First Draft
B1 31/1/08 M Huber M Huber 4/2/08 Final Draft
0 4/2/08 C Purchas M Huber 4/2/08 Final
1 8/2/08 M Huber M Huber 7/2/08 Final Revised
Distribution of copies Revision Copy no Quantity Issued to
A1 1 Electronic Copy Project Manger/Technical Reviewer
B1 1 Electronic Copy Project Manger
0 1 Electronic Copy Client - Bruce Clarke
1 1 Electronic Copy Client - Bruce Clarke
1 1 1 hard copy SKM library
1 2 1 hard copy SKM project file
1 3 1 hard copy Brisbane Marine Studies archive
Printed: 19 March 2008
Last saved: 8 February 2008 04:37 PM
File name: I:\QENV2\Projects\QE09421\Reports\R1_QE09421_Cirebon_Marine_Environment.doc
Author: Dr. Richard Unsworth,
Project manager: Dr. Michael Huber
Name of organisation: PT Cirebon Electric Power
Name of project: Cirebon IPP 600MW Coal Fired Power Station
Name of document: Marine Ecology
Document version: R1
Project number: QE09421.02

Marine Environment
SINCLAIR KNIGHT MERZ D:\Documents and Settings\runsworth\Local Settings\Temporary Internet Files\OLK8B\R1_QE09421_Cirebon_Marine_Environment.doc PAGE 1
1. Introduction This report provides a description of the marine and coastal environment in and around the proposed Cirebon power plant project site. This includes descriptions of water quality, sediment quality, and flora and fauna, as well as an assessment of the current condition of the marine environment and human uses of marine and coastal resources. The report also assesses potential project impacts on the marine environment, and provides recommendations for mitigation measures and environmental monitoring.
1.1 Marine environmental statement limitations and assumptions This report assumes the following:
Effluent discharged from the proposed power plant will conform to Indonesian and World Bank effluent standards (see Appendix A) and will not cause marine waters to be in breach of the Indonesian seawater standards for marine biota (Ministerial Decree of State Minister of Environment No. 51 of 2004) (see Appendix B);
That dredging of marine sediments will not occur as any part of the proposed development; and
That all data presented in the present report are assumed to be to a standard acceptable to demonstrate the Equator Principles of the International Finance Corporation (IFC). All data were provided by external consultants and laboratories, and associated quality control/ assurance procedures were beyond the control of the authors or SKM.
Marine Ecology
SINCLAIR KNIGHT MERZ
PAGE 2 D:\Documents and Settings\runsworth\Local Settings\Temporary Internet Files\OLK8B\R1_QE09421_Cirebon_Marine_Environment.doc
2. Proposed Development
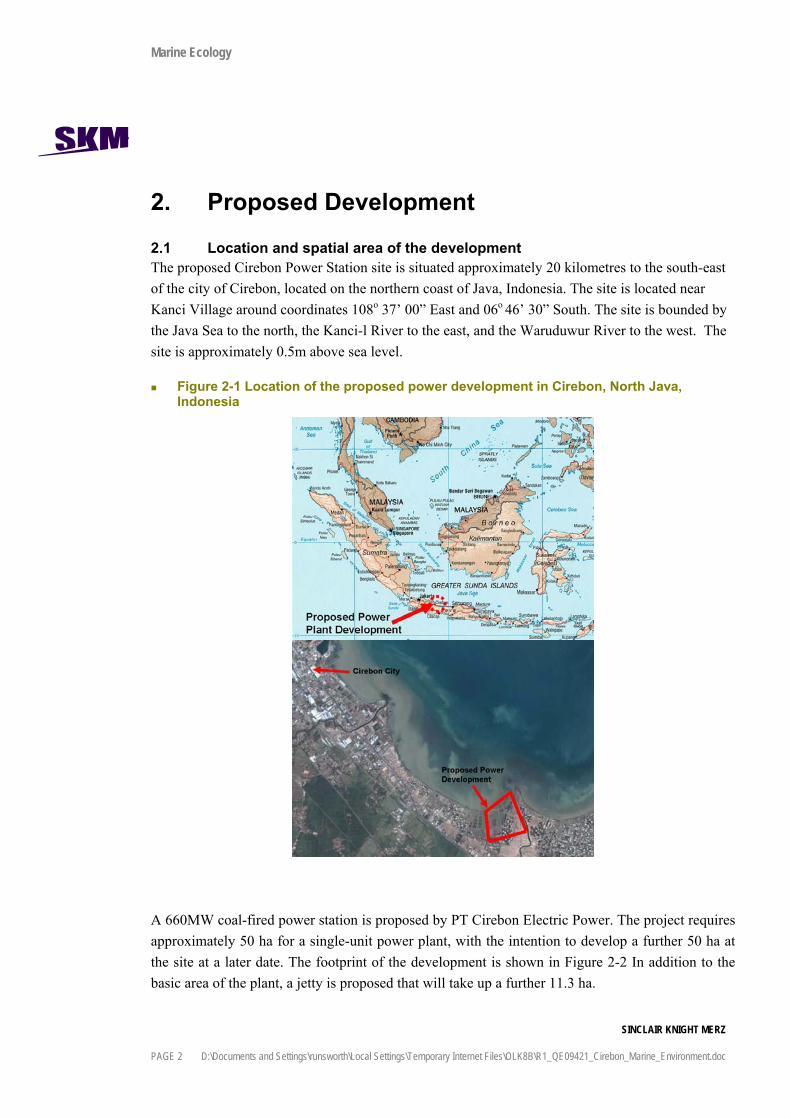
2.1 Location and spatial area of the development The proposed Cirebon Power Station site is situated approximately 20 kilometres to the south-east of the city of Cirebon, located on the northern coast of Java, Indonesia. The site is located near Kanci Village around coordinates 108o 37’ 00” East and 06o 46’ 30” South. The site is bounded by the Java Sea to the north, the Kanci-l River to the east, and the Waruduwur River to the west. The site is approximately 0.5m above sea level.
Figure 2-1 Location of the proposed power development in Cirebon, North Java, Indonesia
A 660MW coal-fired power station is proposed by PT Cirebon Electric Power. The project requires approximately 50 ha for a single-unit power plant, with the intention to develop a further 50 ha at the site at a later date. The footprint of the development is shown in Figure 2-2 In addition to the basic area of the plant, a jetty is proposed that will take up a further 11.3 ha.

Marine Ecology
SINCLAIR KNIGHT MERZ
D:\Documents and Settings\runsworth\Local Settings\Temporary Internet Files\OLK8B\R1_QE09421_Cirebon_Marine_Environment.doc PAGE 3
Figure 2-2 Footprint of proposed Cirebon power plant development with jetty extending out to sea
2.2 Proposed Earthworks The current site level is between 0.0 m to 0.5 m above mean sea level. It is intended that earthworks including excavation and backfilling will produce a generally horizontal platform at a mean level of approximately 2.5 m above mean sea level. An estimated 1 to 1.5 million m3 of cleanfill will be brought on to the site to raise this platform. The cleanfill material will be sourced from two local quarries within 20 km of the site and delivered daily by trucks. The transporting of fill material to the site will occur over a three-month period.
The soil pre-loading of the site will have an initial height of up to 3.8 m, and with settlement over the next 6 to 8 months before construction starts at the site will reduce to 2.5 m above mean sea level. Drains will be installed to allow moisture squeezed out of the sites soil by the preloaded mass of cleanfill to be collected and discharged from the site into the nearby rivers.
Construction works will include the construction of a temporary water block with septic tank (external waste disposal at treatment works), an area for washing truck wheels, a water pool for settling of wastewater and a water discharge channel. The channel will be lined with non-woven

Marine Ecology
SINCLAIR KNIGHT MERZ
PAGE 4 D:\Documents and Settings\runsworth\Local Settings\Temporary Internet Files\OLK8B\R1_QE09421_Cirebon_Marine_Environment.doc
geotextile and screened with double wire mesh for discharge into the adjacent river. The settling pond and screens will reduce sediment and particle outflow into the river.
It is anticipated that the earthworks will necessitate the removal of some mangrove vegetation.
2.3 Proposed Jetty Construction of the proposed power plant will necessitate the additional construction of a jetty. The proposed jetty will be 1.5 to 2.0 km in length (shown as 1.7 km on the plans) and 18 m wide. Some 0.3 km of the jetty will be on land. The minimum berth depth will be 5 m. Coal will be delivered to the site from Kalimantan and Sumatra by barges of 8,500 - 9,500 DWT capacity and offloaded to an unloading dock for transfer by a covered conveyer system to a coal stockpile on site.
The jetty will be situated to the north of the Coal Storage Area (see Figure 2-2), and will run through the coastal area currently containing mangrove vegetation, necessitating clearance of some mangroves.
2.4 Wastewater treatment and water intake A water intake and pipeline will be constructed under the jetty to take seawater at the unloading point. Seawater will be used, after varying levels of treatment and desalination, for cooling water, process waters, and potable water. after treatment.
Treated effluent from a number of sources at the site, including boiler blowdown, cooling tower bleed off, domestic sewage, process water, and some stormwater, will be discharged back to sea via a culverted outfall.

Marine Ecology
SINCLAIR KNIGHT MERZ
D:\Documents and Settings\runsworth\Local Settings\Temporary Internet Files\OLK8B\R1_QE09421_Cirebon_Marine_Environment.doc PAGE 5
3. Description of the Existing Environment The proposed power station development is in the Kanci area to the southeast of Cirebon City, which is located on the north coast of West Java, approximately 290 km east of Jakarta. In 2000 the city of Cirebon had a population of 272,263 (2000 Census). Population growth is currently 0.55% p.a., with a population estimate of 383,251 for 2020. Approximately 10 – 15 % of Cirebon's population lives in a coastal area of approximately 70 ha. The coastal area is intensely exploited and considered to be in poor environmental condition (Indra Consult 2000). The high levels of poverty within the regency of Cirebon, and a lack of viable employment alternatives and environmental understanding, present significant constraints on sustainably managing the existing marine and coastal resources.
The coastline of the Cirebon regency is commonly lined by sparse, degraded mangrove forest mixed with milkfish and prawn aquaculture ponds. Land use of the proposed development site itself currently comprises fish ponds, rice fields and salt ponds, although a large proportion of the site is unused. A belt of mangrove lies to the north of the site adjacent to the sea. The low-lying coast is lined with small pockets of residential areas, such as Kampung Waruduwur and Kampung Citemu, which are found to the west of the proposed site. A small farming village is located to the southeast of the site. The population density in the area immediately surrounding the proposed power plant is <100 persons/km2. Most residents in the surrounding area are farmers, though villagers in the Waruduwur Village are fishermen. Average income in the area is IDR 10,000 to 30,000/day.
3.1 Oceanography and Climate The climate of the Cirebon region is monsoonal. Java has two seasons, wet and dry; there are no extremes of winter and summer. The wet northwest monsoonal season falls between October and April, whilst the dry southeast monsoon season falls between May and September.
The average maximum daily temperature is 33.2 ± 0.1 ºC whilst rainfall averages 1778 ± 185 mm/yr. (see Table 3-1).
Table 3-1 Climate characteristics for the Cirebon region calculated from available data for 1993-2003 (Meteorological and Geofisical Agency, Jakarta 2007)
Maximum temperature
Mean temperature
% Humidity
Wind velocity (kt)
Rain days (No/Month)
Total annual rainfall (mm)
Mean 33.2 28.0 81.4 2.6 9.4 1778 SE 0.1 0.1 0.5 0.1 0.6 185
Marine Ecology
SINCLAIR KNIGHT MERZ
PAGE 6 D:\Documents and Settings\runsworth\Local Settings\Temporary Internet Files\OLK8B\R1_QE09421_Cirebon_Marine_Environment.doc
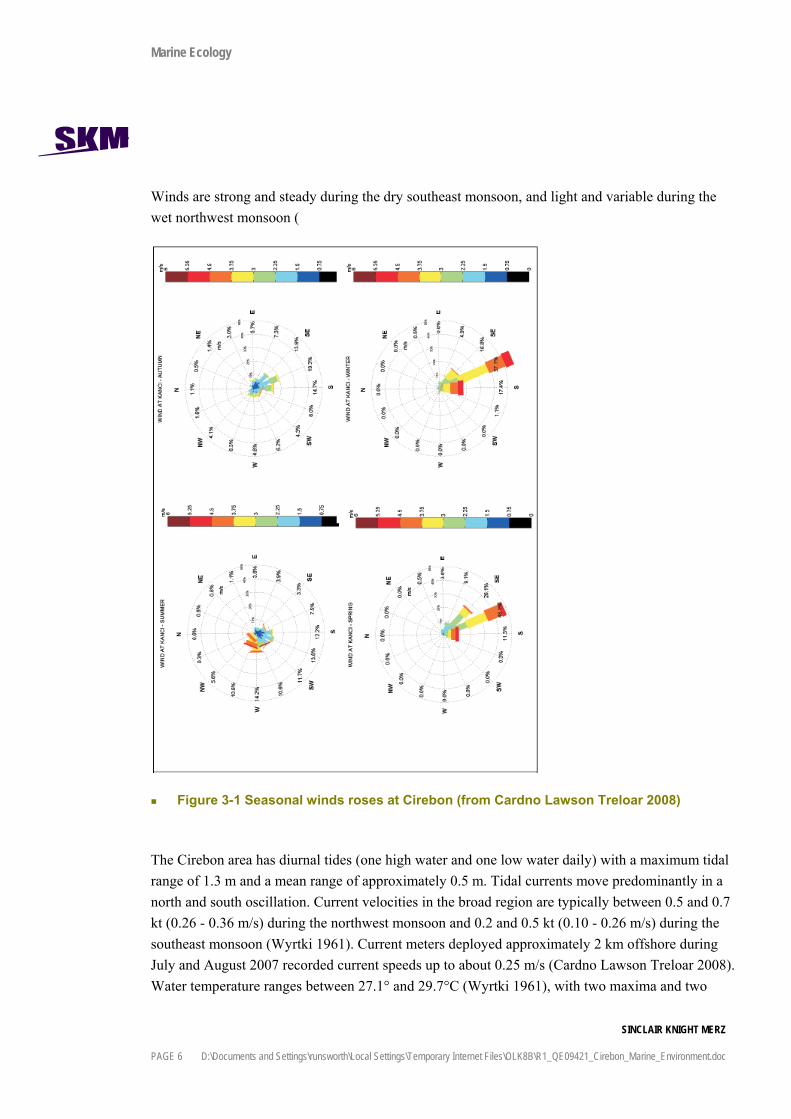
Winds are strong and steady during the dry southeast monsoon, and light and variable during the wet northwest monsoon (
Figure 3-1 Seasonal winds roses at Cirebon (from Cardno Lawson Treloar 2008)
The Cirebon area has diurnal tides (one high water and one low water daily) with a maximum tidal range of 1.3 m and a mean range of approximately 0.5 m. Tidal currents move predominantly in a north and south oscillation. Current velocities in the broad region are typically between 0.5 and 0.7 kt (0.26 - 0.36 m/s) during the northwest monsoon and 0.2 and 0.5 kt (0.10 - 0.26 m/s) during the southeast monsoon (Wyrtki 1961). Current meters deployed approximately 2 km offshore during July and August 2007 recorded current speeds up to about 0.25 m/s (Cardno Lawson Treloar 2008). Water temperature ranges between 27.1° and 29.7°C (Wyrtki 1961), with two maxima and two

Marine Ecology
SINCLAIR KNIGHT MERZ
D:\Documents and Settings\runsworth\Local Settings\Temporary Internet Files\OLK8B\R1_QE09421_Cirebon_Marine_Environment.doc PAGE 7
minima annually, whilst salinity is between 31.4‰ and 34.0‰ (data provided by Doosan Heavy Industries and Construction).
3.2 Water Quality A marine surface water quality study was undertaken to characterise the existing water quality in the vicinity of the Project to support the assessment of the potential impacts of discharges from the power plant.
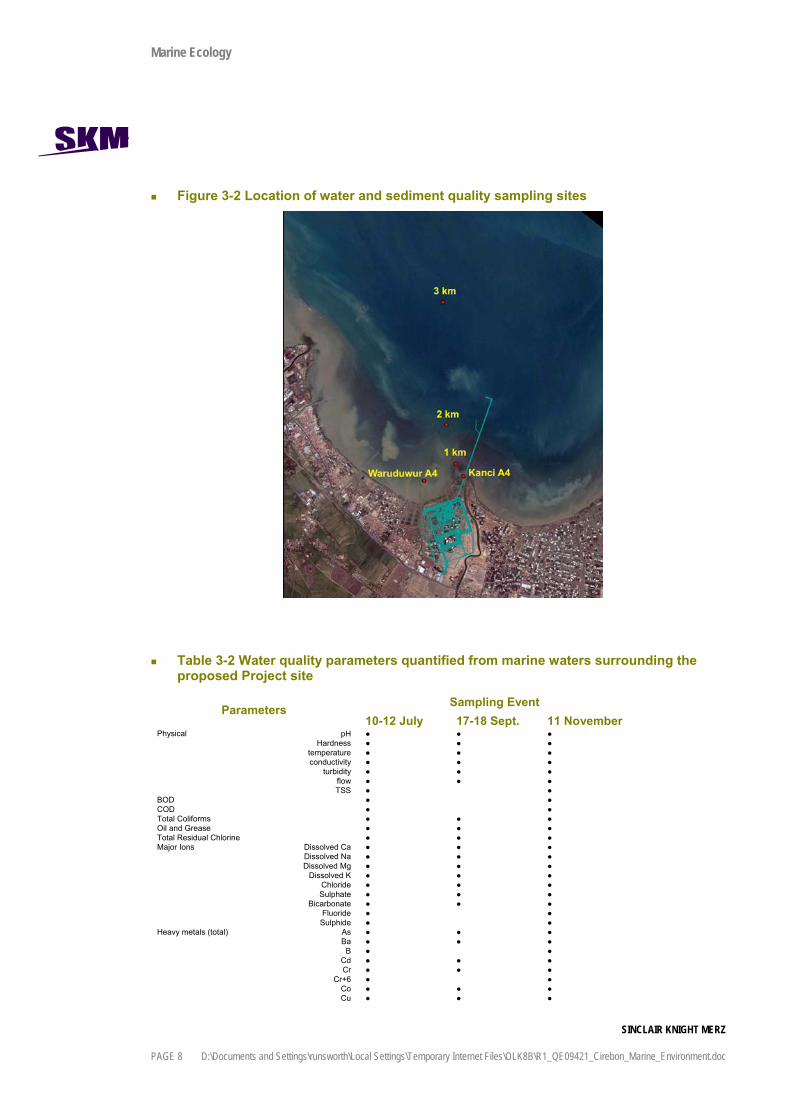
3.2.1 Methodology Water quality was surveyed by ITB consultants at five marine and estuarine localities (Figure 3-2), Three sites were located along a transect at distance of approximately 1, 2 and 3 km offshore of the proposed power plant site (designated as 1 km, 2 km, and 3km), and two sites were located about 400 m out from the mouths of the two rivers bordering the sites (designated as Kanci A4, and Waruduwur A4). At each site, three water sampling events took place, the first during 10-12 July 2007, the second during 17-18 September 2007, and the third on 11 November 2007.
Analysis of water quality samples collected by ITB was conducted by the Indonesian Institute of Sciences (Lembaga Ilmu Pengetahuan Indonesia - LIPI). Samples were analysed for pH, total suspended solids (TSS), ionic concentrations, BOD, COD, total residual chlorine, metals, oil and grease and organic contaminants, except that BOD, COD, and TSS were not determined for samples from the second sampling event (see Table 3-2). No quality control samples (e.g. duplicates, field blanks) were included; therefore levels of analytical accuracy or contamination during laboratory or field sampling cannot be established. It is also unknown whether contamination reduction procedures (e.g., use of latex gloves) were followed during sampling or in the laboratory.
Collection of all water samples for metal analysis used HNO3 (nitric acid) as a preservation agent, whilst analysis of COD and oil and grease used H2SO4 (sulphuric acid). Laboratory methods followed standard methods of the American Public Health Association (APHA).
Marine Ecology
SINCLAIR KNIGHT MERZ
PAGE 8 D:\Documents and Settings\runsworth\Local Settings\Temporary Internet Files\OLK8B\R1_QE09421_Cirebon_Marine_Environment.doc
Figure 3-2 Location of water and sediment quality sampling sites
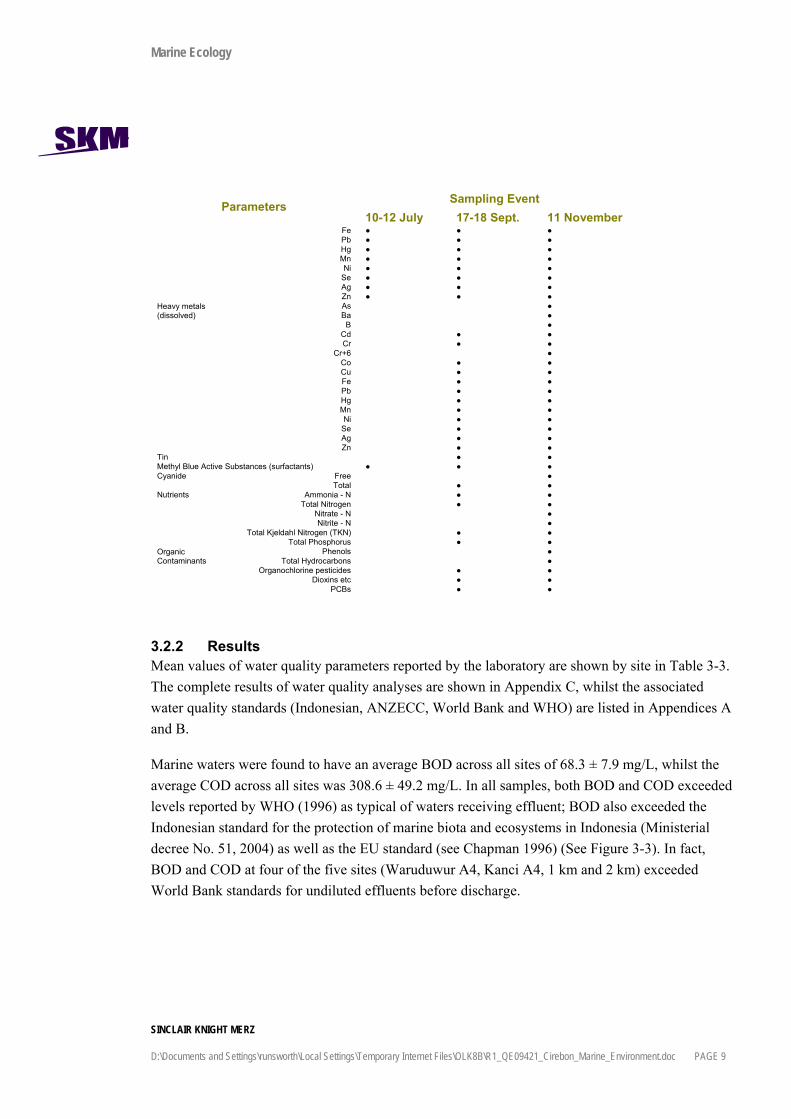
Table 3-2 Water quality parameters quantified from marine waters surrounding the proposed Project site
Sampling Event Parameters 10-12 July 17-18 Sept. 11 November
Physical pH ● ● ● Hardness ● ● ●
temperature ● ● ● conductivity ● ● ●
turbidity ● ● ● flow ● ● ● TSS ● ●
BOD ● ● COD ● ● Total Coliforms ● ● ● Oil and Grease ● ● ● Total Residual Chlorine ● ● ● Major Ions Dissolved Ca ● ● ●
Dissolved Na ● ● ● Dissolved Mg ● ● ●
Dissolved K ● ● ● Chloride ● ● ● Sulphate ● ● ●
Bicarbonate ● ● ● Fluoride ● ●
Sulphide ● ● Heavy metals (total) As ● ● ●
Ba ● ● ● B ● ●
Cd ● ● ● Cr ● ● ●
Cr+6 ● ● Co ● ● ● Cu ● ● ●
Marine Ecology
SINCLAIR KNIGHT MERZ
D:\Documents and Settings\runsworth\Local Settings\Temporary Internet Files\OLK8B\R1_QE09421_Cirebon_Marine_Environment.doc PAGE 9
Sampling Event Parameters 10-12 July 17-18 Sept. 11 November
Fe ● ● ● Pb ● ● ● Hg ● ● ● Mn ● ● ● Ni ● ● ●
Se ● ● ● Ag ● ● ● Zn ● ● ● As ● Heavy metals
(dissolved) Ba ● B ●
Cd ● ● Cr ● ●
Cr+6 ● Co ● ● Cu ● ● Fe ● ● Pb ● ● Hg ● ● Mn ● ● Ni ● ●
Se ● ● Ag ● ● Zn ● ●
Tin ● ● Methyl Blue Active Substances (surfactants) ● ● ● Cyanide Free ●
Total ● ● Nutrients Ammonia - N ● ●
Total Nitrogen ● ● Nitrate - N ● Nitrite - N ●
Total Kjeldahl Nitrogen (TKN) ● ● Total Phosphorus ● ●
Phenols ● Organic Contaminants Total Hydrocarbons ●
Organochlorine pesticides ● ● Dioxins etc ● ●
PCBs ● ●
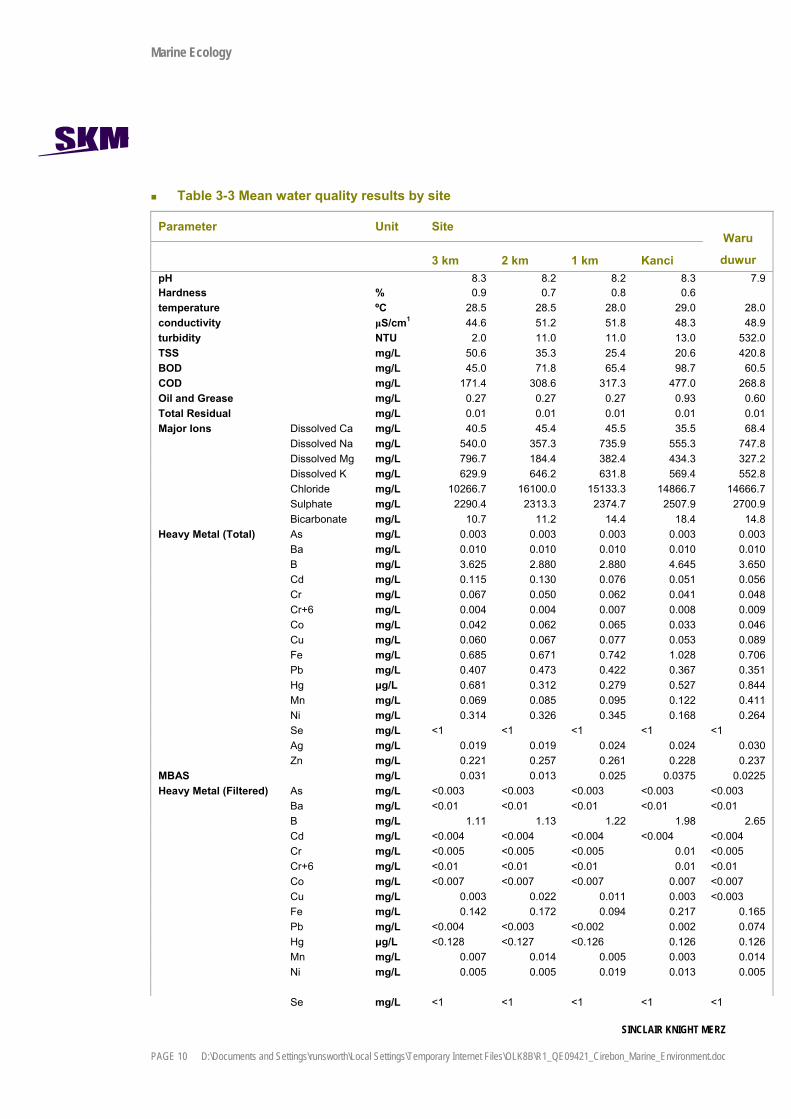
3.2.2 Results Mean values of water quality parameters reported by the laboratory are shown by site in Table 3-3. The complete results of water quality analyses are shown in Appendix C, whilst the associated water quality standards (Indonesian, ANZECC, World Bank and WHO) are listed in Appendices A and B.
Marine waters were found to have an average BOD across all sites of 68.3 ± 7.9 mg/L, whilst the average COD across all sites was 308.6 ± 49.2 mg/L. In all samples, both BOD and COD exceeded levels reported by WHO (1996) as typical of waters receiving effluent; BOD also exceeded the Indonesian standard for the protection of marine biota and ecosystems in Indonesia (Ministerial decree No. 51, 2004) as well as the EU standard (see Chapman 1996) (See Figure 3-3). In fact, BOD and COD at four of the five sites (Waruduwur A4, Kanci A4, 1 km and 2 km) exceeded World Bank standards for undiluted effluents before discharge.
Marine Ecology
SINCLAIR KNIGHT MERZ
PAGE 10 D:\Documents and Settings\runsworth\Local Settings\Temporary Internet Files\OLK8B\R1_QE09421_Cirebon_Marine_Environment.doc
Table 3-3 Mean water quality results by site
Parameter Unit Site
3 km 2 km 1 km Kanci
Waru
duwur pH 8.3 8.2 8.2 8.3 7.9 Hardness % 0.9 0.7 0.8 0.6 temperature ºC 28.5 28.5 28.0 29.0 28.0 conductivity μS/cm1 44.6 51.2 51.8 48.3 48.9 turbidity NTU 2.0 11.0 11.0 13.0 532.0 TSS mg/L 50.6 35.3 25.4 20.6 420.8 BOD mg/L 45.0 71.8 65.4 98.7 60.5 COD mg/L 171.4 308.6 317.3 477.0 268.8 Oil and Grease mg/L 0.27 0.27 0.27 0.93 0.60 Total Residual mg/L 0.01 0.01 0.01 0.01 0.01 Major Ions Dissolved Ca mg/L 40.5 45.4 45.5 35.5 68.4 Dissolved Na mg/L 540.0 357.3 735.9 555.3 747.8 Dissolved Mg mg/L 796.7 184.4 382.4 434.3 327.2 Dissolved K mg/L 629.9 646.2 631.8 569.4 552.8 Chloride mg/L 10266.7 16100.0 15133.3 14866.7 14666.7 Sulphate mg/L 2290.4 2313.3 2374.7 2507.9 2700.9 Bicarbonate mg/L 10.7 11.2 14.4 18.4 14.8 Heavy Metal (Total) As mg/L 0.003 0.003 0.003 0.003 0.003 Ba mg/L 0.010 0.010 0.010 0.010 0.010 B mg/L 3.625 2.880 2.880 4.645 3.650 Cd mg/L 0.115 0.130 0.076 0.051 0.056 Cr mg/L 0.067 0.050 0.062 0.041 0.048 Cr+6 mg/L 0.004 0.004 0.007 0.008 0.009 Co mg/L 0.042 0.062 0.065 0.033 0.046 Cu mg/L 0.060 0.067 0.077 0.053 0.089 Fe mg/L 0.685 0.671 0.742 1.028 0.706 Pb mg/L 0.407 0.473 0.422 0.367 0.351 Hg μg/L 0.681 0.312 0.279 0.527 0.844 Mn mg/L 0.069 0.085 0.095 0.122 0.411 Ni mg/L 0.314 0.326 0.345 0.168 0.264 Se mg/L <1 <1 <1 <1 <1 Ag mg/L 0.019 0.019 0.024 0.024 0.030 Zn mg/L 0.221 0.257 0.261 0.228 0.237 MBAS mg/L 0.031 0.013 0.025 0.0375 0.0225 Heavy Metal (Filtered) As mg/L <0.003 <0.003 <0.003 <0.003 <0.003 Ba mg/L <0.01 <0.01 <0.01 <0.01 <0.01 B mg/L 1.11 1.13 1.22 1.98 2.65 Cd mg/L <0.004 <0.004 <0.004 <0.004 <0.004 Cr mg/L <0.005 <0.005 <0.005 0.01 <0.005 Cr+6 mg/L <0.01 <0.01 <0.01 0.01 <0.01 Co mg/L <0.007 <0.007 <0.007 0.007 <0.007 Cu mg/L 0.003 0.022 0.011 0.003 <0.003 Fe mg/L 0.142 0.172 0.094 0.217 0.165 Pb mg/L <0.004 <0.003 <0.002 0.002 0.074 Hg μg/L <0.128 <0.127 <0.126 0.126 0.126 Mn mg/L 0.007 0.014 0.005 0.003 0.014 Ni mg/L 0.005 0.005 0.019 0.013 0.005
Se mg/L <1 <1 <1 <1 <1

Marine Ecology
SINCLAIR KNIGHT MERZ
D:\Documents and Settings\runsworth\Local Settings\Temporary Internet Files\OLK8B\R1_QE09421_Cirebon_Marine_Environment.doc PAGE 11
Parameter Unit Site
3 km 2 km 1 km Kanci
Waru
duwur Ag mg/L 0.015 0.014 0.02 0.034 0.014 Zn mg/L 0.059 0.044 0.047 0.044 0.037 Cyanide Free mg/L <0.01 <0.01 <0.01 <0.01 <0.01 Total mg/L <0.01 <0.01 <0.01 <0.01 <0.01 Nutrients and Ions NH3 mg/L 0.07 0.08 0.15 0.33 0.25 Total N mg/L 0.72 1.08 1.44 1.44 1.81 NO3- mg/L 0.03 0.02 0.04 0.3 0.15 NO2- mg/L 0.41 0.71 0.42 <0.01 <0.01 PO4
3- mg/L 0.02 0.02 0.01 0.02 0.04 TKN mg/L 5.42 7.22 7.22 7.22 9.03 F- mg/L 0.13 0.17 0.19 0.34 0.3 S2−, mg/L 0.03 0.02 0.01 0.01 0.01 Other Contaminants Phenols mg/L 0.0356 0.0591 0.001 0.0283 0.0363 Tin mg/L <0.005 <0.004 <0.003 0.03 0.03
Total Hydrocarbons mg/L 0.2 0.4 0.2 0.8 0.6 Total Coliforms MPN/10 700 700 300 300 4850
Organochlorine pesticides mg/L <0.0005 <0.0005 <0.0005 <0.0005 <0.0005 Dioxins etc mg/L <0.005 <0.005 <0.005 <0.005 <0.005 PCBs mg/L <0.005 <0.005 <0.005 <0.005 <0.005
1 Conductivity was incorrectly reported in units of mS in laboratory results from sampling event 1
Figure 3-3 Mean biological (BOD) and chemical oxygen demand (COD) compared to Indonesian standards, European Union (EU EPA) standards, and WHO guidelines (from Chapman 1996)
Marine Ecology
SINCLAIR KNIGHT MERZ
PAGE 12 D:\Documents and Settings\runsworth\Local Settings\Temporary Internet Files\OLK8B\R1_QE09421_Cirebon_Marine_Environment.doc
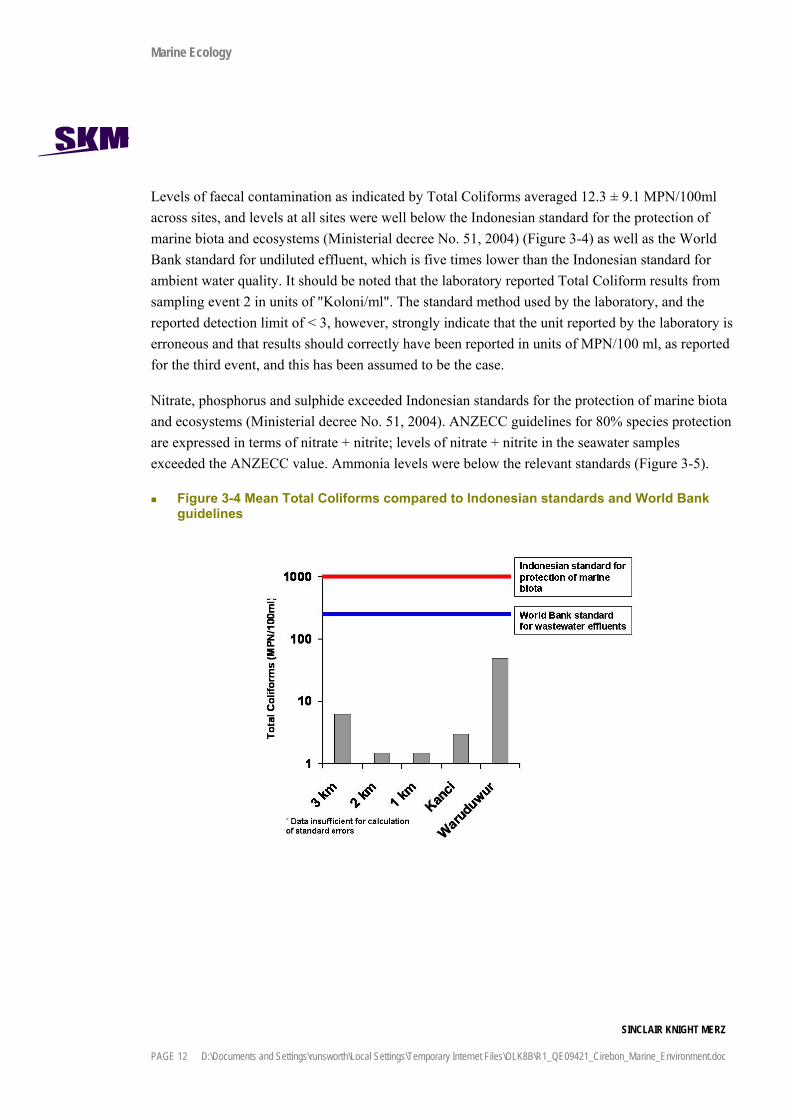
Levels of faecal contamination as indicated by Total Coliforms averaged 12.3 ± 9.1 MPN/100ml across sites, and levels at all sites were well below the Indonesian standard for the protection of marine biota and ecosystems (Ministerial decree No. 51, 2004) (Figure 3-4) as well as the World Bank standard for undiluted effluent, which is five times lower than the Indonesian standard for ambient water quality. It should be noted that the laboratory reported Total Coliform results from sampling event 2 in units of "Koloni/ml". The standard method used by the laboratory, and the reported detection limit of < 3, however, strongly indicate that the unit reported by the laboratory is erroneous and that results should correctly have been reported in units of MPN/100 ml, as reported for the third event, and this has been assumed to be the case.
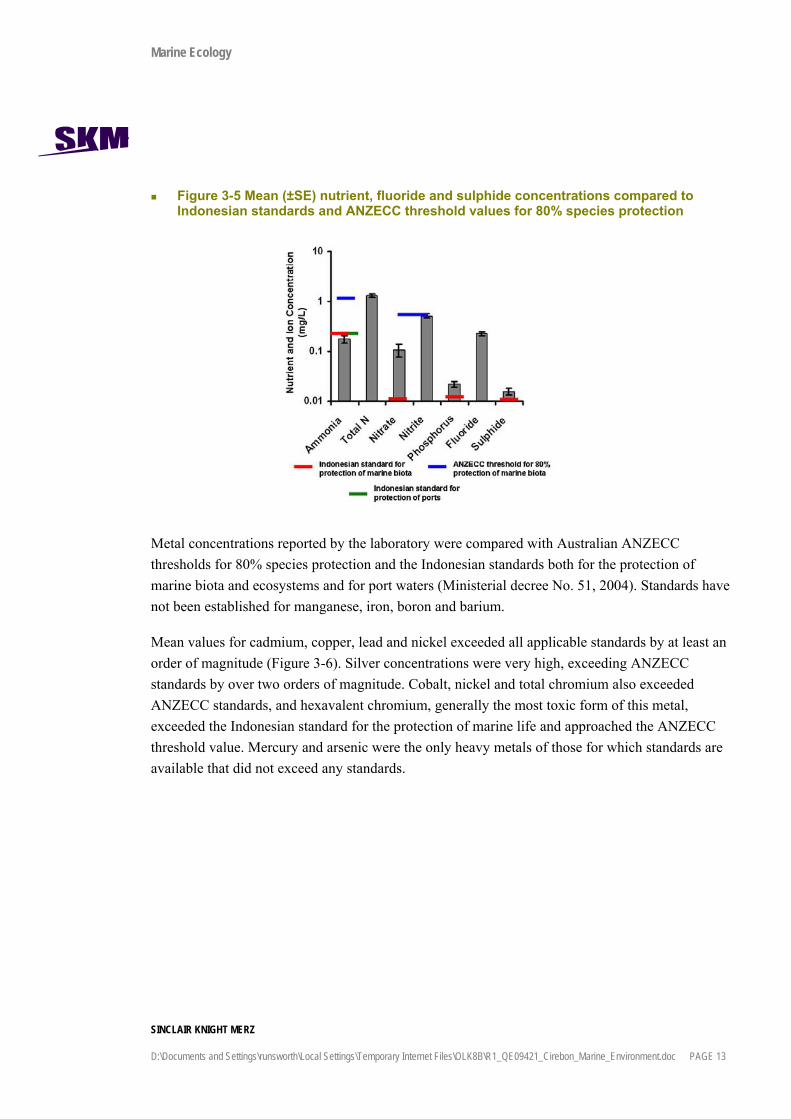
Nitrate, phosphorus and sulphide exceeded Indonesian standards for the protection of marine biota and ecosystems (Ministerial decree No. 51, 2004). ANZECC guidelines for 80% species protection are expressed in terms of nitrate + nitrite; levels of nitrate + nitrite in the seawater samples exceeded the ANZECC value. Ammonia levels were below the relevant standards (Figure 3-5).
Figure 3-4 Mean Total Coliforms compared to Indonesian standards and World Bank guidelines
Marine Ecology
SINCLAIR KNIGHT MERZ
D:\Documents and Settings\runsworth\Local Settings\Temporary Internet Files\OLK8B\R1_QE09421_Cirebon_Marine_Environment.doc PAGE 13
Figure 3-5 Mean (±SE) nutrient, fluoride and sulphide concentrations compared to Indonesian standards and ANZECC threshold values for 80% species protection
Metal concentrations reported by the laboratory were compared with Australian ANZECC thresholds for 80% species protection and the Indonesian standards both for the protection of marine biota and ecosystems and for port waters (Ministerial decree No. 51, 2004). Standards have not been established for manganese, iron, boron and barium.
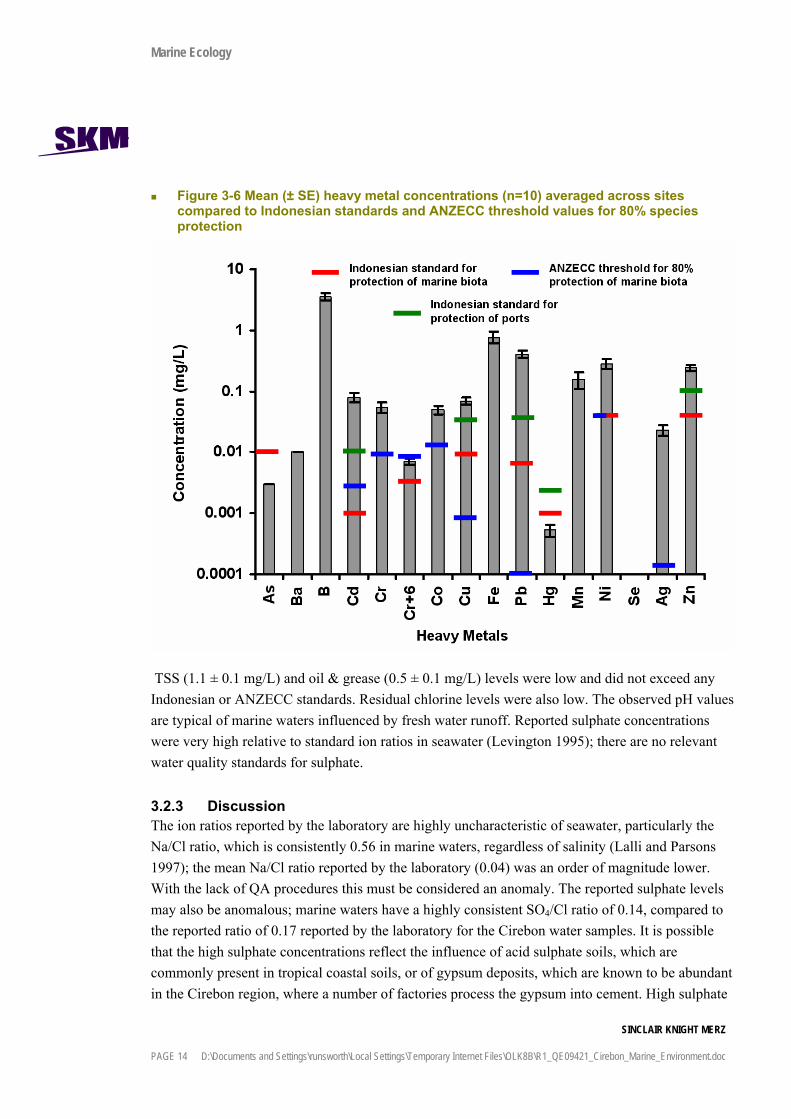
Mean values for cadmium, copper, lead and nickel exceeded all applicable standards by at least an order of magnitude (Figure 3-6). Silver concentrations were very high, exceeding ANZECC standards by over two orders of magnitude. Cobalt, nickel and total chromium also exceeded ANZECC standards, and hexavalent chromium, generally the most toxic form of this metal, exceeded the Indonesian standard for the protection of marine life and approached the ANZECC threshold value. Mercury and arsenic were the only heavy metals of those for which standards are available that did not exceed any standards.
Marine Ecology
SINCLAIR KNIGHT MERZ
PAGE 14 D:\Documents and Settings\runsworth\Local Settings\Temporary Internet Files\OLK8B\R1_QE09421_Cirebon_Marine_Environment.doc
Figure 3-6 Mean (± SE) heavy metal concentrations (n=10) averaged across sites compared to Indonesian standards and ANZECC threshold values for 80% species protection
TSS (1.1 ± 0.1 mg/L) and oil & grease (0.5 ± 0.1 mg/L) levels were low and did not exceed any Indonesian or ANZECC standards. Residual chlorine levels were also low. The observed pH values are typical of marine waters influenced by fresh water runoff. Reported sulphate concentrations were very high relative to standard ion ratios in seawater (Levington 1995); there are no relevant water quality standards for sulphate.
3.2.3 Discussion The ion ratios reported by the laboratory are highly uncharacteristic of seawater, particularly the Na/Cl ratio, which is consistently 0.56 in marine waters, regardless of salinity (Lalli and Parsons 1997); the mean Na/Cl ratio reported by the laboratory (0.04) was an order of magnitude lower. With the lack of QA procedures this must be considered an anomaly. The reported sulphate levels may also be anomalous; marine waters have a highly consistent SO4/Cl ratio of 0.14, compared to the reported ratio of 0.17 reported by the laboratory for the Cirebon water samples. It is possible that the high sulphate concentrations reflect the influence of acid sulphate soils, which are commonly present in tropical coastal soils, or of gypsum deposits, which are known to be abundant in the Cirebon region, where a number of factories process the gypsum into cement. High sulphate
Marine Ecology
SINCLAIR KNIGHT MERZ
D:\Documents and Settings\runsworth\Local Settings\Temporary Internet Files\OLK8B\R1_QE09421_Cirebon_Marine_Environment.doc PAGE 15
in the water column could potentially affect the solubility and hence the bioavailability of metals in the water column. Under anoxic conditions, which generally arise from the decomposition of organic matter, sulphate is reduced by microbial activity to hydrogen sulphide (H2S), which increases the solubility of metals (Bryan 1976). Sulphide levels were below the detection limit in all samples analysed for sulphide, however. Furthermore, despite high levels of total metals, dissolved metal concentrations (determined by analysis of filtered water samples) were low and generally below detection limits, indicating that the metals were present in primarily particulate form.
Within the immediate locality of the proposed Cirebon power development, the major uses of the water bodies are for biological support and biogeochemical cycling rather than for direct extraction of drinking water. The present results are in agreement with existing water quality data on local rivers revealing high organic loading and pollutant contamination. Within the Cirebon region, a 2000 survey by Indra Consult found only one of seventeen rivers (the Cimanggu) had a Biological Oxygen Demand (BOD) less than the Indonesian standard of 20 mg/L with one river containing 142 mg/L of BOD. High BOD in the present study and that of IndraConsult are presumably the result of limited sewage treatment, with many households disposing directly into water bodies, as well as high inputs of organic matter from agricultural and other activities.
The high levels of heavy metals within the water column raise significant environmental, and potentially public health, issues in an area dependent upon marine fisheries (see Section 3.7). The higher levels of total heavy metals relative to dissolved forms suggests that metals in the water column are not bioavailable. However, with levels of some metals, such as cadmium, over two orders of magnitude higher than Indonesian standards for the protection marine biota, metal contamination within the region is a concern. These levels of contamination may reduce the value of the area for marine biota and fisheries, and to the extent that metals are bioavailable have the potential to bioaccumulate within the food web (Connell and Miller 1984). Sources of these contaminants may be varied due to the general lack of environmentally safe refuse and chemical disposal mechanisms within Indonesia. Disposal of refuse in upper river catchments may be resulting in groundwater contamination from uncontained and untreated landfill leachates (Indra Consult 2000), whilst the use of leaded petrol up until 2001 may have resulted in significant deposition of lead across river catchments.
In the absence of information of appropriate quality control procedures, the possibility that samples were contaminated during sampling and analysis cannot be ruled out. The low metal levels in filtered samples, however, tend to indicate that this is not the case since contamination would be at least as likely for filtered as for unfiltered samples.

Marine Ecology
SINCLAIR KNIGHT MERZ
PAGE 16 D:\Documents and Settings\runsworth\Local Settings\Temporary Internet Files\OLK8B\R1_QE09421_Cirebon_Marine_Environment.doc
3.3 Sediment Quality Marine sediments may contain an abundance of flora and fauna that serves to support an array of larger, often economically important, fauna. The particle supply to estuarine- and riverine- influenced marine sediments is often terrigenous, with fine clay and mud particles settling in conditions of low turbulence. Such fine particles bind with many anthropogenic contaminants, potentially causing the accumulation of pollutants in marine sediments and, if the contaminants are bioavailable in the food chain.
The area surrounding the proposed power development is dominated by large fisheries (see Section 3.7) that have significant economic importance. Marine sediment quality is therefore important to the sustainability of fisheries, and possibly biodiversity. Because of the potential for contaminants to accumulate in target organisms, sediment quality is also an important determinant of seafood safety.
3.3.1 Methodology Marine sediment quality was surveyed by ITB consultants at the same five locations that were sampled for water quality (see Figure 3-2). Sites were sampled once. Sites Wuruduwar A4 and Kanci A4 were samples during 10-12 July 2007 and sites 1 km, 2 km and 3 km were sampled during 17-18 September 2007. Sediment samples were taken using a 15 cm x 15 cm (0.0225 m2) Ekman grab. Three replicate samples were collected at each site. The replicates were homogenised and analysed as single samples, however, so no information is available on sampling and analysis variability.
Analysis of sediment samples was conducted by the Indonesian Institute of Sciences (Lembaga Ilmu Pengetahuan Indonesia - LIPI). All samples were analysed for the parameters shown in Table 3-4. No quality control samples (e.g. duplicates, field blanks) were included, therefore levels of analytical accuracy or contamination during laboratory or field sampling protocols cannot be established. It is also unknown whether contamination reduction procedures (e.g. latex gloves) occurred within the laboratory or during sampling.
At each site, one sample was analysed for sediment size using six graded sieves sizes. Each sieve was assigned a Phi value (Ф) and the cumulative percentage of the sediment passing through this size sieve was determined and a median Phi value (Ф) taken as 50% of the cumulative percentage. The median Phi value was categorised into sediment type.
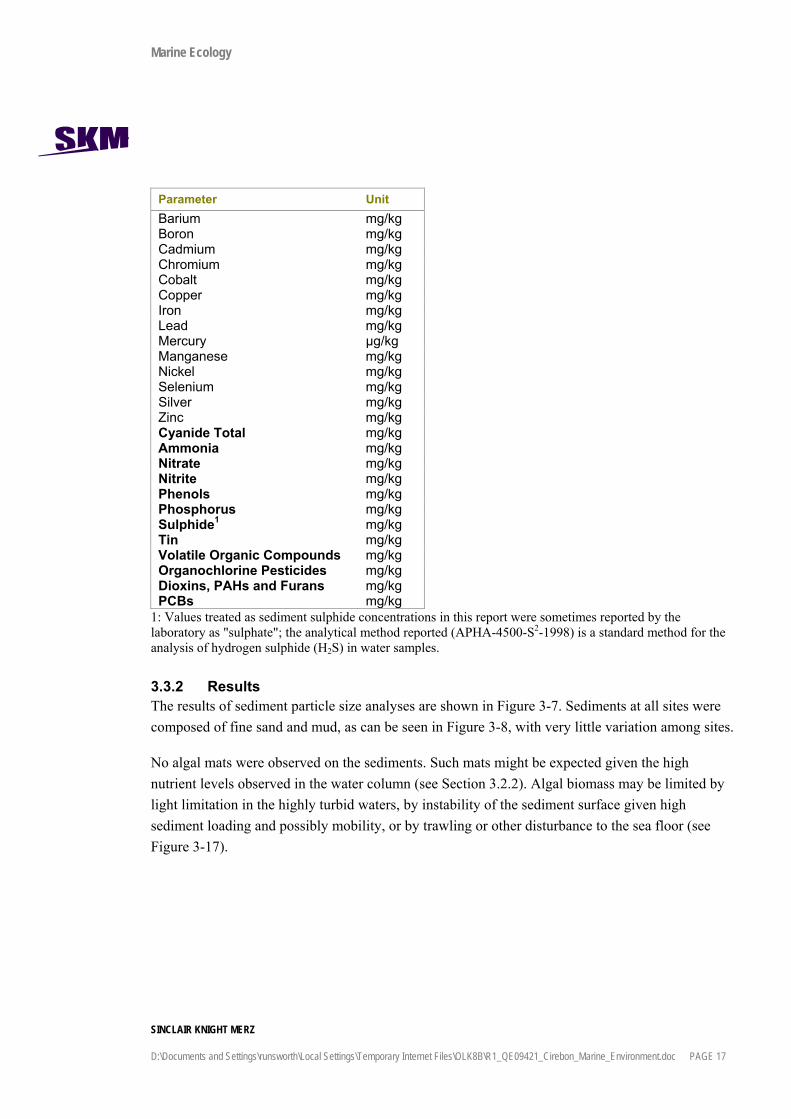
Table 3-4 Parameters analysed in sediment samples
Parameter Unit pH mg/kg Total Organic carbon mg/kg Heavy Metal Arsenic mg/kg
Marine Ecology
SINCLAIR KNIGHT MERZ
D:\Documents and Settings\runsworth\Local Settings\Temporary Internet Files\OLK8B\R1_QE09421_Cirebon_Marine_Environment.doc PAGE 17
Parameter Unit Barium mg/kg Boron mg/kg Cadmium mg/kg Chromium mg/kg Cobalt mg/kg Copper mg/kg Iron mg/kg Lead mg/kg Mercury μg/kg Manganese mg/kg Nickel mg/kg Selenium mg/kg Silver mg/kg Zinc mg/kg Cyanide Total mg/kg Ammonia mg/kg Nitrate mg/kg Nitrite mg/kg Phenols mg/kg Phosphorus mg/kg Sulphide1 mg/kg Tin mg/kg Volatile Organic Compounds mg/kg Organochlorine Pesticides mg/kg Dioxins, PAHs and Furans mg/kg PCBs mg/kg
1: Values treated as sediment sulphide concentrations in this report were sometimes reported by the laboratory as "sulphate"; the analytical method reported (APHA-4500-S2-1998) is a standard method for the analysis of hydrogen sulphide (H2S) in water samples.
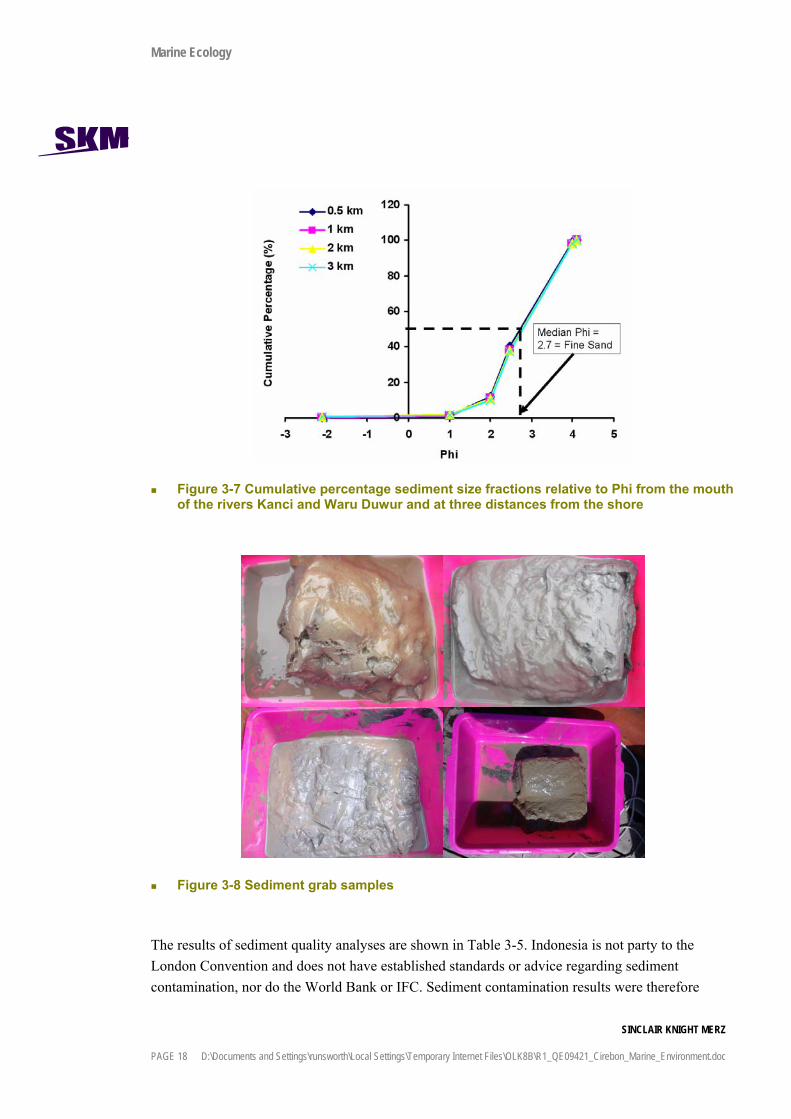
3.3.2 Results The results of sediment particle size analyses are shown in Figure 3-7. Sediments at all sites were composed of fine sand and mud, as can be seen in Figure 3-8, with very little variation among sites.
No algal mats were observed on the sediments. Such mats might be expected given the high nutrient levels observed in the water column (see Section 3.2.2). Algal biomass may be limited by light limitation in the highly turbid waters, by instability of the sediment surface given high sediment loading and possibly mobility, or by trawling or other disturbance to the sea floor (see Figure 3-17).
Marine Ecology
SINCLAIR KNIGHT MERZ
PAGE 18 D:\Documents and Settings\runsworth\Local Settings\Temporary Internet Files\OLK8B\R1_QE09421_Cirebon_Marine_Environment.doc
Figure 3-7 Cumulative percentage sediment size fractions relative to Phi from the mouth of the rivers Kanci and Waru Duwur and at three distances from the shore
Figure 3-8 Sediment grab samples
The results of sediment quality analyses are shown in Table 3-5. Indonesia is not party to the London Convention and does not have established standards or advice regarding sediment contamination, nor do the World Bank or IFC. Sediment contamination results were therefore

Marine Ecology
SINCLAIR KNIGHT MERZ
D:\Documents and Settings\runsworth\Local Settings\Temporary Internet Files\OLK8B\R1_QE09421_Cirebon_Marine_Environment.doc PAGE 19
compared with the interim sediment quality guidelines from the ANZECC (2000) water quality guidelines. These guidelines include low and high trigger values, which correspond to effects range-low and -high values established for biological effects on the basis of a range of toxicological data (Long et al. 1995), and are also used as the screening and maximum levels for sediment assessment in the Australian National Ocean Disposal Guidelines for Dredged Material (NODGM).
Table 3-5 Sediment analysis results for homogenised samples. Values highlighted in red exceed the ANZECC Guidelines ISQG-Low trigger values
Parameter Reporting unit 3 km 2 km 1 km
Kanci A4
Waru duwur A4
ISQG-Low
ISQG-High
pH mg/kg 8.1 7.8 7.8 8.1 8.2 Total Organic carbon mg/kg 6127 3006 Heavy Metals mg/kg As mg/kg <0.003 <0.003 Ba mg/kg 37.4 36.5 B mg/kg 32.8 31.1 Cd mg/kg 0.6 0.8 1.2 1.0 1.3 1.5 10 Cr mg/kg 7.7 4.6 10.4 16.5 14.2 80 370 Co mg/kg 2.5 2.6 2.9 0.8 0.9 Cu mg/kg 3.4 1.8 2.0 13.8 5.5 65 270 Fe mg/kg 1684 1745 1799 1170 2457 Pb mg/kg 10.9 10.6 7.3 13.9 16.8 50 220 Hg μg/kg 7.8 3.3 7.9 1.9 7.8 150 1000 Mn mg/kg 389.4 239.0 309.4 509.6 809.3 Ni mg/kg 27.0 11.6 10.7 15.0 25.7 21 52 Se mg/kg <1 <1 <1 <1 <1 Ag mg/kg 2.3 2.9 2.3 1.4 2.4 1 3.7 Zn mg/kg 79.9 67.6 76.7 125.4 175.3 200 410 Cyanide Total mg/kg <0.01 <0.01 Ammonia mg/kg 0.1 0.02 Nitrate mg/kg 0.15 0.14 0.13 0.05 0.05 Nitrite mg/kg 0.001 0.005 0.004 0.005 0.035 Phenols mg/kg <0.001 <0.001 Phosphorus mg/kg 0.03 0.03 0.04 0.00 0.00 Sulphide mg/kg 9.7 9.1 9.1 5.6 5.4 Tin mg/kg <0.03 <0.03 <0.03 <0.03 <0.03 Volatile Organic Compounds mg/kg <0.003 <0.003 <0.003 <0.003 <0.003 Organochlorine Pesticides mg/kg <0.0005 <0.0005 <0.0005 <0.0005 <0.0005 Dioxins, Furans and PAHs mg/kg <0.005 <0.005 <0.005 <0.005 <0.005 PCBs mg/kg <0.005 <0.005 <0.005 <0.005 <0.005
Samples from all five sites exceeded the ISQG-Low trigger value for silver, and nickel levels exceeded the ISQF-low value at two sites. Levels of other metals were all below the ISQG-low trigger values at all sites. Organic contaminants were below detection limits at all sites. Sulphide concentrations appear high, but as discussed below are difficult to interpret.

Marine Ecology
SINCLAIR KNIGHT MERZ
PAGE 20 D:\Documents and Settings\runsworth\Local Settings\Temporary Internet Files\OLK8B\R1_QE09421_Cirebon_Marine_Environment.doc
3.3.3 Discussion Marine sediments were found to be contaminated by two heavy metals. Silver levels in marine sediments in the locality of the proposed power plant are reported to be nearly three times the ISQG trigger level in the ANZECC guidelines in all samples. Nickel was above screening level in two samples. Under the Australian NODGM , if the sediments were to be evaluated for ocean disposal after dredging, additional investigations would be warranted to determine their potential negative impact on the marine environment, including assessment of the bioavailability of the metals and, depending upon the results of the bioavailability analysis, sediment toxicity testing.
The elevated levels of silver and nickel in the sediments are consistent with the high levels of these metals in particulate form in the water column (see Section 3.2). The relatively low levels of cadmium, chromium, copper and zinc in the sediments are somewhat unexpected given the high levels of these metals, in particulate form, in water samples and the strong tendency of these metals to bind to sediment particles.
The reported sulphide levels in the sediment samples are difficult to interpret. It is noted that the laboratory reported using a method (APHA-4500-S2--1998) that is designed for water rather than soil or sediment samples. The reported sulphide levels are expressed in units of mg/kg; hydrogen sulphide (H2S), however, occurs in gaseous or dissolved forms and therefore all of the reported sulphide would presumably have occurred in the sediment pore waters. This would indicate sulphide concentrations in the pore waters several orders of magnitude higher than the reported mean value of 7.78 mg/kg (or 7.78 ppm). Such levels of H2S would be highly toxic, and would be expected only in anoxic sediments. The productive benthic fisheries in the area (Section 3.7) are highly inconsistent with such conditions in the sediments. If, however, sulphide is indeed formed in the sediments the solubility and therefore bioavailability of metals in the sediment pore water would be expected to increase (Bryan 1976). In the absence of information regarding quality control procedures during sampling, sample handling, and analysis, it is also possible that H2S was generated by microbial degradation of organic matter in the sediment samples during storage prior to analysis.
3.4 Biological Contamination
3.4.1 Introduction Baseline levels of heavy metals in the tissues of marine organisms from the area were surveyed to indicate the availability of metals occurring in high concentrations in seawater and marine sediments in the area. The objective of the tissue concentration analyses were to obtain a preliminary indication of metal bioavailability and bioaccumulation in order to assess the potential

Marine Ecology
SINCLAIR KNIGHT MERZ
D:\Documents and Settings\runsworth\Local Settings\Temporary Internet Files\OLK8B\R1_QE09421_Cirebon_Marine_Environment.doc PAGE 21
biological and human health impacts of existing levels of contamination, as well as the potential impacts of Project discharges to the receiving environment.
3.4.2 Methodology ITB consultants collected samples of 5 species of fish and an unidentified species of oyster (Crassostrea sp.) on 11-12 July, 2007. The fishes were caught with a net; ITB reported that they collected species common in the area. The exact sampling locations, method used to collect the oyster, of numbers of individual samples per species are unknown; because only one analytical result is reported per species it is assumed that a single individual of each species was collected and analysed. Samples were analysed by the Indonesian Institute of Sciences (Lembaga Ilmu Pengetahuan Indonesia - LIPI) for tissue concentrations of iron, copper, mercury, cobalt, chromium, lead, cadmium, zinc, nickel and magnesium. No information on quality control procedures is available.
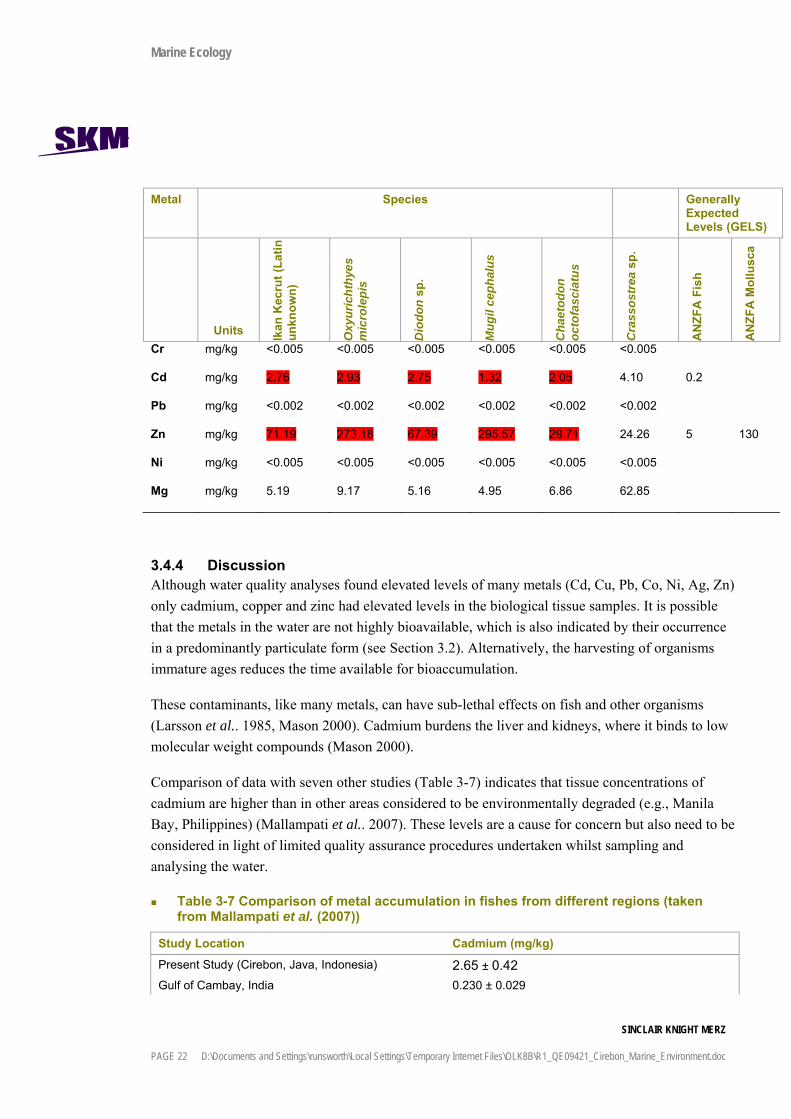
3.4.3 Results The result of the biological contamination analyses are shown in Table 3-6. Metal concentrations in tissues were compared to Food Standards Australia New Zealand Generally Expected Levels (ANZFA GELS). All fish samples were reported to contain cadmium and zinc at levels above the ANZFA GELS, and three of the five fish samples also had copper levels exceeding the GELS. Although GELS for cadmium in molluscs have not been established, the cadmium concentration was also high in the oyster sample. The reported detection limit Other metals had concentrations either below GELS, or GELS were not available.
Table 3-6 Heavy metal concentrations in tissue of marine organisms harvested in the proximity to the Project site. Values highlighted in red exceed ANZFA generally expected levels (GELS) of contamination.
Metal Species Generally Expected Levels (GELS)
Units Ikan
Kec
rut (
Latin
un
know
n)
Oxy
uric
hthy
es
mic
role
pis
Dio
don
sp.
Mug
il ce
phal
us
Cha
etod
on
octo
fasc
iatu
s
Cra
ssos
trea
sp.
AN
ZFA
Fis
h
AN
ZFA
Mol
lusc
a
Cu mg/kg 22.87 30.30 7.11 <0.003 <0.003 <0.003 0.5 5
Fe mg/kg 5.59 59.21 0.002 15.99 49.88 410.05
Hg μg/kg <0.126 <0.126 <0.126 <0.126 <0.126 <0.126
Co mg/kg <0.007 <0.007 <0.007 <0.007 <0.007 <0.007
Marine Ecology
SINCLAIR KNIGHT MERZ
PAGE 22 D:\Documents and Settings\runsworth\Local Settings\Temporary Internet Files\OLK8B\R1_QE09421_Cirebon_Marine_Environment.doc
Metal Species Generally Expected Levels (GELS)
Units Ikan
Kec
rut (
Latin
un
know
n)
Oxy
uric
hthy
es
mic
role
pis
Dio
don
sp.
Mug
il ce
phal
us
Cha
etod
on
octo
fasc
iatu
s
Cra
ssos
trea
sp.
AN
ZFA
Fis
h
AN
ZFA
Mol
lusc
a
Cr mg/kg <0.005 <0.005 <0.005 <0.005 <0.005 <0.005
Cd mg/kg 2.76 2.93 2.75 1.32 2.05 4.10 0.2
Pb mg/kg <0.002 <0.002 <0.002 <0.002 <0.002 <0.002
Zn mg/kg 71.19 273.18 67.39 295.57 29.71 24.26 5 130
Ni mg/kg <0.005 <0.005 <0.005 <0.005 <0.005 <0.005
Mg mg/kg 5.19 9.17 5.16 4.95 6.86 62.85
3.4.4 Discussion Although water quality analyses found elevated levels of many metals (Cd, Cu, Pb, Co, Ni, Ag, Zn) only cadmium, copper and zinc had elevated levels in the biological tissue samples. It is possible that the metals in the water are not highly bioavailable, which is also indicated by their occurrence in a predominantly particulate form (see Section 3.2). Alternatively, the harvesting of organisms immature ages reduces the time available for bioaccumulation.
These contaminants, like many metals, can have sub-lethal effects on fish and other organisms (Larsson et al.. 1985, Mason 2000). Cadmium burdens the liver and kidneys, where it binds to low molecular weight compounds (Mason 2000).
Comparison of data with seven other studies (Table 3-7) indicates that tissue concentrations of cadmium are higher than in other areas considered to be environmentally degraded (e.g., Manila Bay, Philippines) (Mallampati et al.. 2007). These levels are a cause for concern but also need to be considered in light of limited quality assurance procedures undertaken whilst sampling and analysing the water.
Table 3-7 Comparison of metal accumulation in fishes from different regions (taken from Mallampati et al. (2007))
Study Location Cadmium (mg/kg)
Present Study (Cirebon, Java, Indonesia) 2.65 ± 0.42 Gulf of Cambay, India 0.230 ± 0.029

Marine Ecology
SINCLAIR KNIGHT MERZ
D:\Documents and Settings\runsworth\Local Settings\Temporary Internet Files\OLK8B\R1_QE09421_Cirebon_Marine_Environment.doc PAGE 23
Study Location Cadmium (mg/kg)
Manila bay, Philippines 0.0243 (0.006-0.071) Iskenderun Bay 0.95 Calcasieu River and Lake, Louisiana, USA 0.1 (0.003-0.12) Mediterranean Sea 0.37-0.79 Arabian Sea, Pakistan 0.32 (0.19-0.73) Osaka, Japan 0.027 (0.017-0.0045)
3.5 Mangrove Communities Mangrove forests are characteristic of tropical coastlines, containing many additional epiphytic flora and fauna such as higher plants, algae, mosses and liverworts (Hogarth 2007). Mangroves have great ecological and economic importance. This includes the provision of critical habitat, including spawning and nursery grounds for many species of fish, prawns and crabs (Mumby et al.. 2004, Dorenbosch et al.. 2005), the protection of the shoreline from storms, cyclones and tsunamis (Alongi 2008), the production of organic carbon to support the food chain, the trapping or absorption of pollutants (Ruitenbeek 1994, Gilbert & Janssen 1998, Hogarth 2007), and the direct provision of resources including fisheries and wood.. Mangroves also play an important role in global biogeochemical cycles (Hogarth 2007).
Within Indonesia, mangroves are increasingly under threat, particularly from deforestation for aquaculture, coastal development and firewood, as well as pollution. It is estimated that mangrove cover in Indonesia has declined by between 43 and 70% since 1950 (FAO 2002), but the recent tsunami disaster in Aceh, and the importance of mangroves to Indonesia’s climate change strategies has given mangrove conservation a higher political profile.
In terms of their economic importance in Indonesia, mangroves support coastal fisheries production, provide fish and shellfish for consumption, and are a source of traditional medicines, tannin, honey and alcohol (Tomascik et al. 1997). They also have recreational, spiritual and cultural importance. In Indonesia, mangroves are often a preferred source of firewood for cooking and are commonly utilised for housing materials and fish trap construction (Cullen 2007). They have been estimated to have a value of USD500-9,990/ha/yr (Dixon 1989, Costanza et al.. 1997).
3.5.1 Methodology Mangroves were surveyed by ITB consultants on 5 August 2007. Using a hand-held GPS to record their position and maintain a straight transect, ITB walked four, 5 m-wide, belt transect surveys of variable length (see
Table 3-8 ) to identify the spatial extent, abundance, and species of each mangrove tree above head height present in the transect (Figure 3-9), and visually assess mangrove condition. Interview
Marine Ecology
SINCLAIR KNIGHT MERZ
PAGE 24 D:\Documents and Settings\runsworth\Local Settings\Temporary Internet Files\OLK8B\R1_QE09421_Cirebon_Marine_Environment.doc
surveys of local residents were also conducted to characterise the nature and level of mangrove utilisation.
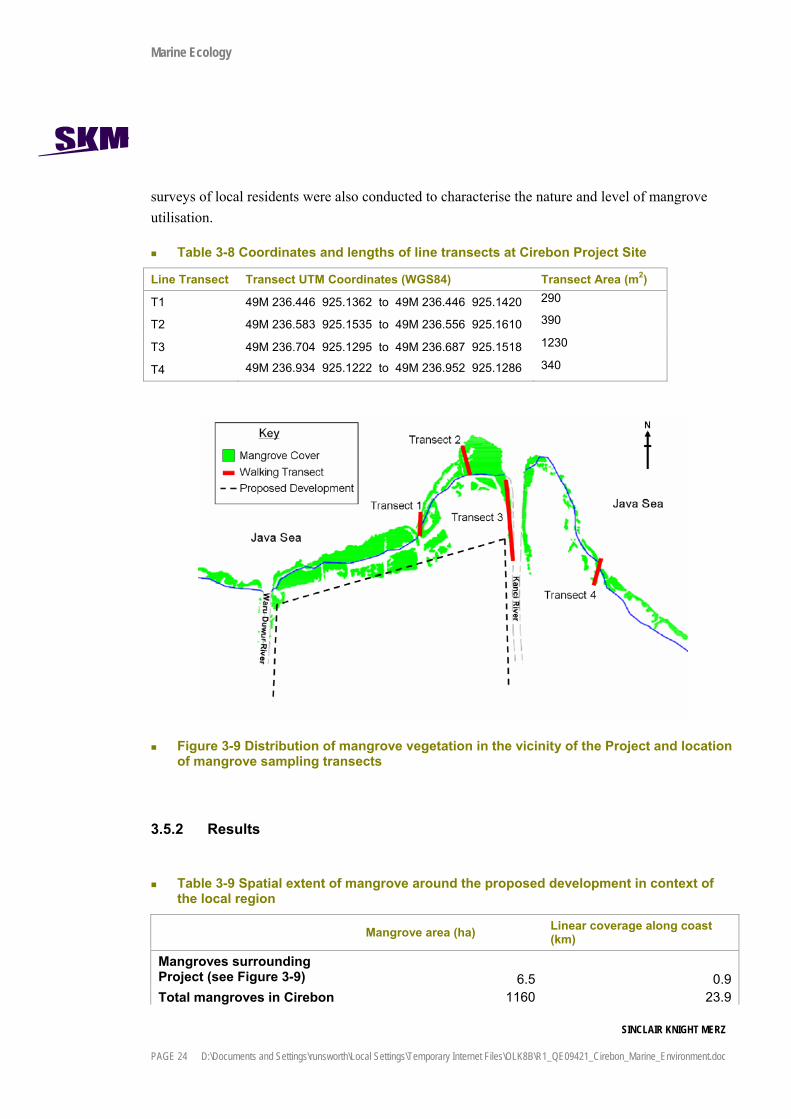
Table 3-8 Coordinates and lengths of line transects at Cirebon Project Site
Line Transect Transect UTM Coordinates (WGS84) Transect Area (m2)
T1 49M 236.446 925.1362 to 49M 236.446 925.1420 290
T2 49M 236.583 925.1535 to 49M 236.556 925.1610 390
T3 49M 236.704 925.1295 to 49M 236.687 925.1518 1230
T4 49M 236.934 925.1222 to 49M 236.952 925.1286 340
Figure 3-9 Distribution of mangrove vegetation in the vicinity of the Project and location of mangrove sampling transects
3.5.2 Results
Table 3-9 Spatial extent of mangrove around the proposed development in context of the local region
Mangrove area (ha) Linear coverage along coast (km)
Mangroves surrounding Project (see Figure 3-9) 6.5 0.9Total mangroves in Cirebon 1160 23.9

Marine Ecology
SINCLAIR KNIGHT MERZ
D:\Documents and Settings\runsworth\Local Settings\Temporary Internet Files\OLK8B\R1_QE09421_Cirebon_Marine_Environment.doc PAGE 25
Mangrove area (ha) Linear coverage along coast (km)
Political Regency Mangroves as a % of region 0.6% 3.7%
A total area 6.5 ha of mangroves is present on the seaward side of the proposed power plant (Figure 3-9). This area represents approximately 0.6% of the mangrove aerial coverage within the Cirebon region and covers 3.7% of the total linear coverage of mangroves along the coast. Six floral species were identified by ITB within this area of mangrove (see Table 3-10). Only four of these species (Avicennia alba, A. marina, Rhizopora mucronata and Acanthus ilicifolius) are generally considered to be true mangroves (salt-tolerant trees and shrubs), and Acanthus ilicifolius is a small herbaceous shrub that is often considered a woody herb rather than a mangrove per se. Sesuvium portulacastrum and Ipomoea pes-caprae are herbaceous ground cover plants common in dune, beach, and other sandy foreshore habitats.
The densities of the three primary mangrove species were quantified, with an overall mean density of 0.16 ± 0.08 individual trees/m2.
Table 3-10 Floral species found in the mangrove area during the field survey
Latin Name Common Name Ecology Typical Habitat
Avicennia alba Blume Pioneer seaward edge, muddy rivers Avicennia marina (Forsk.) Grey mangrove seaward edge, sandy soils Rhizophora mucronata L. Red mangrove Mid inter-tidal muddy rivers Acanthus ilicifolius L. Holly mangrove freshwater Sesuvium portulacastrum L. Sea purslane Pioneer sand Ipomoea pes-caprae L. Goat's foot Pioneer sand
The most abundant species of mangrove was Avicennia alba, with a mean (±SE) abundance of 0.15 ± 0.09 individuals/m2, comprising over 82% of the mangrove trees above head height (Table 3-11). Mangroves were found by ITB to be spatially variable, with the highest density occurring on the western-most transect (T1). The eastern transects (T3 and T4) were the most species-rich. The spatial variability of the mangroves is confirmed by satellite imagery (Google Earth 2007) showing mangrove cover on the western side towards the Waruduwur River to be mixed with milkfish ponds. Such variability can be seen in Figure 3-10. Within the context of the wider Cirebon area, mangroves are only present as a minor habitat, with low mangrove coverage of only 1160 ha, and mangroves in the immediate vicinity of the Project site (shown in green in Figure 3-9) comprise only 0.6% of that coverage.

Marine Ecology
SINCLAIR KNIGHT MERZ
PAGE 26 D:\Documents and Settings\runsworth\Local Settings\Temporary Internet Files\OLK8B\R1_QE09421_Cirebon_Marine_Environment.doc
ITB observers subjectively described the mangroves to be in an overall degraded condition, contaminated with large amounts of plastic rubbish, and to be highly modified from their natural state. Those mangroves closer to the ocean were considered to be somewhat less degraded, however photographs and videos show large amounts of rubbish along the seaward edge of the mangroves as well.
Figure 3-10 Images illustrating the variability of mangrove (inter-mixed with aquaculture ponds) within the area to the east and west of the Kanci River (within the vicinity of the proposed power development)
Figure 3-11 Images illustrating the immaturity (low height) of the mangrove assemblage in the area to the east and west of the Kanci River in the vicinity of the proposed power development
Photographs of the survey localities confirm the low density of relatively mature trees (Figure 3-10 and Figure 3-11). Some areas contain a high density of low, immature plants and propagules. The dominance of the pioneering species Avicennia alba also indicates a disturbed, immature community. ITB surveys of local residents found wood from the mangroves to be an important source of firewood for cooking and an important building material for huts, bridges and fish traps. These can be seen below in

Marine Ecology
SINCLAIR KNIGHT MERZ
D:\Documents and Settings\runsworth\Local Settings\Temporary Internet Files\OLK8B\R1_QE09421_Cirebon_Marine_Environment.doc PAGE 27
Figure 3-12
Figure 3-12 Photos illustrating extensive use of mangrove for fire wood and construction
Table 3-11 Densities of mangroves above head height (individuals/m2) recorded in belt transects in the Project vicinity.
Species Name T1 T2 T3 T4 Mean ± SE
Avicennia alba Blume 0.40 0.10 0.02 0.08 0.15 ± 0.09 Avicennia marina (Forsk.) 0.01 0.01 0.01 0.01 ± 0.00 Rhizophora mucronata L. 0.01 0.01 0.01 ± 0.00
Total 0.40 0.11 0.04 0.11 0.16 ± 0.08
Table 3-12 Relative abundance (%) of mangrove species in belt transects in the Project vicinity (individuals above head height)
Species Name T1 T2 T3 T4 Mean ± SE
Avicennia alba Blume 100 90.5 63 78 82.8 ± 8.0 Avicennia marina (Forsk.) 0 9.5 13 11 8.4 ± 2.9 Rhizophora mucronata L. 0 0 24 11 8.8 ± 5.7
3.5.3 Discussion Mangroves surrounding the proposed power plant represent a very small percentage (0.6%) of the total mangrove area in the Cirebon region, and a somewhat larger but still small percentage (3.7%) of the linear coastline inhabited by mangroves. The mangroves are in a degraded condition. The density of mangrove trees in proximity to the proposed development is low relative to densities of intact mangrove forests elsewhere in the Indo-Pacific region (Hogarth 2007), and lack typical patterns of zonation and diversity. Relatively undisturbed mangrove forests of the Indo-Pacific region typically exhibit a zonation pattern where the seaward edge is occupied by Avicennia and
Marine Ecology
SINCLAIR KNIGHT MERZ
PAGE 28 D:\Documents and Settings\runsworth\Local Settings\Temporary Internet Files\OLK8B\R1_QE09421_Cirebon_Marine_Environment.doc
Sonneratia, Rhizophora is found further inshore, and finally mangroves such as Bruguiera, Ceriops, Xylocarpus and/or Heritiera become common at the landward edge of the forest. Most of these genera were not recorded from the Cirebon mangroves, and according to the qualitative description provided by ITB the mangroves lack apparent zonation. The primary causes of degradation appear to be conversion to aquaculture ponds and overharvesting of trees for wood; solid waste and other pollution may also be a contributing factor.
Despite their degraded state, mangroves in the Project area have economic significance for the local communities. The mangroves provide firewood and construction materials, and local fishers are known to harvest snails and mangrove crabs (Scylla serrata) directly from the mangroves. Other species such as cockles (Anadara granosa) and shrimp (Metapenaeus ensis) are harvested on the mangrove edges (See Section 3.7).
Mangroves also help to support fisheries further offshore. The shrimp Metapenaeus ensis, known locally as the ‘Rebon Shrimp’, for example, is an economically important species known to be dependent upon mangroves as a nursery ground (Robertson and Duke 1987).
Intact mangrove forests may also provide economic benefits via shoreline protection, by stabilising the shoreline and reducing erosion. Intact mangrove forests can also reduce the impact of severe waves (Mazda et al. 1997), for example, estimated that mangrove forests damage by at least 20% per 100m distance inland, and mangrove forests had a significant effect in reducing damage from the 2004 Asian tsunami (Danielson et al. 2005). Although the degree of such protection afforded by the degraded mangroves in the Project vicinity is questionable, they might still provide some protection from wave damage to the shoreline at the Project site.
The mangroves in the Project area also have potential ecological significance by providing habitat, though highly modified, for unexploited fauna including birds, fishes, and invertebrates. Healthy mangroves within Indonesia are important foraging and nursery grounds for nearby coral reefs and seagrass fish assemblages (Unsworth et al.. 2008), and though coral reefs and seagrass beds are not known to occur in the Cirebon area the mangroves could have similar linkages with other subtidal communities in the area. Mangroves also provide nesting and foraging habitat for numerous bird species (Hogarth 2007). These mangroves could also facilitate migration, foraging, breeding, nesting and other ecological functions for flora and fauna along the wider north Java coast. Due to the increasing deforestation of the major mangrove habitats on the north Java coast (e.g., at Muara Cimanuk, ARCBC 2007), it is important to protect what mangrove habitat remains within the region, including that outlined in the present study. Although degraded, the mangroves in the Project area still have potential to serve numerous ecological roles.
Marine Ecology
SINCLAIR KNIGHT MERZ
D:\Documents and Settings\runsworth\Local Settings\Temporary Internet Files\OLK8B\R1_QE09421_Cirebon_Marine_Environment.doc PAGE 29
3.6 Intertidal and Subtidal Benthos Tropical marine intertidal and subtidal environments commonly include seagrass and coral reef habitats that harbour biodiverse fauna of high ecological and economic value (Nybakken 1997). These habitats are under increasing threat from overexploitation, pollution, coastal development and impending climate change (Orth et al.. 2007; Pandolfi et al.. 2003). Muddy tidal flats are less well known, yet productive, tropical habitats that can also harbour diverse and abundant faunal assemblages supporting productive fisheries (Dittmann 2000). . Surveys of the intertidal and subtidal benthic communities in the marine environment adjacent to the Project area were undertaken to identify and characterise the types of benthic communities present in the area. More detailed sampling of benthic infauna was also conducted to determine the diversity, abundance and spatial distribution of macroinvertebrate species in sediments.
3.6.1 Methodology Four survey mechanisms were used to sample the sub-tidal and inter-tidal benthos. These were visual walking surveys along the inter-tidal and beach strandline, sub-tidal towed video transects, benthic faunal grabs, and broad-scale habitat survey. The visual walking survey was a 6m, wide transect starting at coordinates 49 M 236.676 925.1611 and finishing at coordinates 49 M 236.037 925.1255. The transect survey was conducted during November 2007 by ITB Consultants. Observers walked along the transect, counting organisms and taking photographs of conditions.
ITB Consultants performed a broad-scale survey of the substrate type and epibenthos using towed video, diver inspections, and grab sampling. Initially, thirteen towed video transects spaced 250 m apart and extending northward 4 km perpendicularly from the shoreline (Figure 3-13) were planned. In many instances, however, usable video footage could not be obtained to the high water turbidity, so the video observations were supplemented by spot visual inspections by divers and grab samples. The grab samples were taken with a 15 cm X 15 cm (0.0225 m2) Ekman grab; samples were retrieved to the surface and inspected for evidence of coral reef, seagrass, and other benthic fauna (Figure 3-14).
Benthic grab sampling for macroinvertebrate infauna was conducted with the Ekman grab along two transects extending offshore of the Kanci and Waruduwur rivers. Samples were taken at eight points approximately 0.3, 0.7, 1.0, 1.3, 1.5, 2.0, 2.5,and 3.3 km offshore along each transect (Figure 3-13). Three replicate samples were taken at each sampling point. Samples were sieved in the field using a 1 mm screen, preserved and transported to a laboratory (Institut Teknologi Bandung) for sorting, identification and counting. Photos of the sediment samples were also taken in order to record substrate type.
Marine Ecology
SINCLAIR KNIGHT MERZ
PAGE 30 D:\Documents and Settings\runsworth\Local Settings\Temporary Internet Files\OLK8B\R1_QE09421_Cirebon_Marine_Environment.doc
Figure 3-13 Location of towed video and benthic infauna grab samples
Figure 3-14 Location of the diver and broad scale habitat observations
3.6.2 Results The visual survey of the beach strandline communities provided no quantitative data, but provided evidence of the large amount of garbage washed up on the shore. This is a common problem in Indonesia, where coastal communities often dump refuse into the sea.
Visual inspections of the 533 grab samples, video observations and diver observations revealed the substrate to be uniformly mud and sand; this is consistent with the sediment particle size analyses (Section 3.3.2) and presumably results from high sediment inputs from rivers flowing into the
Marine Ecology
SINCLAIR KNIGHT MERZ
D:\Documents and Settings\runsworth\Local Settings\Temporary Internet Files\OLK8B\R1_QE09421_Cirebon_Marine_Environment.doc PAGE 31
embayment. The bottom was uniformly except for occasional macroinvertebrates including sea stars, leucosid crabs and polychaete worms. There was also occasional visual evidence of macroinvertebrate infauna, including burrow openings and worm casts. There was no evidence of the presence of seagrass, coral reef, or other hard-bottom substrate or dense macroinvertebrate communities. Interviews with local residents confirmed the absence of seagrass beds or coral reefs in the area. Examination of satellite imagery (Google Earth 2007) indicates a highly turbid, presumably low-light environment not suitable for photosynthetic organisms such as coral or seagrass. Intense trawling activity (see Section 3.7) probably also prevents the development of
The results of infauna sampling are summarised in Table 3-13; the raw data are provided in Appendix D. The benthic infauna had a high density (5129 ± 879 animals/m2) and was numerically dominated by bivalve molluscs, almost entirely cockles of the genus Anadara (82.7% of total individuals). Crustaceans, primarily a barnacle (Balanus sp.; 9.3% of individuals) were also abundant. Gastropod molluscs, polychaete worms, an ophiuroid echinoderm (brittle star) and a fish identified as a mudskipper (Periopthalmus) were also collected. Both species richness and the density of organisms generally increased with increasing distance from the shore (Figure 3-15).
Table 3-13 Results of sediment infauna sampling
Group Mean abundance (individuals/m2) ±SE
Relative abundance (% of total individuals)
Bivalve molluscs 4442 ± 823 85.3 Gastropod molluscs 187 ± 43 3.6 Crustaceans 495 ± 83 9.5 Polychaete worms 75 ± 10 1.4 Echinoderm (brittle star) 6 ± 3 0.1 Fish ("mudskipper") 1 ± 0.9 0.02
The laboratory reported the occurrence of the mud or mangrove crab (Scylla serrata) in a number of samples (Appendix D); this species typically occurs in the mangroves and is a large species unlikely to be taken with a 15X15 cm grab. Subsequent discussions with ITB and photos obtained from the laboratory indicate that the crab is probably a leucosid crab. The presence of leucosids is consistent with photos taken of grab samples. ITB also reports that the identification of a fish collected in two samples as Periopthalmus is also uncertain. Periopthalmus (mudskipper) typically occurs in intertidal mangroves; the fish is more likely to be a goby or blenny.

Marine Ecology
SINCLAIR KNIGHT MERZ
PAGE 32 D:\Documents and Settings\runsworth\Local Settings\Temporary Internet Files\OLK8B\R1_QE09421_Cirebon_Marine_Environment.doc
Figure 3-15 Infaunal abundance and species richness at eight marine sampling sites of increasing distance from the shoreline leading out from the mouth of the rivers Kanci and Waruduwur within the vicinity of the proposed development.
3.6.3 Discussion The area potentially affected by Project activities is characterised by a more or less uniform, bare mud and sand bottom; seagrass beds and coral reefs appear to be absent. The evidence suggests that the soft-bottom habitat supports a productive faunal assemblage that in turn supports extensive fisheries. Important findings are that faunal abundance and richness increased with distance from the shore and that the bay contains homogenous soft mud substrate indicating no areas of special ecological importance. Sediment and water quality data (Water Quality 3.2 and Sediment Quality 3.3) indicate that this is a highly impacted area. The inter-tidal area was also heavily impacted, with large amounts of garbage strewn along the beach.
Two species that were abundant observed in the infauna samples, a barnacle (Balanus sp.) and the Asian green mussel (Perna viridis, 2.1% of total individuals collected) are sessile species that live attached to hard substrates, and are therefore highly uncharacteristic of the soft-bottom environment in the area. The green mussels almost certainly come from the adjoining mussel farm; this is supported by correspondence with ITB and a much higher abundance of mussels in the transect offshore of Kanci-1 river, adjacent to the farm, than in the transect offshore of Waruduwar (Appendix D). The abundance of barnacles in the infauna samples reflects the settlement of barnacles on mussels and dead mussel shells.

Marine Ecology
SINCLAIR KNIGHT MERZ
D:\Documents and Settings\runsworth\Local Settings\Temporary Internet Files\OLK8B\R1_QE09421_Cirebon_Marine_Environment.doc PAGE 33
3.7 Fisheries Artisanal fisheries in Indonesia are an important source of income and food for millions of the country’s coastal people (Cesar et al.. 1997). The major gears used in Indonesia are purse seine and drift nets (Pet-Soede et al.. 2001). The continued survival of productive fisheries is vital, as it is estimated that fish contribute more than 60% of the total animal protein consumed across the country (Hopley & Suharsono 2000).
Most fisheries in Indonesia are unmanaged and widely overexploited (Hopley & Suharsono 2000, Unsworth et al.. 2007). Overfishing does not directly destroy ecosystems, but it reduces the abundance of fish and invertebrates and can lead to community phase shifts reducing the resilience of the system to external stressors such as pollution and environmental change (Mumby 2006).
3.7.1 Methodology ITB conducted subjective, qualitative interviews of fishermen and workers in the processing industries around the PLTU project site in Cirebon. Questions were asked concerning the activities of the sea fishery and the catch and their localities (Figure 3-16).
Quantitative analysis (total weight of catch) of the local gill net fishery in the coastal waters in close proximity to the proposed power plant was conducted during July 2007 at 2 and 4 km from the coast. In order to calculate CPUE, the number of hours the net was left fishing for, and the number of panels within the net set-up were recorded. ITB recorded the nets to have a square mesh size of 645 mm2 (1 in2), and have a length of 225 m (consisting of units/panels, each panel is 15 m) and were 2.5 m high. CPUE was also reported from official government fishery statistics for the Cirebon City and Regency.
Marine Ecology
SINCLAIR KNIGHT MERZ
PAGE 34 D:\Documents and Settings\runsworth\Local Settings\Temporary Internet Files\OLK8B\R1_QE09421_Cirebon_Marine_Environment.doc
Figure 3-16 Location of fishing activities and net fishing sampling within the vicinity of the proposed development
3.7.2 Results The CPUE in the gill net fishery of the coastal immediately adjacent to the proposed power plant was 0.5 and 2.45 kg/hr at the two trial fishing locations; the gillnet CPUE was higher farther from shore (Table 3-14). These values of CPUE compare favourably with rates recorded in other areas of Indonesia such as southeast Sulawesi (0.58 to 1.68 kg/hr) (May 2003).
Table 3-14 CPUE measured using field analysis of gill nets and using local government fishery statistics
Heading Gillnet 2km from Shoreline
Gillnet 4km from Shoreline
Whole Cirebon fishery
Cirebon Gillnet Fishery
CPUE 0.5 kg/hour 2.45 kg/hour 22.02 kg/Trip 6.38 kg/Trip
Marine Ecology
SINCLAIR KNIGHT MERZ
D:\Documents and Settings\runsworth\Local Settings\Temporary Internet Files\OLK8B\R1_QE09421_Cirebon_Marine_Environment.doc PAGE 35
The major fishery of the Cirebon region was found to be for prawns, mostly Penaeus merguiensis, however numerous other fisheries are present (Table 3-15). These fisheries are conducted using both intertidal and subtidal netting and subtidal trawling. Fishing activities include capture fisheries for fishes, the small black crab (locally known as rajungan), prawns and various molluscs, as well as the cultivation of green mussels (Perna viridis). According to ITB, the majority of fishers use set gill seines and drag nets. Nets are commonly placed in subtidal water or are set daily within the intertidal (Figure 3-18). Satellite imagery shows intensive bottom-trawl activity in the area, evidenced by widespread, large sediment plumes (Figure 3-17). Intertidal fishing and hand-gleaning (for shrimps, bivalves and gastropods), gill-net fishing, and mussel aquaculture are intensive in the vicinity of the proposed power development (Figure 3-16).
Table 3-15 Description of fisheries present within the Cirebon regency and a fisher-estimated CPUE
Fishery Latin name Fishery Method Habitat Dependence
Interview-based CPUE Estimate
Jellyfish Aurilia aurita Tidal nets
Rebon shrimp Penaeus merguiensis Trawling and inter-tidal nets
Mangrove 0.1-0.5kg/hr
Cockles Anadara sp. Gleaning Mangrove 1-20 kg/day
Green mussel Perna viridis Aquaculture
Blue swimming crab Portunus pelagicus Traps and nets Mud / Estuaries 2-10 kg/day
Finfish Various Gill and seine nets
Mangrove 1.5 kg/hr
Squid Loligo sp.
Cuttlefish Sepia officinalis
Mud/mangrove crab Scylla serrata Traps / Aquaculture*
Mangrove
Oyster Crassostrea gigas Aquaculture*
*Anecdotal evidence only

Marine Ecology
SINCLAIR KNIGHT MERZ
PAGE 36 D:\Documents and Settings\runsworth\Local Settings\Temporary Internet Files\OLK8B\R1_QE09421_Cirebon_Marine_Environment.doc
Figure 3-17 Large sediment plumes visible from unknown fishing trawls
Figure 3-18 Inter-tidal fishing close to the proposed power development site
Table 3-16 List of species caught using a gillnet in the vicinity of the proposed development
Scientific NamePoecilopsetta colorata Mobula spp Pseudorhombus arsius Myliobatus spp Psettodes erumei Aetobatus spp. Leiognathus spp Aetomylaeus spp Arius thalassinus Rhina ancylostoma Upeneus vittatus Rhynchobatus djiddensis Lutjanus rivulatus Trigon sephen Lutjanus spp Dasyatis spp Nibea albiflora Parastromateus niger Isurus oxyrinchus Pampus argenteus Carcharhinus amblyrhynchos Decapterus ruselli Carcharhinus albimarginatus Decapterus macarellus Carcharhinus limbatus Decapterus macrosoma Isurus paucus Alepes djeddaba Nebrius ferrugineus Atule mate
Marine Ecology
SINCLAIR KNIGHT MERZ
D:\Documents and Settings\runsworth\Local Settings\Temporary Internet Files\OLK8B\R1_QE09421_Cirebon_Marine_Environment.doc PAGE 37
Scientific NameCentrocymnus crepidater Seriolina nigrofasciata Squalus megalops Uraspis uraspis Carcharhinus plumbeus Selaroides leptolepis Pseudocarcharias kamoharai Thunnus albacares Carcharhinus brachyurus Megalaspis cordyla Carcharhinus falciformis Scomberoides tol Carcharinus longimanus Scomberoides commersonnianus Orectolobus maculatus Mugil cephalus Carcharhinus brevipinna Valamugil seheli Carcharhinus melanopterus Polynemus spp Carcharhinus fitzroyensis Hemirhampus spp. Carcharhinus cautus Stolephorus spp. Mustelus antarcticus Dussumieria acuta Alopias supercilossus Sardinella brachysoma Galaeocerdo cuvieri Sardinella fimbriata Sphyrna lewini Sardinella gibbosa Stegostoma fasciatum Tenualosa ilisha Alopias spp Scomberomorus commerson Squatina sp Thunnus obesus Hemipristis elongatus Thunnus maccoyii Prionace glauca Thunnus tonggol Carcharhinus sorrah Euthynnus affinis Carcharinus brevipina Auxis thazard
3.7.3 Discussion Marine and coastal fisheries surrounding the proposed power development in Cirebon, including at and immediately adjacent to the Project site, contribute significantly to local nutrition and the economy. The fishing industry is a major source of income with 259 companies operating 883 vessels to catch 20000 t/yr (Indonesian Fishing Statistics 2005). Penaeus merguiensis (banana prawn) is the highest-value fishery, producing USD$800,000 worth of prawns per year.
The fisheries in the area are a mix of commercial and subsistence activities that use a variety of gears. Although shrimp is economically the most important fishery, commercial aquaculture is also thriving and developing within the region. Fisheries are sufficiently important to the local economy and to the food security of local people to warrant a high level of protection from negative impacts of industrial development, including the proposed power station.

Marine Ecology
SINCLAIR KNIGHT MERZ
PAGE 38 D:\Documents and Settings\runsworth\Local Settings\Temporary Internet Files\OLK8B\R1_QE09421_Cirebon_Marine_Environment.doc
4. Environmental Impact Assessment
4.1 Water Quality
4.1.1 Wastewater Effluent The spatial extent of the discharge plume was modelled by Cardno Lawson Treloar (2008) and assumed a wastewater composition as outlined in Table 4.1. Modelling was based on wind and current data collected during 2006 and 2007, which showed the predominant effects on circulation to be the northwest and southeast monsoons and tidal currents, which reach a maximum current speed of 0.25 m/s. The model used the Delft3D modelling system in 2D and 3D and was fully calibrated using current data collected at a location 2.3 km out from the shoreline of the proposed development in a northerly direction (6°44'42.58"S 108°37'4.12"E) at -6.85 m Chart Datum for a period of ~1month (10/07/07 to 15/08/07). Two instruments were used: a Valeport current meter at -1.5 m below the sea surface and a FSI acoustic current meter at -5.5 m below the sea surface.
4.1.1.1 Temperature and salinity Model outputs depicting the extent of the mean salinity and thermal plumes from the wastewater outfall are shown in Figure 4-1. South Australian EPA (Environment Protection Authority) guidelines define the mixing zone of the plume in terms of salinity and temperature to extend to the salinity contour 5% above background salinity and the temperature contour 1°C above background temperature, respectively. Using these criteria, the extent of the mixing zone corresponds to the ~33 psu contour (assuming a 31.4 psu background salinity) and 29°C contour (assuming a 28°C background temperature). Model predictions of the extent of the mixing zone are conservative n that they do not take into account the effect of wave-induced turbulence.
2D modelling of the plume indicates that flood tide currents tend to keep the plume near the coast (Cardno Lawson Treloar 2008). This is demonstrated by the temperature and salinity peaks, which occur during ebb tide. The plume spreads farther offshore during spring tides than during neap tides. When a 5 m/s south-southeast wind is applied, the extent of the plume does not reach as far out to sea during neap tides and its signature, in terms of salinity and temperature, is smaller during spring tides than in the “no-wind” case; a southeast wind pushes the plume further along the coast to the northwest than during no-wind conditions. Application of a 5 m/s northwest wind to the model, which occurs only rarely (see Figure 2-1), indicates that, as in southeasterly winds, a northwester wind tends to confine the plume nearer the coast than during no wind, but a northwest wind tends to push the plume along the coast to the southeast.
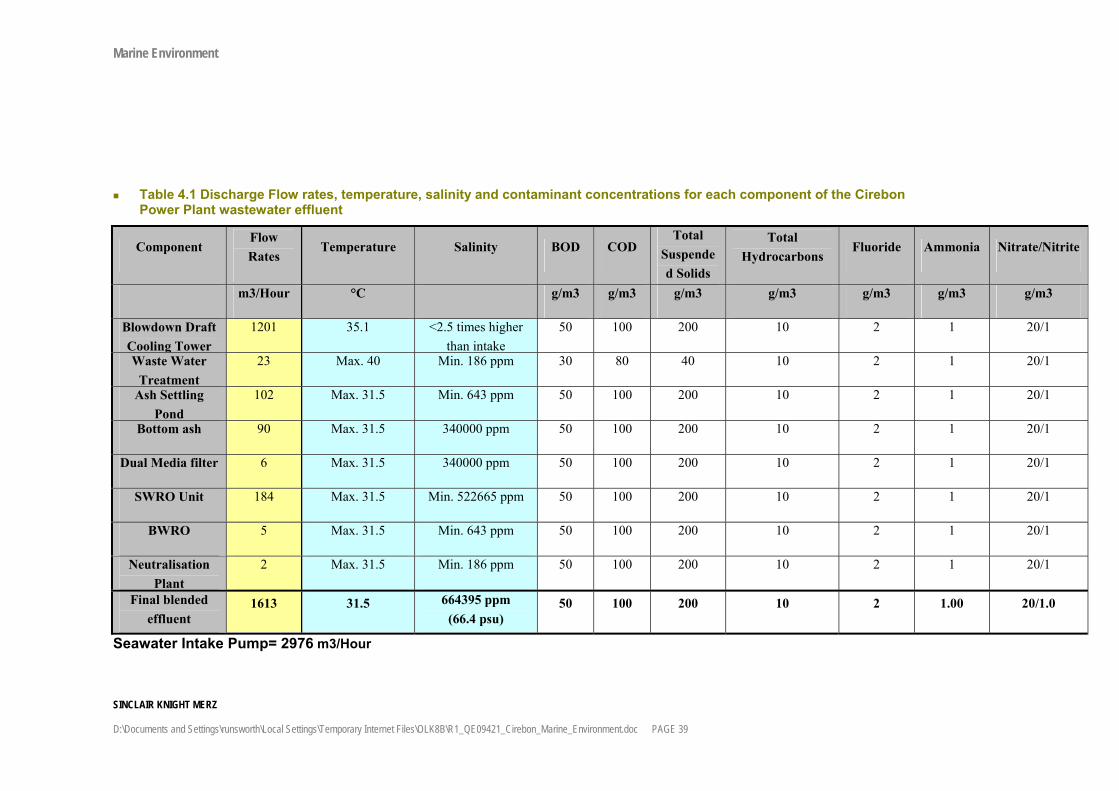
Marine Environment
SINCLAIR KNIGHT MERZ D:\Documents and Settings\runsworth\Local Settings\Temporary Internet Files\OLK8B\R1_QE09421_Cirebon_Marine_Environment.doc PAGE 39
Table 4.1 Discharge Flow rates, temperature, salinity and contaminant concentrations for each component of the Cirebon Power Plant wastewater effluent
Component Flow Rates
Temperature Salinity BOD COD Total
Suspended Solids
Total Hydrocarbons
Fluoride Ammonia Nitrate/Nitrite
m3/Hour °C g/m3 g/m3 g/m3 g/m3 g/m3 g/m3 g/m3
Blowdown Draft Cooling Tower
1201 35.1 <2.5 times higher than intake
50 100 200 10 2 1 20/1
Waste Water Treatment
23 Max. 40 Min. 186 ppm 30 80 40 10 2 1 20/1
Ash Settling Pond
102 Max. 31.5 Min. 643 ppm 50 100 200 10 2 1 20/1
Bottom ash 90 Max. 31.5 340000 ppm 50 100 200 10 2 1 20/1
Dual Media filter 6 Max. 31.5 340000 ppm 50 100 200 10 2 1 20/1
SWRO Unit 184 Max. 31.5 Min. 522665 ppm 50 100 200 10 2 1 20/1
BWRO 5 Max. 31.5 Min. 643 ppm 50 100 200 10 2 1 20/1
Neutralisation Plant
2 Max. 31.5 Min. 186 ppm 50 100 200 10 2 1 20/1
Final blended effluent
1613 31.5 664395 ppm (66.4 psu)
50 100 200 10 2 1.00 20/1.0
Seawater Intake Pump= 2976 m3/Hour
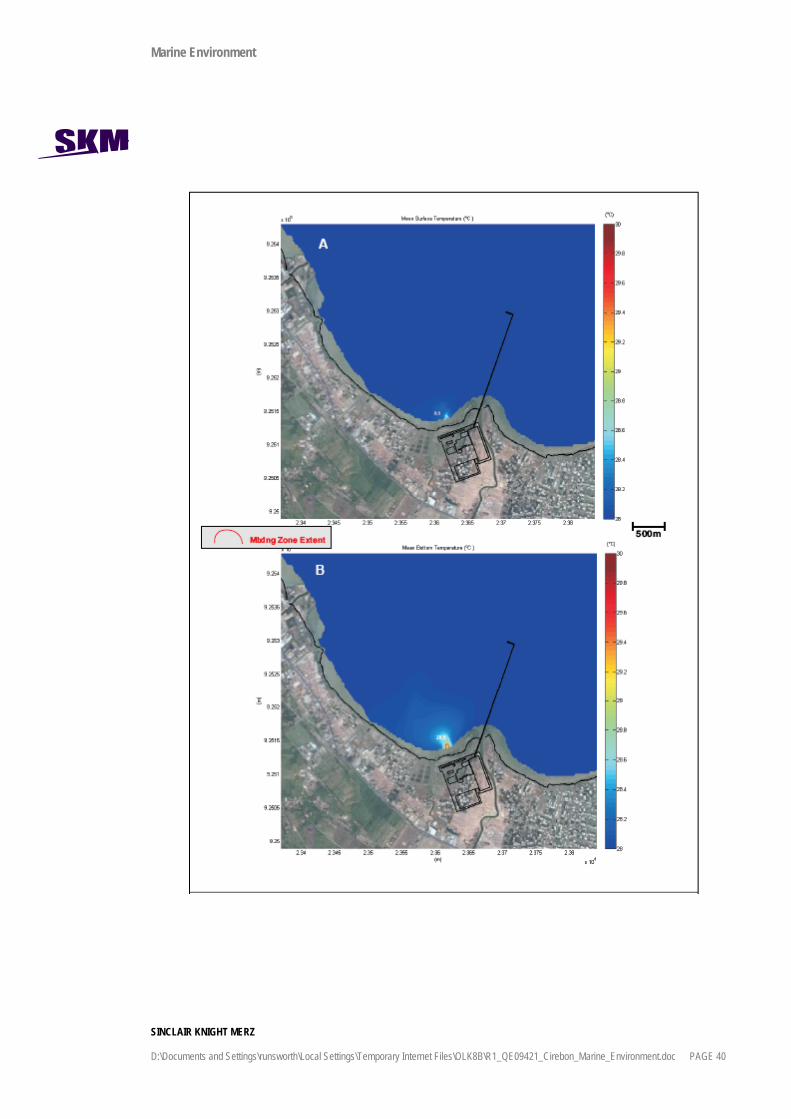
Marine Environment
SINCLAIR KNIGHT MERZ D:\Documents and Settings\runsworth\Local Settings\Temporary Internet Files\OLK8B\R1_QE09421_Cirebon_Marine_Environment.doc PAGE 40
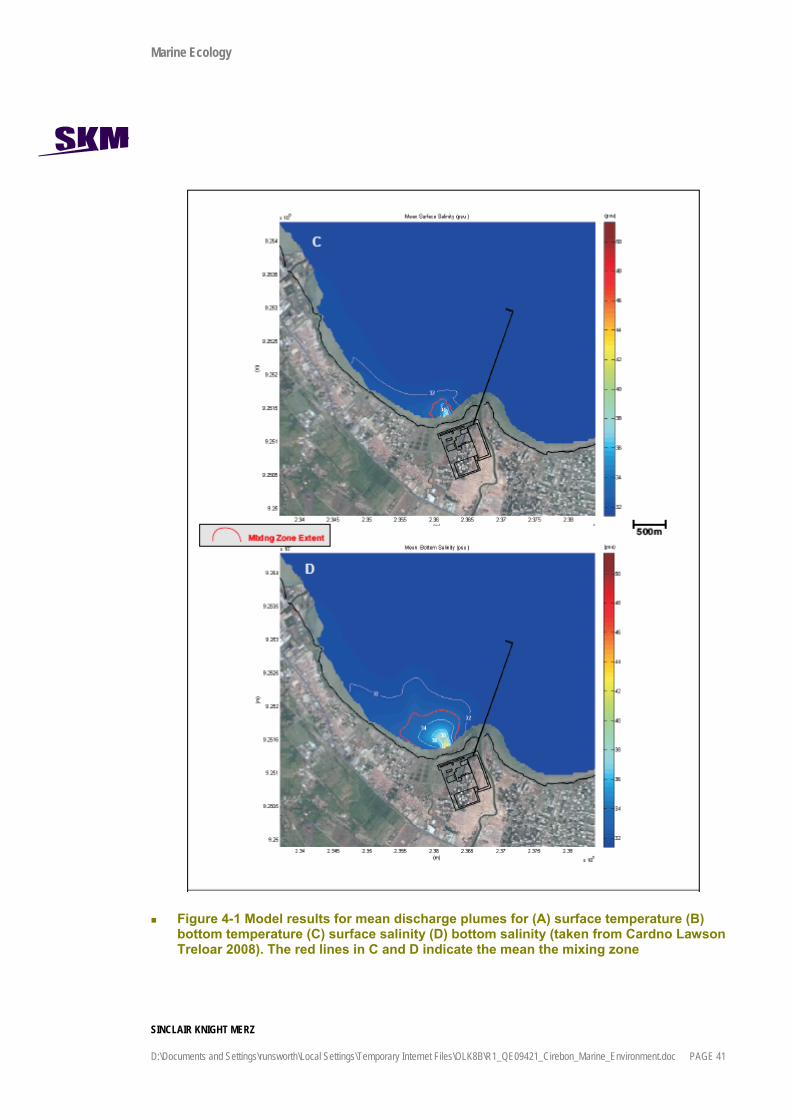
Marine Ecology
SINCLAIR KNIGHT MERZ
D:\Documents and Settings\runsworth\Local Settings\Temporary Internet Files\OLK8B\R1_QE09421_Cirebon_Marine_Environment.doc PAGE 41
Figure 4-1 Model results for mean discharge plumes for (A) surface temperature (B) bottom temperature (C) surface salinity (D) bottom salinity (taken from Cardno Lawson Treloar 2008). The red lines in C and D indicate the mean the mixing zone
Marine Ecology
SINCLAIR KNIGHT MERZ
PAGE 42 D:\Documents and Settings\runsworth\Local Settings\Temporary Internet Files\OLK8B\R1_QE09421_Cirebon_Marine_Environment.doc
The discharge plume will extend further from the outfall along the bottom than at the surface due to the elevated salinity, and therefore density, of the effluent relative to ambient seawater. Based on the mixing zone defined by salinity, which is more extensive than that defined by temperature, the plume mixing zone will extend approximately 350 X 350 m away from the outfall at the surface and 800 m X 1000 m at the bottom.
As tropical inter-tidal flora, mangroves are relatively resilient to increased water temperatures, but sustained temperature increases can be detrimental (Hogarth 2007). Rhiziphora exposed to a sustained 5º C temperature increase responded by decreasing leaf area, whilst a 7-9º C rise resulted in 100% mortality, with a corresponding decrease in the species richness of mangrove fauna (Hogarth 2007). Temperature increases of this magnitude, however, are not expected. Indonesian guidelines for the protection of marine biota specify a maximum water temperature for mangroves of 32 ºC. Effluent discharged at 31.5 ºC will therefore not exceed Indonesian guidelines anywhere within the mixing zone. World Bank guidelines specify a maximum temperature increase in receiving waters of 3 ºC above ambient. Model results were not provided for the 3 ºC above ambient contour, but a temperature increase of 1 ºC above ambient will extend only 80 m from the outfall at the surface, and 100 m on the bottom, on average. A 2 ºC increase will extend beyond 50 m from the outfall less than 5% of the time (Cardno Lawson Treloar 2008). The power plant effluent, as characterised in Table 3-1, therefore does not pose a thermal threat to marine biota.
Indonesian guidelines for the protection of mangrove habitats specify an upper salinity level of 34 ppt; this is in fact the upper end of the normal ambient salinity range in the area. As noted above, modelling indicates that on average the 33 psu contour will extend 350 m from the outfall on the surface and 800 X 1000 m on the bottom. The extent of the 34 psu contour is significantly smaller, and the plume of higher salinities in the immediate vicinity of the assumed outfall location extends more or less perpendicularly out from shore, away from the mangroves (Figure 4-1 C & D). The 5% probability of exceedance contours for 33 psu are predicted to extend 900 X 2200 m at the surface and 1300 X 2200 m at the bottom. It is not clear whether elevated salinities from effluent discharge will have a potential negative impact on the mangroves around the discharge. Mangroves are naturally salt tolerant, with biological mechanisms present to continue growth and survival at salinities of 35 psu or more; generally the salinity tolerances of mangroves are more a function of soil salinity than seawater salinity. The relatively small tidal range, which reduces evaporation and soil salinity increases on the tidal flats, and high freshwater inputs during the wet season are likely to prevent the buildup of salinity in the soil. Nonetheless, reduced growth and/or fecundity are possible. Growth of Avicennia and Rhizophora is optimal at salinities equivalent to 50% normal seawater (Khan and Aziz 2001), although such reduced salinities are not known to prevail near the Project site.

Marine Ecology
SINCLAIR KNIGHT MERZ
D:\Documents and Settings\runsworth\Local Settings\Temporary Internet Files\OLK8B\R1_QE09421_Cirebon_Marine_Environment.doc PAGE 43
4.1.1.2 Contaminants Cardno Lawson Treloar (2008) modelled the distribution of dilution contours away from the discharge for BOD, COD, TSS, fluoride, ammonia, nitrate, and nitrite. Modelling assumed the effluent composition shown in Table 4.1, and also that ambient contaminant levels are zero. Water quality sampling demonstrated that existing contaminant levels are, in fact, much higher (Section 3.2.2). Model outputs were presented by Cardno Lawson Treloar (2008) in terms of absolute concentrations in the environment, but because existing contaminant concentrations in the environment are not zero, as assumed in the modelling, the distribution of contaminant concentrations in the model outputs is not accurate. The modelled concentrations, however, were derived by simply multiplying dilution factors by the effluent concentrations in Table 4.1, so the model outputs can be used to show the spatial distribution of dilution of the effluent by ambient seawater. The contaminant plume distribution (in this example, using BOD) is shown in Figure 4-2. Plumes in terms of dilution factors are identical for all contaminants.
The modelling predicts that on average the effluent will be diluted by 1/10 within 150 X 150 m of the outfall on the surface and within 400 X 400 m on the bottom. Dilution to 1/10 will occur beyond 550 X 650 m on the surface and 600 m X 750 m on the bottom less than 5% of the time. Dilution of 1/20 is predicted to occur beyond 900 X 1800 m on the surface and 1100 X 1900 m at the bottom less than 5% of the time.
Although the predicted mixing zone is relatively large, predicted contaminant levels in the effluent are within World Bank guidelines. Comparing the effluent concentrations for BOD, TSS, and ammonia with the Indonesian standards for the protection of marine biota (50 mg/L, 20 mg/L, and 0.3 mg/L, respectively), the maximum dilution required to meet the Indonesian standards is 1/10 (for TSS). Water quality sampling indicates that existing levels of BOD and COD in ambient seawater are actually higher than those expected in the effluent.
If all the nitrate/nitrite in the effluent is present as nitrate, a 1/2500 dilution would be required to meet the Indonesian standard for the protection of marine biota of 0.008 mg/L. Ambient nitrate concentrations, however, are two order of magnitude than the Indonesian standard, with a mean concentration in the water quality samples of 0.11 mg/L. Reported ambient nitrite concentrations, for which there is no Indonesian standard, are even higher (mean 0.51 mg/L). Nitrite/nitrite concentrations from the discharge are therefore expected to be diluted to ambient levels within close proximity to the discharge.
Metal concentrations in the effluent have not been specified. Cooling blowdown water and other plant processes are likely to introduce metals into the wastewater stream due to corrosion; desalination is likely to concentrate metals in the intake water, which are already at high levels. Treatment of the wastewater, however, can be expected to remove a significant but presently unknown fraction of metal loads in the wastewater. Given this, the relatively high dilution within
Marine Ecology
SINCLAIR KNIGHT MERZ
PAGE 44 D:\Documents and Settings\runsworth\Local Settings\Temporary Internet Files\OLK8B\R1_QE09421_Cirebon_Marine_Environment.doc
close proximity to the discharge, high ambient levels of metals, and the affinity of dissolved metals to bind to particles, reducing their bioavailability, impacts from metal discharges in the effluent are likely to be localised. Figure 4-2 indicates that the effluent plume will discharge contaminants including metals directly into the path of current intertidal fishing activities, and there is therefore a potential risk of increased contamination of seafood.
In terms of the potential impact that this discharge may have upon biologically or economically important assemblages or activities, Section 3.6 indicates that no evidence exists to indicate benthic communities within or surrounding the discharge plume are of global, regional or local importance, nor are they particularly sensitive to the discharge. The current high levels of contamination suggest that organisms present are those resilient to low water quality and will not be altered by the proposed effluent discharge.
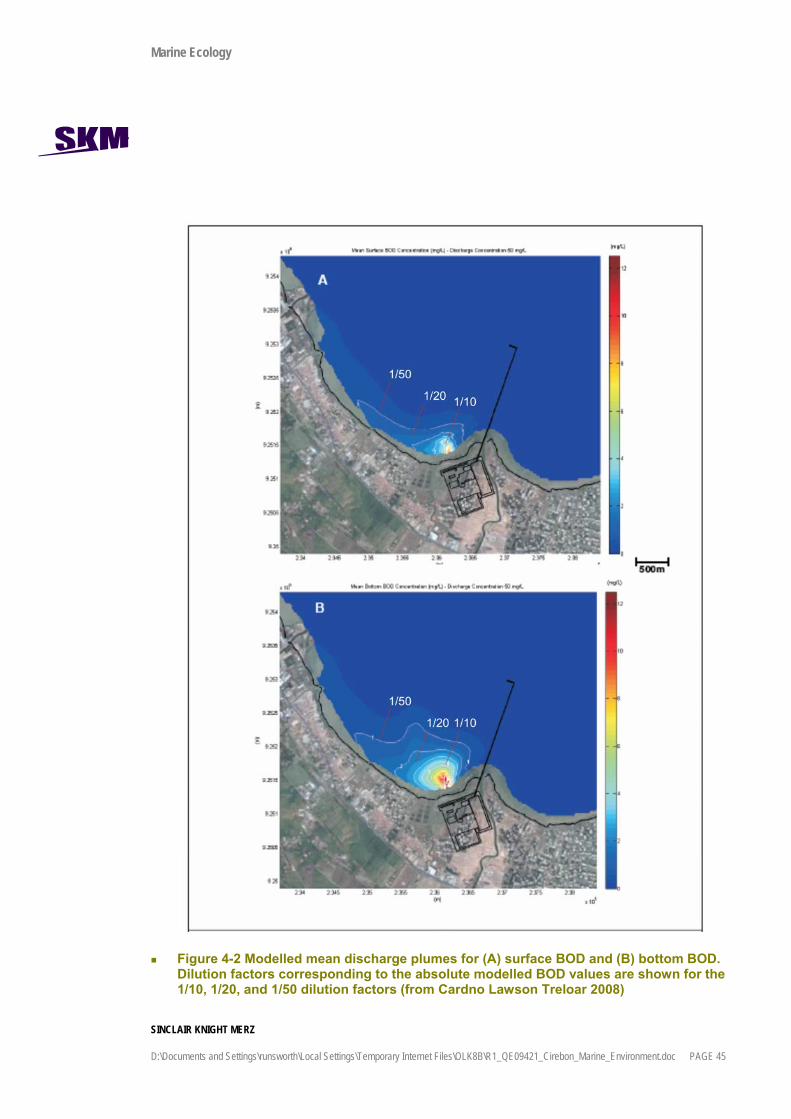
Marine Ecology
SINCLAIR KNIGHT MERZ
D:\Documents and Settings\runsworth\Local Settings\Temporary Internet Files\OLK8B\R1_QE09421_Cirebon_Marine_Environment.doc PAGE 45
Figure 4-2 Modelled mean discharge plumes for (A) surface BOD and (B) bottom BOD. Dilution factors corresponding to the absolute modelled BOD values are shown for the 1/10, 1/20, and 1/50 dilution factors (from Cardno Lawson Treloar 2008)
Marine Environment
SINCLAIR KNIGHT MERZ D:\Documents and Settings\runsworth\Local Settings\Temporary Internet Files\OLK8B\R1_QE09421_Cirebon_Marine_Environment.doc PAGE 46
4.1.2 Jetty Construction If jetty construction construction activities cause disturbance to the sediments, there is a of risk of re-suspending contaminants currently trapped within the sediments. The sediment quality survey (Section 3.3.2) indicates that only silver and to a lesser extend nickel are present in sediments at levels of concern, and these metals, as well as a number of others, are already present in high concentrations in the water column (Section 3.2.2). Furthermore, there already appears to be extensive and ongoing disturbance of surface sediments by trawlers. Nonetheless, sediment disturbance during jetty construction should be minimised to prevent release of further contaminants into the water column.
4.1.3 Stormwater Large monsoonal rains during the wet season have a potential risk of overburdening the waste drainage, settling and screening systems at the plant resulting in storm overflow directly into the environment. Such impacts are not expected to be routine but require consideration. Coal dust, diesel and numerous additional products and chemicals used within the plant operations have potential to be washed into the mangrove habitat during heavy rains, potentially damaging mangroves or bioaccumulating within the food web (Mason 2000).
4.1.4 Vessel Discharges The smaller barges that will transport coal from the bulk carriers to the jetty will potentially discharge solid waste, raw sewage and oily bilge water into coastal waters. Given high levels of fishing and other vessel traffic in the area, these vessels are likely to represent a small fraction of total potential vessel discharges. Nonetheless, management measures should be established to minimise discharges from the coal barges.
Vessels are also a potential source of non-indigenous marine species transported in ballast water or on hulls. Ballast water or hull transport is unlikely to represent a risk of introducing non-indigenous marine species because the bulk vessels will be transporting coal within Indonesia directly from Kalimantan. If the coal source changes and comes from international sources, assessment of the potential impacts of the introduction of non-indigenous species will be required.
4.1.5 Earthworks Discharges The proposed power plant development will include a drainage system from truck wheel washing and stormwater runoff straight into the river during the construction phase. A settling pool and screens are intended to reduce sediment runoff. These river discharges have the potential, if uncontrolled, to lead to increased sediment loads into the river system. If sediment loss is kept to a minimum and sediments are uncontaminated these discharges are unlikely to affect the naturally turbid waters surrounding the proposed development.

Marine Ecology
SINCLAIR KNIGHT MERZ
D:\Documents and Settings\runsworth\Local Settings\Temporary Internet Files\OLK8B\R1_QE09421_Cirebon_Marine_Environment.doc PAGE 47
An estimated 1-1.5 million m3 of cleanfill will be brought in to raise the site; it is intended that this cleanfill will be uncontaminated and not pose a contamination risk. However these construction activities pose risks of sediment runoff that are being controlled using specific measures. The proposed power plant development will include a drainage system from truck wheel washing and stormwater runoff, via a settling pool and screens discharging into the river. These river discharges have the potential, if uncontrolled, to lead to increased sediment loads into the river system. If sediment loss is kept to a minimum and sediments are uncontaminated these discharges are unlikely to affect the naturally turbid waters surrounding the proposed development.
High levels of sulphate found in the waters surrounding the proposed development are likely to be an anomaly, however the possibility exists that the elevated sulphate concentrations result from the presence of acid sulphate soils (ASS). ASS occur naturally over extensive low-lying coastal areas of the tropics and sub-tropics, predominantly below 5 metres above tidal chart datum. ASS, if uncontrolled, can cause detrimental impacts upon marine biota. An ASS assessment should be conducted prior to performing earthworks that will potentially disturb or expose ASS.
4.2 Sediment Quality Potential impacts on sediment quality include altered sediment particle size distribution, which can lead to changes in other characteristics such as dissolved oxygen and organic carbon concentrations, as well changes in concentrations of toxic contaminants in the sediments. Alterations in the sedimentary processes of erosion, transport and deposition are also considered in this section; although technically they are not impacts on sediment quality, they can affect sediment quality as well as having other environmental impacts.
4.2.1 Construction Impacts Sediment inputs in runoff will potentially increase during construction due to storm runoff from earthworks and truck wheel washing. Assuming these discharges are uncontaminated by metals, oil & grease or other contaminants, impacts on the highly turbid receiving environment are expected to be minimal provided that water quality mitigation measures (Section 5.1) are effective.
Construction of the jetty has the potential to alter local circulation patterns, which could in turn have impacts on sediment erosion, transport and deposition processes. The extent of these impacts will depend upon the extent to which the jetty alters hydrodynamic circulation along the coast. The jetty has been designed as a piled structure along its entire length. A piled jetty such as this is expected to have little if any impact on hydrodynamic flows and therefore upon sedimentary processes, except possibly minor scouring around the base of piles.
Marine Ecology
SINCLAIR KNIGHT MERZ
PAGE 48 D:\Documents and Settings\runsworth\Local Settings\Temporary Internet Files\OLK8B\R1_QE09421_Cirebon_Marine_Environment.doc
Mangrove loss from Project activities also has the potential to alter coastal sedimentary processes, depending on the extent of mangrove loss. Planned mangrove removal for jetty construction is expected to have minimal impacts because of the relatively small area affected (see Section 3.5) and the currently degraded condition of the mangroves in the location where the jetty will be constructed. Additional mangrove loss from causes other than direct removal for construction, for example due to wastewater discharges, could have greater impacts on coastal processes, causing unknown levels of disturbance to the sediments and potentially affecting adjacent mangroves and other habitats..
4.2.2 Operational Impacts Metals and organic contaminants have a strong tendency to bind to suspended particles in the water column, which subsequently settle to the sediments. Effluent discharges from the Project therefore have the potential to adversely affect sediment quality by leading to increased sediment contamination. The sediments are already contaminated with nickel and silver, to levels that are of potential public health concern (Section 3.2). It should be noted, however, that existing levels of other metals are reported to be below guideline values despite their high concentrations in particulate form in the water column.
The wastewater discharges will meet World Bank standards and are therefore unlikely to result in any impacts. Due to the localised extent of the modelled discharge plume these impacts are likely to be minimal. Coal and coal dust are also potential contaminants of sediments; these are dealt with in terms of impacts on mangroves in Section 4.4.
4.3 Biological Contamination Data from the baseline survey (Section 3.4) indicate that existing levels of metals contamination in marine organisms consumed by humans are of potential human-health concern. Provided that, as proposed, wastewater discharges from the Project meet Indonesian and World Bank standards, they are not expected to lead to increased metals contamination of marine organisms consumed by humans. It is important, however, to verify that wastewater discharges do not lead to cumulative increases in the contamination of species used for human consumption.
4.4 Mangroves
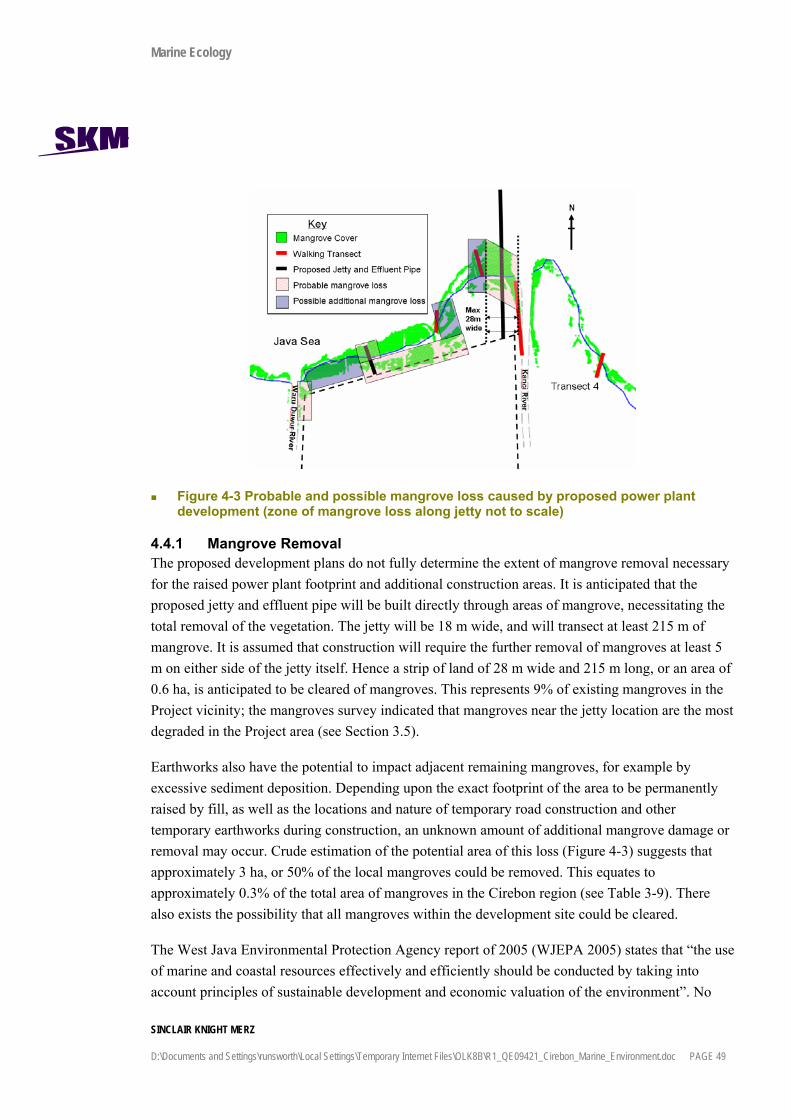
Marine Ecology
SINCLAIR KNIGHT MERZ
D:\Documents and Settings\runsworth\Local Settings\Temporary Internet Files\OLK8B\R1_QE09421_Cirebon_Marine_Environment.doc PAGE 49
Figure 4-3 Probable and possible mangrove loss caused by proposed power plant development (zone of mangrove loss along jetty not to scale)
4.4.1 Mangrove Removal The proposed development plans do not fully determine the extent of mangrove removal necessary for the raised power plant footprint and additional construction areas. It is anticipated that the proposed jetty and effluent pipe will be built directly through areas of mangrove, necessitating the total removal of the vegetation. The jetty will be 18 m wide, and will transect at least 215 m of mangrove. It is assumed that construction will require the further removal of mangroves at least 5 m on either side of the jetty itself. Hence a strip of land of 28 m wide and 215 m long, or an area of 0.6 ha, is anticipated to be cleared of mangroves. This represents 9% of existing mangroves in the Project vicinity; the mangroves survey indicated that mangroves near the jetty location are the most degraded in the Project area (see Section 3.5).
Earthworks also have the potential to impact adjacent remaining mangroves, for example by excessive sediment deposition. Depending upon the exact footprint of the area to be permanently raised by fill, as well as the locations and nature of temporary road construction and other temporary earthworks during construction, an unknown amount of additional mangrove damage or removal may occur. Crude estimation of the potential area of this loss (Figure 4-3) suggests that approximately 3 ha, or 50% of the local mangroves could be removed. This equates to approximately 0.3% of the total area of mangroves in the Cirebon region (see Table 3-9). There also exists the possibility that all mangroves within the development site could be cleared.
The West Java Environmental Protection Agency report of 2005 (WJEPA 2005) states that “the use of marine and coastal resources effectively and efficiently should be conducted by taking into account principles of sustainable development and economic valuation of the environment”. No
Marine Ecology
SINCLAIR KNIGHT MERZ
PAGE 50 D:\Documents and Settings\runsworth\Local Settings\Temporary Internet Files\OLK8B\R1_QE09421_Cirebon_Marine_Environment.doc
available data for the value of mangroves in Indonesia currently exist but, applying the valuations of Dixon (1989) and Costanza et al.. (1997), the value of this loss of habitat is between USD2,500 and 50,000/yr.
4.4.2 Water circulation changes The construction of a large jetty also has the potential to disrupt the long-term water circulation within and beyond the mangroves. This may result in the alteration in the supply of nutrients out welling from the mangroves to adjacent and nearby fisheries (Nedwell et al. 1994), and prevent migratory access to fish and invertebrates (Unsworth et al. 2008). Changes to the hydrodynamics of the mangroves through jetty construction may also affect sedimentary processes. The design of the jetty as a piled structure is expected to minimise the potential for these impacts.
4.4.3 Sediment impacts of earthworks and construction Significant volumes of ‘clean fill’ will be moved in order to raise the power plant site. This will require the construction of temporary roads. Landscaping may prevent erosion and runoff in the long term but in the short term also has the potential to increase sediment runoff. Runoff could transport sediment from the construction site to the mangroves, especially during the wet season; excessive sedimentation has a potential risk of smothering the mangrove roots (Ellison 1999). The pneumatophores (aerial roots) of Avicennia spp. are probably most at risk of sediment burial. During the dry season, dust generated from the earthworks could also cause dust deposition on mangrove leaves, potentially resulting in reduced photosynthetic capacity of mangrove leaves (Naidoo 2004).
4.4.4 Coal and coal dust during plant operation The transportation of coal on a conveyor system through the mangroves has the potential to generate coal dust and result in minor coal spillage into the mangroves. Coal dust deposition on mangrove leaves can result in reduced photosynthetic capacity (Naidoo 2004). If this is sustained in the long term, deterioration or death of mangrove trees may result. Heavy rains in the wet season will tend to wash dust from the leaves, but the resultant runoff, and potentially also runoff from the coal storage area, will flow into the mangroves. In excessive amounts, coal dust washed into the mangroves could conceivably smother mangrove roots and pneumatophores. Deposition of coal dust in the mangroves in these amounts, however, is highly unlikely. Bioavailable contaminants in the coal dust, however, have the potential of reaching the food web and bioaccumulating (Mason 2000).
4.5 Intertidal and Subtidal Benthos

Marine Ecology
SINCLAIR KNIGHT MERZ
D:\Documents and Settings\runsworth\Local Settings\Temporary Internet Files\OLK8B\R1_QE09421_Cirebon_Marine_Environment.doc PAGE 51
4.5.1 Jetty Construction The proposed jetty will extend seaward at least 1.5 km out from the mangroves. Jetty construction has the potential to alter the local water circulation, with potential effects on sedimentary processes. As noted in Section 4.2.1, however, such impacts are expected to be minimal because the jetty will be a piled structure, allowing natural water circulation.
Jetty construction will also have direct physical impacts upon benthic communities due to physical disturbance of the bottom. Physical damage from emplacement of pilings will be permanent, but involve a very small area of seabed equal to the total cross-sectional area of the pilings. Additional physical damage is likely to occur during construction as a result of pile-driving rigs, vessel anchors, and the contact of other construction equipment with the bottom, but such effects are expected to be temporary with recovery, in the absence of other impacts, within months or a few years.
4.5.2 Jetty Operation Coal spillage and the deposition of coal dust present a potential contamination risk from jetty operations to the benthic environment. WBM (1993) provided evidence from field studies in central Queensland that marine sediments containing coal particles up to 10% by weight causes no detrimental effects to the marine infauna. However reductions in fauna abundance, diversity and species richness did occur where the amount of coal spilled was sufficient to cause smothering of the benthos (WBM 1993). It is not anticipated that coal spillage is likely to cause any ecological effects provided that spillage is kept to a minimum.
4.6 Fisheries
4.6.1 Jetty construction and operation Jetty construction will cause direct physical disturbance of the bottom, and probably some sediment inputs or resuspension from the bottom, and species targeted by fisheries would be subject to the same impacts, described in Section 4.5, as other populations in the affected area. As described in Section 4.5, such impacts are expected to be minor and temporary.
SKM understands that there will probably be an exclusion zone around the coal offloading facilities at the seaward end of the jetty, but that local vessel traffic will be allowed to continue as normal along the inshore length of the jetty. The fisheries impacts of lost access to fishing grounds will be proportional to the size of exclusion zone, which is currently not known but is likely to be trivial in proportion to the total area of local fishing grounds; there impacts on fisheries are expected to be negligible.

Marine Ecology
SINCLAIR KNIGHT MERZ
PAGE 52 D:\Documents and Settings\runsworth\Local Settings\Temporary Internet Files\OLK8B\R1_QE09421_Cirebon_Marine_Environment.doc
It is possible that any fisheries losses that do arise from establishing an exclusion zone around the terminal end of the jetty will be offset at least in part by positive effects of effectively providing a no-take reserve, or protected area, that could benefit local fisheries by providing a refuge for breeding stock, allowing replenishment of local fisheries or a refuge that would allow mobile species to reach larger sizes before moving out into areas where they are vulnerable to being caught (Gell and Roberts 2002).
Conversely, the length of the jetty inshore from the terminus will probably attract increased fishing pressure, by providing an attractive tie-up structure for fishers and potentially by attracting fish to the structure and shade provided by the jetty. This is likely to lead to increased, localised resource depletion in the immediate vicinity. To the extent that total fishing pressure in the embayment remains more or less constant and is simply displaced to the jetty, this will probably have minimal effects on total fisheries production. If fish aggregate at the jetty and thereby become more vulnerable to fishing, fisheries stocks could be adversely affected. Conversely, the jetty piles will provide new and locally scarce hard substrate for the attachment of sessile organisms such as mussels and oysters, and could therefore enhance production of these species.
Depending on the size and location of area the area affected, conflict with mussel aquaculture interests could also occur. The mussel farm near the seaward end of the jetty has not been legally established, and will be relocated. The Project proponents are currently negotiating with the operators of the mussel farm for compensation for the costs of the relocation.
The discharge of wastewater effluent directly in the intertidal adjacent to the planned development, which is currently used for intertidal fishing (see Figure & Figure 4-2) is of potential concern. Even though water quality is already very poor, and it is assumed that the effluent will meet World Bank and Indonesian standards, it is not considered good environmental health practice to take fish from areas directly affect by wastewater effluent, Any non-compliance events, even for brief periods, will create significant risks of seafood contamination, particularly if effluent is contaminated with microbial pathogens from the sewage treatment stream. The outfall will therefore either reduce the area available for intertidal fishing, if fishing in the affected area is effectively prohibited, or increase human-health risks from consumption of contaminated seafood. Calculating this area based upon the mixing zone for the bottom salinity plume (see Figure 4-2D), an area of 47 ha (0.47 km2) would be lost to the fishery, this equates to approximately 3.4 % of the intertidal fishery in the Project area.
4.6.2 Impacts of site personnel To the extent that the Project leads to an influx of workers, plant personnel and their families could increase exploitation pressures on mangroves and fisheries in the immediate vicinity of the site. This potentially has not only environmental impacts but also social impacts, for example resource-use or access conflict between local residents and plant workers. These social impacts require
Marine Ecology
SINCLAIR KNIGHT MERZ
D:\Documents and Settings\runsworth\Local Settings\Temporary Internet Files\OLK8B\R1_QE09421_Cirebon_Marine_Environment.doc PAGE 53
further consideration within the socio-economic assessment; however these impacts could result in severe overexploitation of mangroves and fisheries due to the high intensity of exploitation in the one area.

Marine Ecology
SINCLAIR KNIGHT MERZ
PAGE 54 D:\Documents and Settings\runsworth\Local Settings\Temporary Internet Files\OLK8B\R1_QE09421_Cirebon_Marine_Environment.doc
5. Mitigation Measures
5.1 Water Quality The following mitigation and monitoring measures are proposed in order to reduce or eliminate impacts of the proposed development on marine water quality and consequently upon marine biota.
5.1.1 Construction Phase During construction, drainage and settling systems will be in operation to mitigate the flow of wheel wash and other waters causing sediment flow into the river. These systems need to be able to remain effective during periods of high monsoonal rain that have the potential to cause large-scale runoff of clean-fill sediments.
The location, design, and construction of roads, settling ponds and any other site works need to consider the risk of sediment runoff to ocean and waterways to minimise environmental risks. They need to be effective in all weathers, including major rain events, to ensure they will contain sediments and other contaminants. Due to the proximity of the site to marine waters, during the construction phase the presence of hazardous chemicals, oils, grease, solid wastes, and fuel oils on site have the potential, if spilt, to leach into the water column. On-site precautions need to be undertaken to prevent spills of any contaminants, and spill response plans should be developed to immediately contain and decontaminate any spills. Chemical and fuel storage sites need to consider risk-management measures such as the use of impermeable bunds.
The construction phase will require the construction and temporary use of an on-site septic tank. The septic tank should be designed and constructed to accommodate peak use, to eliminate potential for overload and allow effective operation of the system. The locality of the septic tank should be away from the foreshore and the river water courses, and maintenance needs to be conducted regularly to ensure efficient operation is maintained.
Acid sulphate soils (ASS) potentially occur on the proposed development site. Prior to any large-scale excavations or other soil disturbance of soils, a potential ASS assessment should be conducted by a suitably qualified soil scientist. There are no Indonesian regulations for the management of ASS, but their potential impacts upon necessitate their consideration during the construction phase. If present, an ASS management and mitigation plan should be developed and implemented.
5.1.2 Operational Phase During plant operation the primary potential impacts on water quality are from wastewater discharges and stormwater runoff. Wastewater treatment to meet World Bank effluent standards is
Marine Ecology
SINCLAIR KNIGHT MERZ
D:\Documents and Settings\runsworth\Local Settings\Temporary Internet Files\OLK8B\R1_QE09421_Cirebon_Marine_Environment.doc PAGE 55
the primary mitigation measure for wastewater discharges, and will result in minimal impacts on water quality, as described in Section 4.1.1.
Storm events require special consideration, as heavy monsoonal rains that are common during the wet season could result in uncontrolled discharges of site contaminants. These need to be contained by having a drainage system with sufficient capacity to deal effectively with these events and prevent site contamination that is available for re-suspension during stormwater flows. An environmental management plans for stormwater management, site contamination, and spill response should be developed. Such plans should address the storage transport, isolation, storage, and handling of chemicals, fuels, oils, solid waste, and other potential contaminants. Storm drains and settling ponds during periods of persistent rain can quickly fill with sediments; these facilities need regular inspection and cleaning to efficiently maintain their capacity.
It is anticipated that 800 m3 of light fuel oil (LFO) or diesel will be stored on-site; this will be used for boiler start-up and flame stabilization during low-load operation and to supplement coal firing when burning wet coal. Site design and construction should consider ways of minimising the risks associated with the transportation, storage and handling of the fuel oil. Measures should include the use of bunding around storage facilities and the regular inspection and maintenance of storage and transportation equipment. Protocols should be established to prevent spillage of this fuel during transportation, delivery, and storage on-site, and a fuel spill management plan should be developed.
Coal barges, like all vessels, present a risk of contaminating the environment with fuel oil, sewage, solid waste, and in this case coal, from both routine operational discharges and spills. A vessel operations management plan should be developed to minimise operational discharges and the risk of spills, and spill management contingency plans should be developed. The vessel operations management plan should be compatible with guidelines and rules developed by the International Maritime Organization including 1) the International Safety Management Code (ISM), for the safe operation of ships and for pollution prevention, and 2) the International Treaty on Oil Pollution Preparedness, Response, and Co-operation (OPRC). The management plan should specifically consider the use of onboard storage facilities for sewage and oily wastes for discharge to onshore facilities for appropriate treatment, for example in the treatment facilities at the power station.
5.2 Sediment Quality and Benthos The mitigation measures described in Section 5.1 to maintain marine water quality are expected to ensure that impacts on sediment quality from contaminants in the wastewater and stormwater discharge streams are also minimal. The use of a piled jetty structure will minimise or eliminate impacts on sediment quality due to alterations in hydrodynamic flow.
Marine Ecology
SINCLAIR KNIGHT MERZ
PAGE 56 D:\Documents and Settings\runsworth\Local Settings\Temporary Internet Files\OLK8B\R1_QE09421_Cirebon_Marine_Environment.doc
5.3 Mangroves The following mitigation and monitoring measures are proposed to limit Project impacts on the adjacent mangrove habitat.
5.3.1 Construction Phase Mangrove removal should be kept to a minimum during jetty construction and earthworks, and plant construction. In particular, the removal of mangroves in the corridor on either side of the jetty should be reduced as much as possible. If mangrove loss in this corridor is unavoidable, post-construction replanting should be considered. Some mangrove loss during construction is, however, inevitable. Additional losses will primarily be determined by the extent of the area to be elevated by filling. The design and construction of the plant should be developed to minimise this loss. The margins of the filled area along the inner edge of the mangroves should use erosion control and slope stabilisation measures to prevent further large sediment inputs into the mangroves.
If the Project will entail large-scale mangrove removal or even total removal, the Project should consider offsets such as the rehabilitation or re-establishment of degraded mangroves elsewhere in the Cirebon area, or cooperation with government or non-governmental organizations in mangrove conservation projects in other areas of the embayment. Additional impacts of site workers could occur, to reduce overexploitation of these resources and to reduce social problems between excluded local people and migrant site workers. Management measures to reduce the impacts of site personnel, such as restricted access, should be considered.
5.3.2 Operational Phase Mitigation measures for water quality and sediment quality (Sections 5.1, 5.2, and 5.3) will also mitigate impacts of sediment and other contaminant inputs upon mangroves. In addition, the wastewater outfall should be extended beyond the seaward edge of the mangroves to preclude potential buildup of salinity and contaminants in mangrove soils, or the erosion of mangrove sediments by the wastewater outflow.
Measures to control the spread of coal dust to the mangroves and mechanisms to prevent conveyor spillage of dust and coal into the mangroves are necessary for the continued viability of the mangrove habitat. Dust-control measures are being developed in a separate report on air quality and are not considered here. Dust-control measures should be Measures are necessary to control the flow of stormwater run off into the mangroves, these are discussed in section 5.1.1.
5.3.3 Benthos Mitigation measures for water quality, sediment quality, and mangrove impacts (Sections 5.1, 5.2, and 5.3) will also mitigate impacts of contaminant inputs upon benthic communities. Disturbance

Marine Ecology
SINCLAIR KNIGHT MERZ
D:\Documents and Settings\runsworth\Local Settings\Temporary Internet Files\OLK8B\R1_QE09421_Cirebon_Marine_Environment.doc PAGE 57
of the benthos during jetty construction should be minimised All construction waste should be collected on-site and transported back to shore for appropriate disposal.
Although some coal and coal-dust spillage is likely to occur, it is important that this is kept to a minimum by using control measures at critical points in the transfer locations. Dust-control measures should be adequate to reduce the transport of coal dust to the marine environment to minimum practical levels.
5.4 Fisheries Prior to jetty construction, dialogue with local fishers is necessary to mitigate the socio-economic impacts of removing fishing grounds. It is probable that individual fishers currently use the intended site of the proposed jetty (or the area necessary for construction) for long-term placement of nets, the socio-economic implications of this require further analysis. The construction of the jetty should be conducted with care, minimising where possible the spatial extent of the works to minimise the short-term impacts on fishers.
If an exclusion zone around the jetty is used this will require extensive dialogue with stakeholders to determine those activities limited by the exclusion policy. Ways to offset any loss of fishing ground need to be investigated and considered in the context of the socio-economic setting.
Marine Ecology
SINCLAIR KNIGHT MERZ
PAGE 58 D:\Documents and Settings\runsworth\Local Settings\Temporary Internet Files\OLK8B\R1_QE09421_Cirebon_Marine_Environment.doc
6. Monitoring and suggested additional work The major impacts of the proposed development are dependent upon Project compliance with mitigation measures related to wastewater treatment, stormwater management, mangrove removal, disturbance of the seabed, and fisheries habitat loss, and on the effectiveness of those measures in avoiding environmental degradation. Marine environmental monitoring requirements for the Project therefore require two components: compliance monitoring to ensure the ongoing implementation and operational performance of the mitigation measures and environmental status monitoring to ensure the effectiveness of the measures for environmental protection. The following environmental monitoring activities are recommended.
6.1 Compliance monitoring
Each environmental management plan (EMP) should include a compliance monitoring plan to ensure compliance with established procedures, maintenance of relevant structures, equipment, and facilities, and the performance of containment and treatment systems;
Effluent-quality monitoring to ensure that effluent continues to meet the relevant World Bank and Indonesian standards. Quality control measures should be implemented to ensure the reliability and accuracy of laboratory analytical results;
Compliance monitoring should include regular monitoring of water quality of stormwater discharged into the environment from the stormwater drains, during all seasons.
It is assumed compliance monitoring will be included in EMPs for dust control and coal spillage management are included in other reports; and
Monitoring of mitigation measures to ensure that construction impacts such as sediment spread are limited.
6.2 Environmental quality monitoring Environmental quality monitoring plans should be developed and implemented for water
quality, sediment quality, biological contamination, infauna, and mangroves;
Monitoring programs should include near-field and far-field reference sites to allow the detection of Project impacts;
Water quality monitoring should include provisions to assess the dispersion of the wastewater discharge plume for comparison with model predictions;
The environmental quality monitoring program should be developed in light of the results of the baseline surveys
The environmental quality monitoring program should include a minimum of one pre-construction monitoring event;
Marine Ecology
SINCLAIR KNIGHT MERZ
D:\Documents and Settings\runsworth\Local Settings\Temporary Internet Files\OLK8B\R1_QE09421_Cirebon_Marine_Environment.doc PAGE 59
The frequency of monitoring should be relatively high during construction and the initial year of operation. The monitoring program should be reviewed with regard to the number and location of sites, and the frequency of monitoring, after the first year of operation;
Quality control measures should be implemented to ensure the reliability and accuracy of laboratory analytical results; and
Development and implementation of a fisheries monitoring program should be considered, in cooperation with the relevant authorities. In addition to allowing the assessment of potential impacts of the Project upon local fisheries this could provide a useful basis for the resolution of any future claims for compensation for lost fisheries production;
Marine Ecology
SINCLAIR KNIGHT MERZ
PAGE 60 D:\Documents and Settings\runsworth\Local Settings\Temporary Internet Files\OLK8B\R1_QE09421_Cirebon_Marine_Environment.doc
7. References Alongi, DM; 2008. Mangrove forests: Resilience, protection from tsunamis, and responses to global climate change Estuarine, Coastal and Shelf Science 76 (1): 1-13
ASEAN Regional Centre for Biodiversity Conservation 2007. Site descriptions: Muara Cimanuk http://www.arcbc.org.ph/wetlands/indonesia/idn_mua_cimanuk.htm
Bryan, GW; 1976. Heavy metal contamination in the sea. Chapter 3 In: Johnston, R; 1976 Marine Pollution. Academic Press Ltd, New York
Cardno Lawson Treloar, 2008. Cirebon IPP coal fired power station. EISA and AMDAL. Numerical modelling of discharged waste water. Report prepared for Sinclair Knight Merz.
Cesar, HSJ; Lundin, CG; Bettencourt, S; Dixon, JA; 1997. Indonesian coral reefs-an economic analysis of a precious but threatened resource. Ambio 26: 345-350
Chapman, D; (Ed) 1996. Water quality assessments: A guide to the use of biota, sediments and water in environmental monitoring (2nd edition) UNESCO, WHO and UNEP, E & FN Spon, London
Connell, DW; Miller GJ 1984. Chemistry and ecotoxicology of pollution. John Wiley and Sons, New York
Costanza, R; d'Arge, R; de Groot, R; Farber, S; Grasso, M; Hannon, B; Limburg, K; Naeem, S; O'Neil, RV; Paruelo, J; Raskin, RG; Sutton, P; van den Belt, M; 1997. The value of the world's ecosystem services and natural capital. Nature 387: 253-260
Crawford, BR; Siahainenia, A; Rotinsulu, C; Sukmara, A; 2004 Compliance and Enforcement of Community-Based Coastal Resource Management Regulations in North Sulawesi, Indonesia. Coastal Management, 32:39–50
Cullen, L; 2007. Marine resource dependence, resource use patterns and identification of economic performance criteria within a small island community: Kaledupa, Indonesia. PhD thesis, University of Essex, UK
Danielsen, F; Sorensen, MK; Olwig, MF; Selvam, V; Parish F; Burgess, ND; Hiraishi T; Karunagaran, VM; Rasmussen, MS; Hansen, LB; Quarto, A; Suryadiputra, N; 2005. The Asian Tsunami: A Protective Role for Coastal Vegetation Science, 310 (5748) 643.
Dittmann, S; 2000. Zonation of benthic communities in a tropical tidal flat of north-east Australia Journal of Sea Research 43: 33–51
Marine Ecology
SINCLAIR KNIGHT MERZ
D:\Documents and Settings\runsworth\Local Settings\Temporary Internet Files\OLK8B\R1_QE09421_Cirebon_Marine_Environment.doc PAGE 61
Dixon, JA; 1989. Valuation of mangroves. Tropical Coastal Area Management 4:1-6
Dorenbosch, M; Grol, MGG; Christianen, MJA; Nagelkerken, I; van der Velde, G; 2005. Indo- Pacific seagrass beds and mangroves contribute to fish density and diversity on adjacent coral reefs. Marine Ecology Progress Series 302: 63–76
Ellison, JC; 1999. Impacts of sediment burial on mangroves. Marine Pollution Bulletin 37 (8-12): 420-426
Gell, FR; Roberts, CM; 2002. The fishery effects of marine reserves and fishery closures. WWF-US 1250 24th Street, NW, Washington, DC, 20037
Gilbert, A; Janssen, R; 1998. Use of environmental functions to communicate the values of a mangrove ecosystem under different management regimes. Ecological Economics 25: 323-346
Google Earth, 2007. http://earth.google.com/
Hogarth, P 2007. The biology of mangroves and seagrasses 2nd Edition, Oxford University Press, U.K
Hopley, D; Suharsono, H; 2000. The status of coral reefs in eastern Indonesia. Australian Institute of Marine Science, Townsville
Indonesian Fishing Statistics 2005.
Indra Consult (2000) Western Java Enviromental Management Project (WJEMP) Preliminary Statement Of Local Urban Strategy (LES) http://www.indraconsult.co.id/wjemp_cirebon/Inggris/WChapt_1.htm
Khan MA Aziz I 2001 Salinity tolerance in some mangrove species from Pakistan Wetlands Ecology and Management 9(3) 229-233
Lalli, C; Parsons, T; (1997) Biological Oceanography: An Introduction. 2nd Edition, Butterworth-Heinemann, London
Larsson, A; Haux, C; Sjobeck, ML; 1985. Fish physiology and metal pollution: results and experiences from laboratory and field studies. Ecotoxicology Environment and Safety 9, 250-281
Levington, JS; 1995. Marine Biology: function, biodiversity and ecology. Oxford University Press, U.K
Long, E.R., Macdonald, D.D., Smith, S.L., Calder, F.D., 1995. Incidence of adverse biological effects within ranges of chemical concentrations in marine and estuarine sediments. Environmental Management 19(1): 81-97
Marine Ecology
SINCLAIR KNIGHT MERZ
PAGE 62 D:\Documents and Settings\runsworth\Local Settings\Temporary Internet Files\OLK8B\R1_QE09421_Cirebon_Marine_Environment.doc
Mallampati, SR; Bhavesh, M; Sunil, D; Manish, J; Leena, K; Venkatrama, KSS; Shaik, B; Gadde, R; Prashant, B; 2007. Bioaccumulation of heavy metals in some commercial fishes and crabs of the Gulf of Cambay, India. Current Science 92 (11) 1489-1491
Mason, CF; 2000. Biology of freshwater pollution. Addison Wesley Longman Limited, Essex,. England
May, D; 2003. A preliminary assessment of the small-scale tropical fisheries of Kaledupa Island, Wakatobi Marine National Park, SE Sulawesi, Indonesia. Operation Wallacea technical report. http://www.opwall.com
Mazda, Y; Wolanski, E; King, B; Sase, A; Ohtsuka, D; Magi, M; 1997. Drag force due to vegetation in mangrove swamps. Mangroves and Salt Marshes 1: 3
Mumby, PJ; Edwards, AJ; Arias-Gonza´ lez, JE; Lindeman, KC; Blackwell, PG; Gall, A; Gorczynska, MI; Harborne, AR; Pescod, CL; Renken, H; Wabnitz, CCC; Llewellyn, G; 2004. Mangroves enhance the biomass of coral reef fish communities in the Caribbean. Nature 427: 533-536
Naidoo, G; 2004. The effects of coal dust on photosynthetic performance of the mangrove, Avicennia marina in Richards Bay, South Africa. Environmental Pollution 127: 359-399
Norse, EA; 1993. Global marine biological diversity: A strategy for building conservation into decision making. Island Press
Nybakken, JW; 1997. Marine biology: an ecological approach (4th Edition). Addison-Welsley Educational Publishers Inc., New York
Orth, RJ; Carruthers, TJB; Dennison, WC; Duarte, CM; Fourqurean, JW; Heck, KL; Randall Hughes, A; Kendrick, GA; Kenworthy, JW; Olyarnik, S; Short, FT; Michelle, W; Williams, SL; 2006. A global crisis for seagrass ecosystems. Bioscience 56: 987-996
Pandolfi, JM; Bradbury, RH; Sala, E; Hughes, TP; Bjorndal, KA; Cooke, RC; McArdle, D;
McClenachan, L; Newman, MJH; Paredes, G; Warner, RR; Jackson, JBC; 2003. Global
trajectories of the long-term decline of coral reef ecosystems. Science 301: 955-958
Pet-Soede, C; van Densen, WLT; Pet, JS; Machiels, MAM; 2001. Impact of Indonesian coral reef fisheries on fish community structure and the resultant catch composition. Fisheries Research 51 (1): 35-51
Robertson, AI; Duke, NC; 1987. Mangroves as nursery sites: comparisons of the abundance and species composition of fish and crustaceans in mangroves and other nearshore habitats in tropical Australia. Marine Biology 96 (2): 1432-1793

Marine Ecology
SINCLAIR KNIGHT MERZ
D:\Documents and Settings\runsworth\Local Settings\Temporary Internet Files\OLK8B\R1_QE09421_Cirebon_Marine_Environment.doc PAGE 63
Rilov, G; Benayahu, Y; 2000. Fish Assemblages on natural versus artificial reefs: The rehabilitation perspective. Marine Biology. 136: 931-942
Ruitenbeek, J; 1994. Modelling economy-ecology linkages in mangroves: economic evidence for promoting conservation in Bituni Bay, Indonesia. Ecological Economics 10: 233-247
Tomascik, T; Mah, AJ; Nontji, A; Moosa, MK; 1997. The Ecology of the Indonesian Seas: Part II, Vol VIII. Periplus Editions (HK) Ltd
Unsworth, RKF; Smith, DJ; Powell, A; Hukon, F; 2007. The ecology of Indo-Pacific grouper (Serranidae) species and the effects of a small scale no take area on grouper assemblage, abundance and size frequency distribution. Marine Biology 1152(2): 243-254
Unsworth, RKF; Salinas De Leon, P; Garrard, S; Jompa, J; Smith, DJ; Bell, JJ; 2008. High connectivity of Indo-Pacific seagrass fish assemblages with mangrove and coral reef habitats. Marine Ecology Progress Series, 353
WJEPA 2005 ASER 2005: West java annual state of the environment report. Report of the west Java Environment Protection Agency.
Wyrtki, K; 1961. Scientific Results of Marine Investigations of the South China Sea and the Gulf of Thailand 1959-1961 NAGA REPORT Volume 2, The University of California Scripps Institution of Oceanography La Jolla, California
WBM, 1993. Coal Spillage at Hay Point- Environmental Issues. Unpublished Report to Ports Corporation of Queensland, WBM Oceanics, Spring Hill, Brisbane

Marine Ecology
SINCLAIR KNIGHT MERZ
PAGE 64 D:\Documents and Settings\runsworth\Local Settings\Temporary Internet Files\OLK8B\R1_QE09421_Cirebon_Marine_Environment.doc
Appendix A Comparison of World Bank / IFC Guidelines with Indonesian Standards
World Bank standards that are stricter than Indonesian standards are highlighted in red. Parameters which appear in World Bank standards but do not appear in Indonesian standards are highlighted in blue.
Liquid Effluents
World Bank Standards
Indonesian Standards IFC Guidelines Remarks Parameter
Limit Source Limit Source Limit Source
pH 6-9 B 6-9 E 6-9 G ND BOD 50 mg/L C 50 mg/L E 30mg/L G IFC COD 250 mg/L C 100 mg/L E 125mg/L G Indonesian Oil and Grease 10 mg/L B 5 mg/L D 10mg/L G Indonesian Total Nitrogen - - - - 10mg/L G IFC Total suspended solids (TSS)
50 mg/L B 200 mg/L DW
80 mg/L AMSW
E
D
50mg/L G IFC
Total residual Chlorine 0.2 mg/L B 1 mg/L E - - World Bank Heavy metals (total) 10 mg/L C - - - - World Bank Arsenic 0.1 mg/L B 0.1 mg/L E - - ND Barium - - 2 mg/L E - - Indonesian Cadmium 0.1 mg/L C 0.05 mg/L
DW 0.01 mg/L
AMSW
E
D
- - Indonesian
Hexavalent 0.1 mg/L C 0.1 mg/L E - - ND Chromium Total 0.5 mg/L B 0.5 mg/L E - - ND
Cobalt - - 0.4 mg/L E - - Indonesian Copper 0.5 mg/L B 2 mg/L
DW 0.05 mg/L
AMSW
E
D
- - World Bank
Iron 1 mg/L B 5 mg/L E - - World Bank Lead 0.1 mg/L C 0.1 mg/L
DW 0.05 mg/L
AMSW
E
D
- - Indonesian
Mercury 0.01 mg/L C 0.002 mg/L E - - World Bank Methylene Blue Active Substances
- - 5 mg/L E - - Indonesian
Manganese - - 2 mg/L E - - Indonesian Nickel 0.5 mg/L C 0.2 mg/L E - - Indonesian Selenium 0.1 mg/L C 0.05 mg/L E - - Indonesian Silver 0.5 mg/L C - - - - World Bank

Marine Ecology
SINCLAIR KNIGHT MERZ
D:\Documents and Settings\runsworth\Local Settings\Temporary Internet Files\OLK8B\R1_QE09421_Cirebon_Marine_Environment.doc PAGE 65
Zinc 1.0 mg/L B 5 mg/L DW
0.1 mg/L AMSW
E
D
- - World Bank
Free 0.1 mg/L 0.05mg/L E - - Indonesian Cyanide Total 1.0 mg/L
C - - - - World Bank
Ammonia 10 mg/L C 1 mg/L DW
0.3 mg/L AMSW
E
D
- - Indonesian
Fluoride 20 mg/L C 2 mg/L E - - Indonesian Nitrate - - 20 mg/L E - - Indonesian Nitrite - - 1 mg/L E - - Indonesian Phenols 0.5 mg/L C 0.5 mg/L
DW 0.002 mg/L
AMSW
E
D
- - ND
Phosphorus 2.0 mg/L C - - 2.0 mg/L G No difference
Sulphide 1.0 mg/L C 0.05 mg/L DW
0.03 mg/L AMSW
E
D
- - Indonesian
Stannum / Tin - - 2 mg/L E - - Indonesian Total Hydrocarbons - - 1 mg/L D
- - Indonesian
Total Coliform Bacteria ≤ 400 NPN / 100 ml
C 1000 MPN / 100ml
D 400 MPN / 100ml
G World Bank
Dioxins, Furans, other toxics such as PAH ( Polyaromatic Hydrocarbons)
≤ 100 times WHO
guidelines for drinking
water quality1 or ≤ 0.05 mg/L
C - - - - World Bank
Polychlorinated Biphenyls (PCB)
- - 0.001 mg/L D - - Indonesian
Temperature increase2 ≤ 3oC B < 2oC D
- - Indonesian
Legend: A - Ministerial Decree of State Minister of Environment No. 13 of 1995 regarding Threshold Limit of Unmoveable Sources (Appendix IIIB)
B- Pollution Prevention and Abatement Handbook: Thermal Power: Guidelines for New Plants
C- Pollution Prevention and Abatement Handbook: General Environmental Guidelines
1 Please see Table A1 for Dioxins, Furans and PAH listed in the WHO Chemical Drinking Water parameters (highlighted in yellow) 2 Increase in temperature of water body where the effluent is discharged into

Marine Ecology
SINCLAIR KNIGHT MERZ
PAGE 66 D:\Documents and Settings\runsworth\Local Settings\Temporary Internet Files\OLK8B\R1_QE09421_Cirebon_Marine_Environment.doc
D- Ministerial Decree of State Minister of Environment No.51 of 2004 regarding Threshold Limit of Seawater Quality
E – Decree of West Java Governor No. 9 of 1999 regarding Wastewater Thresholds for Industry in West Java Province
F – Ministerial Decree of State Minister of Environment No 48 of 1996 regarding Threshold Limit of Noise
G – International Finance Corporation: Environmental Health and Safety Guidelines, April 30 2007.
H – Indonesian Government Regulation No. 41 of 1999 regarding Air Pollution Control
G – Ministerial Decree of State Monister of Labour No. KEP-51 of 1999 regarding Threshold Limit of Physical Factors at Workplace

Marine Ecology
SINCLAIR KNIGHT MERZ
D:\Documents and Settings\runsworth\Local Settings\Temporary Internet Files\OLK8B\R1_QE09421_Cirebon_Marine_Environment.doc PAGE 67
Relevant WHO drinking water chemical parameters

Marine Ecology
SINCLAIR KNIGHT MERZ
PAGE 68 D:\Documents and Settings\runsworth\Local Settings\Temporary Internet Files\OLK8B\R1_QE09421_Cirebon_Marine_Environment.doc
Appendix B Indonesian sea water standards for marine biota and ports
Based on the Ministerial Decree of State Minister of Environment No. 51 of 2004
PARAMETER UNIT THRESHOLD LIMITS Marine Biota Ports
Visuality m Coral: >5 >3 Seagrass: >3 Odour - Natural Turbiditya NTU <5 TSSb mg/L coral:20 80 Mangrove: 80 Seagrass: 20 Garbage - Not detected 1(4) Temperaturec ºC Coral: 28-30(c) Mangrove: 28-32(c) Seagrass: 20-30(c) Oil layer5 - Not deteced1(5) pHd - 7-8.5(d) 6.5 – 8.5 Salinitye % Coral:33-34(e) Mangrove: up to 34(e) Seagrass: 33-34(e) DO mg/L >5 BOD5 mg/L 20 Total Ammonia (NH3-N) mg/L 0.3 0.3 Phosphate (PO4-P) mg/L 0.015 Nitrate (NO3-N) mg/L 0.008 Cyanide (CN-) mg/L 0.5 Sulphide (H2S) mg/L 0.01 0.03 PAH mg/L 0.003 Total phenols mg/L 0.002 Total Hydrocarbon mg/L 0.002 Total PCB µg/L 0.01 0.01 Surfactan (detergent) mg/L MBAS 1 1 Oil and grease mg/L 1 5 Pesticidesf µg/L 0.01 TBT 7 µg/L 0.01 0.01 Mercury (Hg) mg/L 0.001 0.003 Chromium hexavalent (Cr(VI)) mg/L 0.005 Arsenic mg/L 0.012 Cadmium (Cd) mg/L 0.001 0.01 Cuprum (Cu) mg/L 0.008 0.05 Lead (Pb) mg/L 0.008 0.05 Zink (Zn) mg/L 0.05 0.1 Nickel (Ni) mg/L 0.05 Coliform (total)9 MPN/100mL 1000(g) 1000 Patogent sel/100mL Not detected1 Plankton sel/100mL No blooming6 Notes: 1. Not detected based on detection limit of the equipment and methodology used. 2. Methodology referred to is that commonly practiced in Internatinal or Natinal level.
Marine Ecology
SINCLAIR KNIGHT MERZ
D:\Documents and Settings\runsworth\Local Settings\Temporary Internet Files\OLK8B\R1_QE09421_Cirebon_Marine_Environment.doc PAGE 69
4. Based on observation by human eyes (visual). 5. Based on observation by human eyes (visual). Oil layer referred to is thin layer of 0.01mm thichness. 6. No blooming means no over growth of plankton that can cause eutrofication 7. TBT is antifouling agent which usually be found in vessel paint. a. Allowable variations: <10% euphotic depth b. Allowable variations: <10% seasonal concentration c. Allowable variations: <2ºC of the natural temperature d. Allowable variations: <0.2 unit pH e. Allowable variations: <5% average seasonal salinity f. Including pesticides from the types of DDt, Endrin, Endosulfan and Heptachlor g. Allowable variations: <10% average seasonal concentration
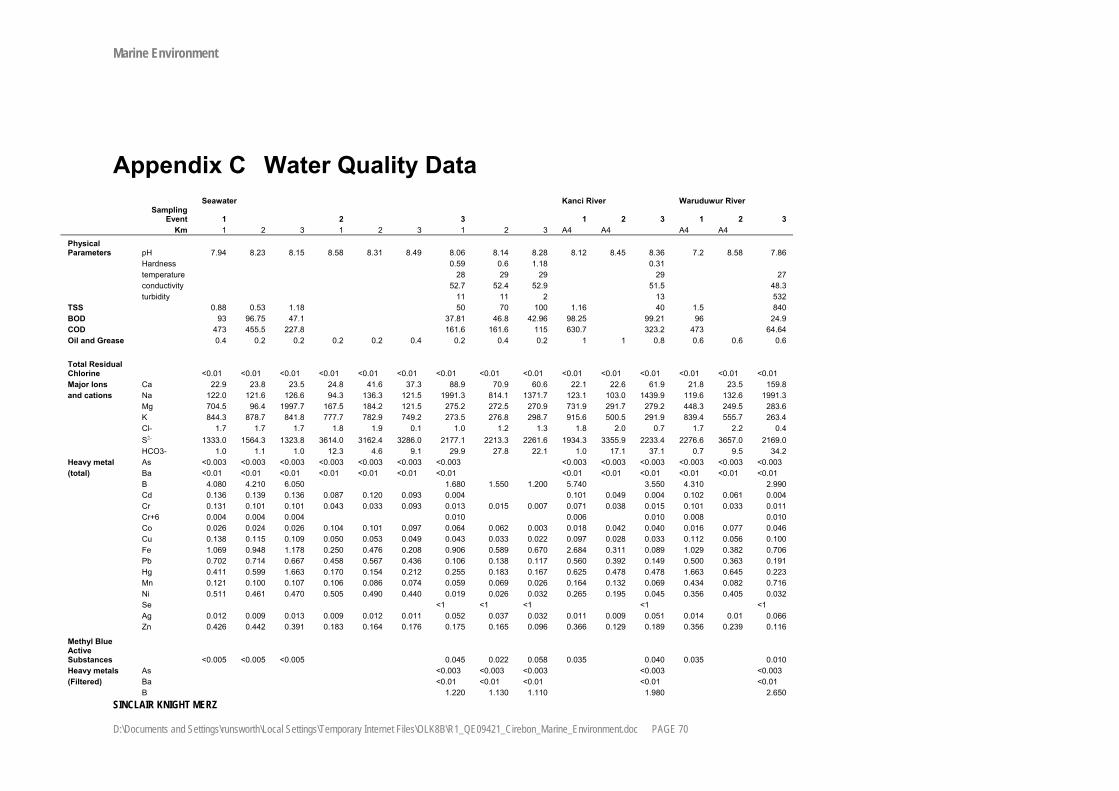
Marine Environment
SINCLAIR KNIGHT MERZ D:\Documents and Settings\runsworth\Local Settings\Temporary Internet Files\OLK8B\R1_QE09421_Cirebon_Marine_Environment.doc PAGE 70
Appendix C Water Quality Data Seawater Kanci River Waruduwur River
Sampling
Event 1 2 3 1 2 3 1 2 3 Km 1 2 3 1 2 3 1 2 3 A4 A4 A4 A4
Physical Parameters pH 7.94 8.23 8.15 8.58 8.31 8.49 8.06 8.14 8.28 8.12 8.45 8.36 7.2 8.58 7.86 Hardness 0.59 0.6 1.18 0.31 temperature 28 29 29 29 27 conductivity 52.7 52.4 52.9 51.5 48.3 turbidity 11 11 2 13 532 TSS 0.88 0.53 1.18 50 70 100 1.16 40 1.5 840 BOD 93 96.75 47.1 37.81 46.8 42.96 98.25 99.21 96 24.9 COD 473 455.5 227.8 161.6 161.6 115 630.7 323.2 473 64.64 Oil and Grease 0.4 0.2 0.2 0.2 0.2 0.4 0.2 0.4 0.2 1 1 0.8 0.6 0.6 0.6
Total Residual Chlorine <0.01 <0.01 <0.01 <0.01 <0.01 <0.01 <0.01 <0.01 <0.01 <0.01 <0.01 <0.01 <0.01 <0.01 <0.01 Major Ions Ca 22.9 23.8 23.5 24.8 41.6 37.3 88.9 70.9 60.6 22.1 22.6 61.9 21.8 23.5 159.8 and cations Na 122.0 121.6 126.6 94.3 136.3 121.5 1991.3 814.1 1371.7 123.1 103.0 1439.9 119.6 132.6 1991.3 Mg 704.5 96.4 1997.7 167.5 184.2 121.5 275.2 272.5 270.9 731.9 291.7 279.2 448.3 249.5 283.6 K 844.3 878.7 841.8 777.7 782.9 749.2 273.5 276.8 298.7 915.6 500.5 291.9 839.4 555.7 263.4 Cl- 1.7 1.7 1.7 1.8 1.9 0.1 1.0 1.2 1.3 1.8 2.0 0.7 1.7 2.2 0.4 S2- 1333.0 1564.3 1323.8 3614.0 3162.4 3286.0 2177.1 2213.3 2261.6 1934.3 3355.9 2233.4 2276.6 3657.0 2169.0 HCO3- 1.0 1.1 1.0 12.3 4.6 9.1 29.9 27.8 22.1 1.0 17.1 37.1 0.7 9.5 34.2 Heavy metal As <0.003 <0.003 <0.003 <0.003 <0.003 <0.003 <0.003 <0.003 <0.003 <0.003 <0.003 <0.003 <0.003 (total) Ba <0.01 <0.01 <0.01 <0.01 <0.01 <0.01 <0.01 <0.01 <0.01 <0.01 <0.01 <0.01 <0.01 B 4.080 4.210 6.050 1.680 1.550 1.200 5.740 3.550 4.310 2.990 Cd 0.136 0.139 0.136 0.087 0.120 0.093 0.004 0.101 0.049 0.004 0.102 0.061 0.004 Cr 0.131 0.101 0.101 0.043 0.033 0.093 0.013 0.015 0.007 0.071 0.038 0.015 0.101 0.033 0.011 Cr+6 0.004 0.004 0.004 0.010 0.006 0.010 0.008 0.010 Co 0.026 0.024 0.026 0.104 0.101 0.097 0.064 0.062 0.003 0.018 0.042 0.040 0.016 0.077 0.046 Cu 0.138 0.115 0.109 0.050 0.053 0.049 0.043 0.033 0.022 0.097 0.028 0.033 0.112 0.056 0.100 Fe 1.069 0.948 1.178 0.250 0.476 0.208 0.906 0.589 0.670 2.684 0.311 0.089 1.029 0.382 0.706 Pb 0.702 0.714 0.667 0.458 0.567 0.436 0.106 0.138 0.117 0.560 0.392 0.149 0.500 0.363 0.191 Hg 0.411 0.599 1.663 0.170 0.154 0.212 0.255 0.183 0.167 0.625 0.478 0.478 1.663 0.645 0.223 Mn 0.121 0.100 0.107 0.106 0.086 0.074 0.059 0.069 0.026 0.164 0.132 0.069 0.434 0.082 0.716 Ni 0.511 0.461 0.470 0.505 0.490 0.440 0.019 0.026 0.032 0.265 0.195 0.045 0.356 0.405 0.032 Se <1 <1 <1 <1 <1 Ag 0.012 0.009 0.013 0.009 0.012 0.011 0.052 0.037 0.032 0.011 0.009 0.051 0.014 0.01 0.066 Zn 0.426 0.442 0.391 0.183 0.164 0.176 0.175 0.165 0.096 0.366 0.129 0.189 0.356 0.239 0.116
Methyl Blue Active Substances <0.005 <0.005 <0.005 0.045 0.022 0.058 0.035 0.040 0.035 0.010 Heavy metals As <0.003 <0.003 <0.003 <0.003 <0.003 (Filtered) Ba <0.01 <0.01 <0.01 <0.01 <0.01 B 1.220 1.130 1.110 1.980 2.650

Marine Ecology
SINCLAIR KNIGHT MERZ
D:\Documents and Settings\runsworth\Local Settings\Temporary Internet Files\OLK8B\R1_QE09421_Cirebon_Marine_Environment.doc PAGE 71
Seawater Kanci River Waruduwur River
Sampling
Event 1 2 3 1 2 3 1 2 3 Km 1 2 3 1 2 3 1 2 3 A4 A4 A4 A4 Cd 0.029 0.032 0.005 <0.004 <0.004 <0.004 0.024 <0.004 0.027 <0.004 Cr 0.022 <0.005 <0.005 <0.005 <0.005 <0.005 0.022 0.010 0.005 <0.005 Cr+6 <0.01 <0.01 <0.01 <0.01 <0.01 Co 0.015 0.012 0.010 <0.007 <0.007 <0.007 0.017 0.007 0.019 <0.007 Cu 0.009 0.013 0.012 0.011 0.022 0.003 0.018 0.003 0.016 <0.003 Fe 0.099 0.094 0.104 0.157 0.172 0.142 0.080 0.217 0.085 0.165 Pb 0.087 0.182 0.029 <0.002 <0.002 <0.002 0.124 <0.002 0.145 0.074 Hg <0.126 <0.126 <0.126 <0.126 <0.126 <0.126 0.020 <0.126 <0.126 <0.126 Mn 0.041 0.043 0.034 0.005 0.014 0.007 0.022 0.003 0.024 0.014 Ni 0.070 0.055 0.050 0.019 <0.005 <0.005 0.060 0.013 0.055 <0.005 Se <1 <1 <1 <1 <1 <1 <1 <1 <1 <1 Ag 0.002 0.003 0.003 0.020 0.014 0.015 0.003 0.034 0.003 0.014 Zn 0.112 0.114 0.109 0.047 0.044 0.059 0.121 0.044 0.114 0.037 Cyanide Cyanide free <0.01 <0.01 <0.01 <0.01 <0.01 Cyanide Total <0.01 <0.01 <0.01 <0.01 <0.01 Nutrients ammonia 0.188 0.188 0.150 0.150 0.080 0.070 0.163 0.330 0.200 0.250 Total N 1.079 1.438 1.438 1.440 1.080 0.720 1.438 1.440 1.798 1.810 nitrate 0.040 0.020 0.030 0.300 0.150 nitrite 0.420 0.710 0.410 <0.01 <0.01 phosphorus 0.210 0.029 0.429 0.010 0.020 0.020 0.031 0.020 0.309 0.040 TKN 40.446 22.470 22.470 7.220 7.220 5.420 31.458 7.220 31.458 9.030 flouride 0.190 0.170 0.130 0.340 0.300 sulphide <0.01 0.020 0.030 <0.01 <0.01 <0.01 <0.01 Oraganic phenols 0.001 0.059 0.036 <0.03 0.028 0.036 Contaminants stannum/tin <0.03 <0.03 <0.03 <0.003 <0.004 <0.005 0.030 0.030 0.030 Total Hydrocarbons 0.200 0.400 0.200 0.800 0.600 Total Coliforms <3 <3 <3 <3 <11 <11 <3 <3 4.000 93.000 Organochlorine pesticides <0.0005 <0.0005 <0.0005 <0.0005 <0.0005 Dioxins etc <0.005 <0.005 <0.005 <0.005 <0.005 PCBs <0.005 <0.005 <0.005 <0.005 <0.005
Marine Environment
SINCLAIR KNIGHT MERZ D:\Documents and Settings\runsworth\Local Settings\Temporary Internet Files\OLK8B\R1_QE09421_Cirebon_Marine_Environment.doc PAGE 72
Appendix D Results of infauna sampling


![tempor, temper, stru, and struct. 3. List as many words as you can think of that contain the roots tempor, temper, stru, and struct. 2. A[n] ______________.](https://static.fdocuments.us/doc/165x107/56649c7f5503460f94935ee0/tempor-temper-stru-and-struct-3-list-as-many-words-as-you-can-think-of.jpg)