Cipla (CIPLA IN) - Business...
10
August 8, 2018 1 Rating: REDUCE | CMP: Rs633 | TP: Rs525 Q1 misses; Steep Valuation for underperformance Gross underperformance against all estimates in 1QFY19: Cipla’s adj Sales, adj. EBITDA and PAT of Rs38.5bn, Rs6.3bn and Rs4.5bn were below our estimates by 7%, 21% and 3% respectively. The company also missed the consensus estimates of sales and EBITDA by 5% and 18% while the beat in PAT was due to net forex gain of Rs400m. The optimistic guidance of the management: a)launch of one complex drug/quarter and Q4FY18 was to be first strong quarter (to begin a series of good quarters) hasn’t played out. And disappointed. Its gross margin declined by 110bps QoQ despite benefit of 4% higher (QoQ) US$/INR rate in Q1FY19. Inflation in global commodity prices, higher costs of API from Chinese suppliers and unabated price erosion in US generics has led to lower gross margin. Tax rate guidance increased to 28% in FY19E due to due to expiry of tax benefits of an Indian formulation plant in backward areas and lower R&D related tax benefits from govt. US sales growth remains a mirage: The US generic sales declined to US$100m in Q1FY19 vs US$105m in Q4FY18 due to product rationalization and price erosion.. Price erosion due to consolidation among channel partners was cited as one of the key reason for not achieving estimated US sales. This is definitely a shift in management commentary as they stated in Q4FY18 conference call that price erosion (due to channel consolidation) has been very less impactful for Cipla as majority of its US portfolio belongs to old generation molecule. Cipla guided that its product rationalization and supply-related issues from Invagen impacted US$10m sales in Q1FY19 and continue to impact US$5m sales in Q2FY19E. R&D expenditure was Rs100m for preparatory work before clinical trial start for gAdvair in US and guided for higher expenses in FY19E once clinical trial starts. US sales growth in FY19 to be led by optimization from the new launches of key complex generics such as gAloxi (AG), gIsuprel, gDacogen, Budesonide and gDepo-Testosterone. It also guided for approval and launch of Toprol-XL. India formulations: Lower Q2 growth indicated: With the benefit of lower base due GST- Cipla’s India formulation sales growth was 22% YoY, while normalized growth was 14% YoY. The management guided for 12-14% YoY growth in FY19E, which is 2-3% higher than industry average. While Q2 and Q3 are traditionally strong quarters for Cipla, management indicated slower sales growth in Q2FY19E due to a) disadvantage of higher base in Q2FY18 and b) slow beginning of sales without seasonal benefits. The company expect to introduce new generation molecules in oncology and anti diabetic segments from global majors like Roche and Eli Lilly. South Africa (SA): Mirren acquisition to benefit in OTC, private market: With 14% YoY growth (in local currency), Cipla plans to increase its presence in OTC and private market post its acquisition of Mirren in SA. It plans to launch in-licensed biosimilars in key ROW markets including SA. Cipla (CIPLA IN) August 8, 2018 Q1FY19 Result Update Change in Estimates | Target | Reco Change in Estimates Current Previous FY19E FY20E FY19E FY20E Rating REDUCE REDUCE Target Price 525 525 Sales (Rs. m) 1,65,824 1,79,996 1,65,824 1,79,996 % Chng. - - EBITDA (Rs. m) 29,848 34,289 29,848 34,289 % Chng. - - EPS (Rs.) 25.0 27.6 25.0 27.6 % Chng. - - Key Financials FY17 FY18 FY19E FY20E Sales (Rs. m) 1,42,809 1,47,509 1,65,824 1,79,996 EBITDA (Rs. m) 21,264 27,559 29,848 34,289 Margin (%) 14.9 18.7 18.0 19.1 PAT (Rs. m) 10,134 18,112 20,156 22,210 EPS (Rs.) 12.6 22.5 25.0 27.6 Gr. (%) (26.2) 78.6 11.3 10.2 DPS (Rs.) 2.1 2.0 2.0 2.0 Yield (%) 0.3 0.3 0.3 0.3 RoE (%) 8.4 13.5 13.3 13.0 RoCE (%) 8.3 12.9 14.3 14.7 EV/Sales (x) 3.7 3.6 3.1 2.8 EV/EBITDA (x) 25.2 19.2 17.3 14.6 PE (x) 50.2 28.1 25.3 22.9 P/BV (x) 4.1 3.6 3.2 2.8 Key Data CIPL.BO | CIPLA IN 52-W High / Low Rs.663 / Rs.507 Sensex / Nifty 37,888 / 11,450 Market Cap Rs.510bn/ $ 7,428m Shares Outstanding 805m 3M Avg. Daily Value Rs.3259.04m Shareholding Pattern (%) Promoter’s 37.21 Foreign 23.87 Domestic Institution 14.23 Public & Others 24.69 Promoter Pledge (Rs bn) - Stock Performance (%) 1M 6M 12M Absolute 3.4 3.4 9.5 Relative (2.7) (6.1) (7.5) Surajit Pal [email protected] | 91-22-66322259
Transcript of Cipla (CIPLA IN) - Business...
August 8, 2018 1
Rating: REDUCE | CMP: Rs633 | TP: Rs525
Q1 misses; Steep Valuation for underperformance
Gross underperformance against all estimates in 1QFY19: Cipla’s adj Sales,
adj. EBITDA and PAT of Rs38.5bn, Rs6.3bn and Rs4.5bn were below our estimates
by 7%, 21% and 3% respectively. The company also missed the consensus
estimates of sales and EBITDA by 5% and 18% while the beat in PAT was due to
net forex gain of Rs400m. The optimistic guidance of the management: a)launch of
one complex drug/quarter and Q4FY18 was to be first strong quarter (to begin a
series of good quarters) hasn’t played out. And disappointed. Its gross margin
declined by 110bps QoQ despite benefit of 4% higher (QoQ) US$/INR rate in
Q1FY19. Inflation in global commodity prices, higher costs of API from Chinese
suppliers and unabated price erosion in US generics has led to lower gross margin.
Tax rate guidance increased to 28% in FY19E due to due to expiry of tax benefits
of an Indian formulation plant in backward areas and lower R&D related tax benefits
from govt.
US sales growth remains a mirage: The US generic sales declined to US$100m
in Q1FY19 vs US$105m in Q4FY18 due to product rationalization and price
erosion.. Price erosion due to consolidation among channel partners was cited as
one of the key reason for not achieving estimated US sales. This is definitely a shift
in management commentary as they stated in Q4FY18 conference call that price
erosion (due to channel consolidation) has been very less impactful for Cipla as
majority of its US portfolio belongs to old generation molecule. Cipla guided that its
product rationalization and supply-related issues from Invagen impacted US$10m
sales in Q1FY19 and continue to impact US$5m sales in Q2FY19E.
R&D expenditure was Rs100m for preparatory work before clinical trial start for
gAdvair in US and guided for higher expenses in FY19E once clinical trial starts.
US sales growth in FY19 to be led by optimization from the new launches of key
complex generics such as gAloxi (AG), gIsuprel, gDacogen, Budesonide and
gDepo-Testosterone. It also guided for approval and launch of Toprol-XL.
India formulations: Lower Q2 growth indicated: With the benefit of lower base
due GST- Cipla’s India formulation sales growth was 22% YoY, while normalized
growth was 14% YoY. The management guided for 12-14% YoY growth in FY19E,
which is 2-3% higher than industry average. While Q2 and Q3 are traditionally
strong quarters for Cipla, management indicated slower sales growth in Q2FY19E
due to a) disadvantage of higher base in Q2FY18 and b) slow beginning of sales
without seasonal benefits. The company expect to introduce new generation
molecules in oncology and anti diabetic segments from global majors like Roche
and Eli Lilly.
South Africa (SA): Mirren acquisition to benefit in OTC, private market: With
14% YoY growth (in local currency), Cipla plans to increase its presence in OTC
and private market post its acquisition of Mirren in SA. It plans to launch in-licensed
biosimilars in key ROW markets including SA.
Cipla (CIPLA IN)
August 8, 2018
Q1FY19 Result Update
Change in Estimates | Target | Reco
Change in Estimates
Current Previous
FY19E FY20E FY19E FY20E
Rating REDUCE REDUCE
Target Price 525 525
Sales (Rs. m) 1,65,824 1,79,996 1,65,824 1,79,996
% Chng. - -
EBITDA (Rs. m) 29,848 34,289 29,848 34,289
% Chng. - -
EPS (Rs.) 25.0 27.6 25.0 27.6
% Chng. - -
Key Financials
FY17 FY18 FY19E FY20E
Sales (Rs. m) 1,42,809 1,47,509 1,65,824 1,79,996
EBITDA (Rs. m) 21,264 27,559 29,848 34,289
Margin (%) 14.9 18.7 18.0 19.1
PAT (Rs. m) 10,134 18,112 20,156 22,210
EPS (Rs.) 12.6 22.5 25.0 27.6
Gr. (%) (26.2) 78.6 11.3 10.2
DPS (Rs.) 2.1 2.0 2.0 2.0
Yield (%) 0.3 0.3 0.3 0.3
RoE (%) 8.4 13.5 13.3 13.0
RoCE (%) 8.3 12.9 14.3 14.7
EV/Sales (x) 3.7 3.6 3.1 2.8
EV/EBITDA (x) 25.2 19.2 17.3 14.6
PE (x) 50.2 28.1 25.3 22.9
P/BV (x) 4.1 3.6 3.2 2.8
Key Data CIPL.BO | CIPLA IN
52-W High / Low Rs.663 / Rs.507
Sensex / Nifty 37,888 / 11,450
Market Cap Rs.510bn/ $ 7,428m
Shares Outstanding 805m
3M Avg. Daily Value Rs.3259.04m
Shareholding Pattern (%)
Promoter’s 37.21
Foreign 23.87
Domestic Institution 14.23
Public & Others 24.69
Promoter Pledge (Rs bn) -
Stock Performance (%)
1M 6M 12M
Absolute 3.4 3.4 9.5
Relative (2.7) (6.1) (7.5)
Surajit Pal
[email protected] | 91-22-66322259

Cipla
August 8, 2018 2
Valuation: Maintain ‘Reduce’, retain TP at Rs525: Cipla was expected to
outperform consensus estimates driven by the launches and traction of complex
generics per quarter. The adjustments of one‐offs also could not lead to headline
growth and margins as guided by the management. There was strong reduction
(50% fall YoY) of global tender (ARV/malaria) business as they strive for selective
tender business for having margin in the range of 16‐18%. Management however
remained optimistic on revenue growth, US sales and EBITDA expansions for
FY19E without specific quantification. Cipla trades at 25x FY19E and 23x FY20E
PER. We maintain ‘Reduce’ recommendation and retain TP at Rs525.
Cipla
August 8, 2018 3
Conference call key takeaways:
The management attributed the decline in gross margins (270bps YoY) in
Q1FY19 due to inventory charges, supply issues from China and oil linked cost
inflation pressure
Domestic sales increased 21.6% YoY mainly due to GST implementation
impact in the base quarter. The growth was aided by strong performance in
cardiac, respiratory, neurology and derma portfolio. Management guided to
achieve 12-14% growth in domestic business in FY19E. Cipla entered into
partnership with Eli Lilly to market and distribute insulin Glargine injection
(Basaglar) in India
Cipla’s US sales have remained stable over last few quarters around
US$100m. The US business was impacted by US$5m due to rationalisation of
low-margin SKUs. Cipla’s US portfolio consist of 101 pending ANDAs, of which
25 have tentative approvals, 10 are partnered and 15 are filed under PEPFAR
Cipla guided for filings of 20 ANDAs in FY19E, and filed 5 ANDAs in US in
Q1FY19. Management guided for at least 1 sizeable approval per quarter going
forward.
Cipla’s US business saw improvement in gross margins in Q1FY19 driven by
product rationalisation and ramp-up of new product launches. The company’s
90% of new product revenues in Q1FY19 was contributed by Budesonide,
Decitabine, Palonosetron and Isoproterenol
SA sales increased 14% YoY to US$125m normalized for SA’s animal health
business. Management guided for first to market launches in Q2FY19E
including Filgrastim biosimilar injection
Management guided for ramp-up of portfolio across key DTMs of Australia
(Azacitidine), New Zealand (Dymista) and Columbia (5 new product launches)
Guided for in-licensing of Trastuzumab for key emerging markets of Australia,
New Zealand, Columbia and Malaysia
Expects approval for gToprol XL in FY19E. Also, management guided for
growth of 5-10% in API business in FY19E
Net debt was Rs19bn while cash and cash equivalents were at Rs22.4bn in
Q1FY19
Clinical trial for Advair commenced from Q2FY19E which will involve higher
R&D spends. Cipla has already spent Rs100m on the preparatory work done
in Advair
R&D costs are likely to be 8-9% of sales in FY19E due to fast track of key
molecules, clinical trials of complex/limited competition drugs and biosimilars.
R&D expenses in Q1FY18 were at 7% of sales.
Continued to maintain focus on building a strong specialty portfolio in US with
certain assets in advanced stages of discussion in neurology and respiratory
segment

Cipla
August 8, 2018 4
Exhibit 1: Quarterly Financials
Y/e March Q1FY19 Q1FY18 YoY gr. (%) Q4FY18 FY19E FY18 YoY gr. (%)
Net Sales 38,458 34,323 12.0 34,958 1,65,824 1,47,509 12.4
Raw Material 14,239 11,767 21.0 13,303 56,795 54,384 4.4
% of Net Sales 37.0 34.3 38.1 34.3 36.9
Personnel Cost 7,140 6,729 6.1 6,990 29,019 26,901 7.9
% of Net Sales 18.6 19.6 20.0 17.5 18.2
Others 10,747 10,290 4.4 11,118 50,162 42,644 17.6
% of Net Sales 27.9 30.0 31.8 30.3 28.9
Total Expenditure 32,126 28,786 11.6 31,411 1,35,976 1,23,929 9.7
EBITDA 6,332 5,537 14.4 3,547 29,848 23,580 26.6
Margin (%) 16.5 16.1 6.3 10.1 18.0 16.0
Depreciation 2,410 2,134 12.9 2,848 10,741 13,228 (18.8)
EBIT 3,922 3,403 15.3 699 19,107 10,352 84.6
Other Income 2,633 2,441 7.8 2,422 7,847 8,260 (5.0)
Interest 351 279 26.0 352 1,028 1,142 (10.0)
PBT 6,204 5,566 11.5 2,769 25,927 17,470 48.4
Extra-Ord. Inc./Exps. (46) 170 521 66 863
Total Taxes 1,737 1,308 32.8 462 5,704 2,501 128.1
ETR (%) 28.0 23.5 16.7 22.0 14.3
Reported PAT 4,513 4,088 10.4 1,786 20,156 14,105 42.9
Source: Company, PL
Exhibit 2: Sources of Revenue
Geographic break up of revenues Q1FY19 Q1FY18 YoY gr. (%) Q4FY18 FY19E FY18 YoY gr. (%)
Domestic market 15,440 12,700 21.6 13,530 64,832 58,670 10.5
% of Sales 39.2 36.0 36.6 37.8 38.6
International market (Exports) 23,950 22,550 6.2 23,450 1,06,590 93,490 14.0
% of Sales 60.8 64.0 63.4 62.2 61.4
North America (US & Canada) 6,700 6,460 3.7 6,750 20,670 25,890 (20.2)
Cipla Medpro (SA) 5,750 4,670 23.1 5,320 24,490 20,314 20.6
Emerging Markets (Africa ex SA) 4,690 4,630 1.3 3,940 24,974 16,820 48.5
Europe 1,340 1,650 (18.8) 1,360 11,370 6,230 82.5
Others (SAGA) 3,470 3,840 (9.6) 4,730 17,783 17,986 (1.1)
APIs 2,000 1,300 53.8 1,350 7,303 6,250 16.8
% of Sales 5.1 3.7 3.7 4.3 4.1
Total 39,390 35,250 11.7 36,980 1,71,422 1,52,160 12.7
Source: Company, PL
Cipla
August 8, 2018 5
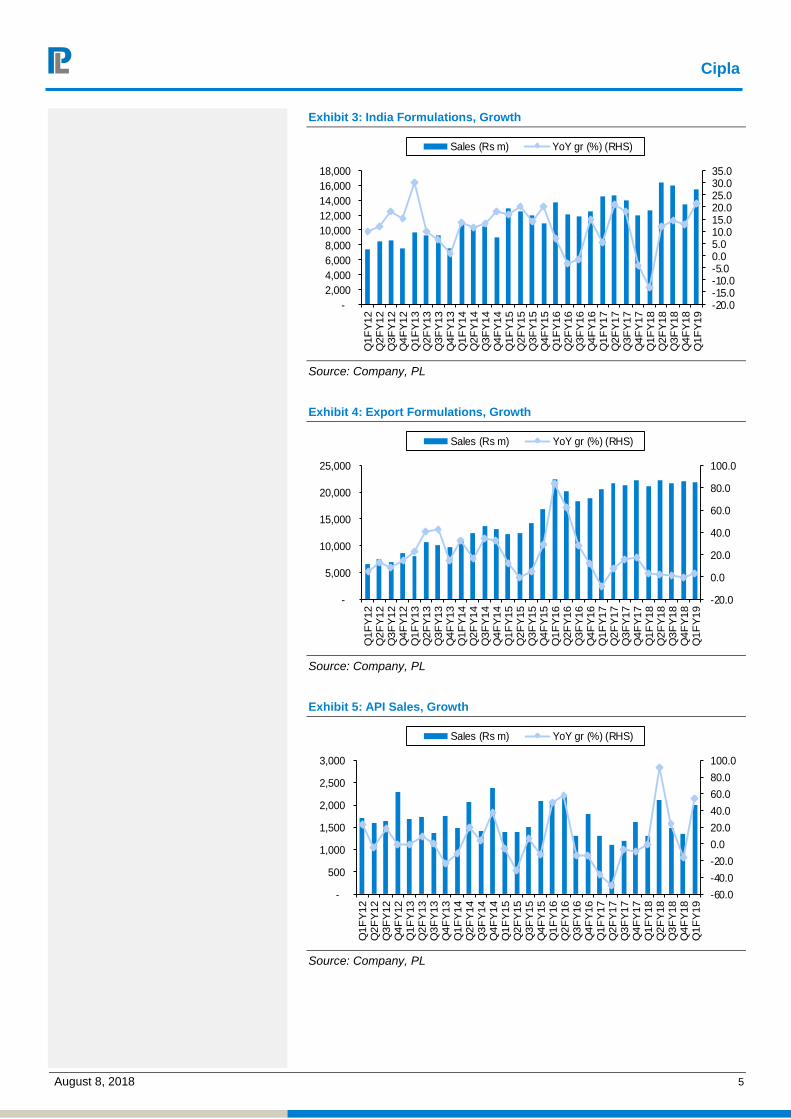
Exhibit 3: India Formulations, Growth
-20.0-15.0-10.0-5.00.05.010.015.020.025.030.035.0
-
2,000
4,000
6,000
8,000
10,000
12,000
14,000
16,000
18,000
Q1F
Y12
Q2F
Y12
Q3F
Y12
Q4F
Y12
Q1F
Y13
Q2F
Y13
Q3F
Y13
Q4F
Y13
Q1F
Y14
Q2F
Y14
Q3F
Y14
Q4F
Y14
Q1F
Y15
Q2F
Y15
Q3F
Y15
Q4F
Y15
Q1F
Y16
Q2F
Y16
Q3F
Y16
Q4F
Y16
Q1F
Y17
Q2F
Y17
Q3F
Y17
Q4F
Y17
Q1F
Y18
Q2F
Y18
Q3F
Y18
Q4F
Y18
Q1F
Y19
Sales (Rs m) YoY gr (%) (RHS)
Source: Company, PL
Exhibit 4: Export Formulations, Growth
-20.0
0.0
20.0
40.0
60.0
80.0
100.0
-
5,000
10,000
15,000
20,000
25,000
Q1F
Y12
Q2F
Y12
Q3F
Y12
Q4F
Y12
Q1F
Y13
Q2F
Y13
Q3F
Y13
Q4F
Y13
Q1F
Y14
Q2F
Y14
Q3F
Y14
Q4F
Y14
Q1F
Y15
Q2F
Y15
Q3F
Y15
Q4F
Y15
Q1F
Y16
Q2F
Y16
Q3F
Y16
Q4F
Y16
Q1F
Y17
Q2F
Y17
Q3F
Y17
Q4F
Y17
Q1F
Y18
Q2F
Y18
Q3F
Y18
Q4F
Y18
Q1F
Y19
Sales (Rs m) YoY gr (%) (RHS)
Source: Company, PL
Exhibit 5: API Sales, Growth
-60.0
-40.0
-20.0
0.0
20.0
40.0
60.0
80.0
100.0
-
500
1,000
1,500
2,000
2,500
3,000
Q1F
Y12
Q2F
Y12
Q3F
Y12
Q4F
Y12
Q1F
Y13
Q2F
Y13
Q3F
Y13
Q4F
Y13
Q1F
Y14
Q2F
Y14
Q3F
Y14
Q4F
Y14
Q1F
Y15
Q2F
Y15
Q3F
Y15
Q4F
Y15
Q1F
Y16
Q2F
Y16
Q3F
Y16
Q4F
Y16
Q1F
Y17
Q2F
Y17
Q3F
Y17
Q4F
Y17
Q1F
Y18
Q2F
Y18
Q3F
Y18
Q4F
Y18
Q1F
Y19
Sales (Rs m) YoY gr (%) (RHS)
Source: Company, PL

Cipla
August 8, 2018 6
Exhibit 6: Overall Sales, Growth
-10.0
0.0
10.0
20.0
30.0
40.0
50.0
-
5,000
10,000
15,000
20,000
25,000
30,000
35,000
40,000
45,000
Q1F
Y12
Q2F
Y12
Q3F
Y12
Q4F
Y12
Q1F
Y13
Q2F
Y13
Q3F
Y13
Q4F
Y13
Q1F
Y14
Q2F
Y14
Q3F
Y14
Q4F
Y14
Q1F
Y15
Q2F
Y15
Q3F
Y15
Q4F
Y15
Q1F
Y16
Q2F
Y16
Q3F
Y16
Q4F
Y16
Q1F
Y17
Q2F
Y17
Q3F
Y17
Q4F
Y17
Q1F
Y18
Q2F
Y18
Q3F
Y18
Q4F
Y18
Q1F
Y19
Sales (Rs m) YoY gr (%) (RHS)
Source: Company, PL
Exhibit 7: EBITDA, Margin
-
5.0
10.0
15.0
20.0
25.0
30.0
35.0
-
2,000
4,000
6,000
8,000
10,000
12,000
Q1F
Y12
Q2F
Y12
Q3F
Y12
Q4F
Y12
Q1F
Y13
Q2F
Y13
Q3F
Y13
Q4F
Y13
Q1F
Y14
Q2F
Y14
Q3F
Y14
Q4F
Y14
Q1F
Y15
Q2F
Y15
Q3F
Y15
Q4F
Y15
Q1F
Y16
Q2F
Y16
Q3F
Y16
Q4F
Y16
Q1F
Y17
Q2F
Y17
Q3F
Y17
Q4F
Y17
Q1F
Y18
Q2F
Y18
Q3F
Y18
Q4F
Y18
Q1F
Y19
EBITDA (Rs m) Margin (%) (RHS)
Source: Company, PL
Exhibit 8: Adj. PAT, Growth
-600.0
-500.0
-400.0
-300.0
-200.0
-100.0
0.0
100.0
200.0
(2,000)
(1,000)
-
1,000
2,000
3,000
4,000
5,000
6,000
7,000
Q1F
Y12
Q2F
Y12
Q3F
Y12
Q4F
Y12
Q1F
Y13
Q2F
Y13
Q3F
Y13
Q4F
Y13
Q1F
Y14
Q2F
Y14
Q3F
Y14
Q4F
Y14
Q1F
Y15
Q2F
Y15
Q3F
Y15
Q4F
Y15
Q1F
Y16
Q2F
Y16
Q3F
Y16
Q4F
Y16
Q1F
Y17
Q2F
Y17
Q3F
Y17
Q4F
Y17
Q1F
Y18
Q2F
Y18
Q3F
Y18
Q4F
Y18
Q1F
Y19
PAT (Rs m) YoY gr (%) (RHS)
Source: Company, PL

Cipla
August 8, 2018 7
Financials
Income Statement (Rs m)
Y/e Mar FY17 FY18 FY19E FY20E
Net Revenues 1,42,809 1,47,509 1,65,824 1,79,996
YoY gr. (%) 5.8 3.3 12.4 8.5
Cost of Goods Sold 53,171 50,405 56,795 58,049
Gross Profit 89,637 97,104 1,09,029 1,21,947
Margin (%) 62.8 65.8 65.8 67.8
Employee Cost 26,338 26,901 29,019 30,959
Other Expenses 10,711 10,283 13,266 14,400
EBITDA 21,264 27,559 29,848 34,289
YoY gr. (%) (2.6) 29.6 8.3 14.9
Margin (%) 14.9 18.7 18.0 19.1
Depreciation and Amortization 13,229 13,228 10,741 12,252
EBIT 8,035 14,331 19,107 22,038
Margin (%) 5.6 9.7 11.5 12.2
Net Interest 1,594 1,142 1,028 925
Other Income 5,781 8,260 7,847 7,455
Profit Before Tax 12,222 21,449 25,927 28,568
Margin (%) 8.6 14.5 15.6 15.9
Total Tax 1,798 2,501 5,704 6,285
Effective tax rate (%) 14.7 11.7 22.0 22.0
Profit after tax 10,424 18,948 20,223 22,283
Minority interest 290 60 66 73
Share Profit from Associate - - - -
Adjusted PAT 10,134 18,112 20,156 22,210
YoY gr. (%) (26.1) 78.7 11.3 10.2
Margin (%) 7.1 12.3 12.2 12.3
Extra Ord. Income / (Exp) - - - -
Reported PAT 10,134 18,112 20,156 22,210
YoY gr. (%) (26.1) 78.7 11.3 10.2
Margin (%) 7.1 12.3 12.2 12.3
Other Comprehensive Income - - - -
Total Comprehensive Income 10,134 18,112 20,156 22,210
Equity Shares O/s (m) 805 805 805 805
EPS (Rs) 12.6 22.5 25.0 27.6
Source: Company Data, PL Research
Balance Sheet Abstract (Rs m)
Y/e Mar FY17 FY18 FY19E FY20E
Non-Current Assets
Gross Block 86,579 1,02,286 1,11,286 1,20,286
Tangibles 60,346 69,438 75,438 81,438
Intangibles 26,234 32,849 35,849 38,849
Acc: Dep / Amortization 18,626 30,932 41,673 53,924
Tangibles 10,241 16,274 21,279 27,060
Intangibles 8,385 14,658 20,394 26,864
Net fixed assets 67,953 71,354 69,613 66,362
Tangibles 50,104 53,164 54,158 54,377
Intangibles 17,849 18,191 15,455 11,984
Capital Work In Progress 16,830 9,813 9,813 9,813
Goodwill 26,967 28,147 28,147 28,147
Non-Current Investments 2,889 3,574 3,809 4,144
Net Deferred tax assets (5,888) (3,157) (2,638) (2,067)
Other Non-Current Assets 6,005 5,699 6,359 7,099
Current Assets
Investments 8,374 11,022 12,675 14,577
Inventories 34,853 40,447 44,068 46,848
Trade receivables 25,631 31,025 34,073 34,520
Cash & Bank Balance 6,242 9,656 12,103 20,218
Other Current Assets 6,740 10,044 10,848 12,475
Total Assets 2,10,371 2,28,606 2,39,919 2,53,255
Equity
Equity Share Capital 1,609 1,610 1,610 1,610
Other Equity 1,23,828 1,40,682 1,58,955 1,79,283
Total Networth 1,25,437 1,42,292 1,60,566 1,80,893
Non-Current Liabilities
Long Term borrowings 36,454 36,621 29,297 23,438
Provisions 1,405 1,379 1,393 1,184
Other non current liabilities 937 933 793 674
Current Liabilities
ST Debt / Current of LT Debt 4,672 4,359 3,487 2,790
Trade payables 15,711 21,191 24,987 27,616
Other current liabilities 13,353 12,772 10,865 8,692
Total Equity & Liabilities 2,10,371 2,28,606 2,39,919 2,53,255
Source: Company Data, PL Research

Cipla
August 8, 2018 8
Cash Flow (Rs m)
Y/e Mar FY17 FY18 FY19E FY20E Year
PBT 12,222 17,470 25,927 28,568
Add. Depreciation 13,229 13,228 10,741 12,252
Add. Interest 1,594 1,142 1,028 925
Less Financial Other Income 5,781 8,260 7,847 7,455
Add. Other (1,079) (2,160) (273) (2,557)
Op. profit before WC changes 25,966 29,681 37,423 39,188
Net Changes-WC 2,354 (7,833) (5,744) (4,279)
Direct tax (4,503) (7,220) (5,704) (6,285)
Net cash from Op. activities 23,818 14,628 25,975 28,624
Capital expenditures (10,982) (7,395) (9,000) (9,000)
Interest / Dividend Income 121 332 - -
Others (2,241) (1,477) (1,800) (2,144)
Net Cash from Invt. activities (13,102) (8,540) (10,800) (11,144)
Issue of share cap. / premium 120 1 - -
Debt changes (10,803) (345) (8,196) (6,557)
Dividend paid (1,936) (1,893) (1,883) (1,883)
Interest paid (1,594) (1,178) (1,028) (925)
Others 1,019 (242) - -
Net cash from Fin. activities (13,194) (3,656) (11,107) (9,365)
Net change in cash (2,478) 2,431 4,068 8,115
Free Cash Flow 12,835 7,233 16,975 19,624
Source: Company Data, PL Research
Quarterly Financials (Rs m)
Y/e Mar Q2FY18 Q3FY18 Q4FY18 Q1FY19
Net Revenue 39,882 38,345 34,958 38,458
YoY gr. (%) - - - 12.0
Raw Material Expenses 15,531 13,784 13,303 14,239
Gross Profit 24,352 24,561 21,656 24,219
Margin (%) 61.1 64.1 61.9 63.0
EBITDA 7,102 7,393 3,547 6,332
YoY gr. (%) 28.3 4.1 (52.0) 78.5
Margin (%) 17.8 19.3 10.1 16.5
Depreciation / Depletion 3,022 5,224 2,848 2,410
EBIT 4,080 2,170 699 3,922
Margin (%) 10.2 5.7 2.0 10.2
Net Interest 420 92 352 351
Other Income 2,075 1,323 2,422 2,633
Profit before Tax 5,735 3,401 2,769 6,204
Margin (%) 14.4 8.9 7.9 16.1
Total Tax 1,374 (642) 462 1,737
Effective tax rate (%) 24.0 (18.9) 16.7 28.0
Profit after Tax 4,361 4,043 2,307 4,467
Minority interest 135 38 (254) (46)
Share Profit from Associates - - - -
Adjusted PAT 4,226 4,005 1,786 4,513
YoY gr. (%) - - - 10.4
Margin (%) 10.6 10.4 5.1 11.7
Extra Ord. Income / (Exp) - - - -
Reported PAT 4,226 4,005 1,786 4,513
YoY gr. (%) - - - 10.4
Margin (%) 10.6 10.4 5.1 11.7
Other Comprehensive Income - - - -
Total Comprehensive Income 4,226 4,005 1,786 4,513
Avg. Shares O/s (m) 805 805 805 805
EPS (Rs) 5.2 5.0 2.2 5.6
Source: Company Data, PL Research
Key Financial Metrics
Y/e Mar FY17 FY18 FY19E FY20E
Per Share(Rs)
EPS 12.6 22.5 25.0 27.6
CEPS 29.0 38.9 38.4 42.8
BVPS 155.9 176.7 199.4 224.7
FCF 16.0 9.0 21.1 24.4
DPS 2.1 2.0 2.0 2.0
Return Ratio(%)
RoCE 8.3 12.9 14.3 14.7
ROIC 10.1 12.1 12.4 13.5
RoE 8.4 13.5 13.3 13.0
Balance Sheet
Net Debt : Equity (x) 0.2 0.1 0.0 0.0
Net Working Capital (Days) 114 124 117 109
Valuation(x)
PER 50.2 28.1 25.3 22.9
P/B 4.1 3.6 3.2 2.8
P/CEPS 29.0 38.9 38.4 42.8
EV/EBITDA 25.2 19.2 17.3 14.6
EV/Sales 3.7 3.6 3.1 2.8
Dividend Yield (%) 0.3 0.3 0.3 0.3
Source: Company Data, PL Research
Key Operating Metrics
Y/e Mar FY17 FY18 FY19E FY20E
India Formulations 56,064 57,886 64,832 71,315
Exports 86,834 84,379 99,287 1,10,507
APIs 7,011 6,520 7,303 8,033
Source: Company Data, PL Research

Cipla
August 8, 2018 9
Price Chart Recommendation History
No. Date Rating TP (Rs.) Share Price (Rs.)
1 12-Aug-17 Reduce 485 543
2 09-Oct-17 Reduce 396 585
3 07-Nov-17 Reduce 485 608
4 10-Jan-18 Reduce 485 613
5 07-Feb-18 Reduce 526 566
6 13-Apr-18 Reduce 526 555
7 23-May-18 Reduce 525 524
8 10-Jul-18 Reduce 525 640
Analyst Coverage Universe
Sr. No. CompanyName Rating TP (Rs) Share Price (Rs)
1 Aurobindo Pharma BUY 909 600
2 Cadila Healthcare Accumulate 437 387
3 Cipla Reduce 525 640
4 Dr. Lal PathLabs Accumulate 1,009 941
5 Dr. Reddy's Laboratories Reduce 1,766 2,133
6 Eris Lifesciences Accumulate 885 703
7 Glenmark Pharmaceuticals Reduce 472 589
8 Indoco Remedies Reduce 184 180
9 Ipca Laboratories BUY 829 679
10 Jubilant Life Sciences Accumulate 880 795
11 Lupin Reduce 727 903
12 Sun Pharmaceutical Industries Reduce 484 574
13 Thyrocare Technologies BUY 795 627
PL’s Recommendation Nomenclature (Absolute Performance)
Buy : > 15%
Accumulate : 5% to 15%
Hold : +5% to -5%
Reduce : -5% to -15%
Sell : < -15%
Not Rated (NR) : No specific call on the stock
Under Review (UR) : Rating likely to change shortly
465
536
607
679
750
Au
g-1
5
Feb
-16
Au
g-1
6
Feb
-17
Au
g-1
7
Jan
-18
Jul-
18
(Rs)
Cipla
August 8, 2018 10
ANALYST CERTIFICATION
(Indian Clients)
We/I, Mr. Surajit Pal- PGDBA, CFA, M.Com Research Analysts, authors and the names subscribed to this report, hereby certify that all of the views expressed in this research report accurately reflect our views about the subject issuer(s) or securities. We also certify that no part of our compensation was, is, or will be directly or indirectly related to the specific recommendation(s) or view(s) in this report.
(US Clients)
The research analysts, with respect to each issuer and its securities covered by them in this research report, certify that: All of the views expressed in this research report accurately reflect his or her or their personal views about all of the issuers and their securities; and No part of his or her or their compensation was, is or will be directly related to the specific recommendation or views expressed in this research report.
DISCLAIMER
Indian Clients
Prabhudas Lilladher Pvt. Ltd, Mumbai, India (hereinafter referred to as “PL”) is engaged in the business of Stock Broking, Portfolio Manager, Depository Participant and distribution for third party financial products. PL is a subsidiary of Prabhudas Lilladher Advisory Services Pvt Ltd. which has its various subsidiaries engaged in business of commodity broking, investment banking, financial services (margin funding) and distribution of third party financial/other products, details in respect of which are available at www.plindia.com.
This document has been prepared by the Research Division of PL and is meant for use by the recipient only as information and is not for circulation. This document is not to be reported or copied or made available to others without prior permission of PL. It should not be considered or taken as an offer to sell or a solicitation to buy or sell any security.
The information contained in this report has been obtained from sources that are considered to be reliable. However, PL has not independently verified the accuracy or completeness of the same. Neither PL nor any of its affiliates, its directors or its employees accepts any responsibility of whatsoever nature for the information, statements and opinion given, made available or expressed herein or for any omission therein.
Recipients of this report should be aware that past performance is not necessarily a guide to future performance and value of investments can go down as well. The suitability or otherwise of any investments will depend upon the recipient's particular circumstances and, in case of doubt, advice should be sought from an independent expert/advisor.
Either PL or its affiliates or its directors or its employees or its representatives or its clients or their relatives may have position(s), make market, act as principal or engage in transactions of securities of companies referred to in this report and they may have used the research material prior to publication.
PL may from time to time solicit or perform investment banking or other services for any company mentioned in this document.
PL is in the process of applying for certificate of registration as Research Analyst under Securities and Exchange Board of India (Research Analysts) Regulations, 2014
PL submits that no material disciplinary action has been taken on us by any Regulatory Authority impacting Equity Research Analysis activities.
PL or its research analysts or its associates or his relatives do not have any financial interest in the subject company.
PL or its research analysts or its associates or his relatives do not have actual/beneficial ownership of one per cent or more securities of the subject company at the end of the month immediately preceding the date of publication of the research report.
PL or its research analysts or its associates or his relatives do not have any material conflict of interest at the time of publication of the research report.
PL or its associates might have received compensation from the subject company in the past twelve months.
PL or its associates might have managed or co-managed public offering of securities for the subject company in the past twelve months or mandated by the subject company for any other assignment in the past twelve months.
PL or its associates might have received any compensation for investment banking or merchant banking or brokerage services from the subject company in the past twelve months.
PL or its associates might have received any compensation for products or services other than investment banking or merchant banking or brokerage services from the subject company in the past twelve months
PL or its associates might have received any compensation or other benefits from the subject company or third party in connection with the research report.
PL encourages independence in research report preparation and strives to minimize conflict in preparation of research report. PL or its analysts did not receive any compensation or other benefits from the subject Company or third party in connection with the preparation of the research report. PL or its Research Analysts do not have any material conflict of interest at the time of publication of this report.
It is confirmed that Mr. Surajit Pal- PGDBA, CFA, M.Com Research Analysts of this report have not received any compensation from the companies mentioned in the report in the preceding twelve months
Compensation of our Research Analysts is not based on any specific merchant banking, investment banking or brokerage service transactions.
The Research analysts for this report certifies that all of the views expressed in this report accurately reflect his or her personal views about the subject company or companies and its or their securities, and no part of his or her compensation was, is or will be, directly or indirectly related to specific recommendations or views expressed in this report.
The research analysts for this report has not served as an officer, director or employee of the subject company PL or its research analysts have not engaged in market making activity for the subject company
Our sales people, traders, and other professionals or affiliates may provide oral or written market commentary or trading strategies to our clients that reflect opinions that are contrary to the opinions expressed herein, and our proprietary trading and investing businesses may make investment decisions that are inconsistent with the recommendations expressed herein. In reviewing these materials, you should be aware that any or all o the foregoing, among other things, may give rise to real or potential conflicts of interest.
PL and its associates, their directors and employees may (a) from time to time, have a long or short position in, and buy or sell the securities of the subject company or (b) be engaged in any other transaction involving such securities and earn brokerage or other compensation or act as a market maker in the financial instruments of the subject company or act as an advisor or lender/borrower to the subject company or may have any other potential conflict of interests with respect to any recommendation and other related information and opinions.
US Clients
This research report is a product of Prabhudas Lilladher Pvt. Ltd., which is the employer of the research analyst(s) who has prepared the research report. The research analyst(s) preparing the research report is/are resident outside the United States (U.S.) and are not associated persons of any U.S. regulated broker-dealer and therefore the analyst(s) is/are not subject to supervision by a U.S. broker-dealer, and is/are not required to satisfy the regulatory licensing requirements of FINRA or required to otherwise comply with U.S. rules or regulations regarding, among other things, communications with a subject company, public appearances and trading securities held by a research analyst account.
This report is intended for distribution by Prabhudas Lilladher Pvt. Ltd. only to "Major Institutional Investors" as defined by Rule 15a-6(b)(4) of the U.S. Securities and Exchange Act, 1934 (the Exchange Act) and interpretations thereof by U.S. Securities and Exchange Commission (SEC) in reliance on Rule 15a 6(a)(2). If the recipient of this report is not a Major Institutional Investor as specified above, then it should not act upon this report and return the same to the sender. Further, this report may not be copied, duplicated and/or transmitted onward to any U.S. person, which is not the Major Institutional Investor.
In reliance on the exemption from registration provided by Rule 15a-6 of the Exchange Act and interpretations thereof by the SEC in order to conduct certain business with Major Institutional Investors, Prabhudas Lilladher Pvt. Ltd. has entered into an agreement with a U.S. registered broker-dealer, Marco Polo Securities Inc. ("Marco Polo").
Transactions in securities discussed in this research report should be effected through Marco Polo or another U.S. registered broker dealer.
Prabhudas Lilladher Pvt. Ltd. 3rd Floor, Sadhana House, 570, P. B. Marg, Worli, Mumbai-400 018, India | Tel: (91 22) 6632 2222 Fax: (91 22) 6632 2209
www.plindia.com | Bloomberg Research Page: PRLD <GO>