Cingranelli-Richards (CIRI) Human Rights...
28
(28) Producer: David Cingranelli, Binghamton University, Binghamton, NY USA. David L. Richards, ETS, Princeton, NJ USA Stated purpose: The data set is designed to provide an indicator of government human rights practices. Funding source: The National Science Foundation (USA), The World Bank Current usage: These data are of use to scholars engaging in analyses of the correlates, determi- nants and consequences of government respect for internationally recognized human rights. Where to find it: Publications, replication data, working papers, and a bibliography of use are now available at www.humanrightsdata.com. All CIRI data was made available free to the public at this site on August 1, 2004. The CIRI dataset is currently being cleaned and made ready for mass distribution. Type of data used: Expert coding of primary sources from US State Department and Amnesty Interna- tional. US State Department used for most indicators, with Amnesty International evidence being the primary source for Physical Integrity rights (freedom from extra- judicial killing, disappearance, torture, and political imprisonment). Coverage: 161 states Timeliness: First data 1981-2000 Latest data 2004 Contact details: David L. Cingranelli David L. Richards Dept Political Science ETS Binghamton University Rosedale Road MS 36-N Binghamton, NY 13902-6000 Princeton, NJ 08541 (607) 777-2435 (609) 683-2246 [email protected] [email protected] Methodology: Probabilistic polychotomous cumulative scaling is used to construct additive ordi- nal indices from individual ordinal CIRI human rights indicators. Scales: Individual Indicators: Most individual indicators in the CIRI dataset range from 0 (no respect for a right) to 2 (full respect for a right). Check for the scale for each individual indicator via the website, since some have larger ranges. Aggregated Indices: The “Physical Integrity Rights” scale is created from four individual indicators (the rights to freedom from extrajudicial killing, disappearance, torture, and political imprisonment), and ranges from 0 (no respect for any of these four rights) to 8 (full respect for all four of these rights). The “Empowerment Rights” scale is created from five individual indicators (the rights to freedom of movement, political participation, workers’ rights, freedom of Cingranelli-Richards (CIRI) Human Rights Database Indic_guide.indd 28 3/12/07 5:38:50 AM
Transcript of Cingranelli-Richards (CIRI) Human Rights...

(28)
Producer: David Cingranelli, Binghamton University, Binghamton, NY USA. David L. Richards, ETS, Princeton, NJ USA
Stated purpose: The data set is designed to provide an indicator of government human rights practices.
Funding source: The National Science Foundation (USA), The World Bank
Current usage: These data are of use to scholars engaging in analyses of the correlates, determi-nants and consequences of government respect for internationally recognized human rights.
Where to find it: Publications, replication data, working papers, and a bibliography of use are now available at www.humanrightsdata.com. All CIRI data was made available free to the public at this site on August 1, 2004. The CIRI dataset is currently being cleaned and made ready for mass distribution.
Type of data used: Expert coding of primary sources from US State Department and Amnesty Interna-tional. US State Department used for most indicators, with Amnesty International evidence being the primary source for Physical Integrity rights (freedom from extra-judicial killing, disappearance, torture, and political imprisonment).
Coverage: 161 states
Timeliness: First data 1981-2000 Latest data 2004
Contact details: David L. Cingranelli David L. Richards Dept Political Science ETS Binghamton University Rosedale Road MS 36-N Binghamton, NY 13902-6000 Princeton, NJ 08541 (607) 777-2435 (609) 683-2246 [email protected] [email protected]
Methodology: Probabilistic polychotomous cumulative scaling is used to construct additive ordi-nal indices from individual ordinal CIRI human rights indicators.
Scales: Individual Indicators: Most individual indicators in the CIRI dataset range from 0 (no respect for a right) to 2 (full respect for a right). Check for the scale for each individual indicator via the website, since some have larger ranges.
Aggregated Indices: The “Physical Integrity Rights” scale is created from four individual indicators (the rights to freedom from extrajudicial killing, disappearance, torture, and political imprisonment), and ranges from 0 (no respect for any of these four rights) to 8 (full respect for all four of these rights).
The “Empowerment Rights” scale is created from five individual indicators (the rights to freedom of movement, political participation, workers’ rights, freedom of
Cingranelli-Richards (CIRI) Human Rights Database
Indic_guide.indd 28 3/12/07 5:38:50 AM

(29)ExTRAjUDICIAl kIllINGS DISAPPEARANCES TORTURE POlITICAl
IMPRISONMENT
Afghanistan 1987 0 0 0 0
Albania 1987 2 2 1 0
Algeria 1987 1 2 1 1
Angola 1987 0 2 1 0
Argentina 1987 1 2 2 1
Australia 1987 2 2 2 2
Austria 1987 2 2 2 2
Bahrain 1987 2 2 1 0
Bangladesh 1987 0 2 1 1
Belgium 1987 2 2 2 2
Belize 1987 2 2 1 2
Benin 1987 1 2 1 1
Bhutan 1987 2 2 2 2
Bolivia 1987 2 2 1 1
Botswana 1987 2 2 1 2
Brazil 1987 0 2 1 1
Brunei 1987 2 2 2 1
Bulgaria 1987 1 2 0 0
Burkina Faso 1987 1 2 2 0
Burundi 1987 1 2 1 0
Cambodia 1987 1 1 0 0
Cameroon 1987 1 2 2 1
expression, and freedom of religion) and ranges from 0 (no respect for any of these five rights) to 10 (full respect for all five of these rights).
Example results: The table below shows a selection of individual physical integrity rights indicators for selected countries for the year 1987.
Valid use: These data are of use to scholars engaging in analyses of the correlates, determi-nants and consequences of government respect for internationally recognized human rights.
Invalid use: CIRI data are not for use in analysing overall human rights conditions – only human rights practices by government. Human rights conditions refer to the overall level of enjoyment of human rights by citizens, and non-state actors can affect this level. Human rights practices refer to the actions of governments affecting citizen enjoy-ment of human rights. CIRI data only
Assumption: Since CIRI contains standards-based data (except for economic rights), its coding methodology implies that the sources from which these data are drawn are com-plete and accurate.
Indic_guide.indd 29 3/12/07 5:38:51 AM

(30)
Producer: Center for Global Development
Stated purpose: To draw attention to the many ways in which rich countries can positively influ-ence development.
Funding source: Rockefeller Foundation and 11 donor governments which are part of the Center for Global Development Consortium.
Current usage: Widely quoted as a measure of donor policies’ impact on developing countries.
Where to find it: www.cgdev.org/cdi
Type of data used: Varied. Mostly administrative data is used. Almost no perception data is used.
Coverage: 21 countries (Members of the OECD Development Assistance Committee except Luxembourg)
Time coverage: First data: Collected between 1995 and 2001 Latest data: Collected in 2004 and published in 2006. Stated Frequency: Updated annually
Contact details: [email protected] 1776 Massachusetts Avenue NW, Washington DC 20036, USA
Methodology: The index is formed from 7 components. Each uses the best available data and weights it according to the prevailing wisdom concerning aid and policy effective-ness. The overall index is a simple average of the scores for each component.
Format of results: The final results are produced in the form of scores where the average (for each component across all countries assessed) is constrained to 5. A higher score is desir-able. There are no fixed ends to the scale used and negative values are possible.
Example results: The table on the following page shows a selection of results.
Valid use: This is an unusual indicator in that it brings together so many aspects of policies and expenditures which can affect development. As such it makes a useful advo-cacy tool for a ‘joined up’ approach to development.
Invalid use: The index has some weaknesses, the greatest being uncertainty about the relative importance of various policies.
Assumptions: The index is compiled based upon a series of assumptions. The key ones by com-ponent are:
Aid: This component assumes that the best situation is targeted (poor but well governed countries), untied aid given in large chunks (small projects being less efficient and more burdensome on the recipient). The value of aid given to countries is discounted using the World Bank KKZ governance
»
Commitment to Development Index
Indic_guide.indd 30 3/12/07 5:38:52 AM

(31)
indicators. This assumes that the quality of national governance affects the quality of aid.
Trade: Agricultural subsidies of EU members are assumed to be in proportion to their contribution to the Common Agricultural Policy fund.
Investment in developing countries is assumed to be related to government policies which insure, screen, prevent double taxation, prevent corrupt prac-tices abroad and have open policies concerning pension fund investment in developing countries.
Migration: Migration is assumed to be good for development through access to labour markets and remittances of migrant labour to their home country. Immigrant numbers are 65% of the resulting migration score, foreign students 15% and 20% for aid to refugees.
Environment: Now assessed as 50% global climate, 10% sustainable fisheries, 40% biodiversity and global ecosystems.
Security: This component is assessed by a variety of costs which relate to peace and security operations. It is assumed that only those endorsed by the UN Security Council, NATO or the African Union are for development pur-poses. All other costs are excluded. Any late UN endorsement (as in Iraq) will substantially boost countries’ CDI score.
Technology: Investment in research and development for military purposes is assumed to have 50% of the value of non-military purposes.
Overall Index: Each of the above components is assumed to be equally impor-tant in the final commitment measure.
»
»
»
»
»
»
»
Aid Trade Investment Migration Environment Security Technology
2006 Commitment to Development Index
Indic_guide.indd 31 3/12/07 5:38:53 AM

(32)
Producer: Transparency International
Stated purpose: To provide data on ‘corruption in international business transactions’
Funding source: Combination of public, private sector and foundations
Current usage: The index is used by a wide range of agencies as a measure of corruption. The results are widely publicised each year, making front page headlines in many countries. Some donors also use the index within their allocation models.
Where to find it: Available from the Transparency International internet site: www.transparency.org/policy_research/surveys_indices/cpi
Type of data used: It is a composite index, drawing on 12 polls and surveys from 9 independent insti-tutions, which gathered the opinions of business people and country analysts.
The key criterion for a data source to be used is that it must provide for a ranking of nations. This means methodological comparability across countries for any one input source.
Coverage: 163 countries globally.
Time coverage: First data: Earliest data used dates from 1980. Latest data: Collected in 2006. Stated frequency: Annual.
Contact details: In addition to Transparency International’s website, further information on methodology can be obtained from: Dr Johann Graf Lambsdorff (TI Adviser and director of the statistical work on the CPI). Passau University, Germany, Tel: +49-851-5092551.
Corruption Perceptions Index
Freedom House – Nations in transit
Economist Intelligence Unit
Price Waterhouse Coopers – The Opacity Index
Institute for Management Develop-ment, Lausanne
Political and Economic Risk Consultancy
World Business Environment Survey (World Bank)
»
»
»
»
»
»
World Economic Forum
State Capacity Survey – Columbia University
Gallup International on behalf of TI
A Multilateral Development Bank
Business Environment and Enterprise Performance Survey
World Markets Research Centre
Information International
»
»
»
»
»
»
»
Indic_guide.indd 32 3/12/07 5:38:54 AM

(33)
RANk COUNTRY 200� CPI SCORE SURVEYS USED CONFIDENCE RANGE
1 Finland 9.6 7 9.4 - 9.7
1 Iceland 9.6 6 9.5 - 9.7
1 New Zealand 9.6 7 9.4 - 9.6
4 Denmark 9.5 7 9.4 - 9.6
5 Singapore 9.4 9 9.2 - 9.5
156 Sudan 2.0 4 1.8 - 2.2
160 Guinea 1.9 3 1.7 - 2.1
160 Iraq 1.9 3 1.6 - 2.1
160 Myanmar 1.9 3 1.8 - 2.3
163 Haiti 1.8 3 1.7 - 1.8
Methodology: Details of the questions asked by each of the data sources are available in the background paper on the website, released at the same time as the index. The base assumption used is that overall levels of corruption globally are unchanged from year to year. All data sources ask qualitative questions to determine the level of corruption. Note that some data sources (Economist Intelligence Unit, Freedom House) use exclusively external assessors based outside the country rated.
Scales: The scale runs from 0 to 10.0 with 10.0 being ‘highly clean’ and 0 being ‘highly corrupt’.
Example results: The table below shows the 2006 top 5 ’clean countries’ together with the 5 ‘most corrupt’ countries indicated in the Corruption Perception Index.
Valid use: This measure will be influential in the ability of countries to attract foreign invest-ment. Its purpose is to measure corruption in international business transactions. Many sources concentrate on occasions when corruption occurs whilst doing business – such as obtaining export permits. The questions in the global com-petitiveness report ask about the need to make undocumented extra payments in connection with public utilities. This particular question will become less relevant as states step out of providing utilities.
Invalid use: This cannot be used as a measure of national performance in combating corrup-tion. This is because countries themselves cannot change their rating. The index is about relative positions. If all countries combated corruption to the same extent, under the basic methodological assumption used, countries would retain the same score.
Indic_guide.indd 33 3/12/07 5:38:54 AM

(34)
Producer: World Bank
Stated purpose: The Country Policy and Institutional Assessment (CPIA) aims to assess the quality of a country’s present policy and institutional framework. ‘Quality’ refers to how conducive that framework is to fostering poverty reduction, sustainable growth and the effective use of development assistance.
Funding source: World Bank
Current usage: CPIA ratings, or the overall country score, are used for informing country assistance strategies and World Bank loaning activities. The CPIA country scores were made public in June 2006 and are increasingly used by the media and development actors.
Where to find it: The CPIA rating, or overall country score based on the results of the CPIA is called the IDA Resource Allocation Index (IRAI). The 2005 country scores can be found at this link: http://web.worldbank.org/WBSITE/EXTERNAL/EXTABOUTUS/ IDA/0,,contentMDK:20933600~menuPK:2626968~pagePK:51236175~ piPK:437394~theSitePK:73154,00.html
Type of data used: The CPIA is based on the analytical work that is done in the Bank as well as informa-tion coming from other sources produced by organisations both within countries (administrative data etc) as well as regional and international organisations. Data is also collected from consultations with national stakeholders within the countries being assessed.
Coverage: 78 countries.
Time coverage: First data: collected in the 1970s (but not publicly available) Latest data: collected in 2006 (first made publicly available) Stated frequency: Annual
Contact details: The World Bank 1818 H Street, NW Washington, DC 20433 USA Tel: +1 (202) 473-1000
Methodology: The CPIA rates countries against a set of 16 criteria grouped in four clusters: (a) economic management; (b) structural policies; (c) policies for social inclusion and equity; and (d) public sector management and institutions. For each of the 16 criteria, countries are rated on a scale of 1 (low) to 6 (high). The scores depend on the level of performance in a given year assessed against the criteria, rather than on changes in performance compared to the previous year. Bank staff assess the country’s actual performance on each of the criteria, and assign a rating. These scores are averaged—first to yield the cluster score, and then to determine a composite country rating as the average of the four clusters. The ratings reflect a variety of indicators, observations, and judgements based on country knowledge, originated in the Bank or elsewhere, and on relevant publicly available indicators.
Country Policy and Institutional Assessment
Indic_guide.indd 34 3/12/07 5:38:55 AM

(35)
The ratings depend on actual policies and performance, rather than on promises or intentions. A copy of the 2005 questionnaire is available at: http://siteresources.worldbank.org/IDA/Resources/CPIA2005Questionnaire.pdf
Example results: The table below shows results across two of the cluster areas: ‘structural policies’ and ‘public sector management and institutions’ for selected countries in 2005.
Valid use: The IDA Resource Allocation Index (IRAI) provides an overview of key features of a country’s institutional and policy framework.
Invalid use: The CPIA ratings are focused on policies and institutions rather than outcomes. They are also based on actual not planned policies and represent a snapshot of country policies and institutions at a particular point in time. The CPIA ratings are produced by World Bank staff and reflect the biases and assumptions of what con-stitutes good policy and institutions of the organisation to which they belong.
2005 IDA Resource Allocation Index (IRAI)
B. STRUCTURAl POlICIES D. PUBlIC SECTOR MANAGEMENT AND INSTITUTIONS
4 5 6 12 13 14 15 16
No. Country Trade Financial Sector
Business Regulatory
Environ.Ave.
Property Rights & Rule-based
Govern.
Quality of Budget. &
Finan. Mgt.
Effic.of Rev-enue Mobil.
Quality of Public
Admin.
Transpar., Account. & Corrup.in Pub. Sec.
Ave.
1 Albania 4.5 4.0 3.5 4.0 3.0 4.0 3.5 3.0 3.0 3.3
2 Angola 4.0 2.5 2.0 2.8 2.0 2.5 2.5 2.5 2.5 2.4
3 Armenia 4.5 3.5 4.0 4.0 3.5 4.0 4.0 4.0 3.5 3.8
4 Azerbaijan 4.0 3.0 3.5 3.5 3.0 4.0 3.5 3.0 2.5 3.2
5 Bangladesh 3.0 3.0 3.5 3.2 3.0 3.0 3.0 3.0 2.5 2.9
� Benin 4.5 3.5 4.0 4.0 3.0 4.0 3.5 3.0 3.5 3.4
� Bhutan 3.0 3.0 3.5 3.2 3.5 3.5 4.0 4.0 4.0 3.8
8 Bolivia 5.0 3.5 3.0 3.8 2.5 3.5 4.0 3.5 3.0 3.3
9 Bosnia and Herzegovina 4.0 4.0 3.5 3.8 3.0 3.5 4.0 3.0 3.0 3.3
Indic_guide.indd 35 3/12/07 5:38:56 AM

(3�)
Producer: The East Asia Barometer Network which includes a network of scholars from local and global universities sponsored by national and international agencies.
Stated purpose: The project is designed to present a systematic comparative survey of attitudes towards political values, democracy, and governance around the East Asia region. As a result, the project also aims to boost capacity for democracy studies, and to foster a network of this kind in the region.
Funding source: Coordination, data archiving and collaborative aspects are funded through research grants by the government agency of Taiwan. Each participating country team is responsible for the partial or full cost of the data collection activities.
Current usage: Assess levels of popular support for democratic form of government and belief in its legitimacy across the region. Assess the process through which citizens acquire and internalize democratic values and orientation. Engage the Asian Values’ debate within and beyond the region.
Where to find it: Data are available on request at the two websites of the East Asia Barometer: http://eacsurvey.law.ntu.edu.tw/chinese/index.htm and Asian Barometer Sur-vey http://www.asianbarometer.org/ Data is also published in academic publications.
Type of data used: Opinions and attitudes of individual respondents.
Coverage: Hong Kong, China, Japan, Indonesia, Thailand, Taiwan, South Korea, the Philip-pines, Mongolia, Singapore, Cambodia, Vietnam.
Time coverage: First wave of data collected in 2001-2002. Second wave: collected in 2005-2007. Stated frequency: more surveys are planned.
Contact details: Contact: Professor Yun-han Chu, Principal Director, Department of Political Science, National Taiwan University (NTU), Taipei, TAIWAN 10020 Email: [email protected]; [email protected].
Methodology: Data is gathered through face to face interviews. Note that barometer surveys exist in many regions. This one is tailored to the East Asian situation. This means that some questions which appear elsewhere are not included. For example, ‘Trust in Churches’ is not covered in Asia or Africa.
Format of results: Results are presented as %, always positive (i.e. % approving of, trusting in, partici-pating in, etc.)
East Asia Barometer
Indic_guide.indd 36 3/12/07 5:38:56 AM

(3�)
Example results: The table below shows results for selected countries in 2005.
Valid uses: The surveys provide a wide ranging snapshot of opinions across the participating countries and topics. Within the questionnaire there are some questions which cover direct experiences, however the results for these are not easily obtainable at present. The questions on political participation are deeper than comparable sur-veys and provide a broader range of results concerning democratic behaviours.
Invalid use: Note carefully the precise question which you are using the data for. For example there are two distinct questions concerning corruption. The first asks an opinion concerning how widespread the respondent thinks corruption is, the second asks whether the respondent has ever witnessed any corrupt act.
Assumptions: Some of the questions include ‘false’ choices. For example, ‘which is more impor-tant, democracy or economic development?’ Such a choice could be seen to assume that one is possible without the other.
COUNTRY YEAR OF lAST SURVEY
% PERSONS ExPRESSING TRUST IN
PARlIAMENT POlICE POlITICAl PARTIES COURTS MIlITARY TV NEWS-
PAPERS
Hong kong 2005/6 62 N/A 29 82 82 67 N/A
japan 2005/6 14 50 10 68 54 52 N/A
korea 2005/6 15 50 15 51 59 77 75
Mongolia 2005/6 61 48 42 47 68 80 40
China 2005/6 99 74 99 82 98 91 85
Philippines 2005/6 45 46 35 50 54 64 54
Taiwan 2005/6 24 49 19 51 70 48 39
Thailand 2005/6 60 58 50 74 80 80 57
Indic_guide.indd 37 3/12/07 5:38:57 AM

(38)
Producer: International Institute for Democracy and Electoral Assistance (IDEA) and Stock-holm University’s Department of Political Science.
Stated purpose: To provide data on quotas for women in public elections, together with the pro-portion of seats occupied by women. Also provides detailed case studies on the use of quotas in thirty countries around the world.
Funding source: International IDEA
Current usage: The website collates data from all countries where quotas are known to be used to increase the representation of women in legislatures. Details are provided concerning the types of quota (electoral law, constitutional or political party + constitutional or legislative quotas for sub-national government).
Where to find it: Available on the internet at www.quotaproject.org
Type of data used: This is a composite database bringing together data from the best available sources. All known quotas are included, regardless of the status of the most recent election of the country to which they relate. Viewers and users are invited to sub-mit any new information which they are aware of for possible inclusion within the database.
Time coverage: First data/latest data: Depends on date of last election in each country concerned.
Stated frequency: Will be continuously updated until 2006
Contact details: International IDEA Strömsborg, S-103 34 Stockholm Sweden Email: [email protected] or [email protected] This is a collaborative project with the department of political science at Stock-holm University.
Methodology: The data is drawn from constitutions and electoral laws, parliamentary websites and secondary sources. Calculations are not made, this being a data harvesting exercise. The individual data source for each country is shown in each case.
Format of results: The quotas are expressed both as percentages and numbers of seats reserved for women. In addition, some political parties set targets for the proportions of candi-dates who must be women.
Example results: The table on the following page shows a selection of results for some countries.
Valid uses: The information in the database facilitates the study of quotas and their impact. IDEA hopes that the database will be valuable to those who work to increase women’s political representation. Further information about additional reasons for
Electoral Quotas for Women Database
Indic_guide.indd 38 3/12/07 5:38:59 AM

(39)
the increase (or decrease) in female political representation is provided through a series of country case studies.
Invalid use: This cannot be used to draw conclusions about the functioning of the democratic process without further information. It would be important to know about the existence of female candidates and the platform upon which they stood (if dif-ferent to male candidates). In addition, issues such as voter turnout could have affected the results in the database.
Assumptions: To use this data as a proxy for the representation of women’s issues within the democratic system of a country would imply an assumption that women’s issues are uniquely, or better covered by female representatives
COuNtRy
yEa
R O
F la
St
ElEC
tiO
N ElECtORal SyStEm QuOta tyPE RESult
% O
F w
Om
EN
iN P
aRl
iam
ENt
Rwanda 2003 FPTP (First Past the Post) (Plurality)
Constitutional Quota for National Parliaments; Election Law Quota Regulation, National Parliament; Constitutional or Legislative Quota, Sub-National Level
39 of 80 48.8%
Sweden 2002List PR (List
Proportional Representation)
Political Party Quota for Electoral Candidates 157 of 349 45.0%
Denmark 2001 List PR Quotas existed previously or quota legislation has been proposed 68 of 179 38.0%
Netherlands 2003 List PR Political Party Quota for Electoral Candidates 55 of 150 36.7%
Norway 2001 List PR Political Party Quota for Electoral Candidates 60 of 165 36.4%
Costa Rica 2002 List PR Election Law Quota Regulation, National Parliament; Political Party Quota for Electoral Candidates 20 of 57 35.1%
Indonesia 1999 List PR Election Law Quota Regulation, National Parliament 44 of 500 8.8%
Greece 2000 List PR Sub-National Level; Political Party Quota for Electoral Candidates 26 of 300 8.7%
Algeria 2002 List PR Political Party Quota for Electoral Candidates 24 of 389 6.2%
Sierra leone 2002 FPTP Quotas existed previously or quota legislation has been proposed N/A of 80 N/A
Iraq 2004 TRS (Majoity) (2 Round System)
Constitutional Quota for National Parliaments; Election Law Quota Regulation, National Parliament 0 0.0%
Afghanistan 2004 FPTP (Plurality) Constitutional Quota for National Parliaments N/A N/A
Indic_guide.indd 39 3/12/07 5:38:59 AM

(40)
Producer: European Commission
Stated purpose: To monitor public opinion in the European Union on issues relating to European integration, attitudes towards the EU, its institutions and its policies.
Funding source: European Commission
Current usage: The Eurobarometer (EB) is widely cited in the media. EU policy makers often take EB-results into account when preparing decisions.
Where to find it: The EB is published by the European Commission: http://europa.eu.int/comm/public_opinion/
Type of data used: National surveys
Coverage: European Union Member States Candidate countries; occasionally other countries of the European Economic Area and Switzerland and USA
Time coverage: First data collected in 1974 Latest data collected in 2006 Stated frequency: Annual (also bi-annual reports)
Contact details: European Commission DG PRESS.B1 – Public Opinion Analysis sector B-1049 Brussels [email protected]
Methodology: The Eurobarometer team uses several instruments. The standard EB is based on random samples of 1000 persons (aged 15 and over) in each country interviewed in their homes. They contain several series of questions designed to measure trends of opinion over time, as well as current affairs questions. Special EB are methodologically identical to standard EB; but their content and frequency varies as they are launched upon the request of one of the directorates general of the Commission if and when needed. Interviews for the ‘FLASH EB’ are done by tel-ephone. When addressing the public at large, they are based on random samples of 500 persons per country. They are done whenever a directorate general needs one. If appropriate, FLASH EB do not address the general public but a specific tar-get group, e.g. managers, farmers, teachers, general practitioners, etc.
Format of results: Public opinion expressed as % of population
Eurobarometer
Indic_guide.indd 40 3/12/07 5:39:00 AM

(41)
Example results: The table above shows public opinion on satisfaction with how democracy works over the last ten years with the latest data from 2006 (standard EB Nr. 65).
Valid use: The Eurobarometer is used in national and international press as opinion polls on EU citizens‘ attitudes to a range of issues.
Invalid use: The Eurobarometer opinion poll results do not represent the opinion of Europe as a whole (although the 10 new member states will make it more representative). Note that this is a perception survey.
Assumptions: The Eurobarometer assumes that the survey questions translate the same mean-ing and connotations in all the survey languages.
10%
0%
20%
30%
40%
50%
Sp. ’06EB65
Sp. ’05EB63
Aut. ’04EB62
Sp. ’04EB61
Aut. ’03EB60
Sp. ’03EB59
Aut. ’02EB58
Aut. ’01EB56
Aut. ’00EB54
Sp. ’00EB53
Aut. ’99EB52
Sp. ’99EB51
Sp. ’98EB49
Aut. ’97EB48
Sp. ’95EB43
Satis�ed
Not Satis�ed
Don’t Know
Satistfaction with the way democracy works in the European Union (% EU)
Indic_guide.indd 41 3/12/07 5:39:01 AM

(42)
Producer: Roger Böhning
Stated purpose: A new indicator system to quantify the realization of fundamental human rights in the world of work in principle and in practice.
Funding source: Private
Current usage: Measures gaps in adherence to core labour standards and their implementation. These two dimensions are pulled together in a single notion, called Core Rights Gaps.
Where to find it: Initially published in 2003 in two ILO working papers, Roger Böhning has sub-sequently elaborated his ideas in a book:- Labour rights in crisis: Measuring the achievement of fundamental human rights in the world of work (Basing-stoke, Palgrave-Macmillan, 2005), www.ilo.org/dyn/declaris/DECLARATIONWEB.WORKINGPAPERS?var_language=EN
Type of data used: Ratification; reporting on ratified and unratified Conventions; expressions of inter-est and satisfaction or direct requests and observations by the ILO’s Committee of Experts on the Application of Conventions and Recommendations; as well as reports by the ILO’s Committee on Freedom of Association.
Time coverage: First data: Collected in 1985 Latest data: Collected in 2004 Stated frequency: Yearly
Contact details: The author can be contacted at [email protected]
Methodology: Accords ratification of core Conventions a certain value, the size of which is not as such important because all other variables forming part of the new system are expressed as a percentage of the value of ratification. Thus, the crucial imple-mentation measure fixes each direct request or negative observation by the Committee of Experts at, respectively, 10% and 20% of a Convention’s value in terms of annual values. Scores can move in both directions in the sense that an expression of interest or satisfaction by the Committee of Experts has the same – but opposite – weight of 10% and 20% of a Convention’s value, respectively. The system covers (i) freedom of association and collective bargaining, (ii) freedom from forced labour, (iii) freedom from child labour and (iv) freedom from discrimi-nation, separately and jointly.
Format of results: Scale runs from 0 to 1. Also shown are adherence and Implementation Gaps. The result is shown as a 3 decimal place Gap. The goal is a score of 0 meaning no Gap. A score of 1 implies that a country has not signed the relevant conventions, nor has it reported upon them.
GAPS in Workers’ Rights
Indic_guide.indd 42 3/12/07 5:39:01 AM

(43)
Example results: The table below shows results for a selection of countries in 2004.
Valid use: All human rights indicators must capture two dimensions. One is the commitment to rights in law, the other is the actual effect given to them in practice. The new indicator system does exactly that, and it does it validly, transparently and, most important, objectively. Furthermore, it ensures replicability, non-truncation, utility in the sense of ease and cost effectiveness of data collection, as well as relevance in the sense of linking data to policies.
A main use of this will be to examine the adherence and implementation of coun-tries to ILO standards. In addition, this can be used as a measure of overall levels of workers’ rights.
Invalid use: One by-product of the points system used is that ratification of an additional con-vention brings a sudden jump in the score received. In reality a country is likely to have been working for some time prior to signature to ensure that it would be possible to fulfil the obligations which the conventions imply. Therefore the index should be used over a broad spread of years as a means of identifying trends.
Assumptions: The core assumption regarding the measurement of human rights, in the labour field and generally, concerns objectivity. The author criticizes bodies such as Free-dom House and Polity, and avoids geopolitical and cultural bias by basing himself on the – negative and positive – judgements of the ILO’s Committee of Experts, sup-plemented by reports of the ILO’s Committee on Freedom of Association. Another assumption concerns the weighting used, such as that Core Rights Gaps give the implementation dimension four times the weight of the adherence dimension.
AREA 2000-04 AVERAGE SCORES ADHERENCE GAP IMPlEMENTATION GAP CORE RIGHTS GAPS
Four freedoms as a whole
Italy 0.000 0.080 0.074
Nicaragua 0.000 0.117 0.108
USA 0.164 0.050 0.248
Myanmar 0.171 0.137 0.337
Freedom of association
Ireland 0.000 0.000 0.000
South Africa 0.006 0.033 0.037
Pakistan 0.025 0.385 0.385
Guatemala 0.000 0.435 0.413
Freedom from discrimination
Kenya 0.050 0.067 0.136
Germany 0.000 0.151 0.136
Nigeria 0.063 0.333 0.398
India 0.000 0.467 0.423
Indic_guide.indd 43 3/12/07 5:39:02 AM

(44)
Producer: UNDP Human Development Report Office
Stated purpose: To capture gender inequality in three key areas: the extent of women’s political participation and decision-making, economic participation and decision-making power and the power exerted by women over economic resources.
Funding source: UNDP
Current usage: Part of the Human Development Report, widely quoted in international media.
Where to find it: Human Development Report, annual. http://hdr.undp.org/hdr2006/
Type of data used: The measure uses estimated earned income based on non-agricultural wages, percentage of parliamentary seats by gender, percentage of technical positions held by women and percentage of legislators, senior officials and managers who are women.
Coverage: The GEM coverage includes all UN members for which data is available.
Time coverage: First data: 2003 Latest data: Collected in 2004 Stated frequency: Produced annually
Contact details: Human Development Report Office 304 E. 45th Street, 12th Floor, New York 10017 Tel: +1 (212) 906-3661 Fax: +1 (212) 906-3677
Methodology: The measure is calculated in 3 parts. Firstly the relative share of parliamentary seats is calculated, compared to an ideal of 50% for each gender. Secondly a sim-ilar method is used for each of the economic participation measures. Lastly an income measure is calculated. The three are then combined into a single index. The income measure is a proxy calculated using information about female/ male shares of non-agricultural wage and female/ male shares of the economically active population.
Format of results: The index runs from 0 to 1 with 1 being the maximum. A higher score is desirable.
Example results: The table on the following page shows a selection of results for some countries.
Valid use: This measure should be used to advocate further opportunities for women. The regular production, and publication of the supporting data means that the meas-ure can also be dissected to examine the factors underlying any result.
Invalid use: The UNDP HDR produces a separate Gender Development Index, which focuses more on women’s capabilities. The empowerment measure is not designed as a development measure.
Gender Empowerment Measure
Indic_guide.indd 44 3/12/07 5:39:02 AM

(45)
Assumptions: The core underlying assumption is that empowered women would make the same choices as men. That is that they would go for the same jobs, seek election to parliament just as frequently and undertake work at similar levels. The implica-tion of this is that empowerment concerns not just the ability and opportunity to make choices, but that those choices would be exercised in a particular manner. Note that empowerment data which relate only to choices (not their result) is not available.
For calculating the female share of the wage bill the measure has assumed that the ratio of female to male wages in non-agricultural jobs applies to the whole economy. For missing data the authors substitute a value of 0.75 for the ratio of female to male non-agricultural wage, implying that unless other data is available it is assumed that women earn approx ¾ of the male wage.
GENDER EMPOWER-MENT MEASURE
(GEM)
SEATS IN PAR-lIAMENT HElD BY WOMEN (AS
% OF TOTAl)
FEMAlE lEGISlA-TORS, SENIOR
OFFICIAlS AND MANAGERS (AS %
OF TOTAl)
FEMAlE PROFES-SIONAl AND TECHNICAl
WORkERS (AS % OF TOTAl)
RATIO OF ESTIMATED FEMAlE TO
MAlE EARNED INCOMERANk VAlUE
Norway 1 0.932 37.9 29 50 0.75
Iceland 3 0.686 33.3 29 55 0.71
Australia 8 0.833 28.3 37 40 0.70
Namibia 26 0.623 26.9 30 53 0.57
Malaysia 55 0.500 13.1 23 40 0.36
Botswana 54 0.501 11.1 31 53 0.36
Bangladesh 67 0.374 14.8 23 12 0.46
Egypt 73 0.262 3.8 9 30 0.23
Yemen 75 0.128 0.7 4 15 0.30
Indic_guide.indd 45 3/12/07 5:39:02 AM

(4�)
Producer: One World Trust
Stated purpose: To promote global accountability, achieve organisational change, improve the effectiveness of global decision making and contribute to poverty reduction through decisions which take into account the needs of affected people, including the world’s poorest.
Funding source: The One World Trust is funded through grants, bequests and individual donations. For its most recent work on accountability, the Trust received support from The Ford Foundation, The Baring Foundation and The Allan Nesta Ferguson Charitable Settlement.
Current usage: The report and accompanying data are principally designed as a tool for concep-tual and practical identification of opportunities for improvement of accountability policy, systems and practice of assessed organizations and their broader sectors.
Where to find it: The Global Accountability Report is available via the website www.oneworldtrust.org/accountability
Type of data used: The indicators were scored based on publicly available data, questionnaires that were completed by the assessed organisations, internal documents and other information collected through semi-structured interviews with representa-tives of the assessed organisations and external experts or stakeholders of the organisations.
Global Accountability Report
Intergovernmental OrganisationsBank for International Settlements (BIS) Food and Agriculture Organization (FAO) Global Environment Facility (GEF) International Labour Organization (ILO) International Monetary Fund (IMF) Organisation for Economic Cooperation and Development (OECD)World Health Organisation (WHO) World Intellectual Property Organisation (WIPO) World Bank – International Bank for Reconstruction and Development (IBRD)World Trade Organisation (WTO)
International non-governmental actorsActionAid International (AAI)Amnesty International (AI)Human Life International (HLI)International Chamber of Commerce (ICC) International Confederation of Free Trade Unions (ICFTU) International Federation of Red Cross and Red Crescent Societies (IFRC)The Nature Conservancy Oxfam International (OI)World Vision International (WVI) World Wildlife Fund International (WWF)
Trans-national CorporationsAnglo American plc Dow Chemical CompanyExxon Mobil Corporation Microsoft Corporation Nestlé News Corporation Pfizer Inc RWE Toyota Motor CorporationWal-Mart Stores Inc
Indic_guide.indd 46 3/12/07 5:39:03 AM

(4�)
Coverage: The Report covers global organisations from the inter-governmental, non-gov-ernmental and corporate sectors. In the 2006 Global Accountability Report, the following organisations were assessed:
Time coverage: First/Latest data: The report is based on key documents from each organisation being studied. The pilot report was published in 2003. The 2006 Report is based on data available as of June 2006.
Stated frequency: A follow up Report which will assess a new group of 30 organisations is expected by early 2008.
Contact details: Monica Blagescu Accountability Programme Manager One World Trust 3 Whitehall Court, London, SW1A 2EL, UK Tel: +44 (0)20 7766 3470 Fax: +44 (0)20 7839 7718 [email protected]
Intergovernmental Organisations
Bank for International Settlements (BIS) Food and Agriculture Organization (FAO) Global Environment Facility (GEF) International Labour Organization (ILO) International Monetary Fund (IMF) Organisation for Economic Cooperation and
Development (OECD)World Health Organisation (WHO) World Intellectual Property Organisation
(WIPO) World Bank – International Bank for
Reconstruction and Development (IBRD)World Trade Organisation (WTO)
International non-governmental actors
ActionAid International (AAI)Amnesty International (AI)Human Life International (HLI)International Chamber of Commerce (ICC) International Confederation of
Free Trade Unions (ICFTU) International Federation of Red Cross
and Red Crescent Societies (IFRC)The Nature Conservancy Oxfam International (OI)World Vision International (WVI) World Wildlife Fund International (WWF)
Trans-national Corporations
Anglo American plc Dow Chemical CompanyExxon Mobil Corporation Microsoft Corporation Nestlé News Corporation Pfizer Inc RWE Toyota Motor CorporationWal-Mart Stores Inc
Indic_guide.indd 47 3/12/07 5:39:03 AM

(48)
Methodology: The Index documents the degree to which the headquarters / international secretariat of the assessed organisations have the capabilities in place to enable accountability and responsiveness to both the communities they affect and the public at large. Desk-based research, questionnaires, interviews, expert reviews, and feedback from organisations and their external stakeholders are used to score the organisational capabilities (policies and systems) against a set of good practice principles of accountability, which were developed through a participatory process. Indicators are weighted depending on their importance to accountability.
Format of results: In the 2006 Global Accountability Report, the organisations are assessed against four core dimensions of accountability: transparency, participation, evaluation, and complaint and response mechanisms. The scores for each organisation were totalled and weighted out of 100 percent for each dimension but no aggregate score was provided. Higher scores in all four dimensions indicate higher capabili-ties to enable, support and foster accountability.
Example results: The graph below shows the results for transparency.
100
90
80
70
60
50
40
30
20
10
0
GEF
Wor
ld B
ank/
IBRD IM
F
OEC
D
WTO BI
S
FAO
ILO
WH
O
WIP
O
Act
ionA
id In
tern
atio
nal
WW
F In
tern
atio
nal
Oxf
am in
tern
atio
nal
IFRC
The
Nat
ure
Cons
erva
ncy
Wor
ld V
isio
n In
tern
atio
nal
Am
nest
y In
tern
atio
nal
Hum
an L
ife In
tern
atio
nal
ICC
ICFT
U
Nes
tlé
P�ze
r
Ang
lo A
mer
ican
plc
Mic
roso
ft C
orp
RWE
Dow
Che
mic
al C
ompa
ny
Exxo
n M
obil
Toyo
ta M
otor
Cor
p
Wal
-mar
t
New
s Co
rp
Graph 1: Organisational scores on transparency capabilities
Indic_guide.indd 48 3/12/07 5:39:04 AM

(49)
Valid use: This data source and the accompanying profiles of organisations can be used to illuminate good practice, highlight accountability gaps, encourage cross-sector learning, and promote realistic reforms within the accountability of the organisa-tions covered.
Invalid use: The coverage is limited to the sample of 30 organisations. For now, this cannot be used to identify best and worst overall performers in the global governance arena in terms of accountability. As coverage increases with the next report, this may become possible.
Assumptions: The Report captures the existence of and commitment to principles of account-ability at the headquarter / international secretariat level of an organisation; and the internal capability to implement these principles across the wider organisa-tion, network, federation or group to foster accountability to affected communities and the public at large. The presence and quality of accountability policies and systems at this level is taken either as reflecting an already existing organisa-tion-wide commitment to the issue, or as an indication that the headquarters / international secretariat recognises that these stated values and principles should be applied throughout the organisation as a matter of conceptual integrity and good practice.
The Report does not attempt to measure the inevitable variations and differences between commitments that are made in organisational documents at the inter-national office and what happens in practice at the field level. Depending on the type of organisations and governances structures that they have in place, such differences can be a reflection of decentralised organisations, loose links between international and field offices, or inadequate communication and management practices. The study therefore does not claim to present a full and definitive assess-ment of the overall accountability of assessed organisations. What happens in practice and at field level is obviously key for a more definitive assessment of any organisation’s accountability.
There is recognition that accountability is a concept subject to multiple cultural or sector-specific interpretations and understandings. The Report does not claim to capture the breadth of the manifestations that accountability principles may take for different organisations.
Indic_guide.indd 49 3/12/07 5:39:04 AM

(50)
Producer: World Economic Forum with Columbia University
Stated purpose: The Global Competitiveness Index (GCI) attempts to quantify the impact of a number of key factors which contribute to create the conditions for competitive-ness, with particular focus on the macroeconomic environment, the quality of the country’s institutions, and the state of the country’s technology and supporting infrastructure.
Funding source: Private sector companies and participation fees from annual meetings.
Current usage: The GCI is widely quoted in the media and in academic research.
Where to find it: The GCI is published as part of the World Economic Forum’s Global Competitiveness Report. http://www.weforum.org/site/homepublic.nsf/Content/Global+Competitiveness+Programme%5CGlobal+Competitiveness+Report
Type of data used: Administrative data (publicly available data) and World Economic Forum Executive Opinion Survey
Coverage: Global 125 countries
Time coverage: First data: Collected in 1979 Latest data: Collected in 2005 Stated frequency: Annual
Contact details: For more information on the survey contact: [email protected].
Methodology: The GCI measures “the set of institutions, factors and policies that set the sustainable current and medium-term levels of economic prosperity” (in other words, those fac-tors that facilitate or drive productivity). The index is composed of nine pillars:
1. Institutions
2. Infrastructure
3. Macro economy
4. Health and primary education
5. Higher education and training
�. Market efficiency (goods, labour, financial)
�. Technological readiness
8. Business sophistication
9. Innovation
The index attempts to take into account countries' different stages of economic development, and organises the nine pillars into three specific sub-indices:
Global Competitiveness Index
Indic_guide.indd 50 3/12/07 5:39:04 AM

(51)
COUNTRY/ECONOMY 200� RANk 200� SCORE
Switzerland 1 5.81Finland 2 5.76Singapore 5 5.63Qatar 38 4.55Malta 39 4.54lithuania 40 4.53Italy 42 4.46India 43 4.44kuwait 44 4.41South Africa 45 4.36Cyprus 46 4.36Poland 48 4.30
1. Basic requirements (most important for countries at a factor-driven stage of development).
2. Efficiency enhancers (most important for countries at the efficiency driven stage).
3. Innovation and sophistication factors (most important for countries at the innova-tion-driven stage).
The rankings are drawn from a combination of publicly available hard data and the results of the Executive Opinion Survey, an annual survey conducted by the World Economic Forum, together with its network of Partner Institutes (research institutes and business organizations) in the countries covered by the Report. In 2006, 11,000 business leaders were polled in 125 economies worldwide. The survey question-naire is designed to capture a broad range of factors affecting an economy’s business climate that are critical determinants of sustained economic growth.
Format of results: Uses a 1-7 scale (higher average score means higher degree of competitiveness).
Example results: The Table below shows results for selected countries in 2006.
Valid use: The GCI is a helpful tool to assess economic competitiveness.
Invalid use: Although the CGI assesses several aspects related to governance such as pub-lic trust in institutions, judicial independence and corruption, these are limited measures of governance. There is also a strong business bias regarding govern-ance related aspects, which is reflected by the questions and respondents of the Executive Opinion Survey. Consequently, the GCI should be used very cautiously as a governance index per se. The GCI points out that the ranking is based on rela-tive positioning, thus one country movement on the list is not necessarily due to changes in the country but rather in other countries (i.e. if one country goes up another has to go down).
Assumption: Weighting used in constructing index is appropriate.
COUNTRY/ECONOMY 200� RANk 200� SCORE
Turkey 59 4.14jamaica 60 4.10El Salvador 61 4.09Russian Federation 62 4.08Azerbaijan 64 4.06Zimbabwe 119 3.01Ethiopia 120 2.99Mozambique 121 2.94Timor-leste 122 2.90Chad 123 2.61Burundi 124 2.59Angola 125 2.50
Indic_guide.indd 51 3/12/07 5:39:06 AM

(52)
Producer: Global Integrity
Stated purpose: To assess the existence and effectiveness of mechanisms that prevent abuses of power and promote public integrity, as well as the access that citizens have to their government.
Funding source: Funded by Legatum Global Development, Sunrise Foundation, Wallace Global Fund and the World Bank.
Current usage: Provides a benchmark of good governance mechanisms and institutions needed to combat corruption, together with qualitative journalistic reporting about cor-ruption in countries.
Where to find it: http://www.globalintegrity.org/data/2006index.cfm
Type of data used: Local expert assessment, reinforced through a peer review mechanism.
Coverage: 43 countries globally, primarily large aid recipients and emerging markets.
Time coverage: First data: Collected in 2003; published in 2004. Latest data: Collected in 2006 Stated frequency: Annual, beginning 2006
Contact details: Global Integrity 910 17th St., NW Suite 1040 Washington DC 20006 Tel: +1 (202) 449-4100
Methodology: Global Integrity combined qualitative journalistic reporting with an in-depth, quantitative scorecard approach to assess the institutions and practices that citi-zens can use to hold their governments accountable. The Global Integrity Index assesses the opposite of corruption: the existence of laws, institutions, and mecha-nisms designed to deter, prevent, or curb corruption and their implementation and enforcement.
Through almost 300 disaggregated indicators, the Global Integrity Index assesses the following dimensions of governance:
Global Integrity Index
Indic_guide.indd 52 3/12/07 5:39:06 AM

(53)
The data is gathered through a consistent methodology applied by in-country experts with a background governance and corruption issues; the disaggregated indicators assess both de jure and de facto corruption prevention measures and are anchored to scoring criteria to help ensure consistency of scoring across indi-viduals and cultures. The survey scores and report are peer-reviewed to ensure accuracy and replicability. Each set of questions forms a subcategory index, category score and overall score. Results are checked for inter-coder reliability. A standardised scoring system is used for each question. At each level the scores are averaged. The data is available for each category and sub-category score as well as at the disaggregated level. The questionnaire can be found at http://www.globalintegrity.org/data/downloads.cfm
1 Civil Society, Public Information and Media
1.1 Civil Society Organizations
1.2 Media
1.3 Public Access to Information
2 Elections
2.1 Voting & Citizen Participation
2.2 Election Integrity
2.3 Political Financing
3 Government Accountability
3.1 Executive Accountability
3.2 Legislative Accountability
3.3 Judicial Accountability
3.4 Budget Processes
4 Administration and Civil Service
4.1 Civil Service Regulations
4.2 Whistle-blowing Measures
4.3 Procurement
4.4 Privatization
5 Oversight and Regulatory Mechanisms
5.1 National Ombudsman
5.2 Supreme Audit Institution
5.3 Taxes and Customs
5.4 Financial Sector Regulation
5.5 Business Licensing and Regulation
� Anti-Corruption Mechanisms and Rule of law
6.1 Anti-Corruption Law
6.2 Anti-Corruption Agency
6.3 Rule of Law
6.4 Law Enforcement
Indic_guide.indd 53 3/12/07 5:39:06 AM

(54)
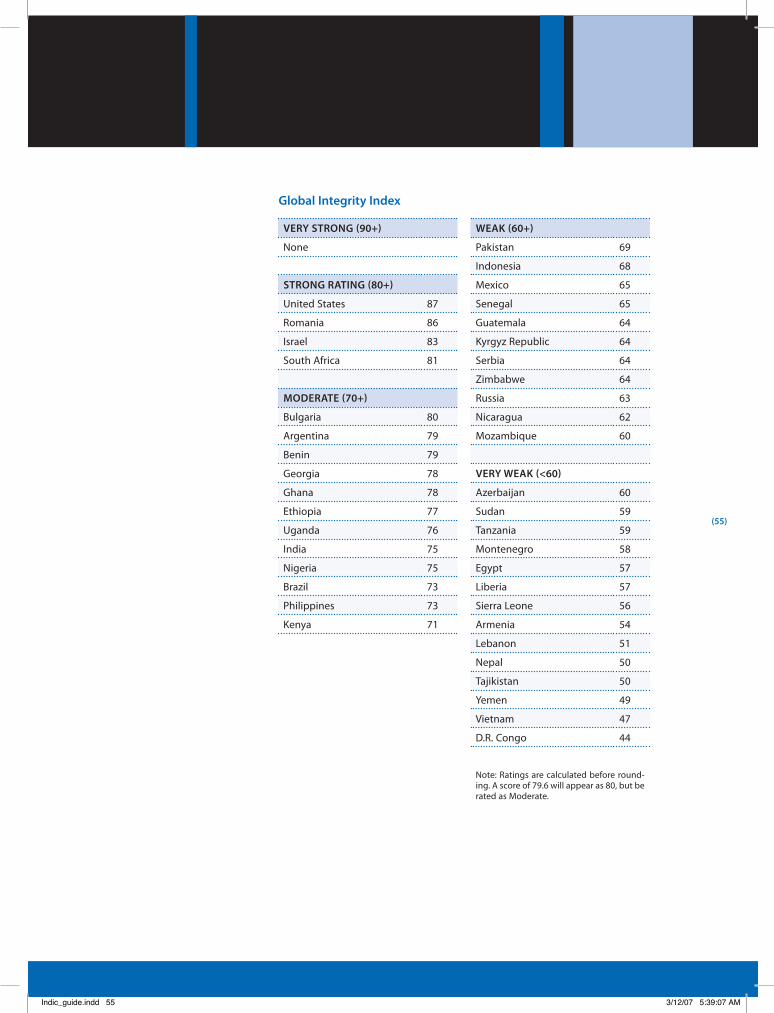
Format of results: Scores are available on a 0-100 scale that are grouped into five tiers:
Very Strong (90-100)
Strong (90-90)
Moderate (70-80)
Weak (60-70)
Very Weak (Below 60).
Users of the website will also find a reference and explanatory comment (optional) accompanying each data point. For each country that participated, a full Global Country Report is also available at: http://www.globalintegrity.org/reports/2006/index.cfm
Example results: The table on the following page shows results for the 43 countries.
Valid uses: This measure is an interesting addition to the field of corruption indicators, in that it specifically concentrates on public sector preventative measures rather than corruption per se. The peer review process seeks to reinforce the validity, and the journalistic narrative provides additional, useful explanatory commentary.
Invalid use: The authors are very open about potential weaknesses of their data source. They note that the coverage focuses on national governance frameworks (sub-national measures are not covered for example). In addition the index excludes private sec-tor corruption (except for some basic aspects). The compilers are working on the inclusion of further output measures in addition to those which currently focus on the existence of laws and institutions. Note that research by the World Bank Institute is beginning to question the need for and effectiveness of anti-corrup-tion organisations for combating corruption, something which the Index assesses amongst many other institutional safeguards [comment: we place no greater impor-tance on anti-corruption commissions than does the bank, and our scoring criteria allow for non-centralized systems where multiple mechanisms (i.e. Special prosecutors + justice ministry + parliamentary committees etc) together serve the role as a ‘central’ anti-corruption organization. Also, there is plenty of other research, not just wbi’s, that questions the effectiveness of a central commission].
Assumptions: The simple average measure assumes that each category examined has equal importance. The top six categories are Civil Society, Public Information and Media; Elections; Government Accountability; Administration and Civil Service; Oversight and regulatory mechanisms; Anti-corruption mechanisms and the rule of law.
»
»
»
»
»
Indic_guide.indd 54 3/12/07 5:39:07 AM
(55)
VERY STRONG (90+)
None
STRONG RATING (80+)
United States 87
Romania 86
Israel 83
South Africa 81
MODERATE (�0+)
Bulgaria 80
Argentina 79
Benin 79
Georgia 78
Ghana 78
Ethiopia 77
Uganda 76
India 75
Nigeria 75
Brazil 73
Philippines 73
Kenya 71
WEAk (�0+)
Pakistan 69
Indonesia 68
Mexico 65
Senegal 65
Guatemala 64
Kyrgyz Republic 64
Serbia 64
Zimbabwe 64
Russia 63
Nicaragua 62
Mozambique 60
VERY WEAk (<�0)
Azerbaijan 60
Sudan 59
Tanzania 59
Montenegro 58
Egypt 57
Liberia 57
Sierra Leone 56
Armenia 54
Lebanon 51
Nepal 50
Tajikistan 50
Yemen 49
Vietnam 47
D.R. Congo 44
Note: Ratings are calculated before round-ing. A score of 79.6 will appear as 80, but be rated as Moderate.
Global Integrity Index
Indic_guide.indd 55 3/12/07 5:39:07 AM