

Cineworld Group 2017 Results/media/Files/C/Cineworld-PLC/reports-and... · (21.3) (17.6) Adjusted...
25
Cineworld Group 2017 Results 15 th March 2018
Transcript of Cineworld Group 2017 Results/media/Files/C/Cineworld-PLC/reports-and... · (21.3) (17.6) Adjusted...

Cineworld Group 2017 Results15th March 2018

Overview

Summary of 2017 – another record year Reached the milestone of 100m admissions Overall strong financial performance for the Group, EBITDA growth of 13.2%,
8.4% in constant currency
Record growth achieved in Poland, Romania, Hungary & Czech Republic Clear progress made against our strategy
Group revenue growth of 11.6%
Adjusted EBITDA growth of 12.7%
Adjusted diluted EPS growth of 12.1% to 38.9p
Full year dividend increased by 12.6% to 21.4p

Financial Review

Financial HighlightsGroup 2017
Group 2016
Statutory Movement
Admissions 103.8m 100.3m 3.5%
£m £m
Box office 553.7 500.9 10.5%
Retail 220.4 190.8 15.5%
Other 116.6 106.1 9.9%
Total revenue 890.7 797.8 11.6%
Adjusted EBITDA1 198.2 175.8 12.7%
Adjusted profit before tax 127.5 111.4 14.5%
Adjusted diluted EPS 38.9p 34.7p 12.1%
Adjusted diluted (rights adjusted) EPS 17.3p 15.4p 12.3%
Statutory revenue growth of 11.6% (constant currency at 8.0%)
Statutory Adjusted EBITDA(1) growth of 12.7% (constant currency 7.4%)
Adjusted diluted EPS up 12.1% to 38.9p
Adjusted diluted EPS (rights adjusted) of 17.3p
Net debt of £278.3m (31 December 2016: £282.3m) – Net debt to EBITDA ratio reduced to 1.4
Increased the full year cash dividend paid by 14.5%. Final adjusted dividend per share of 3.1p
1. Adjusted EBITDA is defined as Operating profit before depreciation and amortisation, onerous leases and other non-cash items, impairments and reversals of impairments, transaction and reorganisation costs, gains and losses on disposals of assets and subsidiaries and the settlement of the defined benefit pension liability.
Performance summary
UK & Ireland ROW Group
2017 Movement versus 2016
2017 Movement versus 2016
2017 Movement versus 2016
Admissions 53.0m 2.3% 50.8 4.7% 103.8 3.5%
£m £m £m
Box office 345.0 6.5% 208.7 8.2% 553.7 6.4%
Retail 125.8 7.1% 94.6 18.7% 220.4 11.1%
Other 53.7 2.3% 62.9 8.3% 116.6 5.4%
Total revenue 524.5 6.2% 366.2 10.7% 890.7 8.0%
Adjusted EBITDA 99.7 2.7% 98.5 12.5% 198.2 7.4%
Adjusted EBITDA Margin
19.0% (0.7)% 26.9% 1.0% 22.3% 0.3%
Group revenue growth of 8.0%
2.3% increase in the UK box office revenues (total market increased by 1.4% - source IBOE)
Group Adjusted EBITDA growth of 7.4%
Group Adjusted EBITDA margin increased to 22.3%
Benefit of operating in nine territories in mature and developing markets
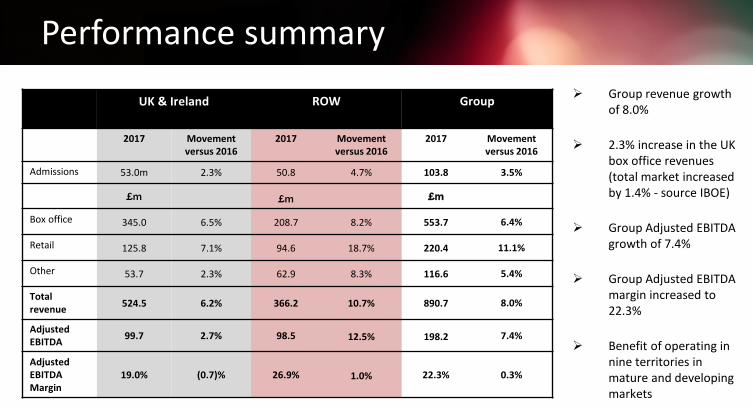
Box Office & Retail Performance
UK Admissions = 53.0m +2.3%
ATP = £6.51 +4.0%
SPP = £2.27 +4.4%
ROW (constant currency) Admissions = 50.8m +4.7%
ATP = £4.11 +3.3%
SPP = £1.86 +13.4%
UK
Is
Hu
Ro
UK
Po
Hu
Ro
Is
Bu2017 Admissions
UK - 53.0m
Poland 17.7m
Hungary - 9.4m
Romania - 8.5m
Israel - 6.6m
Czech - 5.1m
Bulgaria -2.1m
Slovakia - 1.4m

Other income Other income includes revenue from advertising, distribution, screen and event hire and online booking
fees
Overall it has increased by 9.9% (8.0% on a constant currency basis)
UK & Ireland performance + 2.3%
Advertising performed well benefitting from increase in admissions Disposal of small alternative content distribution outfit in Picturehouse
ROW performance + 8.3% (constant currency)
Strong performance from advertising revenues Distribution revenues largely in-line year on year

Group profit and loss£m 2017 2016
Revenue 890.7 797.8
Adjusted EBITDA 198.2 175.8
Depreciation and amortisation (68.1) (58.6)
Exceptional cost (1.9) (4.4)
Operating profit 128.2 112.8
Finance expense (7.8) (14.6)
Profit before tax 120.5 98.2
Tax charge (19.9) (16.2)
Profit after tax 100.6 82.0
Adjustments 5.6 11.8
Adjusted profit after tax 106.2 93.8
The £1.9m net exceptional items includes the following items:
− £7.8m of reorganisation costs
− £1.3m of onerous lease property charges
− £(5.2)m net credit in relation to impairments
− £(2.0)m one off gain relating to the disposal of Picturehouse Entertainment
Includes £5.1m of amortisation related to intangible assets which were identified as part of the Cinema City business combination.
Net finance expense of £7.8m includes £6.3m in respect of interest on bank loans and overdrafts. 2016 included a foreign exchange loss of £6.1m

Growth in the adjusted diluted EPS of 12.1%£m 2017 2016
Adjusted EBITDA 198.2 175.8
Depreciation and amortisation (68.1) (54.0)
Adjusted Operating profit 130.1 121.8
Finance expense (2.6) (10.4)
Adjusted profit before tax 127.5 111.4
Tax (21.3) (17.6)
Adjusted profit after tax 106.2 93.8
Adjusted diluted EPS 38.9 34.7
£m 2017 2016
Adjusted items
Amortisation of Cinema City intangibles 5.1 4.6
Exceptional items 3.9 4.4
Foreign exchange translation movements on Euro Term Loan and exceptional hedge item
- 4.2
Profit on disposals (2.0) -
Total adjustments 7.0 13.2
Tax (1.4) (1.4)
Total post tax adjustments 5.6 11.8

Cash flow statement and net debt£m Cash Bank
loansOther Net
Debt
Opening position at 1 January 2017 55.8 (322.0) (16.1) (282.3)
Operating profit 128.2 - - 128.2
Non-cash movements 56.6 (1.4) (1.0) 54.2
Cash generated from operations 184.8 (1.4) (1.0) 182.4
Tax paid (12.0) - - (12.0)
Net cash flows from investing activities (110.7) - - (110.7)
Net cash flows from financing activities (54.6) (4.8) 1.3 (58.1)
Forex and other non-cash movements 4.2 (1.8) 2.4
Closing position at 31 December 2017 67.5 (330.0) (15.8) (278.3)
Of the net £56.6m non-cash movement, £68.1m relates to the add back of depreciation and amortisation
Investing activities include £7.0m paid for Newcastle Empire and £106.2m of capital expenditure
Financing activities primarily include Drawdown on facility of £17.4m £53.8m dividend payment Loan repayments of £11.1m Interest paid of £6.6m
Adjusted EBITDA to net debt ratio reduced to 1.4 times

Financial Outlook Strong film slate for 2018
Encouraging performance for January and February across all territories
Capital expenditure for 2018 expected to be approximately £80m for the UK/ROW
Focus on cash generation to reduce the net debt to adjusted EBITDA ratio
Cost of debt expected to be circa 4%

Business Update

Key Achievements 103.8m admissions Nine new
openings Acquisition of Empire Newcastle
Six refurbishments
completed
Completion post year end of Regal
Entertainment acquisition
Leading technological
innovation
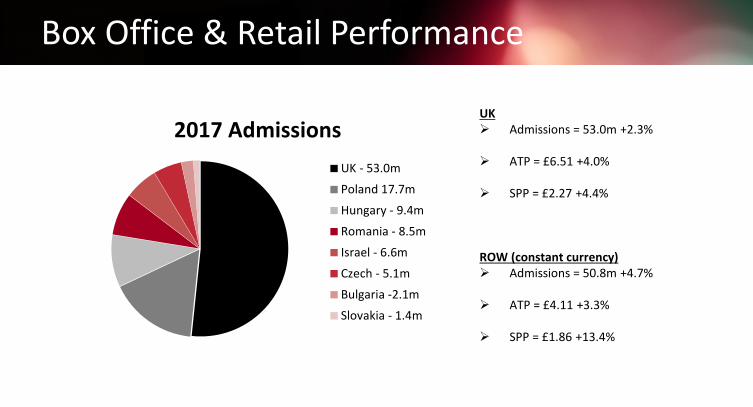
Next generation cinemas – 109 new screensUK & Ireland Leeds – 11 screens Ely – 6 screens South Ruislip – 11 screens Bracknell – 12 screens
ROW Zichron – Israel – 12 screens Galata – Romania – 8 screens Bialoleka – Poland – 11 screens Chodov – Czech Republic – 18 screens Wroclaw – Poland – 20 screens

Next generation cinemas – refurbishmentsContinued delivery of refurbishments with the following completed in 2017
Ipswich – Extension and refurbishment
Northampton – Refurbishment including a Superscreen
Solihull – Refurbishment including Superscreen and Starbucks
Hemel Hempstead – one of the Empire sites acquired, refurbishment including Starbucks
Arkadia (Poland) – leading cinema in Warsaw
Mokotow (Poland) – opened in 1999
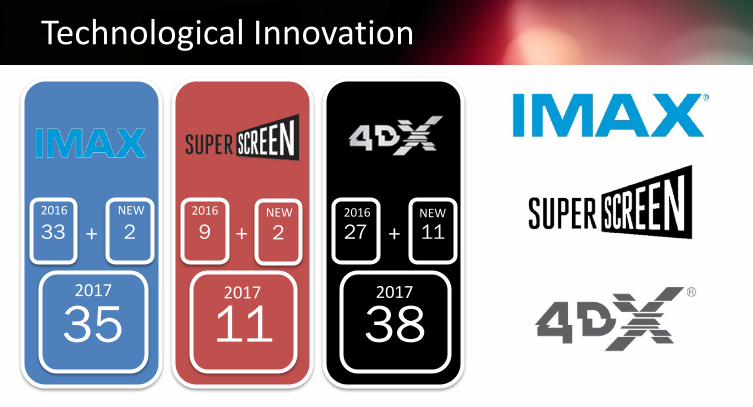
Technological Innovation
33 2
35
+ 27 11
38
+9
11
+ 2
2017 20172017
2016 2016 2016NEW NEW NEW

Retail Offerings
24 5
29
+
2017
2016 NEW
9 3
12
+
2017
2016 NEW

The New Cineworld

Regal acquisition Acquisition completed on 28th February 2018
Cineworld Group is now the second largest Cinema chain in the world (by number of screens)
Encouraging performance for US box office in January and February
Integration plan progressing as expected

What is coming? 19 sites, (3 already opened),176 screens (27 already opened)planned to open in 2018
10 (1 opened) sites in the US 6 (2 opened) sites in the UK 3 sites in the ROW
Further refurbishments planned in the UK and ROW
Plans for first cinema refurbishments progressing well
Continued focus on customer experience to be “The Best Place to Watch a Movie”

2018 – Key Titles

2019 and beyond – Key Titles