ciap.hcn.com.auciap.hcn.com.au/.../final-report-national-qum-indicator-… · Web...
88
1 Final Report Development of the National Quality Use of Medicines Indicators for Australian Hospitals 2014 Submission to the Australian Commission on Safety and Quality in Health Care Final Report: Development of the National Quality Use of Medicines Indicators for Australian Hospitals 2014
Transcript of ciap.hcn.com.auciap.hcn.com.au/.../final-report-national-qum-indicator-… · Web...

1
Final Report
Development of theNational Quality Use of Medicines Indicators
for Australian Hospitals
2014
Submission to the Australian Commission on Safety and Quality in Health Care
February 2014
Final Report: Development of the National Quality Use of Medicines Indicators for Australian Hospitals 2014

2
Contents
Introduction 3
Aims 4
Methods 4
Results 7
Discussion 35
Conclusion 43
References 44
Acknowledgements 45
Appendix 1 49
Appendix 2 51
Appendix 3 55
Appendix 4 59
Final Report: Development of the National Quality Use of Medicines Indicators for Australian Hospitals 2014

3
IntroductionThe measurement of quality use of medicines (QUM) indicators enables identification of gaps in practice in the judicious selection of treatment options and the appropriate, safe and effective use of medicines. QUM is an important component of Australia’s National Medicines Policy1. QUM indicators are designed to facilitate QUM improvement strategies and can be used to assess the effectiveness of such strategies or, when used periodically, can monitor hospital performance with regard to medicines management over time. As such they have potential as accreditation criteria or key performance indicators for jurisdictions.
In 2007, the New South Wales Therapeutic Advisory Group (NSW TAG) in collaboration with the Clinical Excellence Commission (CEC) developed Indicators for Quality Use of Medicines in Australian Hospitals (QUM Indicators 2007).2 The indicators are process indicators which measure compliance with processes of care related to medicines management that have been shown to improve health outcomes. The indicators aim to measure six aspects of care using QUM assessment. The aspects of care are:
antithrombotic therapy;
antibiotic therapy;
medication ordering;
pain management;
continuity of care; and
hospital-wide medication management policies.
These themes were identified as representing high-risk or high-use medicines, high-risk populations and high-risk clinical settings. The indicators were validated and pilot-tested in clinical environments prior to publication. Efforts in the development process of the QUM Indicators 2007 sought to ensure that clinicians would accept the indicators as valid, feasible, useful and important for measurement of QUM practices and so enhance routine use in busy clinical settings.3 Importantly these indicators were developed to be clinician-led, because knowledge and ownership at this level was acknowledged as most likely to generate successful practice change where required. Moreover clinicians were recognised as having the expertise and resources to promote the use of the indicators and lead improvement strategies3. Clinician-directed audit and feedback is recognised as one of the most effective strategies for improving quality and safety of health care.
The Australian Commission on Safety and Quality in Health Care’s 2009 National Medication Safety and Quality Scoping Study Report4 made the following recommendations:
Recommendation 27: Inform development of safe medication practice indicators for all settings of care;
Recommendation 41: Set national agreed priorities for addressing gaps in practice in quality use of medicines and safe medication practice and monitor outcomes through the use of indicators; and
Recommendation 42: Develop safe medication practice indicators.
An important element of the Commission’s strategy for improving the quality of health care is making available current QUM indicators for use by Australian hospitals. The Commission has an interest in updating the QUM Indicators 2007 to ensure they are applicable and relevant to the current health care environment.
In 2011/12 the Commission funded NSW TAG to review the QUM Indicators 2007.5 Four of the 2007 indicators were identified as requiring significant modification. These QUM indicators focused on the areas of appropriate VTE prophylaxis (Indicator 1.2), appropriate use of aminoglycoside antibiotics (Indicator 2.3), and discharge management of acute coronary syndromes (Indicator 5.1) and heart failure (Indicator 5.2).
Final Report: Development of the National Quality Use of Medicines Indicators for Australian Hospitals 2014

4
The review made specific proposals for these revised QUM indicators and it was recommended that further consultation and field testing were carried out to ensure their validity. The revised indicators proposed by the review were:
Indicator 1.2: Percentage of patients risk-assessed as requiring venous thromboembolism prophylaxis that receive appropriate prophylaxis;
Indicator 2.3a: Percentage of patients in whom doses of empirical aminoglycoside therapy are continued beyond 48 hours;
Indicator 2.3b: Percentage of patients in whom dose individualisation has occurred if aminoglycoside therapy is continued beyond 48 hours;
Indicator 5.1: Percentage of patients with acute coronary syndrome that are prescribed appropriate medications at discharge; and
Indicator 5.2: Percentage of patients with systolic heart failure that are prescribed appropriate medications at discharge.
In addition, the Commission identified a gap in the continuity of care sub-set of the QUM Indicators 2007, specifically around ensuring continuity in medication management at discharge. It was recognised that the QUM Indicators 2007 included indicators targeting other aspects of the medication reconciliation process, specifically QUM Indicators 3.1 and 5.3, and that these would be complemented by the addition of further indicators targeting medication processes at discharge.
It was further recognised that the QUM Indicators 2007 did not include any indicators in the area of acute mental health care. The Commission requested that indicators be developed to target current QUM gaps in this area.
AimsNSW Therapeutic Advisory Group was funded by the Australian Commission on Safety and Quality in Health Care between 2012 and 2014 to continue its review the QUM Indicators 2007. Phase Two of the review had two objectives:
Finalise the four QUM indicators identified in the 2011/2012 review as requiring significant modification,; Develop and finalise QUM indicators for medication reconciliation at discharge; and Develop and finalise QUM indicators for acute mental health care.
Methods
QUM Indicators 2007 review and revisionAn Expert Advisory Committee (EAC) was convened to review the revised QUM indicators, advise on further consultation and field testing and assist with decision making regarding the final indicators. The EAC was composed of individuals with expertise in the relevant areas, many of whom had been involved in the development of the QUM Indicators 2007 and thus were familiar with the process and criteria for indicator development (see Acknowledgments). The EAC met on nine occasions between July 2012 and January 2014.
Further consultation was conducted with key individuals and organisations. Various NSW TAG committees also provided feedback on aspects of the proposed indicators. Feedback was considered by the EAC and was incorporated into the draft indicators where appropriate.
Development of new QUM indicators for continuity of medication management at dischargeA literature search was conducted to identify existing indicators looking at medication management at discharge. Twelve indicators were identified from Australian and international indicator sets (Appendix 1).
Final Report: Development of the National Quality Use of Medicines Indicators for Australian Hospitals 2014

5
The relevance of these indicators to Australian health care environment was considered by the EAC. Two indicator themes were identified from this process that would address current QUM gaps in Australian hospitals. Two indicators were developed and approved by the EAC to undergo field testing. The proposed indicators were:
Indicator 5.8: Percentage of discharged patients with a reconciled discharge medication summary; and Indicator 5.9: Percentage of patients who receive a reconciled medication list at the time of hospital
discharge
Development of new QUM indicators for acute mental health careA literature search was conducted to identify existing indicators targeted at medication processes in acute mental health care. Forty-six indicators or similar measurement tools were identified from Australian and international clinical audit sets, some of which were duplicated (Appendix 2).
Consultation was conducted with individual experts and key organisations to explore the current QUM issues faced in the acute mental health environment. A multidisciplinary Mental Health QUM Indicator Expert Advisory Committee (MHEAC) was convened by NSW TAG. MHEAC members are listed in the Acknowledgments. The MHEAC considered the results of the literature review and reviewed the feedback from the consultation process. The committee also identified a number of other QUM gaps relevant to current practice.
A list of 15 indicators that would address current QUM gaps in Australian hospitals was developed from this process. These indicators were then evaluated by the MHEAC using the formal decision algorithm previously developed and used in the 2007 QUM Indicator project.6
The MHEAC acknowledged that gaps exist in the following areas: appropriate initiation of clozapine therapy; provision of information about psychotropic teratogenicity; monitoring of adverse effects for all psychotropics; and dosing and monitoring of lamotrigine.
It was decided not to further develop these indicators due to significant challenges to their measurement, and so nine QUM indicators for acute mental health care were considered suitable for field testing.
After consultation with the ACSQHC, field testing of five indicators was agreed.
The proposed indicators for field testing were:Indicator 7.1: Percentage of “as required” (PRN) psychotropic medication orders with documented indication, dose (or dose range), frequency and maximum daily dose specified. Indicator 7.2: Percentage of patients taking lithium who receive appropriate monitoring during their inpatient treatmentIndicator 7.3: Percentage of patients who receive written and verbal information on newly initiated medications during their inpatient treatment.Indicator 7.4: Percentage of patients taking antipsychotic medications who receive appropriate monitoring for the development of metabolic side effects.Indicator 7.5: Percentage of patients taking two or more regular antipsychotic medications at hospital discharge.
Field testing of revised and new QUM indicators Expressions of interest for participation in the field testing of the modified and new indicators were distributed throughout Australia via NSW TAG networks. Organisations contacted included:
The Council of Australian Therapeutic Advisory Groups; Children’s Healthcare Australasia Medication Safety Special Interest Group; NSW TAG general members; The NSW TAG Drug Use Evaluation Support Group; Those involved in the World Health Organisations High 5’s project led by the ACSQHC;
Final Report: Development of the National Quality Use of Medicines Indicators for Australian Hospitals 2014

6
The Royal Australia and New Zealand College of Psychiatrist Special Interest Group in Leadership and Management; and
The Society of Hospital Pharmacists of Australia Committee of Specialty Practice in Mental Health.
It was planned that a minimum of three hospitals of varying demographics would field test each indicator. Hospitals were asked to identify which indicators they preferred to field test. Ethics approval was obtained from the St Vincent’s Hospital (Sydney) (SVH) Human Research and Ethics Committee (HREC). SVH HREC approval was recognised by NSW public hospitals and many interstate hospitals. On-site project officers were identified and site specific approvals (SSAs) were sought from each hospital’s Research Governance Department.
Field testing required participant hospitals to measure the indicator as defined in the indicator document and complete a structured questionnaire on various aspects of the indicator, including feasibility, validity and measurability (Appendix 3). Data collection spreadsheets were designed to obtain the indicator result as well as provide insight into possible reasons for any identified gaps. Inbuilt formulae enabled automatic collation of results. For the medication reconciliation indicators, online questionnaires including skip logic were trialled for data collection, recognising that medication reconciliation at discharge could occur via different pathways.
Hospitals retained their individual data and provided NSW TAG with their collated results and the completed questionnaire. Results and feedback were reviewed by the relevant expert advisory committees. The two indicators for continuity of medication management were amended significantly based on the results of the field tests and the feedback received. These indicators were re-tested in their revised format before being finalised.
Inclusion of National Safety and Quality Health Service StandardsIn September 2012 the Commission released the National Safety and Quality Health Service Standards (the NSQHS Standards).7 These were developed to drive the implementation of safety and quality systems and improve the quality of health care in Australia. It was recognised that the QUM indicators could play an important role assisting Australian hospitals to monitor or gather evidence in order to develop the evidence-based improvement strategies required to fulfil the Standards, when gaps in hospital practice were identified.
Two strategies were devised to assist hospitals undertake activities in relation to meeting the Standards: reference to the action items of the relevant NSQHS Standards in each indicator’s specifications; and mapping of the individual indicators to the NSQHS Standards.
The QUM indicators were independently screened against the Standards and supporting documents for relevance by two pharmacists. When a consensus was not reached regarding the relevance of an indicator to an action item of a Standard, a third reviewer arbitrated. Documents used for referencing were:
National Safety and Quality Health Service Standards (September 2012);7 Hospital Accreditation Workbook (October 2012);8 and Safety and Quality Improvement Guides Standards 1 – 10 (October 2012).9
Development of data collection toolsData collection tools were developed for the field testing of the new, revised and updated QUM indicators. Data collection tools had been previously developed for Indicators 2.1 and 5.3 for multisite projects coordinated by NSW TAG. The tool developers aimed to ensure a consistency across the tools in their design and approach to data collection and input. Wherever possible the data collection tools were used in field testing to test their functionality.
Sampling methodology guidance
Final Report: Development of the National Quality Use of Medicines Indicators for Australian Hospitals 2014

7
During the initial review of the QUM Indicators 2007 in 2012, it became apparent that there was a lack of knowledge regarding the methodology for conducting local quality improvement (QI) in many hospital practitioners. This required the sampling guidance in the 2007 QUM Indicator manual to be updated. This is supported by recent international literature.10-12
Participation in local QI is an essential component of the NSQHS Standards. While there is no single recommended methodology for QI, the lack of knowledge regarding methodology, in particular how to determine sample size and audit frequency, was recognized as a significant barrier to indicator utilisation and subsequent intervention. Additional guidance on how to monitor changes over time was also required. Given that there also exists potential for the indicators to be used for accountability or benchmarking activities, it is also important that auditors understand the limitations and advantages of the various methodologies.
Hence a document outlining the considerations required to successfully conduct intermittent or continuous quality improvement was developed in this phase of QUM indicator review project.
A targeted literature review was conducted regarding information on sampling for indicator collection. NSW Medicines Information Centre provided assistance in constructing the search and providing full text of relevant papers found. A targeted consultation was also conducted. Details of the literature review may be found in Appendix 4.
ResultsThe results of consultation and field testing are summarised below for each indicator. As the purpose of field testing was to ensure that each indicator had value for quality improvement, no interpretation of the actual data will be made.
Revised Indicators
Indicator 1.2The revised indicator proposed in the 2011/2012 review was not endorsed by the EAC. The following concerns were raised during the consultation process:
The indicator could be interpreted in different ways by different practitioners; Depending on their interpretation some sites may only look at appropriateness of VTE prophylaxis for
patients with documented risk assessment, which could skew results significantly; Documentation of risk assessment is variable and whilst a national inpatient medication chart with VTE
section is being developed, this will only provide a “tick-box” and no space for justification of risk category.
It would not allow for benchmarking between different hospitals. Whilst the most frequent gap in appropriate use of VTE prophylaxis is under-prescription, the indicator
did not account for over-prescription, which increases the risk of adverse bleeding events.
The indicator was modified to account for these issues and the field tested indicator was: Percentage of hospitalised adult patients that receive venous thromboembolism prophylaxis appropriate to their level of risk.
Indicator 1.2 was field tested in four hospitals, whose adult bed numbers ranged between 100 and 500. The data collection tool enabled collection of information on the various components of VTE risk assessment and appropriate use of VTE prophylaxis, in order that hospitals may identify and target specific areas for quality improvement. The indicator results obtained by each hospital are shown in Table 1. Table 2 displays the responses received in the post-testing questionnaires:
Table 1: Collated field testing data for Indicator 1.2
Final Report: Development of the National Quality Use of Medicines Indicators for Australian Hospitals 2014

8
Site Local VTE guideline in use?
Total Number of Patients Audited
Number of patients who had a documented VTE risk assessment
% of patients who had a documented VTE risk assessment
1 Yes 30 14 46.7
2 Yes 50 20 40
3 No 91 11 12.1
4 In surgery and obstetrics only 50 1 2
Site % of patients who did not receive pharmacological prophylaxis when indicated
% of patients who did not receive mechanical prophylaxis when indicated
% of patients who did not receive prophylaxis according to guidelines when indicated
% of patients who received prophylaxis when NOT indicated
Number of patients who received prophylaxis appropriate to their level of risk
% of patients who received VTE prophylaxis appropriate to their level of risk
1 6.7 0 0 6.7 28 93.3
2 26 16 38 2 30 60
3 11 11 22 4.4 67 73.6
4 2 4 6 24 35 70
Final Report: Development of the National Quality Use of Medicines Indicators for Australian Hospitals 2014

9
Table 2: Post-testing questionnaire responses for Indicator 1.2
Site 1 2 3 4
Do you think the data obtained fully addresses the purpose of the indicator?
Yes Yes Yes Yes
Did collecting data for this indicator provide any other useful information?
Yes Yes Yes No
Did you have any difficulties in collecting data for this indicator?
No No Yes Yes
Do you think the key definitions provided are adequate?Yes Yes Yes No
Do you think the numerator provided for this indicator is appropriate, i.e. was the suggested sample easy to identify?
Yes No Yes No
Do you think the denominator provided for this indicator is appropriate, i.e. was the suggested sample easy to identify?
Yes Yes Yes Yes
Do you think the suggested sample size is appropriate?Yes No Yes No
Do you think the instructions for data collection are adequate?
Yes Yes Yes No
Do you think the suggested data sources are appropriate?Yes Yes Yes Yes
Do you think data collection for this indicator could be combined with other indicators?
No No Yes, 1.1 -
Would you use the result from this indicator to guide a review or change in practice in your hospital?
Yes Yes Yes Yes
Would you be comfortable using this indicator to compare your performance now with your performance at a later date?
Yes Yes Yes Yes
Would you be comfortable using this indicator to compare your performance with other similar hospitals?
Yes Yes Yes Yes
Overall, was the data collection for this indicator useful?Yes Yes Yes Yes
Did the data collection tool enable you to identify areas to target for quality improvement?
Yes Yes Yes Yes
Final Report: Development of the National Quality Use of Medicines Indicators for Australian Hospitals 2014

10
The data for this indicator was collected by pharmacists and nurses. Data collection took between seven and twenty minutes per patient. Data sources used were medication charts and medical records, as well as direct patient observation.
Results of field testing were reviewed by the EAC. Indicator 1.2 was deemed to be useful and measurable. There were a number of questions regarding interpretation of the audit criteria and concerns were raised over the ability for different auditors to be consistent in data collection, particularly when there was no local VTE prophylaxis guideline. The EAC agreed that local audit teams should agree on the key definitions for each audit criteria and that TAG should not provide definitions. Both sites that did not have locally agreed VTE prophylaxis guidelines for all patients indicated that the use of the indicator had highlighted a need for guidelines. It is therefore anticipated that this indicator will promote the development and implementation of local VTE prophylaxis guidelines. With these minor changes the indicator was approved and finalised for publication.
Indicators 2.3a and 2.3bThe proposed revised indicators were considerably different from the 2007 aminoglycoside indicator due to a significant change in recommended practice with the publication of the Therapeutic Guidelines: Antibiotics, Version 14 in 2010.13 The updated Therapeutic Guidelines recommend the following:
aminoglycosides should be used for short-term empirical therapy of serious infections possibly caused by Gram-negative organisms and when used empirically no further doses of aminoglycoside should be given beyond 48 hours;
aminoglycoside therapy should only be continued beyond 48 hours if a susceptible Gram-negative organism is identified and the patient has an indication for directed therapy;
monitoring of aminoglycoside plasma concentrations is not required if the clinical plan is to cease therapy within 72 hours of commencement; and
area under the curve (AUC) methods should be used to monitor plasma concentrations in adults.
The 2011/2012 QUM indicator review aimed to address adherence to the various aspects of the revised Therapeutic Guidelines with provision of two indicators targeting appropriate continuation of therapy beyond 48 hours (Indicator 2.3a) and appropriate monitoring of plasma concentrations using recommended AUC methods (Indicator 2.3b).
Consultation with the EAC and antimicrobial experts identified a number of issues with the feasibility of Indicator 2.3b. Few patients proceed to directed therapy and require plasma concentration monitoring. Access to the recommended AUC monitoring methods and availability of trained personnel in these methods is inconsistent across the country and outside the control of practicing clinicians. It was predicted that Indicator 2.3b would not have a significant impact on QUM.
The EAC reviewed the expert comments and decided that Indicator 2.3b should be discarded as it did not fit the criteria for an acceptable indicator. The EAC was aware that the Therapeutic Guidelines: Antibiotics 2010 was under review and that recommendations regarding aminoglycoside monitoring may change in view of the variability in adherence across the country. It was decided that additional information would be collected during field testing of indicator 2.3a to provide information on current QUM issues surrounding aminoglycoside use, including the need for an indicator targeting therapeutic drug monitoring.
There was strong support for Indicator 2.3a from the consultation, and it became Indicator 2.3:Percentage of patients in whom doses of empirical aminoglycoside therapy are continued beyond 48 hours.
Indicator 2.3 was field tested in four hospitals with varying demographics and casemix, including those with paediatric and neonatal units. The data collection tool enabled information on the various components of aminoglycoside prescribing to be recorded, in order that hospitals may identify and target specific areas for quality improvement. Additional data was collected to inform the review, as mentioned above. The indicator results obtained by each hospital and their feedback are displayed in Table 3 and 4, respectively.Final Report: Development of the National Quality Use of Medicines Indicators for Australian Hospitals 2014

11
Table 3: Collated field testing data for Indicator 2.3
Site Total Number of Patients Audited
% of patients who received an appropriate initial dose
% of patients whose initial dose was too high according to their age and weight
% of patients whose initial dose was too low according to their age and weight
Number of patients whose therapy was continued without documentation of it being directed therapy
Mean length of therapy for patients who did not have a documented reason for continuation (days)
% of patients in whom empirical therapy was continued beyond 48 hours
1 2 100 0 0 0 n/a 02 7 71.4 0 28.6 3 4 42.93 31 100 0 0 6 6 19.44 7 28.6 0 71.4 7 3.6 100.0
Site % of patients who received gentamicin
% of patients who received tobramycin
% of patients who received amikacin
% of patients who received intermittent dosing
% of patients who received multiple daily dosing
1 100.0 0.0 0.0 0.0 0.02 71.4 0.0 28.6 0.0 85.73 80.6 12.9 6.5 45.1 54.84 100 0 0 100 0
Site Number of patients who received directed aminoglycoside therapy in a one month period
% of patients whose plasma concentrations were measured during the first 48 hours of therapy
% of patients whose plasma concentrations were measured at or around 72 hours
1 2 50 1002 4 28.6 28.63 25 45.2 38.74 0 14.3 42.9
Final Report: Development of the National Quality Use of Medicines Indicators for Australian Hospitals 2014

12
The following responses were provided in the post-testing questionnaires:
Table 4: Post-testing questionnaire responses for Indicator 2.3
Site 1 2 3 4Do you think the data obtained fully addresses the purpose of the indicator? Yes No Yes Yes
Did collecting data for this indicator provide any other useful information? No Yes Yes Yes
Did you have any difficulties in collecting data for this indicator? Yes No No No
Do you think the key definitions provided are adequate? No Yes Yes YesDo you think the numerator provided for this indicator is appropriate, i.e. was the suggested sample easy to identify? No No Yes Yes
Do you think the denominator provided for this indicator is appropriate, i.e. was the suggested sample easy to identify? No No Yes Yes
Do you think the suggested sample size is appropriate? No No Yes YesDo you think the instructions for data collection are adequate? No Yes Yes Yes
Do you think the suggested data sources are appropriate? Yes Yes Yes Yes
Do you think data collection for this indicator could be combined with other indicators?
No Yes, 2.5 NoYes, other antibiotic indicators
Would you use the result from this indicator to guide a review or change in practice in your hospital? No Yes Yes Yes
Would you be comfortable using this indicator to compare your performance now with your performance at a later date?
No No Yes Yes
Would you be comfortable using this indicator to compare your performance with other similar hospitals? No Yes Yes Yes
Overall, was the data collection for this indicator useful? No Yes Yes YesDid the data collection tool enable you to identify areas to target for quality improvement? No Yes Yes Yes
The data for this indicator was collected by pharmacists in all sites. Data collection took between 2 and 20 minutes per patient. A variety of data sources were used including medication charts, medical records, pharmacy dispensing systems and pathology systems.
Results and feedback for Indicator 2.3 were reviewed by the EAC. Several sites did not find this indicator useful due to small patient numbers. Additionally sites had few patients proceeding to directed therapy. These sites were recognised as having good processes for stewardship of aminoglycosides. Sites that had less rigorous adherence to aminoglycoside prescribing guidelines found the indicator more useful. The EAC decided that the indicator should be retained due to its utility in sites that wish to identify or monitor this practice gap.
It was highlighted that the indicator was used in a number of cystic fibrosis patients in one hospital. It was agreed that these patients should be excluded as therapy is generally “directed” at initiation. Exclusion of patients whose therapy is “directed” at the outset was clarified within the indicator. The numerator description was amended to reflect the title of the indicator.
Final Report: Development of the National Quality Use of Medicines Indicators for Australian Hospitals 2014

13
Further suggestions to improve the clarity of the indicator were made in the feedback provided by field testing sites, particularly with regard to the key definitions. The indicator document was modified to ensure clarity and finalised for publication.
Indicator 5.1Following consultation including feedback from the Cardiac Society of Australia and New Zealand and the Heart Foundation of Australia, it was decided that the definition of the term “appropriate medications” in this indicator would be amended. It was agreed patients having a documented reason for non-prescription of one or more of the standard medications should be ‘defined’ as being on appropriate therapy, such as patients with a contraindication to the medication or those with a documented plan to start in the future. The definitions within the indicator were updated to reflect this.
The field tested indicator was: Percentage of patients with acute coronary syndrome that are prescribed appropriate medications at discharge.
Indicator 5.1 was field tested in three hospitals. All hospitals had electronic discharge management systems that allowed for simple collection of the required data. The data collection tool enabled information on the various components of appropriate prescribing for acute coronary syndrome patients to be recorded, in order that hospitals may identify and target specific areas for quality improvement. Data could be broken down to look at rates of individual medication use and rates of documentation of reasons for non-prescription, as well as by diagnosis. The indicator results and post-field testing feedback are shown in Tables 5 and 6, respectively. (Full breakdowns not shown).
Table 5: Collated field testing data for Indicator 5.1
Site Total number of patients audited
% of patients prescribed an antiplatelet agent or with a documented reason for non-prescription
% of patients prescribed a beta blocker or with a documented reason for non-prescription
% of patients prescribed an ACEI or ARA or with a documented reason for non-prescription
% of patients prescribed a statin or with a documented reason for non-prescription
1 35 94.3 68.6 48.6 80.0
2 60 100 100 88.3 100
3 27 100 81.5 63 96.3
Site Total number of patients receiving all 4 classes of medications
% of patients prescribed all 4 classes of medications
Total number of patients prescribed appropriate medications at discharge
% of patients prescribed appropriate medications at discharge
1 7 20.0 9 25.7
2 43 71.7 53 88.3
3 13 48.1 14 51.9
Final Report: Development of the National Quality Use of Medicines Indicators for Australian Hospitals 2014

14
Table 6: Post-testing questionnaire responses for Indicator 5.1
Site 1 2 3Do you think the data obtained fully addresses the purpose of the indicator? Yes Yes Yes
Did collecting data for this indicator provide any other useful information? Yes No Yes
Did you have any difficulties in collecting data for this indicator? Yes No No
Do you think the key definitions provided are adequate? Yes Yes YesDo you think the numerator provided for this indicator is appropriate, i.e. was the suggested sample easy to identify? Yes Yes Yes
Do you think the denominator provided for this indicator is appropriate, i.e. was the suggested sample easy to identify? Yes Yes Yes
Do you think the suggested sample size is appropriate? Yes Yes YesDo you think the instructions for data collection are adequate? Yes Yes Yes
Do you think the suggested data sources are appropriate? Yes Yes YesDo you think data collection for this indicator could be combined with other indicators? Yes No Yes
Would you use the result from this indicator to guide a review or change in practice in your hospital? Yes Yes Yes
Would you be comfortable using this indicator to compare your performance now with your performance at a later date?
Yes No Yes
Would you be comfortable using this indicator to compare your performance with other similar hospitals? Yes Yes Yes
Overall, was the data collection for this indicator useful? Yes Yes YesDid the data collection tool enable you to identify areas to target for quality improvement? Yes Yes Yes
The data for this indicator was collected by pharmacists and medical staff. Senior medical staff supported indicator measurement. Data collection took approximately five to ten minutes per patient. A variety of data sources were used including medication charts, medical records and discharge summaries, the majority of which were electronic.
Field testing results were reviewed by the EAC. All sites found the indicator useful and measurable. During field testing it became apparent that different sites were using different sources to check for documentation of reasons for non-prescription of the standard medications. It was clarified within the indicator document that documentation must be in the patient’s discharge summary. The indicator was otherwise unchanged and was finalised for publication.
Indicator 5.2Similar feedback was received following consultation including feedback from the Cardiac Society of Australia and New Zealand and the Heart Foundation of Australia, with regard to the definition of the term “appropriate medications” as was received for Indicator 5.1. The definitions within the indicator were revised such that if there was a documented reason for non-prescription of the recommended medications (ACE inhibitors / ARBs and beta-blockers), the patient would be deemed to be on appropriate therapy. Consultation also revealed that identification of systolic heart failure patients was difficult given that no ICD-10 code specifically identifies this Final Report: Development of the National Quality Use of Medicines Indicators for Australian Hospitals 2014

15
group of patients. It was decided that the patient group should be determined by the documentation of heart failure type provided in the discharge summary. It was also decided that patients with no documentation of heart failure type in their discharge summary should be assumed to have systolic heart failure due to a likely benefit of using these medications in these patients and a lack of evidence for harm. It was also considered that auditing of the number of patients without a documented heart failure type might reveal an additional gap in meeting best-practice guidelines.
The field tested indicator was: Percentage of patients with systolic heart failure that are prescribed appropriate medications at discharge
Indicator 5.2 was field tested in three hospitals. The data collection tool enabled information on the various components of appropriate prescribing for systolic heart failure patients to be recorded, in order that hospitals may identify and target specific areas for quality improvement. Data could be broken down to look at rates of use of each individual medication, rates of documentation of reasons for non-prescription and according to whether the type of heart failure was documented. The indicator results for all heart failure patients in the sample and those with documented systolic heart failure as well as feedback from the post-field testing questionnaire are shown in Tables 7, 8 and 9, respectively.
Table 7: Collated field testing data for Indicator 5.2
Site Total number of patients audited
% of patients prescribed an ACEI or ARA or with a documented reason for non-prescription
% of patients prescribed a beta blocker or with a documented reason for non-prescription
Total number of patients prescribed both classes of medications
% of patients prescribed both classes of medications at discharge
Total number of patients prescribed appropriate medications at discharge
% of patients prescribed appropriate medications at discharge
1 45 22.2 40.0 5 11.1 5 11.12 69 85.5 94.2 44 63.8 55 79.73 84 61.9 64.3 35 41.7 39 46.4
Table 8: Collated field testing data for Indicator 5.2: Patients with documented systolic heart failure
Site Number of patients with documented systolic heart failure
% of patients with documented systolic HF prescribed an ACEI or ARA or with a documented reason for non-prescription
% of patients with documented systolic HF prescribed a beta blocker or with a documented reason for non-prescription
Number of patients with documented systolic HF prescribed both classes of medications
% of patients with documented systolic HF prescribed both classes of medications at discharge
Number of patients with documented systolic HF prescribed appropriate medications at discharge
% of patients with documented systolic HF prescribed appropriate medications at discharge
1 12 41.7 0 4 33.3 4 33.32 67 86.6 94 43 64.2 54 80.63 23 65.2 69.6 11 47.8 12 52.2
Final Report: Development of the National Quality Use of Medicines Indicators for Australian Hospitals 2014

16
Table 9: Post-testing questionnaire responses for Indicator 5.2
Site 1 2 3Do you think the data obtained fully addresses the purpose of the indicator? Yes Yes No
Did collecting data for this indicator provide any other useful information? No No No
Did you have any difficulties in collecting data for this indicator? No No No
Do you think the key definitions provided are adequate? Yes Yes NoDo you think the numerator provided for this indicator is appropriate, i.e. was the suggested sample easy to identify? Yes Yes Yes
Do you think the denominator provided for this indicator is appropriate, i.e. was the suggested sample easy to identify? Yes Yes Yes
Do you think the suggested sample size is appropriate? Yes Yes YesDo you think the instructions for data collection are adequate? Yes Yes No
Do you think the suggested data sources are appropriate? Yes Yes -Do you think data collection for this indicator could be combined with other indicators? No Yes, 5.1 -
Would you use the result from this indicator to guide a review or change in practice in your hospital? Yes Yes -
Would you be comfortable using this indicator to compare your performance now with your performance at a later date?
Yes Yes No
Would you be comfortable using this indicator to compare your performance with other similar hospitals? Yes Yes No
Overall, was the data collection for this indicator useful? Yes Yes NoDid the data collection tool enable you to identify areas to target for quality improvement? Yes Yes No
Data for this indicator was collected by pharmacists and nurses. Senior medical staff supported indicator measurement. Data collection was reported to take between three and ten minutes per patient. A variety of data sources were used including discharge summaries, discharge prescriptions and consultant letters.
It became apparent after field testing that different sites used different sources to check for documentation of reasons for non-prescription of the standard medications. One auditor used variety of sources such as echocardiogram reports to identify heart failure type. It was clarified within the indicator document that documentation must be in the patient’s discharge summary. The indicator was otherwise unchanged.
New Indicators for Continuity of Medication Management at Discharge
Indicator 5.8As a result of the literature review, consultation and EAC consideration, the proposed indicator was: Percentage of discharged patients with a reconciled discharge medication summary
Indicator 5.8 was field tested in six hospitals in three states, ranging from small rural to large metropolitan sites. The data collection tool enabled information on the various components of the medication reconciliation process to be recorded, in order that hospitals may identify and target specific areas for quality improvement. The indicator results obtained by each hospital and feedback are shown in Tables 10 and 11.
Final Report: Development of the National Quality Use of Medicines Indicators for Australian Hospitals 2014

17
Table 10: Collated field testing data for Indicator 5.8
Site Total Number of Patients Audited
% of patients with a documented discharge medication summary
% of patients with a reconciled admission medication list (or documentation of no regular medications)
% of patients with a documented plan for each admission medication
% of patients with documented plan for each medication initiated during admission
Total number of patients with a reconciled discharge medication summary
% of patients with a reconciled discharge medication summary
1 51 100 45 39 59 22 432 50 58 56 0 0 0 03 40 80 30 2.5 0 0 04 30 83 80 70 50 7 235 50 96 18 16 82 8 186 30 97 97 93 97 29 97
The following responses were provided in the post-testing questionnaires:
Table 11: Post-testing questionnaire responses for Indicator 5.8
Site 1 2 3 4 5 6Do you think the data obtained fully addresses the purpose of the indicator? Yes No - Yes No No
Did collecting data for this indicator provide any other useful information? Yes Yes Yes No Yes Yes
Did you have any difficulties in collecting data for this indicator? Yes No Yes No Yes Yes
Do you think the key definitions provided are adequate? Yes No Yes Yes Yes NoDo you think the numerator provided for this indicator is appropriate, i.e. was the suggested sample easy to identify? Yes No Yes Yes Yes Yes
Do you think the denominator provided for this indicator is appropriate, i.e. was the suggested sample easy to identify? Yes Yes Yes Yes Yes Yes
Do you think the suggested sample size is appropriate? No No Yes Yes No YesDo you think the instructions for data collection are adequate? No Yes Yes Yes Yes Yes
Do you think the suggested data sources are appropriate? Yes Yes Yes Yes Yes YesDo you think data collection for this indicator could be combined with other indicators?
Yes, 5.9
Yes, 5.3,5.9
Yes, 5.9
Yes, 5.9
Yes, 5.9
Yes, 5.9
Would you use the result from this indicator to guide a review or change in practice in your hospital? Yes Yes* Yes Yes Yes Yes
Would you be comfortable using this indicator to compare your performance now with your performance at a later date?
Yes Yes* Yes No No Yes
Would you be comfortable using this indicator to compare your performance with other similar hospitals? Yes Yes* Yes No Yes Yes
Overall, was the data collection for this indicator useful? Yes Yes Yes Yes Yes YesDid the data collection tool enable you to identify areas to target for quality improvement? Yes Yes Yes Yes Yes Yes
*If the indicator was revisedFinal Report: Development of the National Quality Use of Medicines Indicators for Australian Hospitals 2014

18
The data for this indicator was collected by pharmacists and nurses. Data collection took between two and fifteen minutes per patient, longer if combined with other indicators. A variety of data sources were used including medication charts, medical records, discharge summaries, pharmacy dispensing systems and medication management plans.
The EAC reviewed the results of field testing. There was varying opinion on the usefulness of this indicator because of the perceived inability to achieve positive results within current medication management systems. It was recognised that different hospitals have very different discharge processes and it is not always possible to reconcile the medication summary due to the timing of its preparation. There were a number of suggestions from the testing sites to alter the focus of this indicator. The EAC agreed that the actual goal should be provision of an accurate and comprehensive discharge medication summary, and that the focus should be changed from measuring the rate at which reconciliation occurs to measuring the rate at which an accurate and comprehensive medication list is provided within the discharge summary. It was acknowledged that hospitals, which have effective medication reconciliation processes in place at discharge will inherently have better results.
The indicator was revised and its title became:Percentage of discharge summaries that contain an accurate and comprehensive list of medicines
A further phase of field testing was considered necessary and QUM Indicator 5.8b was field tested in four hospitals in two states, including metropolitan and regional sites and those providing specialist services. The data collection tool enabled information of the various components required for an accurate and comprehensive medication list in a discharge summary to be recorded, in order that hospitals may identify and target specific areas for quality improvement. The indicator results obtained by each hospital and feedback are shown in Tables 12 and 13, respectively.
Sites reported spending five to fifteen minutes retrieving data from each patient record. All used pharmacists to collect data. No site reported difficulties collecting the data; one site noted that ease of data collection would depend on internal systems in place. Two sites thought annual collection would be appropriate. Changes such as new Junior Medical Officer rotation or changes to discharge summary processes might also be an appropriate time to measure this indicator. Staffing levels were perceived to be the most common limitation to uptake of indicator measurement. One site who had field tested the previous version of indicator 5.8 commented that the new version was much more user friendly.
All sites reported that they believed indicator results could guide a review or change in hospital practice and was suitable for intra and inter-hospital comparison (of similar hospitals).
The EAC reviewed the results of field testing and feedback provided by the testing sites. The indicator was modified to include the word ‘current’ to describe the discharge medication summary in order to align with the NSQHS Standards. It was clarified that the indicator would only be measured in those taking medicines at discharge.
The finalised indicator (Indicator 5.8, Version1) was:Percentage of patients whose discharge summaries contain a current, accurate and comprehensive list of medicines
Final Report: Development of the National Quality Use of Medicines Indicators for Australian Hospitals 2014

19
Table 12: Collated field testing data for Indicator 5.8bSite Total Number
of Patients Sampled
% of patients audited (taking medicines at discharge)
% of lists with missing information regarding ongoing medicine
% of lists with missing ongoing medication
% of lists with medicines prescribed that should not be continued on discharge
% of lists with incomplete or incorrect documented allergies
% of discharge summaries that contain an accurate and comprehensive list of medicines
1 50 50 34 20 14 4 382 30 27 13 23 0 23 503 30 30 23 23 0 3 674 30 21 7 10 0 23 70
Table 13: Post-testing questionnaire responses for Indicator 5.8bSite 1 2 3 4
Do you think the data obtained fully addresses the purpose of the indicator? Yes Yes Yes YesDid collecting data for this indicator provide any other useful information? - Yes - YesDid you have any difficulties in collecting data for this indicator? No No No NoDo you think the key definitions provided are adequate? Yes Yes Yes YesDo you think the numerator provided for this indicator is appropriate, i.e. was the suggested sample easy to identify? Yes Yes Yes Yes
Do you think the denominator provided for this indicator is appropriate, i.e. was the suggested sample easy to identify? Yes Yes Yes Yes
Do you think the instructions for data collection are adequate? Yes Yes Yes YesDo you think the suggested data sources are appropriate? Yes Yes Yes YesDo you think data collection for this indicator could be combined with other indicators? - Yes, 5.9 - NoWould you use the result from this indicator to guide a review or change in practice in your hospital? Yes Yes* Yes YesWould you be comfortable using this indicator to compare your performance now with your performance at a later date? Yes Yes* Yes yes
Would you be comfortable using this indicator to compare your performance with other similar hospitals? Yes Yes* Yes Yes, if similar hospital
Overall, was the data collection for this indicator useful? - Yes - YesDid the data collection tool enable you to identify areas to target for quality improvement? - Yes - Yes
Final Report: Development of the National Quality Use of Medicines Indicators for Australian Hospitals 2014

20
Indicator 5.9The proposed indicator was:
Percentage of patients who receive a reconciled medication list at the time of hospital discharge
Indicator 5.9 was field tested in six hospitals in three states, ranging from small rural to large metropolitan sites. The data collection tool enabled information on the various components of the indicator to be recorded, in order that hospitals may identify and target specific areas for quality improvement, for example the inclusion in the medication list of specific instructions for patients, allergies or intolerances and changes to therapy. It also enabled an assessment of whether the medication list had been reconciled, acknowledging that there are a number of different processes by which this may occur. The indicator results and feedback are shown in Tables 14 and 15, respectively.
Table 14: Collated field testing data for Indicator 5.9
Site Total Number of Patients Audited
% of patients for whom a medication list was prepared
% of lists that contain all medications to be taken by the patient after discharge
% of lists that contain clear instructions on dose to be taken for each medication
% of lists that contain clear instructions on the frequency with which each medication should be taken
% of lists that contain a description of all changes to therapy
1 32 81 100 7.7 88.5 422 30 40 100 100 100 03 30 33 100 100 100 1004 40 7.5 100 100 100 335 100 5 20 20 20 206 30 100 97 100 100 97
Site % of lists that contain allergy/ADR information
% of lists prepared using a reconciled discharge medication summary or discharge prescription
% of lists fully reconciled with all relevant sources
% of lists that were appropriately reconciled by either means
Total number of patients who received a reconciled discharge medication list
% of patients who received a reconciled discharge medication list
1 100 92 0 92 1 32 0 100 0 100 0 03 100 0 100 100 10 334 33 33 0 33 1 2.55 20 60 100 100 1 16 87 100 0 100 24 80
Final Report: Development of the National Quality Use of Medicines Indicators for Australian Hospitals 2014

21
Table 15: Post-testing questionnaire responses for Indicator 5.9
Site 1 2 3 4 5 6Do you think the data obtained fully addresses the purpose of the indicator? No No Yes Yes No Yes
Did collecting data for this indicator provide any other useful information? Yes Yes Yes Yes Yes Yes
Did you have any difficulties in collecting data for this indicator? No No Yes No Yes Yes
Do you think the key definitions provided are adequate? Yes Yes Yes Yes Yes NoDo you think the numerator provided for this indicator is appropriate, i.e. was the suggested sample easy to identify? Yes Yes/No Yes Yes Yes Yes
Do you think the denominator provided for this indicator is appropriate, i.e. was the suggested sample easy to identify? Yes Yes Yes Yes Yes Yes
Do you think the suggested sample size is appropriate? No No Yes Yes No YesDo you think the instructions for data collection are adequate? Yes Yes Yes Yes Yes Yes
Do you think the suggested data sources are appropriate? Yes Yes Yes Yes Yes YesDo you think data collection for this indicator could be combined with other indicators?
Yes, 3.1
Yes, 5.3,5.8
Yes, 5.9
Yes, 5.9 Yes Yes,
5.9Would you use the result from this indicator to guide a review or change in practice in your hospital? Yes Yes Yes Yes Yes Yes
Would you be comfortable using this indicator to compare your performance now with your performance at a later date?
Yes Yes Yes Yes No Yes
Would you be comfortable using this indicator to compare your performance with other similar hospitals? No No Yes Yes Yes Yes
Overall, was the data collection for this indicator useful? Yes Yes Yes Yes Yes YesDid the data collection tool enable you to identify areas to target for quality improvement? Yes Yes Yes Yes Yes Yes
The results of field testing were reviewed by the EAC. Some sites reported that this indicator was difficult to measure due to the lack of documentation that medication reconciliation has occurred when supplying a discharge medication list. Sites that performed well generally made assumptions that reconciliation had occurred because they have standard processes in place for reconciliation. It was recognised that the processes for medication reconciliation at discharge are very different across different sites and that documentation is variable. It was agreed that whatever the process the goal should be provision of an accurate and comprehensive medication list to the patient and that the indicator should be amended to reflect this. As for indicator 5.8, those hospitals with effective medication reconciliation processes in place would be expected to achieve better results for this indicator and therefore the indicator will promote improvement of discharge processes.
Other comments received regarding this indicator were that not all patients would require a medication list and hospitals generally prioritise higher risk patients. This was discussed by the EAC in the context of the NSQHS Standards, which specify that all patients should receive a medication list. The Standards do recognise that where resources are limited, patients should be prioritised according to need. It was decided to add a recommendation within the indicator that hospitals audit against local policy for provision of medication lists.
The indicator was revised and given the following new title:
Final Report: Development of the National Quality Use of Medicines Indicators for Australian Hospitals 2014

22
Percentage of patients who receive an accurate and comprehensive medication list at the time of hospital discharge
A further phase of field testing was considered necessary. QUM Indicator 5.9b was field tested in three hospitals in two states, including metropolitan and regional sites. Recruitment of participant hospitals was challenging for this indicator because hospitals believed they would perform badly. It became apparent that there is a lack of systems in place for developing and storing copies of medication lists in many Australian hospitals. While pharmacy software may assist the provision of medication lists there remain a number of limitations. Moreover there are generally two electronic systems within hospitals that are involved in the formulation of a medication list which are not usually integrated. Provision of patient medication lists is usually confined to vulnerable patients such as those aged over 65 years or on more than five medicines. Provision of medication lists in hospitals is more likely where there is a dedicated pharmacist caring for complex patients such as in clinics or wards caring for renal or transplant patients. The data collection tool enabled information of the various components required for an accurate and comprehensive patient medication list to be recorded, in order that hospitals can identify and target specific areas for quality improvement. The indicator results obtained by each hospital and their feedback are shown in Tables 16 and 17, respectively.
Sites reported spending five to ten minutes retrieving data from each patient record. All used pharmacists or pharmacy interns to collect data. Two sites confined their sample to those aged 65 years and over. One site noted that ease of data collection would depend on what internal systems were in place. Sites reported that until appropriate systems were in place, there may be a reluctance to undertake Indicator 5.9b measurement. While there was reluctance to compare results with other hospitals, the sites did report that they would consider future measurement once systems were in place. Documentation sources for data collection varied between the hospitals underscoring the variability in practice regarding medication management processes at discharge.
The EAC reviewed the results of field testing. The indicator was modified to include the word ‘current’ to describe the patient’s medication list in order to align with the NSQHS Standards. It was clarified that the indicator would only be measured in those taking medicines at discharge.
The data collection tool would enable a primary indicator calculation using the denominator of all patients taking medicines at discharge and a secondary calculation using a denominator of all patients who received a medication list, acknowledging that there are two goals with respect to provision of patient medication lists:
that they are accurate and comprehensive; and that every patient taking medicines at discharge receives a medication list.
The EAC acknowledged that the indicator would be aspirational in the current Australian hospital setting.
The finalised indicator (Indicator 5.9, version 1) was:
Percentage of patients who receive a current, accurate and comprehensive medication list at the time of hospital discharge
Final Report: Development of the National Quality Use of Medicines Indicators for Australian Hospitals 2014

23
Table 16: Collated field testing data for Indicator 5.9bSite Total Number
of Patients Sampled
% of patients who received medication list
% of lists missing active ingredient names
% of lists with medical abbreviations
% of lists with missing medicines
% of lists with missing information
% of lists with missing information about changes
% of lists with missing allergy information
% of discharge summaries that contain an accurate and comprehensive list of medicines
1 61 49 0 0 0 0 0 100 47.52 30 17 40 0 0 03 28 43 0 0 0 0 100 100 0
Table 17: Post-testing questionnaire responses for Indicator 5.9bSite 1 2 3
Do you think the data obtained fully addresses the purpose of the indicator? Yes Yes YesDid collecting data for this indicator provide any other useful information? Yes Yes -Did you have any difficulties in collecting data for this indicator? No Yes NoDo you think the key definitions provided are adequate? Yes Yes YesDo you think the numerator provided for this indicator is appropriate, i.e. was the suggested sample easy to identify? Yes Yes Yes#
Do you think the denominator provided for this indicator is appropriate, i.e. was the suggested sample easy to identify? Yes Yes Yes#
Do you think the instructions for data collection are adequate? Yes Yes YesDo you think the suggested data sources are appropriate? Yes Yes YesDo you think data collection for this indicator could be combined with other indicators? - - -Would you use the result from this indicator to guide a review or change in practice in your hospital? Yes Yes* No%
Would you be comfortable using this indicator to compare your performance now with your performance at a later date? Yes Yes* No
Would you be comfortable using this indicator to compare your performance with other similar hospitals? No No NoOverall, was the data collection for this indicator useful? Yes No* -Did the data collection tool enable you to identify areas to target for quality improvement? Yes Yes -
*the current hospital systems used to provide medication lists do not support the and many hospitals use different processes. If there was an improvement in recording, system integration and consistency between hospitals, comparison within and between hospitals may be possible; #if limitations and interpretations in indicator specifications taken into account; %did not feel indicator identified those patients requiring medication lists.
Final Report: Development of the National Quality Use of Medicines Indicators for Australian Hospitals 2014

24
New QUM Indicators for Acute Mental Health Care
Indicator 7.1The proposed indicator was: Percentage of ‘as required’ (PRN) psychotropic medication orders with documented indication, dose (or dose range), frequency and maximum daily dose specified
Six hospitals in three states field tested this indicator. Two were specialised mental health hospitals. The indicator results and feedback from each site are displayed in Tables 18 and 19, respectively.
Table 18: Collated field testing data for QUM Indicator 7.1
Site Number of patients audited
Total number of PRN orders in sample
% of 'as required' (PRN) psychotropic medication orders with indication specified
% of 'as required' (PRN) psychotropic medication orders with dose (or dose range) specified
% of 'as required' (PRN) psychotropic medication orders with frequency specified
% of 'as required' (PRN) psychotropic medication orders with maximum daily dose specified
% of 'as required' (PRN) psychotropic medication orders with documented indication, dose (or dose range), frequency and maximum daily dose specified
1 42 96 93 100 80 86 702 N/A 200 71.5 100 32.5 99 23.53 44 164 Not reported Not reported Not reported Not reported 894 30 86 74 100 71 95 515 30 81 100 99 22 96 146 30 92 93.5 100 98 100 91
Final Report: Development of the National Quality Use of Medicines Indicators for Australian Hospitals 2014

25
Table 19: Post-testing questionnaire responses for QUM Indicator 7.1
Site 1 2 3 4 5 6Did you have any difficulties in collecting data for this indicator? No No No No No No
Do you think the key definitions provided are adequate? No No No Yes Yes Yes
Do you think the numerator provided for this indicator is appropriate, i.e. was the suggested sample easy to identify?
Yes Yes Yes Yes Yes Yes
Do you think the denominator provided for this indicator is appropriate, i.e. was the suggested sample easy to identify?
Yes Yes Yes Yes Yes Yes
Do you think the instructions for data collection are adequate? No Yes Yes Yes Yes Yes
Do you think the suggested data sources are appropriate? Yes Yes Yes Yes Yes Yes
Do you think data collection for this indicator could be combined with other indicators?
- - - - - -
Would you use the result from this indicator to guide a review or change in practice in your hospital?
Yes No Possibly Yes Yes Yes
Would you be comfortable using this indicator to compare your performance now with your performance at a later date?
Yes Yes Yes Yes Yes Yes
Would you be comfortable using this indicator to compare your performance with other similar hospitals?
Yes Yes Yes Yes Yes Yes
All hospitals had good results for specified dose and specified maximum daily dose. Hospitals with the lower overall results were chiefly let down by poor compliance with ‘frequency specified’ often written as ‘bd’, ‘tds’ or ‘qid’ rather than as an hourly frequency; and to a lesser extent ‘indication specified’. Time to collect data per medical record was half to five minutes. Pharmacists were auditors at all sites with one site reporting some input from medical staff. Four of the six sites used the data collection tool. This highlighted the requirement for sites to use the one data collection tool if a benchmarking activity using this or other indicators is undertaken as those sites that did not use the tool interpreted the specifications themselves and did not collect all ancillary data. Sites would also need to ensure that a list of psychotropics be agreed before data collection occurred.
In general, sites were happy to use this indicator to drive local practice change and use for intra- and inter-hospital comparisons. Indicator was easy to collect and did not take too much time.
Some sites reported potential improvements to data collection would be the use of electronic medicines management systems with one site recommending that data collection could be automated.
The EAC reviewed the results of field testing. It was agreed that the indicator should be amended to include the NIMC Paediatric requirements for PRN dosing (dose calculation), and clarification regarding frequency of dosing, the specific psychotropic medicines to be audited and the application of local policy regarding PRN medication orders be provided in the indicator specifications.
Final Report: Development of the National Quality Use of Medicines Indicators for Australian Hospitals 2014

26
With these amendments the indicator was accepted and finalised for publication.
Indicator 7.2The proposed indicator was: Percentage of patients taking lithium who receive appropriate monitoring during their inpatient episode.
Four hospitals in two states field tested this indicator. The results for each site are displayed in Table 20. Two sites provided data regarding baseline and on-going monitoring. These breakdowns are shown in Table 21.
Table 20: Collated field testing data for QUM Indicator 7.2
SiteNumber of
patients audited
% of patients whose renal function was monitored
appropriately
% of patients whose thyroid function was monitored
appropriately
% of patients whose plasma
levels were monitored
appropriately
% of patients taking lithium who received appropriate monitoring
1 36 86 83 75 612 30 100 93 97 903 8 100 100 100 1004 11 100 91 100 91
Table 21: Results broken down by baseline and ongoing monitoring
Site
Baseline monitoring On-going monitoring
Number of patients newly
initiated on lithium during hospitalisation
% of patients newly initiated on lithium
during hospitalisation who received appropriate monitoring
Number of patients on ongoing lithium
therapy
% of patients taking on-going lithium
therapy who received appropriate monitoring
1 9 22 27 742 9 78 21 95
Final Report: Development of the National Quality Use of Medicines Indicators for Australian Hospitals 2014

27
Table 22 displays the responses provided in the post-testing questionnaires:
Table 22: Post-testing questionnaire responses for QUM Indicator 7.2
Site 1 2 3 4Did you have any difficulties in collecting data for this indicator? No Yes Yes No
Do you think the key definitions provided are adequate? No Yes Yes Yes
Do you think the numerator provided for this indicator is appropriate, i.e. was the suggested sample easy to identify?
Yes Yes Yes Yes
Do you think the denominator provided for this indicator is appropriate, i.e. was the suggested sample easy to identify?
Yes Yes Yes Yes
Do you think the instructions for data collection are adequate? Yes Yes Yes Yes
Do you think the suggested data sources are appropriate? Yes Yes Yes Yes
Do you think data collection for this indicator could be combined with other indicators? - No - -
Would you use the result from this indicator to guide a review or change in practice in your hospital?
Yes Yes Possibly Yes
Would you be comfortable using this indicator to compare your performance now with your performance at a later date?
Yes Yes Yes Yes
Would you be comfortable using this indicator to compare your performance with other similar hospitals?
Yes Yes Yes Yes
Sites reported taking less than five minutes per record to collect data. Multiple data sources were used to identify patients and collect data. Three sites relied on electronic records for evidence of measurements (renal function, thyroid function and lithium concentrations). Sites with electronic pathology and medication management systems found data collection relatively easy. One site noted that it is possible that monitoring information could have been in written medical notes but time requirements to search these was not feasible. Identification of patients taking lithium was the most challenging aspect of this indicator.
The availability of electronic medication management systems (used by one field testing site) would greatly enhance uptake of this indicator. As lithium is not prescribed as frequently as it has been in the past, the ability to obtain the recommended sample number was difficult, particularly for two field testing sites. Despite this and the likelihood that much of lithium prescribing occurs in the community, the MHEAC took the view that the quality use of lithium was highly relevant to acute mental health care and an indicator was required. The results justified this position. Despite excellent performance with the indicators at most sites, documentation of baseline monitoring for those patients initiating lithium therapy during hospital admission was poorer than those on on-going therapy.
Monitoring requirements differ depending on whether a patient is being initiated on lithium (baseline monitoring) or receiving on-going lithium therapy (on-going monitoring) and this was built into the indicator specifications and data collection tool. Identification of community-based monitoring not included in the electronic medical record was difficult and time-consuming.
Final Report: Development of the National Quality Use of Medicines Indicators for Australian Hospitals 2014

28
Sites generally reported satisfaction with the indicator. One site had difficulty obtaining a large sample size and because the site showed excellent compliance with the indicator, they did not believe they would repeat the audit in the near future. Another site recommended annual or bi-annual data collection.
The EAC reviewed the results of field testing. It was agreed that the indicator be amended to ensure that the term ‘lithium concentration’ is used rather than ‘lithium level’ and that clarification regarding categorisation of recently initiated community-based lithium be included. The challenges of sample size requirements and recommendations highlighted the importance of the sampling guidance information being developed in conjunction with the indicators.
These amendments were made and the indicator was finalised for publication.
Indicator 7.3The proposed indicator was: Percentage of patients who receive written and verbal information on regular psychotropic medications initiated during their admission
Four hospitals in three states field tested this indicator. The results and feedback from each site are displayed in Tables 23 and 24.
Table 23: Collated field testing data for QUM Indicator 7.3
Site Number of patients audited
% of patients provided with written information on the last regular psychotropic medication initiated during their hospital admission
% of patients provided with verbal information on the last regular psychotropic medication initiated during their hospital admission
% of patients who received both written and verbal information on the last regular psychotropic medication initiated during their hospital admission
1 8 12.5 100 12.52 23 N/A N/A 653 23 39 74 354 30 27 63 27
Final Report: Development of the National Quality Use of Medicines Indicators for Australian Hospitals 2014

29
Table 24: Post-testing questionnaire responses for QUM Indicator 7.3
Site 1 2 3 4Did you have any difficulties in collecting data for this indicator? Yes Yes Yes No
Do you think the key definitions provided are adequate? No No No Yes
Do you think the numerator provided for this indicator is appropriate, i.e. was the suggested sample easy to identify?
Yes No No Yes
Do you think the denominator provided for this indicator is appropriate, i.e. was the suggested sample easy to identify?
Yes Yes Yes Yes
Do you think the instructions for data collection are adequate? Yes Yes Yes Yes
Do you think the suggested data sources are appropriate? - Yes Yes Yes
Do you think data collection for this indicator could be combined with other indicators?
Yes, ACHS Mental Health
Clinical Indicator 3.1
(2013)
- - -
Would you use the result from this indicator to guide a review or change in practice in your hospital?
Yes Yes Yes Yes
Would you be comfortable using this indicator to compare your performance now with your performance at a later date?
Yes Yes Yes Yes
Would you be comfortable using this indicator to compare your performance with other similar hospitals?
Yes Yes Yes Yes
Sites reported taking between five and 30 minutes per record to collect data. Sites commented on the time-consuming nature of the data collection, due to the requirements to determine whether a medicine was newly initiated and to refer to multiple data sources. The sample size varied between sites and relied on cases collected over a one-month period. The sampling guidance document may help sites determine what sample size best suits their requirements.
The indicator used a ‘patient’ denominator, which was more challenging than a ‘medication’ denominator. This made the data collection tool more cumbersome and some of the sites suggested that per medication would be better.
One site reported that additional information was gained from the audit, highlighting the poor documentation of information provision in the medical record. Another site reported that information provision is likely to occur more frequently than documentation might indicate.
The indicator identified the non-standardised and inconsistent documentation regarding provision of medicines information to patients and carers.
While all sites reported that they would be happy to use the indicator in a benchmarking activity, it is apparent that the different methods used to collect data would require standardisation and an agreed strategy regarding sample selection, size and definitions would be required. The indicator may be better utilised as part of routine Final Report: Development of the National Quality Use of Medicines Indicators for Australian Hospitals 2014

30
work with data collection of a small sample occurring frequently. This indicator could be modified for use in other hospitalised patients, either in general or in focused clinical areas such as HIV, oncology and transplant.
The EAC reviewed the results of field testing. It was agreed that the medicines to be included under the banner of psychotropics be clarified as well as the nature and extent of documentation regarding information provision. Clarification around the inclusion of dementia patients was recommended. The terminology ‘medication’ was changed to ‘medicine’ to be consistent across all QUM indicators. It was suggested that the data collection tool be updated to also identify who provides the information. Members of the Mental Health EAC were contacted to clarify whether the denominator should be per patient or per medicine and whether the indicators measurement should be confined to the medicines prescribed at discharge rather than to all newly prescribed medications throughout the admission as this could reduce perusal of the medical record and allow easier identification of patients. Consultation confirmed that the indicator should be applied to all newly prescribed medications throughout the admission.
Following the necessary content changes, the indicator was finalised for publication, with the slightly revised title:Percentage of patients who receive written and verbal information on regular psychotropic medicines initiated during their admission.
Indicator 7.4The proposed indicator was: Percentage of patients taking antipsychotic medications who receive appropriate monitoring for the development of metabolic side effects
Four hospitals in two states field tested this indicator. The indicator results for each site and feedback are displayed in Tables 25 and 26, respectively.
Table 25: Collated field testing data for QUM Indicator 7.4
Site Number of patients audited
% of patients whose waist circumference was recorded during their inpatient stay
% of patients who did not have their waist circumference recorded, but had weight recorded
% of patients who had their blood pressure recorded during their inpatient stay
% of patients who had fasting lipids recorded during their inpatient stay
% of all patients who had a fasting blood glucose level recorded during their inpatient stay
% of patients taking antipsychotics who received appropriate metabolic monitoring
1 16 31 9 100 44 87.5 12.52 29 3 0 97 62 59 33 44 0 - 48 34 36 04 40 0 100 100 30 32.5 0
Final Report: Development of the National Quality Use of Medicines Indicators for Australian Hospitals 2014

31
Table 26: Post-testing questionnaire responses for QUM Indicator 7.4
Site 1 2 3 4Did you have any difficulties in collecting data for this indicator? Yes Yes No No
Do you think the key definitions provided are adequate? Yes No Yes Yes
Do you think the numerator provided for this indicator is appropriate, i.e. was the suggested sample easy to identify?
Yes Yes No Yes
Do you think the denominator provided for this indicator is appropriate, i.e. was the suggested sample easy to identify?
Yes - Yes Yes
Do you think the instructions for data collection are adequate? Yes Yes Yes Yes
Do you think the suggested data sources are appropriate? - Yes Yes Yes
Do you think data collection for this indicator could be combined with other indicators? No - - -
Would you use the result from this indicator to guide a review or change in practice in your hospital?
No Yes Yes Yes
Would you be comfortable using this indicator to compare your performance now with your performance at a later date?
No Yes Yes Yes
Would you be comfortable using this indicator to compare your performance with other similar hospitals?
No Yes Yes Yes
Sites reported taking between three and forty-five minutes per record to collect data. The results indicated poor performance with the indicator. Gaps in all aspects of monitoring were identified with poor documentation of waist circumference having a significant impact on the indicator results. Results improved but were still low if weight (or body mass index) rather than waist circumference was recorded. The data collection tool also enabled indicator measurement according to whether the antipsychotic(s) were newly initiated or on-going therapy. One site suggested the inclusion of family history of metabolic issues in their data collection.
The main issue identified by field testing sites was the need to use multiple data sources and, in consequence, the potential time consuming nature of data collection. A rectifiable gap in documentation systems was identified. Given the availability of a number of metabolic monitoring templates and guidance documents, this indicator could drive the adoption of such tools by health care professionals and their inclusion in medical records, resulting in easily identifiable documentation of relevant monitoring parameters, less time-consuming data collection, improved monitoring and ultimately improvement in the health and well-being of patients taking antipsychotics. Electronic pathology systems will also assist documentation and data collection.
One site reported that they would consider annual indicator measurement. Three of the four hospitals reported that the indicator was valid and that they would be willing to use the indicator to guide local practice and for intra- and inter- hospital comparisons. Sites reported that indicator uptake would be more likely if the indicator was included in a mandatory set of indicators required for accreditation and if sufficient time was allocated by management for indicator collection and evaluation and subsequent quality improvement.
The EAC reviewed the results of field testing. It was agreed that a reference identifying medicines to be classified as antipsychotics and references to NPS MedicineWise and NSW Health metabolic monitoring templates be Final Report: Development of the National Quality Use of Medicines Indicators for Australian Hospitals 2014

32
included in the indicator specifications. Clarification with psychiatrists in the Mental Health EAC was necessary regarding the metabolic monitoring requirements of medication non-adherent patients and those trialled on multiple medications and patient’s refusal to undertake blood tests.
These issues were addressed and the indicator was accepted and finalised for publication with the slightly revised title:Percentage of patients taking antipsychotic medicines who receive appropriate monitoring for the development of metabolic side effects
Indicator 7.5The proposed indicator was: Percentage of patients prescribed two or more regular antipsychotic medications at hospital discharge
Ten hospitals in four states field tested this indicator, three of which were specialist mental health facilities. The indicator results for each site and feedback are displayed in Tables 27 and 28, respectively.
Table 27: Collated field testing data for QUM Indicator 7.5
Site Total Number of Discharged Patients In Sample
Number of patients prescribed regular antipsychotics at discharge
% of patients prescribed two or more regular antipsychotic medications at discharge
Additional info: % of patients prescribed antipsychotics who were prescribed two or more at discharge
1 32 32 31 312 26 25 19 203 128 70 9 174 30 21 17 245 11 7 18 296 76 66 18 217 22 N/A N/A 328 187 122 17 269 92 81 25 28
10 171 159 30 33
Final Report: Development of the National Quality Use of Medicines Indicators for Australian Hospitals 2014

33
Table 28: Post-testing questionnaire responses for QUM Indicator 7.5Site 1 2 3 4 5 6 7 8 9 10
Did you have any difficulties in collecting data for this indicator? No No No No Yes No No No No No
Do you think the key definitions provided are adequate? Yes Yes Yes Yes No Yes Yes Yes No Yes
Do you think the numerator provided for this indicator is appropriate, i.e. was the suggested sample easy to identify?
Yes Yes Yes Yes Yes Yes Yes Yes Yes Yes
Do you think the denominator provided for this indicator is appropriate, i.e. was the suggested sample easy to identify?
Yes Yes Yes No Yes Yes Yes Yes Yes Yes
Do you think the instructions for data collection are adequate? Yes Yes Yes Yes Yes Yes Yes Yes Yes Yes
Do you think the suggested data sources are appropriate? Yes Yes Yes Yes - Yes Yes No Yes Yes
Do you think data collection for this indicator could be combined with other indicators?
No No -
Yes, 7.3 & ACHS
Mental Health Clinical
Indicator 3.1
- - - - - -
Would you use the result from this indicator to guide a review or change in practice in your hospital?
No Yes Yes Yes Yes No Yes Yes Yes Yes
Would you be comfortable using this indicator to compare your performance now with your performance at a later date?
Yes Yes Yes Yes Yes Yes Yes Yes Yes Yes
Would you be comfortable using this indicator to compare your performance with other similar hospitals?
Yes Yes Yes Yes Yes Yes Yes YesDepends
on casemix
Yes
Final Report: Development of the National Quality Use of Medicines Indicators for Australian Hospitals 2014
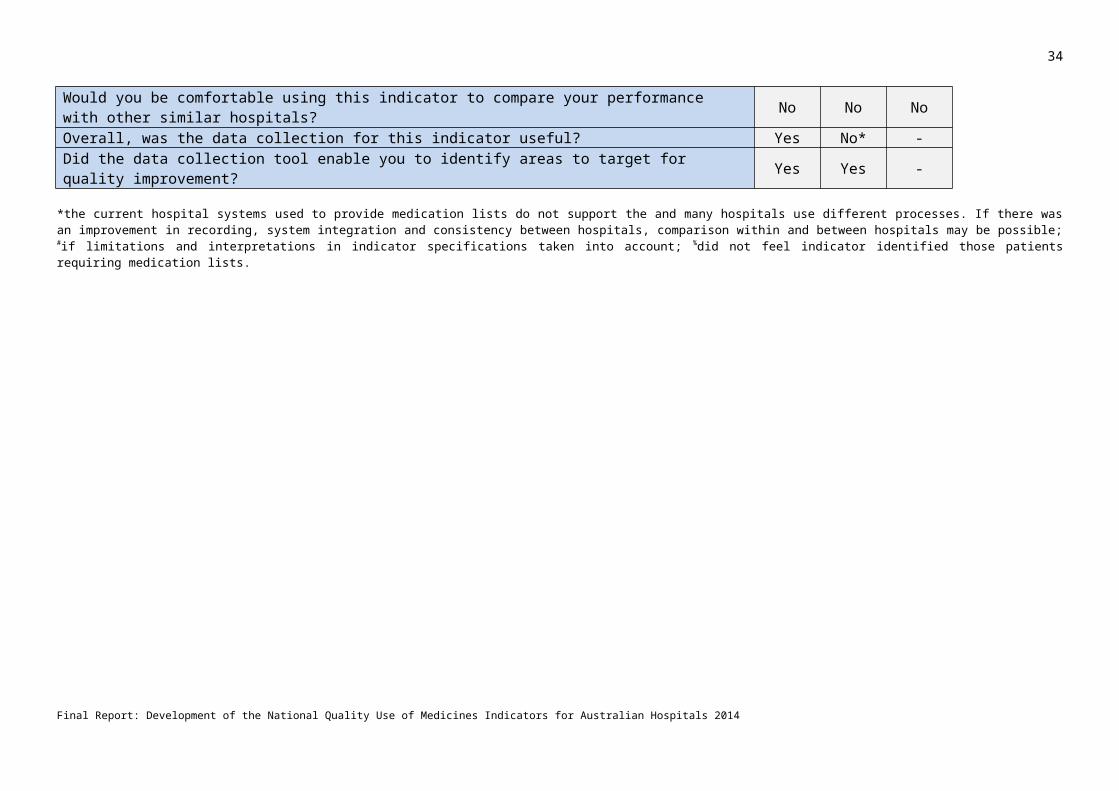
34
Patient numbers varied with three sites auditing over one hundred and twenty patient records. Most sites reported taking less than five minutes per record to collect data, although one site reported 30 minutes. Sites who reported difficulty in collecting data, either did not have a consistent place where information was recorded or did not have electronic medication records. Some sites relied on pharmacy information systems for data collection. This enabled swift collection of data but may exclude patients not requiring medicines at discharge. This underscores the need to ensure agreement regarding data sources and sample selection for any benchmarking activities.
Two indicator statistics were obtained: percentage of discharged patients prescribed 2 or more antipsychotics and percentage of discharge patients taking any antipsychotics prescribed 2 or more antipsychotics. The results ranged between 9 and 31% for the first statistic (the indicator measurement) and 17 to 33% for the latter statistic. One site reported that they believed the latter statistic was the more relevant statistic. The first measure had been chosen by the EAC as this is used in international indicator sets and would therefore potentially allow for international benchmarking.
Some sites collected data on which combinations of antipsychotics were prescribed. Suggested additions to the data collection tool included data points for prescriber, diagnosis, previous antipsychotic failure or treatment resistance. However it was acknowledged that data collection for these items may add further challenges and increased complexity.
There was good acceptance of the indicator. It was seen as useful and most sites would use it to guide local review or change practice and for intra- and inter-hospital audits. Two sites were unsure of the utility of this indicator as they were not sure it would drive practice change. It was reported that the use of antipsychotic polypharmacy was largely limited to patients with treatment failure or resistance and that the evidence for benefit or harm was not clear cut in these patients. One site is likely to replace a current key performance indicator with this indicator and set up an automated system at discharge to collect data as they considered retrospective data collection too time-consuming. Another site also recommended automatic collection from dispensing software ensuring minimal workload throughout year. Other sites suggested that the indicator could be measured six monthly or annually.
One site reported concerns regarding benchmarking if a hospital’s casemix varied from other hospitals. Clear inclusion and exclusion criteria would be required for benchmarking activities.
Enablers suggested for utilisation of QUM Indication 7.5 included automated data collection from dispensing software, greater consensus regarding the lack of benefit from antipsychotic polypharmacy and increased staffing.
The EAC reviewed the results of field testing. It was agreed that a reference identifying medicines to be categorised as antipsychotics be included in the indicator specifications. Clarifications regarding the use of more than one formulation of an antipsychotic drug, inclusion and exclusion criteria (such as patients who are readmitted frequently, or dementia patients) and the appropriate denominator were recommended. Members of the Mental Health EAC were also consulted regarding these issues.
The necessary amendments were made to the content of the indicator and the indicator was finalised for publication with the slightly revised title:Percentage of patients prescribed two or more regular antipsychotic medicines at hospital discharge
Final Report: Development of the National Quality Use of Medicines Indicators for Australian Hospitals 2014

35
DiscussionFollowing the 2011/12 review of the QUM Indicators 2007, four indicators were substantially revised. Consultation and field testing has demonstrated the usefulness and applicability of the revised indicators to the current Australian healthcare environment. Two new indicators for discharge medication processes have been successfully developed. Five new QUM indicators for acute mental health care have been successfully developed. References to the National Safety and Quality in Health Service (NSQHS) Standards and the relevant action items have been included in each QUM indicator. Accompanying these indicators are data collection tools and guidance information for data collection, particularly sampling methodology.
The indicators were tested in a minimum of three sites each. Paediatric and neonatal populations were represented where applicable and possible. The new indicators were tested in three states. Unfortunately the process of gaining ethics approval for field testing of the indicators was found to be resource intensive and time consuming. This restricted the number of sites that were able to participate. Indicators are useful tools to provide evidence towards meeting the NSQHS Standards, against which all acute care hospitals will be accredited from 2013. During field testing many users commented that the indicators would provide useful data for accreditation purposes and would be valuable to promote and monitor the effects of practice change. However, a frequent theme in the questionnaire feedback was the lack of resources available to measure indicators.
For most of the tested indicators there were significant variations in the reported results. These could mostly be accounted for by variations in the patient populations audited, reasons for choosing to audit and local systems. In some cases different interpretations of the indicator directions were revealed, which was addressed during finalisation of the indicator documents.
Indicator 1.2
Field testing highlighted that auditing against this indicator needs to be carried out by staff with knowledge of VTE prophylaxis guidelines. The time taken to perform the audits ranged from seven to twenty minutes. This may restrict the frequency with which this indicator will be measured. QUM Indicator 1.1, which is quicker to measure and requires less skills in data collection, could be used on a more regular basis as a marker of performance in this area. For example, QUM Indicator 1.1 could be measured monthly, with a larger audit performed against QUM Indicator 1.2 annually.
As a result of discussions around this matter, the EAC recommended a matrix be produced as part of the separate piece of work to illustrate the degree of time and skill required to measure each indicator.
All sites were in agreement that they would use this indicator to compare results with other similar sites. However, the use of local guidelines as a reference may mean this indicator is not suitable for benchmarking unless consensus could be reached on best practice and measurement criteria.
Feedback also suggested that this indicator would be improved by looking at the exact type and dosing of pharmacological prophylaxis used. This was felt to be beyond the scope of this indicator, making measurement too complex. However, hospitals may wish to incorporate this aspect into a larger audit of VTE prophylaxis when measuring this indicator.
Indicator 2.3
Since publication of the 14th edition of the Therapeutic Guidelines: Antibiotic in 2010,13 practice around aminoglycoside use has changed significantly. Field testing of this indicator demonstrated that some hospitals have been able to ensure widespread compliance with the guidelines, whereas others have not yet achieved this
Final Report: Development of the National Quality Use of Medicines Indicators for Australian Hospitals 2014

36
goal. It was recognized that this indicator may not provide useful information to sites that have good compliance with the guidelines, but may provide good evidence of a practice gap for others.
The indicator was tested in one neonatal ward and was not found to be useful as aminoglycoside use is well-managed in this unit with clear local protocols for use. Applicability to the neonatal population was discussed by the EAC. The small sample size obtained made it difficult to draw conclusions on the usefulness in neonates. It was agreed that in the absence of comprehensive guidance on aminoglycoside use in neonates, the indicator should remain relevant to neonates and that sites had the option of deciding whether they applied the indicator in this setting. The release of the Paediatric Australian Medicines Handbook is anticipated and depending on the timing of release any relevant guidance on use of aminoglycosides in neonates should be applied to the indicator.
Data collection for this indicator aimed to identify other practice gaps relating to aminoglycosides, such that these areas might be considered for development of further indicators. The data showed that only small numbers of patients go on to directed therapy, requiring therapeutic drug monitoring. The lack of consistency in monitoring methods in the paediatric population was also highlighted, which is an issue that NSW TAG has been addressing through various avenues, and hopes might be considered in the current review of the TGs. Therefore the decision not to include an indicator looking at TDM was upheld. Data suggested that under-dosing at initiation of therapy may be a problem, particularly in adults, and site found it useful to collect this information. The fields to record the initial dose prescribed will be maintained within the data collection tool, so that sites can collect this additional information if they wish. This area may be considered for future indicators, pending the review of the Therapeutic Guidelines: Antibiotics.
It was raised that data for this indicator may be best collected retrospectively, due to the ethical need to intervene should poor practice be uncovered during a prospective audit, which would influence the results. This is acknowledged as an important point for many of the QUM indicators and was raised in the proposed guidance on sampling.
Indicators 5.1 and 5.2
It was difficult to identify sites that wished to field test the cardiology indicators. It is also acknowledged that in the 2011 indicator user survey (ref) there was poor uptake of these indicators. This may be because the QUM indicators are perceived as tools for pharmacists, and pharmacists would generally prioritise other indicators over these. However, a number of cardiology departments were eventually identified to field test the indicators, and all found the results useful and informative. It is important that the indicators are marketed via cardiology networks, to raise awareness and improve uptake.
These indicators rely on documentation in the discharge summary of reasons for non-prescription of the standard medications. Indicator 5.2 also relies on documentation of the heart failure type (or left ventricular ejection fraction) in the discharge summary. In some cases, evidence of consideration of these factors was found elsewhere but was not included in the discharge summary. Documentation of these factors in the discharge summary is vital to ensure optimal continuity of care. Documentation in the discharge summary was generally found to be poor and is a focus for improvement for all sites participating in these indicators.
One site measured indicator 5.2 in a heart failure rehabilitation setting, demonstrating the applicability of the indicator to this setting.
One auditor did not agree that indicator 5.2 provided useful information. This was perceived to be due to a lack of understanding of the management of heart failure and of the use of indicators in general. This emphasises the importance of training for staff carrying out the audits and agreement on the goal of indicator measurement for the organisation.
Final Report: Development of the National Quality Use of Medicines Indicators for Australian Hospitals 2014

37
Indicators 5.8 and 5.9
Field testing revealed wide variation in discharge medication management systems and it was clear that use of the associated data collection tool was important to enable hospitals to identify particular strengths and gaps within their systems. There were perceived barriers to the implementation of new systems to achieve best practice. The new indicators and data collection tools allow for a stepwise approach to quality improvement and will allow organisations to demonstrate gradual improvements over time as they introduce change.
Due to the variations in discharge medication management systems between hospitals, some differences in the interpretation of some of the individual data components were noted. The EAC advised that local agreement on the definitions should be reached to ensure that local issues are addressed. If used for benchmarking, agreement on definitions for each data component would need to be reached.
One of the largest gaps identified was in documentation of medication reconciliation and it was recognised that improving this aspect will likely improve results significantly for both indicators. It is recommended that hospitals use the National Medication Management Plan for documentation of reconciliation of discharge prescriptions and discharge medication summaries. NSW TAG recommends that amendments to the MMP are made to enable healthcare practitioners to indicate exactly what documents have been reconciled and what sources have been used. This will assist with communication between healthcare professionals regarding discharge medication reconciliation and facilitate best practice.
Some lack of understanding was exposed in relation to the processes involved in medication reconciliation. Questions were raised about the need for a complete medication history and the need to document plans for both the admission medications and newly initiated medications. In many sites across Australia, medication reconciliation is in its infancy and education around the importance of documenting medication management plans is required. The widespread implementation of the National MMP form should not only improve documentation but also increase understanding of the importance of documenting medication management information to medication safety and continuity of care.
Indicators for acute mental health careThese indicators were well accepted by participating hospitals. There was high interest from hospitals across Australia to participate in the field testing. Ethical and governance issues in some hospitals prevented participation.
Sampling guidance
The content of ‘Data collection for local monitoring’ section in the QUM Indicator specifications has changed in the 2014 manual. Previously, the 2007 Indicators for QUM in Australian Hospitals gave guidance and recommendations on sample size, sample selection and sampling methodology. Many of these recommendations were based on The Joint Commission: Specifications Manual for National Hospital Inpatient Quality Measures, which were to be used as performance and accountability measures in the United States for conditions such as myocardial infarct, heart failure, pneumonia, stroke surgical care and venous thromboembolism. During the indicator review phase of this project, a number of sites reported difficulty in complying with these recommendations, particularly obtaining the recommended sample sizes. Analysis of the sampling recommendations in the 2007 QUM indicators was undertaken showing that sampling recommendations had been based on random selection. Furthermore, more recent recommendations for sampling when undertaking quality improvement (QI) projects have highlighted the functionality of more frequent data collection using smaller sample sizes collected during routine work and including the use of judgment sampling. Field testing of the indicators demonstrated that field testing sites had used a variety of methods to select their sample and data collection methods (such as prospective versus retrospective) and determine the sample size for their local circumstances.
Final Report: Development of the National Quality Use of Medicines Indicators for Australian Hospitals 2014

38
In concert with the development of the sampling guidance, the EAC decided that users of the indicators would be referred to the “Using the National Quality Use of Medicines Indicators for Australian Hospitals 2014” section of the 2014 publication when reading each indicator’s specifications to ensure that informed decisions regarding sample size, sample selection and data collection methodology would be made that would meet the objectives of the local QI project. It was noted that there is no right or wrong approach to sample selection and that an individual indicator may have multiple appropriate ways by which sample selection could be undertaken (random, judgment or no sampling as in the case where all patients selected). It is up to the local advisory group to guide these decisions.
The ‘Data collection for local monitoring section” in the indicator specifications now refers to this sampling guidance as well as providing information regarding inclusion and exclusion criteria and recommended data sources.
Development of data collection tools
Data collection tools have been developed for all QUM indicators in the National QUM Indicators 2014 set. The provision of standardised data collection tools will facilitate ease of use and uptake of the QUM Indicators. The data collection tools for the eleven newly developed or revised indicators were included in the indicator field testing. The tools for other QUM indicators have been tested for user operability and are accompanied by a disclaimer and contact details for trouble shooting. An accompanying User Guide has also been developed with screen shots of the tools to enhance the guidance. A number of indicators measure complementary QUM aspects or processes and it is envisaged that some data collection tools will be amalgamated to form one data collection tool to enable collection of data simultaneously, such as QUM Indicators 5.3 and 5.8, which evaluate medicines information in discharge summaries. The data collection tool for QUM Indicator 1.2 provides results for QUM indicators 1.1 and 1.2. A data collection tool for QUM Indicator 1.1 is also provided as its measurement is quick and likely to be used as routine monitoring measure. In contrast, QUM Indicator 1.2 requires more resources and may be more conducive to larger intermittent evaluations.
One site collected data for all the mental health indicators at the same time. This site reported that this was the most efficient method and would be likely to repeat this methodology. The auditor did not use the data collection tools and therefore did not collect all ancillary information that the tools enabled. The use of the data collection tools also facilitated consistency in data collection across the field testing sites.
The provision of such tools is likely to increase uptake and facilitate indicator use, promote quality improvement activities and assist with provision of evidence towards meeting the NSQHS Standards. Furthermore tools such as these are essential for multisite projects or benchmarking activities as they assist with standardization of measurement. The development of these data collection tools will facilitate the development of online real-time reporting, monitoring and feedback of National QUM Indicators within facilities, which will further facilitate indicator uptake.
Mapping of QUM Indicators to NSQHS Standards7
The National QUM Indicators 2014 have been referenced against the National Safety and Quality Health Service (NSQHS) Standards in order to provide a guide on how the indicators can be used to meet the specific action items required for each Standard. Two tables are provided demonstrating this information:
Table 1: Action items of the NSQHS Standards mapped to each National QUM Indicator 2014; and Table 2: National QUM Indicators 2014 mapped to each action item of the NSQHS Standards.
This information is a guide only, and is correct at the time of publication. Only the four most pertinent Standards have been referenced in these tables (Standards 1, 3, 4 and 6). There may be items within the other Standards for which the National QUM Indicator measurement may be used as evidence.
Final Report: Development of the National Quality Use of Medicines Indicators for Australian Hospitals 2014

39
In general, measurement of the indicator alone will not provide sufficient evidence for compliance with NSQHS Standard item. Further work, including interpretation of the indicator results and follow up action, will usually be required.
Final Report: Development of the National Quality Use of Medicines Indicators for Australian Hospitals 2014

40
General observations from the development and field testing of the QUM indicators
Ethics approval
A major challenge in the development of the QUM indicators was the lack of conformity across the Australian states for ethics approval of low and negligible risk projects such as the field testing of the QUM indicators. Despite the project being approved by a Human Research and Ethics Committee (HREC) accredited as a Lead HREC by the NSW Ministry of Health and a certified institution under the NHMRC National Harmonisation of Multi-centre Ethical Review Initiative and having extra insurance to cover multi-state projects, numerous separate ethics applications had to be made by the Project Team. This particularly applied to interstate hospitals. Nevertheless there were some NSW hospitals where the site specific approval was so delayed that sites were unable to participate in the project. Field testing was unable to commence in at least eleven Australian hospitals that had expressed interest in participating in the field testing of the indicators. After discussions with one hospital’s research office it became apparent that harmonisation of ethical review across Australia has not been achieved for low and negligible risk projects, only clinical trials; a ludicrous situation. Another site reported that results from quality improvement studies could only be reported within the area in which they were conducted. Moreover, despite the assurance that the data was not identifiable once entered into the data collection tool and that NSW TAG would only be receiving summary data and feedback about the field testing, NSW TAG was instructed that they would need to apply under the Public Health Act of Queensland prior to seeking ethics approval, which would take at least four weeks. One hospital charged NSW TAG for an ethical review. Whilst it is acknowledged that ethics and governance of research projects are of great importance and fundamental to the conduct of any research, the barriers to undertake this project meant that time and money was wasted and health care practitioners were unable to gain experience in the measurement of these indicators. It is recommended that national and state organisations facilitate the national harmonisation of ethical review for low and negligible risk projects.
Development of new QUM indicators
Two new indicators for continuity of medication management at discharge and five for acute mental health care are included in the 2014 QUM indicator manual. Although these have been allocated specific allocated areas of practice, their use is not necessarily confined to these areas. For example, the acute mental health care QUM Indicator 7.3 which measures the provision of verbal and written medicines information could be applied in any hospital setting where medicines are prescribed. Equally there are revised and new indicators that may be used in the mental health care setting. Quality improvement practitioners in all hospital settings are encouraged to look through the whole suite of indicators to identify indicators that may measure or monitor possible QUM gaps.
Enablers and barriers of indicator uptake
The most commonly perceived barrier to indicator uptake was the lack of staff and resources. Another concern was whether indicator measurement would be fair across hospitals in any benchmarking activities. The ability to influence local practice with indicator measurement was also of concern. The Sampling Guidance aims to assist this concern with its guidance regarding the convening of a multidisciplinary stakeholder group. One site suggested that a briefing by NSW TAG to Drug and Therapeutics Committees (DTCs) and hospital management regarding the importance and methods of indicator collection and evaluation would facilitate indicator utilisation.
Sites were reluctant to participate in the field testing of some indicators, particularly QUM Indicator 7.3 (provision of verbal and written medicines information) and QUM Indicator 5.9 (provision of a current, accurate and comprehensive medication lists to patients). Championing of these indicators by national and jurisdictional organisations and local practitioners who acknowledge the indicators’ importance may be required to overcome the barriers related to the use of these indicators. Both indicators have the potential to have a major effect on local practices and improve patient involvement in their care and informed decision-making.
Final Report: Development of the National Quality Use of Medicines Indicators for Australian Hospitals 2014

41
Documentation
Data collection for many of the indicators relies on good documentation. If the information is missing it is deemed not to have occurred. This does not mean that it hasn’t occurred. One reason why it may have not occurred is that there is a lack of documentation systems in place, there is no consistent place to document medicines or related information and there is inadequate training of those responsible for documenting, for example, junior medical officers and the completion of discharge summaries. As a default, information may be written in the medical progress notes where it may be difficult to locate .This was highlighted in the measurement of QUM Indicator 7.3 (provision of verbal and written medicines information) which often took auditors up to 45 minutes to identify whether such a process had occurred. One of the field testing hospitals has subsequently improved its documentation processes in order to identify provision of medicines information.
The need for training of junior medical officers regarding good documentation practice both during orientation and ward practice was highlighted with the measurement of QUM Indicator 5.2 (prescription of appropriate medications at discharge in heart failure patients). Discussion at presentation of the field testing results at one of the site’s Cardiology Grand Rounds for Indicator 5.2 focussed on the importance of documentation in discharge summaries, especially when the information is ready to hand with the availability of electronic medical records and the need for senior medical support to promote this action.
Use of data sources for indicator measurement
Field testing revealed that hospitals use a variety of data sources to collect information required for indicator measurement. Despite consistency of indicator specifications and data collection tools across the field testing sites, there was a variety of methods used by the sites to collect data. This was especially apparent in the retrieval of medicines information at discharge where a number of hospitals used pharmacy sources to identify their sample. However it needs to be noted that there may be a number of patients who are discharged without receiving medicines from the hospital pharmacy at discharge or they may only receive some and not all their required medicines. Hence there is a potential to bias results. This observation highlights the importance of clear and agreed documented methodology for data collection, particularly for intra- and inter-hospital comparison. It also underscores the importance of the formation of the advisory group to oversee indicator measurement to ensure that the potential gaps of measurement are identified and that the aims of the indicator measurement will be met. The issues that require consideration have been detailed in the ‘Using the National QUM Indicators’ section of the 2014 manual.
Electronic data sources
Increased duration of and complexity in data collection occurred for any indicator which relied on data being extracted from multiple data sources. Field testing highlighted that hospitals with electronic data records were able to undertake indicator measurement most efficiently. Nevertheless barriers to measurement arose in these hospitals. Firstly the information sources, such as pharmacy dispensing software, did not have the ability to capture all the information required to meet the Standards7, such as drug allergy. Some hospitals have adopted ‘work arounds’ to include this information such as handwriting information on the medication list. However this information is not recorded. There is a significant potential for increased efficiency and improved medication safety with integration of the electronic systems and automated data collection from dispensing software. Importantly these initiatives will also facilitate QUM indicator measurement.
As indicators were generally easier to measure and more acceptable if data could be extracted readily from electronic resources, it is important that indicator measurement is considered when developing and enhancing electronic systems.
The National QUM Indicators are process indicators. They do not measure outcomes such as death, hospital admission, adverse events, health care professional visits or quality of life. Nevertheless the QUM gaps that they measure have been linked to poor outcomes for patients. Future development of electronic systems and data linkage may in the long term allow the development of QUM indicators as outcome measures.
Final Report: Development of the National Quality Use of Medicines Indicators for Australian Hospitals 2014

42
What does indicator measurement mean?
It is important that auditors, QI advisory committees and hospital managers and the executive recognise that 100% compliance rate with a QUM indicator may not be desirable. While some indicators, for example, QUM Indicators 3.2 and 5.5 which focus on documentation and communication of adverse drug reactions should achieve 100% compliance, others such as. Indicator 5.1 which measures the prescription of appropriate medications for acute coronary syndromes at discharge, would not be expected to achieve 100% compliance rate nor is it desirable that such a level be achieved. This was highlighted in the discussion at a Cardiology Grand Rounds presentation of the results for QUM Indicators 5.1 and 5.2 given by NSW TAG and the site’s auditors at one of the field testing sites. There was widespread discussion around what is the optimal hospital performance level for QUM Indicator 5.1. While there was consensus that prescription of antiplatelets and statins (or documentation of reasons for non-prescription) should be 100%, there was less agreement with regard to the prescription of beta-blockers and ACE inhibitors or angiotensin receptor blockers (ARBs). This hospital considered a performance level of between 70-80% was likely to be the optimal rate. They also acknowledged that this may vary between hospitals depending on their casemix. The Grand Rounds discussion highlighted the importance of clinicians’ and other stakeholders’ involvement in indicator measurement and feedback and the need for agreed performance targets, which may vary between hospitals.
A pragmatic view of compliance rate is also required for a number of QUM indicators where the indicators have been developed with a view to drive change in hospital setting where systems and resources are still immature or lacking. This is particularly so with the newly developed indicators for continuity of medicines management at discharge and for acute mental health care.
Measurement of a QUM indicator means nothing without accompanying and sustained actions. The expanded section, ‘Using the National Quality use of Medicines Indicators for Australian Hospitals 2014’, in the 2014 indicator manual aims to guide practitioners in the use of the indicators and to develop a supportive structure to QI activities. It is strongly recommended that this section is read prior to individual QUM indicator measurement. Auditors and those with an interest in these activities are encouraged to develop a network of peers. The Drug Utilisation and Evaluation Specialist Group co-ordinated by NSW TAG is one such network of peers. This group has undertaken multisite projects using QUM indicators such as QUM Indicator 5.3 (Percentage of discharge summaries that include medication therapy changes and explanations for changes) which led to the development of tools to assist improvement in discharge summary quality with regard to medication changes.
Feedback
The impact of any quality improvement project involving indicator measurement will not be efficiently realised without timely provision of results to the coalface practitioners. Change is more likely if feedback is ongoing and there is stakeholder involvement. The importance that hospital management demonstrates in relation to QI activities is vital for its uptake. The expanded section in the 2014 manual, ‘Using the National Quality use of Medicines Indicators for Australian Hospitals 2014’, aims to facilitate this aspect of QI implementation.
Benchmarking
As highlighted in the 2014 manual, the National QUM Indicators have not been developed nor validated for benchmarking purposes. The ‘Using the National Quality use of Medicines Indicators for Australian Hospitals 2014’ section of the manual details considerations that are required for multisite projects and benchmarking. Nevertheless the QUM Indicators have significant potential for benchmarking activities and such activities can be a potent driver for QI. This was clearly enunciated in the discussion at a Cardiology Grand Rounds presentation of the results for QUM Indicators 5.1 and 5.2 given by NSW TAG and the site’s auditors at one of the field testing sites in October 2013. There was discussion how these indicator results aligned with recent studies, in particular the recent national ACS Snapshot14 which showed a wide variation in prescription of appropriate medicines at discharge for patients with an ACS diagnosis. A national project of heart failure management has recently been conducted with publication expected in 2014 and this may drive greater uptake of indicator 5.2, which was reported to be poor in the 2011 Survey: QUM Indicator Uptake and Utilisation.15
Final Report: Development of the National Quality Use of Medicines Indicators for Australian Hospitals 2014

43
Future directions
The National QUM Indicators is a dynamic document. Practice change, evidence-based gaps in care which are resolved and new emerging gaps mean that the indicators will require periodic revision, updating and turnover. Emerging gaps in QUM in 2014 include the appropriate and safe use of the novel anticoagulants and increasing antimicrobial resistance through injudicious and inappropriate use of antimicrobials. A number of indicators for QUM in acute mental health care were identified as being worthy indicators. These included indicators to measure QUM issues regarding informed consent, emergency sedation, intentional overdose and drug therapy during electroconvulsive therapy. Resources at the time of development meant that not all could be field tested and finalised but revisiting these indicators in the future is recommended.
Equally important is the implementation and appropriate use of the National QUM Indicators. Measuring and managing improvement is not easy, especially when busy clinicians are focussed on providing care. 2 Accreditation requirements for hospitals are likely drivers of indicator measurement. However as evidenced by the 2011 user survey, some indicators may be under-utilised, often because of difficulty in measurement while others may be unnecessarily measured. The accompanying data collection tools and the matrix of QUM Indicators mapped to the NSQHS Standards, which have been developed for the 2014 publication of the National QUM Indicators are also likely to facilitate indicator measurement. Nevertheless resources will be required to maintain and update the indicators and these tools.
Significantly, recognition of QI as a science, and the need for health care practitioners, managers and health executives to obtain at the very least an understanding of this science or to obtain knowledge and skills in it as a QI practitioner, is paramount to ensure improvement in quality use of medicines in Australia as efficiently as possible. Clinicians wish to ensure their actions are safe and effective and they have the ability to most directly drive change in their hospitals. Hence it is recommended that an implementation plan to accompany the publication of the National QUM Indicators is developed to not only promote the use of the indicators but to also include development of educational programs to facilitate the use of the indicators as part of QI projects. Project management, sampling methodology, analysis, interpretation, presentation of results and provision of feedback are key aspects of QI activities that should be included in such an educational program. Forums such as Webinars, face-to-face workshops and consideration of this science as a subject for undergraduate and postgraduate health care professional courses are recommended. Involvement of multisite QI projects is also an excellent means of developing these skills in a supportive environment and support of such projects should be encouraged by health managers. Hospital management should see the development of knowledge and skills in QI in their workforce as a core activity and provide support for its acquisition.
Given its long involvement in the development of indicators for the quality use of medicines, NSW Therapeutic Advisory Group and its member network look forward to further involvement in activities which support QUM indicator measurement and promote their efficient and appropriate use in Australian hospitals.
Final Report: Development of the National Quality Use of Medicines Indicators for Australian Hospitals 2014

44
ConclusionAn updated set of Quality Use of Medicines Indicators for Australian Hospitals has been prepared, including two new indicators for continuity of medication management at discharge and five for acute mental health care. The indicators include a reference to the National Safety and Quality Health Service Standards and a matrix demonstrating the applicability of each indicator to the Standards has been prepared. The National QUM Indicators demonstrate an ongoing commitment by Australian health care professionals to ensure quality use of medicines within Australian hospitals. NSW Therapeutic Advisory Group (TAG) wishes to thank the many people who have been involved in the development of these QUM indicators. NSW TAG wishes to thank the Clinical Excellence Commission for their continued support of NSW TAG and acknowledge their contribution to the development of the Indicators for Quality Use of Medicines in Australian Hospitals in 2007. NSW TAG recommends these indicators to all health care practitioners interested in ensuring that patients realise the best outcomes they can from their use of medicines.
Final Report: Development of the National Quality Use of Medicines Indicators for Australian Hospitals 2014

45
References 1. National Medicines Policy. Department of Health and Ageing, Commonwealth of Australia, 2000.2. Indicators for Quality Use of Medicines in Australian Hospitals. NSW Therepeutic Advisory Group, 2007.3. Lowinger JS, Stark HE, Kelly M, Hughes CF, Gazarian M, Kaye KI. Improving use of medicines with clinician-led use of validated clinical indicators. Med J Aust 2010;192(4):180-1. Epub 2010/02/23. DOI 4. National Medication Safety and Quality Scoping Study Report. Sydney: Australian Commission on Safety and Quality in Health Care, 2009.5. NSW Therapeutic Advisory Group. Indicators for the Quality Use of Medicines in Australian Hospitals: Interim Report for the Australian Commission on Safety and Quality in Health Care. September 2012.6. NSW Therapeutic Advisory Group. Indicators for the Quality Use of Medicines in Australian Hospitals. Sydney: NSW TAG, 2007.7. Australian Commission on Safety and Quality in Health Care. National Safety and Quality Health Service (NSQHS) Standards ACSQHC, 2012.8. Hospital Accreditation Workbook. Sydney: Australian Commission on Safety and Quality in Health Care, 2012.9. Safety and Quality Improvement Guides: Standards 1-10. Sydney: Australian Commission on Safety and Quality in Health Care, 2012.10. Perla RJ, Provost LP, Murray SK. Sampling considerations for health care improvement. Quality Management in Health Care 2013;22(1):36-47. Epub 2012/12/29. DOI 10.1097/QMH.0b013e31827deadb11. Malcolm W, Nathwani D, Davey P, et al. From intermittent antibiotic point prevalence surveys to quality improvement: experience in Scottish hospitals. Antimicrobial Resistance and Infection Control 2013;2(1):3. 12. Pulcini C, Crofts S, Campbell D, Davey P. Design, measurement, and evaluation of an education strategy in the hospital setting to combat antimicrobial resistance - Theoretical considerations and a practical example. Disease Management & Health Outcomes 2007;15(3):151-63. 10.2165/00115677-200715030-0000413. Therapeutic Guidelines Limited. Therapeutics Guidelines: Antibiotics. 2010.14. Chew D, French J, Briffa TG, Hammett CJ, Ellis C, et al. Acute cornoary syndrome care across Australia and New Zealand: the SNAPSHOT ACS sudy. Medical Journal of Australia 2013. Epub 17 May 2013. 15. NSW Therapeutic Advisory Group. Final Report of 2011 Survey: QUM Indicator Uptake and Utilisation. 2012.
Final Report: Development of the National Quality Use of Medicines Indicators for Australian Hospitals 2014

46
Acknowledgements
NSW TAG Project TeamDr Alexandra (Sasha) Bennett Executive OfficerGillian Sharratt Executive Officer Katie Kerr Project OfficerJames Grant ConsultantJocelyn Lowinger Consultant Penny Thornton Project Officer (until February 2012)Andrew HargreavesAnna Drew
QUM Indicator Expert Advisory CommitteeThe Expert Advisory Committee provided advice, support and direction in the review of the 2007 QUM Indicators, and guided the development of new indicators for discharge medication reconciliation.
Dr Jen Bichel-Findlay Manager, Performance & Outcomes Service, The Australian Council on Healthcare Standards, (until May 2013)
Gary Cadwallender Manager, Performance & Outcomes Service, The Australian Council on Healthcare Standards (from May 2013)
Rosemary Burke Director of Pharmacy, Concord Repatriation General Hospital, andChair, Society of Hospital Pharmacists Medication Safety Committee of Specialty Practice
Dr Jed Duff Clinical Research Fellow, Nursing Research Institute, St Vincent’s Private HospitalMargaret Duguid Pharmaceutical Advisor, Australian Commission on Safety and Quality in Health CareA/Prof Madlen Consultant in Paediatric Clinical Pharmacology & Therapeutics, Gazarian Pharmacoepidemiology and Pharmacovigilance, and
Honorary Associate Professor, Faculty of Medicine, University of NSWBelinda Johnston Director of Pharmacy Services, St Vincent's Private Hospital Daniel Lalor Project Manager, Medication Safety, Clinical Excellence CommissionJennifer MacDonald Director of Pharmacy, John Hunter HospitalProf Ian Whyte Director, Clinical Toxicology & Pharmacology, Calvary Mater Hospital, Newcastle
Mental Health QUM Indicator Expert Advisory CommitteeThe Mental Health Advisory Committee provided advice, support and guidance on the development of new QUM indicators for acute mental health.
Prof Greg Carter A/Director, Department of Consultation-Liaison Psychiatry, Calvary Mater Newcastle Hospital, andConjoint Professor and Principal Researcher, Centre for Translational Neuroscience and Mental Health, University of Newcastle
Aoife Davis Specialist Pharmacist, Justice Health & Forensic Mental Health Network, and subsequentlyMental Health Pharmacist, Manly Hospital
Paul De Carlo Clinical Nurse Consultant, Mental Health Services, Sydney & South Western Sydney LHDs, and subsequentlyProject Officer - Mental Health, Nursing and Midwifery Office, NSW Health
Prof Kim Foster Associate Professor Mental Health Nursing, Sydney Nursing School, The University of Sydney
Dr Adrian Keller Clinical Director, The Forensic Hospital & Long Bay Hospital, Justice Health & Forensic Mental Health Network
Judy Longworth Pharmacist, Department of Psychological Medicine, the Children's Hospital at WestmeadFinal Report: Development of the National Quality Use of Medicines Indicators for Australian Hospitals 2014

47
Dr Roderick McKay A/Director, Specialist Mental Health Services for Older People, Sydney and South Western Sydney Local Health Districts, and Chair, Faculty of Psychiatry of Old Age, Royal Australia and New Zealand College of Psychiatrists
Dr Nick O’Connor Clinical Director, North Shore Ryde Mental Health Services
Field Test HospitalsThe following hospitals participated in field testing of the new and revised QUM indicators and we gratefully acknowledge their contribution. We thank all participants in the project teams and those in each hospital who participated in data collection and subsequent discussions.
Bankstown-Lidcombe Hospital, NSWBarwon Health, VICCampbelltown Hospital, NSWConcord Repatriation General Hospital, NSWGoulburn Base Hospital, NSWJohn Hunter Hospital, NSWLogan Hospital, QLDMacquarie Hospital, NSWMaroondah Hospital, VICHunter New England Mater Mental Health Centre, NSWOrange Base Hospital, NSWRedland and Wynnum Hospitals, QLDRoyal Prince Alfred Hospital, NSWSt George Hospital, NSWSt Vincent’s Hospital, Sydney, NSWSt Vincent’s Private Hospital, NSWThe Alfred Hospital, VICThe Children’s Hospital at Westmead, NSWThe Royal Hospital for Women, NSW
2007 Project Team and ContributorsWe acknowledge the enormous effort of the NSW TAG project team who developed the 2007 QUM Indicators. We also acknowledge the many organisations and individuals who contributed to the development of the 2007 indicators on which the National QUM Indicators 2014 are based.
Key ContributorsA large number of individuals and organisations have been involved in the development of the 2014 QUM Indicators. Their advice and cooperation has been integral to this project and we thank you all for your input. Key organisations and individuals who assisted us are listed below:
Organisations- Australian Commission on Safety and Quality in Health Care High 5s Medication Reconciliation Project
participants- Australian Commission on Safety and Quality in Health Care Anticoagulation Working Group- Australian Council on Healthcare Standards Emergency Medicine Indicator Working Party- Australasian College of Emergency Medicine- Cancer Institute NSW - Children’s Hospitals Australasia Medication Safety Special Interest Group - Clinical Excellence Commission Continuity of Medication Management Expert Advisory Group- Heart Foundation of Australia- Justice Health & Forensic Mental Health Network, NSWFinal Report: Development of the National Quality Use of Medicines Indicators for Australian Hospitals 2014

48
- NPS MedicineWise- NSW Expert Group on Multiple Resistant Organisms - NSW TAG DUE Support Group- NSW TAG Editorial Committee - NSW TAG General Committee- NSW TAG SAFER Medicines Group - Royal Australia and New Zealand College of Psychiatrists- The Cardiac Society of Australia and New Zealand- Society of Hospital Pharmacists of Australia Committee of Specialty Practice in Mental Health- Society of Hospital Pharmacists of Australia Committee of Specialty Practice in Medication Safety- Thoracic Society of Australia and New Zealand
Individuals - Dr John Atherton, Department of Cardiology, Royal Brisbane and Women’s Hospital, QLD- Selvana Awad, Bankstown-Lidcombe Hospital, NSW- Garth Birdsey, Senior Clinician Pharmacist, Cardiac Services, Barwon Health, VIC- Cecilia Bjorksten, Assistant Director of Pharmacy, Hunter New England Mater Mental Health Centre, NSW- Stuart Bond, Antimicrobial Stewardship Pharmacist, Illawarra Shoalhaven Local Health District, NSW- A/Prof Caroline Brand, Centre for Research Excellence in Patient Safety, Monash university, VIC- David Brownlea, Electronic Medicines Management Pharmacist, Concord Repatriation General Hospital, NSW- Evette Buono, Project Officer - Antimicrobial Stewardship, Clinical Excellence Commission, NSW- Prof Terence Campbell, Head, University Department of Medicine, St Vincent's Hospital Sydney, NSW- Debbie Carter, NPS MedicineWise- Albert Chan, Senior Mental Health Pharmacist, Logan Hospital, QLD- Christine Coorey, Senior Pharmacist, St Vincent’s Hospital Sydney, NSW- Gabrielle Couch, District Director of Pharmacy, Southern NSW Local Health District, NSW- Clare Delaney, NPS MedicineWise- Mariella De Rosa, Senior Pharmacist, The Royal Hospital For Women, NSW- Paula Doherty, Quality Use of Medicines Pharmacist, John Hunter Hospital, NSW- Jeff Elliott, NPS MedicineWise- Dr Andrew Finckh, Staff Specialist, Emergency Department, St Vincent’s Hospital Sydney, NSW- Helen Ganley, Clinical Governance Unit, Northern Sydney Central Coast Health, and Bounty Brokers Pty Ltd,
NSW- Prof Lyn Gilbert, Clinical Lead, Infection Prevention & Control, Western Sydney Local Health Network, NSW- John Glen, Chief Pharmacist, Macquarie Hospital, NSW- Linda Graudins, Medication Safety and QUM Pharmacist, The Alfred Hospital, VIC- Stephen Hancock, Statistician Health Services Research Group, CCEB University of Newcastle, NSW- Bernie Harrison, Executive Director, Hospital Performance, National Health Performance Authority- A/Prof Sarah Hilmer, Head of Department, Clinical Pharmacology and Staff Specialist, Aged Care and
Rehabilitation Royal North Shore Hospital, NSW- Michelle Hooper, Senior Clinical Pharmacist – Psychiatry, The Alfred Hospital, VIC- Prof Cliff Hughes, Chief Executive Officer, Clinical Excellence Commission, NSW- Karen Kaye, Executive Manager, Quality Use of Medicines, NPS MedicineWise- Michelle Kent, Mental Health Specialist Pharmacist, Barwon Health, VIC- Prue Kevans, Senior Mental Health Pharmacist, Orange Health Service, NSW- Dr David Kong, Lecturer, Faculty of Pharmacy and Pharmaceutical Sciences, Monash University, VIC- Tony Lai, Clinical Pharmacist, the Children’s Hospital at Westmead, NSW- Prof Tim Lambert, Professor and Head of Psychiatry, Sydney Medical School, University of Sydney; Head,
Schizophrenia Treatments and Outcomes, Brain & Mind Research Institute; and Director, Centre of Excellence in Relapse Prevention in Psychosis, The Concord Centre for Cardiometabolic Health in Psychosis, Sydney Local Health District, NSW
Final Report: Development of the National Quality Use of Medicines Indicators for Australian Hospitals 2014

49
- Michelle Le, Clinical Pharmacist, St Vincent's Hospital Sydney, NSW- Jane Ludington, Pharmacist, St Vincent’s Hospital Sydney, NSW - Prof Andrea Mant, Former QUM Advisor, South Eastern Sydney and Illawara Area Health Service, NSW- Prof Andrew McLachlan, Chair of Pharmacy (Aged Care), Sydney University, NSW- Terry Melocco, Director of Pharmacy, St Vincent’s Hospital Sydney, NSW- Omar Mubaslat, Pharmacist, Royal Prince Alfred Hospital, NSW- Dr Zac Matthews, Director of Pharmacy, Canterbury Hospital, NSW- Julia McKay, Senior Clinical Pharmacist, Orange Health Service, NSW- Alice McKellar, Chief Pharmacist, Goulburn Base Hospital, NSW- Karma Zarif Sourial Mekhail, Clinical Pharmacist, Bankstown-Lidcombe Hospital, NSW- Nina Muscillo, Medication Safety and Quality Officer , Clinical Excellence Commission, NSW- Minnie Park, Mental Health Pharmacist, The Prince Charles Hospital, QLD- Joanna Ramachenderan, Research Officer, Department of Cardiology, Bankstown-Lidcombe Hospital, NSW- Greg Roberts, Clinical Research Pharmacist, Repatriation General Hospital, SA- Dr Jason Roberts, Consultant Clinical Pharmacist, Royal Brisbane and Women's Hospital, QLD- Kate Roper, Education and Training Pharmacist, Campbelltown and Camden Hospitals, NSW- A/Prof Neville Sammell, Medical Director, Cardiac Rehabilitation Program, St Vincent’s Hospital Sydney, NSW- Emeritus Prof Lloyd Sansom, Chair, Committee of Review of Anticoagulation Therapies in Atrial Fibrillation,
Department of Health and Aging- A/Prof Ian Scott, Director of Internal Medicine and Clinical Epidemiology, Princess Alexandra Hospital;
Associate Professor of Medicine, University of Queensland; and, Adjunct Associate Professor of Medicine, Monash University
- Prof Paul Seale, Professor of Clinical Pharmacology, Faculty of Medicine, University of Sydney; and Department of Respiratory Medicine, Royal Prince Alfred Hospital, NSW
- Emilia Serban, Cardiac Chronic Care Coordinator, Cardiac Ambulatory Services, Bankstown Lidcombe Hospital, NSW
- Dr Yashwant Sinha, University of Sydney, NSW- Leone Snowdon, Manager, NSW Medicines Information Centre, Sydney, NSW- Greg Spann, Mental Health Pharmacist, Logan Hospital, QLD- Helen Stark, Senior Project Officer, Medication Safety Program, Australian Commission on Safety and Quality
in Health Care- Julie Thompson, Project Manager for Guidance MS, South East Sydney Local Health District, NSW- Dijana Vracar, Drug Usage Evaluation Pharmacist, St George Hospital, NSW- Angela Wai, Senior Pharmacist Medication Safety and Clinical Education, Royal Prince Alfred Hospital, NSW- Paul Wembridge, Clinical Pharmacist, Maroondah Hospital , VIC- Dr Stephanie Wilson, Senior Staff Specialist, Cardiology Department, St Vincent’s Hospital Sydney, NSW- Ann Whitaker, Senior Clinical Pharmacist, Redland and Wynnum Hospitals, QLD- Joseph Whitehouse, Infectious Diseases Pharmacist , Antimicrobial Surveillance Unit, Flinders Medical Centre,
SA - Maureen Winn, Project Officer, Medication Safety and Quality, Clinical Excellence Commission, NSW- Dr Simon Wong, Resident Medical Officer, St Vincent’s Hospital Sydney, NSW- Rachel Worthington, Senior Pharmacist, the Children’s Hospital at Westmead, NSW
Final Report: Development of the National Quality Use of Medicines Indicators for Australian Hospitals 2014

50
Appendix 1: Indicators relating to continuity of medication management at discharge identified from Australian and international indicator sets
Source IndicatorNational Committee for Quality Assurance1
Percentage of discharges from January 1 to December 1 of the measurement year for members 66 years of age and older for whom medications were reconciled on or within 30 days of discharge.
Safer healthcare now!2 Percentage of patients receiving a best possible medication discharge plan at dischargeCanadian Council on Health Services Accreditation3
Number of patients whose medication profiles are reconciled within 24 hours before hospital discharge as a percentage of discharged patientsNumber of unintentional medication order discrepancies (e.g. omission, commission, incorrect dose, incorrect frequency) as a percentage of all medication orders
South Australia APAC Key Performance Indicators4
Percentage of discharge prescriptions reviewed and reconciled by a pharmacist prior to dispensing.
Medication Services Queensland Key Performance Indicators5
Percentage of non-same day separations for which a discharge medication record has been produced
American Medical Association6 Percentage of patients, regardless of age, discharged from an inpatient facility to home or any other site of care, or their caregiver(s), who received a reconciled medication list at the time of discharge, including, at a minimum, medications in the specified categories
Agency for Healthcare Research and Quality7
Percentage of patients provided an updated home medication list at discharge
Society of Hospital Medicine8 Percentage of discharged patients with reconciled discharge medication listPercentage of discharged patients affirming comprehension of discharge medication listPercentage of discharged patients with discharge medication list received by provider
National Quality Forum Safe Practice Discharge Measures9
Percentage of patients for whom documentation exists that the Home Management Plan of Care (HMPC), as a separate document specific to the patient, was given to the patient/caregiver, prior to or upon discharge
Final Report: Development of the National Quality Use of Medicines Indicators for Australian Hospitals 2014

51
References1. National Committee for Quality Assurance. HEDIS 2011: Healthcare Effectiveness Data and
Information Set. Vol 2, Technical Specifications. Washington (DC): National Committee for Quality Assurance; 2010
2. Safer Healthcare Now! Medication Reconciliation in Acute Care Getting Started Kit, Version 3.0, Sept 2011
3. Nigam R, MacKinnon NJ, U D, Hartnell NR, Levy AR, Gurnham ME, Nguyen TT. Development of Canadian safety indicators for medication use. Healthcare Quarterly 2008, 11: 47 – 53.
4. South Australia Health. South Australian APAC Key Performance Indicators for Hospitals Participating in Pharmaceutical Reform, May 2010
5. Personal Communication, Ms Alison Xecanas, Data Analyst, Medication Services Queensland, 28th August 2012
6. American Board of Internal Medicine Foundation, American College of Physicians, Society of Hospital Medicine, Physician Consortium for Performance Improvement. Care Transitions Performance Measurement Set (Phase I: Inpatient Discharges & Emergency Department Discharges). Chicago : American Medical Association; 2009 Jun
7. Gleason KM, Brake H, Agramonte V, Perfetti C. Medications at Transitions and Clinical Handoffs (MATCH) Toolkit for Medication Reconciliation. Rockville, MD: Agency for Healthcare Research and Quality. Revised August 2012.
8. MARQUIS Investigators. MARQUIS Implementation Manual, A Guide for Implementation of Medication Reconciliation Quality Improvement. Philadelphia, PA: Society of Hospital Medicine; 2011 Sept.
9. Brian J B, Paasche-Orlow M, Mitchell S, Forsythe S, Martin J, Brach C. Re-Engineered Discharge (RED) Toolkit. Rockville, MD: Agency for Healthcare Research and Quality, March 2013
Final Report: Development of the National Quality Use of Medicines Indicators for Australian Hospitals 2014

52
Appendix 2: Indicators and clinical audit criteria relating to acute mental health care identified from Australian and international literature
Source IndicatorQuality Indicator Project1 Adult admissions to inpatient psychiatric or substance abuse unit/facility due to patient non-compliance with treatment and/or
medicationOrganization for Economic Co-operation and Development (OECD)2 Length of treatment for substance-related disorders (treatment lasting at least 90 days)
Use of anti-cholinergic anti-depressant drugs among elderly patientsContinuous anti-depressant medication treatment in acute phase (new episode of depression treated with antidepressant for min 12 weeks)Continuous anti-depressant medication treatment in continuation phase (new episode of depression treated with antidepressant for at least 180 days)
The Joint Commission HBIPS Measures3
Patients discharged on multiple antipsychotic medicationsPatients discharged on multiple antipsychotic medications with appropriate justificationPost-discharge continuing care plan createdPost-discharge continuing care plan transmitted to next level of care provider upon discharge
Australian Council on Healthcare Standards4 Three or more psychotropic medications on dischargeAddington et al.5 Percentage of adults hospitalised for an acute episode of schizophrenia who were given a prescription for antipsychotic
medication on dischargePercentage of patients with acute symptom relief who received maintenance medicationPercentage of patients discharged for acute care facilities who have a documented discharge plan (excluding those discharged against medical advice)Percentage of patients taking antipsychotic medications who are evaluated for side effectsPercentage of patients monitored for tardive dyskinesia at 6 month intervalsPercentage of patients regularly assessed for akathisia
Final Report: Development of the National Quality Use of Medicines Indicators for Australian Hospitals 2014

53
Source IndicatorBollini et al .6 Prescription of an antipsychotic drug for the treatment of acute symptoms
Dose of antipsychotic drugs at the first acute episodeDose of antipsychotic drugs at the second and subsequent acute episodesLength of antipsychotic treatment in the maintenance phase, < 12 months after the resolution of the last acute episodeDose of antipsychotic drugs in the maintenance phase, < 12 months after the resolution of the last acute episodePrescription of a depot antipsychotic to patients with inadequate compliance in the maintenance phase
Prescription of clozapine - the patient has received 2 antipsychotics, 1 of which is 2nd generation for at least 6 weeks at therapeutic doses with no effect, has good compliance to treatment and no history of haematological disordersAction taken within 6 weeks of the occurrence of extrapyramidal side effectsMonotherapy - patient should be taking one antipsychotic drug
National Standards for Mental Health Services 7 Provision of medicines information to consumers and their carers/ promotion of adherenceNational Institute for Clinical Excellence Schizophrenia Audit Support8
National Institute for Clinical Excellence Schizophrenia Audit Support8 (cont.)
People with newly diagnosed schizophrenia should be offered oral antipsychotic medication.
Before starting oral antipsychotic medication, the person with schizophrenia must be offered an electrocardiogram … (in defined circumstances)If person is being treated with antipsychotic medication, then the following should be undertaken:
· the indications and expected benefits and risks of oral antipsychotic medication, and the expected time for a change in symptoms and appearance of side effects must be recorded
· at the start of treatment the dose should be at the lower end of the licensed range and slowly titrated upwards within the dose range given in the British National Formulary (BNF) or SPC· reasons for dosages outside the range given in the BNF or SPC must be justified and recorded
· the following must be monitored and recorded throughout treatment, but especially during titration: efficacy, side effects, adherence, physical health, rationale for continuing, changing or stopping medication and the effects of such changes· a trial of the medication at optimum dosage must be carried out for 4–6 weeks.
Healthcare professionals should discuss the use of alcohol, tobacco, prescription and non-prescription medication and illicit drugs with the person with schizophrenia
If the person with schizophrenia has ‘as required’ (p.r.n.) antipsychotic medication prescribed, there should be a review of clinical indications, frequency of administration, therapeutic benefits and side effects each week or as appropriate.
Final Report: Development of the National Quality Use of Medicines Indicators for Australian Hospitals 2014

54
Source IndicatorPeople with schizophrenia should not have a loading dose of antipsychotic medication.People with schizophrenia should not have regular combined antipsychotic medication initiated.People prescribed chlorpromazine should be warned of its potential to cause skin photosensitivity.People with an acute exacerbation or recurrence of schizophrenia should be offered oral antipsychotic medication.
People with schizophrenia should be informed by their healthcare professionals that there is a high risk of relapse if they stop medication in the next 1–2 years.
If withdrawing from antipsychotic medication it must be undertaken gradually and the service user monitored for signs and symptoms of relapse.
After withdrawal from antipsychotic medication, service user must be monitored for signs and symptoms of relapse for at least 2 yearsTargeted, intermittent dosage maintenance strategies should not be routinely used.
Where the person with schizophrenia is receiving depot/long-acting injectable antipsychotic medication the reason for this should be either: that they would prefer such treatment after an acute episode or avoiding covert non-adherence (either intentional or unintentional) to antipsychotic medication is a clinical priority within the treatment plan
When initiating depot/long-acting injectable antipsychotic medication: take into account the service user’s preferences and attitudes towards the mode of administration and organisational procedures (for example, home visits and location of clinics) and initially use a small test dose as set out in the BNF or SPC.
For people whose illness has not responded adequately to pharmacological treatment, the percentage who had it established that there had been adherence to antipsychotic medication, prescribed at an adequate dose and for the correct duration.
People with schizophrenia whose illness has not responded adequately to treatment despite the sequential use of adequate doses of at least two different antipsychotic drugs1 should be offered clozapine.Local alternatives to above criteria (to be used where other data addressing the same issue are more readily available).
Final Report: Development of the National Quality Use of Medicines Indicators for Australian Hospitals 2014

55
Source IndicatorUK Prescribing Observatory for Mental Health9
High dose and combined antipsychotics in acute adult inpatient settingsScreening for metabolic side effects of antipsychotic drugs in patients treated by assertive outreach teamsAssessment of side effects of depot antipsychoticsMonitoring of patients prescribed lithium
Medicines reconciliationUse of antipsychotic medication in people with Learning DisabilitiesUse of antipsychotic medication in CAMHSUse of antipsychotics in dementiaPrescribing for people with a personality disorder
Final Report: Development of the National Quality Use of Medicines Indicators for Australian Hospitals 2014

56
References1. The Joint Commission, Quality Improvement Project, 2008, www.qiproject.org2. Hermann RC, Mattke S, Members of the OECD Mental Health Care Panel. Selecting Indicators for the Quality of Mental Health Care at the Health Systems Level in OECD Countries. Paris: Organization for Economic Co-operation and Development (OECD), 20043. The Joint Commission, Hospital Based Inpatient Psychiatric Services (HBIPS) Measures, version 2014A, 20144. Australian Council on Healthcare Standards, Clinical Indicator Program, Mental Health Inpatient, version 6, 20135. Addington D, McKenzie E, Addington J, Patten S, Smith H, Adair C. Performance measures for early psychosis treatment services. Psychiatr Serv. 2005; 56:1570–15826. 6. Bollini P, Pampallona S, Nieddu S, Bianco M, Tibaldi G, Munizza C. Indicators of conformance with guidelines of schizophrenia treatment in mental health services. Psychiatr Serv. 2008;59:782–7917. Australian Government Department of Health, National Standards for Mental Health Services, 20108. National Institute for Clinical Excellence, NICE Clinical Guideline 82: Schizophrenia, Audit Support (pharmacological interventions), 20099. Royal College of Psychiatrists and College centre for Quality Improvement. Prescribing Observatory for Mental Health, http://www.rcpsych.ac.uk/quality/nationalclinicalaudits/prescribingpomh/prescribingobservatorypomh/publicresources/serviceuserandcarerinfo.asp
Final Report: Development of the National Quality Use of Medicines Indicators for Australian Hospitals 2014

57
Appendix 3: Post field testing questionnaire
NSW Therapeutic Advisory GroupUpdate of the Indicators for Quality Use of Medicines in Australian Hospitals 2007
Field testing of revised and new QUM indicators
The QUM indicators which you are field testing are undergoing a developmental process that will end with an updated set of indicators that address significant QUM gaps in the Australian hospital setting. The aims of this evaluation are to:
test measurability of the indicators ensure the indicator specifications are clear assess indicator usefulness including suitability for intra- and inter-hospital comparisons explore innovative methods for collection of indicator measures
Your feedback is essential in ensuring the indicators meet the stringent criteria that have been set. Please review these questions prior to field testing and consider your responses during the field test and as issues or ideas arise. Please complete a separate questionnaire for each indicator you have tested.
Please contact the project team if you need any help during the field test period.Katie Kerr Sasha BennettPhone : (02) 8382 2852 Phone: (02) 8382 2852Email: [email protected] Email: [email protected]
INDICATOR NAME / NUMBER: _____________________________________________________
Q1: Having collected data for this indicator, what do you think this data actually measures?
Regarding the process of collecting data for this indicator:
Q2: How many records were in your sample? __________________________
Q3: How long did data collection take per record (in minutes)? ______________________
Q4: What was/were your data source/s for this indicator?
Q5: Which disciplines were involved in collecting data for this indicator?
Q6: Did you have any difficulties in collecting data for this indicator?
Circle answer: Yes / NoIf yes, please explain what these were and suggest how they could be overcome
Final Report: Development of the National Quality Use of Medicines Indicators for Australian Hospitals 2014

58
Regarding the information provided on the specifications sheet:
Q7: Do you think the key definitions provided are adequate?
Circle answer: Yes / No
If no, please explain why and include suggestions for any changes needed to achieve this goal.
Q8: Do you think the numerator provided for this measure is appropriate?Circle answer: Yes / No
If no, please explain why and suggest a better alternative
Q9: Do you think the denominator provided for this measure is appropriate?
Circle answer: Yes / No
If no, please explain why and suggest a better alternative
Q10: Do you think the instructions for data collection are adequate?Circle answer: Yes / NoIf no, please explain why and include suggestions for any changes needed to achieve this goal.
Q11: Do you think the suggested data sources are appropriate?Circle answer: Yes / NoIf no, please explain why
Q12: Please suggest alternative or additional data sources that may be more accurate and / or easily collected routinely
Final Report: Development of the National Quality Use of Medicines Indicators for Australian Hospitals 2014

59
Q13: Please suggest any other automated or simpler way of collecting data routinely eg through use of your hospitals electronic discharge referral system or through software downloaded on to personal digital assistants for concurrent data collection (even if such systems do not currently exist in your hospital)
Regarding the usefulness of this indicator:
Q14: Would you use the result from this indicator to guide a review or change in practice in your hospital? Circle answer: Yes / NoIf no, please explain why and include suggestions for any changes needed to achieve this goal.
Q15: Would you be comfortable using this indicator to compare your performance now with your performance at a later date?Circle answer: Yes / NoIf no, please explain why and include suggestions for any changes needed to achieve this goal.
Q16: Would you be comfortable using this indicator to compare your performance with other hospitals?Circle answer: Yes / NoIf no, please explain why and include suggestions for any changes needed to achieve this goal.
Q17: What would facilitate regular use of this indicator in your hospital?
Q18: Based on your experience with this indicator, please outline any other suggestions you have for improving this indicator in the space below.
_________________________________________________________________________
Q19: Do you have any other comments about this indicator?
_________________________________________________________________________
THANK YOU FOR YOUR HELP
Final Report: Development of the National Quality Use of Medicines Indicators for Australian Hospitals 2014

60
Appendix 4: Details of targeted literature search for sampling methodology guidance
Targeted literature searchA natural language search of Google and Google Scholar was conducted, as was a targeted search of key quality and safety national and international organisations including:
Australian Institute of Health Innovation http://www.aihi.unsw.edu.au Australian Patient Safety Foundation http://www.apsf.net.au Centre of Research Excellence in Patient Safety http://www.med.monash.edu.au/sphpm/creps/ The Victorian Quality Council http://www.health.vic.gov.au/qualitycouncil/ The Institute for Healthcare Improvement http://www.ihi.org/Pages/default.aspx The Agency for Healthcare and Research Quality http://www.ahrq.gov The Joint Commission http://www.jointcommission.org National Health Service http://www.nhs.uk/Pages/HomePage.aspx NHS Institute for Innovation and Improvement http://www.institute.nhs.uk/index.php NHS Improvement http://www.improvement.nhs.uk/qipp/Home/Innovation/tabid/181/Default.aspx National Institute of Health and Clinical Excellence http://www.nice.org.uk
Relevant papers and reports were summarised and compiled into key information to inform development of the paper. As was expected, due to the statistical nature of the question, a comprehensive search of EMBASE and MEDLINE did not reveal any additional papers of relevance beyond those already available.
Searches were conducted in the MEDLINE and EMBASE databases as follows:
EMBASE:Searches
1 *sampling/2 *sample size/3 *clinical indicator/ or *indicator/4 *data extraction/ or *data analysis/ or *data collection method5 *data extraction/ and *data analysis/ and *data collection method6 1 and 2 and 37 2 and 38 1 and 29 1 and 2 and 410 3 and 411 1 and 312 1 and 413 1 and 3 and 4
Final Report: Development of the National Quality Use of Medicines Indicators for Australian Hospitals 2014

61
EMBASE: Searches
1 exp sampling/2 exp sample size/3 exp clinical indicator/ or exp indicator/4 (1 or 2) and 35 exp data extraction/ or exp data analysis/ or exp data collection method6 4 and 57 *sampling/8 *sample size/9 *clinical indicator/ or *indicator/10 (7 or 8) and 9
MEDLINE:Searches
1 Sampling studies/2 *Sample size/3 *Quality Indicators, Health Care/4 *Data Collection/5 1 and 2 and 3 and 46 2 and 37 1 and 38 2 and 49 1 and 410 1 and 2 and 411 1 and 3 and 412 3 and 4
Final Report: Development of the National Quality Use of Medicines Indicators for Australian Hospitals 2014